Zip Codes with the Highest Percentage of Self-Employed / Not Incorporated in Vermont
RELATED REPORTS & OPTIONS
Self-Employed / Not Incorporated
Vermont
Compare Zip Codes
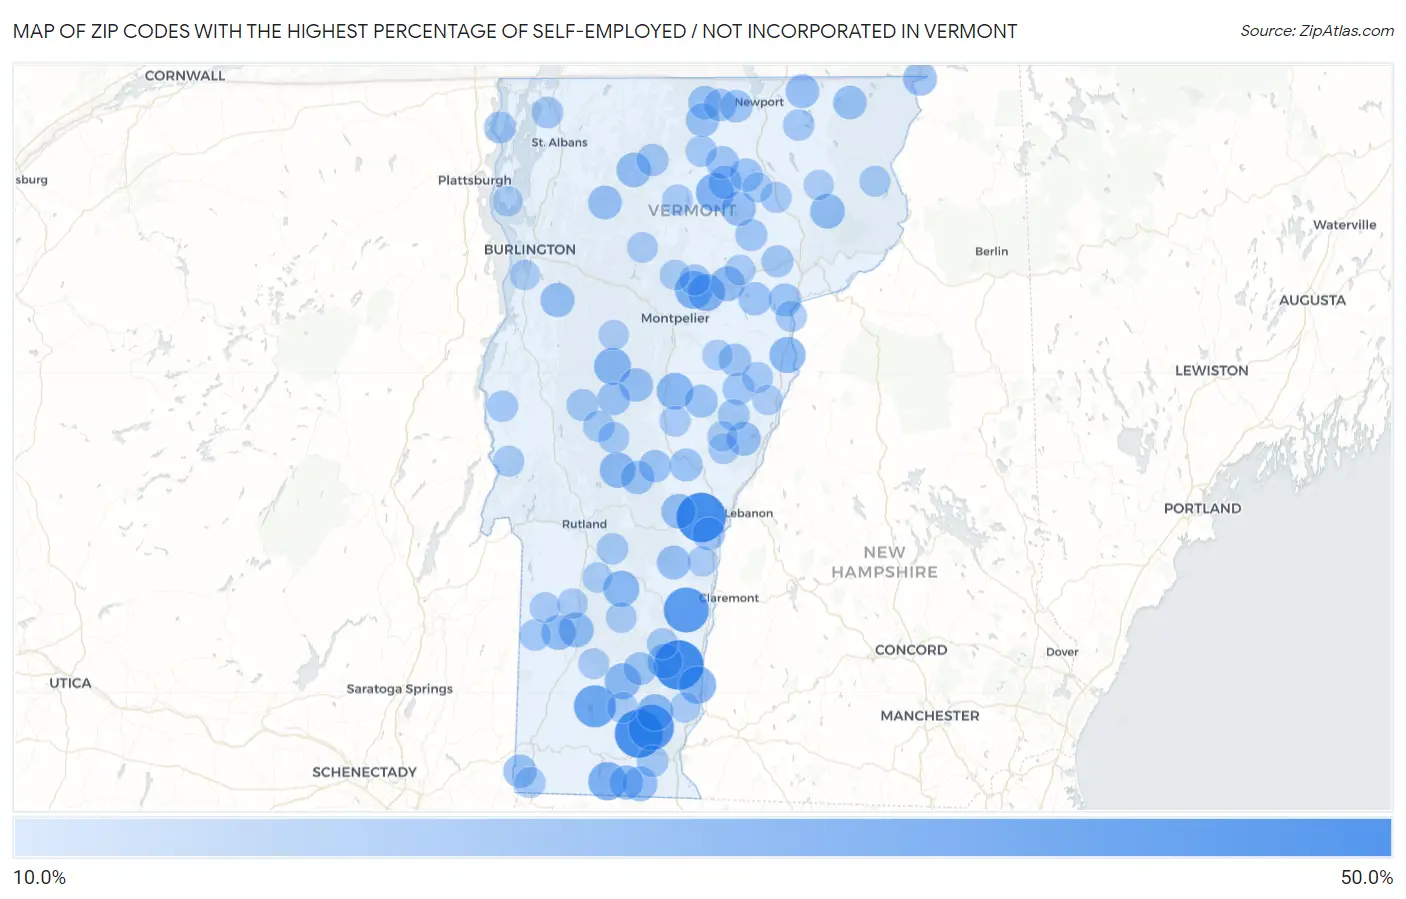
Map of Zip Codes with the Highest Percentage of Self-Employed / Not Incorporated in Vermont
10.0%
50.0%
Zip Codes with the Highest Percentage of Self-Employed / Not Incorporated in Vermont
| Zip Code | % Self-Employed / Not Incorporated | vs State | vs National | |
| 1. | 05141 | 45.8% | 8.3%(+37.5)#1 | 5.8%(+40.0)#288 |
| 2. | 05073 | 45.5% | 8.3%(+37.1)#2 | 5.8%(+39.6)#297 |
| 3. | 05351 | 42.9% | 8.3%(+34.5)#3 | 5.8%(+37.0)#337 |
| 4. | 05362 | 38.5% | 8.3%(+30.1)#4 | 5.8%(+32.6)#447 |
| 5. | 05150 | 37.7% | 8.3%(+29.3)#5 | 5.8%(+31.9)#467 |
| 6. | 05360 | 32.3% | 8.3%(+24.0)#6 | 5.8%(+26.5)#659 |
| 7. | 05361 | 25.8% | 8.3%(+17.5)#7 | 5.8%(+20.0)#1,070 |
| 8. | 05826 | 25.4% | 8.3%(+17.0)#8 | 5.8%(+19.6)#1,117 |
| 9. | 05640 | 24.7% | 8.3%(+16.4)#9 | 5.8%(+18.9)#1,178 |
| 10. | 05158 | 24.0% | 8.3%(+15.7)#10 | 5.8%(+18.2)#1,255 |
| 11. | 05666 | 23.5% | 8.3%(+15.2)#11 | 5.8%(+17.7)#1,308 |
| 12. | 05674 | 23.0% | 8.3%(+14.7)#12 | 5.8%(+17.2)#1,352 |
| 13. | 05345 | 22.7% | 8.3%(+14.3)#13 | 5.8%(+16.8)#1,395 |
| 14. | 05036 | 22.6% | 8.3%(+14.2)#14 | 5.8%(+16.7)#1,410 |
| 15. | 05081 | 21.6% | 8.3%(+13.3)#15 | 5.8%(+15.8)#1,540 |
| 16. | 05730 | 21.6% | 8.3%(+13.3)#16 | 5.8%(+15.8)#1,544 |
| 17. | 05343 | 21.3% | 8.3%(+12.9)#17 | 5.8%(+15.4)#1,602 |
| 18. | 05762 | 20.8% | 8.3%(+12.4)#18 | 5.8%(+14.9)#1,682 |
| 19. | 05146 | 19.5% | 8.3%(+11.2)#19 | 5.8%(+13.7)#1,914 |
| 20. | 05253 | 19.5% | 8.3%(+11.2)#20 | 5.8%(+13.7)#1,921 |
| 21. | 05251 | 19.4% | 8.3%(+11.1)#21 | 5.8%(+13.6)#1,939 |
| 22. | 05832 | 19.3% | 8.3%(+11.0)#22 | 5.8%(+13.5)#1,941 |
| 23. | 05658 | 19.3% | 8.3%(+11.0)#23 | 5.8%(+13.5)#1,947 |
| 24. | 05091 | 19.1% | 8.3%(+10.8)#24 | 5.8%(+13.3)#1,990 |
| 25. | 05358 | 19.1% | 8.3%(+10.8)#25 | 5.8%(+13.3)#2,002 |
| 26. | 05492 | 18.9% | 8.3%(+10.6)#26 | 5.8%(+13.1)#2,060 |
| 27. | 05841 | 18.4% | 8.3%(+10.1)#27 | 5.8%(+12.6)#2,201 |
| 28. | 05342 | 18.2% | 8.3%(+9.86)#28 | 5.8%(+12.4)#2,259 |
| 29. | 05461 | 18.1% | 8.3%(+9.76)#29 | 5.8%(+12.3)#2,293 |
| 30. | 05058 | 17.9% | 8.3%(+9.62)#30 | 5.8%(+12.1)#2,324 |
| 31. | 05902 | 17.6% | 8.3%(+9.32)#31 | 5.8%(+11.8)#2,417 |
| 32. | 05444 | 17.5% | 8.3%(+9.17)#32 | 5.8%(+11.7)#2,467 |
| 33. | 05830 | 17.5% | 8.3%(+9.15)#33 | 5.8%(+11.7)#2,471 |
| 34. | 05062 | 17.5% | 8.3%(+9.13)#34 | 5.8%(+11.6)#2,474 |
| 35. | 05669 | 17.4% | 8.3%(+9.09)#35 | 5.8%(+11.6)#2,496 |
| 36. | 05907 | 17.1% | 8.3%(+8.78)#36 | 5.8%(+11.3)#2,604 |
| 37. | 05859 | 17.0% | 8.3%(+8.68)#37 | 5.8%(+11.2)#2,635 |
| 38. | 05772 | 16.8% | 8.3%(+8.51)#38 | 5.8%(+11.0)#2,681 |
| 39. | 05874 | 16.7% | 8.3%(+8.39)#39 | 5.8%(+10.9)#2,720 |
| 40. | 05827 | 16.7% | 8.3%(+8.34)#40 | 5.8%(+10.9)#2,735 |
| 41. | 05260 | 16.7% | 8.3%(+8.34)#41 | 5.8%(+10.9)#2,743 |
| 42. | 05862 | 16.6% | 8.3%(+8.24)#42 | 5.8%(+10.7)#2,784 |
| 43. | 05875 | 16.5% | 8.3%(+8.18)#43 | 5.8%(+10.7)#2,804 |
| 44. | 05821 | 16.2% | 8.3%(+7.90)#44 | 5.8%(+10.4)#2,890 |
| 45. | 05038 | 16.2% | 8.3%(+7.90)#45 | 5.8%(+10.4)#2,893 |
| 46. | 05068 | 16.1% | 8.3%(+7.74)#46 | 5.8%(+10.3)#2,943 |
| 47. | 05048 | 16.1% | 8.3%(+7.73)#47 | 5.8%(+10.2)#2,954 |
| 48. | 05747 | 16.0% | 8.3%(+7.72)#48 | 5.8%(+10.2)#2,959 |
| 49. | 05359 | 16.0% | 8.3%(+7.71)#49 | 5.8%(+10.2)#2,966 |
| 50. | 05820 | 15.8% | 8.3%(+7.46)#50 | 5.8%(+9.97)#3,079 |
| 51. | 05086 | 15.5% | 8.3%(+7.17)#51 | 5.8%(+9.68)#3,203 |
| 52. | 05032 | 15.4% | 8.3%(+7.08)#52 | 5.8%(+9.59)#3,228 |
| 53. | 05868 | 15.4% | 8.3%(+7.06)#53 | 5.8%(+9.57)#3,244 |
| 54. | 05857 | 15.4% | 8.3%(+7.03)#54 | 5.8%(+9.54)#3,258 |
| 55. | 05442 | 15.0% | 8.3%(+6.70)#55 | 5.8%(+9.21)#3,416 |
| 56. | 05039 | 14.9% | 8.3%(+6.54)#56 | 5.8%(+9.05)#3,482 |
| 57. | 05836 | 14.7% | 8.3%(+6.41)#57 | 5.8%(+8.92)#3,545 |
| 58. | 05828 | 14.3% | 8.3%(+6.02)#58 | 5.8%(+8.53)#3,721 |
| 59. | 05463 | 14.2% | 8.3%(+5.91)#59 | 5.8%(+8.42)#3,778 |
| 60. | 05766 | 14.2% | 8.3%(+5.84)#60 | 5.8%(+8.35)#3,818 |
| 61. | 05301 | 14.1% | 8.3%(+5.82)#61 | 5.8%(+8.33)#3,829 |
| 62. | 05079 | 14.0% | 8.3%(+5.68)#62 | 5.8%(+8.19)#3,898 |
| 63. | 05488 | 13.9% | 8.3%(+5.59)#63 | 5.8%(+8.10)#3,943 |
| 64. | 05776 | 13.8% | 8.3%(+5.47)#64 | 5.8%(+7.98)#4,012 |
| 65. | 05738 | 13.5% | 8.3%(+5.20)#65 | 5.8%(+7.71)#4,174 |
| 66. | 05872 | 13.5% | 8.3%(+5.19)#66 | 5.8%(+7.70)#4,175 |
| 67. | 05748 | 13.3% | 8.3%(+4.98)#67 | 5.8%(+7.49)#4,314 |
| 68. | 05767 | 13.3% | 8.3%(+4.97)#68 | 5.8%(+7.48)#4,323 |
| 69. | 05734 | 13.3% | 8.3%(+4.96)#69 | 5.8%(+7.47)#4,324 |
| 70. | 05847 | 13.3% | 8.3%(+4.94)#70 | 5.8%(+7.45)#4,335 |
| 71. | 05050 | 13.3% | 8.3%(+4.93)#71 | 5.8%(+7.44)#4,345 |
| 72. | 05648 | 13.2% | 8.3%(+4.87)#72 | 5.8%(+7.38)#4,394 |
| 73. | 05143 | 13.0% | 8.3%(+4.64)#73 | 5.8%(+7.15)#4,554 |
| 74. | 05261 | 12.9% | 8.3%(+4.57)#74 | 5.8%(+7.08)#4,587 |
| 75. | 05355 | 12.9% | 8.3%(+4.54)#75 | 5.8%(+7.05)#4,606 |
| 76. | 05760 | 12.8% | 8.3%(+4.52)#76 | 5.8%(+7.03)#4,632 |
| 77. | 05040 | 12.8% | 8.3%(+4.49)#77 | 5.8%(+7.00)#4,657 |
| 78. | 05905 | 12.7% | 8.3%(+4.41)#78 | 5.8%(+6.92)#4,706 |
| 79. | 05866 | 12.6% | 8.3%(+4.29)#79 | 5.8%(+6.80)#4,796 |
| 80. | 05655 | 12.6% | 8.3%(+4.25)#80 | 5.8%(+6.76)#4,829 |
| 81. | 05340 | 12.5% | 8.3%(+4.14)#81 | 5.8%(+6.65)#4,915 |
| 82. | 05161 | 12.3% | 8.3%(+3.97)#82 | 5.8%(+6.47)#5,049 |
| 83. | 05061 | 12.2% | 8.3%(+3.90)#83 | 5.8%(+6.41)#5,100 |
| 84. | 05672 | 12.2% | 8.3%(+3.86)#84 | 5.8%(+6.37)#5,130 |
| 85. | 05761 | 12.2% | 8.3%(+3.84)#85 | 5.8%(+6.35)#5,155 |
| 86. | 05739 | 12.0% | 8.3%(+3.71)#86 | 5.8%(+6.22)#5,268 |
| 87. | 05070 | 12.0% | 8.3%(+3.69)#87 | 5.8%(+6.20)#5,278 |
| 88. | 05649 | 12.0% | 8.3%(+3.67)#88 | 5.8%(+6.18)#5,294 |
| 89. | 05647 | 12.0% | 8.3%(+3.63)#89 | 5.8%(+6.14)#5,317 |
| 90. | 05072 | 11.7% | 8.3%(+3.39)#90 | 5.8%(+5.90)#5,534 |
| 91. | 05033 | 11.7% | 8.3%(+3.38)#91 | 5.8%(+5.89)#5,546 |
| 92. | 05682 | 11.7% | 8.3%(+3.34)#92 | 5.8%(+5.85)#5,562 |
| 93. | 05346 | 11.6% | 8.3%(+3.31)#93 | 5.8%(+5.82)#5,592 |
| 94. | 05486 | 11.6% | 8.3%(+3.27)#94 | 5.8%(+5.78)#5,624 |
| 95. | 05089 | 11.6% | 8.3%(+3.25)#95 | 5.8%(+5.76)#5,640 |
| 96. | 05482 | 11.5% | 8.3%(+3.22)#96 | 5.8%(+5.73)#5,664 |
| 97. | 05871 | 11.5% | 8.3%(+3.17)#97 | 5.8%(+5.68)#5,703 |
| 98. | 05839 | 11.5% | 8.3%(+3.16)#98 | 5.8%(+5.67)#5,722 |
| 99. | 05742 | 11.5% | 8.3%(+3.14)#99 | 5.8%(+5.65)#5,743 |
| 100. | 05673 | 11.5% | 8.3%(+3.13)#100 | 5.8%(+5.64)#5,750 |
Common Questions
What are the Top 10 Zip Codes with the Highest Percentage of Self-Employed / Not Incorporated in Vermont?
Top 10 Zip Codes with the Highest Percentage of Self-Employed / Not Incorporated in Vermont are:
What zip code has the Highest Percentage of Self-Employed / Not Incorporated in Vermont?
05141 has the Highest Percentage of Self-Employed / Not Incorporated in Vermont with 45.8%.
What is the Percentage of Self-Employed / Not Incorporated in the State of Vermont?
Percentage of Self-Employed / Not Incorporated in Vermont is 8.3%.
What is the Percentage of Self-Employed / Not Incorporated in the United States?
Percentage of Self-Employed / Not Incorporated in the United States is 5.8%.