Zip Codes with the Highest Percentage of Population Employed in Accommodation & Food Services in South Dakota
RELATED REPORTS & OPTIONS
Accommodation & Food Services
South Dakota
Compare Zip Codes
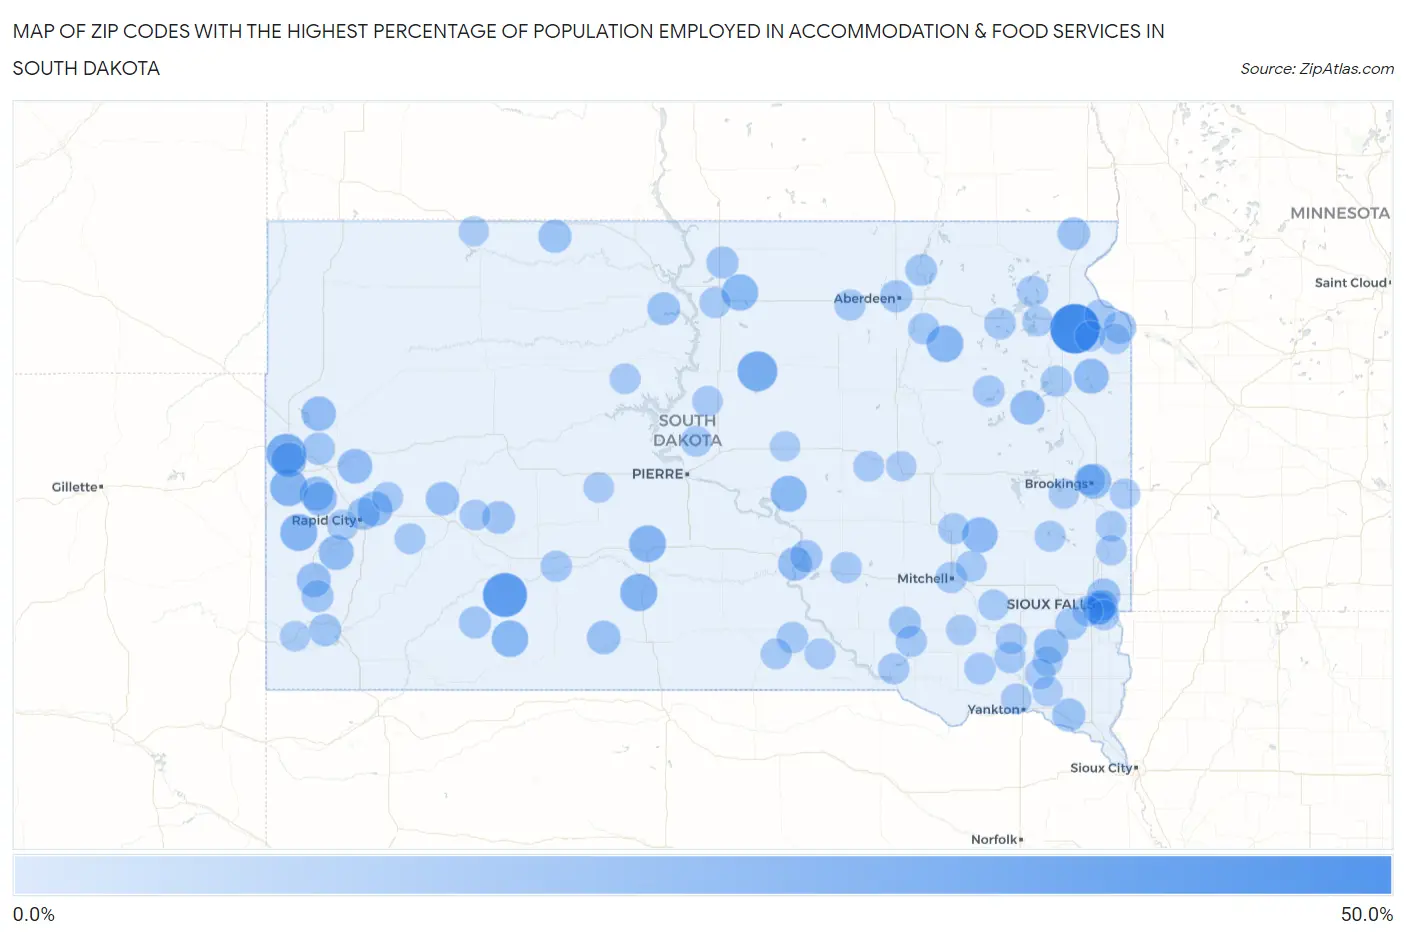
Map of Zip Codes with the Highest Percentage of Population Employed in Accommodation & Food Services in South Dakota
0.0%
50.0%
Zip Codes with the Highest Percentage of Population Employed in Accommodation & Food Services in South Dakota
| Zip Code | % Employed | vs State | vs National | |
| 1. | 57251 | 44.3% | 6.8%(+37.5)#1 | 6.9%(+37.5)#135 |
| 2. | 57750 | 33.3% | 6.8%(+26.5)#2 | 6.9%(+26.5)#255 |
| 3. | 57455 | 24.7% | 6.8%(+17.8)#3 | 6.9%(+17.8)#523 |
| 4. | 57799 | 24.6% | 6.8%(+17.8)#4 | 6.9%(+17.7)#525 |
| 5. | 57754 | 19.6% | 6.8%(+12.8)#5 | 6.9%(+12.7)#865 |
| 6. | 57579 | 19.3% | 6.8%(+12.5)#6 | 6.9%(+12.5)#904 |
| 7. | 57745 | 19.2% | 6.8%(+12.3)#7 | 6.9%(+12.3)#926 |
| 8. | 57559 | 18.8% | 6.8%(+12.0)#8 | 6.9%(+11.9)#970 |
| 9. | 57434 | 18.4% | 6.8%(+11.6)#9 | 6.9%(+11.6)#1,028 |
| 10. | 57714 | 18.1% | 6.8%(+11.3)#10 | 6.9%(+11.2)#1,077 |
| 11. | 57452 | 17.7% | 6.8%(+10.9)#11 | 6.9%(+10.8)#1,145 |
| 12. | 57346 | 17.1% | 6.8%(+10.3)#12 | 6.9%(+10.3)#1,240 |
| 13. | 57337 | 16.0% | 6.8%(+9.17)#13 | 6.9%(+9.12)#1,455 |
| 14. | 57783 | 15.4% | 6.8%(+8.52)#14 | 6.9%(+8.47)#1,593 |
| 15. | 57007 | 15.1% | 6.8%(+8.25)#15 | 6.9%(+8.20)#1,649 |
| 16. | 57265 | 14.8% | 6.8%(+7.98)#16 | 6.9%(+7.93)#1,729 |
| 17. | 57751 | 14.8% | 6.8%(+7.93)#17 | 6.9%(+7.89)#1,741 |
| 18. | 57706 | 14.7% | 6.8%(+7.88)#18 | 6.9%(+7.83)#1,754 |
| 19. | 57785 | 14.3% | 6.8%(+7.51)#19 | 6.9%(+7.46)#1,858 |
| 20. | 57762 | 14.1% | 6.8%(+7.29)#20 | 6.9%(+7.24)#1,931 |
| 21. | 57036 | 13.8% | 6.8%(+6.96)#21 | 6.9%(+6.91)#2,027 |
| 22. | 57242 | 13.5% | 6.8%(+6.71)#22 | 6.9%(+6.66)#2,119 |
| 23. | 57732 | 13.2% | 6.8%(+6.39)#23 | 6.9%(+6.34)#2,259 |
| 24. | 57730 | 13.1% | 6.8%(+6.23)#24 | 6.9%(+6.18)#2,324 |
| 25. | 57759 | 12.7% | 6.8%(+5.90)#25 | 6.9%(+5.85)#2,470 |
| 26. | 57365 | 12.5% | 6.8%(+5.71)#26 | 6.9%(+5.66)#2,563 |
| 27. | 57791 | 12.2% | 6.8%(+5.39)#27 | 6.9%(+5.34)#2,701 |
| 28. | 57566 | 12.1% | 6.8%(+5.31)#28 | 6.9%(+5.26)#2,755 |
| 29. | 57197 | 12.0% | 6.8%(+5.16)#29 | 6.9%(+5.11)#2,834 |
| 30. | 57104 | 11.6% | 6.8%(+4.75)#30 | 6.9%(+4.70)#3,106 |
| 31. | 57660 | 11.5% | 6.8%(+4.71)#31 | 6.9%(+4.66)#3,134 |
| 32. | 57069 | 11.4% | 6.8%(+4.61)#32 | 6.9%(+4.57)#3,198 |
| 33. | 57601 | 11.0% | 6.8%(+4.15)#33 | 6.9%(+4.10)#3,572 |
| 34. | 57775 | 10.5% | 6.8%(+3.67)#34 | 6.9%(+3.62)#3,995 |
| 35. | 57255 | 10.4% | 6.8%(+3.56)#35 | 6.9%(+3.51)#4,102 |
| 36. | 57701 | 10.3% | 6.8%(+3.44)#36 | 6.9%(+3.39)#4,219 |
| 37. | 57325 | 10.1% | 6.8%(+3.23)#37 | 6.9%(+3.18)#4,454 |
| 38. | 57401 | 10.0% | 6.8%(+3.19)#38 | 6.9%(+3.14)#4,518 |
| 39. | 57793 | 10.0% | 6.8%(+3.16)#39 | 6.9%(+3.11)#4,558 |
| 40. | 57216 | 9.9% | 6.8%(+3.09)#40 | 6.9%(+3.04)#4,640 |
| 41. | 57773 | 9.7% | 6.8%(+2.85)#41 | 6.9%(+2.80)#4,955 |
| 42. | 57747 | 9.7% | 6.8%(+2.84)#42 | 6.9%(+2.80)#4,959 |
| 43. | 57752 | 9.4% | 6.8%(+2.60)#43 | 6.9%(+2.55)#5,312 |
| 44. | 57646 | 9.4% | 6.8%(+2.54)#44 | 6.9%(+2.49)#5,388 |
| 45. | 57105 | 9.1% | 6.8%(+2.24)#45 | 6.9%(+2.19)#5,859 |
| 46. | 57328 | 9.0% | 6.8%(+2.16)#46 | 6.9%(+2.11)#5,962 |
| 47. | 57015 | 8.7% | 6.8%(+1.88)#47 | 6.9%(+1.83)#6,441 |
| 48. | 57433 | 8.6% | 6.8%(+1.80)#48 | 6.9%(+1.75)#6,584 |
| 49. | 57225 | 8.6% | 6.8%(+1.73)#49 | 6.9%(+1.68)#6,707 |
| 50. | 57059 | 8.2% | 6.8%(+1.35)#50 | 6.9%(+1.31)#7,446 |
| 51. | 57274 | 8.2% | 6.8%(+1.35)#51 | 6.9%(+1.30)#7,469 |
| 52. | 57533 | 8.1% | 6.8%(+1.22)#52 | 6.9%(+1.17)#7,718 |
| 53. | 57313 | 8.0% | 6.8%(+1.18)#53 | 6.9%(+1.13)#7,793 |
| 54. | 57045 | 7.9% | 6.8%(+1.10)#54 | 6.9%(+1.06)#7,951 |
| 55. | 57543 | 7.9% | 6.8%(+1.08)#55 | 6.9%(+1.03)#8,012 |
| 56. | 57474 | 7.9% | 6.8%(+1.03)#56 | 6.9%(+0.976)#8,135 |
| 57. | 57301 | 7.7% | 6.8%(+0.912)#57 | 6.9%(+0.862)#8,389 |
| 58. | 57239 | 7.7% | 6.8%(+0.910)#58 | 6.9%(+0.861)#8,392 |
| 59. | 57356 | 7.7% | 6.8%(+0.840)#59 | 6.9%(+0.791)#8,571 |
| 60. | 57006 | 7.5% | 6.8%(+0.665)#60 | 6.9%(+0.616)#9,003 |
| 61. | 57719 | 7.4% | 6.8%(+0.615)#61 | 6.9%(+0.566)#9,114 |
| 62. | 57201 | 7.4% | 6.8%(+0.615)#62 | 6.9%(+0.565)#9,116 |
| 63. | 57472 | 7.4% | 6.8%(+0.602)#63 | 6.9%(+0.553)#9,156 |
| 64. | 57227 | 7.4% | 6.8%(+0.597)#64 | 6.9%(+0.548)#9,175 |
| 65. | 57314 | 7.4% | 6.8%(+0.585)#65 | 6.9%(+0.536)#9,207 |
| 66. | 57355 | 7.4% | 6.8%(+0.575)#66 | 6.9%(+0.526)#9,230 |
| 67. | 57451 | 7.3% | 6.8%(+0.500)#67 | 6.9%(+0.451)#9,430 |
| 68. | 57103 | 7.3% | 6.8%(+0.492)#68 | 6.9%(+0.443)#9,448 |
| 69. | 57529 | 7.3% | 6.8%(+0.422)#69 | 6.9%(+0.373)#9,665 |
| 70. | 57042 | 7.1% | 6.8%(+0.311)#70 | 6.9%(+0.262)#9,935 |
| 71. | 57725 | 7.1% | 6.8%(+0.311)#71 | 6.9%(+0.262)#9,944 |
| 72. | 57340 | 7.1% | 6.8%(+0.311)#72 | 6.9%(+0.262)#9,948 |
| 73. | 57501 | 7.1% | 6.8%(+0.300)#73 | 6.9%(+0.251)#9,976 |
| 74. | 57332 | 7.1% | 6.8%(+0.224)#74 | 6.9%(+0.175)#10,159 |
| 75. | 57523 | 7.0% | 6.8%(+0.139)#75 | 6.9%(+0.090)#10,406 |
| 76. | 57029 | 6.9% | 6.8%(+0.086)#76 | 6.9%(+0.037)#10,553 |
| 77. | 57702 | 6.9% | 6.8%(+0.019)#77 | 6.9%(-0.030)#10,715 |
| 78. | 57381 | 6.8% | 6.8%(+0.006)#78 | 6.9%(-0.043)#10,760 |
| 79. | 57252 | 6.8% | 6.8%(-0.052)#79 | 6.9%(-0.101)#10,948 |
| 80. | 57269 | 6.8% | 6.8%(-0.052)#80 | 6.9%(-0.101)#10,954 |
| 81. | 57108 | 6.8% | 6.8%(-0.066)#81 | 6.9%(-0.115)#10,999 |
| 82. | 57520 | 6.7% | 6.8%(-0.165)#82 | 6.9%(-0.214)#11,308 |
| 83. | 57625 | 6.6% | 6.8%(-0.202)#83 | 6.9%(-0.251)#11,420 |
| 84. | 57078 | 6.6% | 6.8%(-0.205)#84 | 6.9%(-0.254)#11,428 |
| 85. | 57106 | 6.6% | 6.8%(-0.267)#85 | 6.9%(-0.316)#11,635 |
| 86. | 57028 | 6.6% | 6.8%(-0.281)#86 | 6.9%(-0.330)#11,675 |
| 87. | 57790 | 6.5% | 6.8%(-0.286)#87 | 6.9%(-0.335)#11,690 |
| 88. | 57037 | 6.5% | 6.8%(-0.374)#88 | 6.9%(-0.423)#11,979 |
| 89. | 57552 | 6.4% | 6.8%(-0.393)#89 | 6.9%(-0.442)#12,037 |
| 90. | 57366 | 6.3% | 6.8%(-0.544)#90 | 6.9%(-0.593)#12,523 |
| 91. | 57026 | 6.3% | 6.8%(-0.548)#91 | 6.9%(-0.598)#12,536 |
| 92. | 57065 | 6.3% | 6.8%(-0.549)#92 | 6.9%(-0.598)#12,540 |
| 93. | 57735 | 6.1% | 6.8%(-0.692)#93 | 6.9%(-0.741)#12,993 |
| 94. | 57070 | 6.1% | 6.8%(-0.723)#94 | 6.9%(-0.772)#13,103 |
| 95. | 57072 | 6.1% | 6.8%(-0.734)#95 | 6.9%(-0.783)#13,147 |
| 96. | 57384 | 6.1% | 6.8%(-0.761)#96 | 6.9%(-0.810)#13,239 |
| 97. | 57273 | 6.1% | 6.8%(-0.771)#97 | 6.9%(-0.820)#13,265 |
| 98. | 57061 | 6.0% | 6.8%(-0.808)#98 | 6.9%(-0.857)#13,371 |
| 99. | 57345 | 5.9% | 6.8%(-0.950)#99 | 6.9%(-0.999)#13,829 |
| 100. | 57638 | 5.9% | 6.8%(-0.955)#100 | 6.9%(-1.00)#13,860 |
Common Questions
What are the Top 10 Zip Codes with the Highest Percentage of Population Employed in Accommodation & Food Services in South Dakota?
Top 10 Zip Codes with the Highest Percentage of Population Employed in Accommodation & Food Services in South Dakota are:
What zip code has the Highest Percentage of Population Employed in Accommodation & Food Services in South Dakota?
57251 has the Highest Percentage of Population Employed in Accommodation & Food Services in South Dakota with 44.3%.
What is the Percentage of Population Employed in Accommodation & Food Services in the State of South Dakota?
Percentage of Population Employed in Accommodation & Food Services in South Dakota is 6.8%.
What is the Percentage of Population Employed in Accommodation & Food Services in the United States?
Percentage of Population Employed in Accommodation & Food Services in the United States is 6.9%.