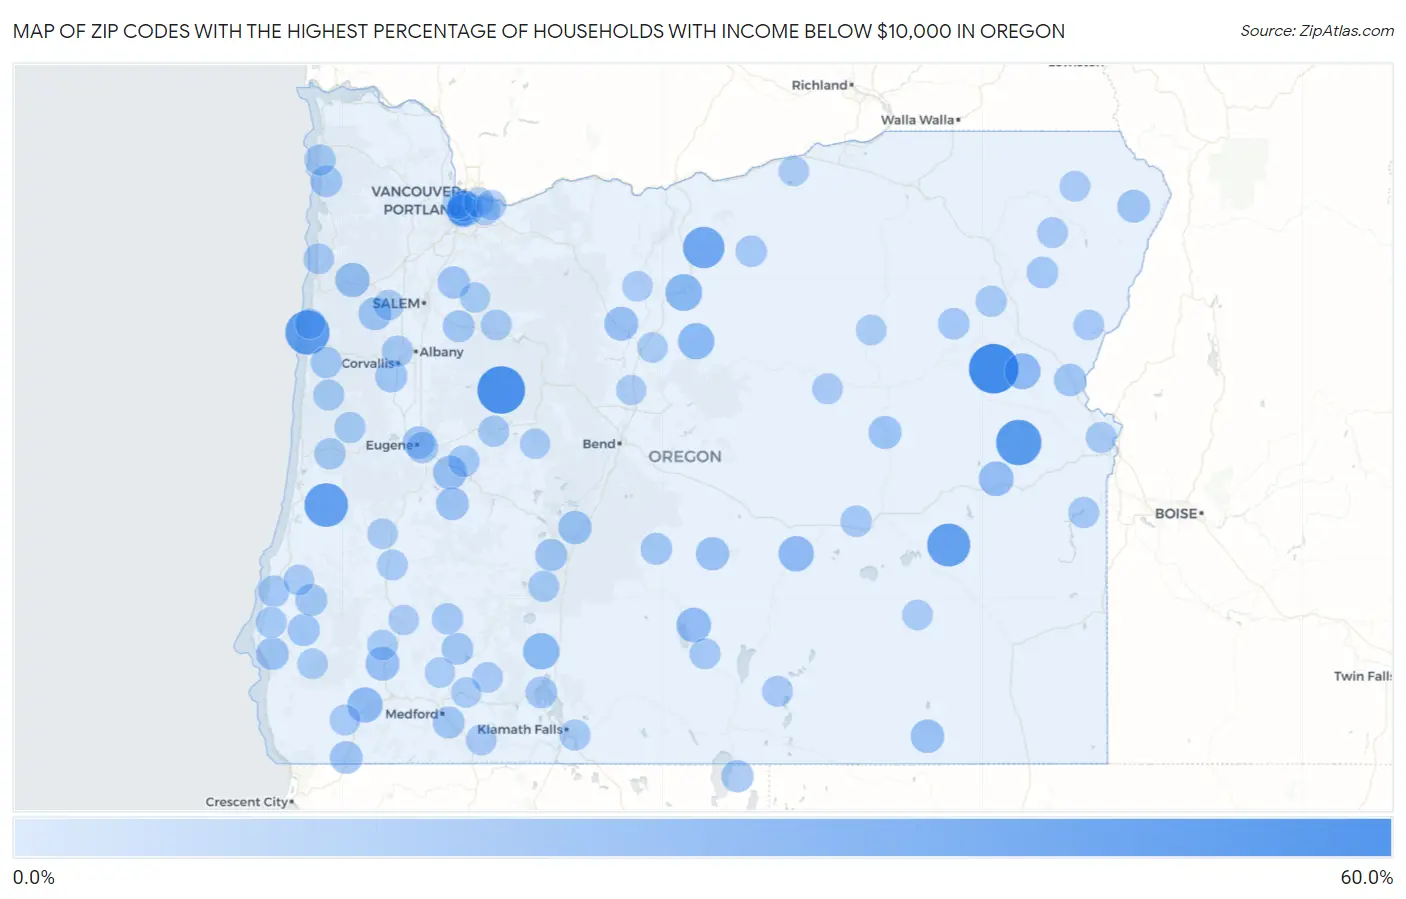
Zip Codes with the Highest Percentage of Households with Income Below $10,000 in Oregon
RELATED REPORTS & OPTIONS
Household Income | $0-10k
Oregon
Compare Zip Codes
Map of Zip Codes with the Highest Percentage of Households with Income Below $10,000 in Oregon
0.0%
60.0%
Zip Codes with the Highest Percentage of Households with Income Below $10,000 in Oregon
| Zip Code | Households with Income < $10k | vs State | vs National | |
| 1. | 97837 | 54.8% | 4.4%(+50.4)#1 | 4.9%(+49.9)#91 |
| 2. | 97329 | 50.0% | 4.4%(+45.6)#2 | 4.9%(+45.1)#114 |
| 3. | 97920 | 43.8% | 4.4%(+39.4)#3 | 4.9%(+38.9)#147 |
| 4. | 97369 | 41.3% | 4.4%(+36.9)#4 | 4.9%(+36.4)#163 |
| 5. | 97473 | 39.7% | 4.4%(+35.3)#5 | 4.9%(+34.8)#177 |
| 6. | 97732 | 38.1% | 4.4%(+33.7)#6 | 4.9%(+33.2)#187 |
| 7. | 97033 | 33.9% | 4.4%(+29.5)#7 | 4.9%(+29.0)#238 |
| 8. | 97057 | 22.2% | 4.4%(+17.8)#8 | 4.9%(+17.3)#629 |
| 9. | 97626 | 21.2% | 4.4%(+16.8)#9 | 4.9%(+16.3)#695 |
| 10. | 97711 | 20.8% | 4.4%(+16.4)#10 | 4.9%(+15.9)#724 |
| 11. | 97819 | 20.0% | 4.4%(+15.6)#11 | 4.9%(+15.1)#805 |
| 12. | 97204 | 19.7% | 4.4%(+15.3)#12 | 4.9%(+14.8)#826 |
| 13. | 97758 | 18.5% | 4.4%(+14.1)#13 | 4.9%(+13.6)#954 |
| 14. | 97543 | 18.4% | 4.4%(+14.0)#14 | 4.9%(+13.5)#964 |
| 15. | 97911 | 17.1% | 4.4%(+12.7)#15 | 4.9%(+12.2)#1,156 |
| 16. | 97640 | 16.7% | 4.4%(+12.3)#16 | 4.9%(+11.8)#1,222 |
| 17. | 97347 | 16.3% | 4.4%(+11.9)#17 | 4.9%(+11.4)#1,284 |
| 18. | 97497 | 15.0% | 4.4%(+10.6)#18 | 4.9%(+10.1)#1,523 |
| 19. | 97761 | 14.9% | 4.4%(+10.5)#19 | 4.9%(+10.00)#1,547 |
| 20. | 97431 | 14.8% | 4.4%(+10.4)#20 | 4.9%(+9.90)#1,572 |
| 21. | 97710 | 13.9% | 4.4%(+9.50)#21 | 4.9%(+9.00)#1,816 |
| 22. | 97737 | 13.6% | 4.4%(+9.20)#22 | 4.9%(+8.70)#1,899 |
| 23. | 97641 | 13.5% | 4.4%(+9.10)#23 | 4.9%(+8.60)#1,930 |
| 24. | 97873 | 12.8% | 4.4%(+8.40)#24 | 4.9%(+7.90)#2,186 |
| 25. | 97344 | 12.5% | 4.4%(+8.10)#25 | 4.9%(+7.60)#2,264 |
| 26. | 97434 | 12.5% | 4.4%(+8.10)#26 | 4.9%(+7.60)#2,269 |
| 27. | 97842 | 12.1% | 4.4%(+7.70)#27 | 4.9%(+7.20)#2,450 |
| 28. | 97534 | 12.0% | 4.4%(+7.60)#28 | 4.9%(+7.10)#2,484 |
| 29. | 97465 | 11.9% | 4.4%(+7.50)#29 | 4.9%(+7.00)#2,528 |
| 30. | 97333 | 11.2% | 4.4%(+6.80)#30 | 4.9%(+6.30)#2,839 |
| 31. | 97362 | 11.2% | 4.4%(+6.80)#31 | 4.9%(+6.30)#2,857 |
| 32. | 97907 | 11.1% | 4.4%(+6.70)#32 | 4.9%(+6.20)#2,921 |
| 33. | 97201 | 11.0% | 4.4%(+6.60)#33 | 4.9%(+6.10)#2,953 |
| 34. | 97635 | 10.9% | 4.4%(+6.50)#34 | 4.9%(+6.00)#3,046 |
| 35. | 97401 | 10.8% | 4.4%(+6.40)#35 | 4.9%(+5.90)#3,055 |
| 36. | 97466 | 10.7% | 4.4%(+6.30)#36 | 4.9%(+5.80)#3,149 |
| 37. | 97733 | 10.6% | 4.4%(+6.20)#37 | 4.9%(+5.70)#3,215 |
| 38. | 97458 | 10.3% | 4.4%(+5.90)#38 | 4.9%(+5.40)#3,378 |
| 39. | 97535 | 10.0% | 4.4%(+5.60)#39 | 4.9%(+5.10)#3,593 |
| 40. | 97735 | 10.0% | 4.4%(+5.60)#40 | 4.9%(+5.10)#3,631 |
| 41. | 97383 | 9.8% | 4.4%(+5.40)#41 | 4.9%(+4.90)#3,731 |
| 42. | 97541 | 9.6% | 4.4%(+5.20)#42 | 4.9%(+4.70)#3,920 |
| 43. | 97147 | 9.6% | 4.4%(+5.20)#43 | 4.9%(+4.70)#3,933 |
| 44. | 97601 | 9.5% | 4.4%(+5.10)#44 | 4.9%(+4.60)#3,960 |
| 45. | 97205 | 9.3% | 4.4%(+4.90)#45 | 4.9%(+4.40)#4,120 |
| 46. | 97883 | 9.3% | 4.4%(+4.90)#46 | 4.9%(+4.40)#4,137 |
| 47. | 97877 | 9.3% | 4.4%(+4.90)#47 | 4.9%(+4.40)#4,186 |
| 48. | 97403 | 9.1% | 4.4%(+4.70)#48 | 4.9%(+4.20)#4,315 |
| 49. | 97438 | 9.1% | 4.4%(+4.70)#49 | 4.9%(+4.20)#4,358 |
| 50. | 97823 | 8.9% | 4.4%(+4.50)#50 | 4.9%(+4.00)#4,569 |
| 51. | 97411 | 8.8% | 4.4%(+4.40)#51 | 4.9%(+3.90)#4,635 |
| 52. | 97391 | 8.8% | 4.4%(+4.40)#52 | 4.9%(+3.90)#4,640 |
| 53. | 97738 | 8.8% | 4.4%(+4.40)#53 | 4.9%(+3.90)#4,662 |
| 54. | 97330 | 8.7% | 4.4%(+4.30)#54 | 4.9%(+3.80)#4,716 |
| 55. | 97484 | 8.6% | 4.4%(+4.20)#55 | 4.9%(+3.70)#4,904 |
| 56. | 97453 | 8.5% | 4.4%(+4.10)#56 | 4.9%(+3.60)#4,995 |
| 57. | 97833 | 8.4% | 4.4%(+4.00)#57 | 4.9%(+3.50)#5,128 |
| 58. | 97102 | 8.4% | 4.4%(+4.00)#58 | 4.9%(+3.50)#5,133 |
| 59. | 97209 | 8.3% | 4.4%(+3.90)#59 | 4.9%(+3.40)#5,174 |
| 60. | 97488 | 8.3% | 4.4%(+3.90)#60 | 4.9%(+3.40)#5,260 |
| 61. | 97450 | 8.1% | 4.4%(+3.70)#61 | 4.9%(+3.20)#5,515 |
| 62. | 97390 | 8.0% | 4.4%(+3.60)#62 | 4.9%(+3.10)#5,647 |
| 63. | 97603 | 7.9% | 4.4%(+3.50)#63 | 4.9%(+3.00)#5,677 |
| 64. | 97914 | 7.8% | 4.4%(+3.40)#64 | 4.9%(+2.90)#5,821 |
| 65. | 97913 | 7.8% | 4.4%(+3.40)#65 | 4.9%(+2.90)#5,850 |
| 66. | 97636 | 7.8% | 4.4%(+3.40)#66 | 4.9%(+2.90)#5,918 |
| 67. | 97430 | 7.8% | 4.4%(+3.40)#67 | 4.9%(+2.90)#5,919 |
| 68. | 97731 | 7.7% | 4.4%(+3.30)#68 | 4.9%(+2.80)#6,035 |
| 69. | 97358 | 7.4% | 4.4%(+3.00)#69 | 4.9%(+2.50)#6,413 |
| 70. | 97637 | 7.4% | 4.4%(+3.00)#70 | 4.9%(+2.50)#6,466 |
| 71. | 97538 | 7.3% | 4.4%(+2.90)#71 | 4.9%(+2.40)#6,563 |
| 72. | 97495 | 7.3% | 4.4%(+2.90)#72 | 4.9%(+2.40)#6,566 |
| 73. | 97857 | 7.3% | 4.4%(+2.90)#73 | 4.9%(+2.40)#6,586 |
| 74. | 97825 | 7.3% | 4.4%(+2.90)#74 | 4.9%(+2.40)#6,593 |
| 75. | 97233 | 7.2% | 4.4%(+2.80)#75 | 4.9%(+2.30)#6,624 |
| 76. | 97442 | 7.1% | 4.4%(+2.70)#76 | 4.9%(+2.20)#6,872 |
| 77. | 97135 | 7.1% | 4.4%(+2.70)#77 | 4.9%(+2.20)#6,882 |
| 78. | 97870 | 7.1% | 4.4%(+2.70)#78 | 4.9%(+2.20)#6,909 |
| 79. | 97828 | 7.0% | 4.4%(+2.60)#79 | 4.9%(+2.10)#7,031 |
| 80. | 97423 | 6.9% | 4.4%(+2.50)#80 | 4.9%(+2.00)#7,181 |
| 81. | 97520 | 6.8% | 4.4%(+2.40)#81 | 4.9%(+1.90)#7,327 |
| 82. | 97522 | 6.8% | 4.4%(+2.40)#82 | 4.9%(+1.90)#7,489 |
| 83. | 97856 | 6.8% | 4.4%(+2.40)#83 | 4.9%(+1.90)#7,492 |
| 84. | 97341 | 6.7% | 4.4%(+2.30)#84 | 4.9%(+1.80)#7,615 |
| 85. | 97406 | 6.7% | 4.4%(+2.30)#85 | 4.9%(+1.80)#7,678 |
| 86. | 97722 | 6.7% | 4.4%(+2.30)#86 | 4.9%(+1.80)#7,691 |
| 87. | 97462 | 6.6% | 4.4%(+2.20)#87 | 4.9%(+1.70)#7,801 |
| 88. | 97524 | 6.5% | 4.4%(+2.10)#88 | 4.9%(+1.60)#7,940 |
| 89. | 97210 | 6.5% | 4.4%(+2.10)#89 | 4.9%(+1.60)#7,948 |
| 90. | 97503 | 6.4% | 4.4%(+2.00)#90 | 4.9%(+1.50)#8,142 |
| 91. | 97741 | 6.4% | 4.4%(+2.00)#91 | 4.9%(+1.50)#8,147 |
| 92. | 97417 | 6.4% | 4.4%(+2.00)#92 | 4.9%(+1.50)#8,225 |
| 93. | 97413 | 6.4% | 4.4%(+2.00)#93 | 4.9%(+1.50)#8,259 |
| 94. | 97220 | 6.3% | 4.4%(+1.90)#94 | 4.9%(+1.40)#8,334 |
| 95. | 97037 | 6.3% | 4.4%(+1.90)#95 | 4.9%(+1.40)#8,465 |
| 96. | 97338 | 6.2% | 4.4%(+1.80)#96 | 4.9%(+1.30)#8,548 |
| 97. | 97024 | 6.2% | 4.4%(+1.80)#97 | 4.9%(+1.30)#8,584 |
| 98. | 97760 | 6.2% | 4.4%(+1.80)#98 | 4.9%(+1.30)#8,597 |
| 99. | 97818 | 6.2% | 4.4%(+1.80)#99 | 4.9%(+1.30)#8,616 |
| 100. | 97375 | 6.2% | 4.4%(+1.80)#100 | 4.9%(+1.30)#8,665 |
Common Questions
What are the Top 10 Zip Codes with the Highest Percentage of Households with Income Below $10,000 in Oregon?
Top 10 Zip Codes with the Highest Percentage of Households with Income Below $10,000 in Oregon are:
What zip code has the Highest Percentage of Households with Income Below $10,000 in Oregon?
97837 has the Highest Percentage of Households with Income Below $10,000 in Oregon with 54.8%.
What is the Percentage of Households with Income Below $10,000 in the State of Oregon?
Percentage of Households with Income Below $10,000 in Oregon is 4.4%.
What is the Percentage of Households with Income Below $10,000 in the United States?
Percentage of Households with Income Below $10,000 in the United States is 4.9%.