Zip Codes with the Highest Percentage of Population Employed in Arts, Entertainment & Recreation in Bend, OR
RELATED REPORTS & OPTIONS
Arts, Entertainment & Recreation
Bend
Compare Zip Codes
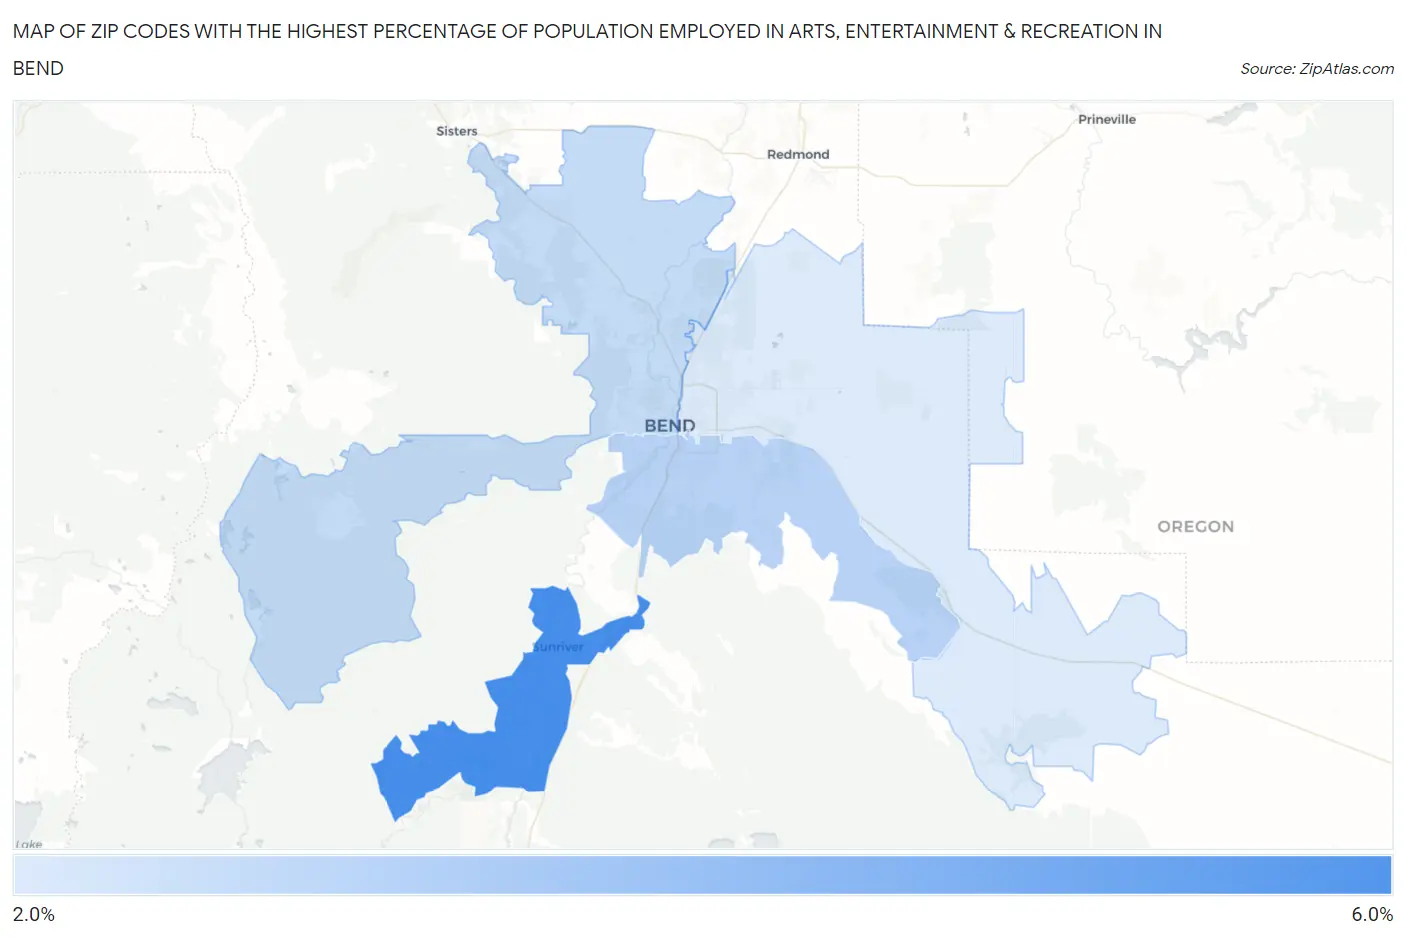
Map of Zip Codes with the Highest Percentage of Population Employed in Arts, Entertainment & Recreation in Bend
2.3%
5.7%
Zip Codes with the Highest Percentage of Population Employed in Arts, Entertainment & Recreation in Bend, OR
| Zip Code | % Employed | vs State | vs National | |
| 1. | 97707 | 5.7% | 2.1%(+3.60)#33 | 2.1%(+3.61)#1,861 |
| 2. | 97702 | 3.1% | 2.1%(+0.993)#82 | 2.1%(+1.00)#5,100 |
| 3. | 97703 | 2.8% | 2.1%(+0.676)#95 | 2.1%(+0.688)#6,100 |
| 4. | 97701 | 2.3% | 2.1%(+0.162)#121 | 2.1%(+0.174)#8,348 |
1
Common Questions
What are the Top 3 Zip Codes with the Highest Percentage of Population Employed in Arts, Entertainment & Recreation in Bend, OR?
Top 3 Zip Codes with the Highest Percentage of Population Employed in Arts, Entertainment & Recreation in Bend, OR are:
What zip code has the Highest Percentage of Population Employed in Arts, Entertainment & Recreation in Bend, OR?
97707 has the Highest Percentage of Population Employed in Arts, Entertainment & Recreation in Bend, OR with 5.7%.
What is the Percentage of Population Employed in Arts, Entertainment & Recreation in Bend, OR?
Percentage of Population Employed in Arts, Entertainment & Recreation in Bend is 2.9%.
What is the Percentage of Population Employed in Arts, Entertainment & Recreation in Oregon?
Percentage of Population Employed in Arts, Entertainment & Recreation in Oregon is 2.1%.
What is the Percentage of Population Employed in Arts, Entertainment & Recreation in the United States?
Percentage of Population Employed in Arts, Entertainment & Recreation in the United States is 2.1%.