Zip Codes with the Highest Percentage of Households with Income Below $10,000 in New Mexico
RELATED REPORTS & OPTIONS
Household Income | $0-10k
New Mexico
Compare Zip Codes
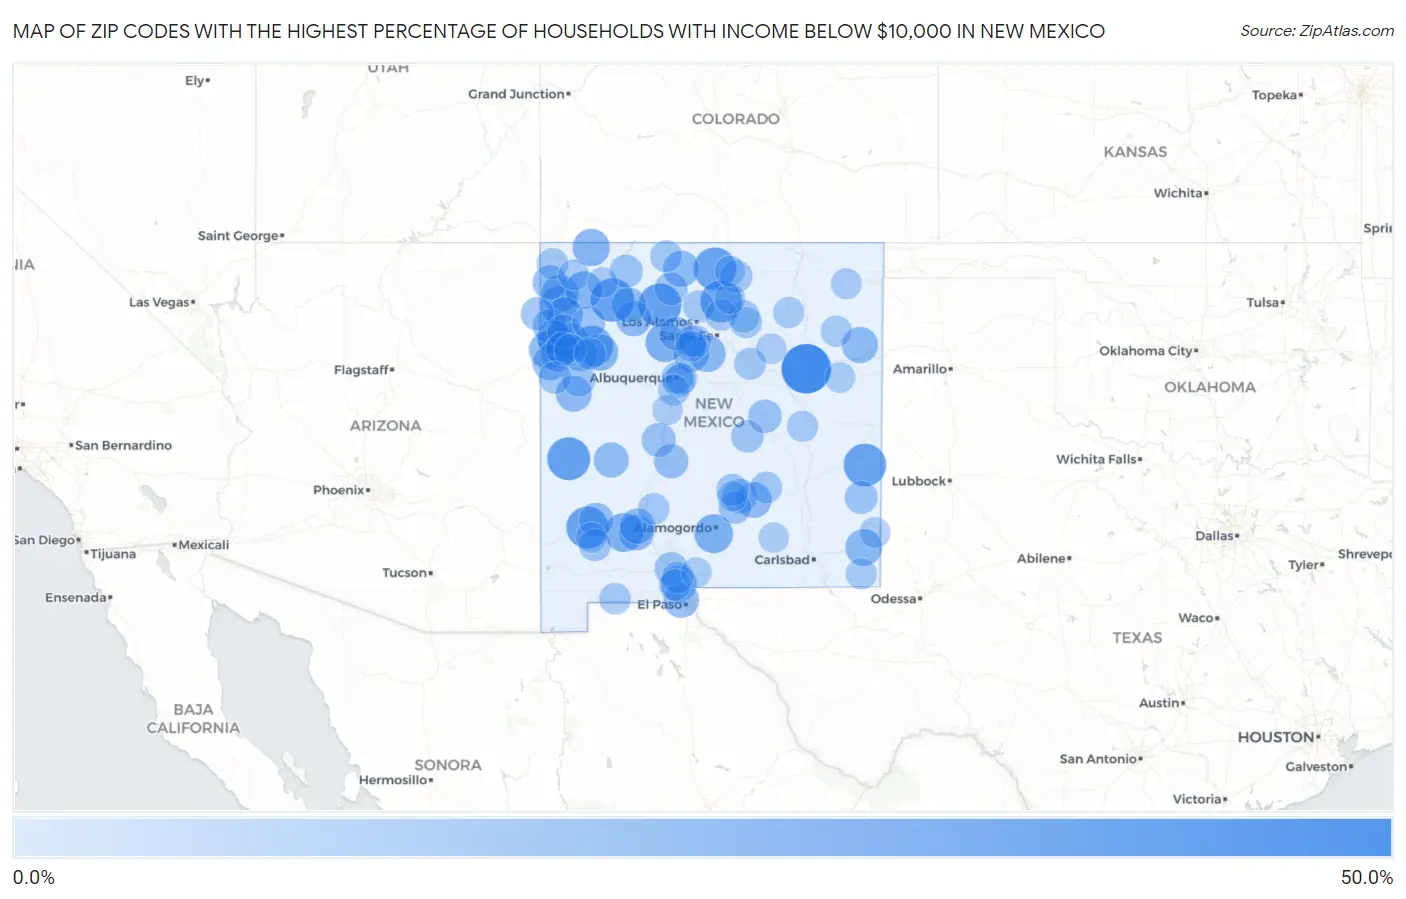
Map of Zip Codes with the Highest Percentage of Households with Income Below $10,000 in New Mexico
0.0%
50.0%
Zip Codes with the Highest Percentage of Households with Income Below $10,000 in New Mexico
| Zip Code | Households with Income < $10k | vs State | vs National | |
| 1. | 88431 | 47.6% | 6.8%(+40.8)#1 | 4.9%(+42.7)#126 |
| 2. | 87037 | 35.1% | 6.8%(+28.3)#2 | 4.9%(+30.2)#218 |
| 3. | 87027 | 34.4% | 6.8%(+27.6)#3 | 4.9%(+29.5)#227 |
| 4. | 87820 | 34.0% | 6.8%(+27.2)#4 | 4.9%(+29.1)#236 |
| 5. | 88126 | 33.3% | 6.8%(+26.5)#5 | 4.9%(+28.4)#259 |
| 6. | 87577 | 33.1% | 6.8%(+26.3)#6 | 4.9%(+28.2)#264 |
| 7. | 88053 | 32.4% | 6.8%(+25.6)#7 | 4.9%(+27.5)#281 |
| 8. | 87527 | 32.0% | 6.8%(+25.2)#8 | 4.9%(+27.1)#288 |
| 9. | 87365 | 30.0% | 6.8%(+23.2)#9 | 4.9%(+25.1)#330 |
| 10. | 87053 | 25.8% | 6.8%(+19.0)#10 | 4.9%(+20.9)#449 |
| 11. | 88311 | 25.4% | 6.8%(+18.6)#11 | 4.9%(+20.5)#465 |
| 12. | 88042 | 25.4% | 6.8%(+18.6)#12 | 4.9%(+20.5)#469 |
| 13. | 87364 | 22.7% | 6.8%(+15.9)#13 | 4.9%(+17.8)#600 |
| 14. | 87455 | 22.6% | 6.8%(+15.8)#14 | 4.9%(+17.7)#604 |
| 15. | 87499 | 22.6% | 6.8%(+15.8)#15 | 4.9%(+17.7)#605 |
| 16. | 87317 | 22.3% | 6.8%(+15.5)#16 | 4.9%(+17.4)#618 |
| 17. | 87418 | 22.3% | 6.8%(+15.5)#17 | 4.9%(+17.4)#621 |
| 18. | 87319 | 22.0% | 6.8%(+15.2)#18 | 4.9%(+17.1)#636 |
| 19. | 88265 | 21.3% | 6.8%(+14.5)#19 | 4.9%(+16.4)#690 |
| 20. | 87045 | 21.1% | 6.8%(+14.3)#20 | 4.9%(+16.2)#698 |
| 21. | 87010 | 20.8% | 6.8%(+14.0)#21 | 4.9%(+15.9)#717 |
| 22. | 87001 | 20.5% | 6.8%(+13.7)#22 | 4.9%(+15.6)#747 |
| 23. | 88426 | 20.2% | 6.8%(+13.4)#23 | 4.9%(+15.3)#783 |
| 24. | 87575 | 20.1% | 6.8%(+13.3)#24 | 4.9%(+15.2)#788 |
| 25. | 88024 | 20.1% | 6.8%(+13.3)#25 | 4.9%(+15.2)#789 |
| 26. | 88336 | 19.6% | 6.8%(+12.8)#26 | 4.9%(+14.7)#837 |
| 27. | 87357 | 19.5% | 6.8%(+12.7)#27 | 4.9%(+14.6)#842 |
| 28. | 87311 | 19.3% | 6.8%(+12.5)#28 | 4.9%(+14.4)#866 |
| 29. | 87325 | 19.3% | 6.8%(+12.5)#29 | 4.9%(+14.4)#868 |
| 30. | 87930 | 19.3% | 6.8%(+12.5)#30 | 4.9%(+14.4)#870 |
| 31. | 88063 | 19.0% | 6.8%(+12.2)#31 | 4.9%(+14.1)#899 |
| 32. | 87013 | 18.5% | 6.8%(+11.7)#32 | 4.9%(+13.6)#947 |
| 33. | 87931 | 18.5% | 6.8%(+11.7)#33 | 4.9%(+13.6)#952 |
| 34. | 87326 | 18.3% | 6.8%(+11.5)#34 | 4.9%(+13.4)#974 |
| 35. | 87825 | 17.9% | 6.8%(+11.1)#35 | 4.9%(+13.0)#1,035 |
| 36. | 87018 | 17.6% | 6.8%(+10.8)#36 | 4.9%(+12.7)#1,077 |
| 37. | 87312 | 17.4% | 6.8%(+10.6)#37 | 4.9%(+12.5)#1,106 |
| 38. | 87461 | 17.3% | 6.8%(+10.5)#38 | 4.9%(+12.4)#1,117 |
| 39. | 87320 | 17.2% | 6.8%(+10.4)#39 | 4.9%(+12.3)#1,131 |
| 40. | 87375 | 16.8% | 6.8%(+10.00)#40 | 4.9%(+11.9)#1,187 |
| 41. | 88346 | 16.7% | 6.8%(+9.90)#41 | 4.9%(+11.8)#1,203 |
| 42. | 88049 | 16.7% | 6.8%(+9.90)#42 | 4.9%(+11.8)#1,212 |
| 43. | 87832 | 16.3% | 6.8%(+9.50)#43 | 4.9%(+11.4)#1,288 |
| 44. | 87823 | 16.0% | 6.8%(+9.20)#44 | 4.9%(+11.1)#1,345 |
| 45. | 87044 | 15.4% | 6.8%(+8.60)#45 | 4.9%(+10.5)#1,450 |
| 46. | 87305 | 15.3% | 6.8%(+8.50)#46 | 4.9%(+10.4)#1,457 |
| 47. | 88353 | 14.9% | 6.8%(+8.10)#47 | 4.9%(+10.00)#1,552 |
| 48. | 88001 | 14.6% | 6.8%(+7.80)#48 | 4.9%(+9.70)#1,614 |
| 49. | 87328 | 14.5% | 6.8%(+7.70)#49 | 4.9%(+9.60)#1,652 |
| 50. | 87310 | 14.5% | 6.8%(+7.70)#50 | 4.9%(+9.60)#1,654 |
| 51. | 87322 | 14.3% | 6.8%(+7.50)#51 | 4.9%(+9.40)#1,702 |
| 52. | 87321 | 14.1% | 6.8%(+7.30)#52 | 4.9%(+9.20)#1,750 |
| 53. | 87017 | 14.1% | 6.8%(+7.30)#53 | 4.9%(+9.20)#1,758 |
| 54. | 87313 | 14.0% | 6.8%(+7.20)#54 | 4.9%(+9.10)#1,764 |
| 55. | 87412 | 13.9% | 6.8%(+7.10)#55 | 4.9%(+9.00)#1,808 |
| 56. | 88267 | 13.8% | 6.8%(+7.00)#56 | 4.9%(+8.90)#1,826 |
| 57. | 88340 | 13.1% | 6.8%(+6.30)#57 | 4.9%(+8.20)#2,039 |
| 58. | 88318 | 13.1% | 6.8%(+6.30)#58 | 4.9%(+8.20)#2,057 |
| 59. | 87327 | 12.8% | 6.8%(+6.00)#59 | 4.9%(+7.90)#2,164 |
| 60. | 88312 | 12.7% | 6.8%(+5.90)#60 | 4.9%(+7.80)#2,206 |
| 61. | 87514 | 12.7% | 6.8%(+5.90)#61 | 4.9%(+7.80)#2,211 |
| 62. | 87041 | 12.6% | 6.8%(+5.80)#62 | 4.9%(+7.70)#2,243 |
| 63. | 88043 | 12.4% | 6.8%(+5.60)#63 | 4.9%(+7.50)#2,308 |
| 64. | 87106 | 12.2% | 6.8%(+5.40)#64 | 4.9%(+7.30)#2,370 |
| 65. | 87732 | 12.1% | 6.8%(+5.30)#65 | 4.9%(+7.20)#2,434 |
| 66. | 87528 | 11.9% | 6.8%(+5.10)#66 | 4.9%(+7.00)#2,522 |
| 67. | 87583 | 11.9% | 6.8%(+5.10)#67 | 4.9%(+7.00)#2,535 |
| 68. | 88072 | 11.8% | 6.8%(+5.00)#68 | 4.9%(+6.90)#2,552 |
| 69. | 87316 | 11.8% | 6.8%(+5.00)#69 | 4.9%(+6.90)#2,559 |
| 70. | 87323 | 11.7% | 6.8%(+4.90)#70 | 4.9%(+6.80)#2,591 |
| 71. | 87537 | 11.5% | 6.8%(+4.70)#71 | 4.9%(+6.60)#2,692 |
| 72. | 87102 | 11.4% | 6.8%(+4.60)#72 | 4.9%(+6.50)#2,727 |
| 73. | 88351 | 11.4% | 6.8%(+4.60)#73 | 4.9%(+6.50)#2,776 |
| 74. | 88029 | 11.3% | 6.8%(+4.50)#74 | 4.9%(+6.40)#2,811 |
| 75. | 88027 | 11.3% | 6.8%(+4.50)#75 | 4.9%(+6.40)#2,817 |
| 76. | 87522 | 11.1% | 6.8%(+4.30)#76 | 4.9%(+6.20)#2,904 |
| 77. | 87742 | 11.1% | 6.8%(+4.30)#77 | 4.9%(+6.20)#2,926 |
| 78. | 87108 | 11.0% | 6.8%(+4.20)#78 | 4.9%(+6.10)#2,947 |
| 79. | 87901 | 10.8% | 6.8%(+4.00)#79 | 4.9%(+5.90)#3,078 |
| 80. | 87420 | 10.6% | 6.8%(+3.80)#80 | 4.9%(+5.70)#3,181 |
| 81. | 87072 | 10.6% | 6.8%(+3.80)#81 | 4.9%(+5.70)#3,210 |
| 82. | 87022 | 10.4% | 6.8%(+3.60)#82 | 4.9%(+5.50)#3,345 |
| 83. | 87752 | 10.3% | 6.8%(+3.50)#83 | 4.9%(+5.40)#3,407 |
| 84. | 87733 | 10.3% | 6.8%(+3.50)#84 | 4.9%(+5.40)#3,419 |
| 85. | 88252 | 10.1% | 6.8%(+3.30)#85 | 4.9%(+5.20)#3,531 |
| 86. | 88119 | 9.9% | 6.8%(+3.10)#86 | 4.9%(+5.00)#3,682 |
| 87. | 88242 | 9.7% | 6.8%(+2.90)#87 | 4.9%(+4.80)#3,821 |
| 88. | 87052 | 9.7% | 6.8%(+2.90)#88 | 4.9%(+4.80)#3,834 |
| 89. | 87416 | 9.5% | 6.8%(+2.70)#89 | 4.9%(+4.60)#3,976 |
| 90. | 88424 | 9.5% | 6.8%(+2.70)#90 | 4.9%(+4.60)#4,020 |
| 91. | 87553 | 9.3% | 6.8%(+2.50)#91 | 4.9%(+4.40)#4,152 |
| 92. | 88026 | 9.2% | 6.8%(+2.40)#92 | 4.9%(+4.30)#4,263 |
| 93. | 87701 | 9.0% | 6.8%(+2.20)#93 | 4.9%(+4.10)#4,413 |
| 94. | 87513 | 9.0% | 6.8%(+2.20)#94 | 4.9%(+4.10)#4,472 |
| 95. | 88081 | 8.9% | 6.8%(+2.10)#95 | 4.9%(+4.00)#4,518 |
| 96. | 87413 | 8.9% | 6.8%(+2.10)#96 | 4.9%(+4.00)#4,521 |
| 97. | 88401 | 8.9% | 6.8%(+2.10)#97 | 4.9%(+4.00)#4,537 |
| 98. | 87002 | 8.8% | 6.8%(+2.00)#98 | 4.9%(+3.90)#4,620 |
| 99. | 88345 | 8.7% | 6.8%(+1.90)#99 | 4.9%(+3.80)#4,748 |
| 100. | 88250 | 8.6% | 6.8%(+1.80)#100 | 4.9%(+3.70)#4,900 |
Common Questions
What are the Top 10 Zip Codes with the Highest Percentage of Households with Income Below $10,000 in New Mexico?
Top 10 Zip Codes with the Highest Percentage of Households with Income Below $10,000 in New Mexico are:
What zip code has the Highest Percentage of Households with Income Below $10,000 in New Mexico?
88431 has the Highest Percentage of Households with Income Below $10,000 in New Mexico with 47.6%.
What is the Percentage of Households with Income Below $10,000 in the State of New Mexico?
Percentage of Households with Income Below $10,000 in New Mexico is 6.8%.
What is the Percentage of Households with Income Below $10,000 in the United States?
Percentage of Households with Income Below $10,000 in the United States is 4.9%.