McLain, MS Map & Demographics
McLain Map
McLain Overview
$16,087
PER CAPITA INCOME
$30,938
AVG HOUSEHOLD INCOME
56.1%
WAGE / INCOME GAP [ % ]
43.9¢/ $1
WAGE / INCOME GAP [ $ ]
0.48
INEQUALITY / GINI INDEX
367
TOTAL POPULATION
112
MALE POPULATION
255
FEMALE POPULATION
43.92
MALES / 100 FEMALES
227.68
FEMALES / 100 MALES
27.6
MEDIAN AGE
3.9
AVG FAMILY SIZE
3.1
AVG HOUSEHOLD SIZE
83
LABOR FORCE [ PEOPLE ]
38.6%
PERCENT IN LABOR FORCE
1.2%
UNEMPLOYMENT RATE
Income in McLain
Income Overview in McLain
| Characteristic | Number | Measure |
| Per Capita Income | 367 | $16,087 |
| Median Family Income | 86 | $0 |
| Mean Family Income | 86 | $69,730 |
| Median Household Income | 120 | $30,938 |
| Mean Household Income | 120 | $54,865 |
| Income Deficit | 86 | $0 |
| Wage / Income Gap (%) | 367 | 56.11% |
| Wage / Income Gap ($) | 367 | 43.89¢ per $1 |
| Gini / Inequality Index | 367 | 0.48 |
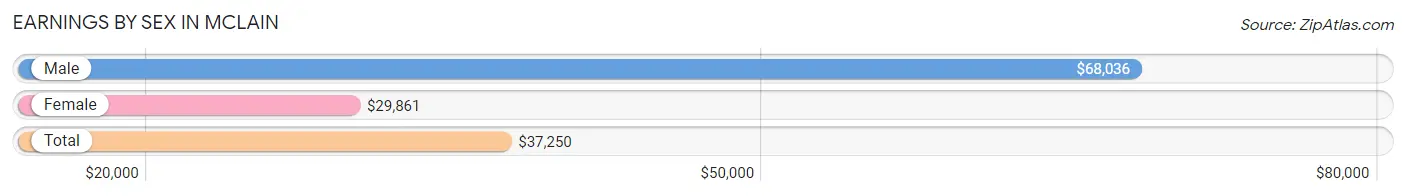
Earnings by Sex in McLain
Average Earnings in McLain are $37,250, $68,036 for men and $29,861 for women, a difference of 56.1%.
| Sex | Number | Average Earnings |
| Male | 45 (47.9%) | $68,036 |
| Female | 49 (52.1%) | $29,861 |
| Total | 94 (100.0%) | $37,250 |
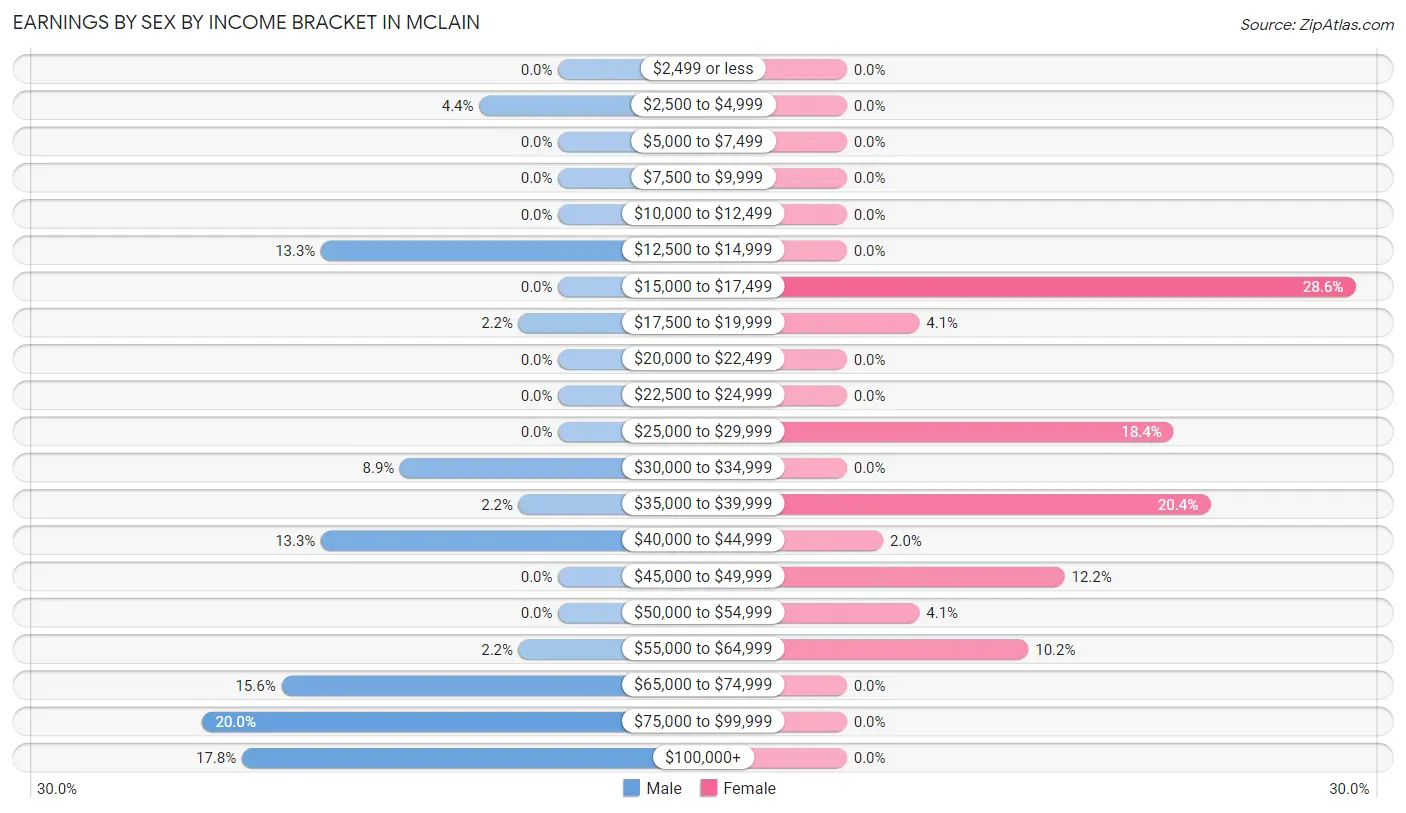
Earnings by Sex by Income Bracket in McLain
The most common earnings brackets in McLain are $75,000 to $99,999 for men (9 | 20.0%) and $15,000 to $17,499 for women (14 | 28.6%).
| Income | Male | Female |
| $2,499 or less | 0 (0.0%) | 0 (0.0%) |
| $2,500 to $4,999 | 2 (4.4%) | 0 (0.0%) |
| $5,000 to $7,499 | 0 (0.0%) | 0 (0.0%) |
| $7,500 to $9,999 | 0 (0.0%) | 0 (0.0%) |
| $10,000 to $12,499 | 0 (0.0%) | 0 (0.0%) |
| $12,500 to $14,999 | 6 (13.3%) | 0 (0.0%) |
| $15,000 to $17,499 | 0 (0.0%) | 14 (28.6%) |
| $17,500 to $19,999 | 1 (2.2%) | 2 (4.1%) |
| $20,000 to $22,499 | 0 (0.0%) | 0 (0.0%) |
| $22,500 to $24,999 | 0 (0.0%) | 0 (0.0%) |
| $25,000 to $29,999 | 0 (0.0%) | 9 (18.4%) |
| $30,000 to $34,999 | 4 (8.9%) | 0 (0.0%) |
| $35,000 to $39,999 | 1 (2.2%) | 10 (20.4%) |
| $40,000 to $44,999 | 6 (13.3%) | 1 (2.0%) |
| $45,000 to $49,999 | 0 (0.0%) | 6 (12.2%) |
| $50,000 to $54,999 | 0 (0.0%) | 2 (4.1%) |
| $55,000 to $64,999 | 1 (2.2%) | 5 (10.2%) |
| $65,000 to $74,999 | 7 (15.6%) | 0 (0.0%) |
| $75,000 to $99,999 | 9 (20.0%) | 0 (0.0%) |
| $100,000+ | 8 (17.8%) | 0 (0.0%) |
| Total | 45 (100.0%) | 49 (100.0%) |
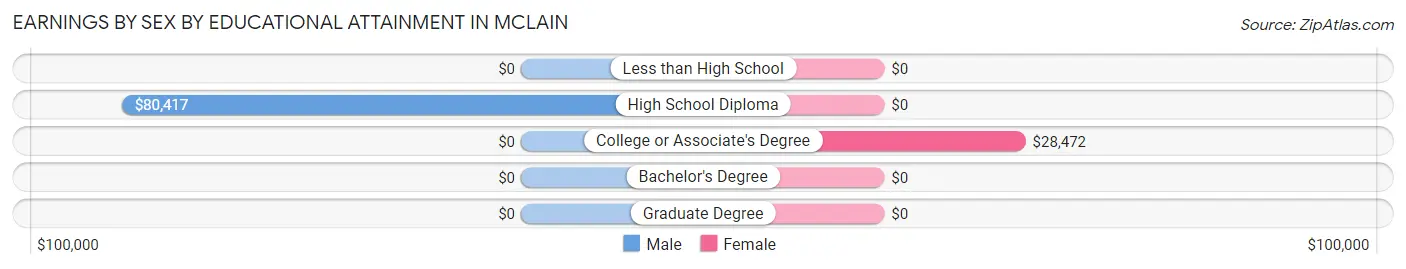
Earnings by Sex by Educational Attainment in McLain
Average earnings in McLain are $69,107 for men and $29,861 for women, a difference of 56.8%. Men with an educational attainment of high school diploma enjoy the highest average annual earnings of $80,417, while those with high school diploma education earn the least with $80,417. Women with an educational attainment of college or associate's degree earn the most with the average annual earnings of $28,472, while those with college or associate's degree education have the smallest earnings of $28,472.
| Educational Attainment | Male Income | Female Income |
| Less than High School | - | - |
| High School Diploma | $80,417 | $0 |
| College or Associate's Degree | - | - |
| Bachelor's Degree | - | - |
| Graduate Degree | - | - |
| Total | $69,107 | $29,861 |
Family Income in McLain
Family Income Brackets in McLain
According to the McLain family income data, there are 22 families falling into the $25,000 to $34,999 income range, which is the most common income bracket and makes up 25.6% of all families.
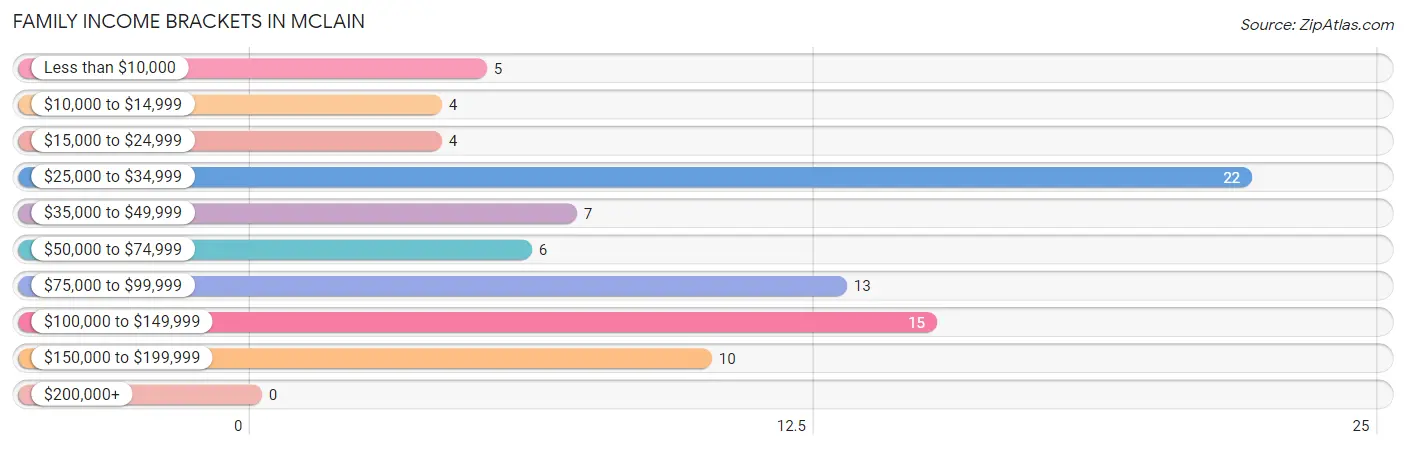
| Income Bracket | # Families | % Families |
| Less than $10,000 | 5 | 5.8% |
| $10,000 to $14,999 | 4 | 4.7% |
| $15,000 to $24,999 | 4 | 4.7% |
| $25,000 to $34,999 | 22 | 25.6% |
| $35,000 to $49,999 | 7 | 8.1% |
| $50,000 to $74,999 | 6 | 7.0% |
| $75,000 to $99,999 | 13 | 15.1% |
| $100,000 to $149,999 | 15 | 17.4% |
| $150,000 to $199,999 | 10 | 11.6% |
| $200,000+ | 0 | 0.0% |
Family Income by Famaliy Size in McLain
3-person families (31 | 36.0%) account for the highest median family income in McLain with $128,472 per family, while 3-person families (31 | 36.0%) have the highest median income of $42,824 per family member.
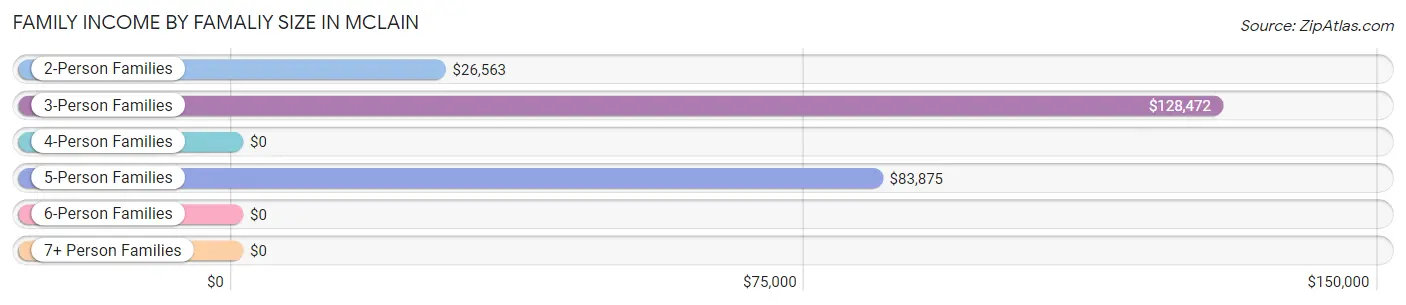
| Income Bracket | # Families | Median Income |
| 2-Person Families | 31 (36.0%) | $26,563 |
| 3-Person Families | 31 (36.0%) | $128,472 |
| 4-Person Families | 11 (12.8%) | $0 |
| 5-Person Families | 13 (15.1%) | $83,875 |
| 6-Person Families | 0 (0.0%) | $0 |
| 7+ Person Families | 0 (0.0%) | $0 |
| Total | 86 (100.0%) | $0 |
Family Income by Number of Earners in McLain
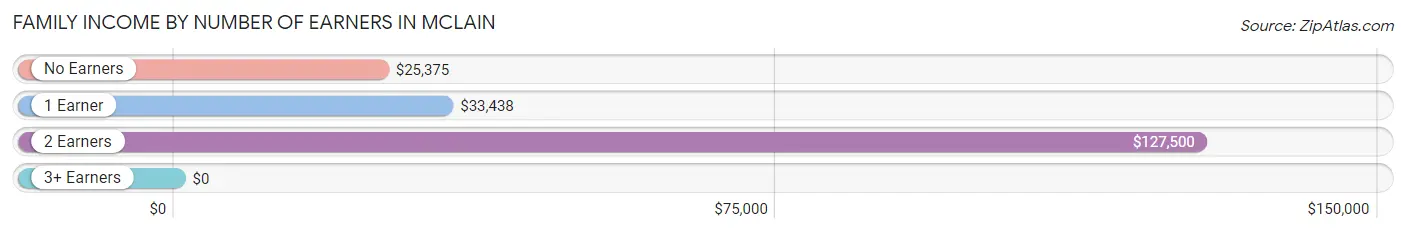
| Number of Earners | # Families | Median Income |
| No Earners | 29 (33.7%) | $25,375 |
| 1 Earner | 19 (22.1%) | $33,438 |
| 2 Earners | 38 (44.2%) | $127,500 |
| 3+ Earners | 0 (0.0%) | $0 |
| Total | 86 (100.0%) | $0 |
Household Income in McLain
Household Income Brackets in McLain
With 33 households falling in the category, the $25,000 to $34,999 income range is the most frequent in McLain, accounting for 27.5% of all households.
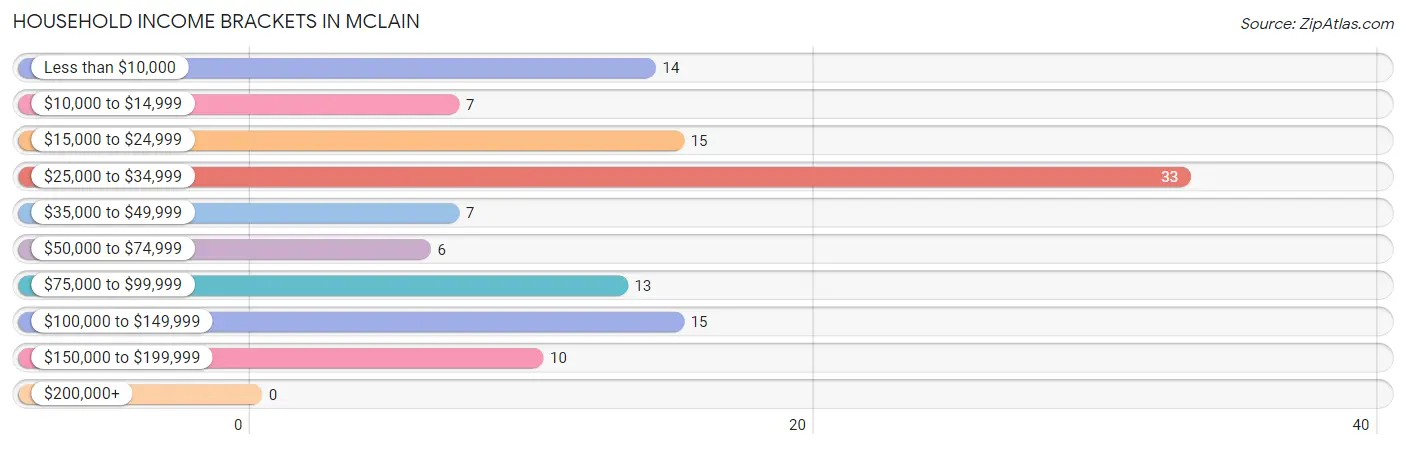
| Income Bracket | # Households | % Households |
| Less than $10,000 | 14 | 11.7% |
| $10,000 to $14,999 | 7 | 5.8% |
| $15,000 to $24,999 | 15 | 12.5% |
| $25,000 to $34,999 | 33 | 27.5% |
| $35,000 to $49,999 | 7 | 5.8% |
| $50,000 to $74,999 | 6 | 5.0% |
| $75,000 to $99,999 | 13 | 10.8% |
| $100,000 to $149,999 | 15 | 12.5% |
| $150,000 to $199,999 | 10 | 8.3% |
| $200,000+ | 0 | 0.0% |
Household Income by Householder Age in McLain
The median household income in McLain is $30,938, with the highest median household income of $127,639 found in the 25 to 44 years age bracket for the primary householder. A total of 37 households (30.8%) fall into this category.
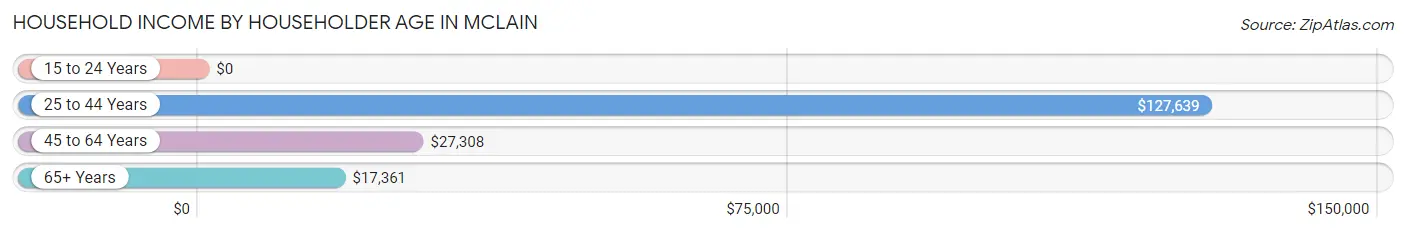
| Income Bracket | # Households | Median Income |
| 15 to 24 Years | 0 (0.0%) | $0 |
| 25 to 44 Years | 37 (30.8%) | $127,639 |
| 45 to 64 Years | 34 (28.3%) | $27,308 |
| 65+ Years | 49 (40.8%) | $17,361 |
| Total | 120 (100.0%) | $30,938 |
Poverty in McLain
Income Below Poverty by Sex and Age in McLain
With 8.0% poverty level for males and 8.2% for females among the residents of McLain, 16 and 17 year old males and 65 to 74 year old females are the most vulnerable to poverty, with 5 males (45.5%) and 16 females (41.0%) in their respective age groups living below the poverty level.
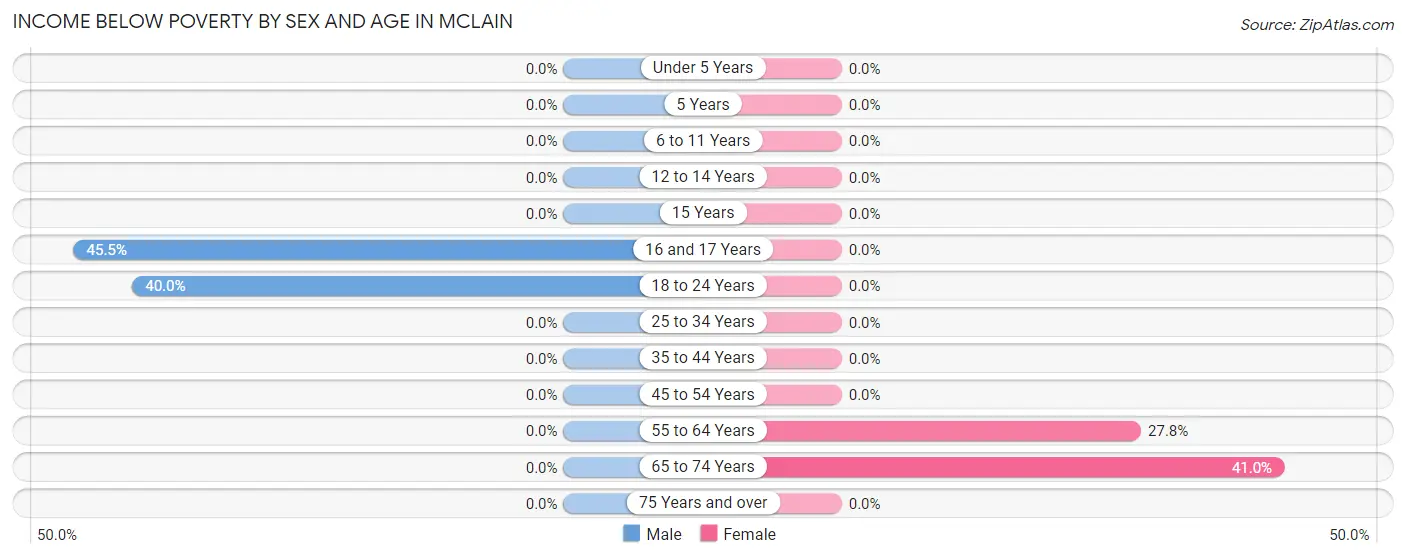
| Age Bracket | Male | Female |
| Under 5 Years | 0 (0.0%) | 0 (0.0%) |
| 5 Years | 0 (0.0%) | 0 (0.0%) |
| 6 to 11 Years | 0 (0.0%) | 0 (0.0%) |
| 12 to 14 Years | 0 (0.0%) | 0 (0.0%) |
| 15 Years | 0 (0.0%) | 0 (0.0%) |
| 16 and 17 Years | 5 (45.5%) | 0 (0.0%) |
| 18 to 24 Years | 4 (40.0%) | 0 (0.0%) |
| 25 to 34 Years | 0 (0.0%) | 0 (0.0%) |
| 35 to 44 Years | 0 (0.0%) | 0 (0.0%) |
| 45 to 54 Years | 0 (0.0%) | 0 (0.0%) |
| 55 to 64 Years | 0 (0.0%) | 5 (27.8%) |
| 65 to 74 Years | 0 (0.0%) | 16 (41.0%) |
| 75 Years and over | 0 (0.0%) | 0 (0.0%) |
| Total | 9 (8.0%) | 21 (8.2%) |
Income Above Poverty by Sex and Age in McLain
According to the poverty statistics in McLain, males aged under 5 years and females aged under 5 years are the age groups that are most secure financially, with 100.0% of males and 100.0% of females in these age groups living above the poverty line.
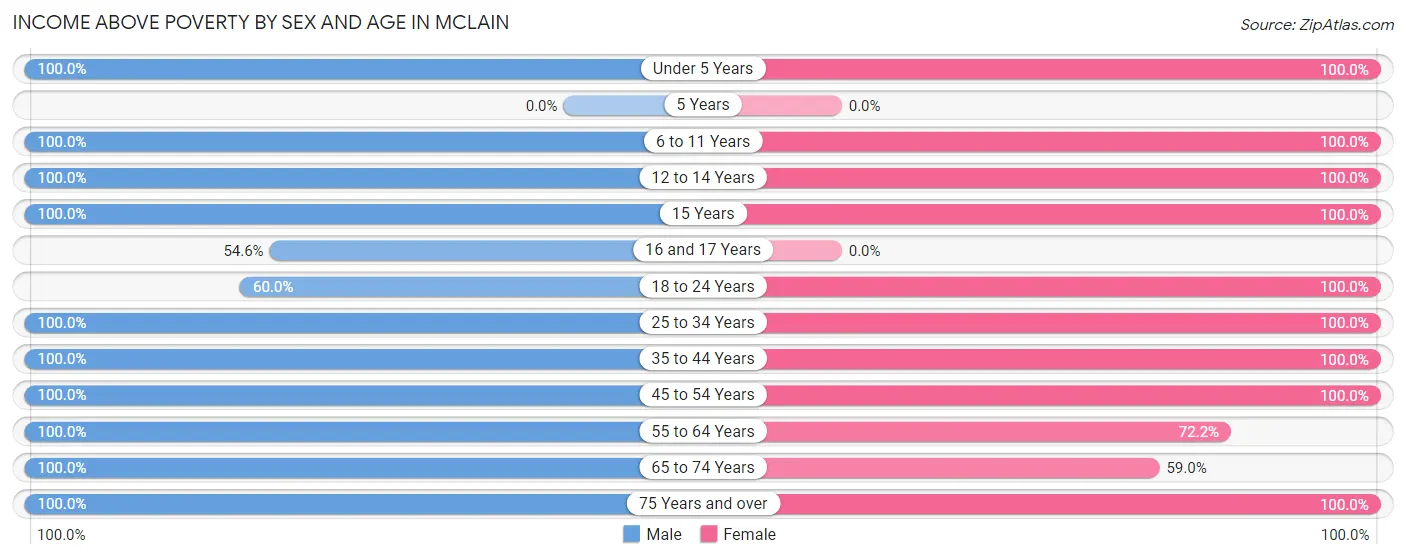
| Age Bracket | Male | Female |
| Under 5 Years | 16 (100.0%) | 5 (100.0%) |
| 5 Years | 0 (0.0%) | 0 (0.0%) |
| 6 to 11 Years | 2 (100.0%) | 97 (100.0%) |
| 12 to 14 Years | 2 (100.0%) | 6 (100.0%) |
| 15 Years | 7 (100.0%) | 17 (100.0%) |
| 16 and 17 Years | 6 (54.5%) | 0 (0.0%) |
| 18 to 24 Years | 6 (60.0%) | 3 (100.0%) |
| 25 to 34 Years | 18 (100.0%) | 10 (100.0%) |
| 35 to 44 Years | 16 (100.0%) | 35 (100.0%) |
| 45 to 54 Years | 10 (100.0%) | 20 (100.0%) |
| 55 to 64 Years | 13 (100.0%) | 13 (72.2%) |
| 65 to 74 Years | 6 (100.0%) | 23 (59.0%) |
| 75 Years and over | 1 (100.0%) | 5 (100.0%) |
| Total | 103 (92.0%) | 234 (91.8%) |
Income Below Poverty Among Married-Couple Families in McLain
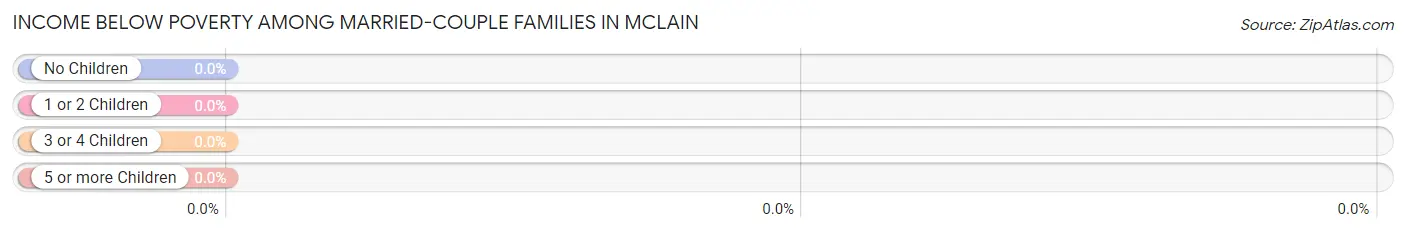
| Children | Above Poverty | Below Poverty |
| No Children | 14 (100.0%) | 0 (0.0%) |
| 1 or 2 Children | 33 (100.0%) | 0 (0.0%) |
| 3 or 4 Children | 10 (100.0%) | 0 (0.0%) |
| 5 or more Children | 0 (0.0%) | 0 (0.0%) |
| Total | 57 (100.0%) | 0 (0.0%) |
Income Below Poverty Among Single-Parent Households in McLain
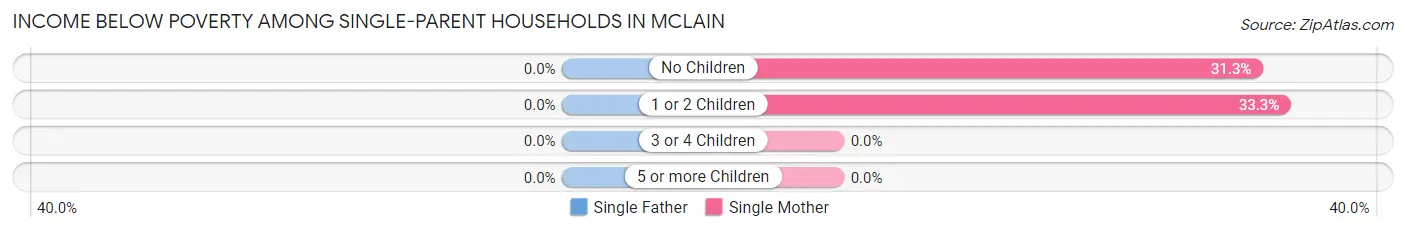
| Children | Single Father | Single Mother |
| No Children | 0 (0.0%) | 5 (31.2%) |
| 1 or 2 Children | 0 (0.0%) | 4 (33.3%) |
| 3 or 4 Children | 0 (0.0%) | 0 (0.0%) |
| 5 or more Children | 0 (0.0%) | 0 (0.0%) |
| Total | 0 (0.0%) | 9 (32.1%) |
Income Below Poverty Among Married-Couple vs Single-Parent Households in McLain
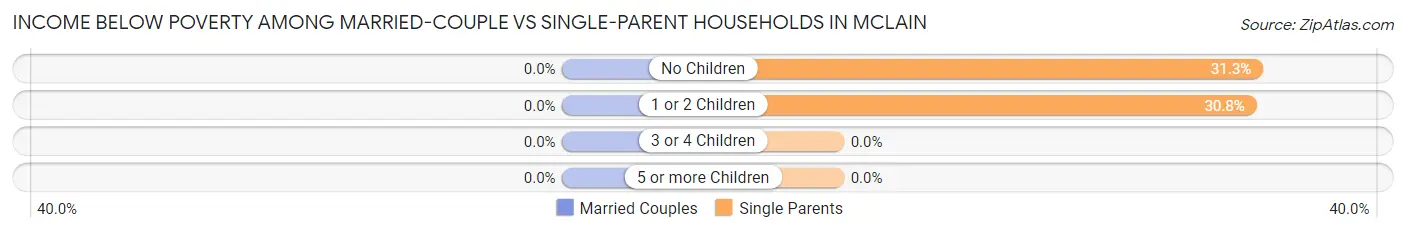
| Children | Married-Couple Families | Single-Parent Households |
| No Children | 0 (0.0%) | 5 (31.2%) |
| 1 or 2 Children | 0 (0.0%) | 4 (30.8%) |
| 3 or 4 Children | 0 (0.0%) | 0 (0.0%) |
| 5 or more Children | 0 (0.0%) | 0 (0.0%) |
| Total | 0 (0.0%) | 9 (31.0%) |
Race in McLain
The most populous races in McLain are White / Caucasian (325 | 88.6%), Black / African American (30 | 8.2%), and Two or more Races (11 | 3.0%).
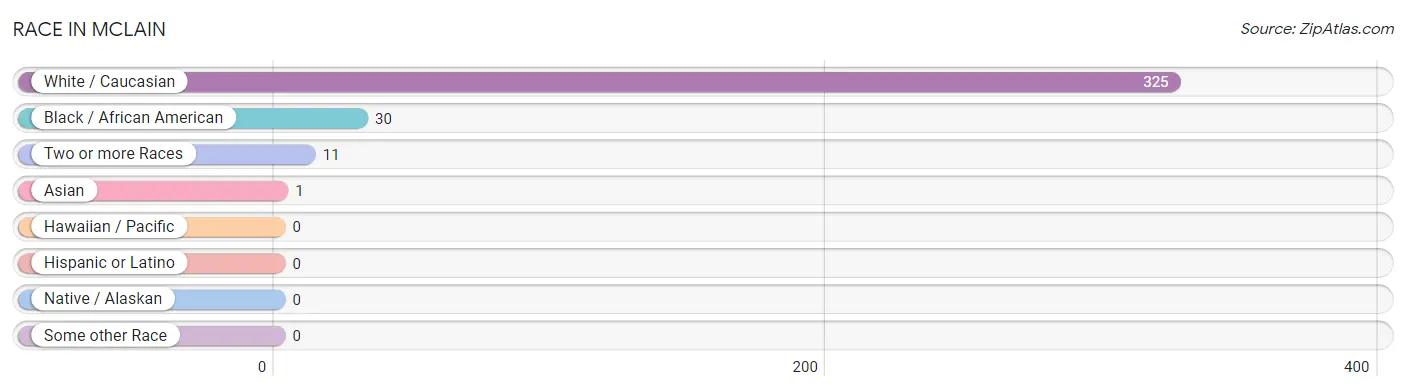
| Race | # Population | % Population |
| Asian | 1 | 0.3% |
| Black / African American | 30 | 8.2% |
| Hawaiian / Pacific | 0 | 0.0% |
| Hispanic or Latino | 0 | 0.0% |
| Native / Alaskan | 0 | 0.0% |
| White / Caucasian | 325 | 88.6% |
| Two or more Races | 11 | 3.0% |
| Some other Race | 0 | 0.0% |
| Total | 367 | 100.0% |
Ancestry in McLain
The most populous ancestries reported in McLain are Irish (166 | 45.2%), American (61 | 16.6%), French (40 | 10.9%), German (19 | 5.2%), and English (11 | 3.0%), together accounting for 80.9% of all McLain residents.
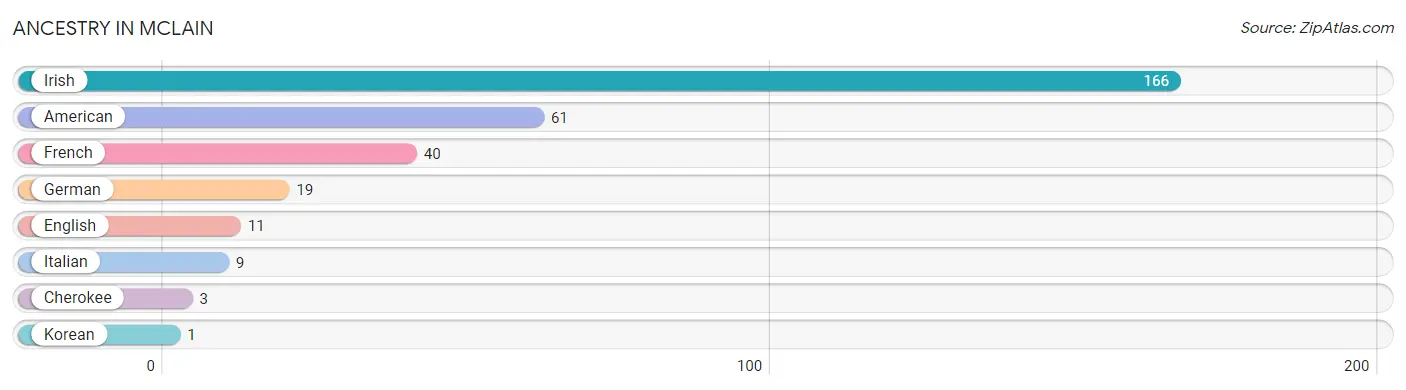
| Ancestry | # Population | % Population |
| American | 61 | 16.6% |
| Cherokee | 3 | 0.8% |
| English | 11 | 3.0% |
| French | 40 | 10.9% |
| German | 19 | 5.2% |
| Irish | 166 | 45.2% |
| Italian | 9 | 2.5% |
| Korean | 1 | 0.3% | View All 8 Rows |
Immigrants in McLain
The most numerous immigrant groups reported in McLain came from Canada (8 | 2.2%), Asia (1 | 0.3%), Philippines (1 | 0.3%), and South Eastern Asia (1 | 0.3%), together accounting for 3.0% of all McLain residents.
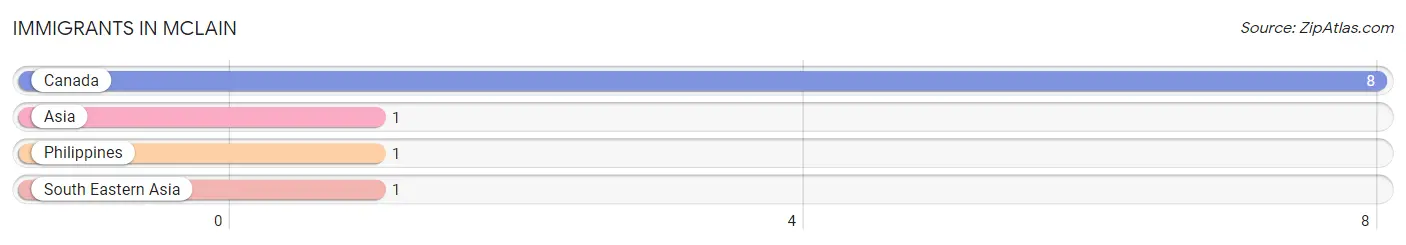
| Immigration Origin | # Population | % Population |
| Asia | 1 | 0.3% |
| Canada | 8 | 2.2% |
| Philippines | 1 | 0.3% |
| South Eastern Asia | 1 | 0.3% | View All 4 Rows |
Sex and Age in McLain
Sex and Age in McLain
The most populous age groups in McLain are 15 to 19 Years (22 | 19.6%) for men and 5 to 9 Years (97 | 38.0%) for women.
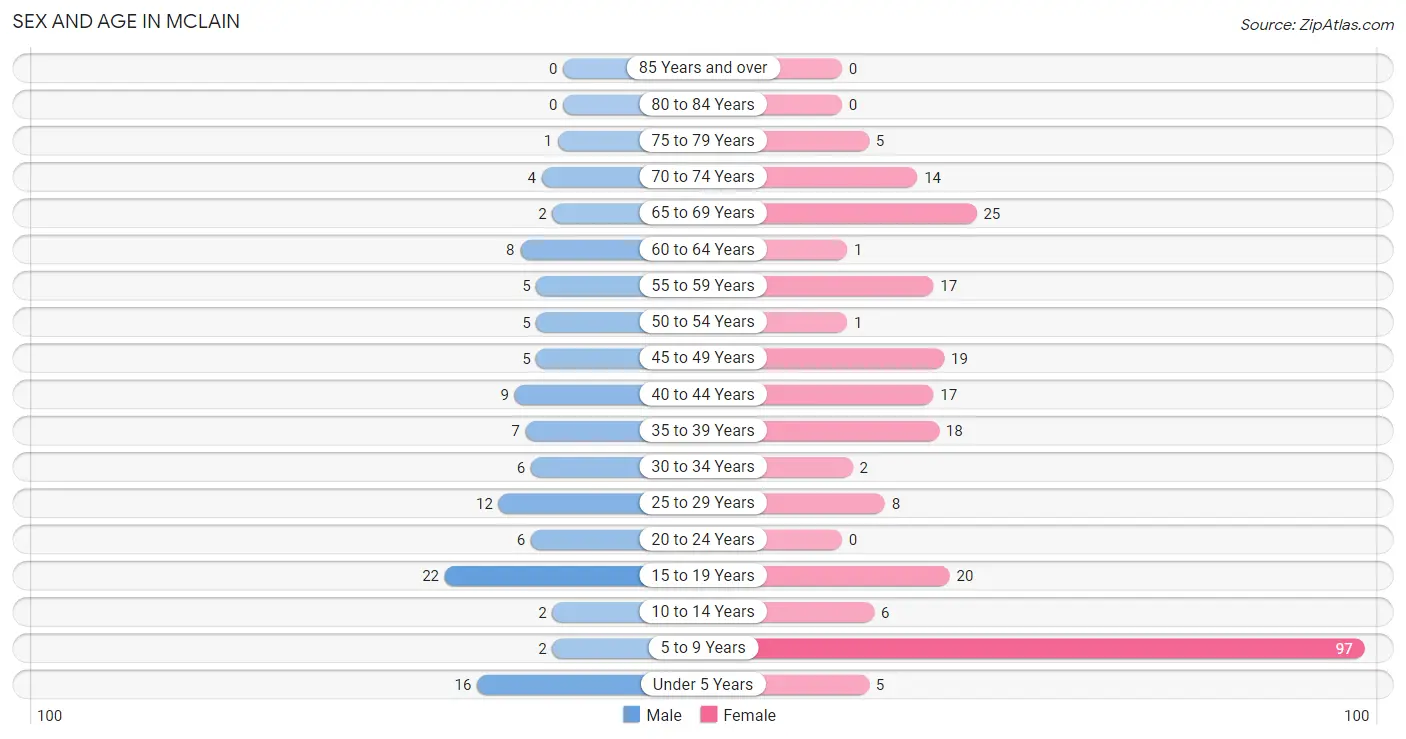
| Age Bracket | Male | Female |
| Under 5 Years | 16 (14.3%) | 5 (2.0%) |
| 5 to 9 Years | 2 (1.8%) | 97 (38.0%) |
| 10 to 14 Years | 2 (1.8%) | 6 (2.4%) |
| 15 to 19 Years | 22 (19.6%) | 20 (7.8%) |
| 20 to 24 Years | 6 (5.4%) | 0 (0.0%) |
| 25 to 29 Years | 12 (10.7%) | 8 (3.1%) |
| 30 to 34 Years | 6 (5.4%) | 2 (0.8%) |
| 35 to 39 Years | 7 (6.2%) | 18 (7.1%) |
| 40 to 44 Years | 9 (8.0%) | 17 (6.7%) |
| 45 to 49 Years | 5 (4.5%) | 19 (7.4%) |
| 50 to 54 Years | 5 (4.5%) | 1 (0.4%) |
| 55 to 59 Years | 5 (4.5%) | 17 (6.7%) |
| 60 to 64 Years | 8 (7.1%) | 1 (0.4%) |
| 65 to 69 Years | 2 (1.8%) | 25 (9.8%) |
| 70 to 74 Years | 4 (3.6%) | 14 (5.5%) |
| 75 to 79 Years | 1 (0.9%) | 5 (2.0%) |
| 80 to 84 Years | 0 (0.0%) | 0 (0.0%) |
| 85 Years and over | 0 (0.0%) | 0 (0.0%) |
| Total | 112 (100.0%) | 255 (100.0%) |
Families and Households in McLain
Median Family Size in McLain
The median family size in McLain is 3.87 persons per family, with single male/father families (1 | 1.2%) accounting for the largest median family size of 14 persons per family. On the other hand, single female/mother families (28 | 32.6%) represent the smallest median family size with 2.46 persons per family.
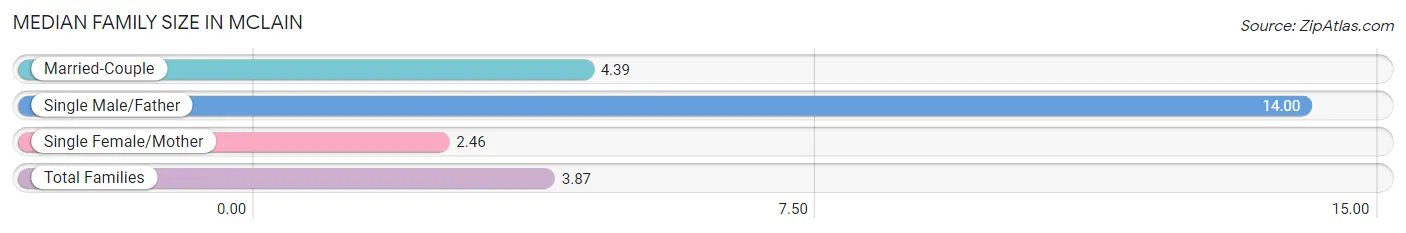
| Family Type | # Families | Family Size |
| Married-Couple | 57 (66.3%) | 4.39 |
| Single Male/Father | 1 (1.2%) | 14.00 |
| Single Female/Mother | 28 (32.6%) | 2.46 |
| Total Families | 86 (100.0%) | 3.87 |
Median Household Size in McLain
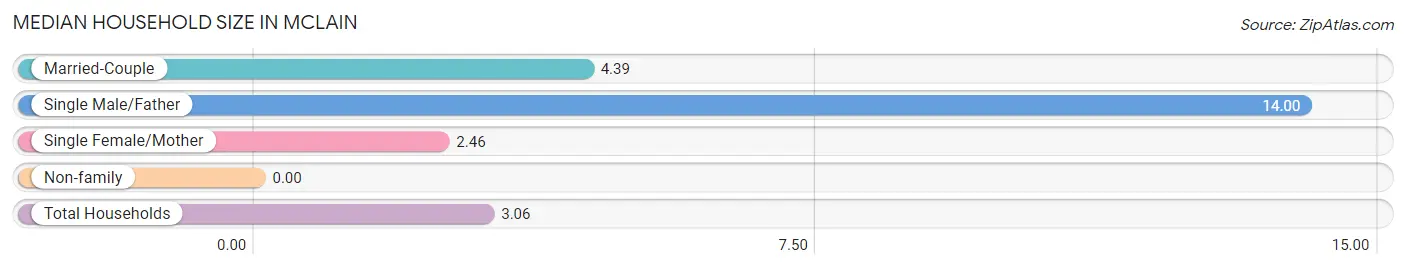
| Household Type | # Households | Household Size |
| Married-Couple | 57 (47.5%) | 4.39 |
| Single Male/Father | 1 (0.8%) | 14.00 |
| Single Female/Mother | 28 (23.3%) | 2.46 |
| Non-family | 34 (28.3%) | - |
| Total Households | 120 (100.0%) | 3.06 |
Household Size by Marriage Status in McLain
Out of a total of 120 households in McLain, 86 (71.7%) are family households, while 34 (28.3%) are nonfamily households. The most numerous type of family households are 2-person households, comprising 31, and the most common type of nonfamily households are 1-person households, comprising 34.
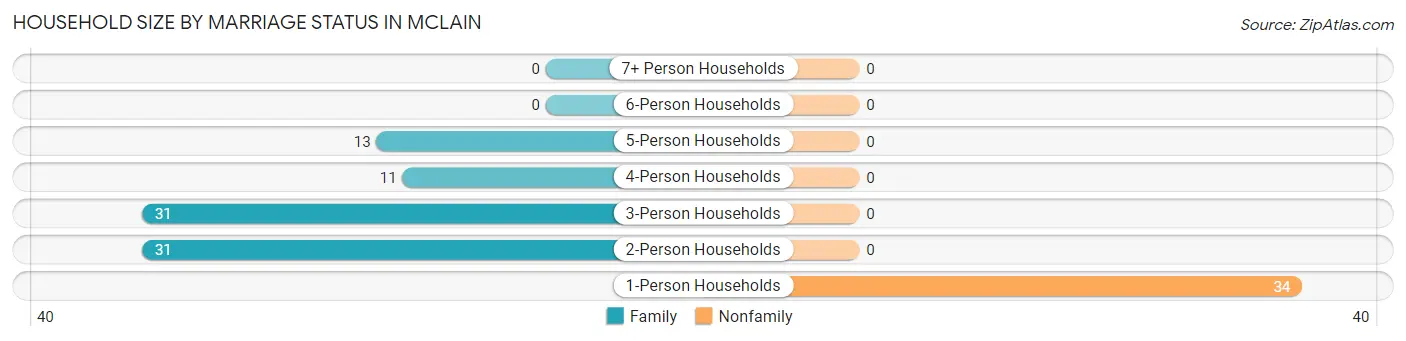
| Household Size | Family Households | Nonfamily Households |
| 1-Person Households | - | 34 (28.3%) |
| 2-Person Households | 31 (25.8%) | 0 (0.0%) |
| 3-Person Households | 31 (25.8%) | 0 (0.0%) |
| 4-Person Households | 11 (9.2%) | 0 (0.0%) |
| 5-Person Households | 13 (10.8%) | 0 (0.0%) |
| 6-Person Households | 0 (0.0%) | 0 (0.0%) |
| 7+ Person Households | 0 (0.0%) | 0 (0.0%) |
| Total | 86 (71.7%) | 34 (28.3%) |
Female Fertility in McLain
Fertility by Age in McLain
Average fertility rate in McLain is 95.0 births per 1,000 women. Women in the age bracket of 35 to 50 years have the highest fertility rate with 148.0 births per 1,000 women. Women in the age bracket of 35 to 50 years acount for 100.0% of all women with births.
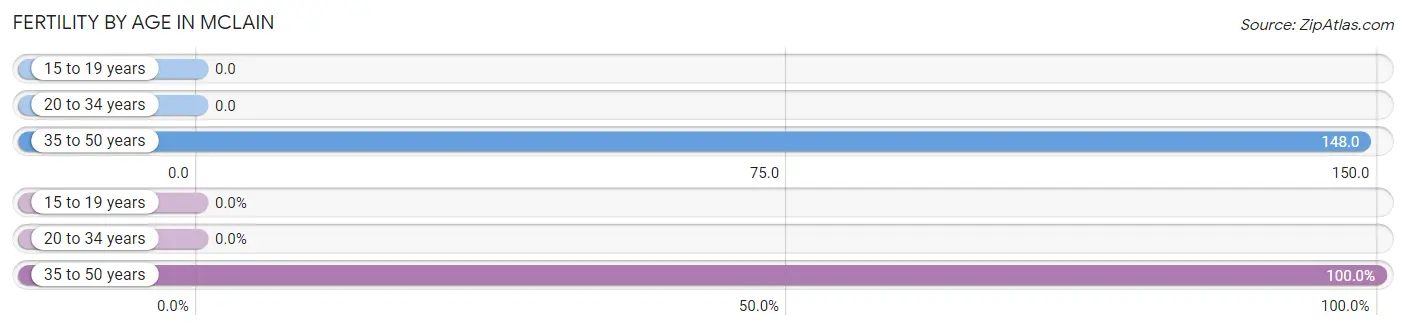
| Age Bracket | Women with Births | Births / 1,000 Women |
| 15 to 19 years | 0 (0.0%) | 0.0 |
| 20 to 34 years | 0 (0.0%) | 0.0 |
| 35 to 50 years | 8 (100.0%) | 148.0 |
| Total | 8 (100.0%) | 95.0 |
Fertility by Age by Marriage Status in McLain
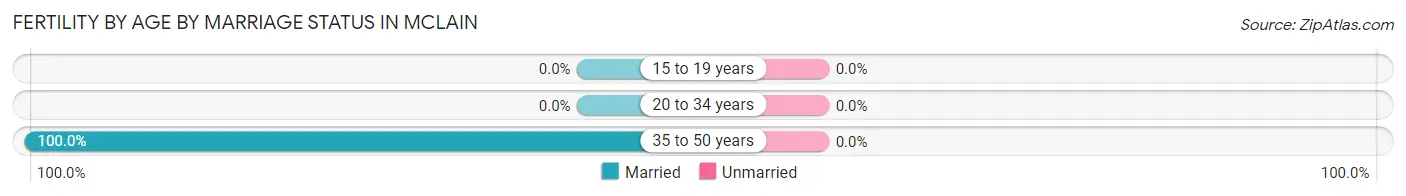
| Age Bracket | Married | Unmarried |
| 15 to 19 years | 0 (0.0%) | 0 (0.0%) |
| 20 to 34 years | 0 (0.0%) | 0 (0.0%) |
| 35 to 50 years | 8 (100.0%) | 0 (0.0%) |
| Total | 8 (100.0%) | 0 (0.0%) |
Fertility by Education in McLain
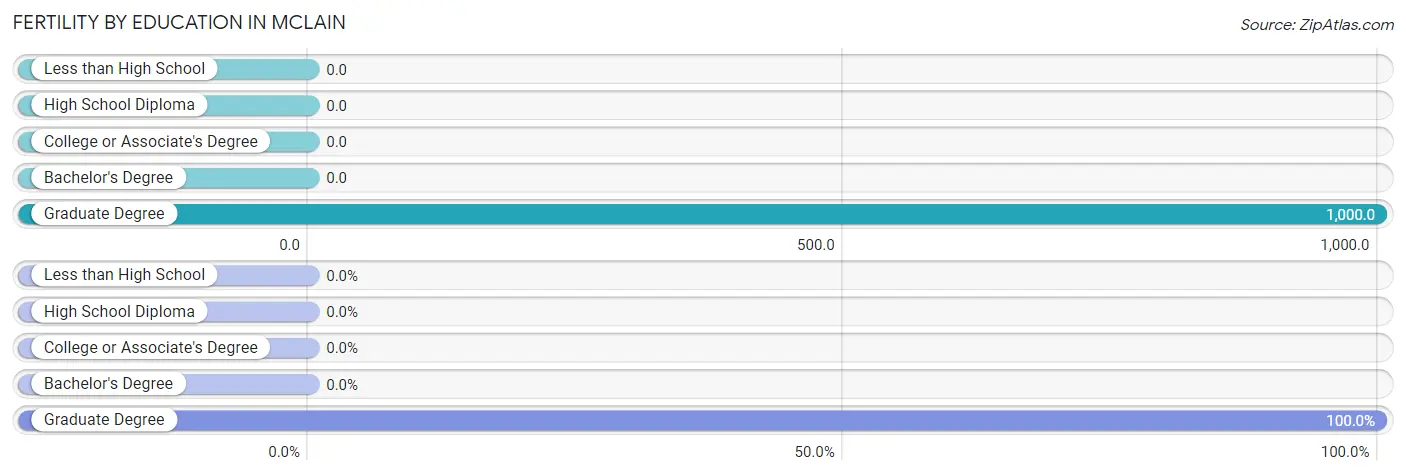
| Educational Attainment | Women with Births | Births / 1,000 Women |
| Less than High School | 0 (0.0%) | 0.0 |
| High School Diploma | 0 (0.0%) | 0.0 |
| College or Associate's Degree | 0 (0.0%) | 0.0 |
| Bachelor's Degree | 0 (0.0%) | 0.0 |
| Graduate Degree | 8 (100.0%) | 1,000.0 |
| Total | 8 (100.0%) | 95.0 |
Fertility by Education by Marriage Status in McLain
| Educational Attainment | Married | Unmarried |
| Less than High School | 0 (0.0%) | 0 (0.0%) |
| High School Diploma | 0 (0.0%) | 0 (0.0%) |
| College or Associate's Degree | 0 (0.0%) | 0 (0.0%) |
| Bachelor's Degree | 0 (0.0%) | 0 (0.0%) |
| Graduate Degree | 8 (100.0%) | 0 (0.0%) |
| Total | 8 (100.0%) | 0 (0.0%) |
Employment Characteristics in McLain
Employment by Class of Employer in McLain
Among the 82 employed individuals in McLain, private company employees (63 | 76.8%), local government employees (15 | 18.3%), and self-employed (not incorporated) (4 | 4.9%) make up the most common classes of employment.
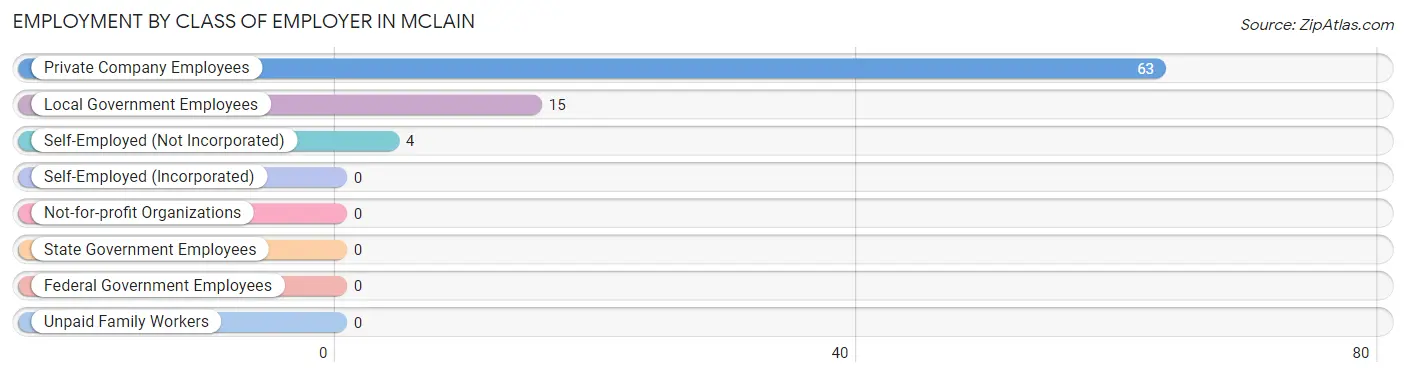
| Employer Class | # Employees | % Employees |
| Private Company Employees | 63 | 76.8% |
| Self-Employed (Incorporated) | 0 | 0.0% |
| Self-Employed (Not Incorporated) | 4 | 4.9% |
| Not-for-profit Organizations | 0 | 0.0% |
| Local Government Employees | 15 | 18.3% |
| State Government Employees | 0 | 0.0% |
| Federal Government Employees | 0 | 0.0% |
| Unpaid Family Workers | 0 | 0.0% |
| Total | 82 | 100.0% |
Employment Status by Age in McLain
According to the labor force statistics for McLain, out of the total population over 16 years of age (215), 38.6% or 83 individuals are in the labor force, with 1.2% or 1 of them unemployed. The age group with the highest labor force participation rate is 25 to 29 years, with 85.0% or 17 individuals in the labor force. Within the labor force, the 35 to 44 years age range has the highest percentage of unemployed individuals, with 2.8% or 1 of them being unemployed.
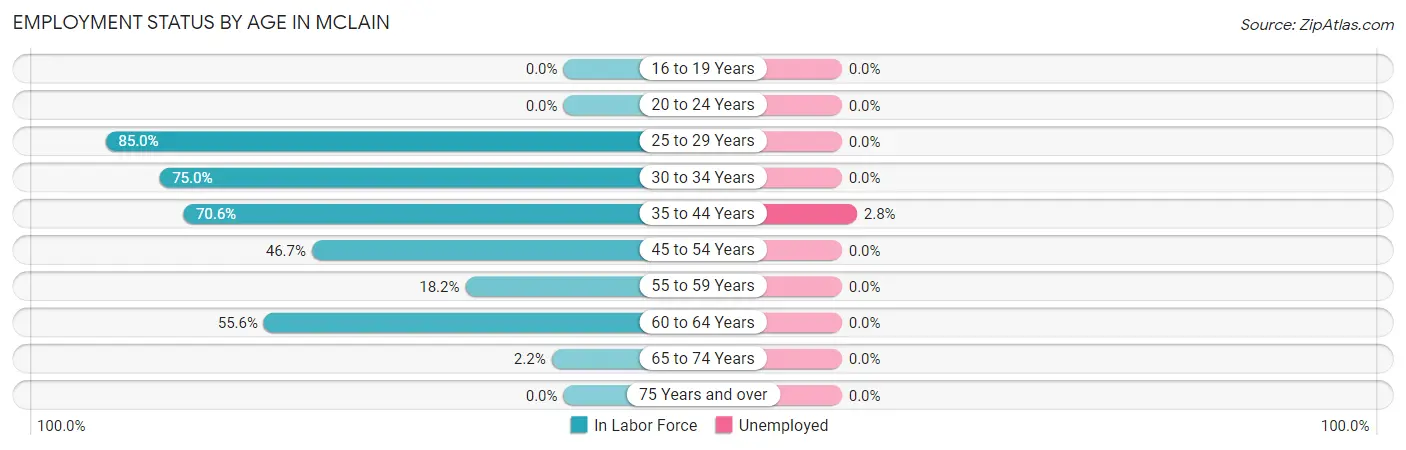
| Age Bracket | In Labor Force | Unemployed |
| 16 to 19 Years | 0 (0.0%) | 0 (0.0%) |
| 20 to 24 Years | 0 (0.0%) | 0 (0.0%) |
| 25 to 29 Years | 17 (85.0%) | 0 (0.0%) |
| 30 to 34 Years | 6 (75.0%) | 0 (0.0%) |
| 35 to 44 Years | 36 (70.6%) | 1 (2.8%) |
| 45 to 54 Years | 14 (46.7%) | 0 (0.0%) |
| 55 to 59 Years | 4 (18.2%) | 0 (0.0%) |
| 60 to 64 Years | 5 (55.6%) | 0 (0.0%) |
| 65 to 74 Years | 1 (2.2%) | 0 (0.0%) |
| 75 Years and over | 0 (0.0%) | 0 (0.0%) |
| Total | 83 (38.6%) | 1 (1.2%) |
Employment Status by Educational Attainment in McLain
According to labor force statistics for McLain, 58.6% of individuals (82) out of the total population between 25 and 64 years of age (140) are in the labor force, with 1.2% or 1 of them being unemployed. The group with the highest labor force participation rate are those with the educational attainment of high school diploma, with 64.4% or 38 individuals in the labor force. Within the labor force, individuals with high school diploma education have the highest percentage of unemployment, with 2.6% or 1 of them being unemployed.
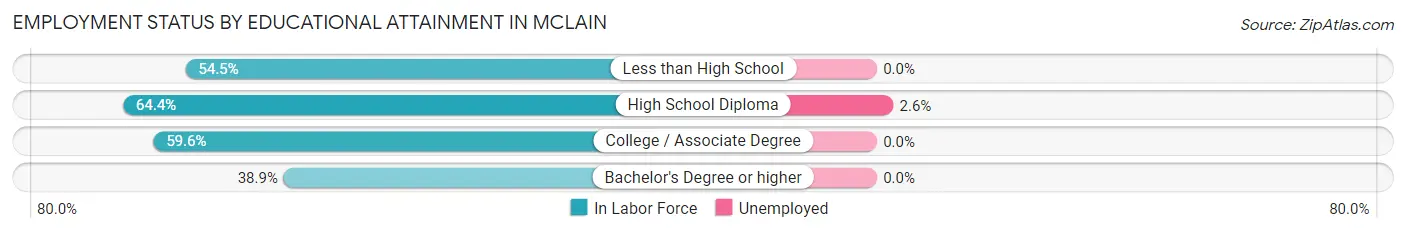
| Educational Attainment | In Labor Force | Unemployed |
| Less than High School | 6 (54.5%) | 0 (0.0%) |
| High School Diploma | 38 (64.4%) | 2 (2.6%) |
| College / Associate Degree | 31 (59.6%) | 0 (0.0%) |
| Bachelor's Degree or higher | 7 (38.9%) | 0 (0.0%) |
| Total | 82 (58.6%) | 2 (1.2%) |
Employment Occupations by Sex in McLain
Management, Business, Science and Arts Occupations
The most common Management, Business, Science and Arts occupations in McLain are Health Diagnosing & Treating (17 | 20.7%), Management (11 | 13.4%), Health Technologists (6 | 7.3%), Community & Social Service (5 | 6.1%), and Education Instruction & Library (5 | 6.1%).
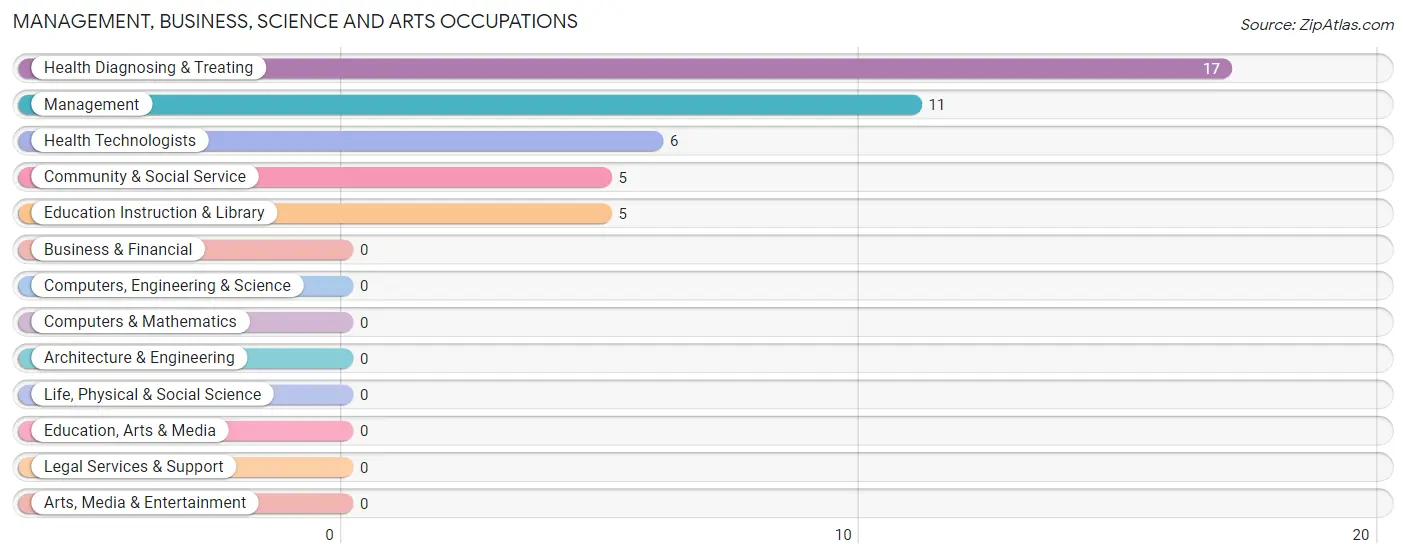
Management, Business, Science and Arts Occupations by Sex
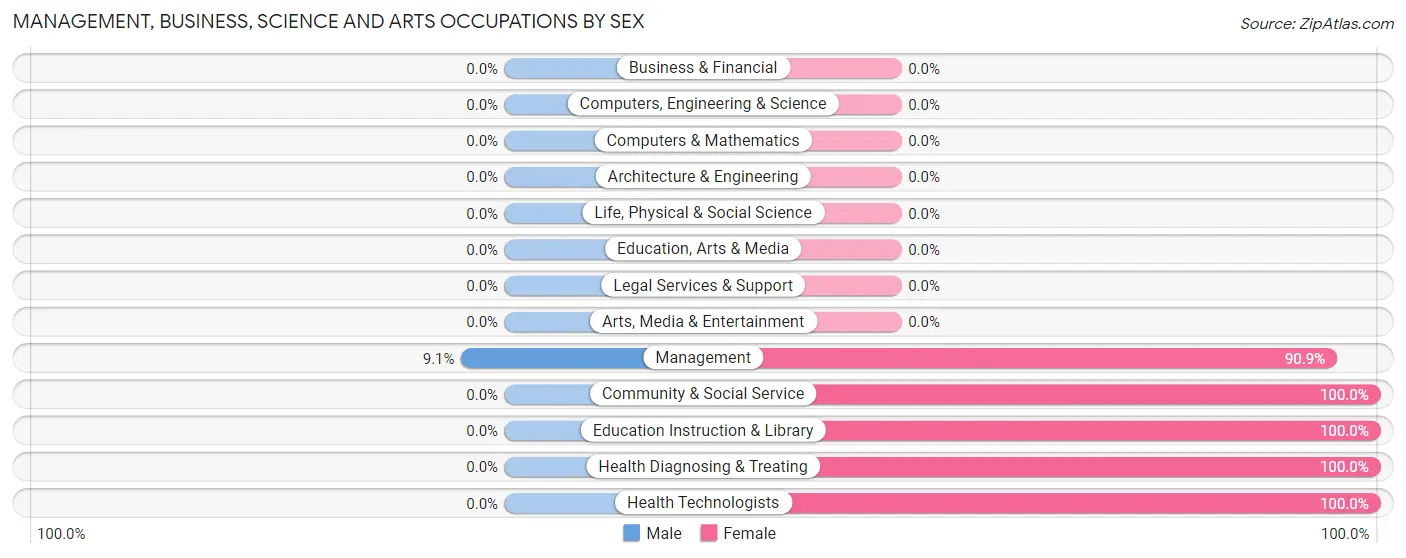
| Occupation | Male | Female |
| Management | 1 (9.1%) | 10 (90.9%) |
| Business & Financial | 0 (0.0%) | 0 (0.0%) |
| Computers, Engineering & Science | 0 (0.0%) | 0 (0.0%) |
| Computers & Mathematics | 0 (0.0%) | 0 (0.0%) |
| Architecture & Engineering | 0 (0.0%) | 0 (0.0%) |
| Life, Physical & Social Science | 0 (0.0%) | 0 (0.0%) |
| Community & Social Service | 0 (0.0%) | 5 (100.0%) |
| Education, Arts & Media | 0 (0.0%) | 0 (0.0%) |
| Legal Services & Support | 0 (0.0%) | 0 (0.0%) |
| Education Instruction & Library | 0 (0.0%) | 5 (100.0%) |
| Arts, Media & Entertainment | 0 (0.0%) | 0 (0.0%) |
| Health Diagnosing & Treating | 0 (0.0%) | 17 (100.0%) |
| Health Technologists | 0 (0.0%) | 6 (100.0%) |
| Total (Category) | 1 (3.0%) | 32 (97.0%) |
| Total (Overall) | 35 (42.7%) | 47 (57.3%) |
Services Occupations
The most common Services occupations in McLain are , and Personal Care & Service (8 | 9.8%).
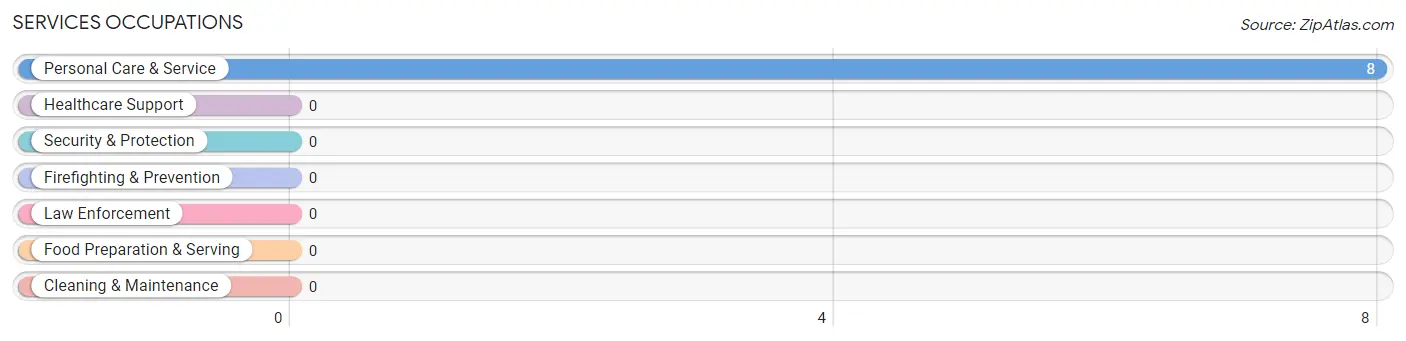
Services Occupations by Sex
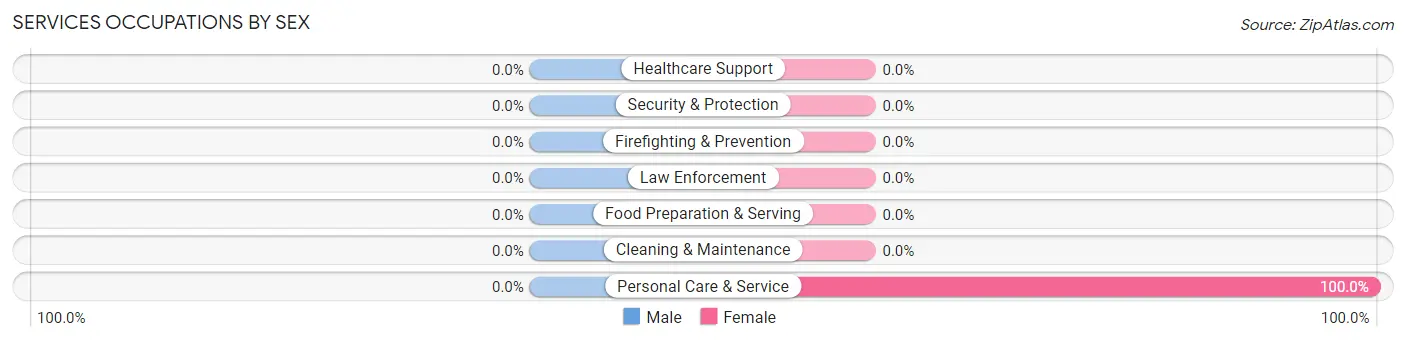
| Occupation | Male | Female |
| Healthcare Support | 0 (0.0%) | 0 (0.0%) |
| Security & Protection | 0 (0.0%) | 0 (0.0%) |
| Firefighting & Prevention | 0 (0.0%) | 0 (0.0%) |
| Law Enforcement | 0 (0.0%) | 0 (0.0%) |
| Food Preparation & Serving | 0 (0.0%) | 0 (0.0%) |
| Cleaning & Maintenance | 0 (0.0%) | 0 (0.0%) |
| Personal Care & Service | 0 (0.0%) | 8 (100.0%) |
| Total (Category) | 0 (0.0%) | 8 (100.0%) |
| Total (Overall) | 35 (42.7%) | 47 (57.3%) |
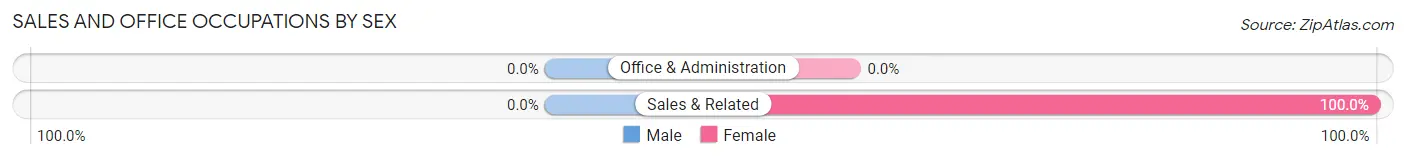
Sales and Office Occupations
The most common Sales and Office occupations in McLain are , and Sales & Related (3 | 3.7%).
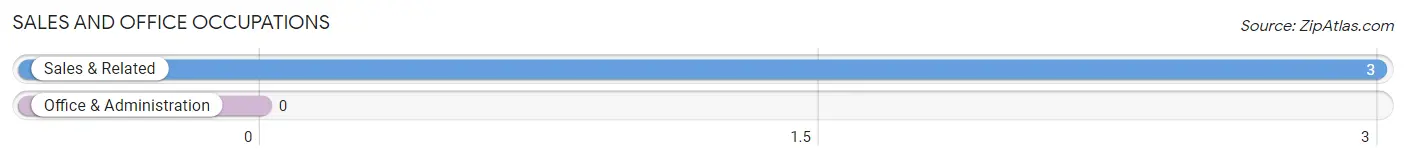
Sales and Office Occupations by Sex
| Occupation | Male | Female |
| Sales & Related | 0 (0.0%) | 3 (100.0%) |
| Office & Administration | 0 (0.0%) | 0 (0.0%) |
| Total (Category) | 0 (0.0%) | 3 (100.0%) |
| Total (Overall) | 35 (42.7%) | 47 (57.3%) |
Natural Resources, Construction and Maintenance Occupations
The most common Natural Resources, Construction and Maintenance occupations in McLain are Construction & Extraction (30 | 36.6%), and Farming, Fishing & Forestry (4 | 4.9%).
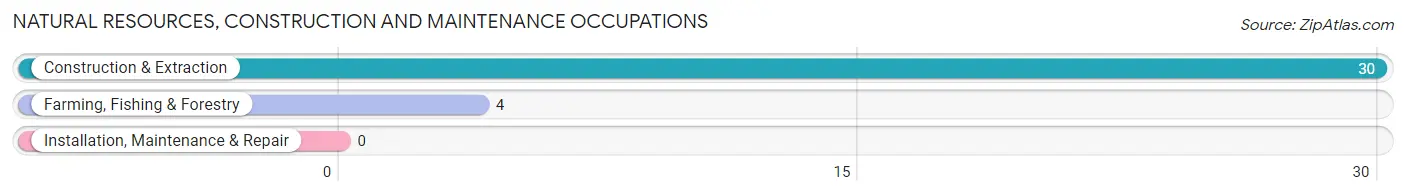
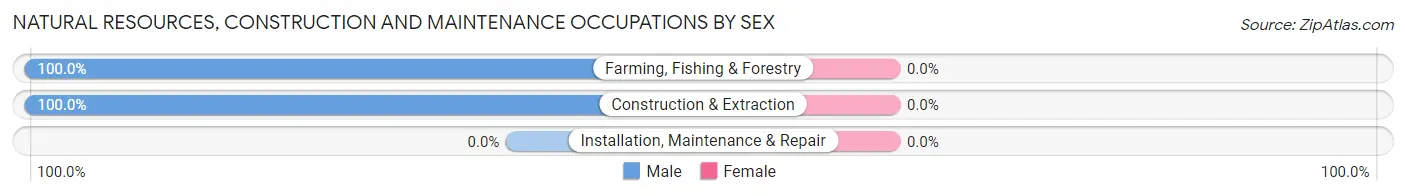
Natural Resources, Construction and Maintenance Occupations by Sex
| Occupation | Male | Female |
| Farming, Fishing & Forestry | 4 (100.0%) | 0 (0.0%) |
| Construction & Extraction | 30 (100.0%) | 0 (0.0%) |
| Installation, Maintenance & Repair | 0 (0.0%) | 0 (0.0%) |
| Total (Category) | 34 (100.0%) | 0 (0.0%) |
| Total (Overall) | 35 (42.7%) | 47 (57.3%) |
Production, Transportation and Moving Occupations
The most common Production, Transportation and Moving occupations in McLain are , and Transportation (4 | 4.9%).
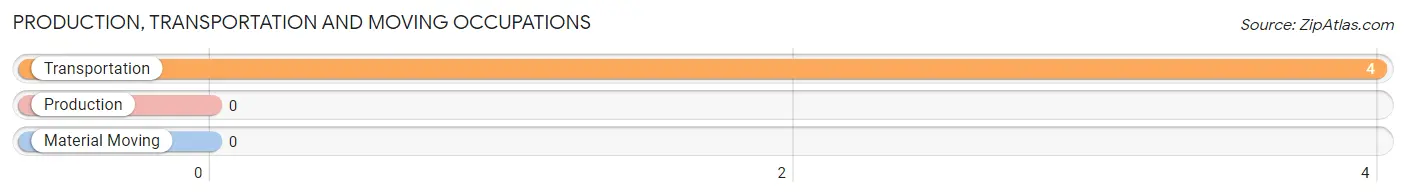
Production, Transportation and Moving Occupations by Sex
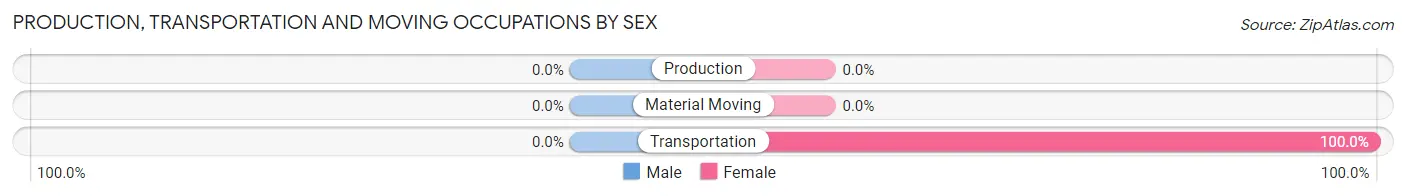
| Occupation | Male | Female |
| Production | 0 (0.0%) | 0 (0.0%) |
| Transportation | 0 (0.0%) | 4 (100.0%) |
| Material Moving | 0 (0.0%) | 0 (0.0%) |
| Total (Category) | 0 (0.0%) | 4 (100.0%) |
| Total (Overall) | 35 (42.7%) | 47 (57.3%) |
Employment Industries by Sex in McLain
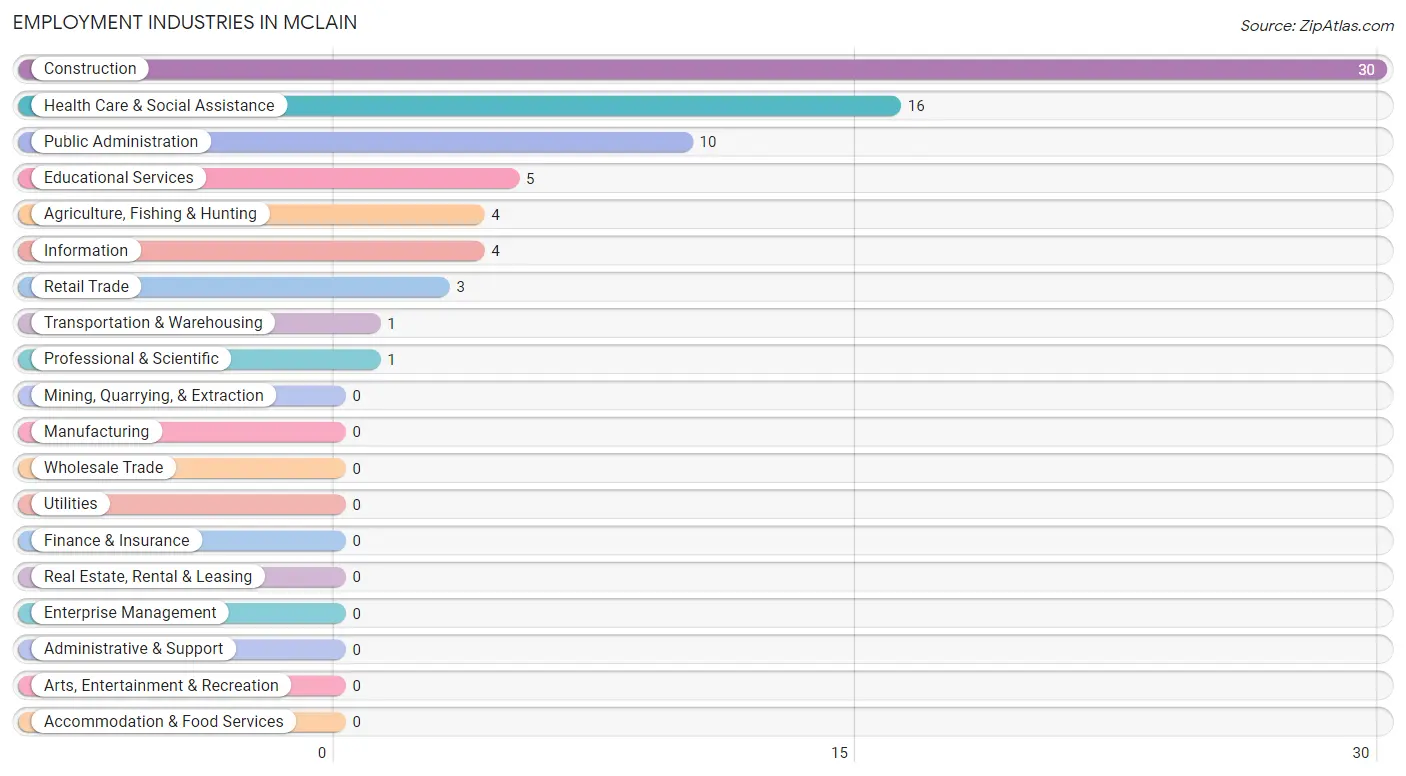
Employment Industries in McLain
The major employment industries in McLain include Construction (30 | 36.6%), Health Care & Social Assistance (16 | 19.5%), Public Administration (10 | 12.2%), Educational Services (5 | 6.1%), and Agriculture, Fishing & Hunting (4 | 4.9%).
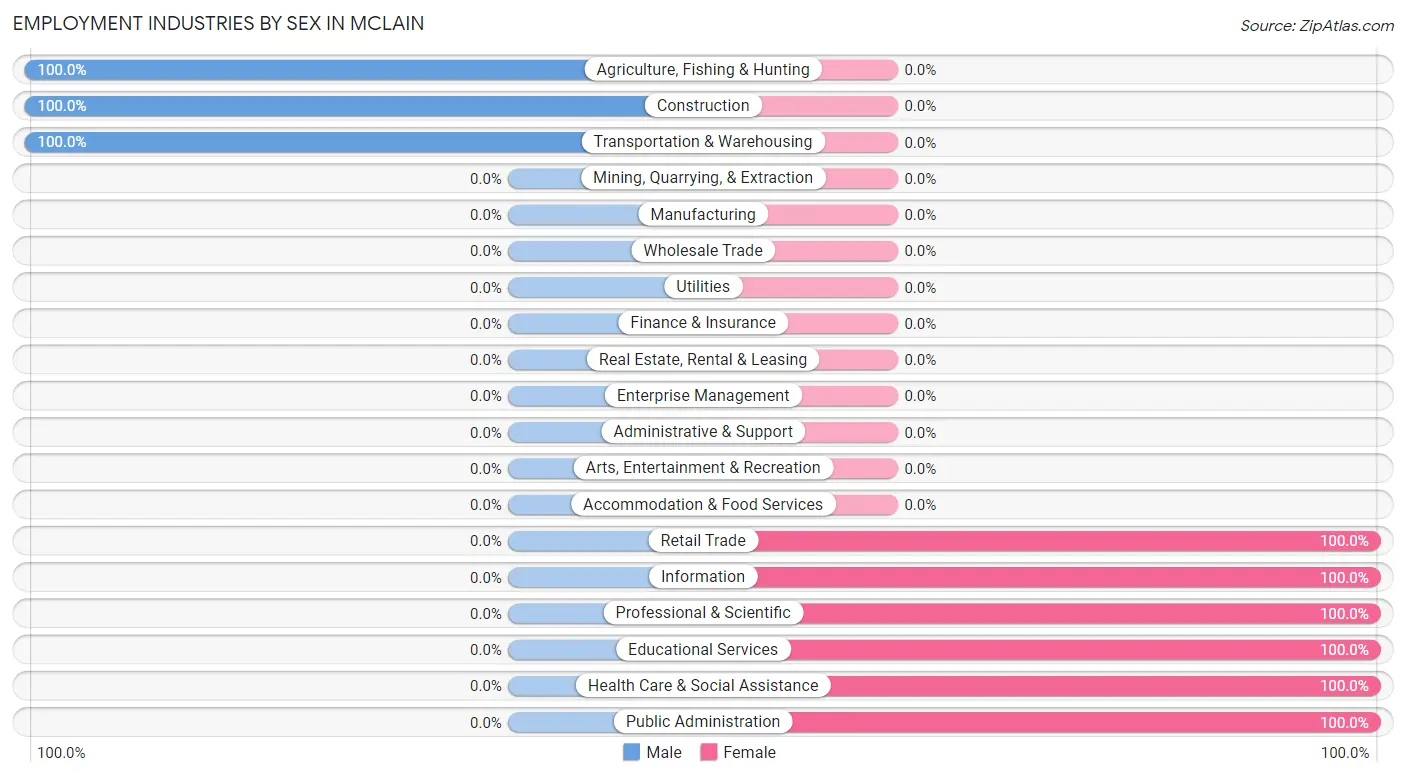
Employment Industries by Sex in McLain
The McLain industries that see more men than women are Agriculture, Fishing & Hunting (100.0%), Construction (100.0%), and Transportation & Warehousing (100.0%), whereas the industries that tend to have a higher number of women are Retail Trade (100.0%), Information (100.0%), and Professional & Scientific (100.0%).
| Industry | Male | Female |
| Agriculture, Fishing & Hunting | 4 (100.0%) | 0 (0.0%) |
| Mining, Quarrying, & Extraction | 0 (0.0%) | 0 (0.0%) |
| Construction | 30 (100.0%) | 0 (0.0%) |
| Manufacturing | 0 (0.0%) | 0 (0.0%) |
| Wholesale Trade | 0 (0.0%) | 0 (0.0%) |
| Retail Trade | 0 (0.0%) | 3 (100.0%) |
| Transportation & Warehousing | 1 (100.0%) | 0 (0.0%) |
| Utilities | 0 (0.0%) | 0 (0.0%) |
| Information | 0 (0.0%) | 4 (100.0%) |
| Finance & Insurance | 0 (0.0%) | 0 (0.0%) |
| Real Estate, Rental & Leasing | 0 (0.0%) | 0 (0.0%) |
| Professional & Scientific | 0 (0.0%) | 1 (100.0%) |
| Enterprise Management | 0 (0.0%) | 0 (0.0%) |
| Administrative & Support | 0 (0.0%) | 0 (0.0%) |
| Educational Services | 0 (0.0%) | 5 (100.0%) |
| Health Care & Social Assistance | 0 (0.0%) | 16 (100.0%) |
| Arts, Entertainment & Recreation | 0 (0.0%) | 0 (0.0%) |
| Accommodation & Food Services | 0 (0.0%) | 0 (0.0%) |
| Public Administration | 0 (0.0%) | 10 (100.0%) |
| Total | 35 (42.7%) | 47 (57.3%) |
Education in McLain
School Enrollment in McLain
The most common levels of schooling among the 163 students in McLain are elementary school (105 | 64.4%), high school (42 | 25.8%), and graduate / professional (8 | 4.9%).
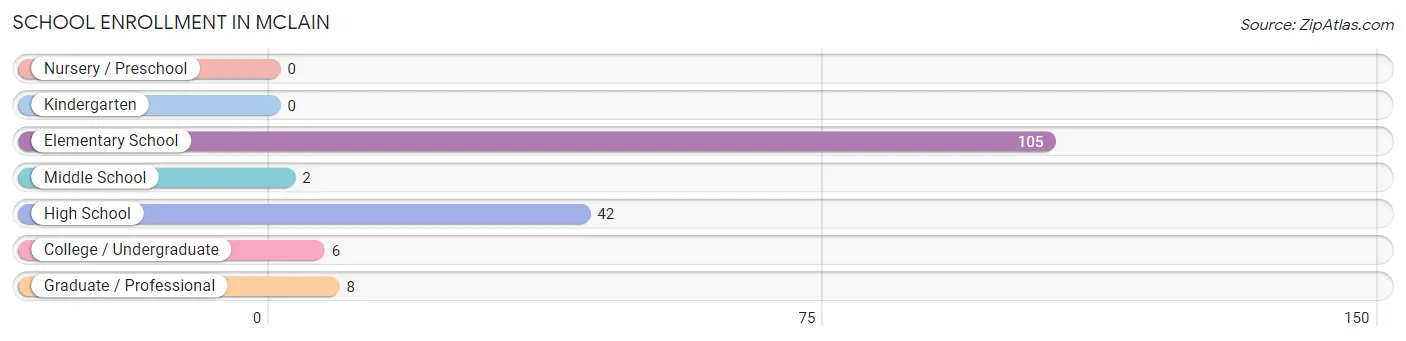
| School Level | # Students | % Students |
| Nursery / Preschool | 0 | 0.0% |
| Kindergarten | 0 | 0.0% |
| Elementary School | 105 | 64.4% |
| Middle School | 2 | 1.2% |
| High School | 42 | 25.8% |
| College / Undergraduate | 6 | 3.7% |
| Graduate / Professional | 8 | 4.9% |
| Total | 163 | 100.0% |
School Enrollment by Age by Funding Source in McLain
Out of a total of 163 students who are enrolled in schools in McLain, 23 (14.1%) attend a private institution, while the remaining 140 (85.9%) are enrolled in public schools. The age group of 20 to 24 year olds has the highest likelihood of being enrolled in private schools, with 6 (100.0% in the age bracket) enrolled. Conversely, the age group of 15 to 17 year olds has the lowest likelihood of being enrolled in a private school, with 35 (100.0% in the age bracket) attending a public institution.
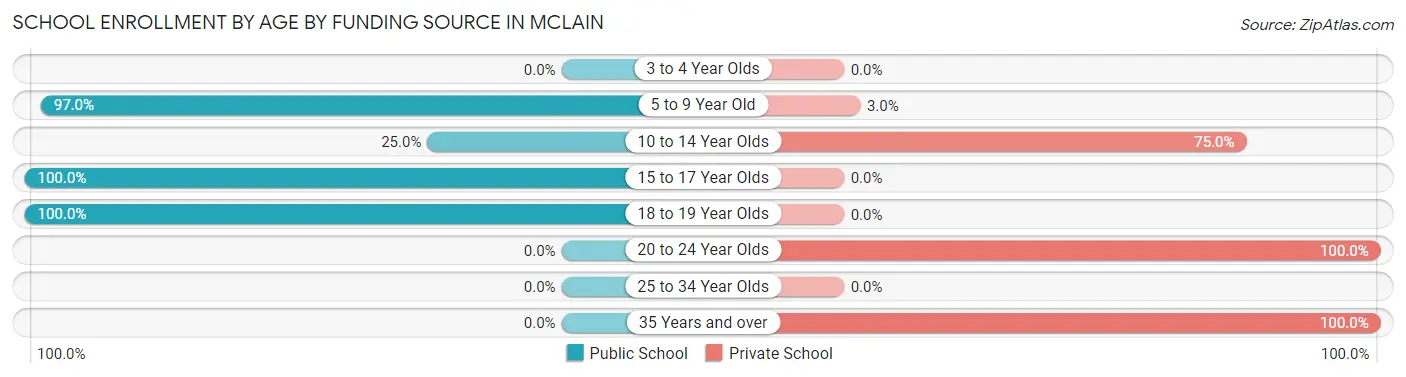
| Age Bracket | Public School | Private School |
| 3 to 4 Year Olds | 0 (0.0%) | 0 (0.0%) |
| 5 to 9 Year Old | 96 (97.0%) | 3 (3.0%) |
| 10 to 14 Year Olds | 2 (25.0%) | 6 (75.0%) |
| 15 to 17 Year Olds | 35 (100.0%) | 0 (0.0%) |
| 18 to 19 Year Olds | 7 (100.0%) | 0 (0.0%) |
| 20 to 24 Year Olds | 0 (0.0%) | 6 (100.0%) |
| 25 to 34 Year Olds | 0 (0.0%) | 0 (0.0%) |
| 35 Years and over | 0 (0.0%) | 8 (100.0%) |
| Total | 140 (85.9%) | 23 (14.1%) |
Educational Attainment by Field of Study in McLain
Business (9 | 31.0%), communications (8 | 27.6%), science & technology (6 | 20.7%), bio, nature & agricultural (3 | 10.3%), and psychology (3 | 10.3%) are the most common fields of study among 29 individuals in McLain who have obtained a bachelor's degree or higher.
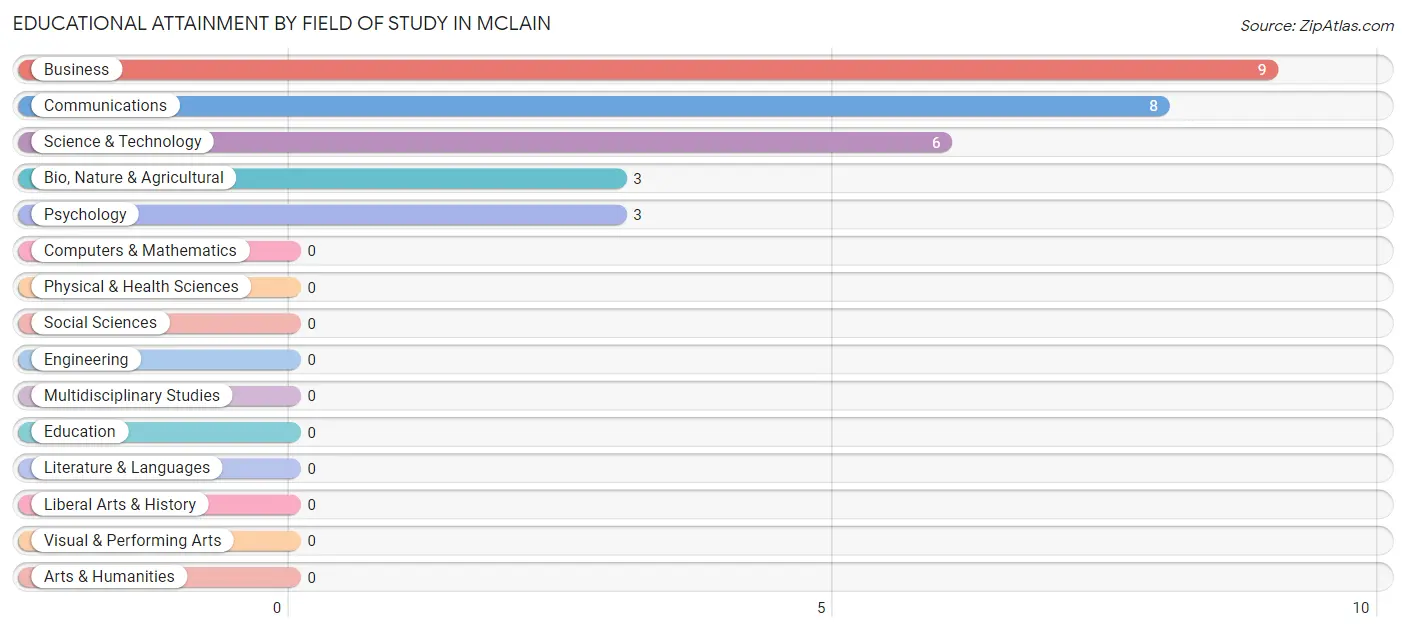
| Field of Study | # Graduates | % Graduates |
| Computers & Mathematics | 0 | 0.0% |
| Bio, Nature & Agricultural | 3 | 10.3% |
| Physical & Health Sciences | 0 | 0.0% |
| Psychology | 3 | 10.3% |
| Social Sciences | 0 | 0.0% |
| Engineering | 0 | 0.0% |
| Multidisciplinary Studies | 0 | 0.0% |
| Science & Technology | 6 | 20.7% |
| Business | 9 | 31.0% |
| Education | 0 | 0.0% |
| Literature & Languages | 0 | 0.0% |
| Liberal Arts & History | 0 | 0.0% |
| Visual & Performing Arts | 0 | 0.0% |
| Communications | 8 | 27.6% |
| Arts & Humanities | 0 | 0.0% |
| Total | 29 | 100.0% |
Transportation & Commute in McLain
Vehicle Availability by Sex in McLain
The most prevalent vehicle ownership categories in McLain are males with 3 vehicles (24, accounting for 68.6%) and females with 3 vehicles (26, making up 51.1%).
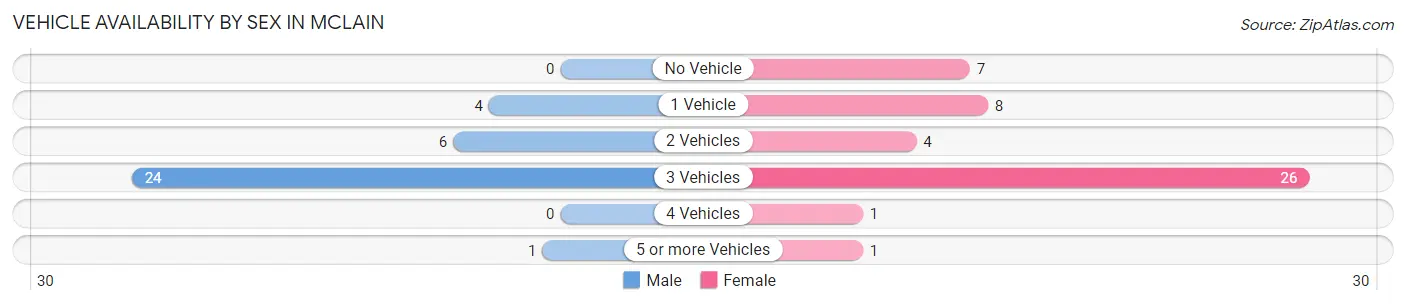
| Vehicles Available | Male | Female |
| No Vehicle | 0 (0.0%) | 7 (14.9%) |
| 1 Vehicle | 4 (11.4%) | 8 (17.0%) |
| 2 Vehicles | 6 (17.1%) | 4 (8.5%) |
| 3 Vehicles | 24 (68.6%) | 26 (55.3%) |
| 4 Vehicles | 0 (0.0%) | 1 (2.1%) |
| 5 or more Vehicles | 1 (2.9%) | 1 (2.1%) |
| Total | 35 (100.0%) | 47 (100.0%) |
Commute Time in McLain
The most frequently occuring commute durations in McLain are 60 to 89 minutes (13 commuters, 15.9%), 35 to 39 minutes (12 commuters, 14.6%), and less than 5 minutes (10 commuters, 12.2%).
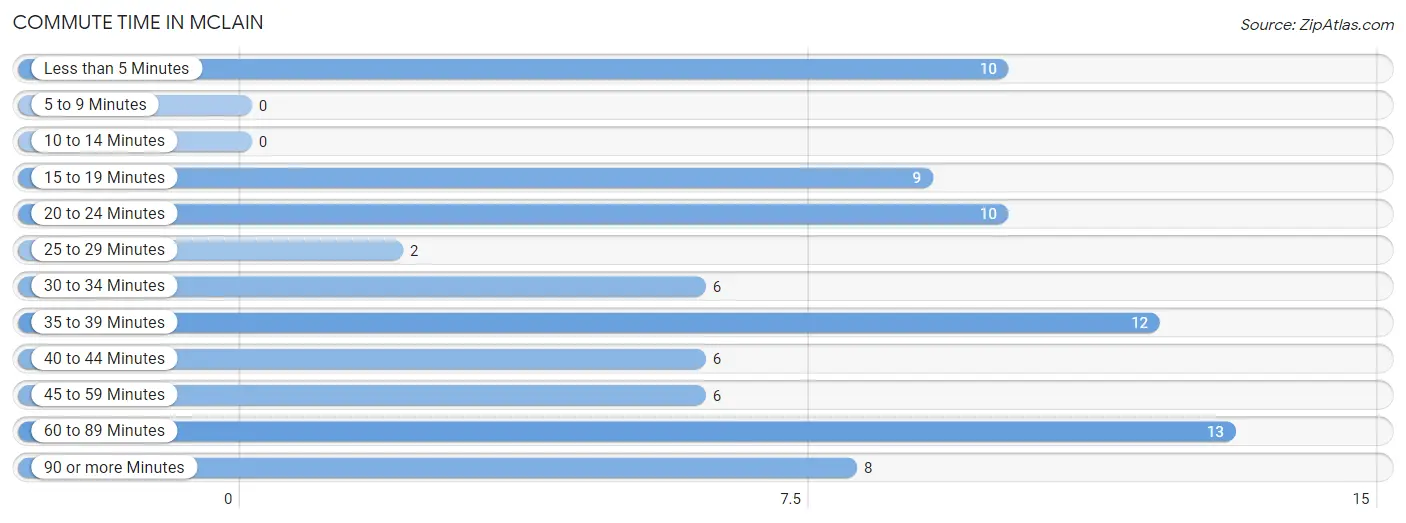
| Commute Time | # Commuters | % Commuters |
| Less than 5 Minutes | 10 | 12.2% |
| 5 to 9 Minutes | 0 | 0.0% |
| 10 to 14 Minutes | 0 | 0.0% |
| 15 to 19 Minutes | 9 | 11.0% |
| 20 to 24 Minutes | 10 | 12.2% |
| 25 to 29 Minutes | 2 | 2.4% |
| 30 to 34 Minutes | 6 | 7.3% |
| 35 to 39 Minutes | 12 | 14.6% |
| 40 to 44 Minutes | 6 | 7.3% |
| 45 to 59 Minutes | 6 | 7.3% |
| 60 to 89 Minutes | 13 | 15.9% |
| 90 or more Minutes | 8 | 9.8% |
Commute Time by Sex in McLain
The most common commute times in McLain are 60 to 89 minutes (9 commuters, 25.7%) for males and less than 5 minutes (10 commuters, 21.3%) for females.
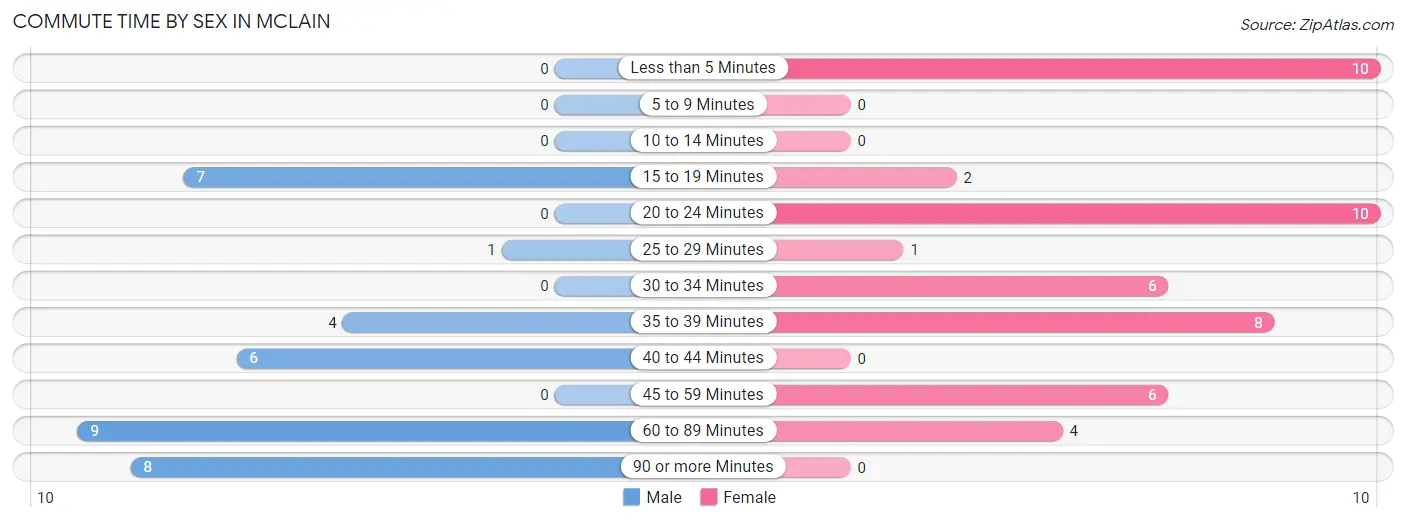
| Commute Time | Male | Female |
| Less than 5 Minutes | 0 (0.0%) | 10 (21.3%) |
| 5 to 9 Minutes | 0 (0.0%) | 0 (0.0%) |
| 10 to 14 Minutes | 0 (0.0%) | 0 (0.0%) |
| 15 to 19 Minutes | 7 (20.0%) | 2 (4.3%) |
| 20 to 24 Minutes | 0 (0.0%) | 10 (21.3%) |
| 25 to 29 Minutes | 1 (2.9%) | 1 (2.1%) |
| 30 to 34 Minutes | 0 (0.0%) | 6 (12.8%) |
| 35 to 39 Minutes | 4 (11.4%) | 8 (17.0%) |
| 40 to 44 Minutes | 6 (17.1%) | 0 (0.0%) |
| 45 to 59 Minutes | 0 (0.0%) | 6 (12.8%) |
| 60 to 89 Minutes | 9 (25.7%) | 4 (8.5%) |
| 90 or more Minutes | 8 (22.9%) | 0 (0.0%) |
Time of Departure to Work by Sex in McLain
The most frequent times of departure to work in McLain are 12:00 AM to 4:59 AM (21, 60.0%) for males and 7:00 AM to 7:29 AM (18, 38.3%) for females.
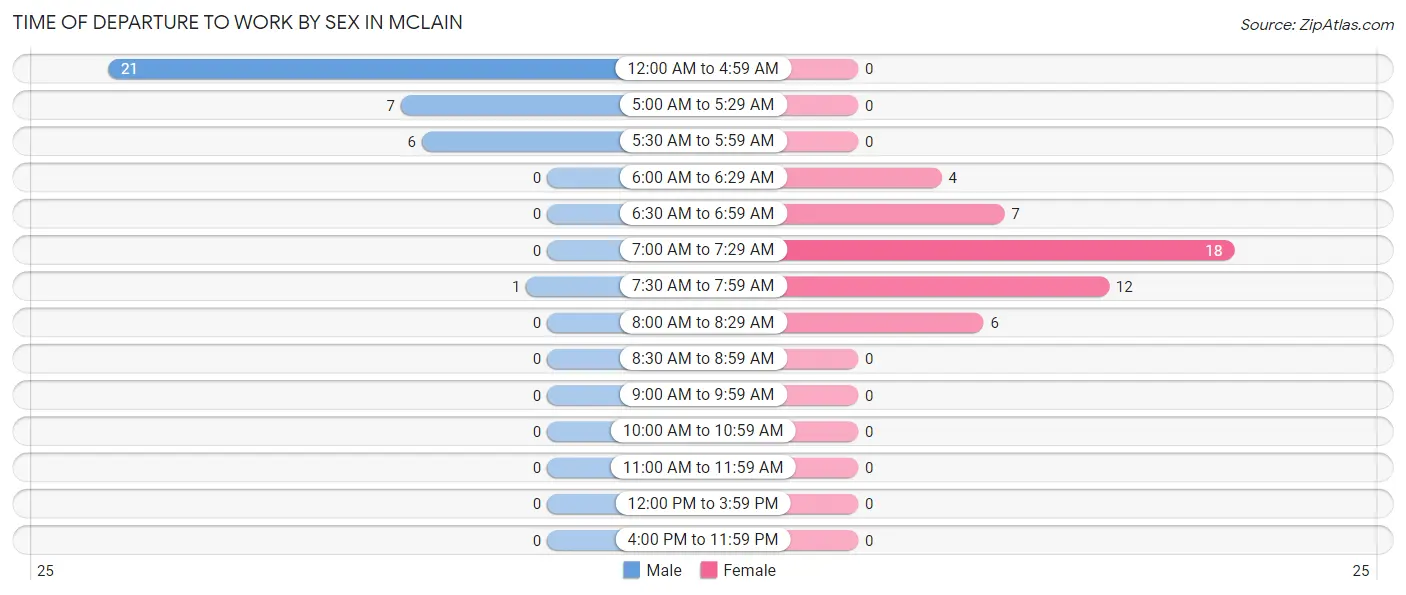
| Time of Departure | Male | Female |
| 12:00 AM to 4:59 AM | 21 (60.0%) | 0 (0.0%) |
| 5:00 AM to 5:29 AM | 7 (20.0%) | 0 (0.0%) |
| 5:30 AM to 5:59 AM | 6 (17.1%) | 0 (0.0%) |
| 6:00 AM to 6:29 AM | 0 (0.0%) | 4 (8.5%) |
| 6:30 AM to 6:59 AM | 0 (0.0%) | 7 (14.9%) |
| 7:00 AM to 7:29 AM | 0 (0.0%) | 18 (38.3%) |
| 7:30 AM to 7:59 AM | 1 (2.9%) | 12 (25.5%) |
| 8:00 AM to 8:29 AM | 0 (0.0%) | 6 (12.8%) |
| 8:30 AM to 8:59 AM | 0 (0.0%) | 0 (0.0%) |
| 9:00 AM to 9:59 AM | 0 (0.0%) | 0 (0.0%) |
| 10:00 AM to 10:59 AM | 0 (0.0%) | 0 (0.0%) |
| 11:00 AM to 11:59 AM | 0 (0.0%) | 0 (0.0%) |
| 12:00 PM to 3:59 PM | 0 (0.0%) | 0 (0.0%) |
| 4:00 PM to 11:59 PM | 0 (0.0%) | 0 (0.0%) |
| Total | 35 (100.0%) | 47 (100.0%) |
Housing Occupancy in McLain
Occupancy by Ownership in McLain
Of the total 120 dwellings in McLain, owner-occupied units account for 113 (94.2%), while renter-occupied units make up 7 (5.8%).
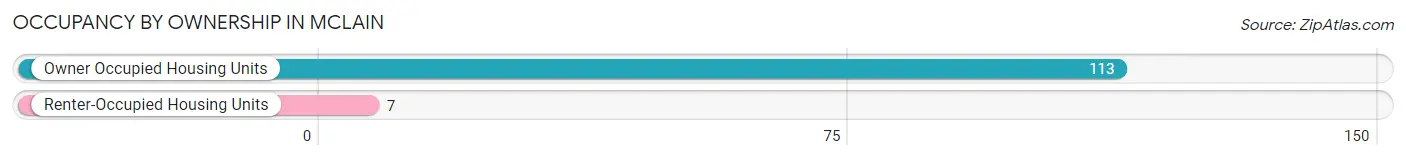
| Occupancy | # Housing Units | % Housing Units |
| Owner Occupied Housing Units | 113 | 94.2% |
| Renter-Occupied Housing Units | 7 | 5.8% |
| Total Occupied Housing Units | 120 | 100.0% |
Occupancy by Household Size in McLain
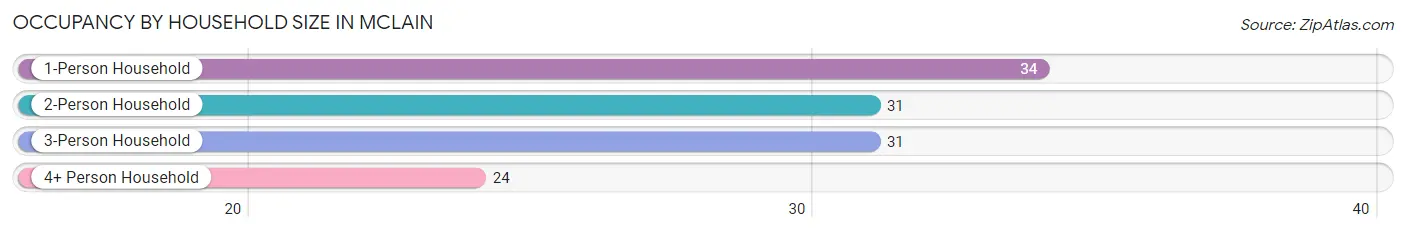
| Household Size | # Housing Units | % Housing Units |
| 1-Person Household | 34 | 28.3% |
| 2-Person Household | 31 | 25.8% |
| 3-Person Household | 31 | 25.8% |
| 4+ Person Household | 24 | 20.0% |
| Total Housing Units | 120 | 100.0% |
Occupancy by Ownership by Household Size in McLain
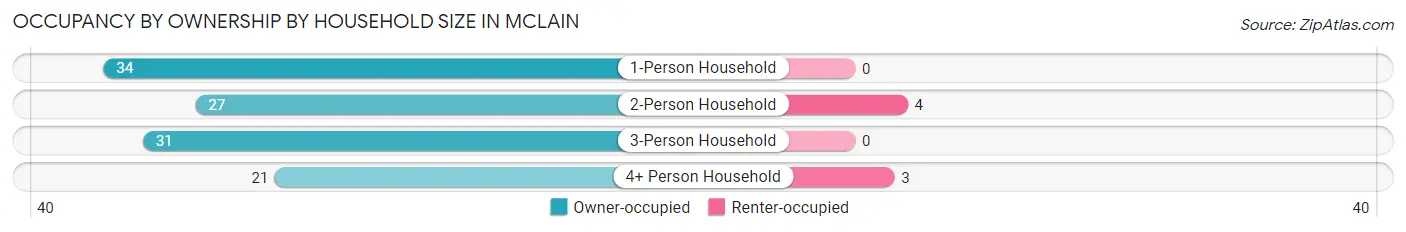
| Household Size | Owner-occupied | Renter-occupied |
| 1-Person Household | 34 (100.0%) | 0 (0.0%) |
| 2-Person Household | 27 (87.1%) | 4 (12.9%) |
| 3-Person Household | 31 (100.0%) | 0 (0.0%) |
| 4+ Person Household | 21 (87.5%) | 3 (12.5%) |
| Total Housing Units | 113 (94.2%) | 7 (5.8%) |
Occupancy by Educational Attainment in McLain
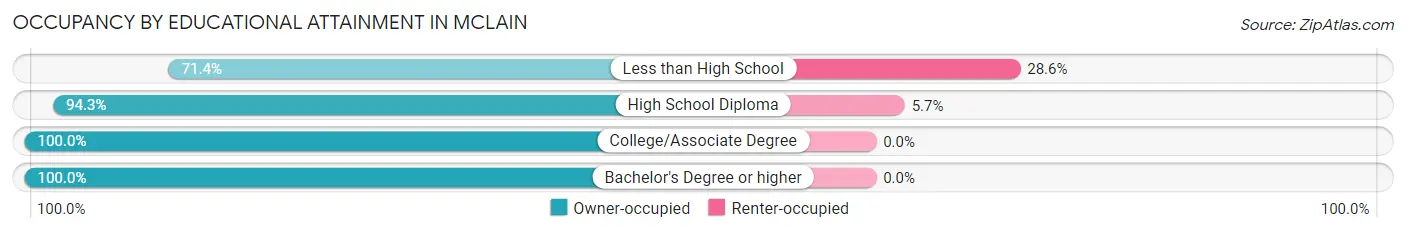
| Household Size | Owner-occupied | Renter-occupied |
| Less than High School | 10 (71.4%) | 4 (28.6%) |
| High School Diploma | 50 (94.3%) | 3 (5.7%) |
| College/Associate Degree | 50 (100.0%) | 0 (0.0%) |
| Bachelor's Degree or higher | 3 (100.0%) | 0 (0.0%) |
Occupancy by Age of Householder in McLain
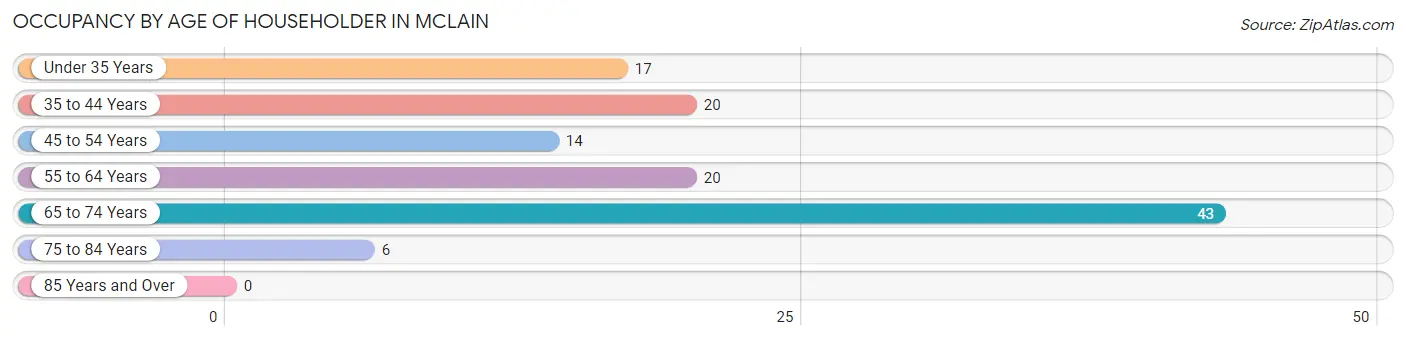
| Age Bracket | # Households | % Households |
| Under 35 Years | 17 | 14.2% |
| 35 to 44 Years | 20 | 16.7% |
| 45 to 54 Years | 14 | 11.7% |
| 55 to 64 Years | 20 | 16.7% |
| 65 to 74 Years | 43 | 35.8% |
| 75 to 84 Years | 6 | 5.0% |
| 85 Years and Over | 0 | 0.0% |
| Total | 120 | 100.0% |
Housing Finances in McLain
Median Income by Occupancy in McLain
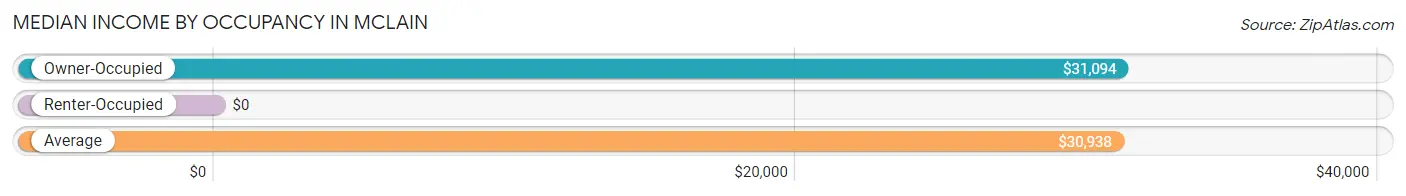
| Occupancy Type | # Households | Median Income |
| Owner-Occupied | 113 (94.2%) | $31,094 |
| Renter-Occupied | 7 (5.8%) | $0 |
| Average | 120 (100.0%) | $30,938 |
Occupancy by Householder Income Bracket in McLain
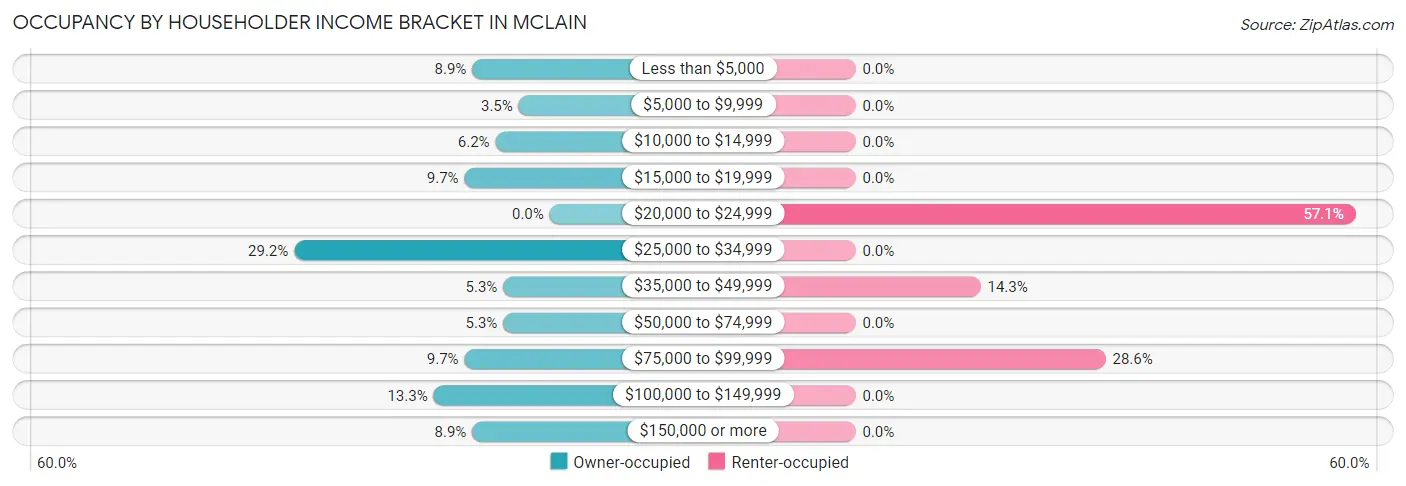
| Income Bracket | Owner-occupied | Renter-occupied |
| Less than $5,000 | 10 (8.8%) | 0 (0.0%) |
| $5,000 to $9,999 | 4 (3.5%) | 0 (0.0%) |
| $10,000 to $14,999 | 7 (6.2%) | 0 (0.0%) |
| $15,000 to $19,999 | 11 (9.7%) | 0 (0.0%) |
| $20,000 to $24,999 | 0 (0.0%) | 4 (57.1%) |
| $25,000 to $34,999 | 33 (29.2%) | 0 (0.0%) |
| $35,000 to $49,999 | 6 (5.3%) | 1 (14.3%) |
| $50,000 to $74,999 | 6 (5.3%) | 0 (0.0%) |
| $75,000 to $99,999 | 11 (9.7%) | 2 (28.6%) |
| $100,000 to $149,999 | 15 (13.3%) | 0 (0.0%) |
| $150,000 or more | 10 (8.8%) | 0 (0.0%) |
| Total | 113 (100.0%) | 7 (100.0%) |
Monthly Housing Cost Tiers in McLain
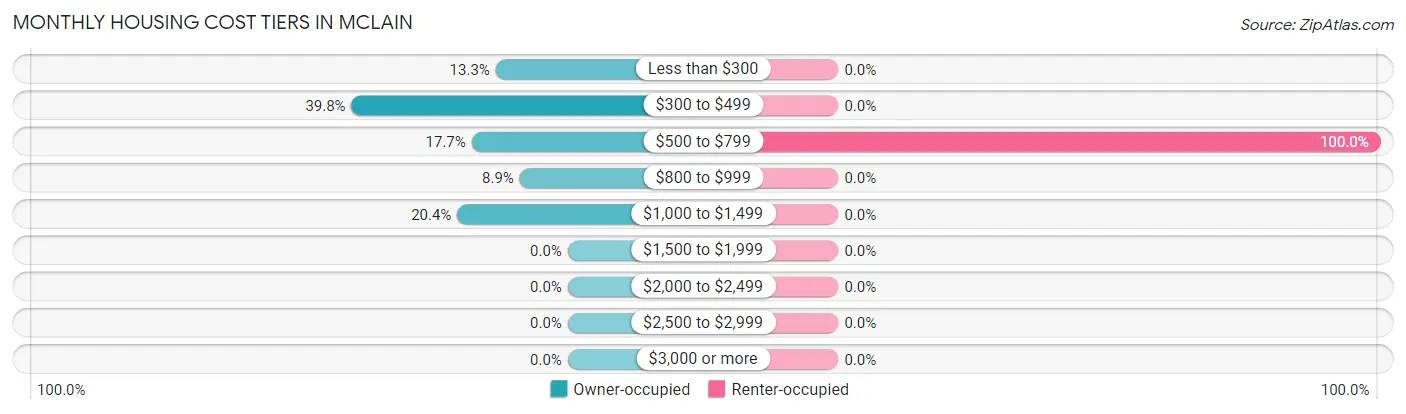
| Monthly Cost | Owner-occupied | Renter-occupied |
| Less than $300 | 15 (13.3%) | 0 (0.0%) |
| $300 to $499 | 45 (39.8%) | 0 (0.0%) |
| $500 to $799 | 20 (17.7%) | 7 (100.0%) |
| $800 to $999 | 10 (8.8%) | 0 (0.0%) |
| $1,000 to $1,499 | 23 (20.3%) | 0 (0.0%) |
| $1,500 to $1,999 | 0 (0.0%) | 0 (0.0%) |
| $2,000 to $2,499 | 0 (0.0%) | 0 (0.0%) |
| $2,500 to $2,999 | 0 (0.0%) | 0 (0.0%) |
| $3,000 or more | 0 (0.0%) | 0 (0.0%) |
| Total | 113 (100.0%) | 7 (100.0%) |
Physical Housing Characteristics in McLain
Housing Structures in McLain
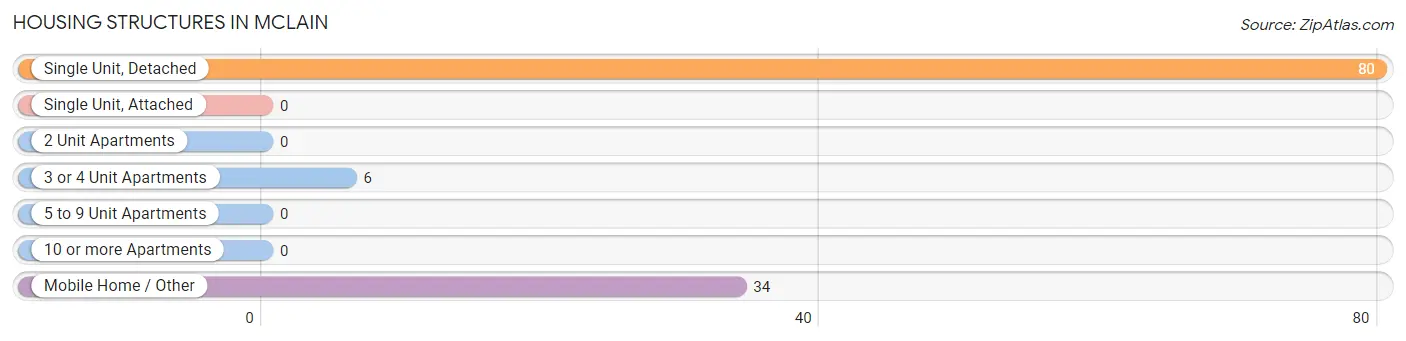
| Structure Type | # Housing Units | % Housing Units |
| Single Unit, Detached | 80 | 66.7% |
| Single Unit, Attached | 0 | 0.0% |
| 2 Unit Apartments | 0 | 0.0% |
| 3 or 4 Unit Apartments | 6 | 5.0% |
| 5 to 9 Unit Apartments | 0 | 0.0% |
| 10 or more Apartments | 0 | 0.0% |
| Mobile Home / Other | 34 | 28.3% |
| Total | 120 | 100.0% |
Housing Structures by Occupancy in McLain
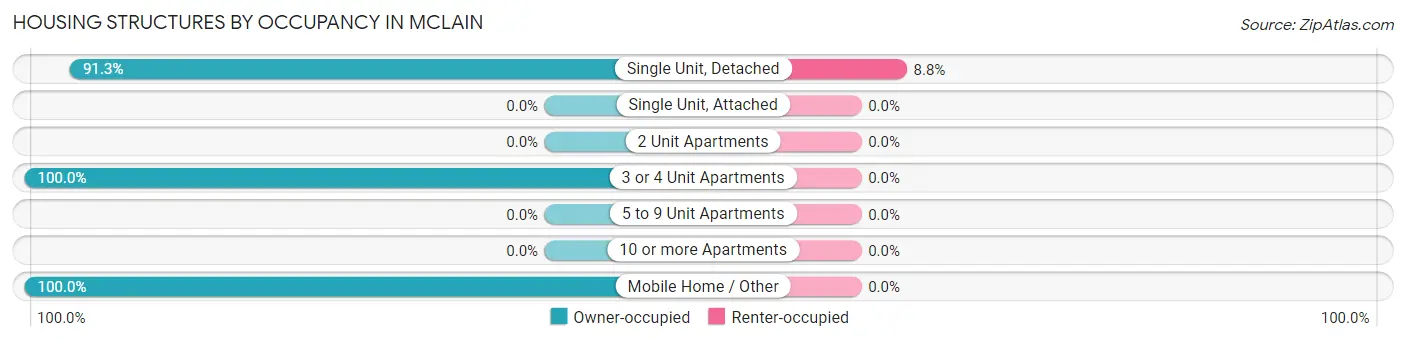
| Structure Type | Owner-occupied | Renter-occupied |
| Single Unit, Detached | 73 (91.2%) | 7 (8.7%) |
| Single Unit, Attached | 0 (0.0%) | 0 (0.0%) |
| 2 Unit Apartments | 0 (0.0%) | 0 (0.0%) |
| 3 or 4 Unit Apartments | 6 (100.0%) | 0 (0.0%) |
| 5 to 9 Unit Apartments | 0 (0.0%) | 0 (0.0%) |
| 10 or more Apartments | 0 (0.0%) | 0 (0.0%) |
| Mobile Home / Other | 34 (100.0%) | 0 (0.0%) |
| Total | 113 (94.2%) | 7 (5.8%) |
Housing Structures by Number of Rooms in McLain
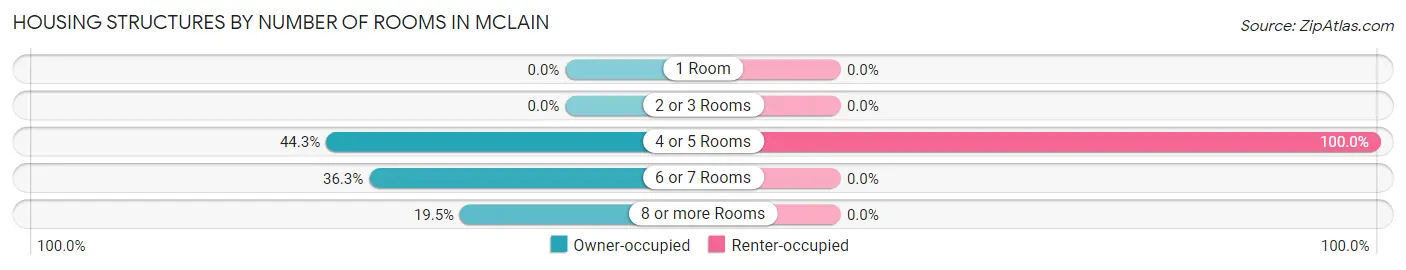
| Number of Rooms | Owner-occupied | Renter-occupied |
| 1 Room | 0 (0.0%) | 0 (0.0%) |
| 2 or 3 Rooms | 0 (0.0%) | 0 (0.0%) |
| 4 or 5 Rooms | 50 (44.3%) | 7 (100.0%) |
| 6 or 7 Rooms | 41 (36.3%) | 0 (0.0%) |
| 8 or more Rooms | 22 (19.5%) | 0 (0.0%) |
| Total | 113 (100.0%) | 7 (100.0%) |
Housing Structure by Heating Type in McLain
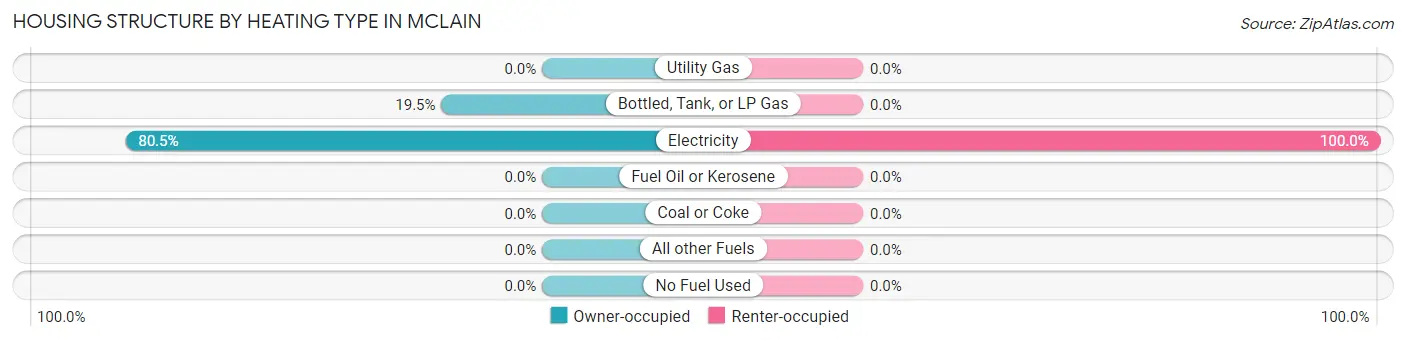
| Heating Type | Owner-occupied | Renter-occupied |
| Utility Gas | 0 (0.0%) | 0 (0.0%) |
| Bottled, Tank, or LP Gas | 22 (19.5%) | 0 (0.0%) |
| Electricity | 91 (80.5%) | 7 (100.0%) |
| Fuel Oil or Kerosene | 0 (0.0%) | 0 (0.0%) |
| Coal or Coke | 0 (0.0%) | 0 (0.0%) |
| All other Fuels | 0 (0.0%) | 0 (0.0%) |
| No Fuel Used | 0 (0.0%) | 0 (0.0%) |
| Total | 113 (100.0%) | 7 (100.0%) |
Household Vehicle Usage in McLain
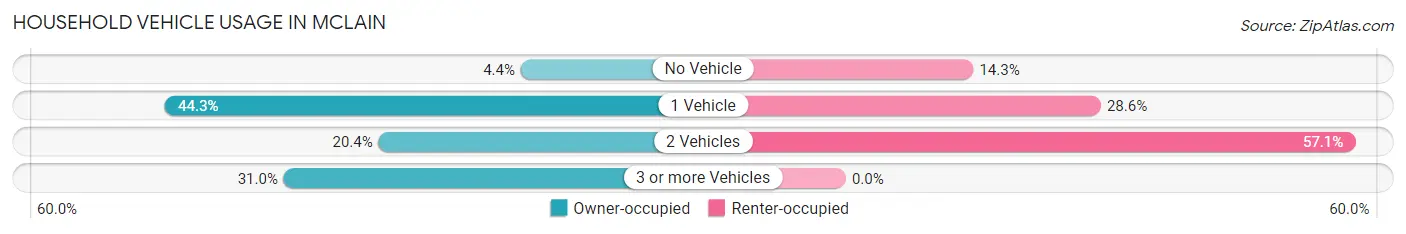
| Vehicles per Household | Owner-occupied | Renter-occupied |
| No Vehicle | 5 (4.4%) | 1 (14.3%) |
| 1 Vehicle | 50 (44.3%) | 2 (28.6%) |
| 2 Vehicles | 23 (20.3%) | 4 (57.1%) |
| 3 or more Vehicles | 35 (31.0%) | 0 (0.0%) |
| Total | 113 (100.0%) | 7 (100.0%) |
Real Estate & Mortgages in McLain
Real Estate and Mortgage Overview in McLain
| Characteristic | Without Mortgage | With Mortgage |
| Housing Units | 79 | 34 |
| Median Property Value | $57,500 | $93,000 |
| Median Household Income | $27,212 | $10 |
| Monthly Housing Costs | $362 | $0 |
| Real Estate Taxes | $708 | $14 |
Property Value by Mortgage Status in McLain
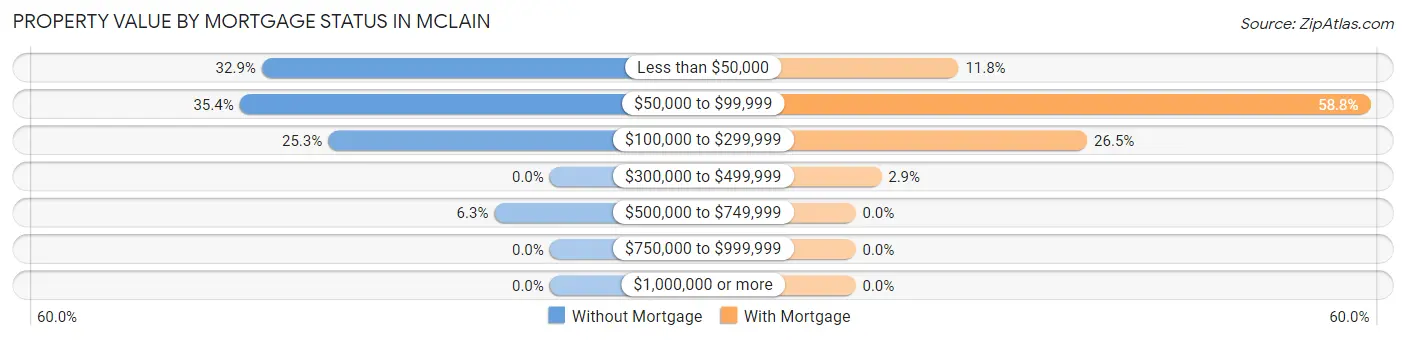
| Property Value | Without Mortgage | With Mortgage |
| Less than $50,000 | 26 (32.9%) | 4 (11.8%) |
| $50,000 to $99,999 | 28 (35.4%) | 20 (58.8%) |
| $100,000 to $299,999 | 20 (25.3%) | 9 (26.5%) |
| $300,000 to $499,999 | 0 (0.0%) | 1 (2.9%) |
| $500,000 to $749,999 | 5 (6.3%) | 0 (0.0%) |
| $750,000 to $999,999 | 0 (0.0%) | 0 (0.0%) |
| $1,000,000 or more | 0 (0.0%) | 0 (0.0%) |
| Total | 79 (100.0%) | 34 (100.0%) |
Household Income by Mortgage Status in McLain
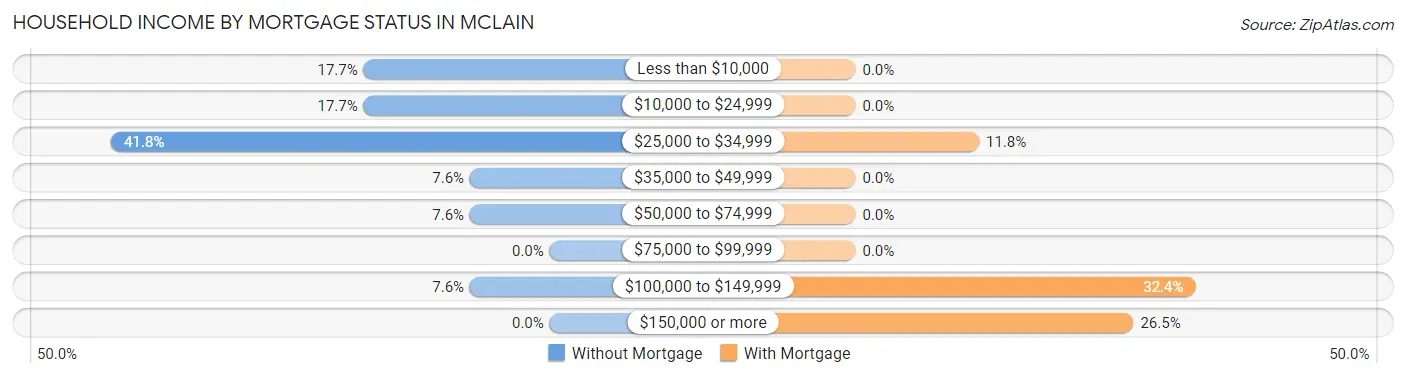
| Household Income | Without Mortgage | With Mortgage |
| Less than $10,000 | 14 (17.7%) | 0 (0.0%) |
| $10,000 to $24,999 | 14 (17.7%) | 0 (0.0%) |
| $25,000 to $34,999 | 33 (41.8%) | 4 (11.8%) |
| $35,000 to $49,999 | 6 (7.6%) | 0 (0.0%) |
| $50,000 to $74,999 | 6 (7.6%) | 0 (0.0%) |
| $75,000 to $99,999 | 0 (0.0%) | 0 (0.0%) |
| $100,000 to $149,999 | 6 (7.6%) | 11 (32.4%) |
| $150,000 or more | 0 (0.0%) | 9 (26.5%) |
| Total | 79 (100.0%) | 34 (100.0%) |
Property Value to Household Income Ratio in McLain
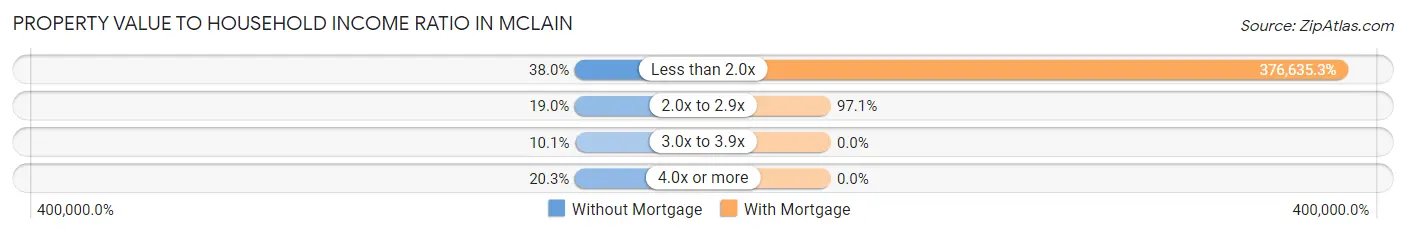
| Value-to-Income Ratio | Without Mortgage | With Mortgage |
| Less than 2.0x | 30 (38.0%) | 128,056 (376,635.3%) |
| 2.0x to 2.9x | 15 (19.0%) | 33 (97.1%) |
| 3.0x to 3.9x | 8 (10.1%) | 0 (0.0%) |
| 4.0x or more | 16 (20.3%) | 0 (0.0%) |
| Total | 79 (100.0%) | 34 (100.0%) |
Real Estate Taxes by Mortgage Status in McLain
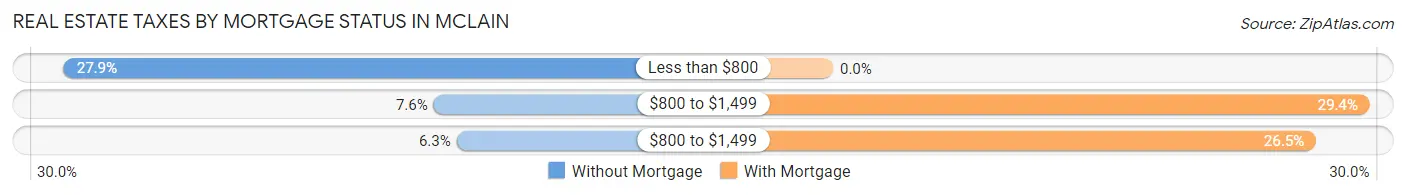
| Property Taxes | Without Mortgage | With Mortgage |
| Less than $800 | 22 (27.9%) | 0 (0.0%) |
| $800 to $1,499 | 6 (7.6%) | 10 (29.4%) |
| $800 to $1,499 | 5 (6.3%) | 9 (26.5%) |
| Total | 79 (100.0%) | 34 (100.0%) |
Health & Disability in McLain
Health Insurance Coverage by Age in McLain
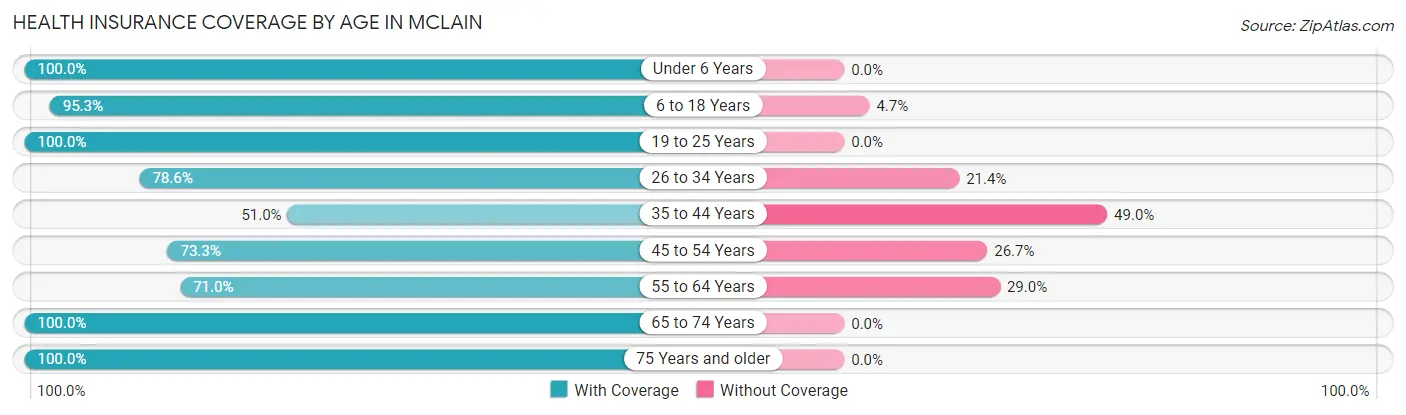
| Age Bracket | With Coverage | Without Coverage |
| Under 6 Years | 21 (100.0%) | 0 (0.0%) |
| 6 to 18 Years | 142 (95.3%) | 7 (4.7%) |
| 19 to 25 Years | 6 (100.0%) | 0 (0.0%) |
| 26 to 34 Years | 22 (78.6%) | 6 (21.4%) |
| 35 to 44 Years | 26 (51.0%) | 25 (49.0%) |
| 45 to 54 Years | 22 (73.3%) | 8 (26.7%) |
| 55 to 64 Years | 22 (71.0%) | 9 (29.0%) |
| 65 to 74 Years | 45 (100.0%) | 0 (0.0%) |
| 75 Years and older | 6 (100.0%) | 0 (0.0%) |
| Total | 312 (85.0%) | 55 (15.0%) |
Health Insurance Coverage by Citizenship Status in McLain
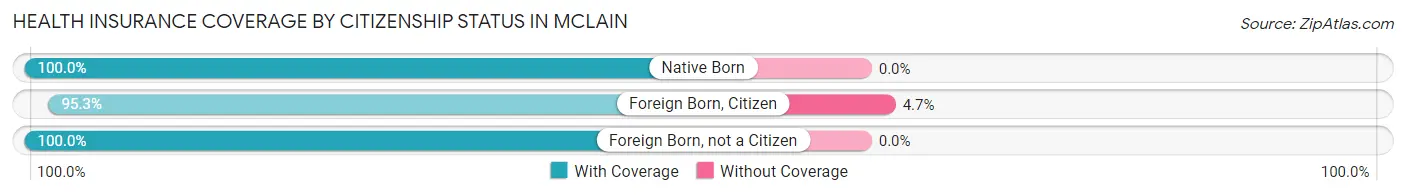
| Citizenship Status | With Coverage | Without Coverage |
| Native Born | 21 (100.0%) | 0 (0.0%) |
| Foreign Born, Citizen | 142 (95.3%) | 7 (4.7%) |
| Foreign Born, not a Citizen | 6 (100.0%) | 0 (0.0%) |
Health Insurance Coverage by Household Income in McLain
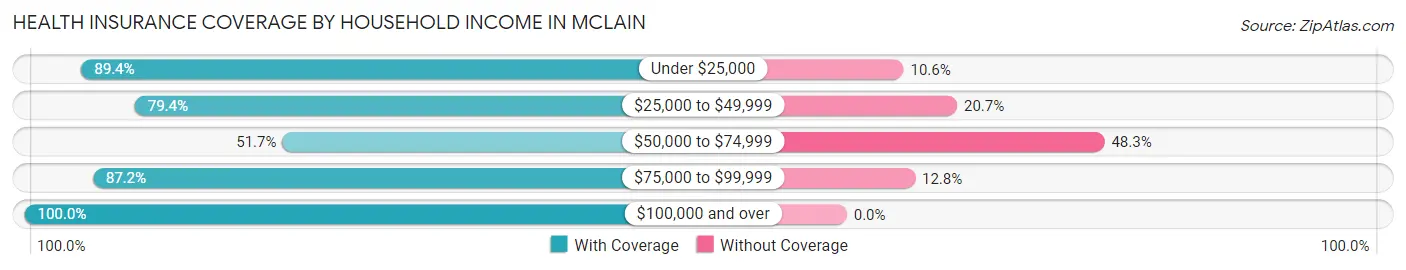
| Household Income | With Coverage | Without Coverage |
| Under $25,000 | 42 (89.4%) | 5 (10.6%) |
| $25,000 to $49,999 | 73 (79.3%) | 19 (20.6%) |
| $50,000 to $74,999 | 15 (51.7%) | 14 (48.3%) |
| $75,000 to $99,999 | 116 (87.2%) | 17 (12.8%) |
| $100,000 and over | 66 (100.0%) | 0 (0.0%) |
Public vs Private Health Insurance Coverage by Age in McLain
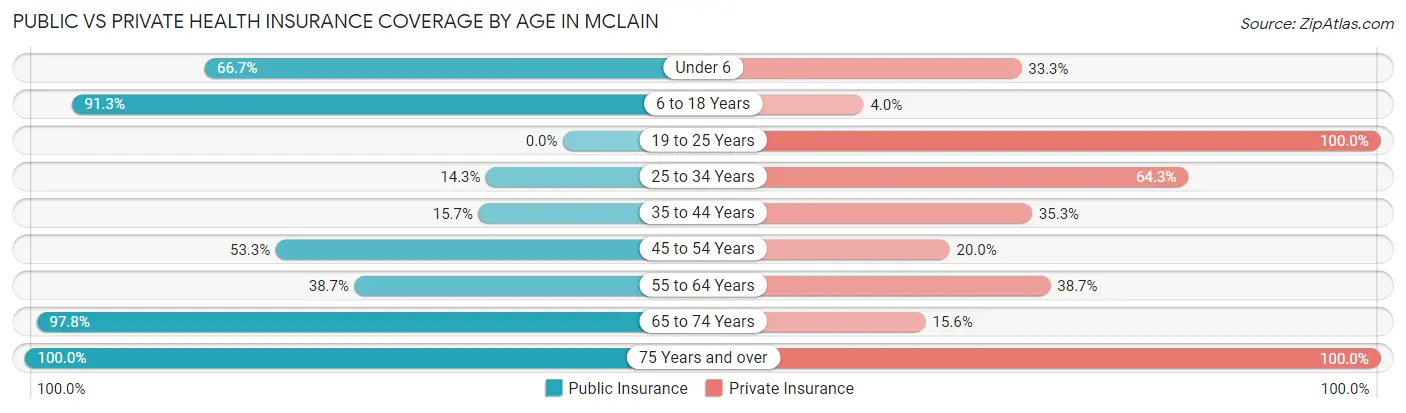
| Age Bracket | Public Insurance | Private Insurance |
| Under 6 | 14 (66.7%) | 7 (33.3%) |
| 6 to 18 Years | 136 (91.3%) | 6 (4.0%) |
| 19 to 25 Years | 0 (0.0%) | 6 (100.0%) |
| 25 to 34 Years | 4 (14.3%) | 18 (64.3%) |
| 35 to 44 Years | 8 (15.7%) | 18 (35.3%) |
| 45 to 54 Years | 16 (53.3%) | 6 (20.0%) |
| 55 to 64 Years | 12 (38.7%) | 12 (38.7%) |
| 65 to 74 Years | 44 (97.8%) | 7 (15.6%) |
| 75 Years and over | 6 (100.0%) | 6 (100.0%) |
| Total | 240 (65.4%) | 86 (23.4%) |
Disability Status by Sex by Age in McLain
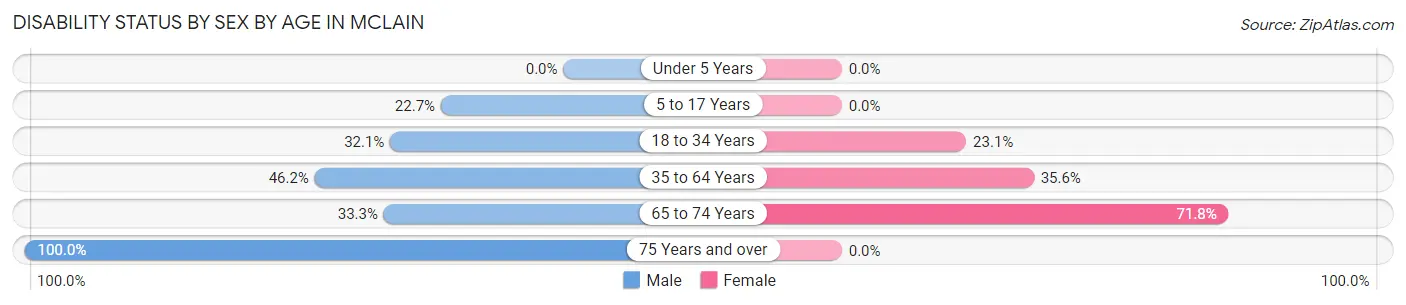
| Age Bracket | Male | Female |
| Under 5 Years | 0 (0.0%) | 0 (0.0%) |
| 5 to 17 Years | 5 (22.7%) | 0 (0.0%) |
| 18 to 34 Years | 9 (32.1%) | 3 (23.1%) |
| 35 to 64 Years | 18 (46.2%) | 26 (35.6%) |
| 65 to 74 Years | 2 (33.3%) | 28 (71.8%) |
| 75 Years and over | 1 (100.0%) | 0 (0.0%) |
Disability Class by Sex by Age in McLain
Disability Class: Hearing Difficulty
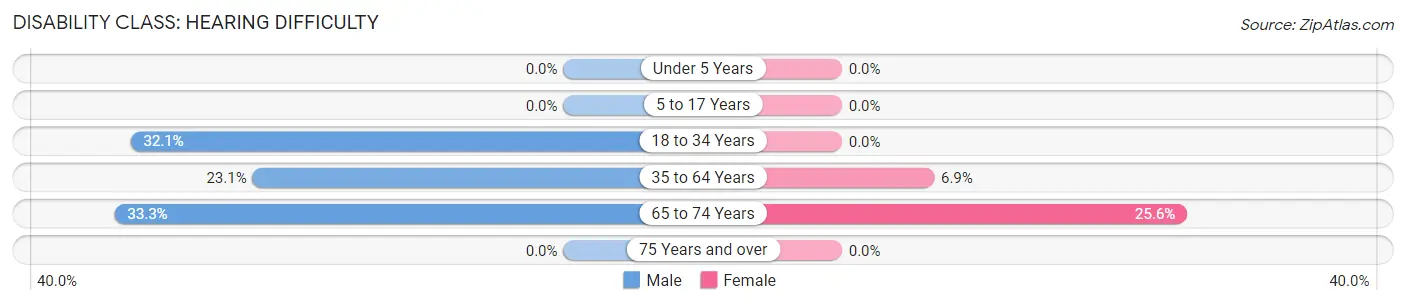
| Age Bracket | Male | Female |
| Under 5 Years | 0 (0.0%) | 0 (0.0%) |
| 5 to 17 Years | 0 (0.0%) | 0 (0.0%) |
| 18 to 34 Years | 9 (32.1%) | 0 (0.0%) |
| 35 to 64 Years | 9 (23.1%) | 5 (6.9%) |
| 65 to 74 Years | 2 (33.3%) | 10 (25.6%) |
| 75 Years and over | 0 (0.0%) | 0 (0.0%) |
Disability Class: Vision Difficulty
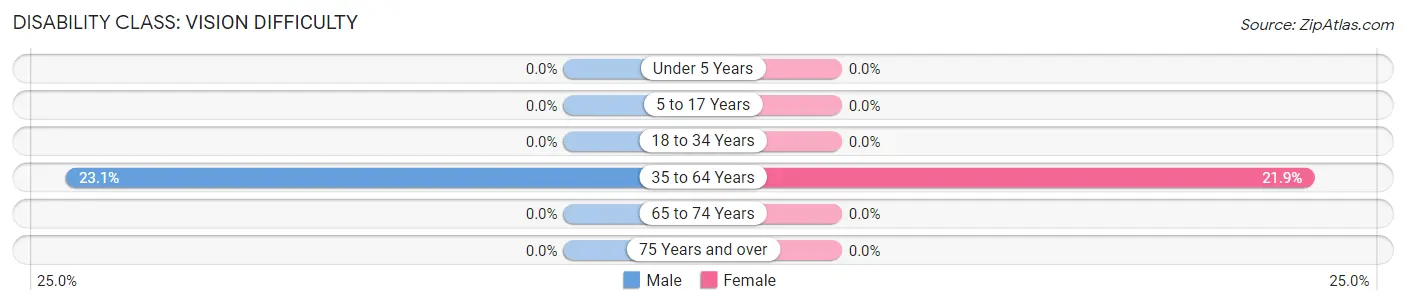
| Age Bracket | Male | Female |
| Under 5 Years | 0 (0.0%) | 0 (0.0%) |
| 5 to 17 Years | 0 (0.0%) | 0 (0.0%) |
| 18 to 34 Years | 0 (0.0%) | 0 (0.0%) |
| 35 to 64 Years | 9 (23.1%) | 16 (21.9%) |
| 65 to 74 Years | 0 (0.0%) | 0 (0.0%) |
| 75 Years and over | 0 (0.0%) | 0 (0.0%) |
Disability Class: Cognitive Difficulty
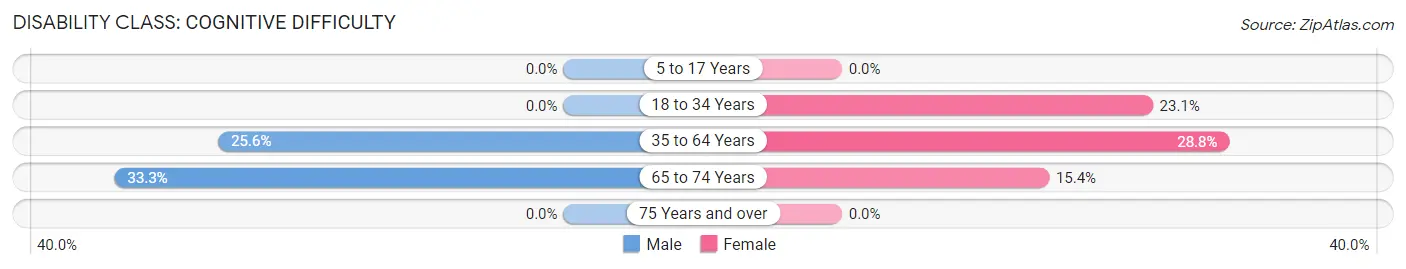
| Age Bracket | Male | Female |
| 5 to 17 Years | 0 (0.0%) | 0 (0.0%) |
| 18 to 34 Years | 0 (0.0%) | 3 (23.1%) |
| 35 to 64 Years | 10 (25.6%) | 21 (28.8%) |
| 65 to 74 Years | 2 (33.3%) | 6 (15.4%) |
| 75 Years and over | 0 (0.0%) | 0 (0.0%) |
Disability Class: Ambulatory Difficulty
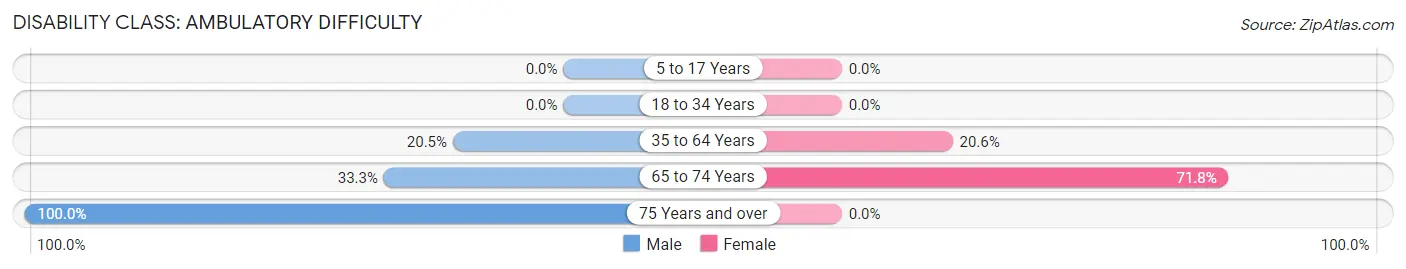
| Age Bracket | Male | Female |
| 5 to 17 Years | 0 (0.0%) | 0 (0.0%) |
| 18 to 34 Years | 0 (0.0%) | 0 (0.0%) |
| 35 to 64 Years | 8 (20.5%) | 15 (20.5%) |
| 65 to 74 Years | 2 (33.3%) | 28 (71.8%) |
| 75 Years and over | 1 (100.0%) | 0 (0.0%) |
Disability Class: Self-Care Difficulty
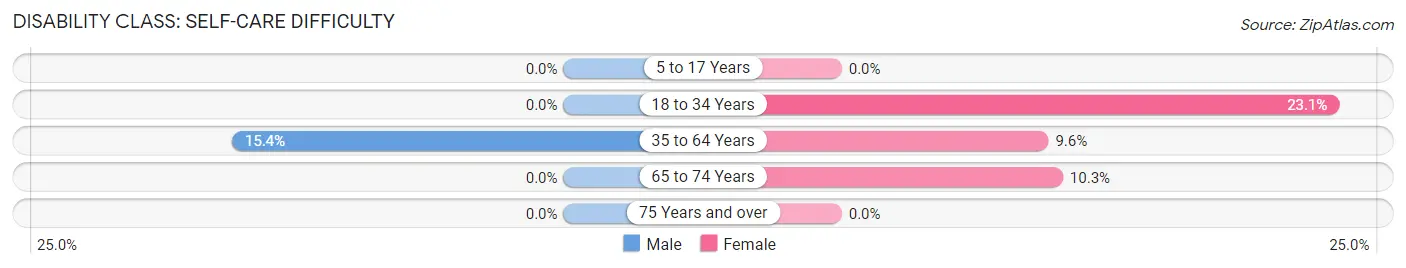
| Age Bracket | Male | Female |
| 5 to 17 Years | 0 (0.0%) | 0 (0.0%) |
| 18 to 34 Years | 0 (0.0%) | 3 (23.1%) |
| 35 to 64 Years | 6 (15.4%) | 7 (9.6%) |
| 65 to 74 Years | 0 (0.0%) | 4 (10.3%) |
| 75 Years and over | 0 (0.0%) | 0 (0.0%) |
Technology Access in McLain
Computing Device Access in McLain
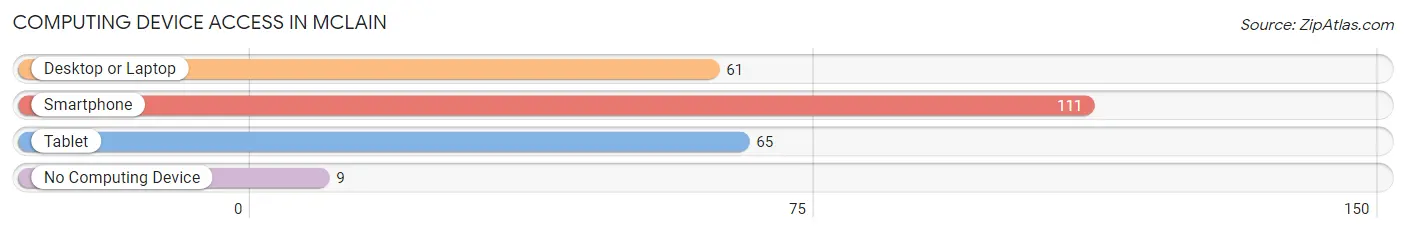
| Device Type | # Households | % Households |
| Desktop or Laptop | 61 | 50.8% |
| Smartphone | 111 | 92.5% |
| Tablet | 65 | 54.2% |
| No Computing Device | 9 | 7.5% |
| Total | 120 | 100.0% |
Internet Access in McLain
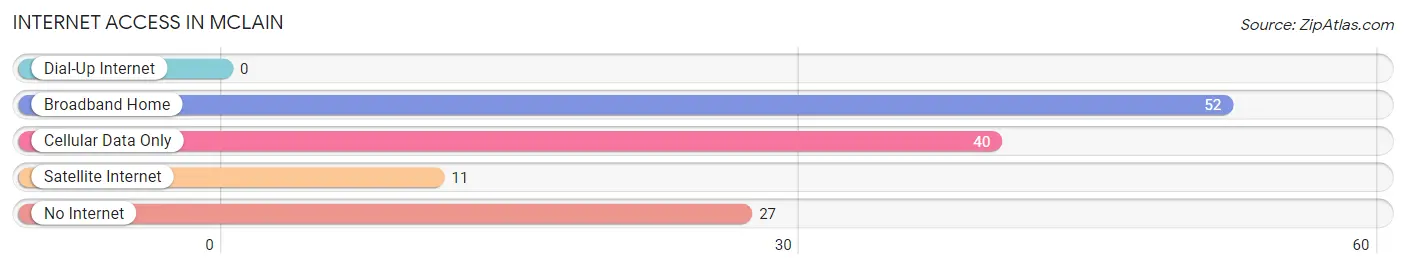
| Internet Type | # Households | % Households |
| Dial-Up Internet | 0 | 0.0% |
| Broadband Home | 52 | 43.3% |
| Cellular Data Only | 40 | 33.3% |
| Satellite Internet | 11 | 9.2% |
| No Internet | 27 | 22.5% |
| Total | 120 | 100.0% |
McLain Summary
Mclain, Mississippi is a small town located in the southeastern corner of the state, in Perry County. It is situated on the banks of the Leaf River, and is home to a population of just over 1,000 people. The town was founded in 1837, and has a rich history of agriculture, industry, and culture.
Geography
Mclain is located in the southeastern corner of Perry County, Mississippi. It is situated on the banks of the Leaf River, and is surrounded by rolling hills and forests. The town is located approximately 30 miles from Hattiesburg, and is accessible by US Highway 98. The climate in Mclain is humid subtropical, with hot summers and mild winters.
Economy
Mclain’s economy is largely based on agriculture. The town is home to several farms, which produce a variety of crops, including corn, soybeans, cotton, and hay. The town also has a small manufacturing sector, which produces furniture, textiles, and other goods. In addition, Mclain is home to several small businesses, including restaurants, retail stores, and service providers.
Demographics
As of the 2010 census, Mclain had a population of 1,072 people. The racial makeup of the town was 79.3% White, 19.2% African American, 0.3% Native American, 0.2% Asian, and 0.9% from other races. The median household income was $25,972, and the median family income was $31,250. The per capita income was $14,945.
History
Mclain was founded in 1837, and was named after the Mclain family, who were among the first settlers in the area. The town was originally a farming community, and the Mclain family owned a large plantation. During the Civil War, Mclain was the site of several skirmishes between Union and Confederate forces. After the war, the town began to grow, and several businesses were established. In the early 20th century, the town was home to several sawmills, and the lumber industry was a major contributor to the local economy. In the 1950s, the town began to decline, and many of the businesses closed. In recent years, the town has seen a resurgence, and is now home to several small businesses and farms.
Mclain is a small town with a rich history and culture. It is home to a diverse population, and has a strong agricultural and manufacturing base. The town is situated on the banks of the Leaf River, and is surrounded by rolling hills and forests. Mclain is a great place to live, work, and raise a family.
Common Questions
What is Per Capita Income in McLain?
Per Capita income in McLain is $16,087.
What is the Median Household income in McLain?
Median Household Income in McLain is $30,938.
What is Income or Wage Gap in McLain?
Income or Wage Gap in McLain is 56.1%.
Women in McLain earn 43.9 cents for every dollar earned by a man.
What is Inequality or Gini Index in McLain?
Inequality or Gini Index in McLain is 0.48.
What is the Total Population of McLain?
Total Population of McLain is 367.
What is the Total Male Population of McLain?
Total Male Population of McLain is 112.
What is the Total Female Population of McLain?
Total Female Population of McLain is 255.
What is the Ratio of Males per 100 Females in McLain?
There are 43.92 Males per 100 Females in McLain.
What is the Ratio of Females per 100 Males in McLain?
There are 227.68 Females per 100 Males in McLain.
What is the Median Population Age in McLain?
Median Population Age in McLain is 27.6 Years.
What is the Average Family Size in McLain
Average Family Size in McLain is 3.9 People.
What is the Average Household Size in McLain
Average Household Size in McLain is 3.1 People.
How Large is the Labor Force in McLain?
There are 83 People in the Labor Forcein in McLain.
What is the Percentage of People in the Labor Force in McLain?
38.6% of People are in the Labor Force in McLain.
What is the Unemployment Rate in McLain?
Unemployment Rate in McLain is 1.2%.