Zip Codes with the Highest Percentage of Population Employed in Health Diagnosing & Treating in Mississippi
RELATED REPORTS & OPTIONS
Health Diagnosing & Treating
Mississippi
Compare Zip Codes
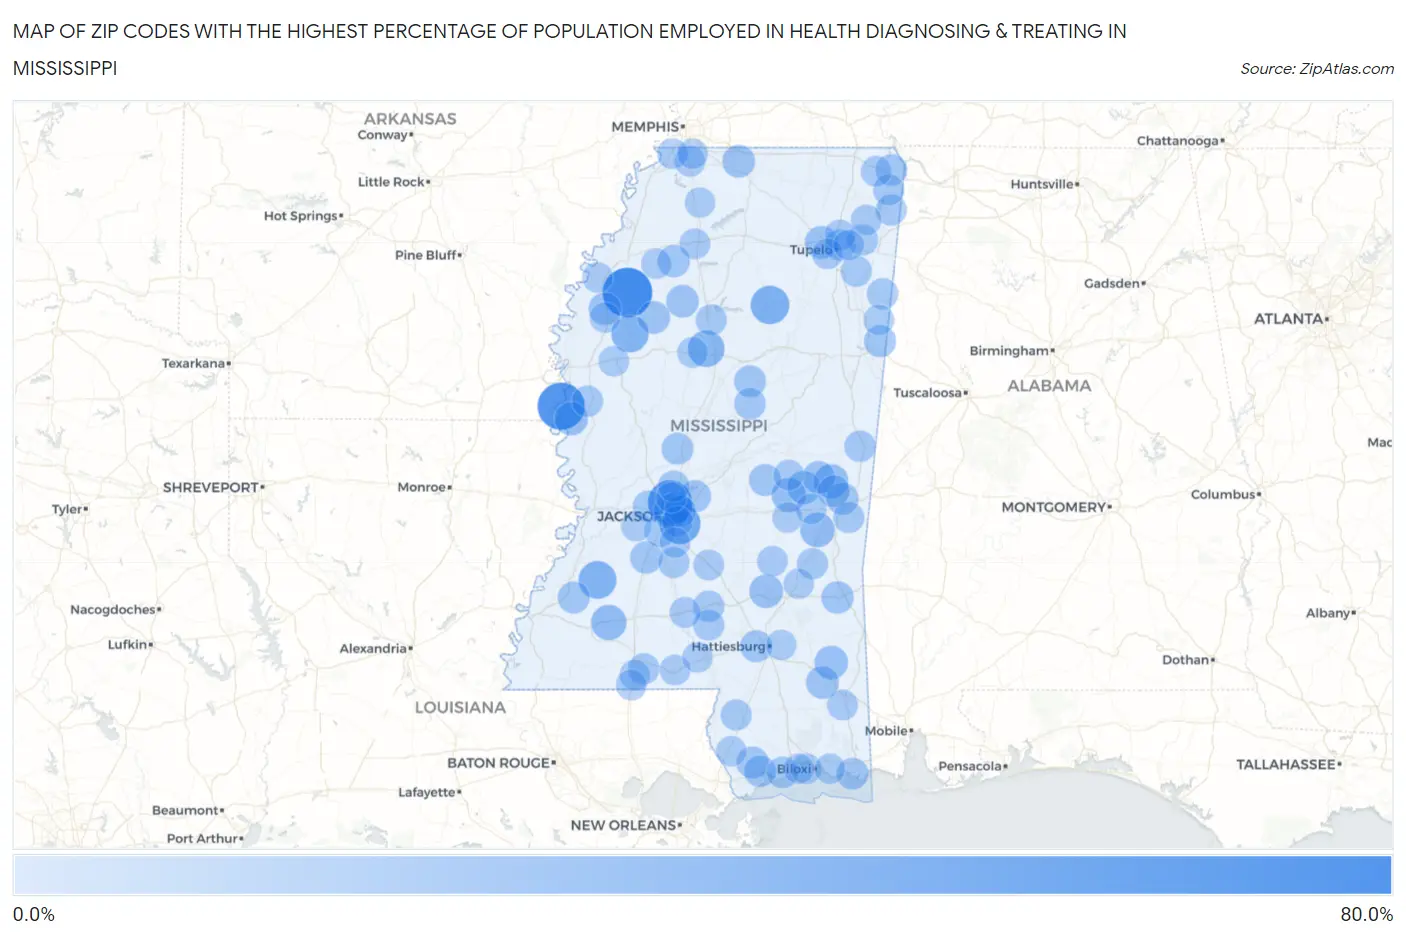
Map of Zip Codes with the Highest Percentage of Population Employed in Health Diagnosing & Treating in Mississippi
0.0%
80.0%
Zip Codes with the Highest Percentage of Population Employed in Health Diagnosing & Treating in Mississippi
| Zip Code | % Employed | vs State | vs National | |
| 1. | 38738 | 61.4% | 7.8%(+53.5)#1 | 6.2%(+55.1)#38 |
| 2. | 38731 | 55.0% | 7.8%(+47.2)#2 | 6.2%(+48.8)#52 |
| 3. | 39174 | 46.9% | 7.8%(+39.1)#3 | 6.2%(+40.7)#80 |
| 4. | 39193 | 37.2% | 7.8%(+29.4)#4 | 6.2%(+31.0)#132 |
| 5. | 38839 | 31.2% | 7.8%(+23.4)#5 | 6.2%(+25.0)#201 |
| 6. | 39144 | 29.1% | 7.8%(+21.3)#6 | 6.2%(+22.8)#238 |
| 7. | 38736 | 27.6% | 7.8%(+19.8)#7 | 6.2%(+21.3)#263 |
| 8. | 38943 | 25.7% | 7.8%(+17.8)#8 | 6.2%(+19.4)#301 |
| 9. | 39647 | 22.2% | 7.8%(+14.3)#9 | 6.2%(+15.9)#425 |
| 10. | 39216 | 21.6% | 7.8%(+13.8)#10 | 6.2%(+15.4)#453 |
| 11. | 39330 | 20.3% | 7.8%(+12.4)#11 | 6.2%(+14.0)#537 |
| 12. | 39320 | 19.7% | 7.8%(+11.8)#12 | 6.2%(+13.4)#575 |
| 13. | 39327 | 19.1% | 7.8%(+11.2)#13 | 6.2%(+12.8)#607 |
| 14. | 39480 | 17.9% | 7.8%(+10.0)#14 | 6.2%(+11.6)#721 |
| 15. | 39461 | 17.6% | 7.8%(+9.75)#15 | 6.2%(+11.3)#752 |
| 16. | 38744 | 17.4% | 7.8%(+9.53)#16 | 6.2%(+11.1)#776 |
| 17. | 39337 | 16.8% | 7.8%(+8.92)#17 | 6.2%(+10.5)#850 |
| 18. | 38826 | 16.2% | 7.8%(+8.35)#18 | 6.2%(+9.94)#930 |
| 19. | 39456 | 15.9% | 7.8%(+8.05)#19 | 6.2%(+9.64)#974 |
| 20. | 38661 | 15.5% | 7.8%(+7.62)#20 | 6.2%(+9.21)#1,049 |
| 21. | 39325 | 15.4% | 7.8%(+7.57)#21 | 6.2%(+9.16)#1,056 |
| 22. | 38944 | 15.4% | 7.8%(+7.55)#22 | 6.2%(+9.14)#1,063 |
| 23. | 38920 | 15.2% | 7.8%(+7.40)#23 | 6.2%(+8.99)#1,098 |
| 24. | 38759 | 15.0% | 7.8%(+7.13)#24 | 6.2%(+8.72)#1,162 |
| 25. | 39059 | 14.5% | 7.8%(+6.71)#25 | 6.2%(+8.29)#1,251 |
| 26. | 39367 | 14.5% | 7.8%(+6.67)#26 | 6.2%(+8.26)#1,261 |
| 27. | 38622 | 14.3% | 7.8%(+6.45)#27 | 6.2%(+8.04)#1,320 |
| 28. | 39047 | 13.9% | 7.8%(+6.07)#28 | 6.2%(+7.66)#1,435 |
| 29. | 39342 | 13.8% | 7.8%(+5.97)#29 | 6.2%(+7.56)#1,468 |
| 30. | 39211 | 13.8% | 7.8%(+5.93)#30 | 6.2%(+7.52)#1,490 |
| 31. | 39402 | 13.6% | 7.8%(+5.75)#31 | 6.2%(+7.34)#1,546 |
| 32. | 39556 | 13.5% | 7.8%(+5.68)#32 | 6.2%(+7.27)#1,566 |
| 33. | 39305 | 13.5% | 7.8%(+5.65)#33 | 6.2%(+7.24)#1,574 |
| 34. | 39359 | 13.5% | 7.8%(+5.65)#34 | 6.2%(+7.24)#1,577 |
| 35. | 39069 | 13.5% | 7.8%(+5.62)#35 | 6.2%(+7.21)#1,591 |
| 36. | 39766 | 13.3% | 7.8%(+5.43)#36 | 6.2%(+7.02)#1,652 |
| 37. | 39232 | 13.1% | 7.8%(+5.31)#37 | 6.2%(+6.90)#1,695 |
| 38. | 39525 | 13.0% | 7.8%(+5.17)#38 | 6.2%(+6.76)#1,740 |
| 39. | 39179 | 12.9% | 7.8%(+5.10)#39 | 6.2%(+6.69)#1,763 |
| 40. | 39567 | 12.8% | 7.8%(+5.01)#40 | 6.2%(+6.59)#1,809 |
| 41. | 39745 | 12.8% | 7.8%(+4.98)#41 | 6.2%(+6.57)#1,824 |
| 42. | 39056 | 12.7% | 7.8%(+4.89)#42 | 6.2%(+6.48)#1,860 |
| 43. | 39067 | 12.4% | 7.8%(+4.56)#43 | 6.2%(+6.15)#2,004 |
| 44. | 39560 | 12.4% | 7.8%(+4.53)#44 | 6.2%(+6.12)#2,023 |
| 45. | 39272 | 12.3% | 7.8%(+4.49)#45 | 6.2%(+6.08)#2,047 |
| 46. | 38804 | 12.0% | 7.8%(+4.15)#46 | 6.2%(+5.73)#2,229 |
| 47. | 38852 | 11.9% | 7.8%(+4.08)#47 | 6.2%(+5.66)#2,275 |
| 48. | 39110 | 11.9% | 7.8%(+4.06)#48 | 6.2%(+5.64)#2,284 |
| 49. | 39358 | 11.8% | 7.8%(+3.99)#49 | 6.2%(+5.58)#2,315 |
| 50. | 38848 | 11.5% | 7.8%(+3.71)#50 | 6.2%(+5.30)#2,488 |
| 51. | 39474 | 11.5% | 7.8%(+3.62)#51 | 6.2%(+5.21)#2,556 |
| 52. | 38748 | 11.4% | 7.8%(+3.61)#52 | 6.2%(+5.19)#2,563 |
| 53. | 38827 | 11.4% | 7.8%(+3.57)#53 | 6.2%(+5.16)#2,584 |
| 54. | 39470 | 11.4% | 7.8%(+3.55)#54 | 6.2%(+5.14)#2,599 |
| 55. | 39648 | 11.3% | 7.8%(+3.51)#55 | 6.2%(+5.10)#2,628 |
| 56. | 38858 | 11.2% | 7.8%(+3.37)#56 | 6.2%(+4.96)#2,739 |
| 57. | 38873 | 11.2% | 7.8%(+3.34)#57 | 6.2%(+4.93)#2,761 |
| 58. | 39427 | 11.0% | 7.8%(+3.21)#58 | 6.2%(+4.80)#2,863 |
| 59. | 38855 | 11.0% | 7.8%(+3.21)#59 | 6.2%(+4.80)#2,864 |
| 60. | 39366 | 11.0% | 7.8%(+3.15)#60 | 6.2%(+4.73)#2,901 |
| 61. | 39301 | 10.8% | 7.8%(+2.98)#61 | 6.2%(+4.57)#3,035 |
| 62. | 38901 | 10.8% | 7.8%(+2.97)#62 | 6.2%(+4.56)#3,045 |
| 63. | 39082 | 10.8% | 7.8%(+2.97)#63 | 6.2%(+4.56)#3,051 |
| 64. | 39663 | 10.6% | 7.8%(+2.79)#64 | 6.2%(+4.37)#3,208 |
| 65. | 38866 | 10.4% | 7.8%(+2.53)#65 | 6.2%(+4.12)#3,451 |
| 66. | 38606 | 10.3% | 7.8%(+2.46)#66 | 6.2%(+4.05)#3,531 |
| 67. | 38917 | 10.2% | 7.8%(+2.42)#67 | 6.2%(+4.00)#3,588 |
| 68. | 39114 | 10.2% | 7.8%(+2.39)#68 | 6.2%(+3.97)#3,628 |
| 69. | 38801 | 10.2% | 7.8%(+2.36)#69 | 6.2%(+3.94)#3,653 |
| 70. | 38651 | 10.2% | 7.8%(+2.32)#70 | 6.2%(+3.91)#3,697 |
| 71. | 38833 | 10.1% | 7.8%(+2.31)#71 | 6.2%(+3.90)#3,705 |
| 72. | 39452 | 10.0% | 7.8%(+2.17)#72 | 6.2%(+3.76)#3,878 |
| 73. | 38856 | 9.9% | 7.8%(+2.09)#73 | 6.2%(+3.67)#3,983 |
| 74. | 38680 | 9.9% | 7.8%(+2.04)#74 | 6.2%(+3.63)#4,027 |
| 75. | 39365 | 9.9% | 7.8%(+2.03)#75 | 6.2%(+3.62)#4,034 |
| 76. | 39652 | 9.9% | 7.8%(+2.02)#76 | 6.2%(+3.61)#4,052 |
| 77. | 39667 | 9.8% | 7.8%(+2.00)#77 | 6.2%(+3.59)#4,072 |
| 78. | 39208 | 9.8% | 7.8%(+1.97)#78 | 6.2%(+3.56)#4,105 |
| 79. | 39422 | 9.8% | 7.8%(+1.96)#79 | 6.2%(+3.55)#4,117 |
| 80. | 39657 | 9.8% | 7.8%(+1.95)#80 | 6.2%(+3.54)#4,136 |
| 81. | 39531 | 9.8% | 7.8%(+1.92)#81 | 6.2%(+3.51)#4,177 |
| 82. | 38732 | 9.7% | 7.8%(+1.91)#82 | 6.2%(+3.50)#4,195 |
| 83. | 39323 | 9.7% | 7.8%(+1.89)#83 | 6.2%(+3.47)#4,232 |
| 84. | 38751 | 9.7% | 7.8%(+1.85)#84 | 6.2%(+3.44)#4,276 |
| 85. | 38857 | 9.7% | 7.8%(+1.82)#85 | 6.2%(+3.41)#4,317 |
| 86. | 39157 | 9.6% | 7.8%(+1.78)#86 | 6.2%(+3.37)#4,374 |
| 87. | 38643 | 9.6% | 7.8%(+1.76)#87 | 6.2%(+3.35)#4,402 |
| 88. | 39465 | 9.6% | 7.8%(+1.74)#88 | 6.2%(+3.33)#4,436 |
| 89. | 39345 | 9.5% | 7.8%(+1.71)#89 | 6.2%(+3.30)#4,477 |
| 90. | 39466 | 9.5% | 7.8%(+1.67)#90 | 6.2%(+3.26)#4,539 |
| 91. | 39740 | 9.5% | 7.8%(+1.66)#91 | 6.2%(+3.25)#4,556 |
| 92. | 38740 | 9.5% | 7.8%(+1.66)#92 | 6.2%(+3.24)#4,558 |
| 93. | 39154 | 9.3% | 7.8%(+1.51)#93 | 6.2%(+3.10)#4,785 |
| 94. | 39073 | 9.3% | 7.8%(+1.50)#94 | 6.2%(+3.08)#4,810 |
| 95. | 38672 | 9.3% | 7.8%(+1.48)#95 | 6.2%(+3.07)#4,839 |
| 96. | 39477 | 9.3% | 7.8%(+1.43)#96 | 6.2%(+3.01)#4,929 |
| 97. | 39564 | 9.2% | 7.8%(+1.39)#97 | 6.2%(+2.97)#4,990 |
| 98. | 39483 | 9.2% | 7.8%(+1.38)#98 | 6.2%(+2.97)#4,998 |
| 99. | 38668 | 9.2% | 7.8%(+1.38)#99 | 6.2%(+2.97)#4,999 |
| 100. | 39507 | 9.1% | 7.8%(+1.26)#100 | 6.2%(+2.85)#5,181 |
Common Questions
What are the Top 10 Zip Codes with the Highest Percentage of Population Employed in Health Diagnosing & Treating in Mississippi?
Top 10 Zip Codes with the Highest Percentage of Population Employed in Health Diagnosing & Treating in Mississippi are:
What zip code has the Highest Percentage of Population Employed in Health Diagnosing & Treating in Mississippi?
38738 has the Highest Percentage of Population Employed in Health Diagnosing & Treating in Mississippi with 61.4%.
What is the Percentage of Population Employed in Health Diagnosing & Treating in the State of Mississippi?
Percentage of Population Employed in Health Diagnosing & Treating in Mississippi is 7.8%.
What is the Percentage of Population Employed in Health Diagnosing & Treating in the United States?
Percentage of Population Employed in Health Diagnosing & Treating in the United States is 6.2%.