Zip Codes with the Highest Percentage of Population Employed in Health Diagnosing & Treating in Moss Point, MS
RELATED REPORTS & OPTIONS
Health Diagnosing & Treating
Moss Point
Compare Zip Codes
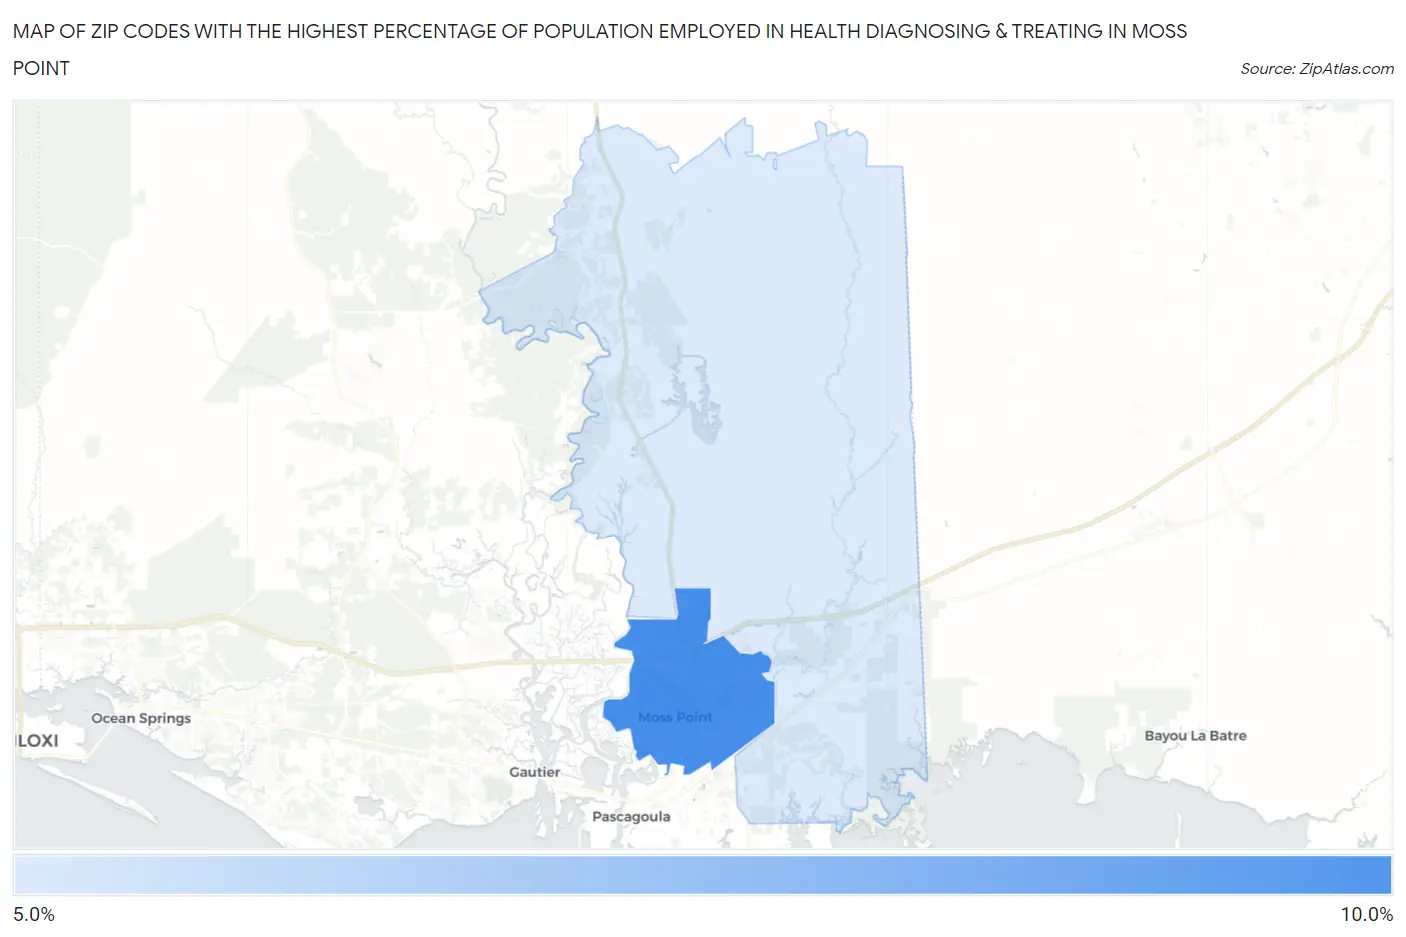
Map of Zip Codes with the Highest Percentage of Population Employed in Health Diagnosing & Treating in Moss Point
5.2%
8.2%
Zip Codes with the Highest Percentage of Population Employed in Health Diagnosing & Treating in Moss Point, MS
| Zip Code | % Employed | vs State | vs National | |
| 1. | 39563 | 8.2% | 7.8%(+0.364)#134 | 6.2%(+1.95)#7,017 |
| 2. | 39562 | 5.2% | 7.8%(-2.59)#229 | 6.2%(-1.00)#16,775 |
1
Common Questions
What are the Top Zip Codes with the Highest Percentage of Population Employed in Health Diagnosing & Treating in Moss Point, MS?
Top Zip Codes with the Highest Percentage of Population Employed in Health Diagnosing & Treating in Moss Point, MS are:
What zip code has the Highest Percentage of Population Employed in Health Diagnosing & Treating in Moss Point, MS?
39563 has the Highest Percentage of Population Employed in Health Diagnosing & Treating in Moss Point, MS with 8.2%.
What is the Percentage of Population Employed in Health Diagnosing & Treating in Moss Point, MS?
Percentage of Population Employed in Health Diagnosing & Treating in Moss Point is 8.2%.
What is the Percentage of Population Employed in Health Diagnosing & Treating in Mississippi?
Percentage of Population Employed in Health Diagnosing & Treating in Mississippi is 7.8%.
What is the Percentage of Population Employed in Health Diagnosing & Treating in the United States?
Percentage of Population Employed in Health Diagnosing & Treating in the United States is 6.2%.