Lumberton, MS Map & Demographics
Lumberton Map
Lumberton Overview
$19,376
PER CAPITA INCOME
$46,494
AVG FAMILY INCOME
$40,641
AVG HOUSEHOLD INCOME
19.9%
WAGE / INCOME GAP [ % ]
80.1¢/ $1
WAGE / INCOME GAP [ $ ]
0.42
INEQUALITY / GINI INDEX
1,588
TOTAL POPULATION
834
MALE POPULATION
754
FEMALE POPULATION
110.61
MALES / 100 FEMALES
90.41
FEMALES / 100 MALES
36.9
MEDIAN AGE
3.0
AVG FAMILY SIZE
2.5
AVG HOUSEHOLD SIZE
674
LABOR FORCE [ PEOPLE ]
55.8%
PERCENT IN LABOR FORCE
19.3%
UNEMPLOYMENT RATE
Lumberton Zip Codes
Income in Lumberton
Income Overview in Lumberton
Per Capita Income in Lumberton is $19,376, while median incomes of families and households are $46,494 and $40,641 respectively.
| Characteristic | Number | Measure |
| Per Capita Income | 1,588 | $19,376 |
| Median Family Income | 437 | $46,494 |
| Mean Family Income | 437 | $56,962 |
| Median Household Income | 620 | $40,641 |
| Mean Household Income | 620 | $48,343 |
| Income Deficit | 437 | $0 |
| Wage / Income Gap (%) | 1,588 | 19.90% |
| Wage / Income Gap ($) | 1,588 | 80.10¢ per $1 |
| Gini / Inequality Index | 1,588 | 0.42 |
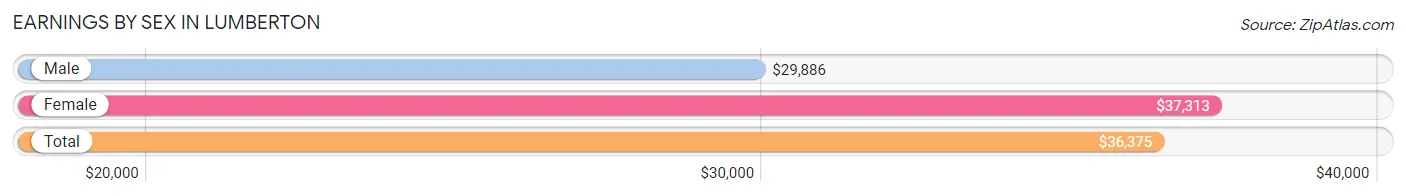
Earnings by Sex in Lumberton
Average Earnings in Lumberton are $36,375, $29,886 for men and $37,313 for women, a difference of 19.9%.
| Sex | Number | Average Earnings |
| Male | 272 (43.8%) | $29,886 |
| Female | 349 (56.2%) | $37,313 |
| Total | 621 (100.0%) | $36,375 |
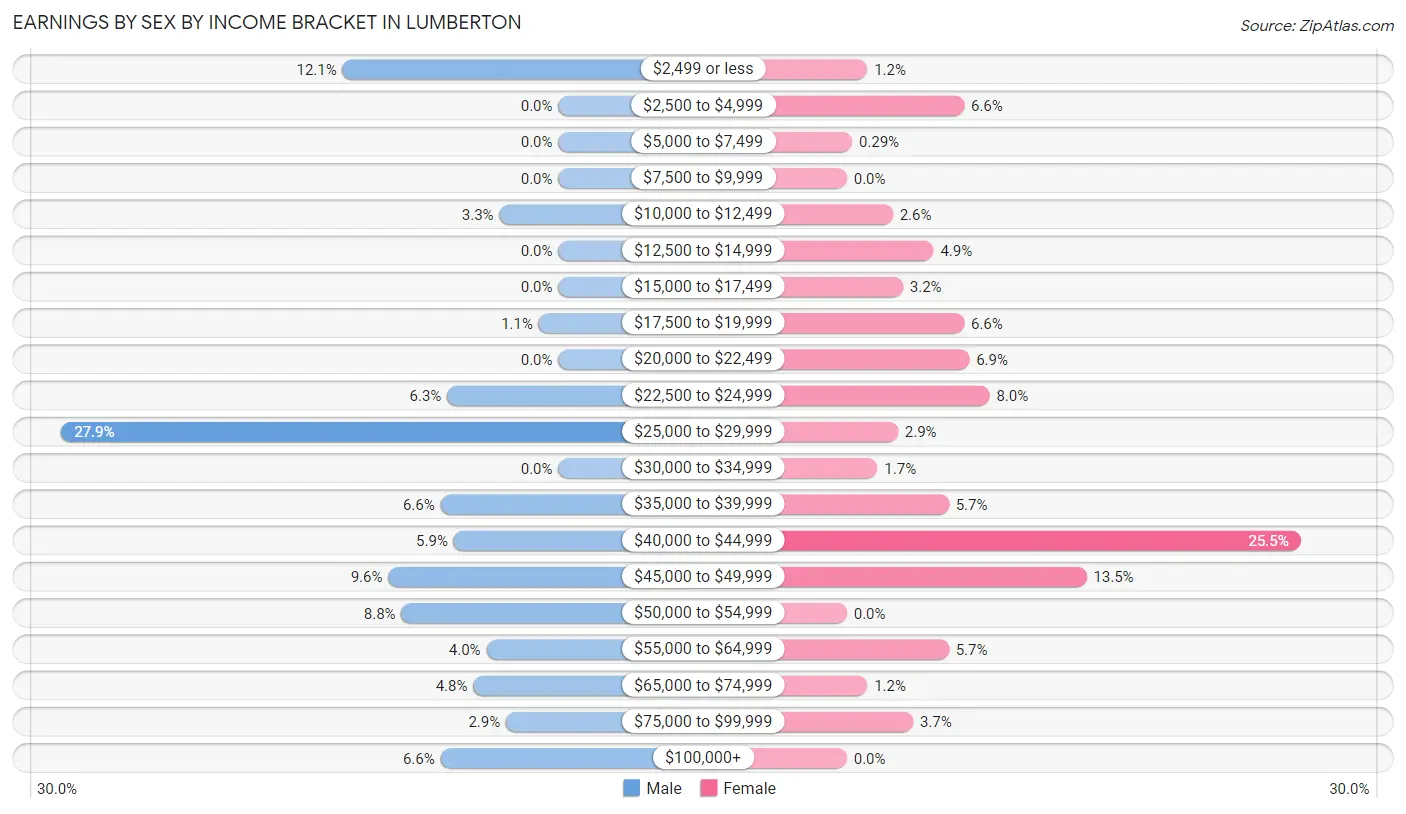
Earnings by Sex by Income Bracket in Lumberton
The most common earnings brackets in Lumberton are $25,000 to $29,999 for men (76 | 27.9%) and $40,000 to $44,999 for women (89 | 25.5%).
| Income | Male | Female |
| $2,499 or less | 33 (12.1%) | 4 (1.1%) |
| $2,500 to $4,999 | 0 (0.0%) | 23 (6.6%) |
| $5,000 to $7,499 | 0 (0.0%) | 1 (0.3%) |
| $7,500 to $9,999 | 0 (0.0%) | 0 (0.0%) |
| $10,000 to $12,499 | 9 (3.3%) | 9 (2.6%) |
| $12,500 to $14,999 | 0 (0.0%) | 17 (4.9%) |
| $15,000 to $17,499 | 0 (0.0%) | 11 (3.2%) |
| $17,500 to $19,999 | 3 (1.1%) | 23 (6.6%) |
| $20,000 to $22,499 | 0 (0.0%) | 24 (6.9%) |
| $22,500 to $24,999 | 17 (6.2%) | 28 (8.0%) |
| $25,000 to $29,999 | 76 (27.9%) | 10 (2.9%) |
| $30,000 to $34,999 | 0 (0.0%) | 6 (1.7%) |
| $35,000 to $39,999 | 18 (6.6%) | 20 (5.7%) |
| $40,000 to $44,999 | 16 (5.9%) | 89 (25.5%) |
| $45,000 to $49,999 | 26 (9.6%) | 47 (13.5%) |
| $50,000 to $54,999 | 24 (8.8%) | 0 (0.0%) |
| $55,000 to $64,999 | 11 (4.0%) | 20 (5.7%) |
| $65,000 to $74,999 | 13 (4.8%) | 4 (1.1%) |
| $75,000 to $99,999 | 8 (2.9%) | 13 (3.7%) |
| $100,000+ | 18 (6.6%) | 0 (0.0%) |
| Total | 272 (100.0%) | 349 (100.0%) |
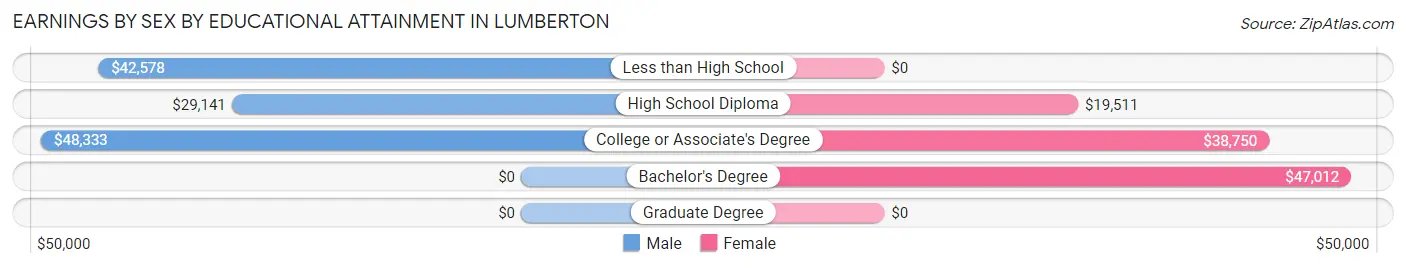
Earnings by Sex by Educational Attainment in Lumberton
Average earnings in Lumberton are $38,438 for men and $40,439 for women, a difference of 5.0%. Men with an educational attainment of college or associate's degree enjoy the highest average annual earnings of $48,333, while those with high school diploma education earn the least with $29,141. Women with an educational attainment of bachelor's degree earn the most with the average annual earnings of $47,012, while those with high school diploma education have the smallest earnings of $19,511.
| Educational Attainment | Male Income | Female Income |
| Less than High School | $42,578 | $0 |
| High School Diploma | $29,141 | $19,511 |
| College or Associate's Degree | $48,333 | $38,750 |
| Bachelor's Degree | - | - |
| Graduate Degree | - | - |
| Total | $38,438 | $40,439 |
Family Income in Lumberton
Family Income Brackets in Lumberton
According to the Lumberton family income data, there are 98 families falling into the $35,000 to $49,999 income range, which is the most common income bracket and makes up 22.4% of all families. Conversely, the $150,000 to $199,999 income bracket is the least frequent group with only 6 families (1.4%) belonging to this category.
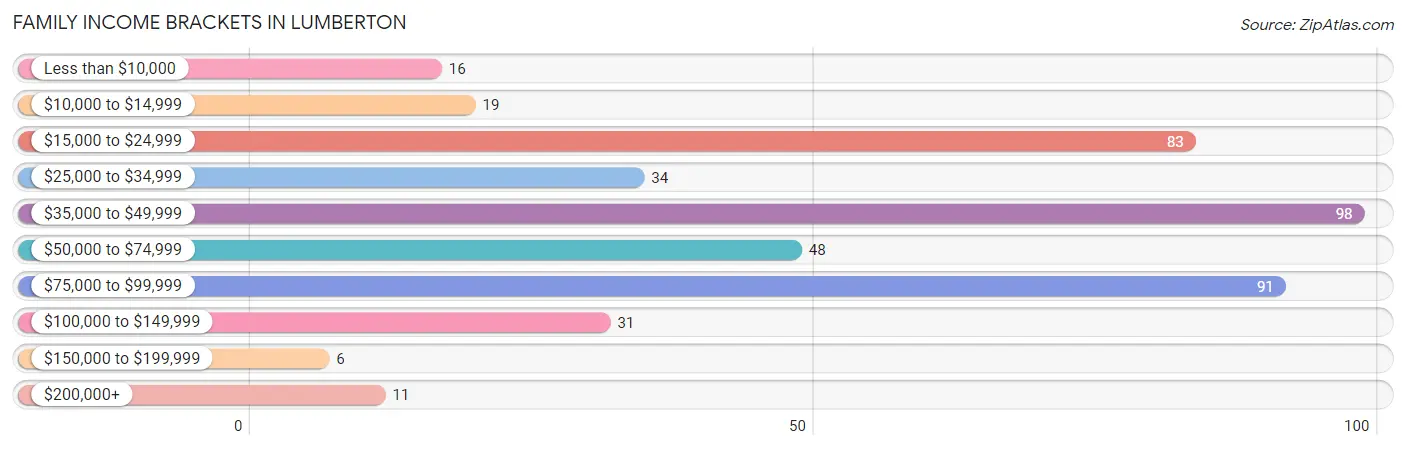
| Income Bracket | # Families | % Families |
| Less than $10,000 | 16 | 3.7% |
| $10,000 to $14,999 | 19 | 4.3% |
| $15,000 to $24,999 | 83 | 19.0% |
| $25,000 to $34,999 | 34 | 7.8% |
| $35,000 to $49,999 | 98 | 22.4% |
| $50,000 to $74,999 | 48 | 11.0% |
| $75,000 to $99,999 | 91 | 20.8% |
| $100,000 to $149,999 | 31 | 7.1% |
| $150,000 to $199,999 | 6 | 1.4% |
| $200,000+ | 11 | 2.5% |
Family Income by Famaliy Size in Lumberton
2-person families (189 | 43.2%) account for the highest median family income in Lumberton with $53,906 per family, while 2-person families (189 | 43.2%) have the highest median income of $26,953 per family member.
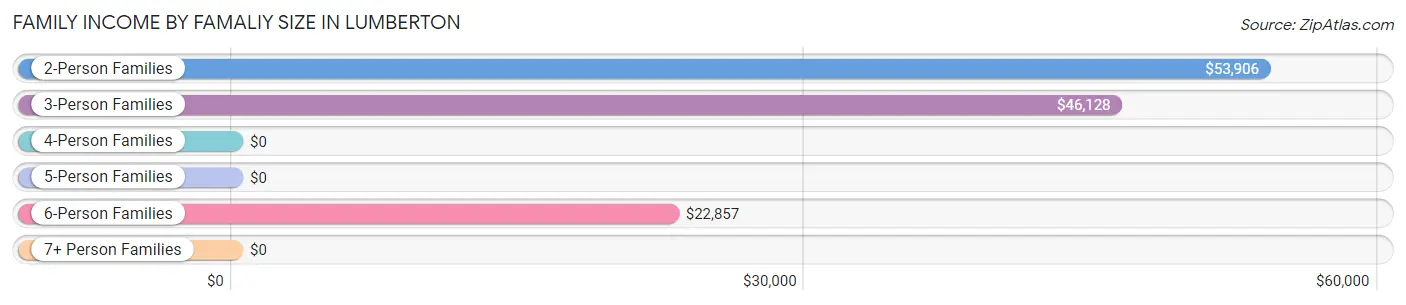
| Income Bracket | # Families | Median Income |
| 2-Person Families | 189 (43.2%) | $53,906 |
| 3-Person Families | 139 (31.8%) | $46,128 |
| 4-Person Families | 70 (16.0%) | $0 |
| 5-Person Families | 5 (1.1%) | $0 |
| 6-Person Families | 34 (7.8%) | $22,857 |
| 7+ Person Families | 0 (0.0%) | $0 |
| Total | 437 (100.0%) | $46,494 |
Family Income by Number of Earners in Lumberton
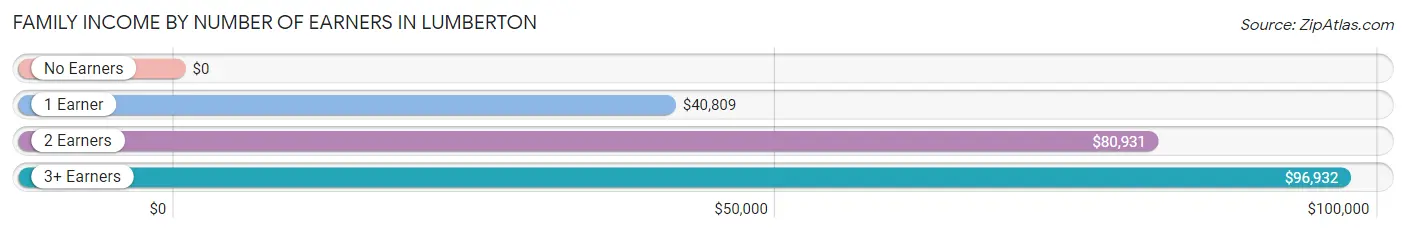
| Number of Earners | # Families | Median Income |
| No Earners | 69 (15.8%) | $0 |
| 1 Earner | 225 (51.5%) | $40,809 |
| 2 Earners | 126 (28.8%) | $80,931 |
| 3+ Earners | 17 (3.9%) | $96,932 |
| Total | 437 (100.0%) | $46,494 |
Household Income in Lumberton
Household Income Brackets in Lumberton
With 131 households falling in the category, the $35,000 to $49,999 income range is the most frequent in Lumberton, accounting for 21.1% of all households. In contrast, only 6 households (1.0%) fall into the $150,000 to $199,999 income bracket, making it the least populous group.
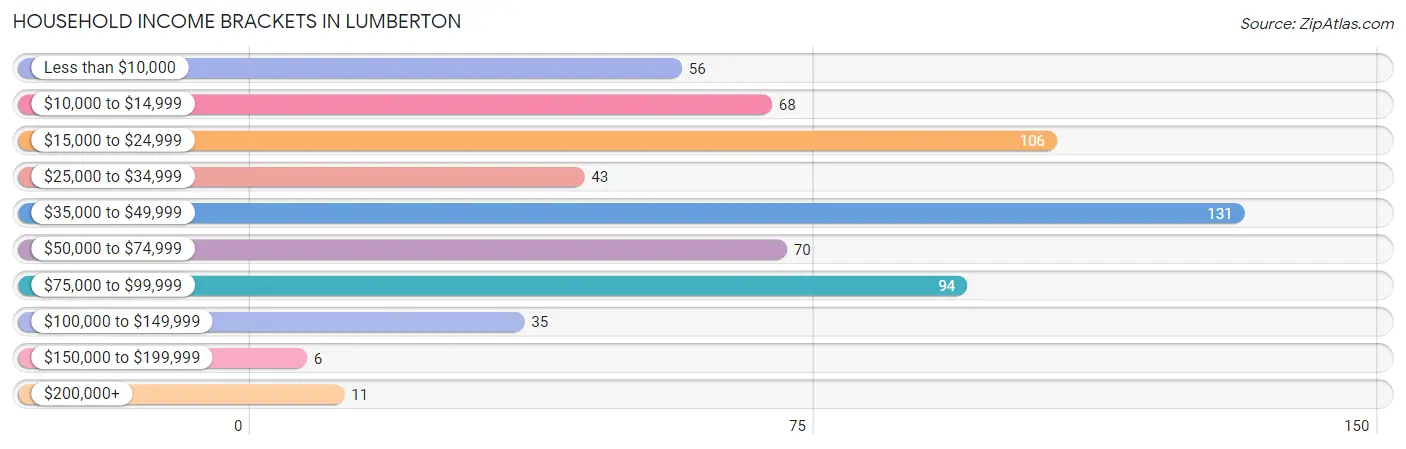
| Income Bracket | # Households | % Households |
| Less than $10,000 | 56 | 9.0% |
| $10,000 to $14,999 | 68 | 11.0% |
| $15,000 to $24,999 | 106 | 17.1% |
| $25,000 to $34,999 | 43 | 6.9% |
| $35,000 to $49,999 | 131 | 21.1% |
| $50,000 to $74,999 | 70 | 11.3% |
| $75,000 to $99,999 | 94 | 15.2% |
| $100,000 to $149,999 | 35 | 5.6% |
| $150,000 to $199,999 | 6 | 1.0% |
| $200,000+ | 11 | 1.8% |
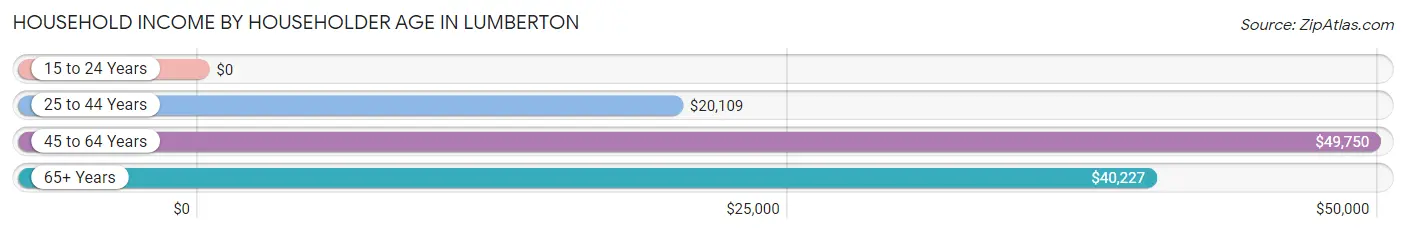
Household Income by Householder Age in Lumberton
The median household income in Lumberton is $40,641, with the highest median household income of $49,750 found in the 45 to 64 years age bracket for the primary householder. A total of 327 households (52.7%) fall into this category. Meanwhile, the 15 to 24 years age bracket for the primary householder has the lowest median household income of $0, with 9 households (1.5%) in this group.
| Income Bracket | # Households | Median Income |
| 15 to 24 Years | 9 (1.5%) | $0 |
| 25 to 44 Years | 150 (24.2%) | $20,109 |
| 45 to 64 Years | 327 (52.7%) | $49,750 |
| 65+ Years | 134 (21.6%) | $40,227 |
| Total | 620 (100.0%) | $40,641 |
Poverty in Lumberton
Income Below Poverty by Sex and Age in Lumberton
With 46.1% poverty level for males and 36.9% for females among the residents of Lumberton, 6 to 11 year old males and 15 year old females are the most vulnerable to poverty, with 88 males (100.0%) and 9 females (100.0%) in their respective age groups living below the poverty level.
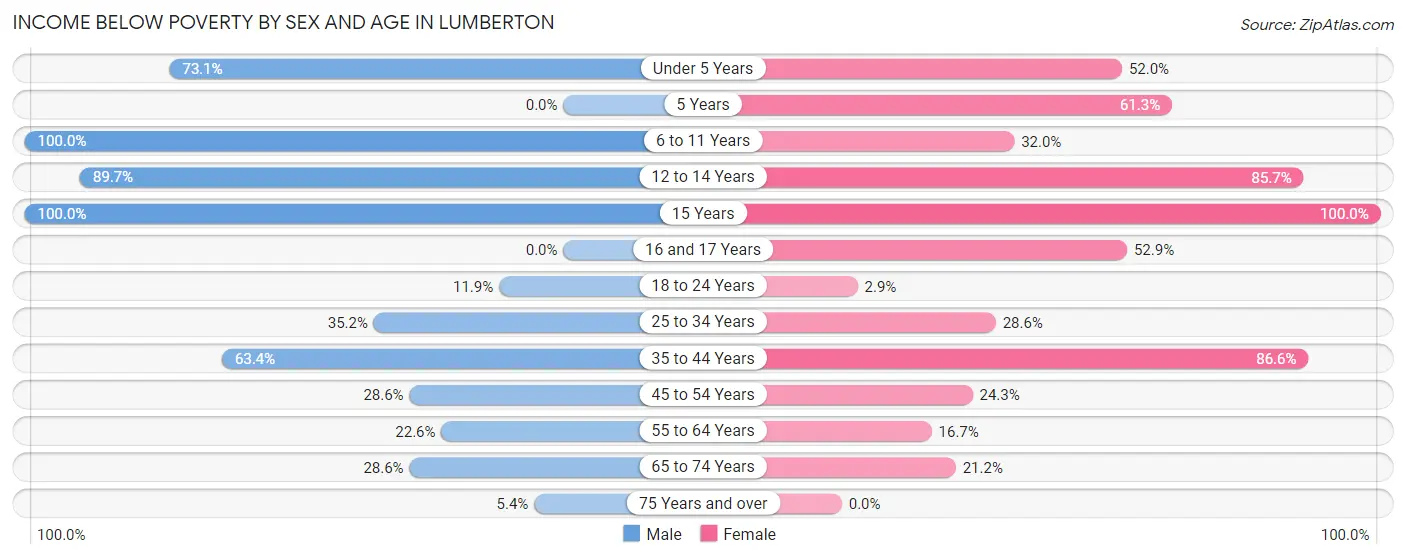
| Age Bracket | Male | Female |
| Under 5 Years | 49 (73.1%) | 13 (52.0%) |
| 5 Years | 0 (0.0%) | 19 (61.3%) |
| 6 to 11 Years | 88 (100.0%) | 8 (32.0%) |
| 12 to 14 Years | 70 (89.7%) | 42 (85.7%) |
| 15 Years | 5 (100.0%) | 9 (100.0%) |
| 16 and 17 Years | 0 (0.0%) | 9 (52.9%) |
| 18 to 24 Years | 8 (11.9%) | 1 (2.9%) |
| 25 to 34 Years | 57 (35.2%) | 22 (28.6%) |
| 35 to 44 Years | 45 (63.4%) | 71 (86.6%) |
| 45 to 54 Years | 32 (28.6%) | 58 (24.3%) |
| 55 to 64 Years | 12 (22.6%) | 13 (16.7%) |
| 65 to 74 Years | 10 (28.6%) | 11 (21.1%) |
| 75 Years and over | 4 (5.4%) | 0 (0.0%) |
| Total | 380 (46.1%) | 276 (36.9%) |
Income Above Poverty by Sex and Age in Lumberton
According to the poverty statistics in Lumberton, males aged 16 and 17 years and females aged 75 years and over are the age groups that are most secure financially, with 100.0% of males and 100.0% of females in these age groups living above the poverty line.
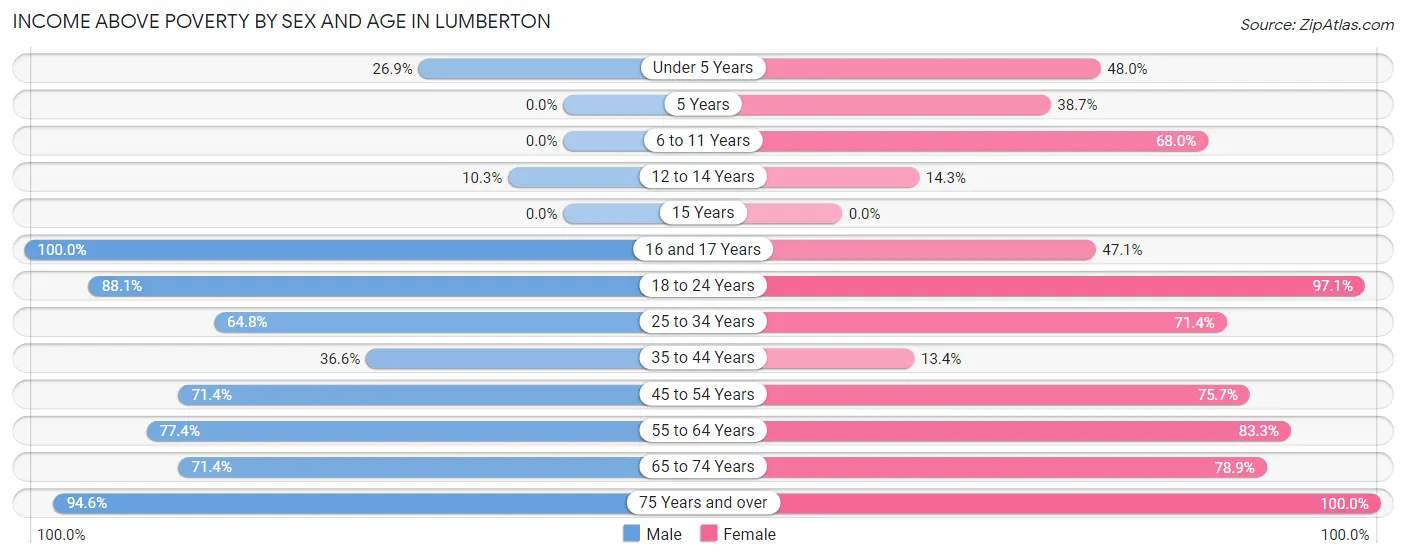
| Age Bracket | Male | Female |
| Under 5 Years | 18 (26.9%) | 12 (48.0%) |
| 5 Years | 0 (0.0%) | 12 (38.7%) |
| 6 to 11 Years | 0 (0.0%) | 17 (68.0%) |
| 12 to 14 Years | 8 (10.3%) | 7 (14.3%) |
| 15 Years | 0 (0.0%) | 0 (0.0%) |
| 16 and 17 Years | 13 (100.0%) | 8 (47.1%) |
| 18 to 24 Years | 59 (88.1%) | 33 (97.1%) |
| 25 to 34 Years | 105 (64.8%) | 55 (71.4%) |
| 35 to 44 Years | 26 (36.6%) | 11 (13.4%) |
| 45 to 54 Years | 80 (71.4%) | 181 (75.7%) |
| 55 to 64 Years | 41 (77.4%) | 65 (83.3%) |
| 65 to 74 Years | 25 (71.4%) | 41 (78.8%) |
| 75 Years and over | 70 (94.6%) | 30 (100.0%) |
| Total | 445 (53.9%) | 472 (63.1%) |
Income Below Poverty Among Married-Couple Families in Lumberton
The poverty statistics for married-couple families in Lumberton show that 21.2% or 42 of the total 198 families live below the poverty line. Families with 3 or 4 children have the highest poverty rate of 100.0%, comprising of 22 families. On the other hand, families with no children have the lowest poverty rate of 7.3%, which includes 7 families.
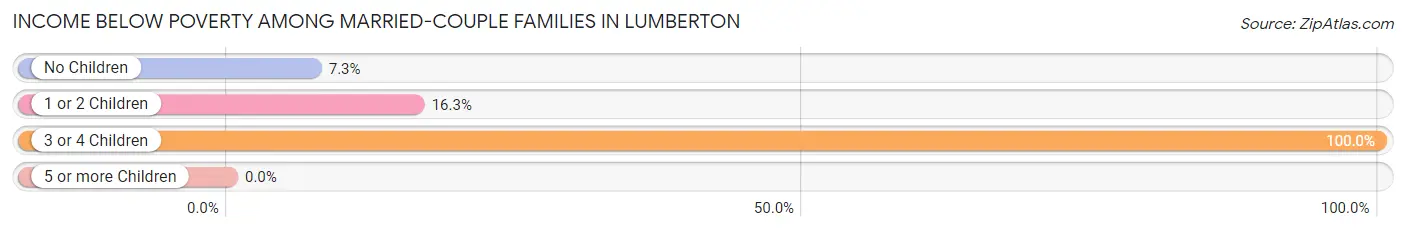
| Children | Above Poverty | Below Poverty |
| No Children | 89 (92.7%) | 7 (7.3%) |
| 1 or 2 Children | 67 (83.8%) | 13 (16.3%) |
| 3 or 4 Children | 0 (0.0%) | 22 (100.0%) |
| 5 or more Children | 0 (0.0%) | 0 (0.0%) |
| Total | 156 (78.8%) | 42 (21.2%) |
Income Below Poverty Among Single-Parent Households in Lumberton
According to the poverty data in Lumberton, 18.5% or 5 single-father households and 33.0% or 70 single-mother households are living below the poverty line. Among single-father households, those with 5 or more children have the highest poverty rate, with 5 households (100.0%) experiencing poverty. Likewise, among single-mother households, those with 3 or 4 children have the highest poverty rate, with 7 households (100.0%) falling below the poverty line.
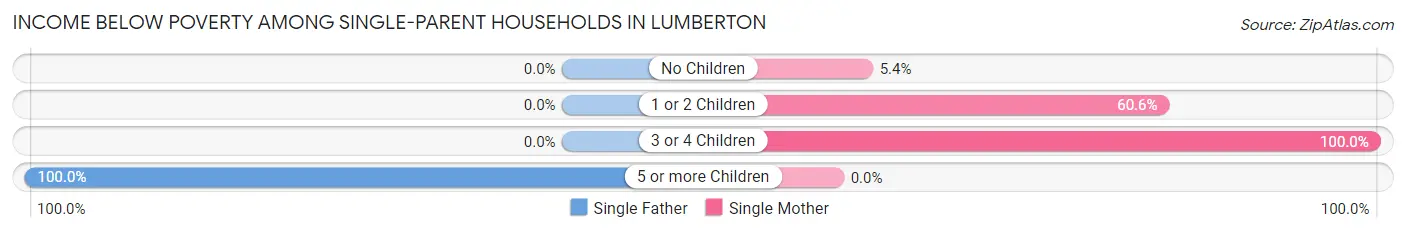
| Children | Single Father | Single Mother |
| No Children | 0 (0.0%) | 6 (5.4%) |
| 1 or 2 Children | 0 (0.0%) | 57 (60.6%) |
| 3 or 4 Children | 0 (0.0%) | 7 (100.0%) |
| 5 or more Children | 5 (100.0%) | 0 (0.0%) |
| Total | 5 (18.5%) | 70 (33.0%) |
Income Below Poverty Among Married-Couple vs Single-Parent Households in Lumberton
The poverty data for Lumberton shows that 42 of the married-couple family households (21.2%) and 75 of the single-parent households (31.4%) are living below the poverty level. Within the married-couple family households, those with 3 or 4 children have the highest poverty rate, with 22 households (100.0%) falling below the poverty line. Among the single-parent households, those with 3 or 4 children have the highest poverty rate, with 7 household (100.0%) living below poverty.
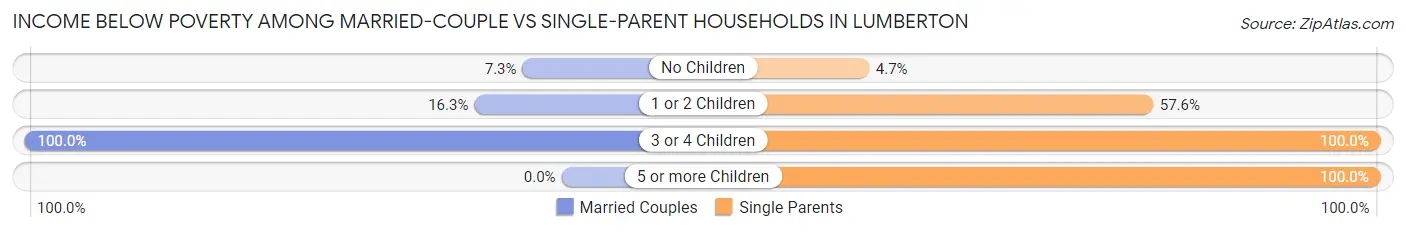
| Children | Married-Couple Families | Single-Parent Households |
| No Children | 7 (7.3%) | 6 (4.7%) |
| 1 or 2 Children | 13 (16.3%) | 57 (57.6%) |
| 3 or 4 Children | 22 (100.0%) | 7 (100.0%) |
| 5 or more Children | 0 (0.0%) | 5 (100.0%) |
| Total | 42 (21.2%) | 75 (31.4%) |
Race in Lumberton
The most populous races in Lumberton are Black / African American (1,077 | 67.8%), White / Caucasian (469 | 29.5%), and Two or more Races (37 | 2.3%).
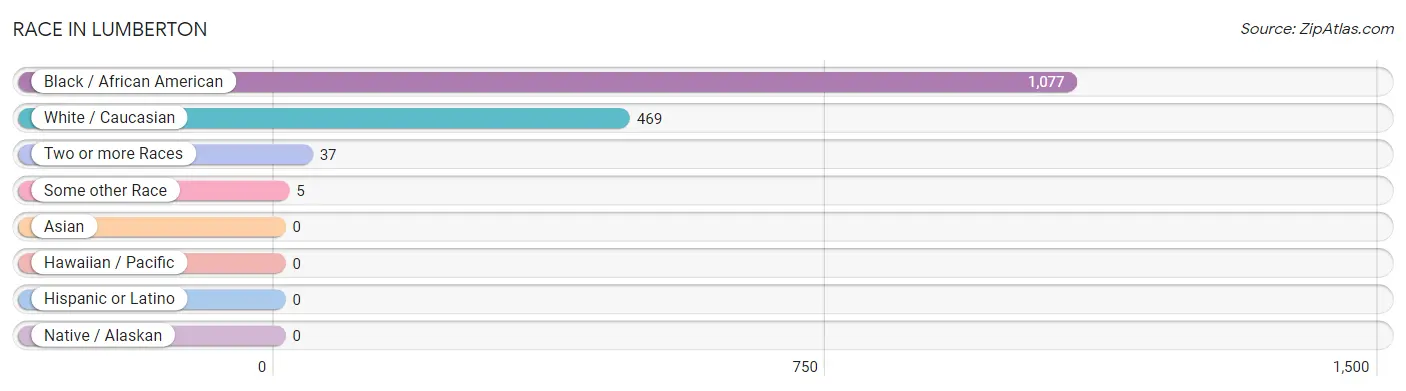
| Race | # Population | % Population |
| Asian | 0 | 0.0% |
| Black / African American | 1,077 | 67.8% |
| Hawaiian / Pacific | 0 | 0.0% |
| Hispanic or Latino | 0 | 0.0% |
| Native / Alaskan | 0 | 0.0% |
| White / Caucasian | 469 | 29.5% |
| Two or more Races | 37 | 2.3% |
| Some other Race | 5 | 0.3% |
| Total | 1,588 | 100.0% |
Ancestry in Lumberton
The most populous ancestries reported in Lumberton are Irish (161 | 10.1%), American (61 | 3.8%), German (43 | 2.7%), English (35 | 2.2%), and Scottish (27 | 1.7%), together accounting for 20.6% of all Lumberton residents.
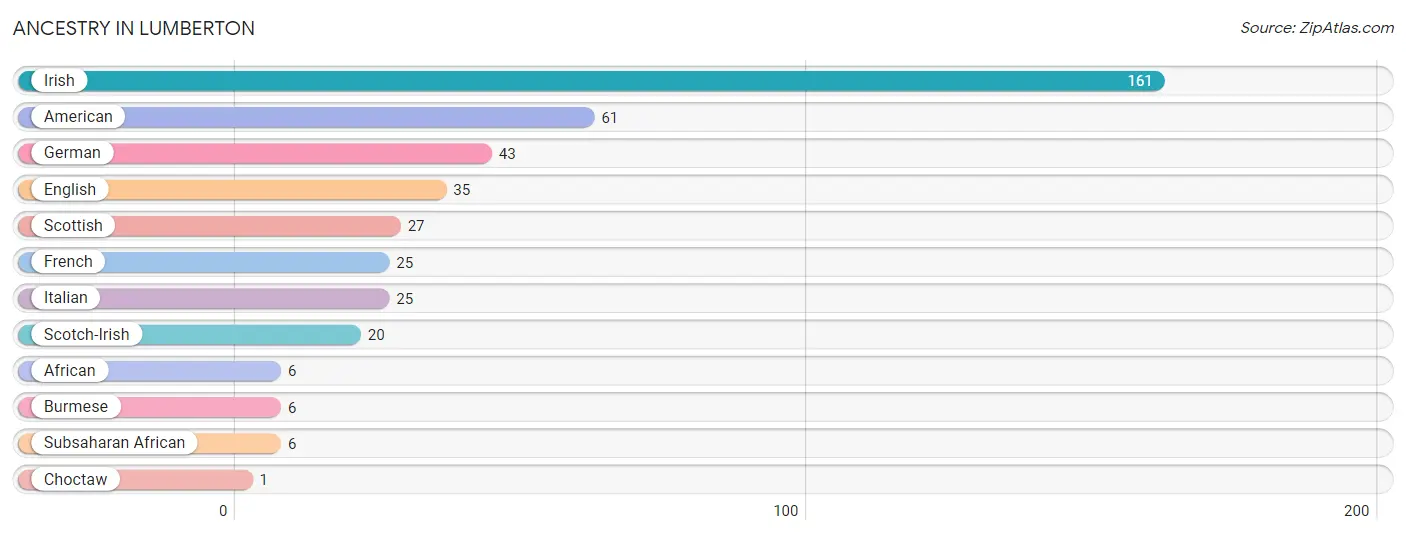
| Ancestry | # Population | % Population |
| African | 6 | 0.4% |
| American | 61 | 3.8% |
| Burmese | 6 | 0.4% |
| Choctaw | 1 | 0.1% |
| English | 35 | 2.2% |
| French | 25 | 1.6% |
| German | 43 | 2.7% |
| Irish | 161 | 10.1% |
| Italian | 25 | 1.6% |
| Scotch-Irish | 20 | 1.3% |
| Scottish | 27 | 1.7% |
| Subsaharan African | 6 | 0.4% | View All 12 Rows |
Immigrants in Lumberton

| Immigration Origin | # Population | % Population | View All 0 Rows |
Sex and Age in Lumberton
Sex and Age in Lumberton
The most populous age groups in Lumberton are 25 to 29 Years (135 | 16.2%) for men and 50 to 54 Years (199 | 26.4%) for women.
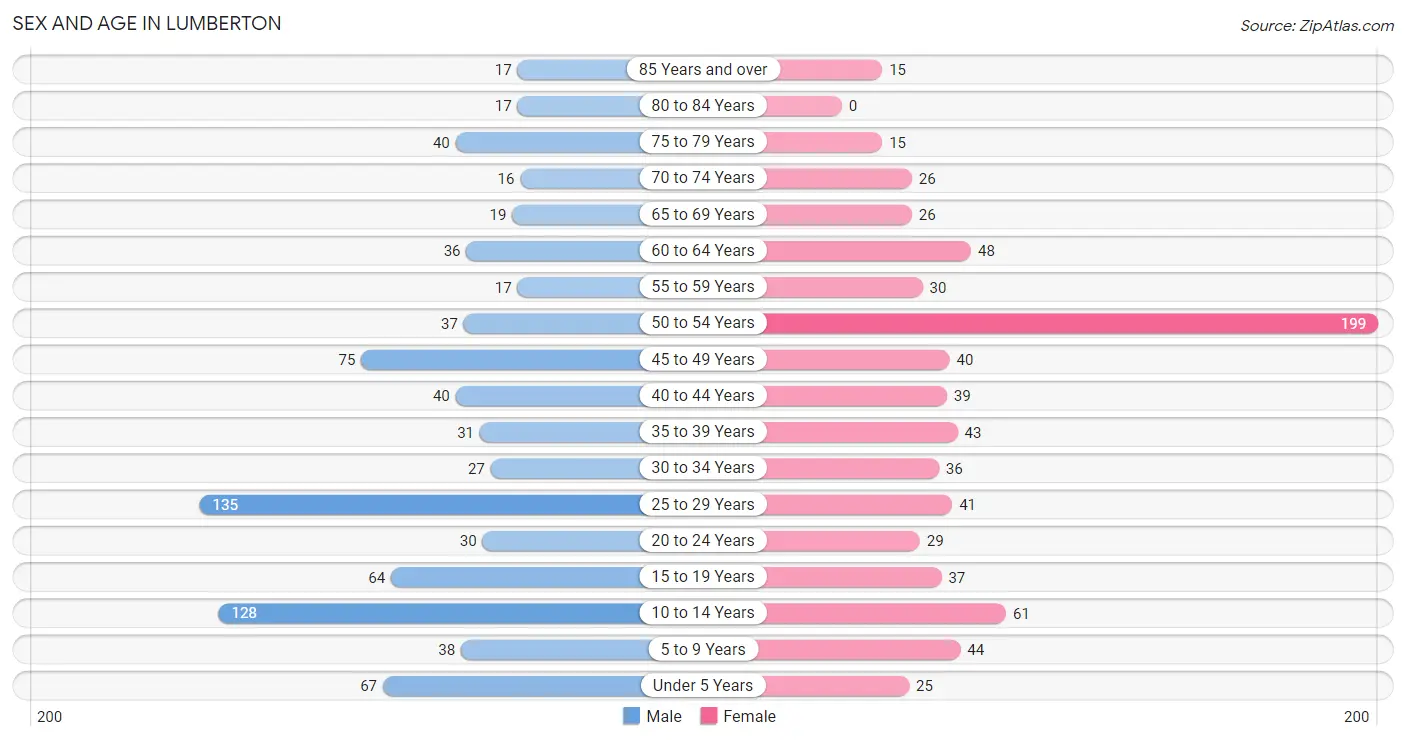
| Age Bracket | Male | Female |
| Under 5 Years | 67 (8.0%) | 25 (3.3%) |
| 5 to 9 Years | 38 (4.6%) | 44 (5.8%) |
| 10 to 14 Years | 128 (15.3%) | 61 (8.1%) |
| 15 to 19 Years | 64 (7.7%) | 37 (4.9%) |
| 20 to 24 Years | 30 (3.6%) | 29 (3.8%) |
| 25 to 29 Years | 135 (16.2%) | 41 (5.4%) |
| 30 to 34 Years | 27 (3.2%) | 36 (4.8%) |
| 35 to 39 Years | 31 (3.7%) | 43 (5.7%) |
| 40 to 44 Years | 40 (4.8%) | 39 (5.2%) |
| 45 to 49 Years | 75 (9.0%) | 40 (5.3%) |
| 50 to 54 Years | 37 (4.4%) | 199 (26.4%) |
| 55 to 59 Years | 17 (2.0%) | 30 (4.0%) |
| 60 to 64 Years | 36 (4.3%) | 48 (6.4%) |
| 65 to 69 Years | 19 (2.3%) | 26 (3.5%) |
| 70 to 74 Years | 16 (1.9%) | 26 (3.5%) |
| 75 to 79 Years | 40 (4.8%) | 15 (2.0%) |
| 80 to 84 Years | 17 (2.0%) | 0 (0.0%) |
| 85 Years and over | 17 (2.0%) | 15 (2.0%) |
| Total | 834 (100.0%) | 754 (100.0%) |
Families and Households in Lumberton
Median Family Size in Lumberton
The median family size in Lumberton is 3.05 persons per family, with single male/father families (27 | 6.2%) accounting for the largest median family size of 3.41 persons per family. On the other hand, single female/mother families (212 | 48.5%) represent the smallest median family size with 2.75 persons per family.
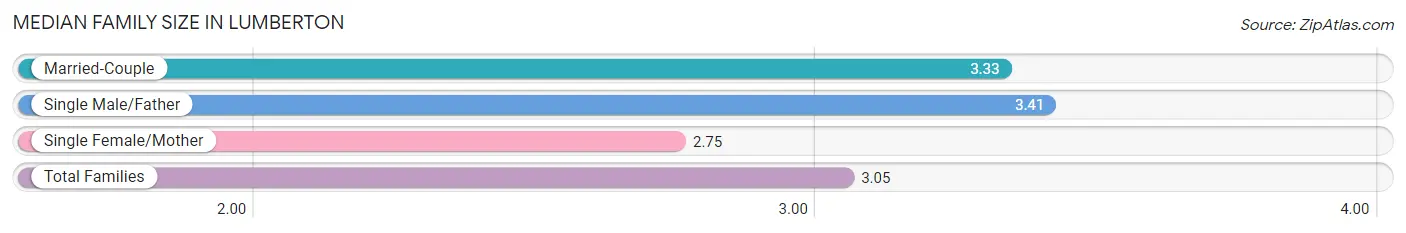
| Family Type | # Families | Family Size |
| Married-Couple | 198 (45.3%) | 3.33 |
| Single Male/Father | 27 (6.2%) | 3.41 |
| Single Female/Mother | 212 (48.5%) | 2.75 |
| Total Families | 437 (100.0%) | 3.05 |
Median Household Size in Lumberton
The median household size in Lumberton is 2.53 persons per household, with single male/father households (27 | 4.3%) accounting for the largest median household size of 4.41 persons per household. non-family households (183 | 29.5%) represent the smallest median household size with 1.08 persons per household.
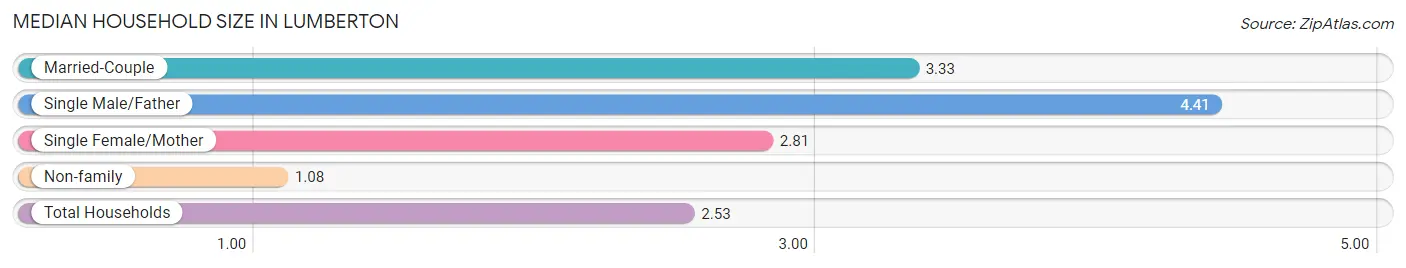
| Household Type | # Households | Household Size |
| Married-Couple | 198 (31.9%) | 3.33 |
| Single Male/Father | 27 (4.3%) | 4.41 |
| Single Female/Mother | 212 (34.2%) | 2.81 |
| Non-family | 183 (29.5%) | 1.08 |
| Total Households | 620 (100.0%) | 2.53 |
Household Size by Marriage Status in Lumberton
Out of a total of 620 households in Lumberton, 437 (70.5%) are family households, while 183 (29.5%) are nonfamily households. The most numerous type of family households are 2-person households, comprising 184, and the most common type of nonfamily households are 1-person households, comprising 174.
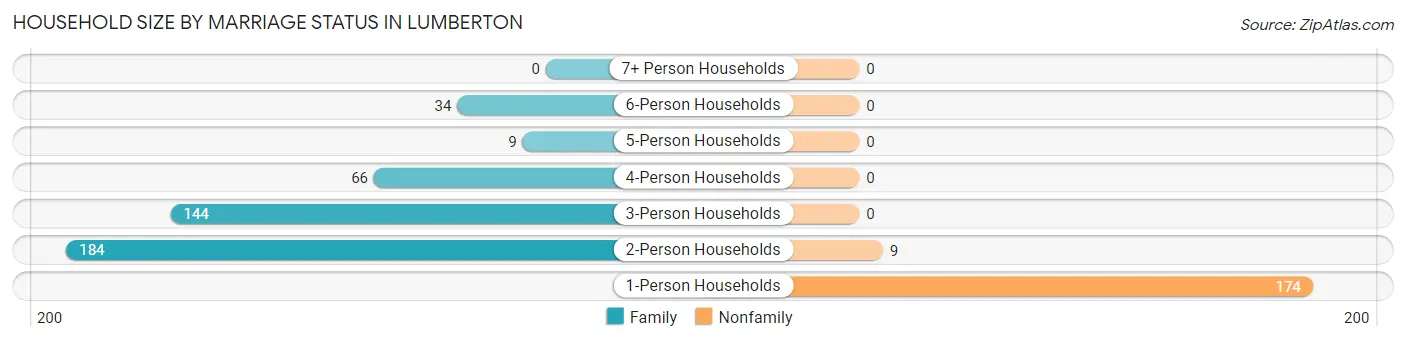
| Household Size | Family Households | Nonfamily Households |
| 1-Person Households | - | 174 (28.1%) |
| 2-Person Households | 184 (29.7%) | 9 (1.5%) |
| 3-Person Households | 144 (23.2%) | 0 (0.0%) |
| 4-Person Households | 66 (10.6%) | 0 (0.0%) |
| 5-Person Households | 9 (1.5%) | 0 (0.0%) |
| 6-Person Households | 34 (5.5%) | 0 (0.0%) |
| 7+ Person Households | 0 (0.0%) | 0 (0.0%) |
| Total | 437 (70.5%) | 183 (29.5%) |
Female Fertility in Lumberton
Fertility by Age in Lumberton
| Age Bracket | Women with Births | Births / 1,000 Women |
| 15 to 19 years | 0 (0.0%) | 0.0 |
| 20 to 34 years | 0 (0.0%) | 0.0 |
| 35 to 50 years | 0 (0.0%) | 0.0 |
| Total | 0 (0.0%) | 0.0 |
Fertility by Age by Marriage Status in Lumberton
| Age Bracket | Married | Unmarried |
| 15 to 19 years | 0 (0.0%) | 0 (0.0%) |
| 20 to 34 years | 0 (0.0%) | 0 (0.0%) |
| 35 to 50 years | 0 (0.0%) | 0 (0.0%) |
| Total | 0 (0.0%) | 0 (0.0%) |
Fertility by Education in Lumberton
| Educational Attainment | Women with Births | Births / 1,000 Women |
| Less than High School | 0 (0.0%) | 0.0 |
| High School Diploma | 0 (0.0%) | 0.0 |
| College or Associate's Degree | 0 (0.0%) | 0.0 |
| Bachelor's Degree | 0 (0.0%) | 0.0 |
| Graduate Degree | 0 (0.0%) | 0.0 |
| Total | 0 (0.0%) | 0.0 |
Fertility by Education by Marriage Status in Lumberton
| Educational Attainment | Married | Unmarried |
| Less than High School | 0 (0.0%) | 0 (0.0%) |
| High School Diploma | 0 (0.0%) | 0 (0.0%) |
| College or Associate's Degree | 0 (0.0%) | 0 (0.0%) |
| Bachelor's Degree | 0 (0.0%) | 0 (0.0%) |
| Graduate Degree | 0 (0.0%) | 0 (0.0%) |
| Total | 0 (0.0%) | 0 (0.0%) |
Employment Characteristics in Lumberton
Employment by Class of Employer in Lumberton
Among the 533 employed individuals in Lumberton, private company employees (299 | 56.1%), local government employees (148 | 27.8%), and state government employees (60 | 11.3%) make up the most common classes of employment.
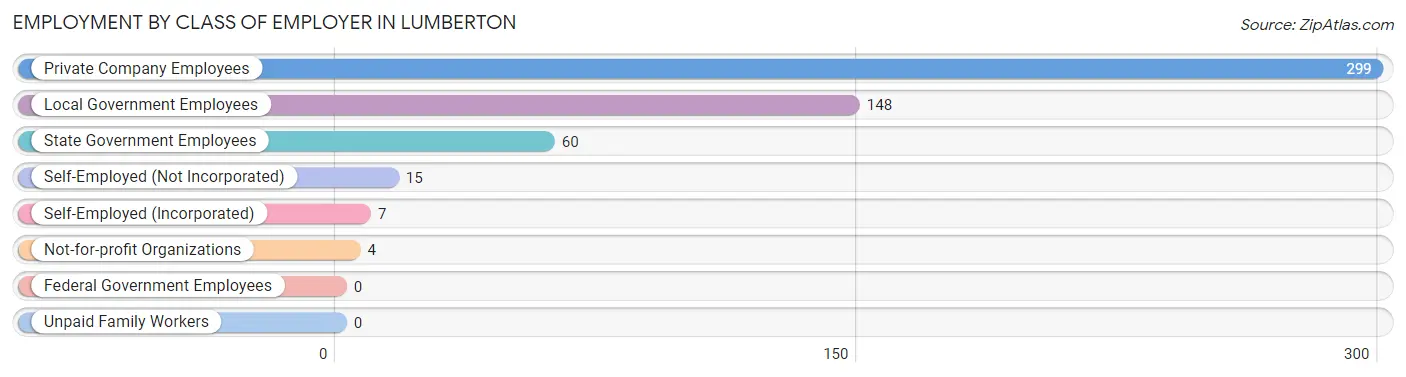
| Employer Class | # Employees | % Employees |
| Private Company Employees | 299 | 56.1% |
| Self-Employed (Incorporated) | 7 | 1.3% |
| Self-Employed (Not Incorporated) | 15 | 2.8% |
| Not-for-profit Organizations | 4 | 0.7% |
| Local Government Employees | 148 | 27.8% |
| State Government Employees | 60 | 11.3% |
| Federal Government Employees | 0 | 0.0% |
| Unpaid Family Workers | 0 | 0.0% |
| Total | 533 | 100.0% |
Employment Status by Age in Lumberton
According to the labor force statistics for Lumberton, out of the total population over 16 years of age (1,207), 55.8% or 674 individuals are in the labor force, with 19.3% or 130 of them unemployed. The age group with the highest labor force participation rate is 25 to 29 years, with 100.0% or 176 individuals in the labor force. Within the labor force, the 30 to 34 years age range has the highest percentage of unemployed individuals, with 52.2% or 24 of them being unemployed.
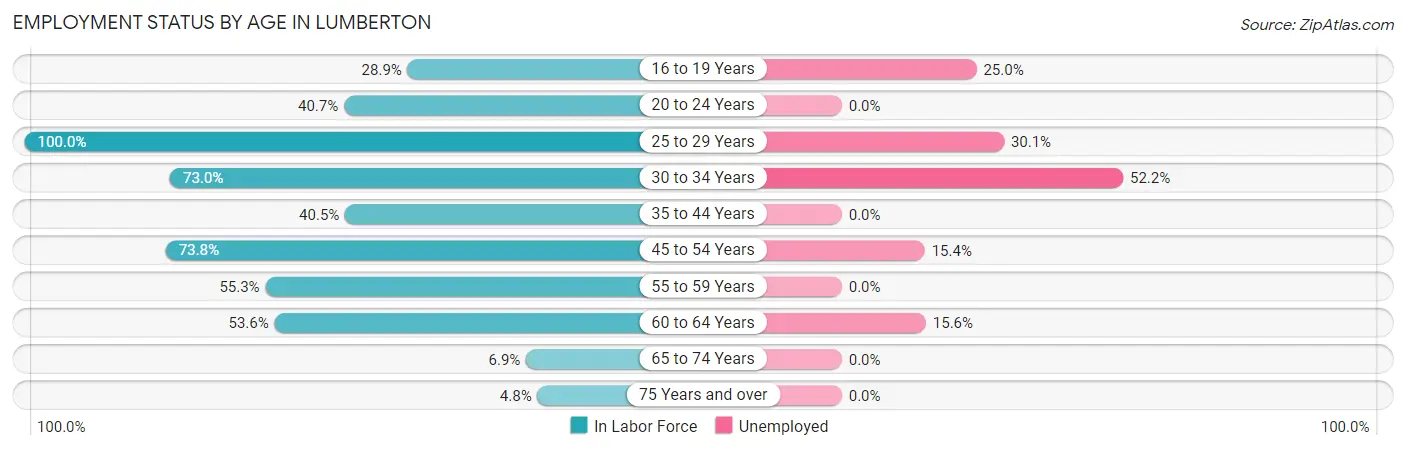
| Age Bracket | In Labor Force | Unemployed |
| 16 to 19 Years | 24 (28.9%) | 6 (25.0%) |
| 20 to 24 Years | 24 (40.7%) | 0 (0.0%) |
| 25 to 29 Years | 176 (100.0%) | 53 (30.1%) |
| 30 to 34 Years | 46 (73.0%) | 24 (52.2%) |
| 35 to 44 Years | 62 (40.5%) | 0 (0.0%) |
| 45 to 54 Years | 259 (73.8%) | 40 (15.4%) |
| 55 to 59 Years | 26 (55.3%) | 0 (0.0%) |
| 60 to 64 Years | 45 (53.6%) | 7 (15.6%) |
| 65 to 74 Years | 6 (6.9%) | 0 (0.0%) |
| 75 Years and over | 5 (4.8%) | 0 (0.0%) |
| Total | 674 (55.8%) | 130 (19.3%) |
Employment Status by Educational Attainment in Lumberton
According to labor force statistics for Lumberton, 70.3% of individuals (614) out of the total population between 25 and 64 years of age (874) are in the labor force, with 20.2% or 124 of them being unemployed. The group with the highest labor force participation rate are those with the educational attainment of bachelor's degree or higher, with 100.0% or 94 individuals in the labor force. Within the labor force, individuals with college / associate degree education have the highest percentage of unemployment, with 27.5% or 95 of them being unemployed.
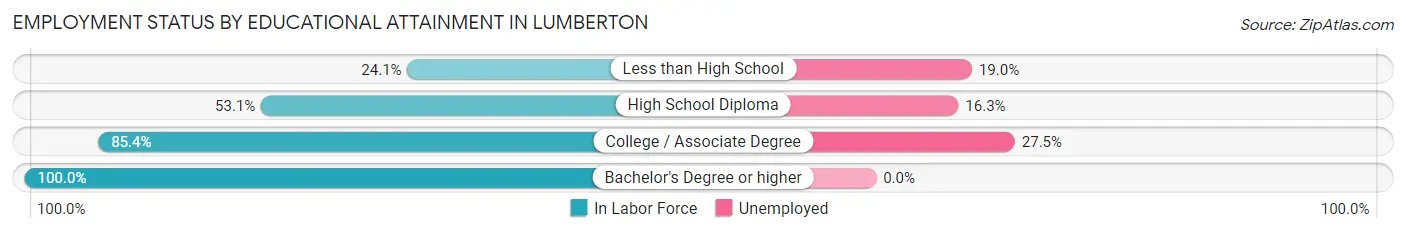
| Educational Attainment | In Labor Force | Unemployed |
| Less than High School | 21 (24.1%) | 17 (19.0%) |
| High School Diploma | 153 (53.1%) | 47 (16.3%) |
| College / Associate Degree | 346 (85.4%) | 111 (27.5%) |
| Bachelor's Degree or higher | 94 (100.0%) | 0 (0.0%) |
| Total | 614 (70.3%) | 177 (20.2%) |
Employment Occupations by Sex in Lumberton
Management, Business, Science and Arts Occupations
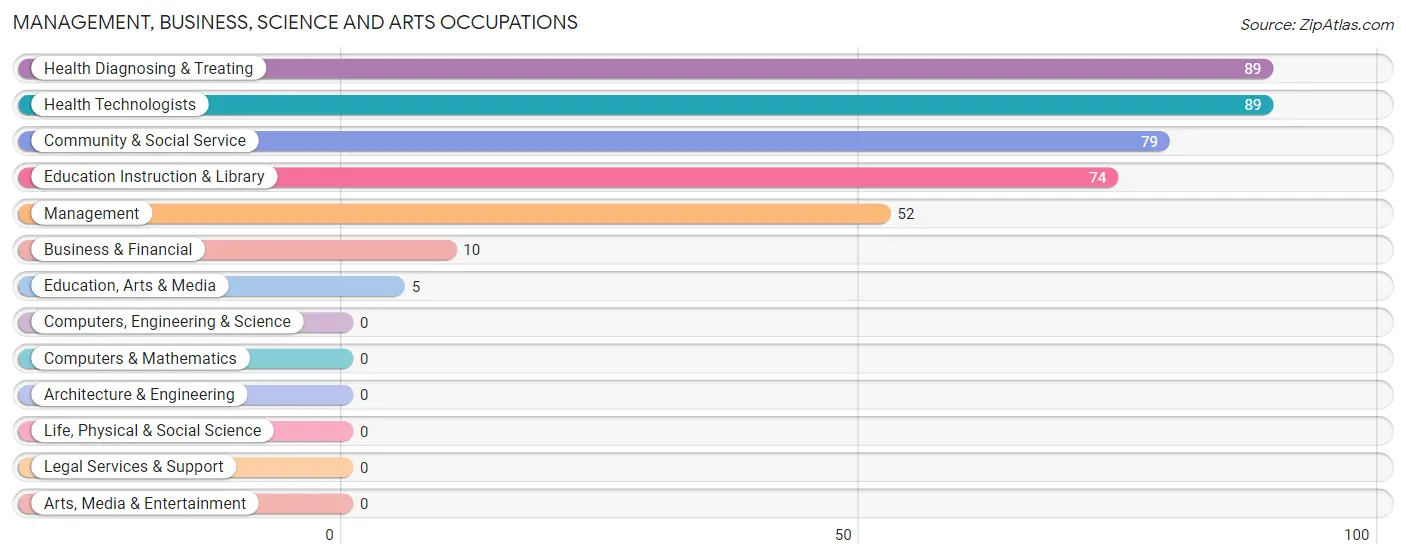
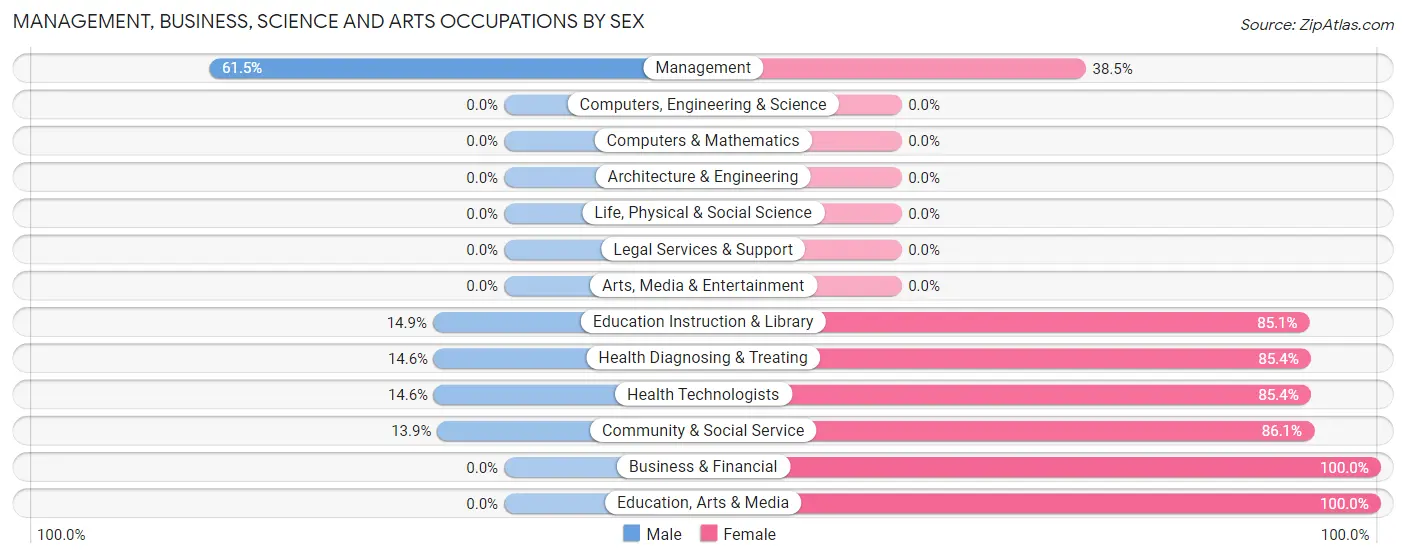
The most common Management, Business, Science and Arts occupations in Lumberton are Health Diagnosing & Treating (89 | 16.4%), Health Technologists (89 | 16.4%), Community & Social Service (79 | 14.5%), Education Instruction & Library (74 | 13.6%), and Management (52 | 9.6%).
Management, Business, Science and Arts Occupations by Sex
Within the Management, Business, Science and Arts occupations in Lumberton, the most male-oriented occupations are Management (61.5%), Education Instruction & Library (14.9%), and Health Diagnosing & Treating (14.6%), while the most female-oriented occupations are Business & Financial (100.0%), Education, Arts & Media (100.0%), and Community & Social Service (86.1%).
| Occupation | Male | Female |
| Management | 32 (61.5%) | 20 (38.5%) |
| Business & Financial | 0 (0.0%) | 10 (100.0%) |
| Computers, Engineering & Science | 0 (0.0%) | 0 (0.0%) |
| Computers & Mathematics | 0 (0.0%) | 0 (0.0%) |
| Architecture & Engineering | 0 (0.0%) | 0 (0.0%) |
| Life, Physical & Social Science | 0 (0.0%) | 0 (0.0%) |
| Community & Social Service | 11 (13.9%) | 68 (86.1%) |
| Education, Arts & Media | 0 (0.0%) | 5 (100.0%) |
| Legal Services & Support | 0 (0.0%) | 0 (0.0%) |
| Education Instruction & Library | 11 (14.9%) | 63 (85.1%) |
| Arts, Media & Entertainment | 0 (0.0%) | 0 (0.0%) |
| Health Diagnosing & Treating | 13 (14.6%) | 76 (85.4%) |
| Health Technologists | 13 (14.6%) | 76 (85.4%) |
| Total (Category) | 56 (24.3%) | 174 (75.6%) |
| Total (Overall) | 227 (41.8%) | 316 (58.2%) |
Services Occupations
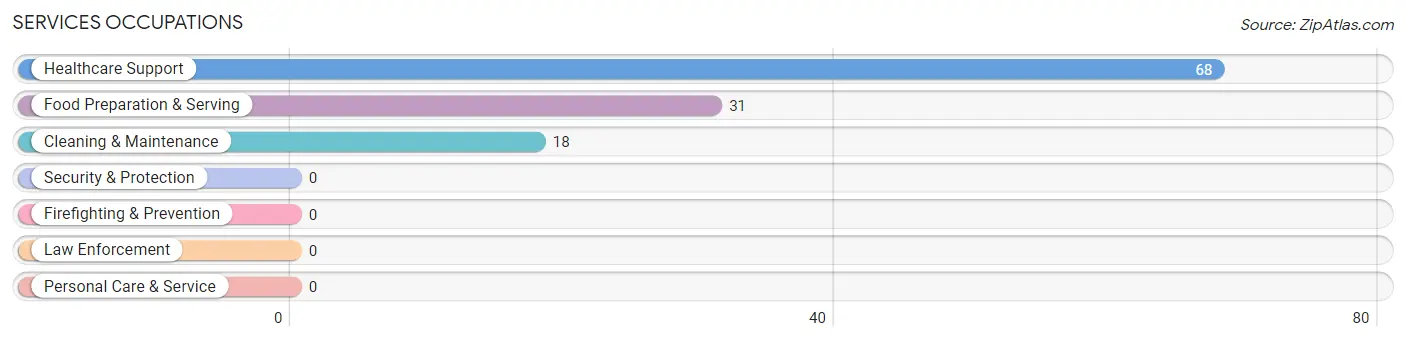
The most common Services occupations in Lumberton are Healthcare Support (68 | 12.5%), Food Preparation & Serving (31 | 5.7%), and Cleaning & Maintenance (18 | 3.3%).
Services Occupations by Sex
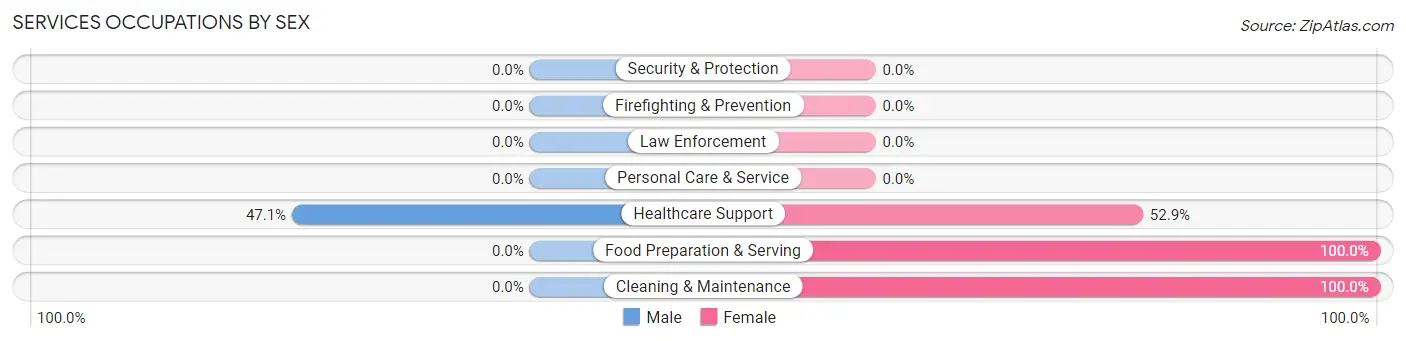
| Occupation | Male | Female |
| Healthcare Support | 32 (47.1%) | 36 (52.9%) |
| Security & Protection | 0 (0.0%) | 0 (0.0%) |
| Firefighting & Prevention | 0 (0.0%) | 0 (0.0%) |
| Law Enforcement | 0 (0.0%) | 0 (0.0%) |
| Food Preparation & Serving | 0 (0.0%) | 31 (100.0%) |
| Cleaning & Maintenance | 0 (0.0%) | 18 (100.0%) |
| Personal Care & Service | 0 (0.0%) | 0 (0.0%) |
| Total (Category) | 32 (27.4%) | 85 (72.7%) |
| Total (Overall) | 227 (41.8%) | 316 (58.2%) |
Sales and Office Occupations
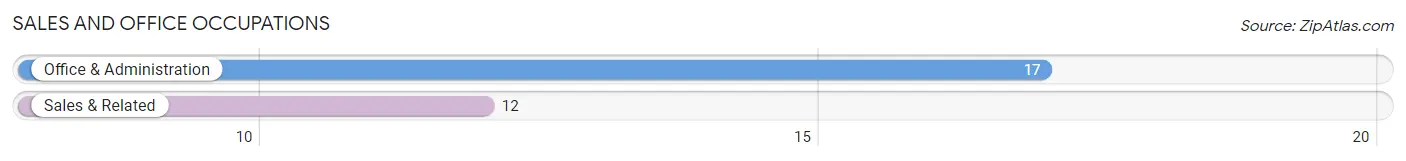
The most common Sales and Office occupations in Lumberton are Office & Administration (17 | 3.1%), and Sales & Related (12 | 2.2%).
Sales and Office Occupations by Sex
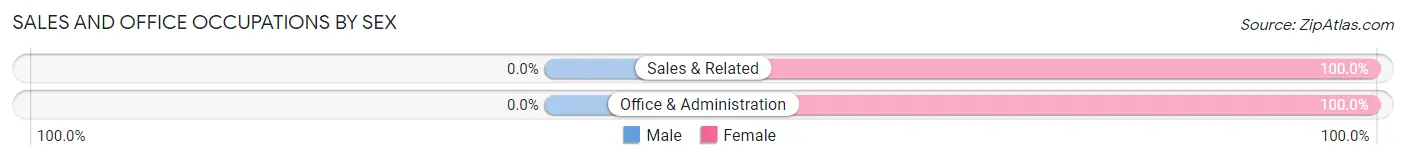
| Occupation | Male | Female |
| Sales & Related | 0 (0.0%) | 12 (100.0%) |
| Office & Administration | 0 (0.0%) | 17 (100.0%) |
| Total (Category) | 0 (0.0%) | 29 (100.0%) |
| Total (Overall) | 227 (41.8%) | 316 (58.2%) |
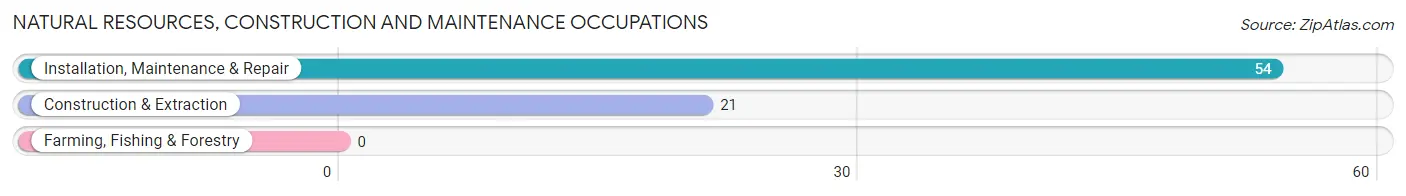
Natural Resources, Construction and Maintenance Occupations
The most common Natural Resources, Construction and Maintenance occupations in Lumberton are Installation, Maintenance & Repair (54 | 9.9%), and Construction & Extraction (21 | 3.9%).
Natural Resources, Construction and Maintenance Occupations by Sex
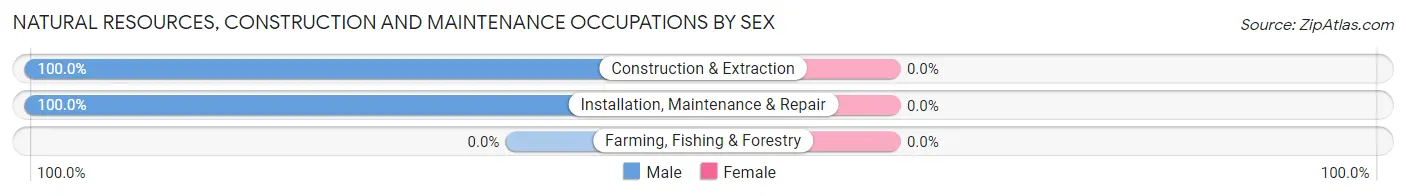
| Occupation | Male | Female |
| Farming, Fishing & Forestry | 0 (0.0%) | 0 (0.0%) |
| Construction & Extraction | 21 (100.0%) | 0 (0.0%) |
| Installation, Maintenance & Repair | 54 (100.0%) | 0 (0.0%) |
| Total (Category) | 75 (100.0%) | 0 (0.0%) |
| Total (Overall) | 227 (41.8%) | 316 (58.2%) |
Production, Transportation and Moving Occupations
The most common Production, Transportation and Moving occupations in Lumberton are Transportation (41 | 7.5%), Production (35 | 6.5%), and Material Moving (16 | 2.9%).
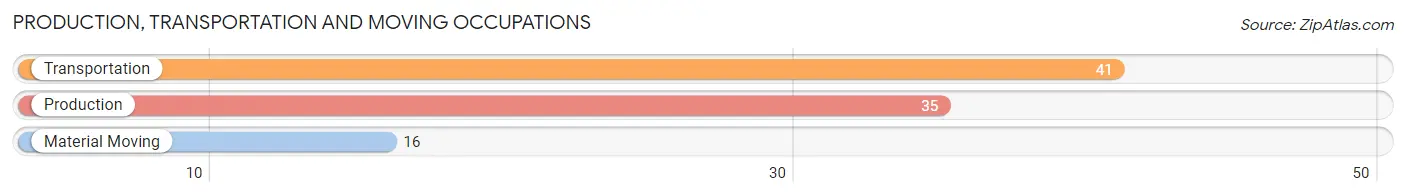
Production, Transportation and Moving Occupations by Sex
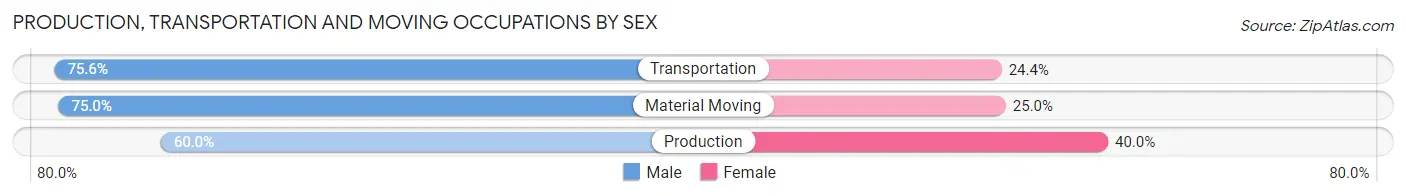
| Occupation | Male | Female |
| Production | 21 (60.0%) | 14 (40.0%) |
| Transportation | 31 (75.6%) | 10 (24.4%) |
| Material Moving | 12 (75.0%) | 4 (25.0%) |
| Total (Category) | 64 (69.6%) | 28 (30.4%) |
| Total (Overall) | 227 (41.8%) | 316 (58.2%) |
Employment Industries by Sex in Lumberton
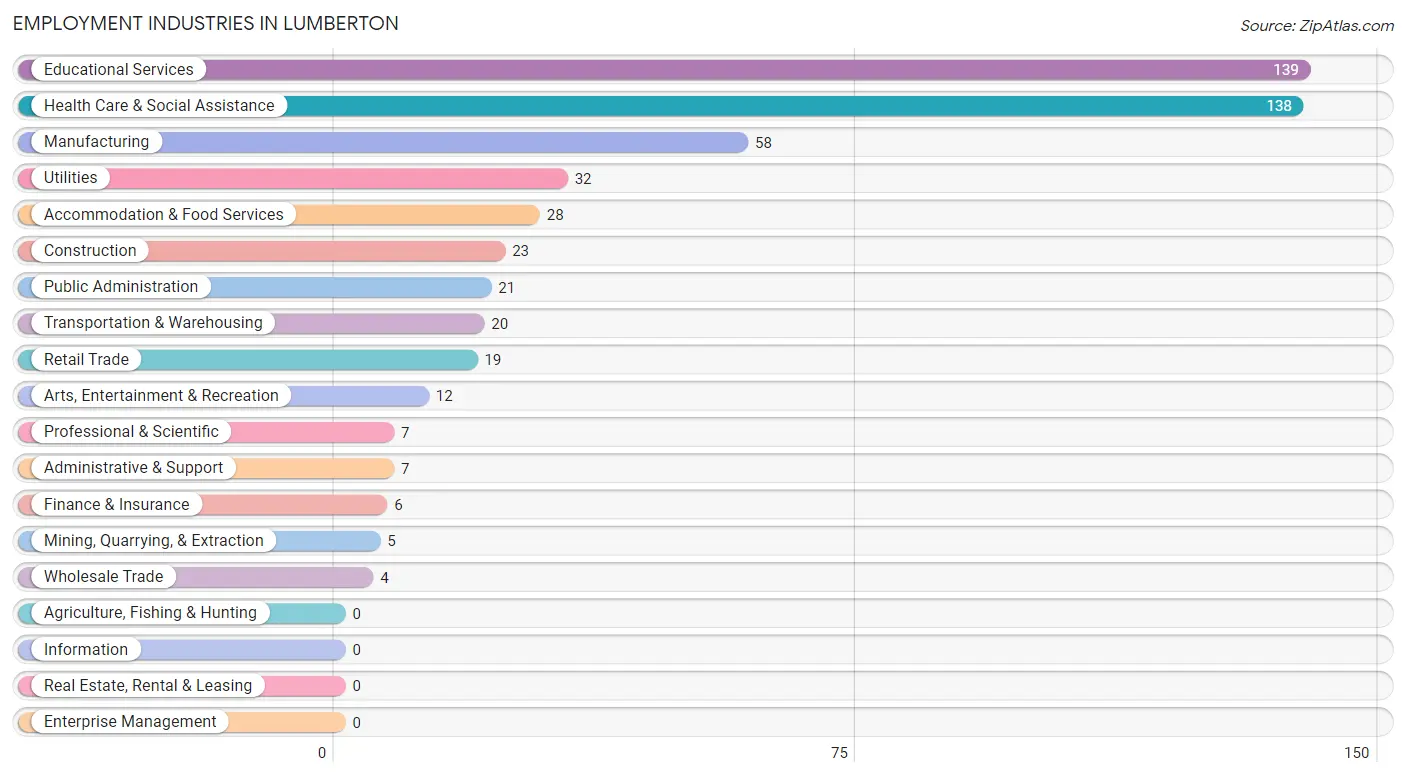
Employment Industries in Lumberton
The major employment industries in Lumberton include Educational Services (139 | 25.6%), Health Care & Social Assistance (138 | 25.4%), Manufacturing (58 | 10.7%), Utilities (32 | 5.9%), and Accommodation & Food Services (28 | 5.2%).
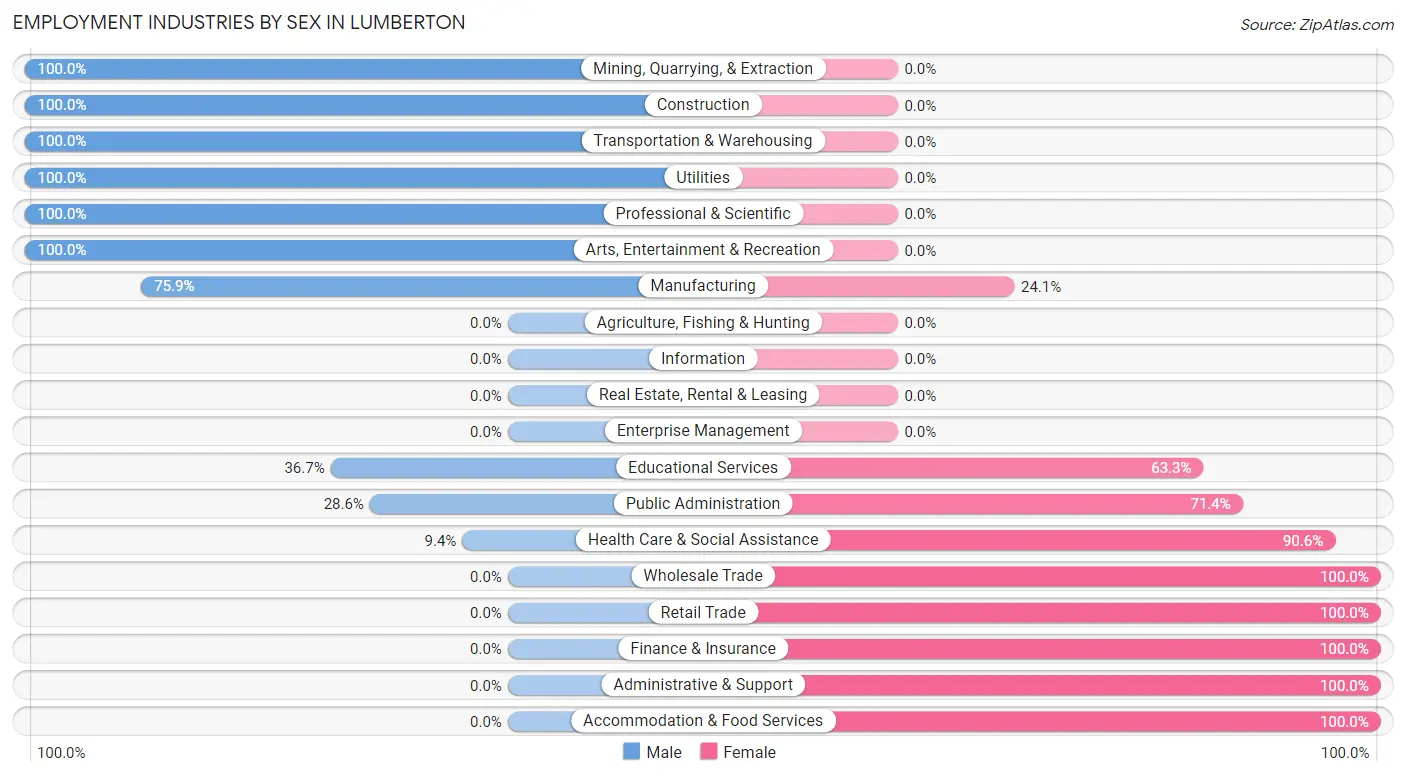
Employment Industries by Sex in Lumberton
The Lumberton industries that see more men than women are Mining, Quarrying, & Extraction (100.0%), Construction (100.0%), and Transportation & Warehousing (100.0%), whereas the industries that tend to have a higher number of women are Wholesale Trade (100.0%), Retail Trade (100.0%), and Finance & Insurance (100.0%).
| Industry | Male | Female |
| Agriculture, Fishing & Hunting | 0 (0.0%) | 0 (0.0%) |
| Mining, Quarrying, & Extraction | 5 (100.0%) | 0 (0.0%) |
| Construction | 23 (100.0%) | 0 (0.0%) |
| Manufacturing | 44 (75.9%) | 14 (24.1%) |
| Wholesale Trade | 0 (0.0%) | 4 (100.0%) |
| Retail Trade | 0 (0.0%) | 19 (100.0%) |
| Transportation & Warehousing | 20 (100.0%) | 0 (0.0%) |
| Utilities | 32 (100.0%) | 0 (0.0%) |
| Information | 0 (0.0%) | 0 (0.0%) |
| Finance & Insurance | 0 (0.0%) | 6 (100.0%) |
| Real Estate, Rental & Leasing | 0 (0.0%) | 0 (0.0%) |
| Professional & Scientific | 7 (100.0%) | 0 (0.0%) |
| Enterprise Management | 0 (0.0%) | 0 (0.0%) |
| Administrative & Support | 0 (0.0%) | 7 (100.0%) |
| Educational Services | 51 (36.7%) | 88 (63.3%) |
| Health Care & Social Assistance | 13 (9.4%) | 125 (90.6%) |
| Arts, Entertainment & Recreation | 12 (100.0%) | 0 (0.0%) |
| Accommodation & Food Services | 0 (0.0%) | 28 (100.0%) |
| Public Administration | 6 (28.6%) | 15 (71.4%) |
| Total | 227 (41.8%) | 316 (58.2%) |
Education in Lumberton
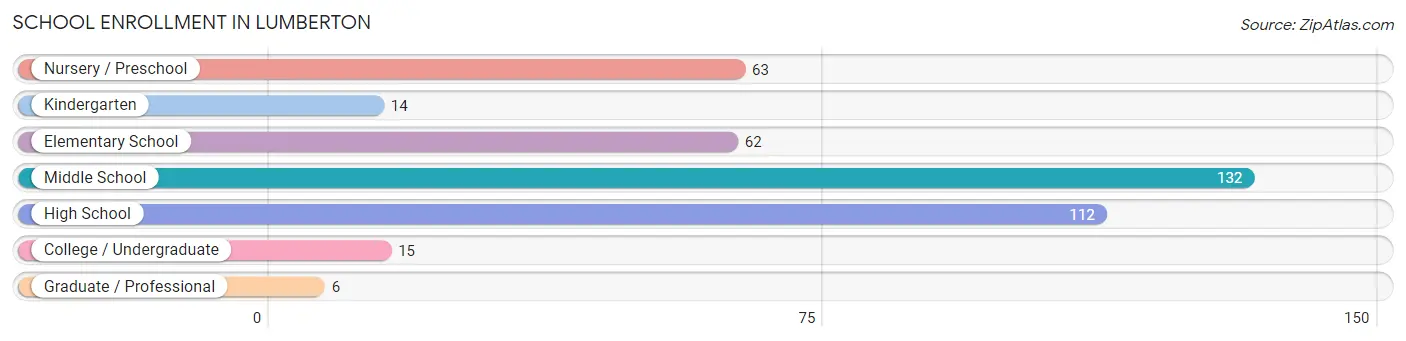
School Enrollment in Lumberton
The most common levels of schooling among the 404 students in Lumberton are middle school (132 | 32.7%), high school (112 | 27.7%), and nursery / preschool (63 | 15.6%).
| School Level | # Students | % Students |
| Nursery / Preschool | 63 | 15.6% |
| Kindergarten | 14 | 3.5% |
| Elementary School | 62 | 15.3% |
| Middle School | 132 | 32.7% |
| High School | 112 | 27.7% |
| College / Undergraduate | 15 | 3.7% |
| Graduate / Professional | 6 | 1.5% |
| Total | 404 | 100.0% |
School Enrollment by Age by Funding Source in Lumberton
Out of a total of 404 students who are enrolled in schools in Lumberton, 22 (5.4%) attend a private institution, while the remaining 382 (94.6%) are enrolled in public schools. The age group of 15 to 17 year olds has the highest likelihood of being enrolled in private schools, with 8 (19.1% in the age bracket) enrolled. Conversely, the age group of 5 to 9 year old has the lowest likelihood of being enrolled in a private school, with 82 (100.0% in the age bracket) attending a public institution.
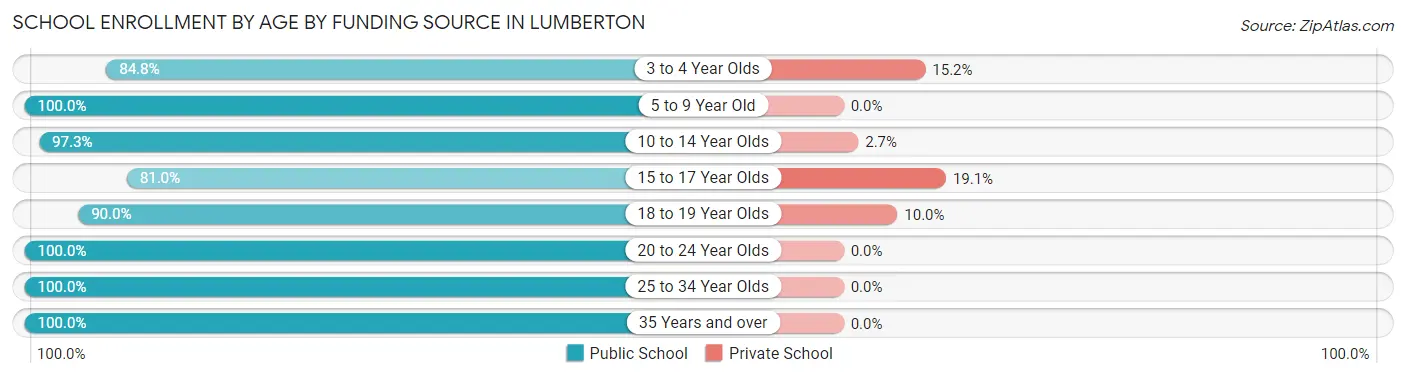
| Age Bracket | Public School | Private School |
| 3 to 4 Year Olds | 39 (84.8%) | 7 (15.2%) |
| 5 to 9 Year Old | 82 (100.0%) | 0 (0.0%) |
| 10 to 14 Year Olds | 179 (97.3%) | 5 (2.7%) |
| 15 to 17 Year Olds | 34 (80.9%) | 8 (19.1%) |
| 18 to 19 Year Olds | 18 (90.0%) | 2 (10.0%) |
| 20 to 24 Year Olds | 6 (100.0%) | 0 (0.0%) |
| 25 to 34 Year Olds | 18 (100.0%) | 0 (0.0%) |
| 35 Years and over | 6 (100.0%) | 0 (0.0%) |
| Total | 382 (94.6%) | 22 (5.4%) |
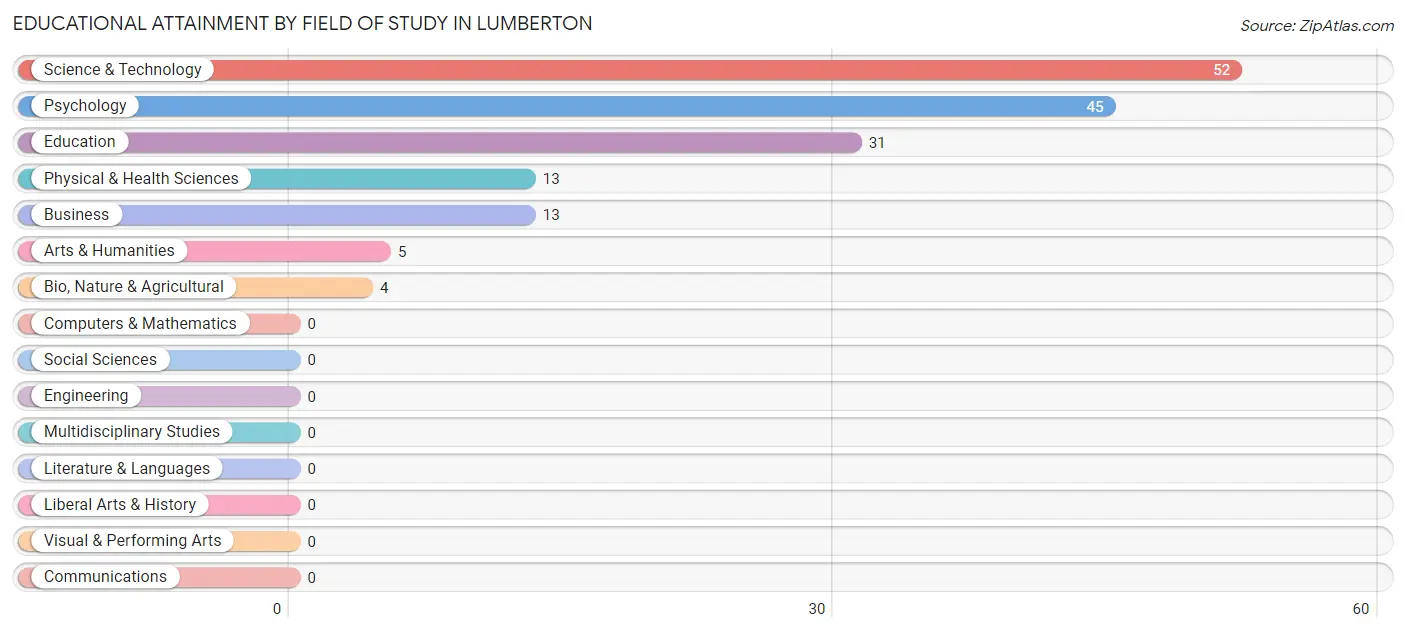
Educational Attainment by Field of Study in Lumberton
Science & technology (52 | 31.9%), psychology (45 | 27.6%), education (31 | 19.0%), physical & health sciences (13 | 8.0%), and business (13 | 8.0%) are the most common fields of study among 163 individuals in Lumberton who have obtained a bachelor's degree or higher.
| Field of Study | # Graduates | % Graduates |
| Computers & Mathematics | 0 | 0.0% |
| Bio, Nature & Agricultural | 4 | 2.5% |
| Physical & Health Sciences | 13 | 8.0% |
| Psychology | 45 | 27.6% |
| Social Sciences | 0 | 0.0% |
| Engineering | 0 | 0.0% |
| Multidisciplinary Studies | 0 | 0.0% |
| Science & Technology | 52 | 31.9% |
| Business | 13 | 8.0% |
| Education | 31 | 19.0% |
| Literature & Languages | 0 | 0.0% |
| Liberal Arts & History | 0 | 0.0% |
| Visual & Performing Arts | 0 | 0.0% |
| Communications | 0 | 0.0% |
| Arts & Humanities | 5 | 3.1% |
| Total | 163 | 100.0% |
Transportation & Commute in Lumberton
Vehicle Availability by Sex in Lumberton
The most prevalent vehicle ownership categories in Lumberton are males with 2 vehicles (68, accounting for 31.3%) and females with 2 vehicles (128, making up 21.5%).
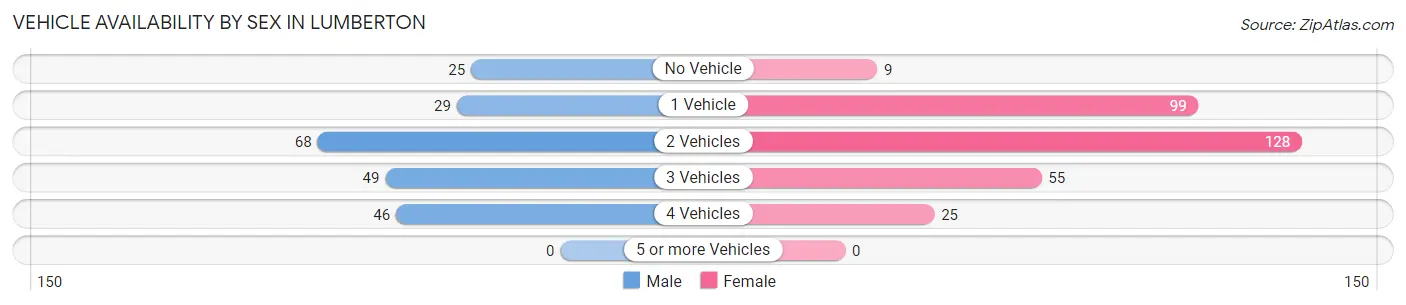
| Vehicles Available | Male | Female |
| No Vehicle | 25 (11.5%) | 9 (2.9%) |
| 1 Vehicle | 29 (13.4%) | 99 (31.3%) |
| 2 Vehicles | 68 (31.3%) | 128 (40.5%) |
| 3 Vehicles | 49 (22.6%) | 55 (17.4%) |
| 4 Vehicles | 46 (21.2%) | 25 (7.9%) |
| 5 or more Vehicles | 0 (0.0%) | 0 (0.0%) |
| Total | 217 (100.0%) | 316 (100.0%) |
Commute Time in Lumberton
The most frequently occuring commute durations in Lumberton are 30 to 34 minutes (120 commuters, 22.5%), 15 to 19 minutes (98 commuters, 18.4%), and 40 to 44 minutes (61 commuters, 11.4%).
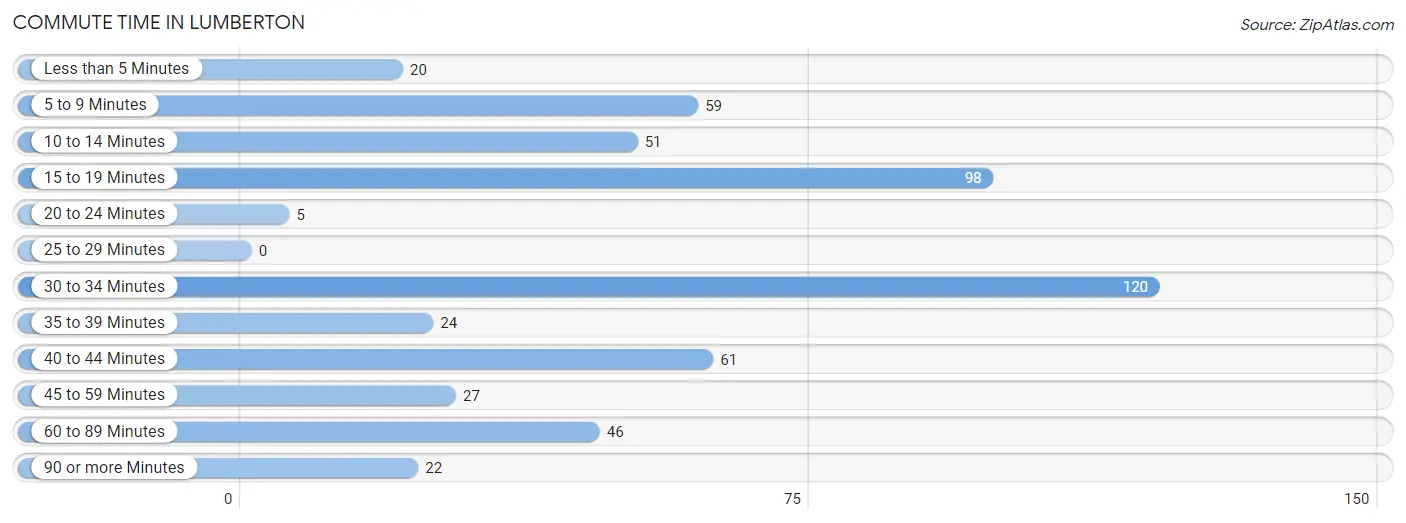
| Commute Time | # Commuters | % Commuters |
| Less than 5 Minutes | 20 | 3.7% |
| 5 to 9 Minutes | 59 | 11.1% |
| 10 to 14 Minutes | 51 | 9.6% |
| 15 to 19 Minutes | 98 | 18.4% |
| 20 to 24 Minutes | 5 | 0.9% |
| 25 to 29 Minutes | 0 | 0.0% |
| 30 to 34 Minutes | 120 | 22.5% |
| 35 to 39 Minutes | 24 | 4.5% |
| 40 to 44 Minutes | 61 | 11.4% |
| 45 to 59 Minutes | 27 | 5.1% |
| 60 to 89 Minutes | 46 | 8.6% |
| 90 or more Minutes | 22 | 4.1% |
Commute Time by Sex in Lumberton
The most common commute times in Lumberton are 30 to 34 minutes (45 commuters, 20.7%) for males and 30 to 34 minutes (75 commuters, 23.7%) for females.
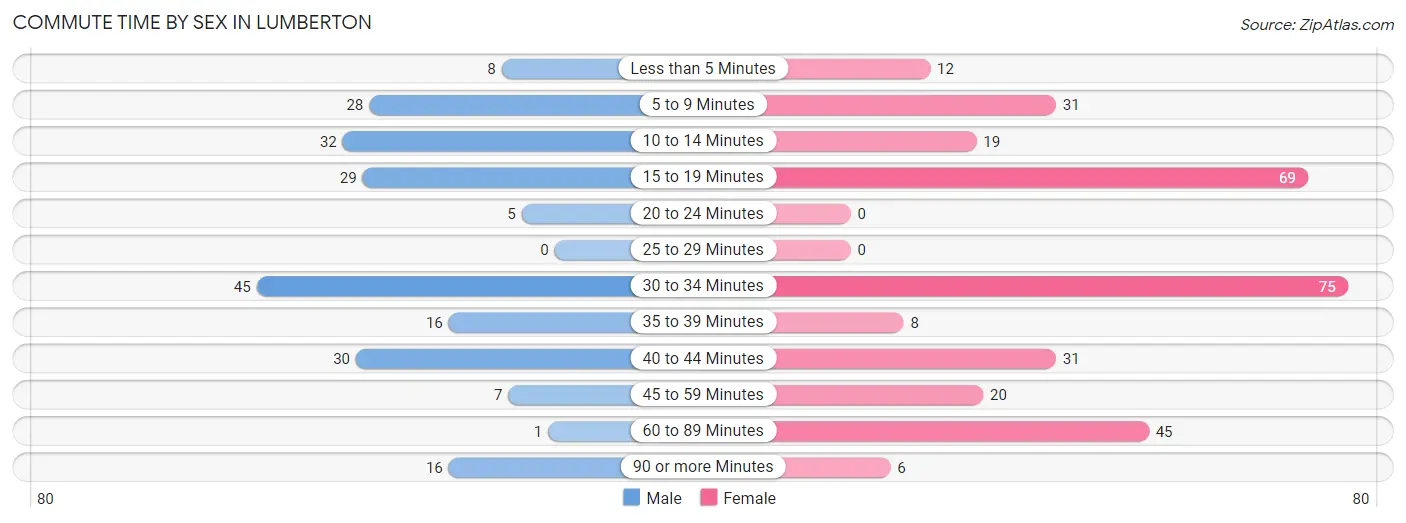
| Commute Time | Male | Female |
| Less than 5 Minutes | 8 (3.7%) | 12 (3.8%) |
| 5 to 9 Minutes | 28 (12.9%) | 31 (9.8%) |
| 10 to 14 Minutes | 32 (14.7%) | 19 (6.0%) |
| 15 to 19 Minutes | 29 (13.4%) | 69 (21.8%) |
| 20 to 24 Minutes | 5 (2.3%) | 0 (0.0%) |
| 25 to 29 Minutes | 0 (0.0%) | 0 (0.0%) |
| 30 to 34 Minutes | 45 (20.7%) | 75 (23.7%) |
| 35 to 39 Minutes | 16 (7.4%) | 8 (2.5%) |
| 40 to 44 Minutes | 30 (13.8%) | 31 (9.8%) |
| 45 to 59 Minutes | 7 (3.2%) | 20 (6.3%) |
| 60 to 89 Minutes | 1 (0.5%) | 45 (14.2%) |
| 90 or more Minutes | 16 (7.4%) | 6 (1.9%) |
Time of Departure to Work by Sex in Lumberton
The most frequent times of departure to work in Lumberton are 6:00 AM to 6:29 AM (37, 17.1%) for males and 6:00 AM to 6:29 AM (78, 24.7%) for females.
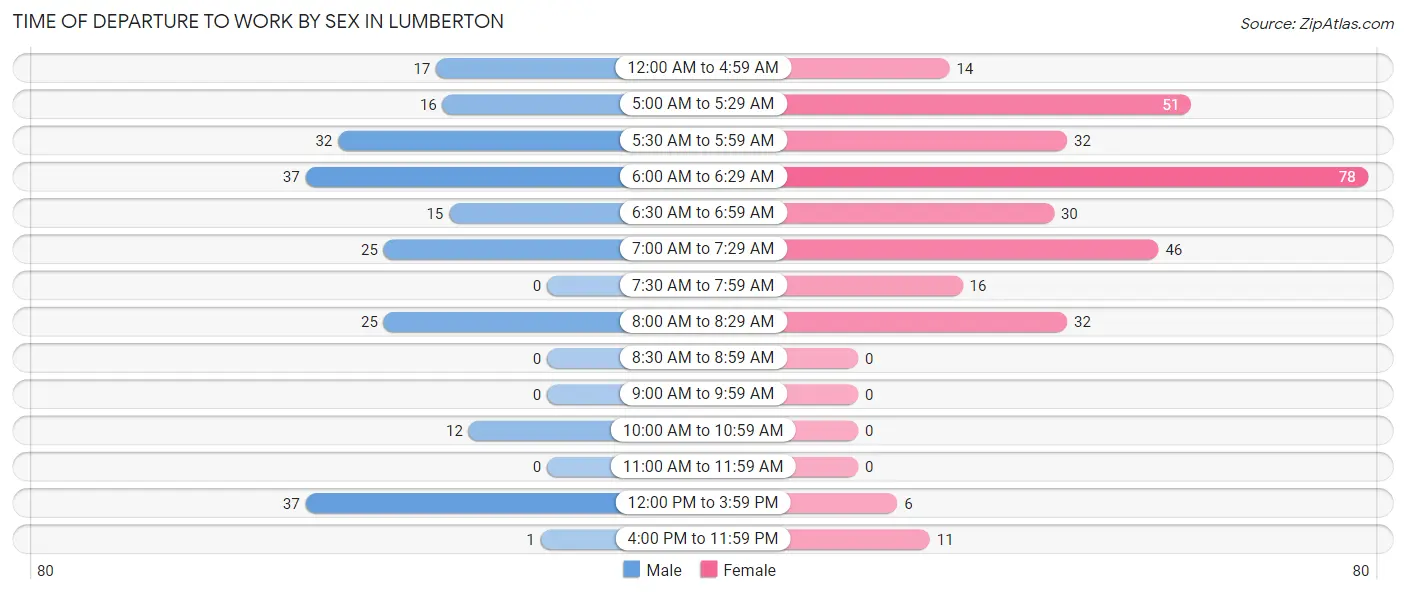
| Time of Departure | Male | Female |
| 12:00 AM to 4:59 AM | 17 (7.8%) | 14 (4.4%) |
| 5:00 AM to 5:29 AM | 16 (7.4%) | 51 (16.1%) |
| 5:30 AM to 5:59 AM | 32 (14.7%) | 32 (10.1%) |
| 6:00 AM to 6:29 AM | 37 (17.1%) | 78 (24.7%) |
| 6:30 AM to 6:59 AM | 15 (6.9%) | 30 (9.5%) |
| 7:00 AM to 7:29 AM | 25 (11.5%) | 46 (14.6%) |
| 7:30 AM to 7:59 AM | 0 (0.0%) | 16 (5.1%) |
| 8:00 AM to 8:29 AM | 25 (11.5%) | 32 (10.1%) |
| 8:30 AM to 8:59 AM | 0 (0.0%) | 0 (0.0%) |
| 9:00 AM to 9:59 AM | 0 (0.0%) | 0 (0.0%) |
| 10:00 AM to 10:59 AM | 12 (5.5%) | 0 (0.0%) |
| 11:00 AM to 11:59 AM | 0 (0.0%) | 0 (0.0%) |
| 12:00 PM to 3:59 PM | 37 (17.1%) | 6 (1.9%) |
| 4:00 PM to 11:59 PM | 1 (0.5%) | 11 (3.5%) |
| Total | 217 (100.0%) | 316 (100.0%) |
Housing Occupancy in Lumberton
Occupancy by Ownership in Lumberton
Of the total 620 dwellings in Lumberton, owner-occupied units account for 278 (44.8%), while renter-occupied units make up 342 (55.2%).
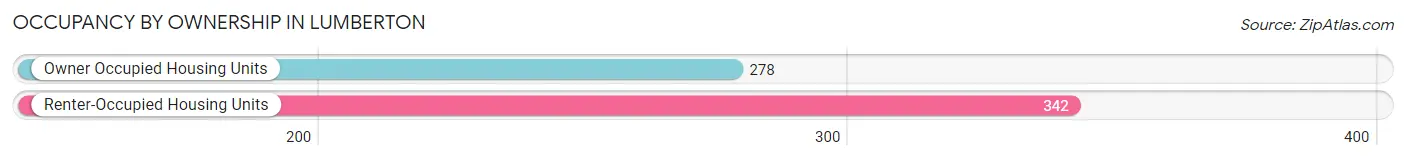
| Occupancy | # Housing Units | % Housing Units |
| Owner Occupied Housing Units | 278 | 44.8% |
| Renter-Occupied Housing Units | 342 | 55.2% |
| Total Occupied Housing Units | 620 | 100.0% |
Occupancy by Household Size in Lumberton
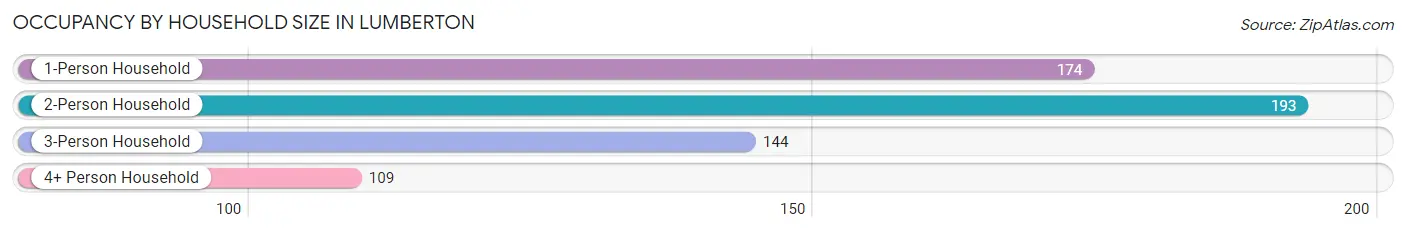
| Household Size | # Housing Units | % Housing Units |
| 1-Person Household | 174 | 28.1% |
| 2-Person Household | 193 | 31.1% |
| 3-Person Household | 144 | 23.2% |
| 4+ Person Household | 109 | 17.6% |
| Total Housing Units | 620 | 100.0% |
Occupancy by Ownership by Household Size in Lumberton
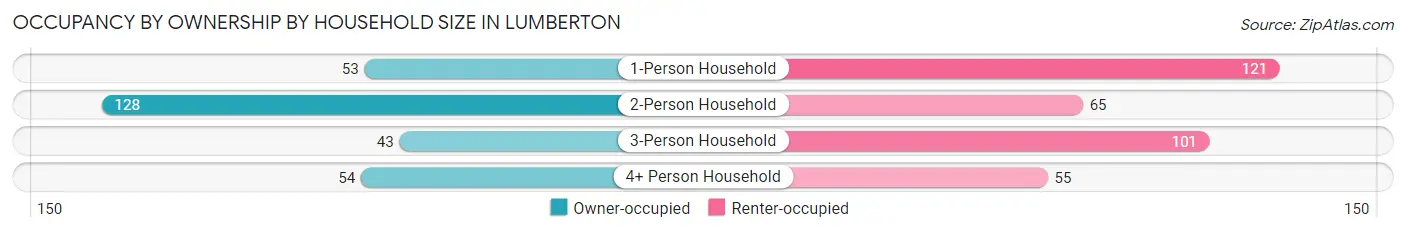
| Household Size | Owner-occupied | Renter-occupied |
| 1-Person Household | 53 (30.5%) | 121 (69.5%) |
| 2-Person Household | 128 (66.3%) | 65 (33.7%) |
| 3-Person Household | 43 (29.9%) | 101 (70.1%) |
| 4+ Person Household | 54 (49.5%) | 55 (50.5%) |
| Total Housing Units | 278 (44.8%) | 342 (55.2%) |
Occupancy by Educational Attainment in Lumberton
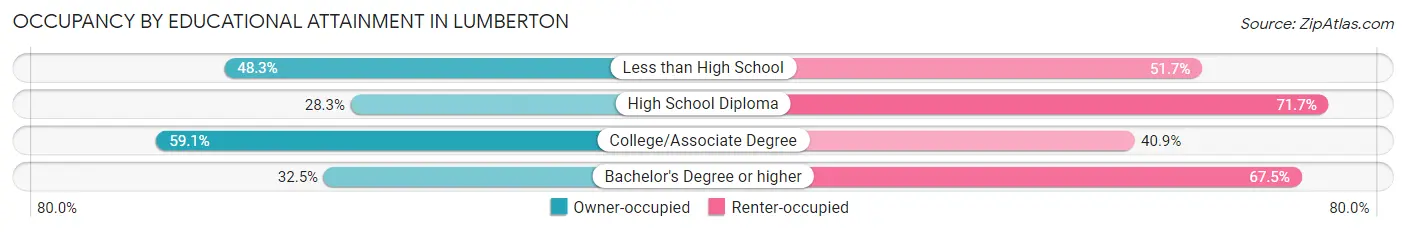
| Household Size | Owner-occupied | Renter-occupied |
| Less than High School | 43 (48.3%) | 46 (51.7%) |
| High School Diploma | 52 (28.3%) | 132 (71.7%) |
| College/Associate Degree | 156 (59.1%) | 108 (40.9%) |
| Bachelor's Degree or higher | 27 (32.5%) | 56 (67.5%) |
Occupancy by Age of Householder in Lumberton
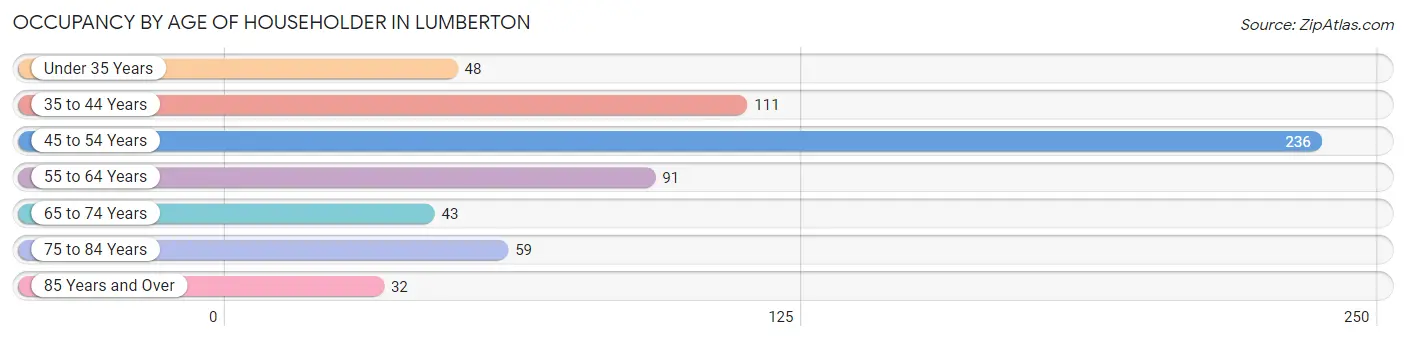
| Age Bracket | # Households | % Households |
| Under 35 Years | 48 | 7.7% |
| 35 to 44 Years | 111 | 17.9% |
| 45 to 54 Years | 236 | 38.1% |
| 55 to 64 Years | 91 | 14.7% |
| 65 to 74 Years | 43 | 6.9% |
| 75 to 84 Years | 59 | 9.5% |
| 85 Years and Over | 32 | 5.2% |
| Total | 620 | 100.0% |
Housing Finances in Lumberton
Median Income by Occupancy in Lumberton
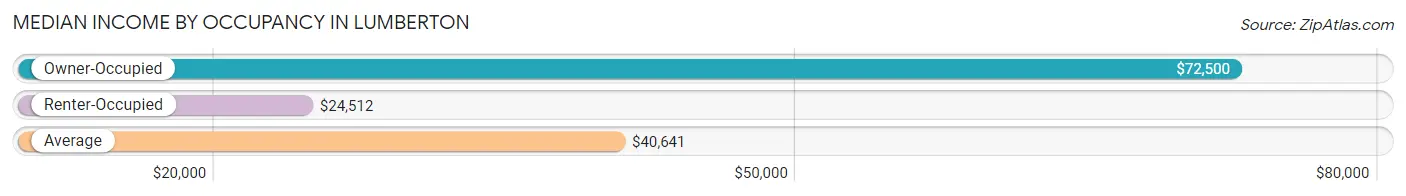
| Occupancy Type | # Households | Median Income |
| Owner-Occupied | 278 (44.8%) | $72,500 |
| Renter-Occupied | 342 (55.2%) | $24,512 |
| Average | 620 (100.0%) | $40,641 |
Occupancy by Householder Income Bracket in Lumberton
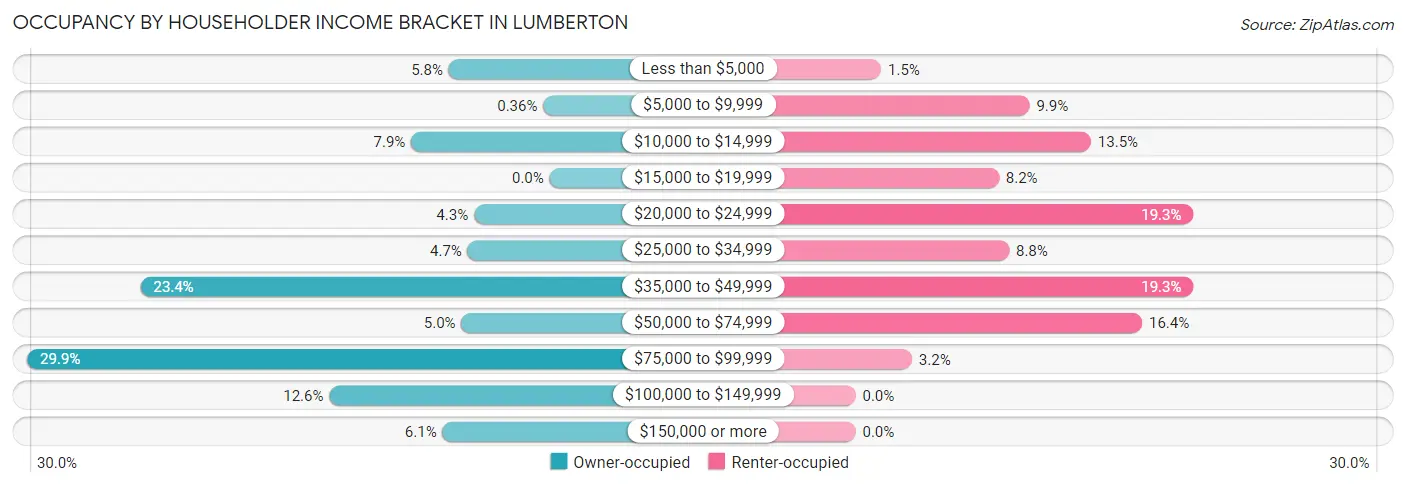
| Income Bracket | Owner-occupied | Renter-occupied |
| Less than $5,000 | 16 (5.8%) | 5 (1.5%) |
| $5,000 to $9,999 | 1 (0.4%) | 34 (9.9%) |
| $10,000 to $14,999 | 22 (7.9%) | 46 (13.5%) |
| $15,000 to $19,999 | 0 (0.0%) | 28 (8.2%) |
| $20,000 to $24,999 | 12 (4.3%) | 66 (19.3%) |
| $25,000 to $34,999 | 13 (4.7%) | 30 (8.8%) |
| $35,000 to $49,999 | 65 (23.4%) | 66 (19.3%) |
| $50,000 to $74,999 | 14 (5.0%) | 56 (16.4%) |
| $75,000 to $99,999 | 83 (29.9%) | 11 (3.2%) |
| $100,000 to $149,999 | 35 (12.6%) | 0 (0.0%) |
| $150,000 or more | 17 (6.1%) | 0 (0.0%) |
| Total | 278 (100.0%) | 342 (100.0%) |
Monthly Housing Cost Tiers in Lumberton
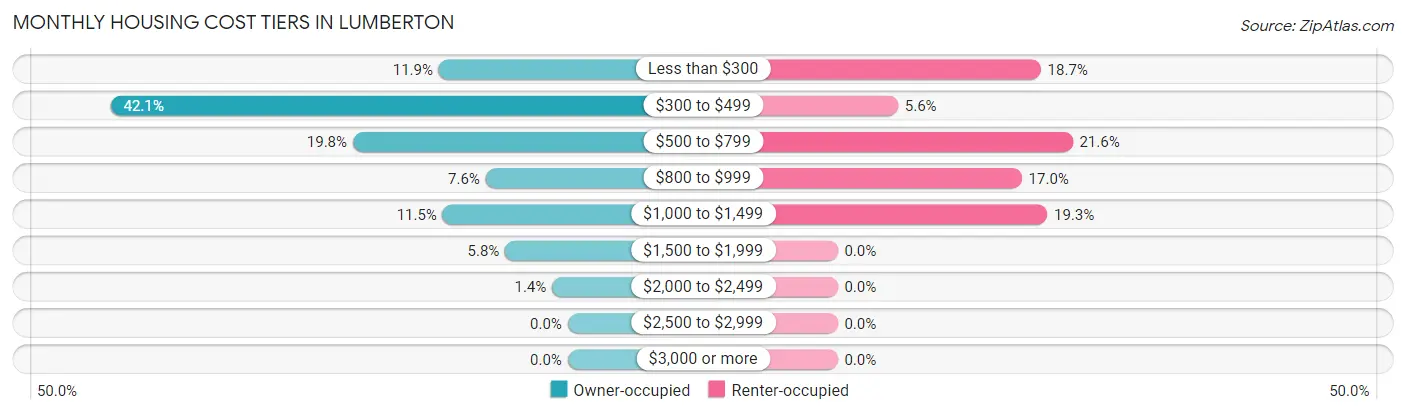
| Monthly Cost | Owner-occupied | Renter-occupied |
| Less than $300 | 33 (11.9%) | 64 (18.7%) |
| $300 to $499 | 117 (42.1%) | 19 (5.6%) |
| $500 to $799 | 55 (19.8%) | 74 (21.6%) |
| $800 to $999 | 21 (7.5%) | 58 (17.0%) |
| $1,000 to $1,499 | 32 (11.5%) | 66 (19.3%) |
| $1,500 to $1,999 | 16 (5.8%) | 0 (0.0%) |
| $2,000 to $2,499 | 4 (1.4%) | 0 (0.0%) |
| $2,500 to $2,999 | 0 (0.0%) | 0 (0.0%) |
| $3,000 or more | 0 (0.0%) | 0 (0.0%) |
| Total | 278 (100.0%) | 342 (100.0%) |
Physical Housing Characteristics in Lumberton
Housing Structures in Lumberton
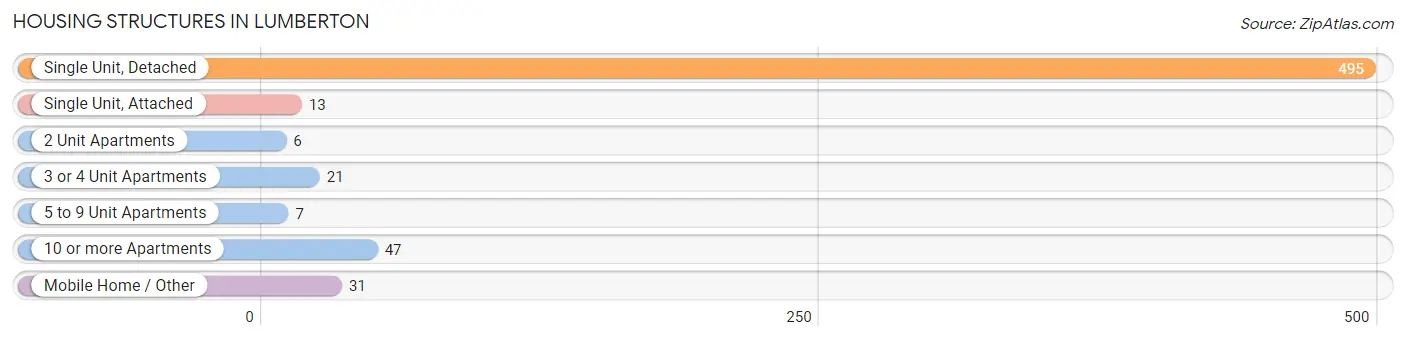
| Structure Type | # Housing Units | % Housing Units |
| Single Unit, Detached | 495 | 79.8% |
| Single Unit, Attached | 13 | 2.1% |
| 2 Unit Apartments | 6 | 1.0% |
| 3 or 4 Unit Apartments | 21 | 3.4% |
| 5 to 9 Unit Apartments | 7 | 1.1% |
| 10 or more Apartments | 47 | 7.6% |
| Mobile Home / Other | 31 | 5.0% |
| Total | 620 | 100.0% |
Housing Structures by Occupancy in Lumberton
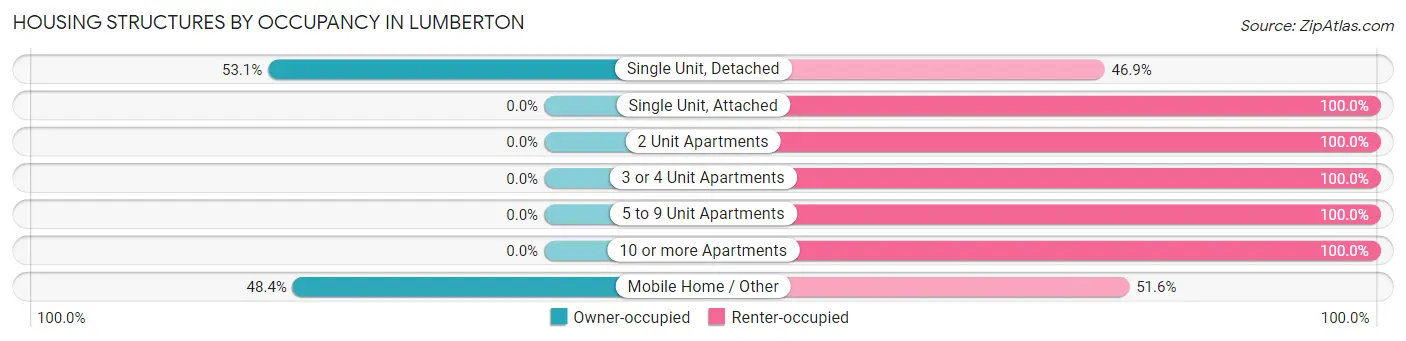
| Structure Type | Owner-occupied | Renter-occupied |
| Single Unit, Detached | 263 (53.1%) | 232 (46.9%) |
| Single Unit, Attached | 0 (0.0%) | 13 (100.0%) |
| 2 Unit Apartments | 0 (0.0%) | 6 (100.0%) |
| 3 or 4 Unit Apartments | 0 (0.0%) | 21 (100.0%) |
| 5 to 9 Unit Apartments | 0 (0.0%) | 7 (100.0%) |
| 10 or more Apartments | 0 (0.0%) | 47 (100.0%) |
| Mobile Home / Other | 15 (48.4%) | 16 (51.6%) |
| Total | 278 (44.8%) | 342 (55.2%) |
Housing Structures by Number of Rooms in Lumberton
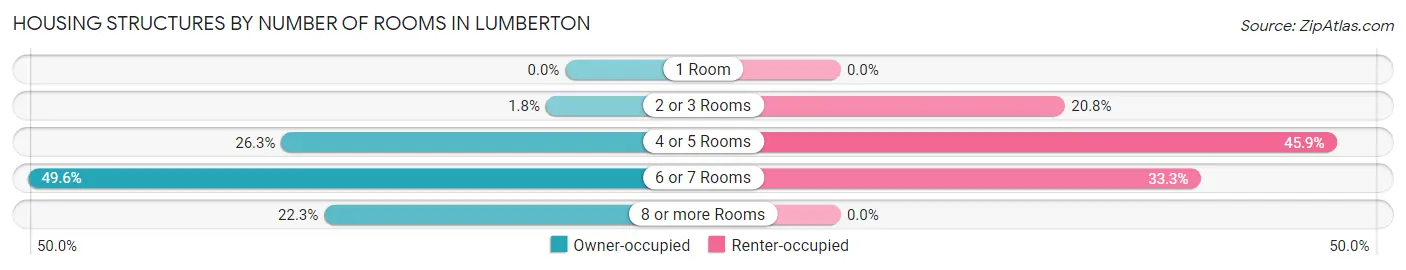
| Number of Rooms | Owner-occupied | Renter-occupied |
| 1 Room | 0 (0.0%) | 0 (0.0%) |
| 2 or 3 Rooms | 5 (1.8%) | 71 (20.8%) |
| 4 or 5 Rooms | 73 (26.3%) | 157 (45.9%) |
| 6 or 7 Rooms | 138 (49.6%) | 114 (33.3%) |
| 8 or more Rooms | 62 (22.3%) | 0 (0.0%) |
| Total | 278 (100.0%) | 342 (100.0%) |
Housing Structure by Heating Type in Lumberton
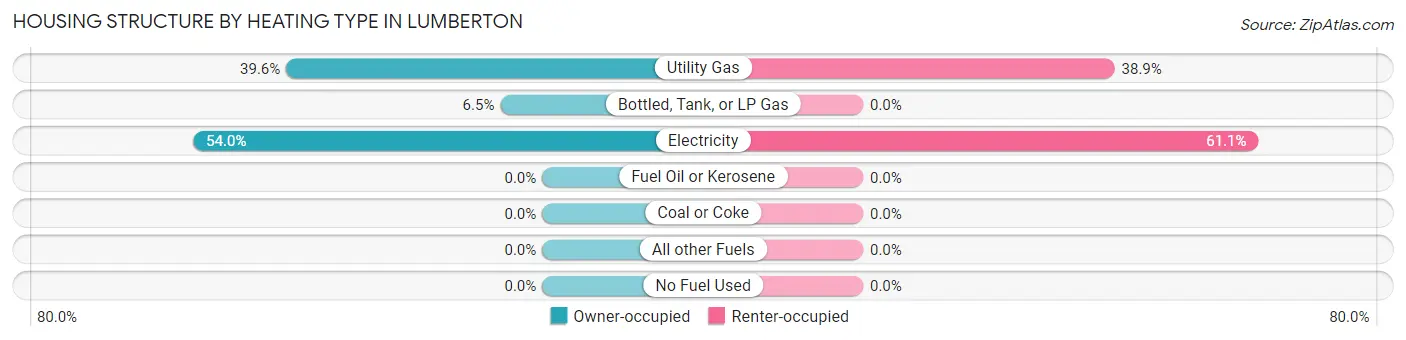
| Heating Type | Owner-occupied | Renter-occupied |
| Utility Gas | 110 (39.6%) | 133 (38.9%) |
| Bottled, Tank, or LP Gas | 18 (6.5%) | 0 (0.0%) |
| Electricity | 150 (54.0%) | 209 (61.1%) |
| Fuel Oil or Kerosene | 0 (0.0%) | 0 (0.0%) |
| Coal or Coke | 0 (0.0%) | 0 (0.0%) |
| All other Fuels | 0 (0.0%) | 0 (0.0%) |
| No Fuel Used | 0 (0.0%) | 0 (0.0%) |
| Total | 278 (100.0%) | 342 (100.0%) |
Household Vehicle Usage in Lumberton
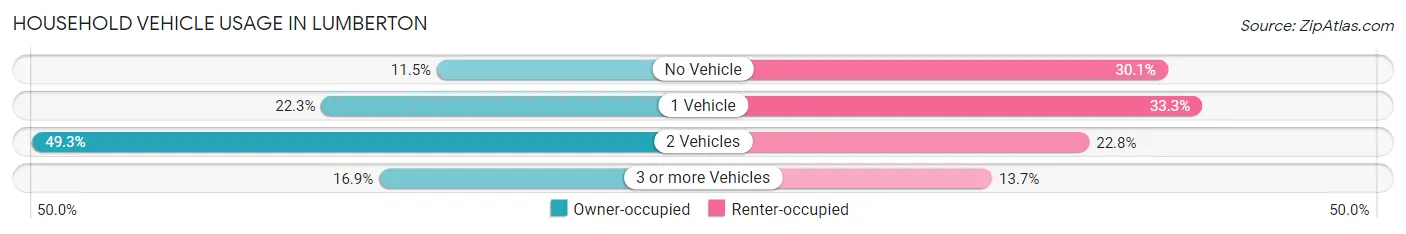
| Vehicles per Household | Owner-occupied | Renter-occupied |
| No Vehicle | 32 (11.5%) | 103 (30.1%) |
| 1 Vehicle | 62 (22.3%) | 114 (33.3%) |
| 2 Vehicles | 137 (49.3%) | 78 (22.8%) |
| 3 or more Vehicles | 47 (16.9%) | 47 (13.7%) |
| Total | 278 (100.0%) | 342 (100.0%) |
Real Estate & Mortgages in Lumberton
Real Estate and Mortgage Overview in Lumberton
| Characteristic | Without Mortgage | With Mortgage |
| Housing Units | 157 | 121 |
| Median Property Value | $39,400 | $89,700 |
| Median Household Income | $60,625 | $17 |
| Monthly Housing Costs | $419 | $0 |
| Real Estate Taxes | $893 | $22 |
Property Value by Mortgage Status in Lumberton
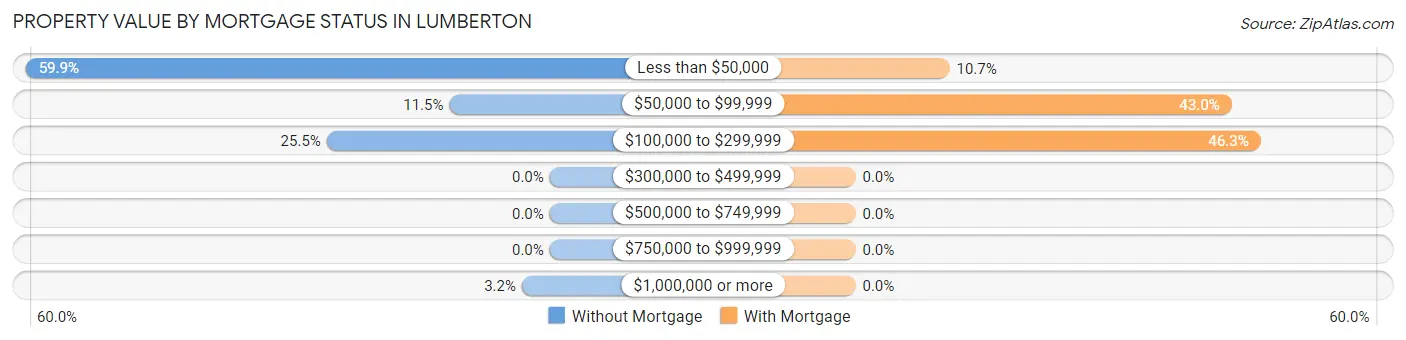
| Property Value | Without Mortgage | With Mortgage |
| Less than $50,000 | 94 (59.9%) | 13 (10.7%) |
| $50,000 to $99,999 | 18 (11.5%) | 52 (43.0%) |
| $100,000 to $299,999 | 40 (25.5%) | 56 (46.3%) |
| $300,000 to $499,999 | 0 (0.0%) | 0 (0.0%) |
| $500,000 to $749,999 | 0 (0.0%) | 0 (0.0%) |
| $750,000 to $999,999 | 0 (0.0%) | 0 (0.0%) |
| $1,000,000 or more | 5 (3.2%) | 0 (0.0%) |
| Total | 157 (100.0%) | 121 (100.0%) |
Household Income by Mortgage Status in Lumberton
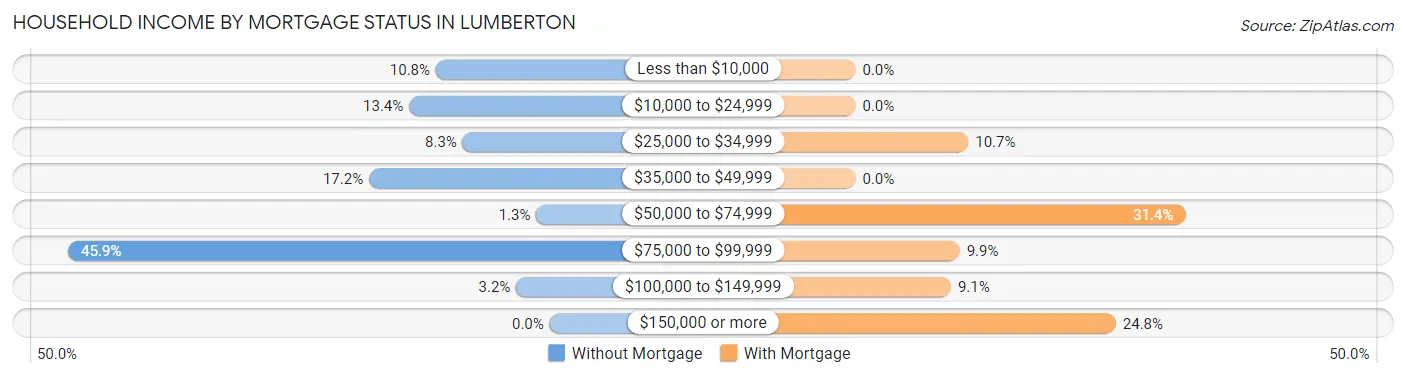
| Household Income | Without Mortgage | With Mortgage |
| Less than $10,000 | 17 (10.8%) | 0 (0.0%) |
| $10,000 to $24,999 | 21 (13.4%) | 0 (0.0%) |
| $25,000 to $34,999 | 13 (8.3%) | 13 (10.7%) |
| $35,000 to $49,999 | 27 (17.2%) | 0 (0.0%) |
| $50,000 to $74,999 | 2 (1.3%) | 38 (31.4%) |
| $75,000 to $99,999 | 72 (45.9%) | 12 (9.9%) |
| $100,000 to $149,999 | 5 (3.2%) | 11 (9.1%) |
| $150,000 or more | 0 (0.0%) | 30 (24.8%) |
| Total | 157 (100.0%) | 121 (100.0%) |
Property Value to Household Income Ratio in Lumberton
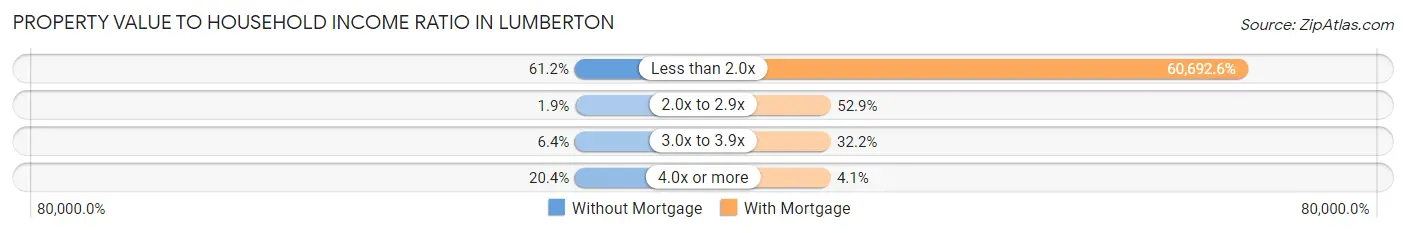
| Value-to-Income Ratio | Without Mortgage | With Mortgage |
| Less than 2.0x | 96 (61.2%) | 73,438 (60,692.6%) |
| 2.0x to 2.9x | 3 (1.9%) | 64 (52.9%) |
| 3.0x to 3.9x | 10 (6.4%) | 39 (32.2%) |
| 4.0x or more | 32 (20.4%) | 5 (4.1%) |
| Total | 157 (100.0%) | 121 (100.0%) |
Real Estate Taxes by Mortgage Status in Lumberton
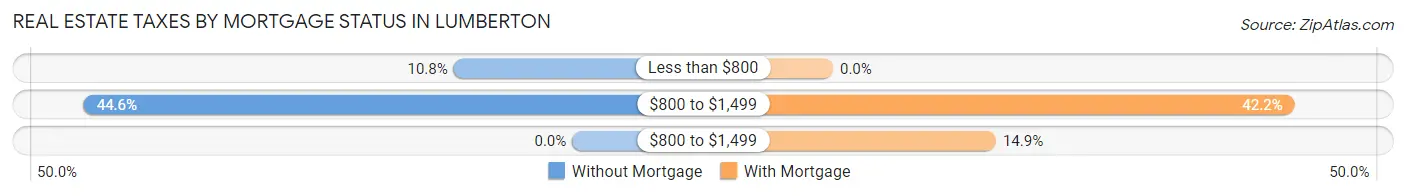
| Property Taxes | Without Mortgage | With Mortgage |
| Less than $800 | 17 (10.8%) | 0 (0.0%) |
| $800 to $1,499 | 70 (44.6%) | 51 (42.1%) |
| $800 to $1,499 | 0 (0.0%) | 18 (14.9%) |
| Total | 157 (100.0%) | 121 (100.0%) |
Health & Disability in Lumberton
Health Insurance Coverage by Age in Lumberton
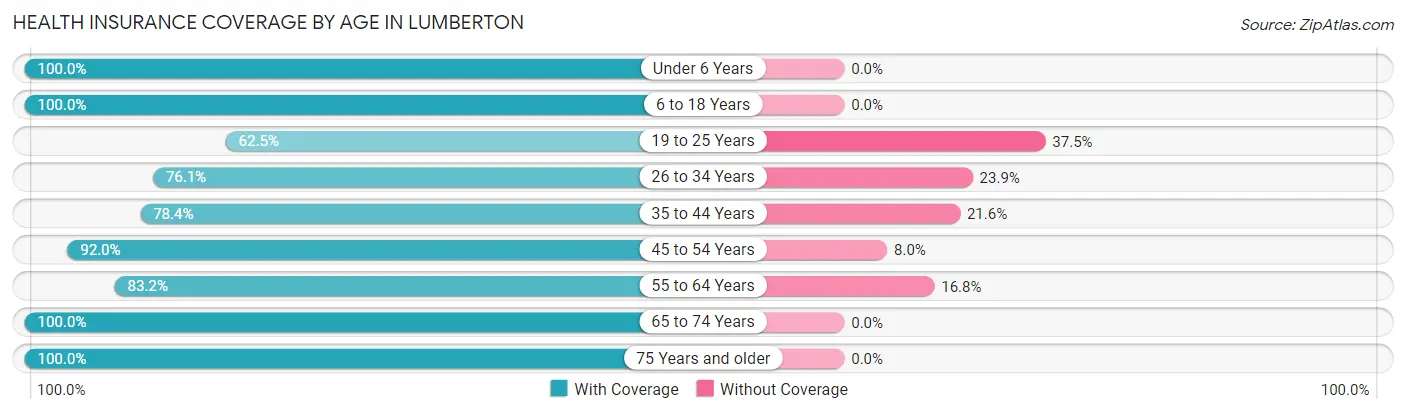
| Age Bracket | With Coverage | Without Coverage |
| Under 6 Years | 123 (100.0%) | 0 (0.0%) |
| 6 to 18 Years | 299 (100.0%) | 0 (0.0%) |
| 19 to 25 Years | 70 (62.5%) | 42 (37.5%) |
| 26 to 34 Years | 162 (76.1%) | 51 (23.9%) |
| 35 to 44 Years | 120 (78.4%) | 33 (21.6%) |
| 45 to 54 Years | 323 (92.0%) | 28 (8.0%) |
| 55 to 64 Years | 109 (83.2%) | 22 (16.8%) |
| 65 to 74 Years | 87 (100.0%) | 0 (0.0%) |
| 75 Years and older | 104 (100.0%) | 0 (0.0%) |
| Total | 1,397 (88.8%) | 176 (11.2%) |
Health Insurance Coverage by Citizenship Status in Lumberton

| Citizenship Status | With Coverage | Without Coverage |
| Native Born | 123 (100.0%) | 0 (0.0%) |
| Foreign Born, Citizen | 299 (100.0%) | 0 (0.0%) |
| Foreign Born, not a Citizen | 70 (62.5%) | 42 (37.5%) |
Health Insurance Coverage by Household Income in Lumberton
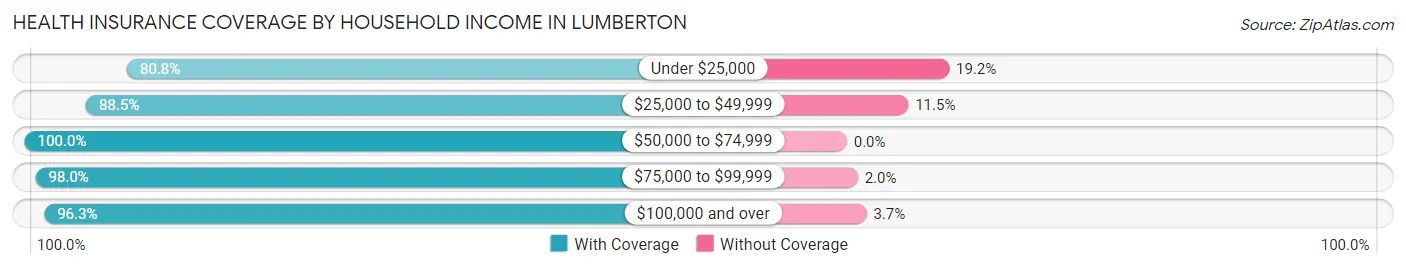
| Household Income | With Coverage | Without Coverage |
| Under $25,000 | 506 (80.8%) | 120 (19.2%) |
| $25,000 to $49,999 | 346 (88.5%) | 45 (11.5%) |
| $50,000 to $74,999 | 146 (100.0%) | 0 (0.0%) |
| $75,000 to $99,999 | 240 (98.0%) | 5 (2.0%) |
| $100,000 and over | 157 (96.3%) | 6 (3.7%) |
Public vs Private Health Insurance Coverage by Age in Lumberton
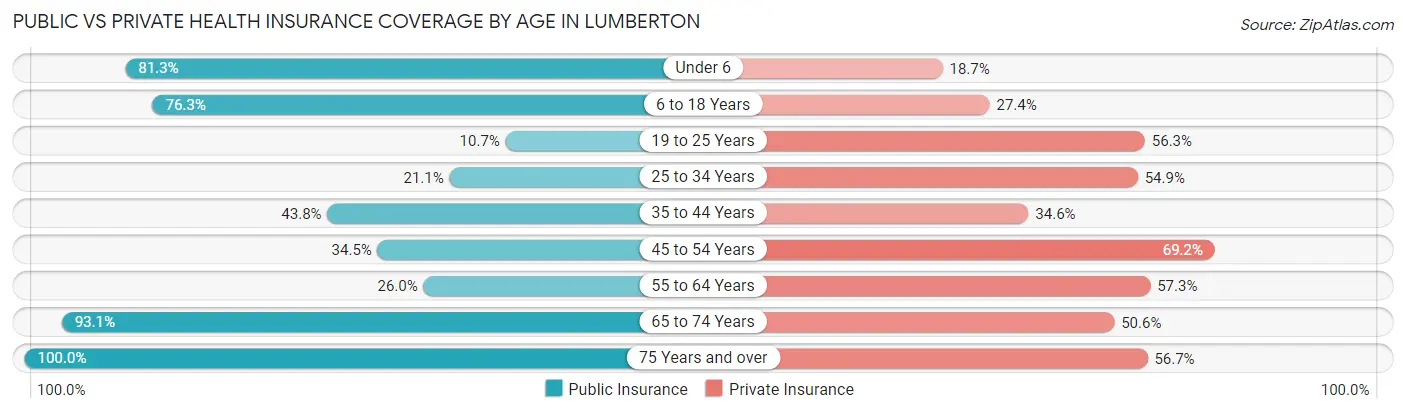
| Age Bracket | Public Insurance | Private Insurance |
| Under 6 | 100 (81.3%) | 23 (18.7%) |
| 6 to 18 Years | 228 (76.2%) | 82 (27.4%) |
| 19 to 25 Years | 12 (10.7%) | 63 (56.2%) |
| 25 to 34 Years | 45 (21.1%) | 117 (54.9%) |
| 35 to 44 Years | 67 (43.8%) | 53 (34.6%) |
| 45 to 54 Years | 121 (34.5%) | 243 (69.2%) |
| 55 to 64 Years | 34 (26.0%) | 75 (57.3%) |
| 65 to 74 Years | 81 (93.1%) | 44 (50.6%) |
| 75 Years and over | 104 (100.0%) | 59 (56.7%) |
| Total | 792 (50.3%) | 759 (48.2%) |
Disability Status by Sex by Age in Lumberton
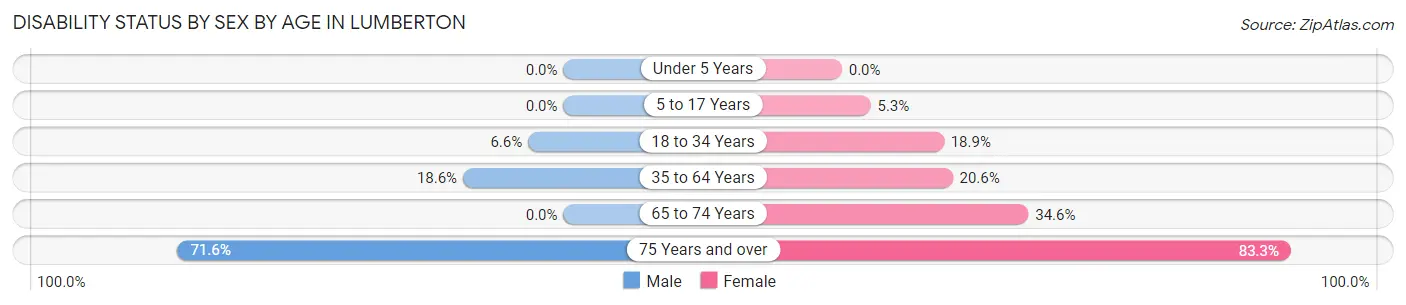
| Age Bracket | Male | Female |
| Under 5 Years | 0 (0.0%) | 0 (0.0%) |
| 5 to 17 Years | 0 (0.0%) | 7 (5.3%) |
| 18 to 34 Years | 15 (6.6%) | 21 (18.9%) |
| 35 to 64 Years | 44 (18.6%) | 82 (20.5%) |
| 65 to 74 Years | 0 (0.0%) | 18 (34.6%) |
| 75 Years and over | 53 (71.6%) | 25 (83.3%) |
Disability Class by Sex by Age in Lumberton
Disability Class: Hearing Difficulty
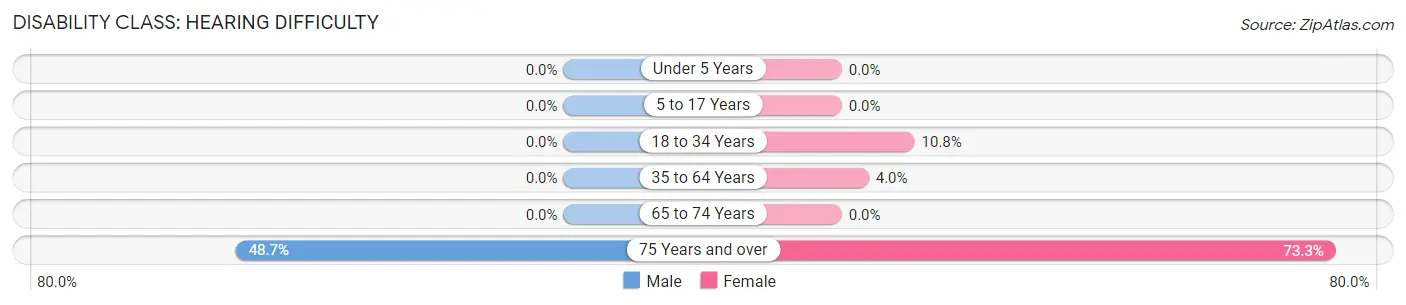
| Age Bracket | Male | Female |
| Under 5 Years | 0 (0.0%) | 0 (0.0%) |
| 5 to 17 Years | 0 (0.0%) | 0 (0.0%) |
| 18 to 34 Years | 0 (0.0%) | 12 (10.8%) |
| 35 to 64 Years | 0 (0.0%) | 16 (4.0%) |
| 65 to 74 Years | 0 (0.0%) | 0 (0.0%) |
| 75 Years and over | 36 (48.6%) | 22 (73.3%) |
Disability Class: Vision Difficulty
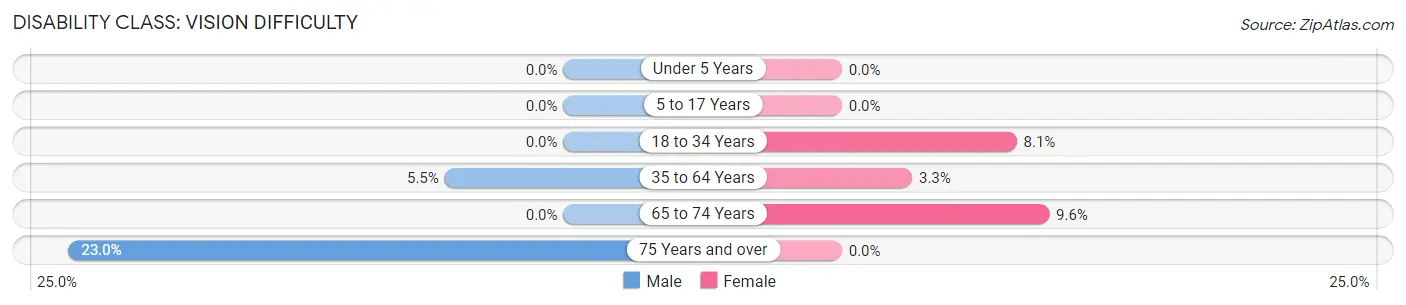
| Age Bracket | Male | Female |
| Under 5 Years | 0 (0.0%) | 0 (0.0%) |
| 5 to 17 Years | 0 (0.0%) | 0 (0.0%) |
| 18 to 34 Years | 0 (0.0%) | 9 (8.1%) |
| 35 to 64 Years | 13 (5.5%) | 13 (3.3%) |
| 65 to 74 Years | 0 (0.0%) | 5 (9.6%) |
| 75 Years and over | 17 (23.0%) | 0 (0.0%) |
Disability Class: Cognitive Difficulty
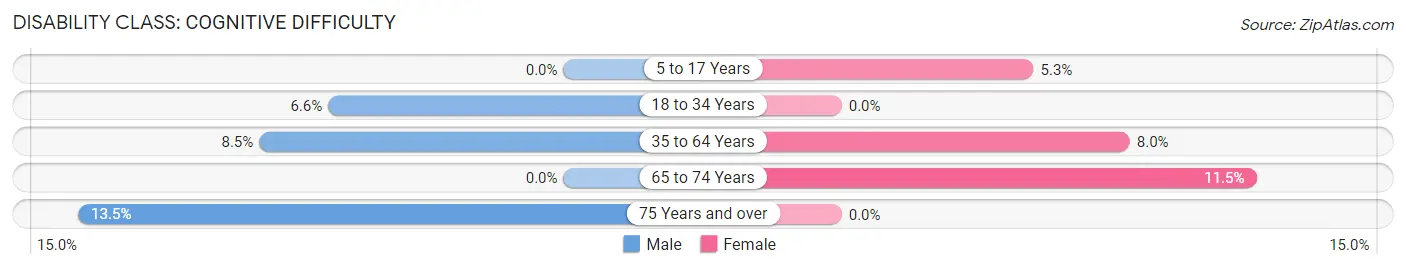
| Age Bracket | Male | Female |
| 5 to 17 Years | 0 (0.0%) | 7 (5.3%) |
| 18 to 34 Years | 15 (6.6%) | 0 (0.0%) |
| 35 to 64 Years | 20 (8.5%) | 32 (8.0%) |
| 65 to 74 Years | 0 (0.0%) | 6 (11.5%) |
| 75 Years and over | 10 (13.5%) | 0 (0.0%) |
Disability Class: Ambulatory Difficulty
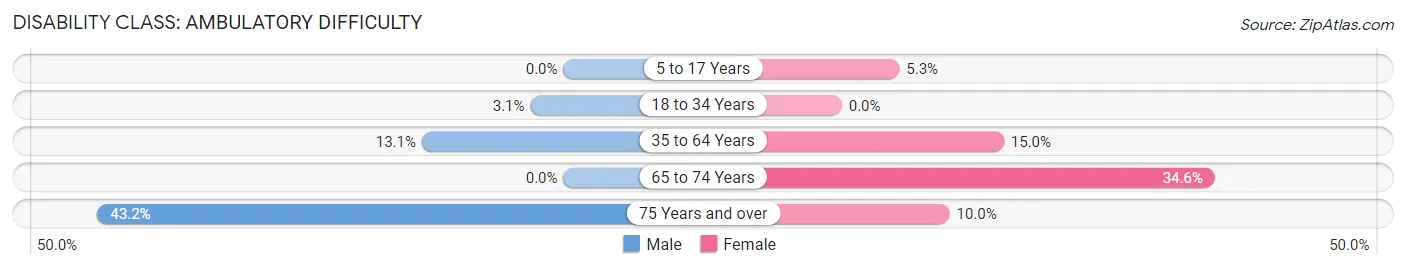
| Age Bracket | Male | Female |
| 5 to 17 Years | 0 (0.0%) | 7 (5.3%) |
| 18 to 34 Years | 7 (3.1%) | 0 (0.0%) |
| 35 to 64 Years | 31 (13.1%) | 60 (15.0%) |
| 65 to 74 Years | 0 (0.0%) | 18 (34.6%) |
| 75 Years and over | 32 (43.2%) | 3 (10.0%) |
Disability Class: Self-Care Difficulty
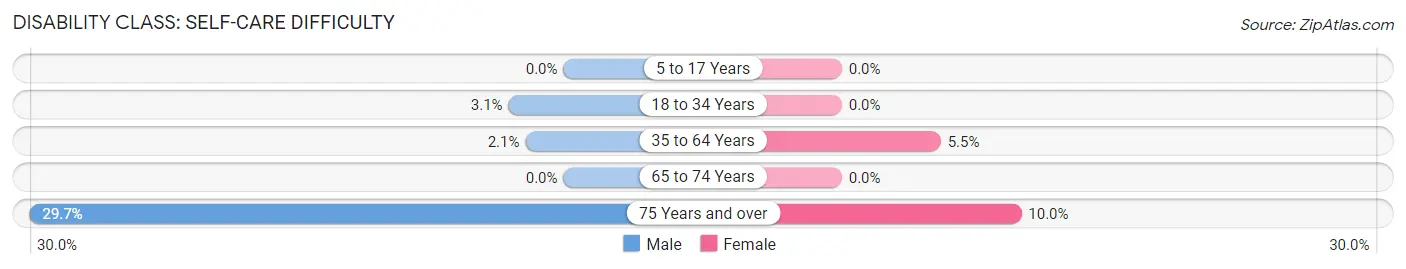
| Age Bracket | Male | Female |
| 5 to 17 Years | 0 (0.0%) | 0 (0.0%) |
| 18 to 34 Years | 7 (3.1%) | 0 (0.0%) |
| 35 to 64 Years | 5 (2.1%) | 22 (5.5%) |
| 65 to 74 Years | 0 (0.0%) | 0 (0.0%) |
| 75 Years and over | 22 (29.7%) | 3 (10.0%) |
Technology Access in Lumberton
Computing Device Access in Lumberton
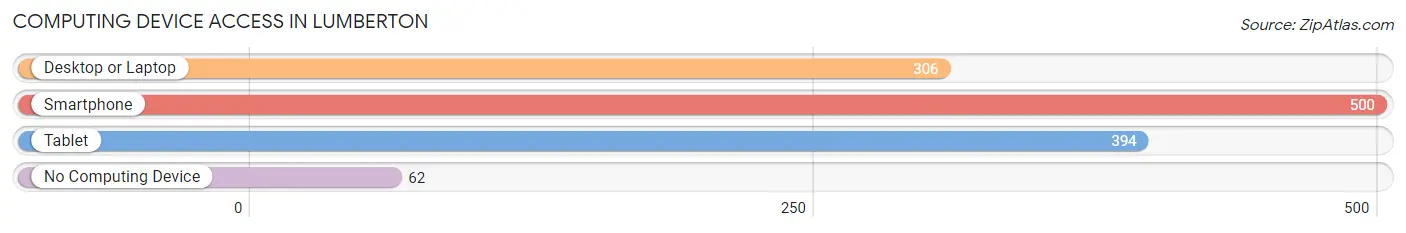
| Device Type | # Households | % Households |
| Desktop or Laptop | 306 | 49.3% |
| Smartphone | 500 | 80.6% |
| Tablet | 394 | 63.5% |
| No Computing Device | 62 | 10.0% |
| Total | 620 | 100.0% |
Internet Access in Lumberton
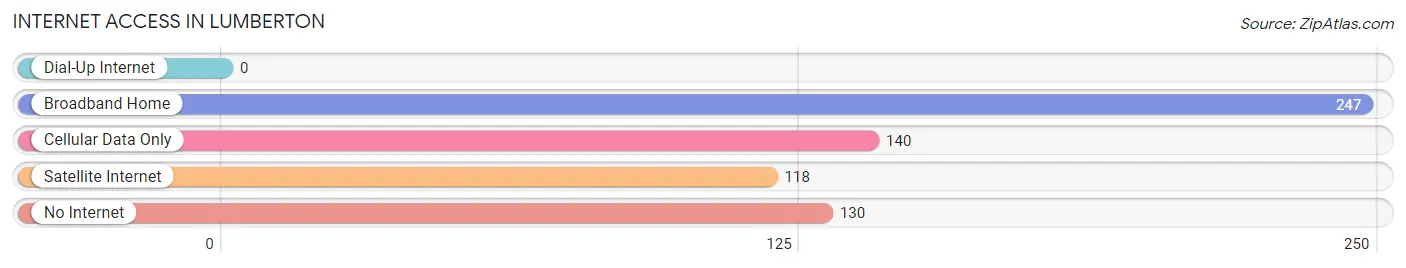
| Internet Type | # Households | % Households |
| Dial-Up Internet | 0 | 0.0% |
| Broadband Home | 247 | 39.8% |
| Cellular Data Only | 140 | 22.6% |
| Satellite Internet | 118 | 19.0% |
| No Internet | 130 | 21.0% |
| Total | 620 | 100.0% |
Lumberton Summary
Lumberton, Mississippi is a small town located in Lamar County, Mississippi. It is situated in the southeastern corner of the state, approximately 70 miles northeast of Hattiesburg and 90 miles southeast of Jackson. The town is located on the banks of the Leaf River and is home to a population of approximately 2,500 people.
History
Lumberton was founded in 1837 by a group of settlers from North Carolina. The town was named after the lumber industry that was prevalent in the area at the time. The town was incorporated in 1839 and quickly became a hub for the lumber industry. The town was also home to a number of sawmills and other businesses related to the lumber industry.
In the late 19th century, the town began to experience a decline in the lumber industry. This was due to the depletion of the local timber resources and the introduction of new technologies that made it easier to transport lumber from other parts of the country. As a result, the town began to focus more on agriculture and other industries.
Geography
Lumberton is located in the southeastern corner of Lamar County, Mississippi. It is situated on the banks of the Leaf River and is approximately 70 miles northeast of Hattiesburg and 90 miles southeast of Jackson. The town is located in a rural area and is surrounded by forests and farmland. The town is located at an elevation of approximately 200 feet above sea level.
The climate in Lumberton is classified as humid subtropical. The town experiences hot, humid summers and mild winters. The average annual temperature is around 70 degrees Fahrenheit. The town receives an average of 50 inches of precipitation per year.
Economy
The economy of Lumberton is largely based on agriculture and manufacturing. The town is home to a number of agricultural businesses, including poultry farms, dairy farms, and vegetable farms. The town is also home to a number of manufacturing businesses, including furniture factories, textile mills, and paper mills.
The town is also home to a number of retail businesses, including grocery stores, restaurants, and clothing stores. The town is also home to a number of service businesses, including banks, insurance companies, and medical offices.
Demographics
As of the 2010 census, the population of Lumberton was 2,500. The town is approximately 75% white, 20% African American, and 5% other races. The median household income in the town is approximately $35,000. The median age in the town is approximately 40 years old.
Conclusion
Lumberton, Mississippi is a small town located in Lamar County, Mississippi. It is situated on the banks of the Leaf River and is home to a population of approximately 2,500 people. The town was founded in 1837 and was originally a hub for the lumber industry. Today, the town’s economy is largely based on agriculture and manufacturing. The town is approximately 75% white, 20% African American, and 5% other races. The median household income in the town is approximately $35,000 and the median age is approximately 40 years old.
Common Questions
What is Per Capita Income in Lumberton?
Per Capita income in Lumberton is $19,376.
What is the Median Family Income in Lumberton?
Median Family Income in Lumberton is $46,494.
What is the Median Household income in Lumberton?
Median Household Income in Lumberton is $40,641.
What is Income or Wage Gap in Lumberton?
Income or Wage Gap in Lumberton is 19.9%.
Women in Lumberton earn 80.1 cents for every dollar earned by a man.
What is Inequality or Gini Index in Lumberton?
Inequality or Gini Index in Lumberton is 0.42.
What is the Total Population of Lumberton?
Total Population of Lumberton is 1,588.
What is the Total Male Population of Lumberton?
Total Male Population of Lumberton is 834.
What is the Total Female Population of Lumberton?
Total Female Population of Lumberton is 754.
What is the Ratio of Males per 100 Females in Lumberton?
There are 110.61 Males per 100 Females in Lumberton.
What is the Ratio of Females per 100 Males in Lumberton?
There are 90.41 Females per 100 Males in Lumberton.
What is the Median Population Age in Lumberton?
Median Population Age in Lumberton is 36.9 Years.
What is the Average Family Size in Lumberton
Average Family Size in Lumberton is 3.0 People.
What is the Average Household Size in Lumberton
Average Household Size in Lumberton is 2.5 People.
How Large is the Labor Force in Lumberton?
There are 674 People in the Labor Forcein in Lumberton.
What is the Percentage of People in the Labor Force in Lumberton?
55.8% of People are in the Labor Force in Lumberton.
What is the Unemployment Rate in Lumberton?
Unemployment Rate in Lumberton is 19.3%.