Covington, LA Map & Demographics
Covington Map
Covington Overview
$36,427
PER CAPITA INCOME
$92,536
AVG FAMILY INCOME
$71,719
AVG HOUSEHOLD INCOME
15.9%
WAGE / INCOME GAP [ % ]
84.1¢/ $1
WAGE / INCOME GAP [ $ ]
0.47
INEQUALITY / GINI INDEX
11,444
TOTAL POPULATION
6,052
MALE POPULATION
5,392
FEMALE POPULATION
112.24
MALES / 100 FEMALES
89.09
FEMALES / 100 MALES
38.7
MEDIAN AGE
2.9
AVG FAMILY SIZE
2.5
AVG HOUSEHOLD SIZE
5,106
LABOR FORCE [ PEOPLE ]
55.5%
PERCENT IN LABOR FORCE
4.7%
UNEMPLOYMENT RATE
Covington Area Codes
Income in Covington
Income Overview in Covington
Per Capita Income in Covington is $36,427, while median incomes of families and households are $92,536 and $71,719 respectively.
| Characteristic | Number | Measure |
| Per Capita Income | 11,444 | $36,427 |
| Median Family Income | 3,031 | $92,536 |
| Mean Family Income | 3,031 | $111,083 |
| Median Household Income | 4,241 | $71,719 |
| Mean Household Income | 4,241 | $98,209 |
| Income Deficit | 3,031 | $0 |
| Wage / Income Gap (%) | 11,444 | 15.95% |
| Wage / Income Gap ($) | 11,444 | 84.05¢ per $1 |
| Gini / Inequality Index | 11,444 | 0.47 |
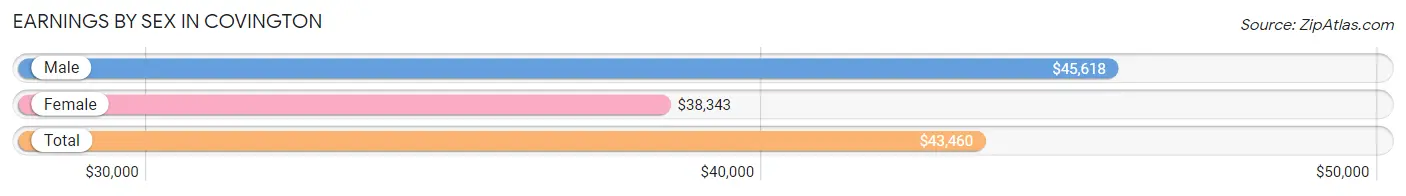
Earnings by Sex in Covington
Average Earnings in Covington are $43,460, $45,618 for men and $38,343 for women, a difference of 16.0%.
| Sex | Number | Average Earnings |
| Male | 3,212 (56.2%) | $45,618 |
| Female | 2,502 (43.8%) | $38,343 |
| Total | 5,714 (100.0%) | $43,460 |
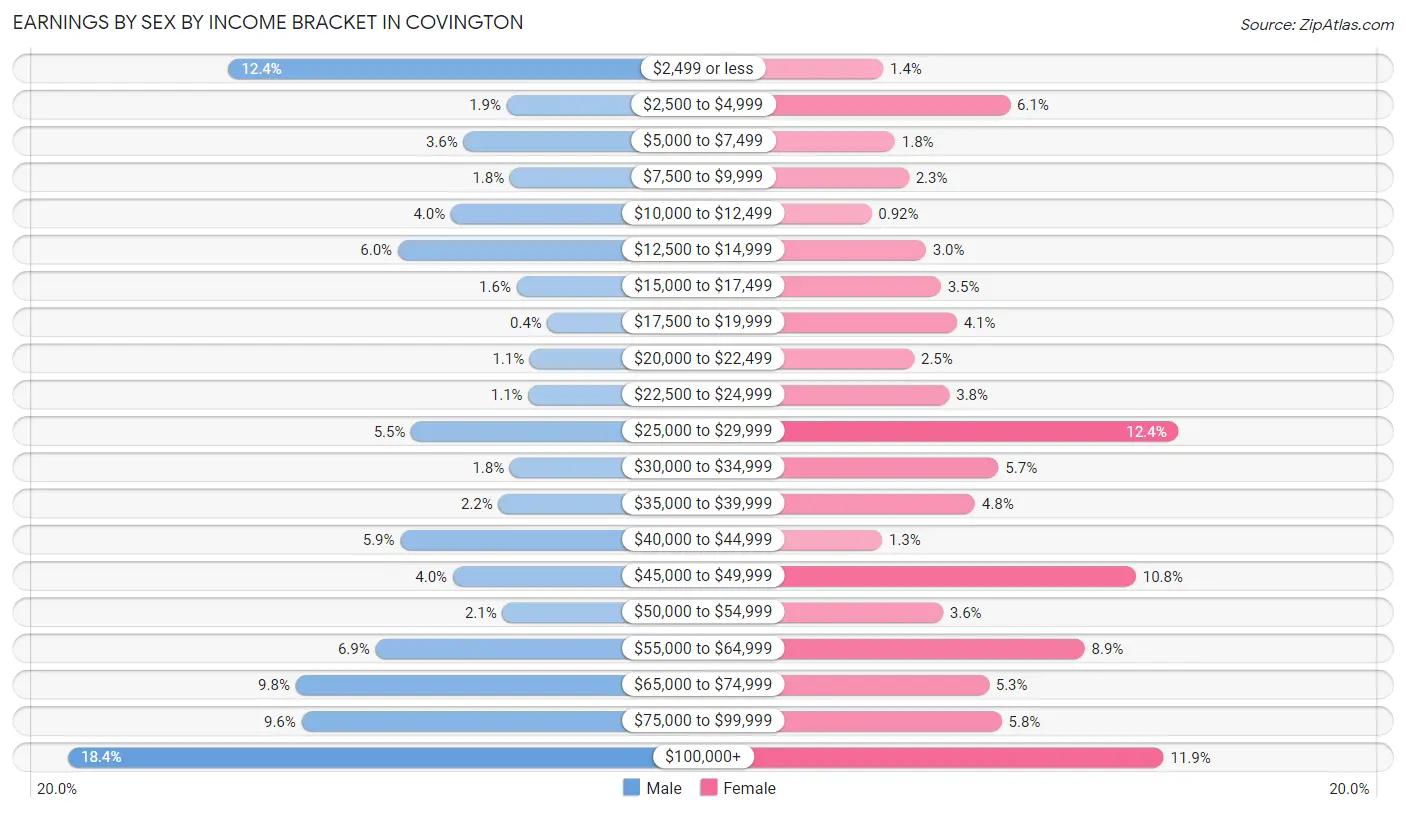
Earnings by Sex by Income Bracket in Covington
The most common earnings brackets in Covington are $100,000+ for men (590 | 18.4%) and $25,000 to $29,999 for women (311 | 12.4%).
| Income | Male | Female |
| $2,499 or less | 397 (12.4%) | 34 (1.4%) |
| $2,500 to $4,999 | 62 (1.9%) | 153 (6.1%) |
| $5,000 to $7,499 | 114 (3.5%) | 45 (1.8%) |
| $7,500 to $9,999 | 58 (1.8%) | 58 (2.3%) |
| $10,000 to $12,499 | 129 (4.0%) | 23 (0.9%) |
| $12,500 to $14,999 | 193 (6.0%) | 74 (3.0%) |
| $15,000 to $17,499 | 50 (1.6%) | 88 (3.5%) |
| $17,500 to $19,999 | 13 (0.4%) | 103 (4.1%) |
| $20,000 to $22,499 | 34 (1.1%) | 63 (2.5%) |
| $22,500 to $24,999 | 36 (1.1%) | 96 (3.8%) |
| $25,000 to $29,999 | 177 (5.5%) | 311 (12.4%) |
| $30,000 to $34,999 | 58 (1.8%) | 142 (5.7%) |
| $35,000 to $39,999 | 72 (2.2%) | 120 (4.8%) |
| $40,000 to $44,999 | 190 (5.9%) | 33 (1.3%) |
| $45,000 to $49,999 | 127 (4.0%) | 271 (10.8%) |
| $50,000 to $54,999 | 67 (2.1%) | 90 (3.6%) |
| $55,000 to $64,999 | 220 (6.9%) | 223 (8.9%) |
| $65,000 to $74,999 | 316 (9.8%) | 133 (5.3%) |
| $75,000 to $99,999 | 309 (9.6%) | 145 (5.8%) |
| $100,000+ | 590 (18.4%) | 297 (11.9%) |
| Total | 3,212 (100.0%) | 2,502 (100.0%) |
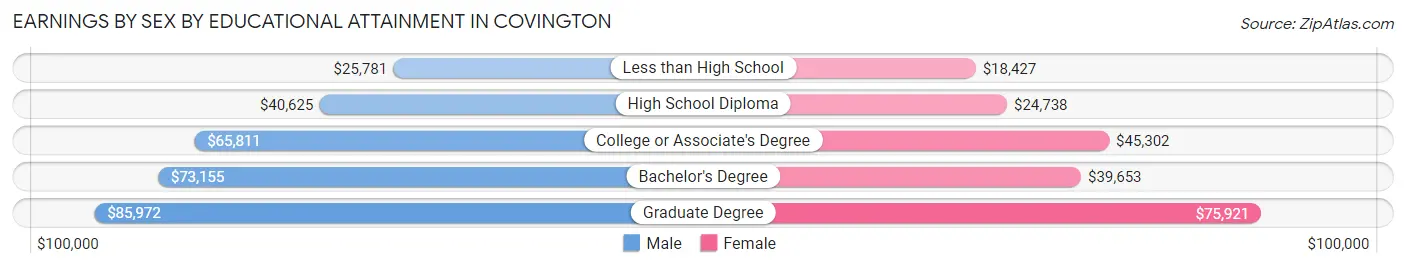
Earnings by Sex by Educational Attainment in Covington
Average earnings in Covington are $57,021 for men and $45,585 for women, a difference of 20.1%. Men with an educational attainment of graduate degree enjoy the highest average annual earnings of $85,972, while those with less than high school education earn the least with $25,781. Women with an educational attainment of graduate degree earn the most with the average annual earnings of $75,921, while those with less than high school education have the smallest earnings of $18,427.
| Educational Attainment | Male Income | Female Income |
| Less than High School | $25,781 | $18,427 |
| High School Diploma | $40,625 | $24,738 |
| College or Associate's Degree | $65,811 | $45,302 |
| Bachelor's Degree | $73,155 | $39,653 |
| Graduate Degree | $85,972 | $75,921 |
| Total | $57,021 | $45,585 |
Family Income in Covington
Family Income Brackets in Covington
According to the Covington family income data, there are 530 families falling into the $75,000 to $99,999 income range, which is the most common income bracket and makes up 17.5% of all families. Conversely, the $10,000 to $14,999 income bracket is the least frequent group with only 94 families (3.1%) belonging to this category.
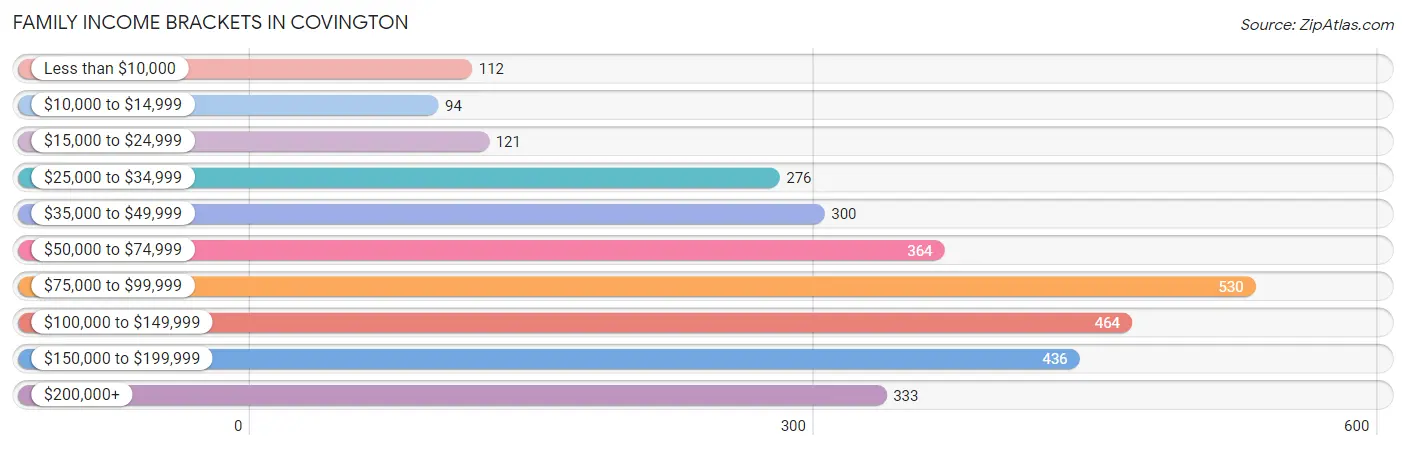
| Income Bracket | # Families | % Families |
| Less than $10,000 | 112 | 3.7% |
| $10,000 to $14,999 | 94 | 3.1% |
| $15,000 to $24,999 | 121 | 4.0% |
| $25,000 to $34,999 | 276 | 9.1% |
| $35,000 to $49,999 | 300 | 9.9% |
| $50,000 to $74,999 | 364 | 12.0% |
| $75,000 to $99,999 | 530 | 17.5% |
| $100,000 to $149,999 | 464 | 15.3% |
| $150,000 to $199,999 | 436 | 14.4% |
| $200,000+ | 333 | 11.0% |
Family Income by Famaliy Size in Covington
5-person families (382 | 12.6%) account for the highest median family income in Covington with $180,182 per family, while 3-person families (742 | 24.5%) have the highest median income of $42,173 per family member.
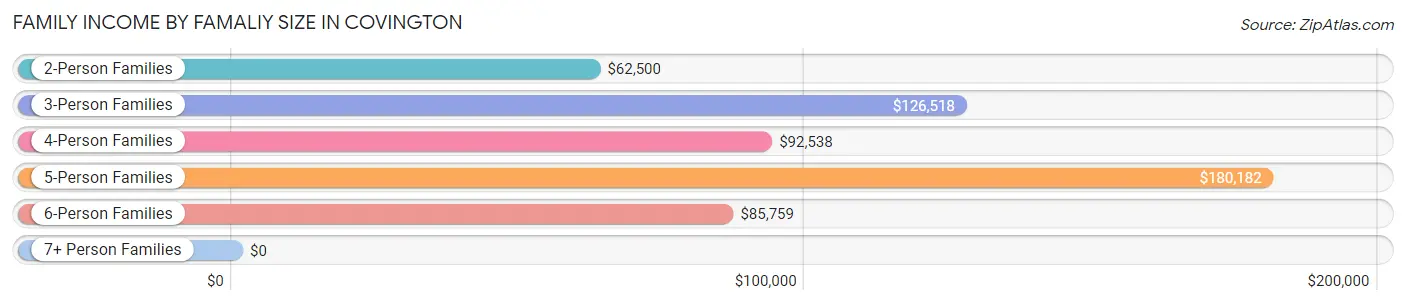
| Income Bracket | # Families | Median Income |
| 2-Person Families | 1,520 (50.1%) | $62,500 |
| 3-Person Families | 742 (24.5%) | $126,518 |
| 4-Person Families | 342 (11.3%) | $92,538 |
| 5-Person Families | 382 (12.6%) | $180,182 |
| 6-Person Families | 39 (1.3%) | $85,759 |
| 7+ Person Families | 6 (0.2%) | $0 |
| Total | 3,031 (100.0%) | $92,536 |
Family Income by Number of Earners in Covington
The median family income in Covington is $92,536, with families comprising 3+ earners (354) having the highest median family income of $181,590, while families with no earners (450) have the lowest median family income of $42,143, accounting for 11.7% and 14.8% of families, respectively.
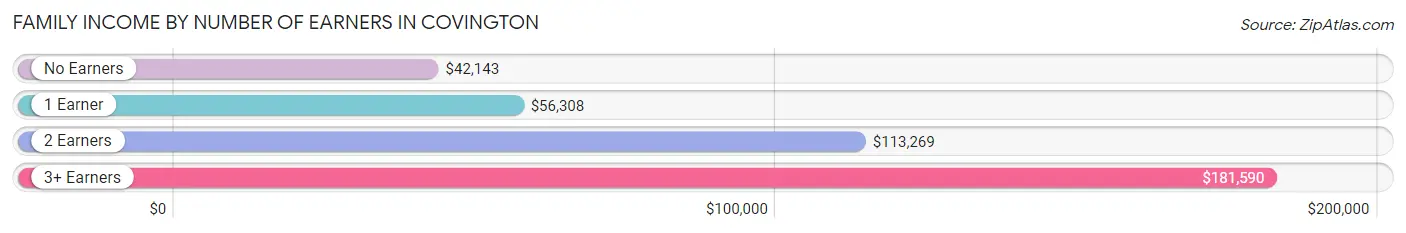
| Number of Earners | # Families | Median Income |
| No Earners | 450 (14.8%) | $42,143 |
| 1 Earner | 1,249 (41.2%) | $56,308 |
| 2 Earners | 978 (32.3%) | $113,269 |
| 3+ Earners | 354 (11.7%) | $181,590 |
| Total | 3,031 (100.0%) | $92,536 |
Household Income in Covington
Household Income Brackets in Covington
With 785 households falling in the category, the $50,000 to $74,999 income range is the most frequent in Covington, accounting for 18.5% of all households. In contrast, only 131 households (3.1%) fall into the $10,000 to $14,999 income bracket, making it the least populous group.
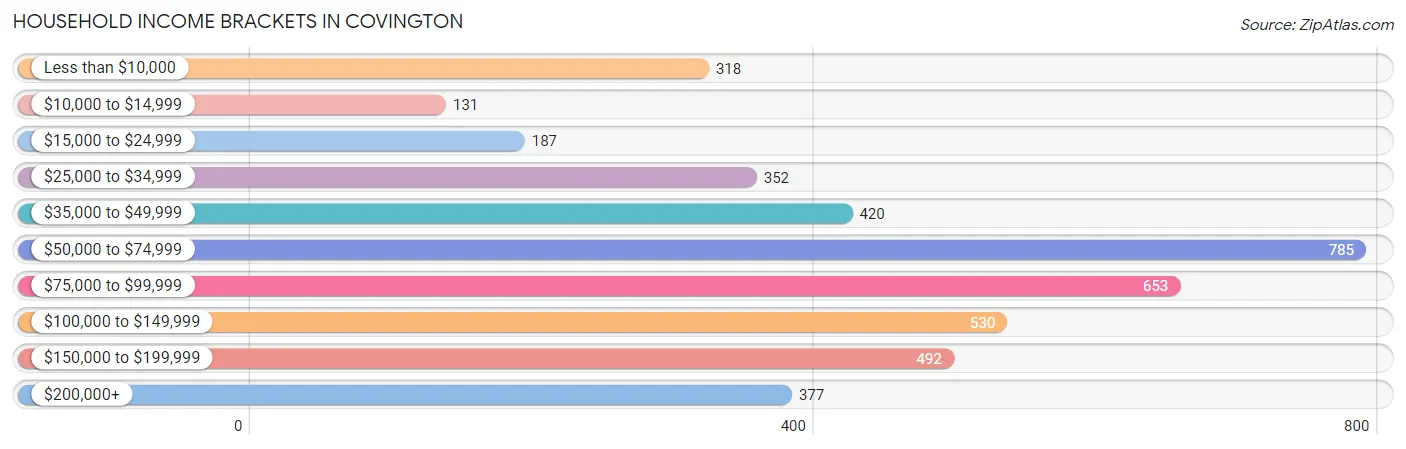
| Income Bracket | # Households | % Households |
| Less than $10,000 | 318 | 7.5% |
| $10,000 to $14,999 | 131 | 3.1% |
| $15,000 to $24,999 | 187 | 4.4% |
| $25,000 to $34,999 | 352 | 8.3% |
| $35,000 to $49,999 | 420 | 9.9% |
| $50,000 to $74,999 | 785 | 18.5% |
| $75,000 to $99,999 | 653 | 15.4% |
| $100,000 to $149,999 | 530 | 12.5% |
| $150,000 to $199,999 | 492 | 11.6% |
| $200,000+ | 377 | 8.9% |
Household Income by Householder Age in Covington
The median household income in Covington is $71,719, with the highest median household income of $93,339 found in the 25 to 44 years age bracket for the primary householder. A total of 1,479 households (34.9%) fall into this category. Meanwhile, the 15 to 24 years age bracket for the primary householder has the lowest median household income of $0, with 33 households (0.8%) in this group.
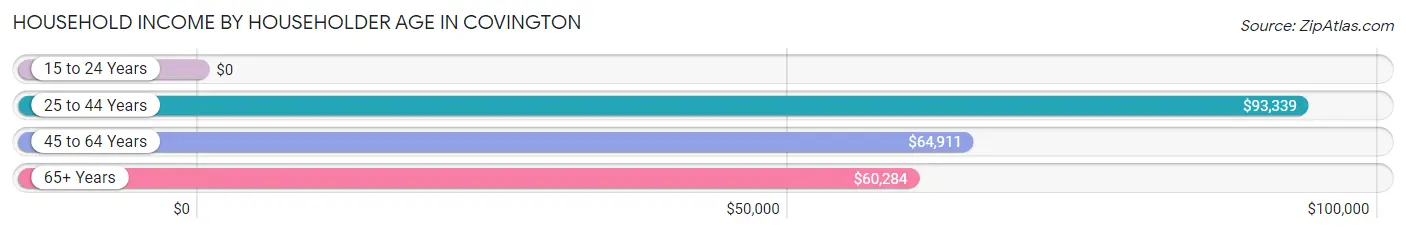
| Income Bracket | # Households | Median Income |
| 15 to 24 Years | 33 (0.8%) | $0 |
| 25 to 44 Years | 1,479 (34.9%) | $93,339 |
| 45 to 64 Years | 1,617 (38.1%) | $64,911 |
| 65+ Years | 1,112 (26.2%) | $60,284 |
| Total | 4,241 (100.0%) | $71,719 |
Poverty in Covington
Income Below Poverty by Sex and Age in Covington
With 12.0% poverty level for males and 14.8% for females among the residents of Covington, 55 to 64 year old males and 16 and 17 year old females are the most vulnerable to poverty, with 237 males (26.7%) and 50 females (59.5%) in their respective age groups living below the poverty level.
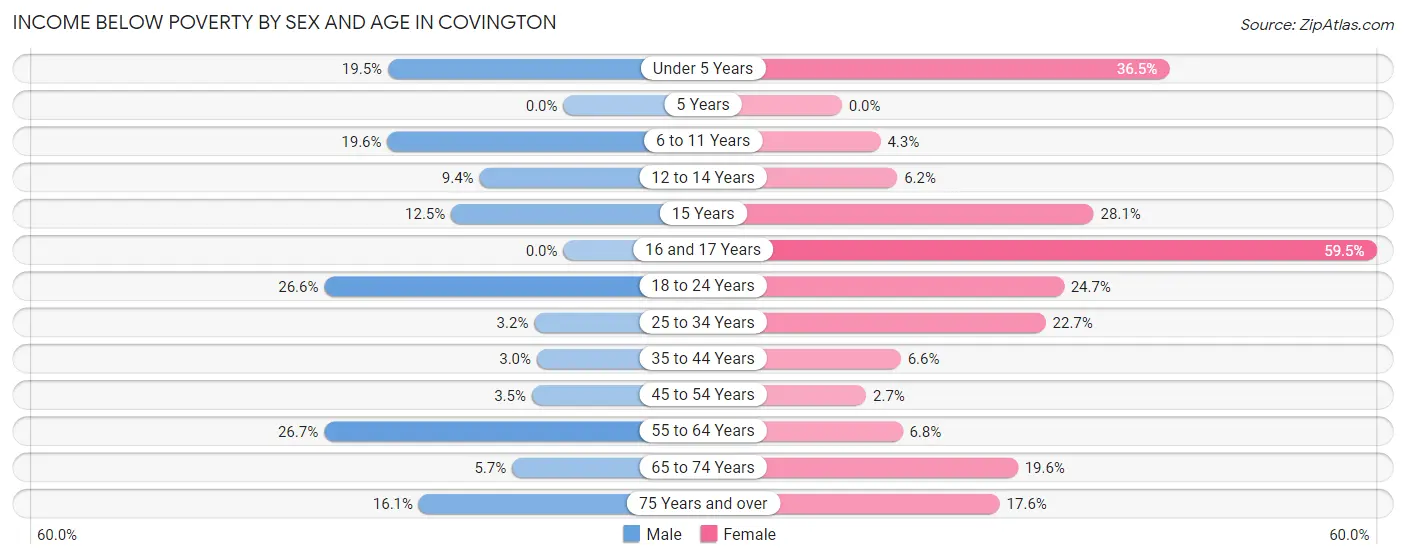
| Age Bracket | Male | Female |
| Under 5 Years | 34 (19.5%) | 113 (36.4%) |
| 5 Years | 0 (0.0%) | 0 (0.0%) |
| 6 to 11 Years | 79 (19.6%) | 23 (4.3%) |
| 12 to 14 Years | 40 (9.3%) | 10 (6.2%) |
| 15 Years | 10 (12.5%) | 23 (28.1%) |
| 16 and 17 Years | 0 (0.0%) | 50 (59.5%) |
| 18 to 24 Years | 111 (26.6%) | 84 (24.7%) |
| 25 to 34 Years | 19 (3.2%) | 158 (22.7%) |
| 35 to 44 Years | 23 (2.9%) | 46 (6.6%) |
| 45 to 54 Years | 15 (3.5%) | 14 (2.7%) |
| 55 to 64 Years | 237 (26.7%) | 44 (6.8%) |
| 65 to 74 Years | 31 (5.7%) | 142 (19.6%) |
| 75 Years and over | 37 (16.1%) | 74 (17.6%) |
| Total | 636 (12.0%) | 781 (14.8%) |
Income Above Poverty by Sex and Age in Covington
According to the poverty statistics in Covington, males aged 5 years and females aged 5 years are the age groups that are most secure financially, with 100.0% of males and 100.0% of females in these age groups living above the poverty line.
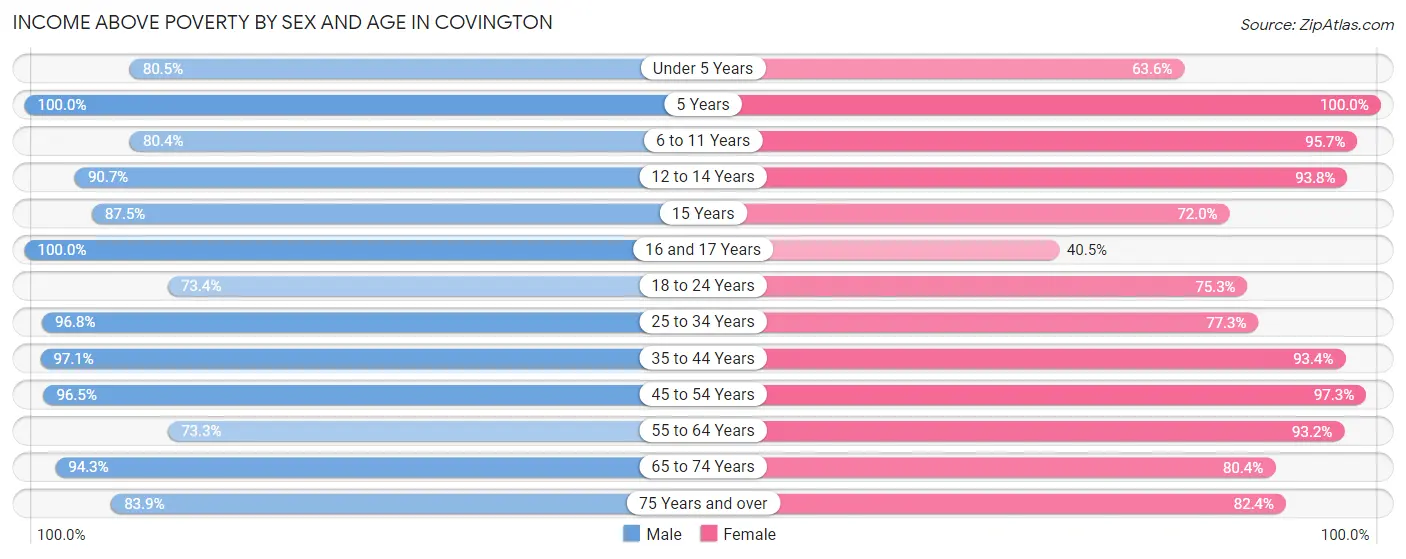
| Age Bracket | Male | Female |
| Under 5 Years | 140 (80.5%) | 197 (63.5%) |
| 5 Years | 17 (100.0%) | 54 (100.0%) |
| 6 to 11 Years | 324 (80.4%) | 511 (95.7%) |
| 12 to 14 Years | 388 (90.6%) | 152 (93.8%) |
| 15 Years | 70 (87.5%) | 59 (72.0%) |
| 16 and 17 Years | 324 (100.0%) | 34 (40.5%) |
| 18 to 24 Years | 306 (73.4%) | 256 (75.3%) |
| 25 to 34 Years | 567 (96.8%) | 538 (77.3%) |
| 35 to 44 Years | 756 (97.1%) | 655 (93.4%) |
| 45 to 54 Years | 412 (96.5%) | 503 (97.3%) |
| 55 to 64 Years | 652 (73.3%) | 607 (93.2%) |
| 65 to 74 Years | 512 (94.3%) | 583 (80.4%) |
| 75 Years and over | 193 (83.9%) | 347 (82.4%) |
| Total | 4,661 (88.0%) | 4,496 (85.2%) |
Income Below Poverty Among Married-Couple Families in Covington
The poverty statistics for married-couple families in Covington show that 3.2% or 66 of the total 2,095 families live below the poverty line. Families with no children have the highest poverty rate of 4.7%, comprising of 57 families. On the other hand, families with 3 or 4 children have the lowest poverty rate of 0.0%, which includes 0 families.
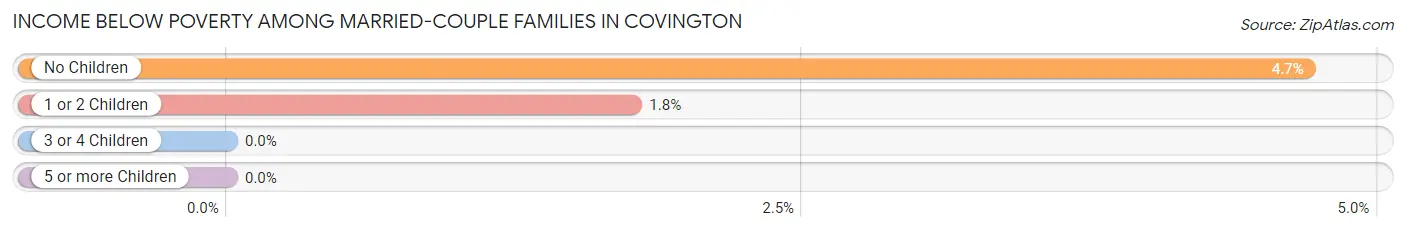
| Children | Above Poverty | Below Poverty |
| No Children | 1,158 (95.3%) | 57 (4.7%) |
| 1 or 2 Children | 503 (98.2%) | 9 (1.8%) |
| 3 or 4 Children | 368 (100.0%) | 0 (0.0%) |
| 5 or more Children | 0 (0.0%) | 0 (0.0%) |
| Total | 2,029 (96.9%) | 66 (3.2%) |
Income Below Poverty Among Single-Parent Households in Covington
According to the poverty data in Covington, 4.5% or 10 single-father households and 29.1% or 207 single-mother households are living below the poverty line. Among single-father households, those with no children have the highest poverty rate, with 10 households (11.1%) experiencing poverty. Likewise, among single-mother households, those with 3 or 4 children have the highest poverty rate, with 66 households (100.0%) falling below the poverty line.
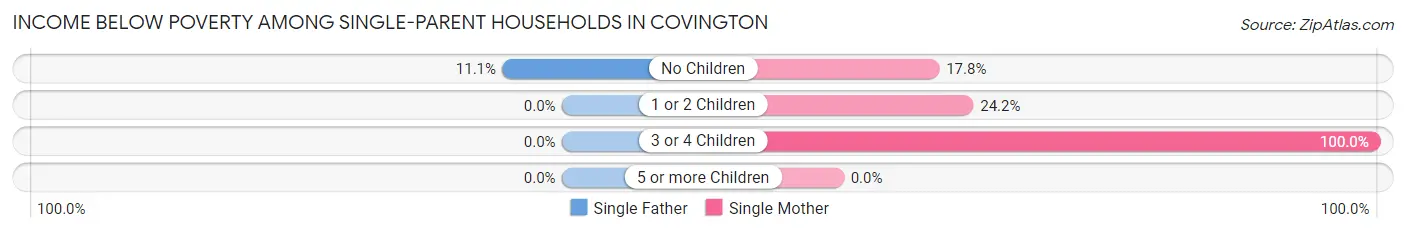
| Children | Single Father | Single Mother |
| No Children | 10 (11.1%) | 42 (17.8%) |
| 1 or 2 Children | 0 (0.0%) | 99 (24.1%) |
| 3 or 4 Children | 0 (0.0%) | 66 (100.0%) |
| 5 or more Children | 0 (0.0%) | 0 (0.0%) |
| Total | 10 (4.5%) | 207 (29.1%) |
Income Below Poverty Among Married-Couple vs Single-Parent Households in Covington
The poverty data for Covington shows that 66 of the married-couple family households (3.2%) and 217 of the single-parent households (23.2%) are living below the poverty level. Within the married-couple family households, those with no children have the highest poverty rate, with 57 households (4.7%) falling below the poverty line. Among the single-parent households, those with 3 or 4 children have the highest poverty rate, with 66 household (100.0%) living below poverty.
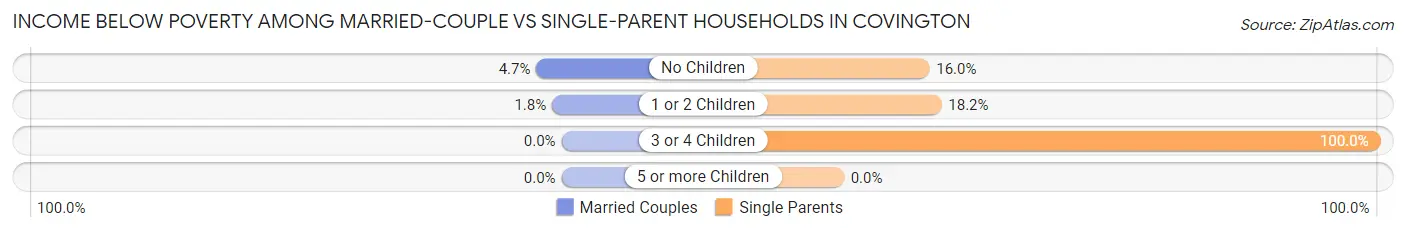
| Children | Married-Couple Families | Single-Parent Households |
| No Children | 57 (4.7%) | 52 (16.0%) |
| 1 or 2 Children | 9 (1.8%) | 99 (18.2%) |
| 3 or 4 Children | 0 (0.0%) | 66 (100.0%) |
| 5 or more Children | 0 (0.0%) | 0 (0.0%) |
| Total | 66 (3.2%) | 217 (23.2%) |
Race in Covington
The most populous races in Covington are White / Caucasian (9,043 | 79.0%), Black / African American (1,637 | 14.3%), and Two or more Races (567 | 5.0%).
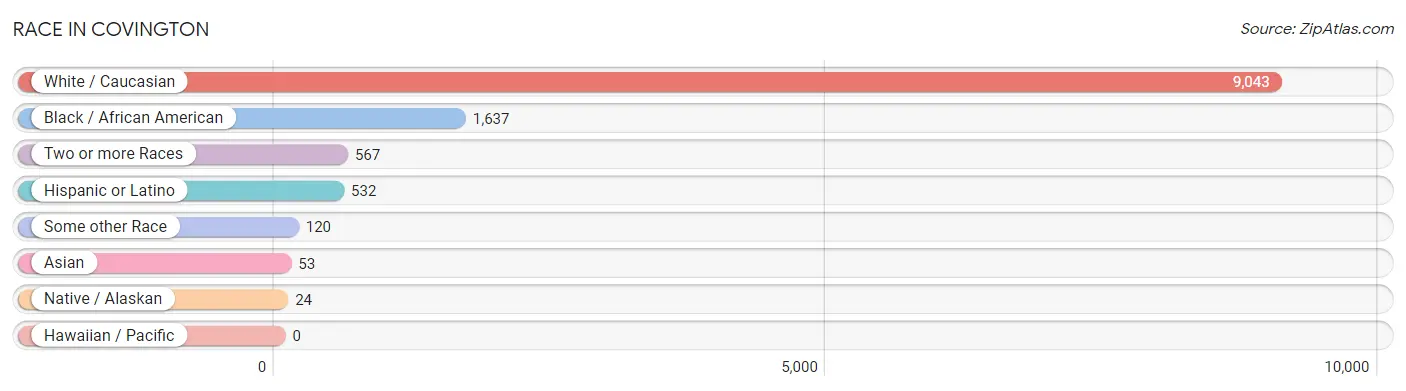
| Race | # Population | % Population |
| Asian | 53 | 0.5% |
| Black / African American | 1,637 | 14.3% |
| Hawaiian / Pacific | 0 | 0.0% |
| Hispanic or Latino | 532 | 4.6% |
| Native / Alaskan | 24 | 0.2% |
| White / Caucasian | 9,043 | 79.0% |
| Two or more Races | 567 | 5.0% |
| Some other Race | 120 | 1.1% |
| Total | 11,444 | 100.0% |
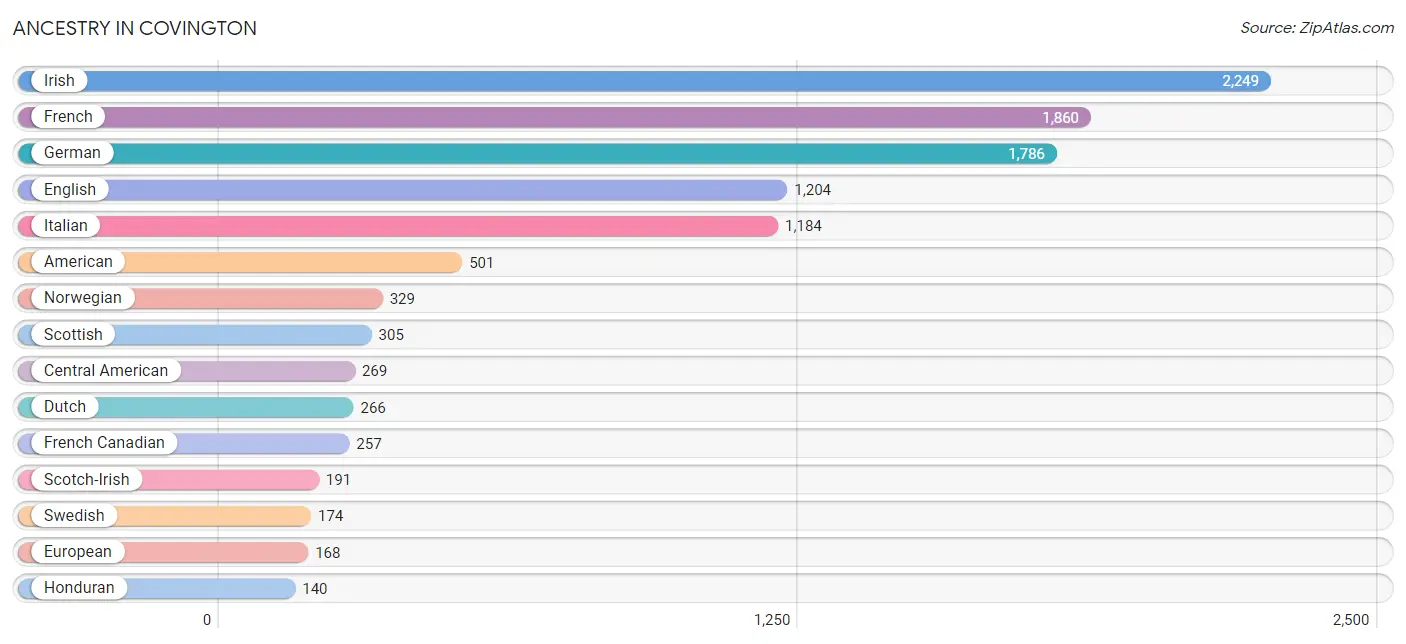
Ancestry in Covington
The most populous ancestries reported in Covington are Irish (2,249 | 19.7%), French (1,860 | 16.3%), German (1,786 | 15.6%), English (1,204 | 10.5%), and Italian (1,184 | 10.3%), together accounting for 72.4% of all Covington residents.
| Ancestry | # Population | % Population |
| American | 501 | 4.4% |
| Arab | 98 | 0.9% |
| Argentinean | 56 | 0.5% |
| Brazilian | 14 | 0.1% |
| British | 52 | 0.4% |
| Cajun | 98 | 0.9% |
| Canadian | 23 | 0.2% |
| Central American | 269 | 2.4% |
| Cherokee | 7 | 0.1% |
| Choctaw | 7 | 0.1% |
| Colombian | 15 | 0.1% |
| Cuban | 26 | 0.2% |
| Danish | 56 | 0.5% |
| Dominican | 7 | 0.1% |
| Dutch | 266 | 2.3% |
| English | 1,204 | 10.5% |
| European | 168 | 1.5% |
| French | 1,860 | 16.3% |
| French Canadian | 257 | 2.2% |
| German | 1,786 | 15.6% |
| Guatemalan | 7 | 0.1% |
| Honduran | 140 | 1.2% |
| Indian (Asian) | 44 | 0.4% |
| Irish | 2,249 | 19.7% |
| Italian | 1,184 | 10.3% |
| Lebanese | 98 | 0.9% |
| Mexican | 53 | 0.5% |
| Nicaraguan | 90 | 0.8% |
| Northern European | 48 | 0.4% |
| Norwegian | 329 | 2.9% |
| Panamanian | 32 | 0.3% |
| Polish | 71 | 0.6% |
| Portuguese | 14 | 0.1% |
| Puerto Rican | 10 | 0.1% |
| Romanian | 22 | 0.2% |
| Russian | 9 | 0.1% |
| Scotch-Irish | 191 | 1.7% |
| Scottish | 305 | 2.7% |
| South American | 71 | 0.6% |
| Spaniard | 35 | 0.3% |
| Spanish | 54 | 0.5% |
| Swedish | 174 | 1.5% |
| Swiss | 9 | 0.1% |
| Thai | 9 | 0.1% |
| Welsh | 58 | 0.5% | View All 45 Rows |
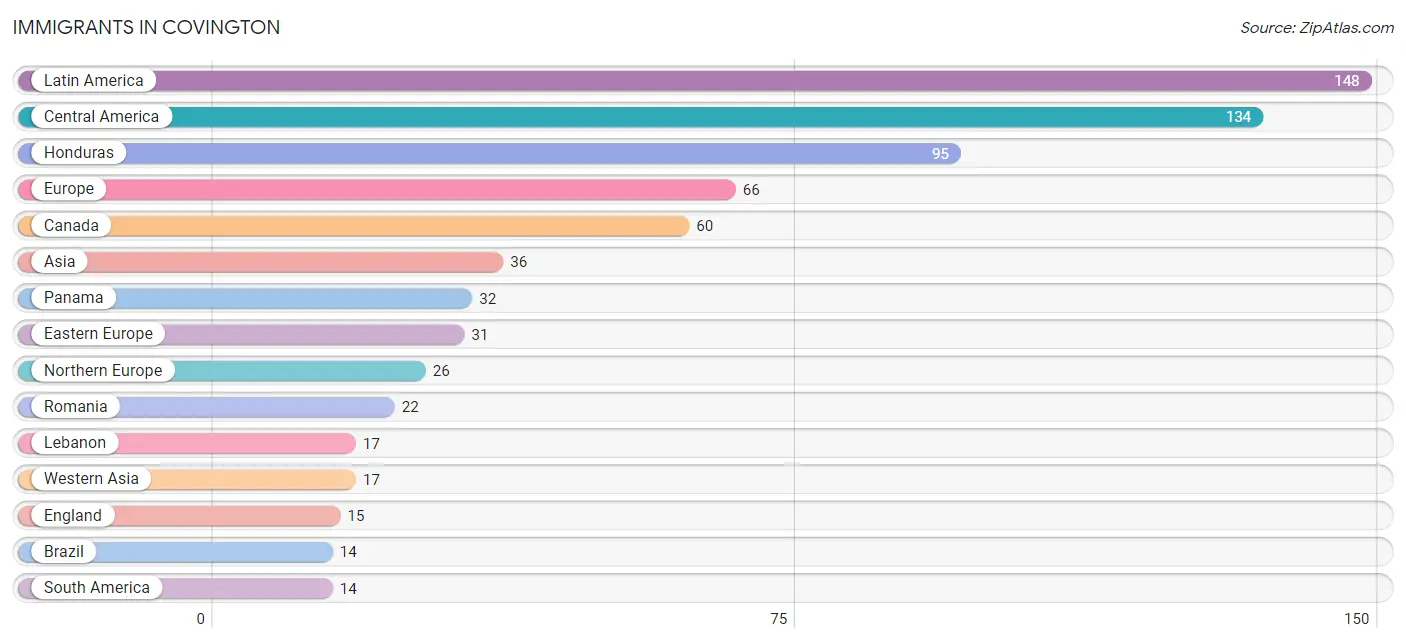
Immigrants in Covington
The most numerous immigrant groups reported in Covington came from Latin America (148 | 1.3%), Central America (134 | 1.2%), Honduras (95 | 0.8%), Europe (66 | 0.6%), and Canada (60 | 0.5%), together accounting for 4.4% of all Covington residents.
| Immigration Origin | # Population | % Population |
| Asia | 36 | 0.3% |
| Bangladesh | 9 | 0.1% |
| Brazil | 14 | 0.1% |
| Canada | 60 | 0.5% |
| Central America | 134 | 1.2% |
| China | 10 | 0.1% |
| Eastern Asia | 10 | 0.1% |
| Eastern Europe | 31 | 0.3% |
| England | 15 | 0.1% |
| Europe | 66 | 0.6% |
| Germany | 9 | 0.1% |
| Guatemala | 7 | 0.1% |
| Honduras | 95 | 0.8% |
| Latin America | 148 | 1.3% |
| Lebanon | 17 | 0.2% |
| Northern Europe | 26 | 0.2% |
| Panama | 32 | 0.3% |
| Romania | 22 | 0.2% |
| Russia | 9 | 0.1% |
| South America | 14 | 0.1% |
| South Central Asia | 9 | 0.1% |
| Western Asia | 17 | 0.2% |
| Western Europe | 9 | 0.1% | View All 23 Rows |
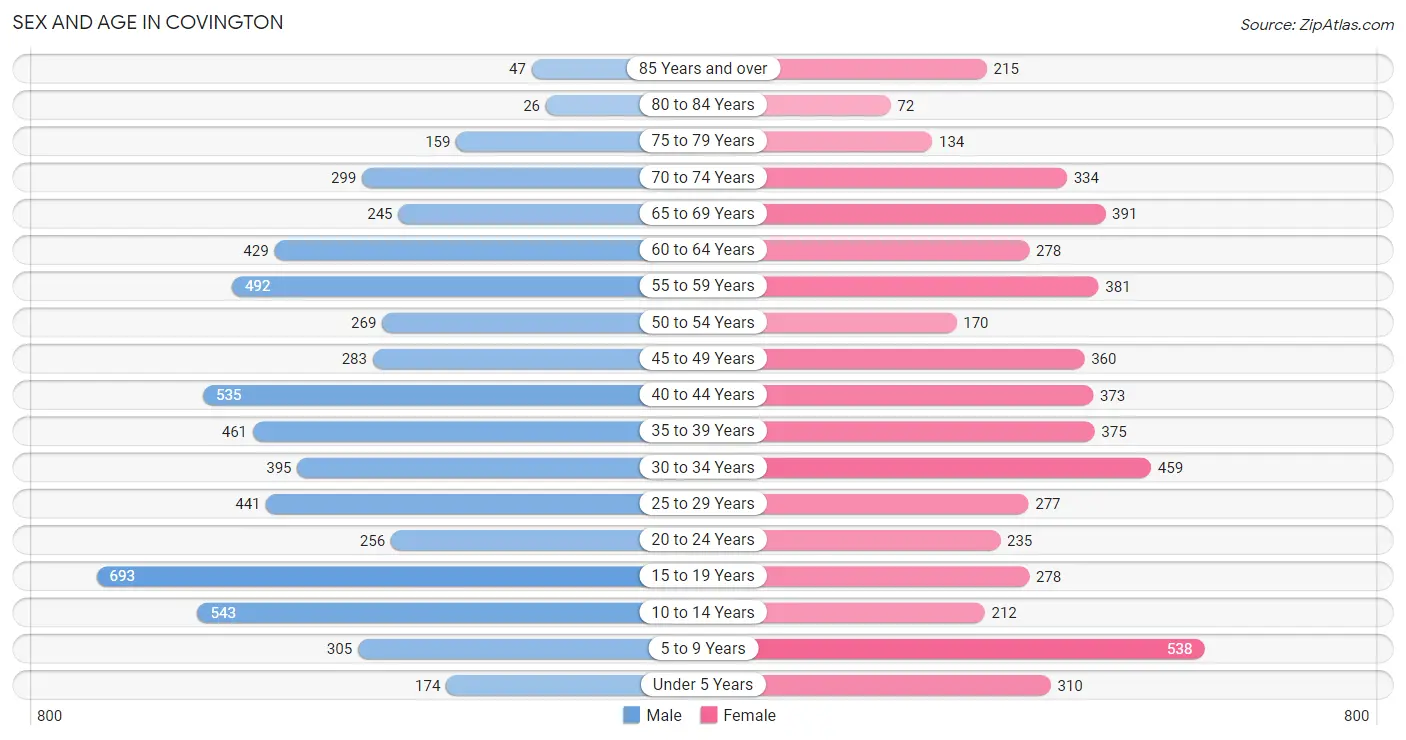
Sex and Age in Covington
Sex and Age in Covington
The most populous age groups in Covington are 15 to 19 Years (693 | 11.5%) for men and 5 to 9 Years (538 | 10.0%) for women.
| Age Bracket | Male | Female |
| Under 5 Years | 174 (2.9%) | 310 (5.8%) |
| 5 to 9 Years | 305 (5.0%) | 538 (10.0%) |
| 10 to 14 Years | 543 (9.0%) | 212 (3.9%) |
| 15 to 19 Years | 693 (11.5%) | 278 (5.2%) |
| 20 to 24 Years | 256 (4.2%) | 235 (4.4%) |
| 25 to 29 Years | 441 (7.3%) | 277 (5.1%) |
| 30 to 34 Years | 395 (6.5%) | 459 (8.5%) |
| 35 to 39 Years | 461 (7.6%) | 375 (7.0%) |
| 40 to 44 Years | 535 (8.8%) | 373 (6.9%) |
| 45 to 49 Years | 283 (4.7%) | 360 (6.7%) |
| 50 to 54 Years | 269 (4.4%) | 170 (3.2%) |
| 55 to 59 Years | 492 (8.1%) | 381 (7.1%) |
| 60 to 64 Years | 429 (7.1%) | 278 (5.2%) |
| 65 to 69 Years | 245 (4.1%) | 391 (7.2%) |
| 70 to 74 Years | 299 (4.9%) | 334 (6.2%) |
| 75 to 79 Years | 159 (2.6%) | 134 (2.5%) |
| 80 to 84 Years | 26 (0.4%) | 72 (1.3%) |
| 85 Years and over | 47 (0.8%) | 215 (4.0%) |
| Total | 6,052 (100.0%) | 5,392 (100.0%) |
Families and Households in Covington
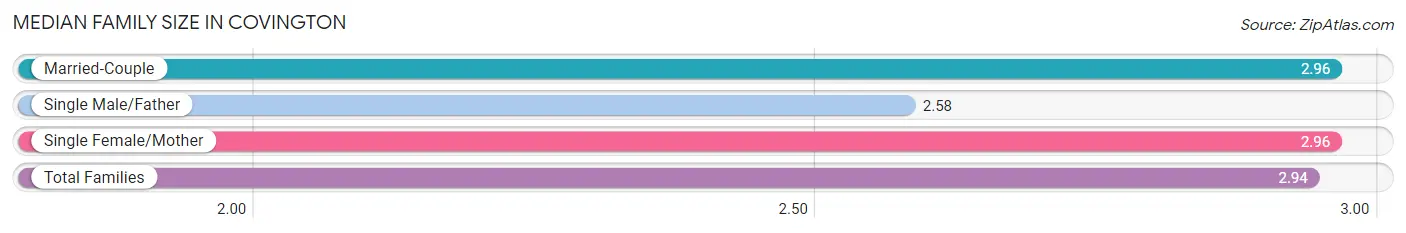
Median Family Size in Covington
The median family size in Covington is 2.94 persons per family, with married-couple families (2,095 | 69.1%) accounting for the largest median family size of 2.96 persons per family. On the other hand, single male/father families (224 | 7.4%) represent the smallest median family size with 2.58 persons per family.
| Family Type | # Families | Family Size |
| Married-Couple | 2,095 (69.1%) | 2.96 |
| Single Male/Father | 224 (7.4%) | 2.58 |
| Single Female/Mother | 712 (23.5%) | 2.96 |
| Total Families | 3,031 (100.0%) | 2.94 |
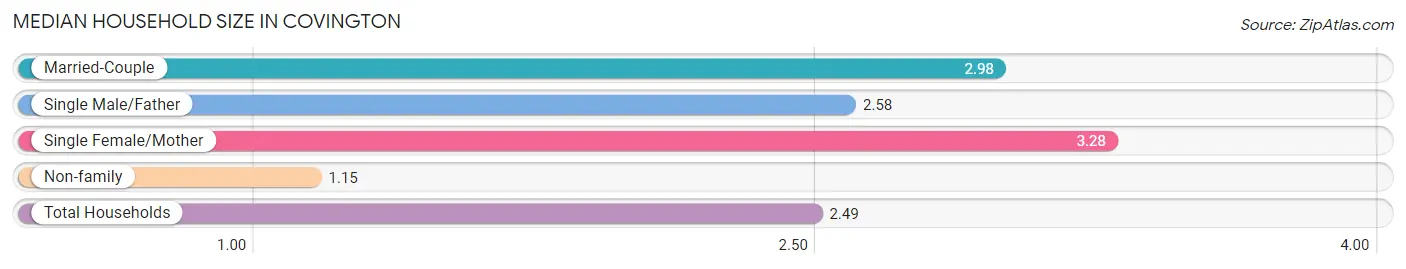
Median Household Size in Covington
The median household size in Covington is 2.49 persons per household, with single female/mother households (712 | 16.8%) accounting for the largest median household size of 3.28 persons per household. non-family households (1,210 | 28.5%) represent the smallest median household size with 1.15 persons per household.
| Household Type | # Households | Household Size |
| Married-Couple | 2,095 (49.4%) | 2.98 |
| Single Male/Father | 224 (5.3%) | 2.58 |
| Single Female/Mother | 712 (16.8%) | 3.28 |
| Non-family | 1,210 (28.5%) | 1.15 |
| Total Households | 4,241 (100.0%) | 2.49 |
Household Size by Marriage Status in Covington
Out of a total of 4,241 households in Covington, 3,031 (71.5%) are family households, while 1,210 (28.5%) are nonfamily households. The most numerous type of family households are 2-person households, comprising 1,428, and the most common type of nonfamily households are 1-person households, comprising 1,030.
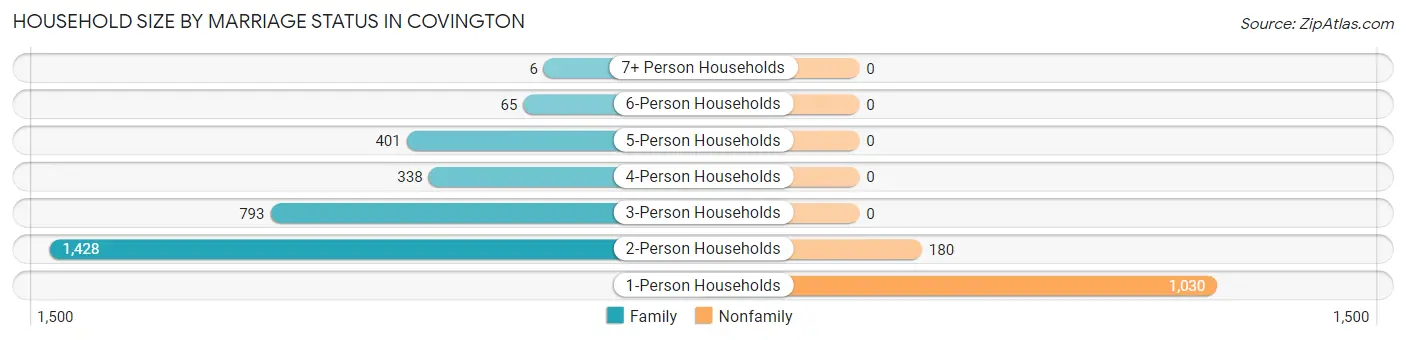
| Household Size | Family Households | Nonfamily Households |
| 1-Person Households | - | 1,030 (24.3%) |
| 2-Person Households | 1,428 (33.7%) | 180 (4.2%) |
| 3-Person Households | 793 (18.7%) | 0 (0.0%) |
| 4-Person Households | 338 (8.0%) | 0 (0.0%) |
| 5-Person Households | 401 (9.5%) | 0 (0.0%) |
| 6-Person Households | 65 (1.5%) | 0 (0.0%) |
| 7+ Person Households | 6 (0.1%) | 0 (0.0%) |
| Total | 3,031 (71.5%) | 1,210 (28.5%) |
Female Fertility in Covington
Fertility by Age in Covington
Average fertility rate in Covington is 38.0 births per 1,000 women. Women in the age bracket of 20 to 34 years have the highest fertility rate with 80.0 births per 1,000 women. Women in the age bracket of 20 to 34 years acount for 87.6% of all women with births.
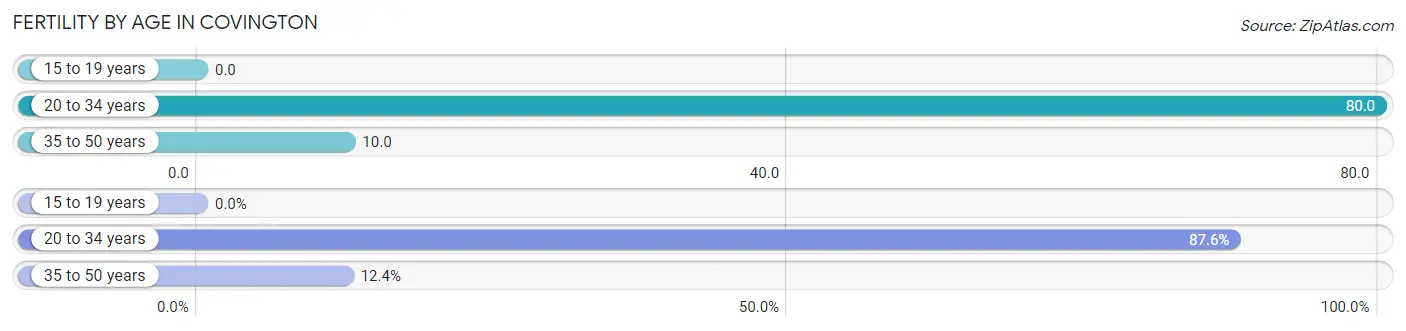
| Age Bracket | Women with Births | Births / 1,000 Women |
| 15 to 19 years | 0 (0.0%) | 0.0 |
| 20 to 34 years | 78 (87.6%) | 80.0 |
| 35 to 50 years | 11 (12.4%) | 10.0 |
| Total | 89 (100.0%) | 38.0 |
Fertility by Age by Marriage Status in Covington
86.5% of women with births (89) in Covington are married. The highest percentage of unmarried women with births falls into 20 to 34 years age bracket with 15.4% of them unmarried at the time of birth, while the lowest percentage of unmarried women with births belong to 35 to 50 years age bracket with 0.0% of them unmarried.
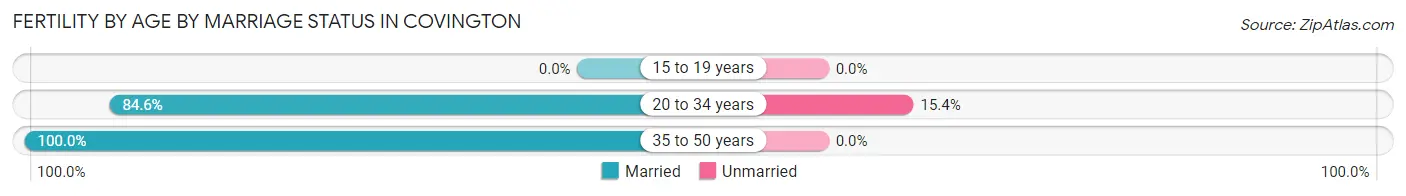
| Age Bracket | Married | Unmarried |
| 15 to 19 years | 0 (0.0%) | 0 (0.0%) |
| 20 to 34 years | 66 (84.6%) | 12 (15.4%) |
| 35 to 50 years | 11 (100.0%) | 0 (0.0%) |
| Total | 77 (86.5%) | 12 (13.5%) |
Fertility by Education in Covington
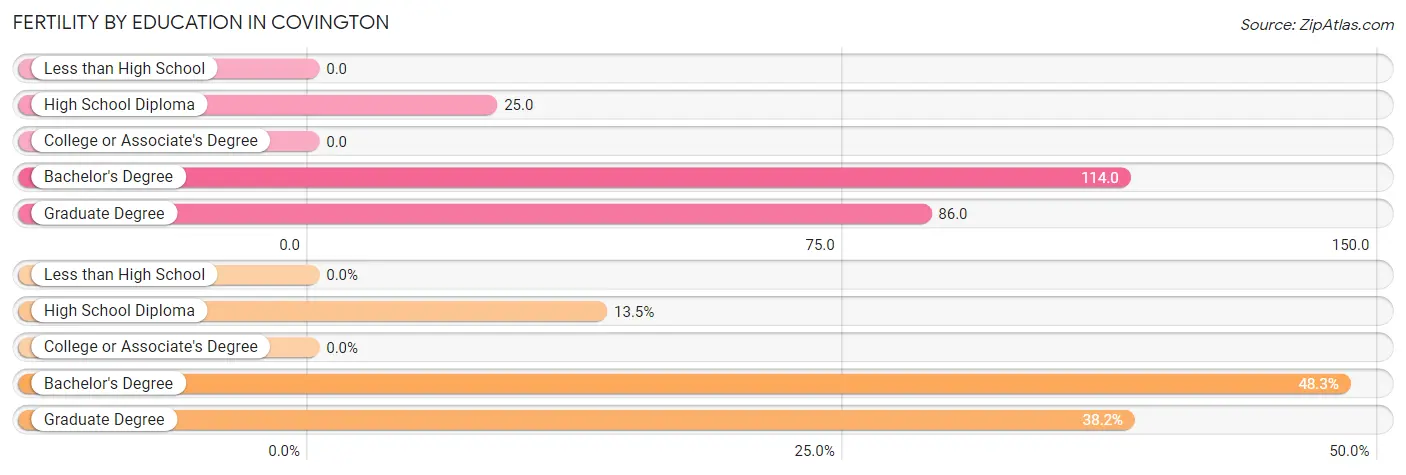
| Educational Attainment | Women with Births | Births / 1,000 Women |
| Less than High School | 0 (0.0%) | 0.0 |
| High School Diploma | 12 (13.5%) | 25.0 |
| College or Associate's Degree | 0 (0.0%) | 0.0 |
| Bachelor's Degree | 43 (48.3%) | 114.0 |
| Graduate Degree | 34 (38.2%) | 86.0 |
| Total | 89 (100.0%) | 38.0 |
Fertility by Education by Marriage Status in Covington
13.5% of women with births in Covington are unmarried. Women with the educational attainment of bachelor's degree are most likely to be married with 100.0% of them married at childbirth, while women with the educational attainment of high school diploma are least likely to be married with 100.0% of them unmarried at childbirth.
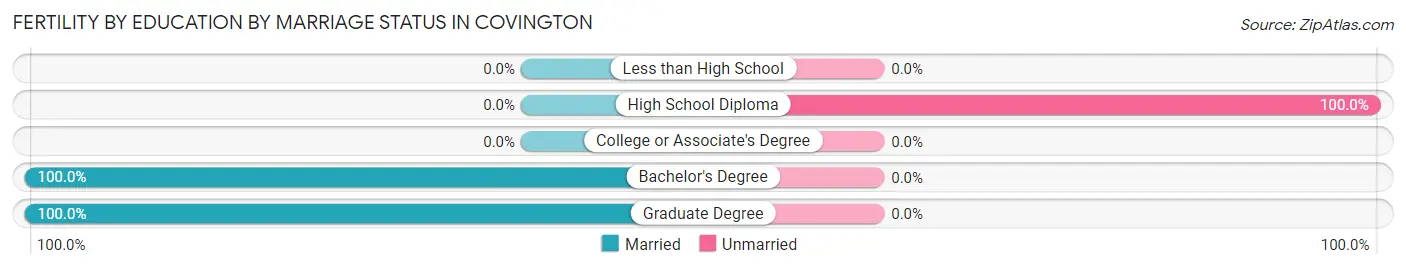
| Educational Attainment | Married | Unmarried |
| Less than High School | 0 (0.0%) | 0 (0.0%) |
| High School Diploma | 0 (0.0%) | 12 (100.0%) |
| College or Associate's Degree | 0 (0.0%) | 0 (0.0%) |
| Bachelor's Degree | 43 (100.0%) | 0 (0.0%) |
| Graduate Degree | 34 (100.0%) | 0 (0.0%) |
| Total | 77 (86.5%) | 12 (13.5%) |
Employment Characteristics in Covington
Employment by Class of Employer in Covington
Among the 4,650 employed individuals in Covington, private company employees (3,246 | 69.8%), not-for-profit organizations (514 | 11.1%), and self-employed (not incorporated) (305 | 6.6%) make up the most common classes of employment.
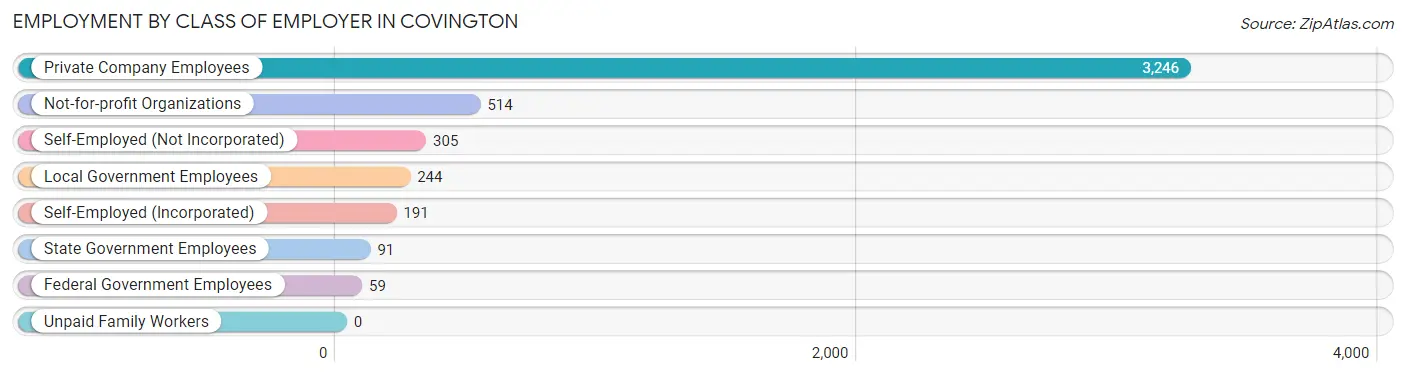
| Employer Class | # Employees | % Employees |
| Private Company Employees | 3,246 | 69.8% |
| Self-Employed (Incorporated) | 191 | 4.1% |
| Self-Employed (Not Incorporated) | 305 | 6.6% |
| Not-for-profit Organizations | 514 | 11.1% |
| Local Government Employees | 244 | 5.2% |
| State Government Employees | 91 | 2.0% |
| Federal Government Employees | 59 | 1.3% |
| Unpaid Family Workers | 0 | 0.0% |
| Total | 4,650 | 100.0% |
Employment Status by Age in Covington
According to the labor force statistics for Covington, out of the total population over 16 years of age (9,200), 55.5% or 5,106 individuals are in the labor force, with 4.7% or 240 of them unemployed. The age group with the highest labor force participation rate is 55 to 59 years, with 78.5% or 685 individuals in the labor force. Within the labor force, the 16 to 19 years age range has the highest percentage of unemployed individuals, with 13.4% or 29 of them being unemployed.
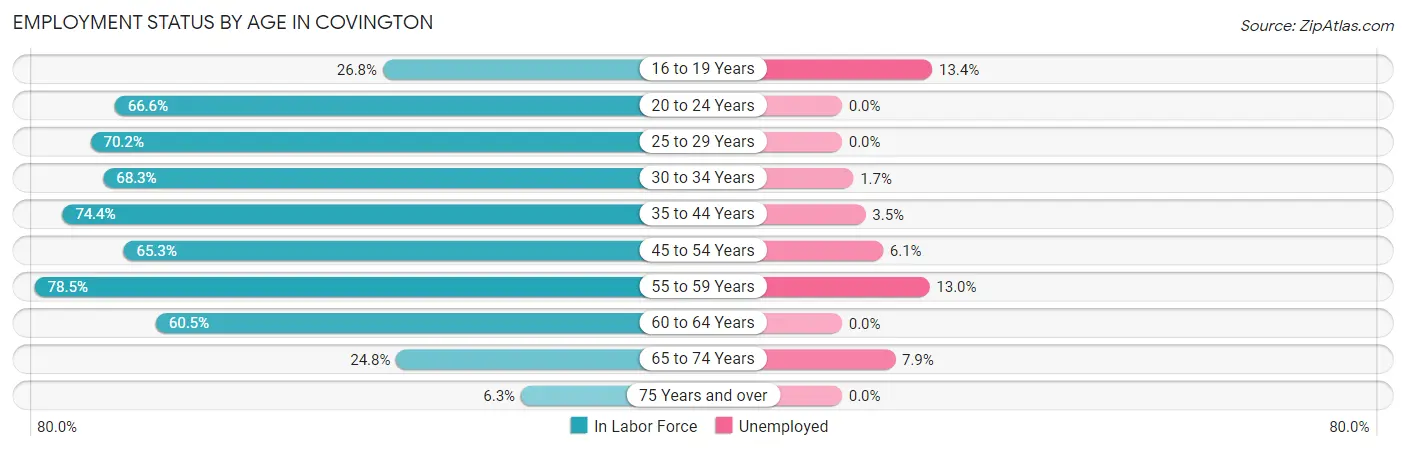
| Age Bracket | In Labor Force | Unemployed |
| 16 to 19 Years | 217 (26.8%) | 29 (13.4%) |
| 20 to 24 Years | 327 (66.6%) | 0 (0.0%) |
| 25 to 29 Years | 504 (70.2%) | 0 (0.0%) |
| 30 to 34 Years | 583 (68.3%) | 10 (1.7%) |
| 35 to 44 Years | 1,298 (74.4%) | 45 (3.5%) |
| 45 to 54 Years | 707 (65.3%) | 43 (6.1%) |
| 55 to 59 Years | 685 (78.5%) | 89 (13.0%) |
| 60 to 64 Years | 428 (60.5%) | 0 (0.0%) |
| 65 to 74 Years | 315 (24.8%) | 25 (7.9%) |
| 75 Years and over | 41 (6.3%) | 0 (0.0%) |
| Total | 5,106 (55.5%) | 240 (4.7%) |
Employment Status by Educational Attainment in Covington
According to labor force statistics for Covington, 70.3% of individuals (4,203) out of the total population between 25 and 64 years of age (5,978) are in the labor force, with 4.5% or 189 of them being unemployed. The group with the highest labor force participation rate are those with the educational attainment of bachelor's degree or higher, with 89.0% or 2,092 individuals in the labor force. Within the labor force, individuals with college / associate degree education have the highest percentage of unemployment, with 8.8% or 103 of them being unemployed.
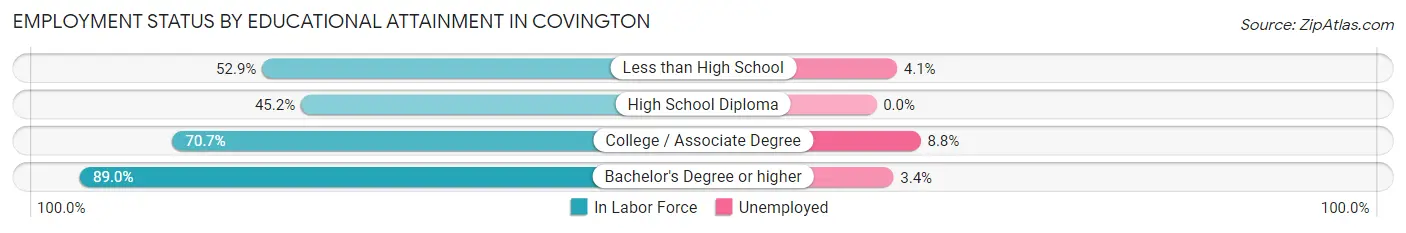
| Educational Attainment | In Labor Force | Unemployed |
| Less than High School | 342 (52.9%) | 26 (4.1%) |
| High School Diploma | 596 (45.2%) | 0 (0.0%) |
| College / Associate Degree | 1,176 (70.7%) | 146 (8.8%) |
| Bachelor's Degree or higher | 2,092 (89.0%) | 80 (3.4%) |
| Total | 4,203 (70.3%) | 269 (4.5%) |
Employment Occupations by Sex in Covington
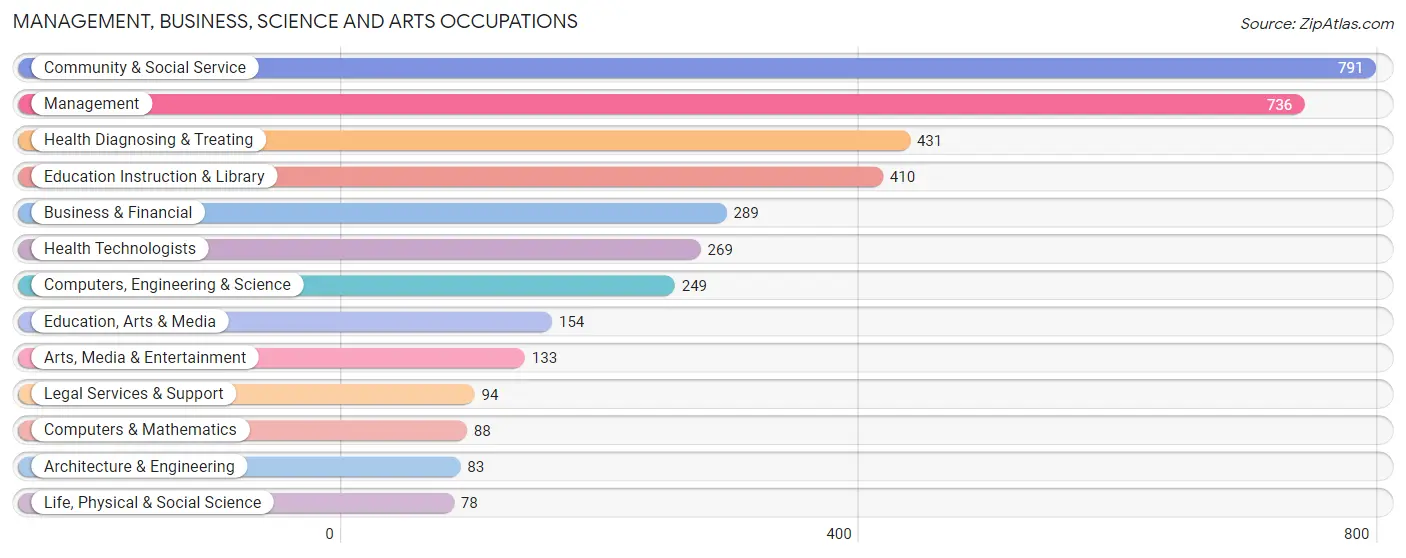
Management, Business, Science and Arts Occupations
The most common Management, Business, Science and Arts occupations in Covington are Community & Social Service (791 | 16.3%), Management (736 | 15.1%), Health Diagnosing & Treating (431 | 8.9%), Education Instruction & Library (410 | 8.4%), and Business & Financial (289 | 5.9%).
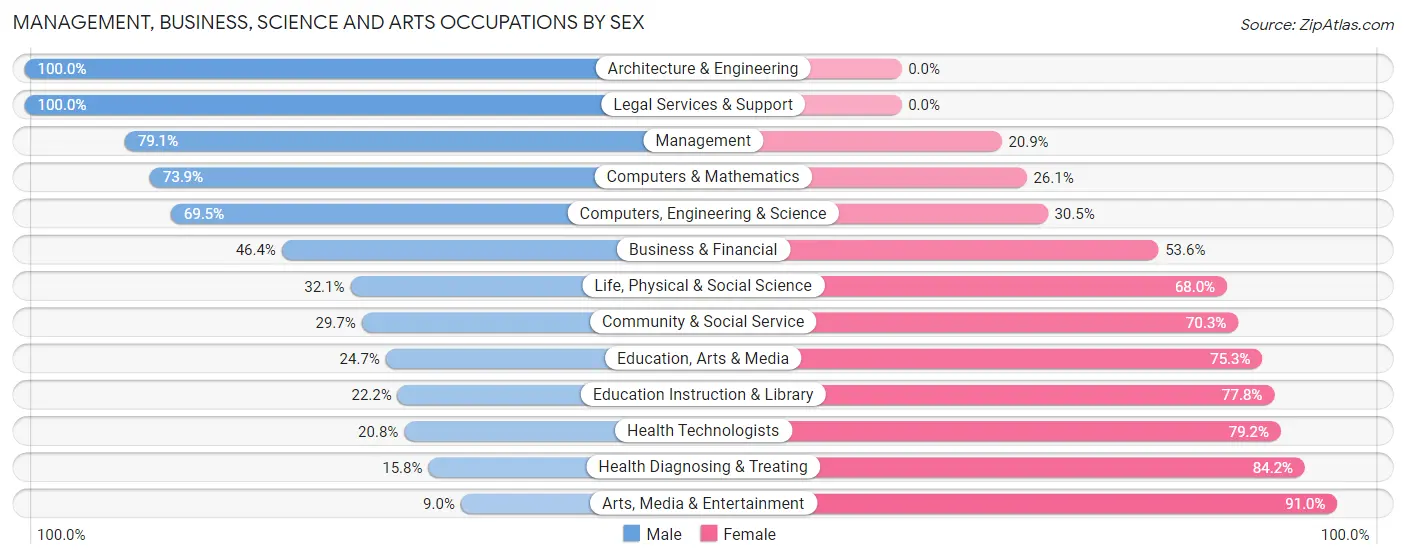
Management, Business, Science and Arts Occupations by Sex
Within the Management, Business, Science and Arts occupations in Covington, the most male-oriented occupations are Architecture & Engineering (100.0%), Legal Services & Support (100.0%), and Management (79.1%), while the most female-oriented occupations are Arts, Media & Entertainment (91.0%), Health Diagnosing & Treating (84.2%), and Health Technologists (79.2%).
| Occupation | Male | Female |
| Management | 582 (79.1%) | 154 (20.9%) |
| Business & Financial | 134 (46.4%) | 155 (53.6%) |
| Computers, Engineering & Science | 173 (69.5%) | 76 (30.5%) |
| Computers & Mathematics | 65 (73.9%) | 23 (26.1%) |
| Architecture & Engineering | 83 (100.0%) | 0 (0.0%) |
| Life, Physical & Social Science | 25 (32.1%) | 53 (67.9%) |
| Community & Social Service | 235 (29.7%) | 556 (70.3%) |
| Education, Arts & Media | 38 (24.7%) | 116 (75.3%) |
| Legal Services & Support | 94 (100.0%) | 0 (0.0%) |
| Education Instruction & Library | 91 (22.2%) | 319 (77.8%) |
| Arts, Media & Entertainment | 12 (9.0%) | 121 (91.0%) |
| Health Diagnosing & Treating | 68 (15.8%) | 363 (84.2%) |
| Health Technologists | 56 (20.8%) | 213 (79.2%) |
| Total (Category) | 1,192 (47.8%) | 1,304 (52.2%) |
| Total (Overall) | 2,511 (51.6%) | 2,352 (48.4%) |
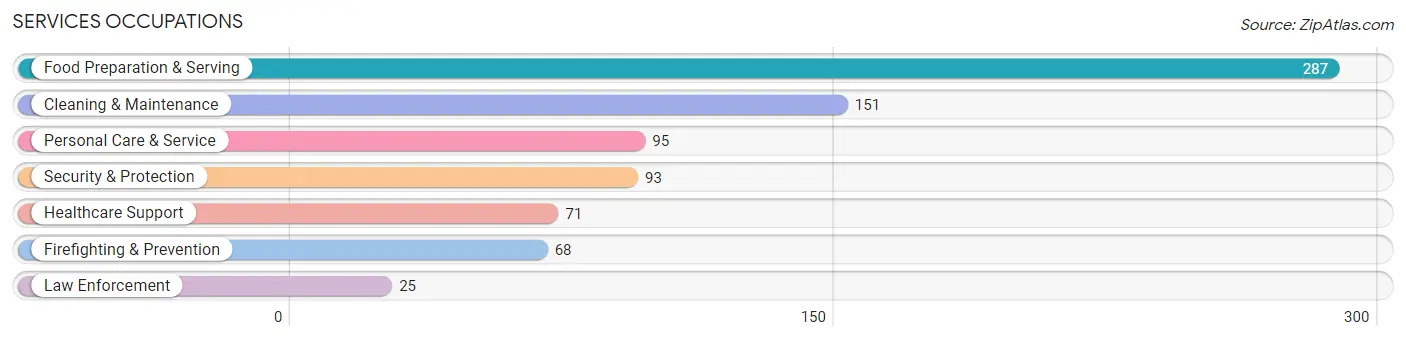
Services Occupations
The most common Services occupations in Covington are Food Preparation & Serving (287 | 5.9%), Cleaning & Maintenance (151 | 3.1%), Personal Care & Service (95 | 1.9%), Security & Protection (93 | 1.9%), and Healthcare Support (71 | 1.5%).
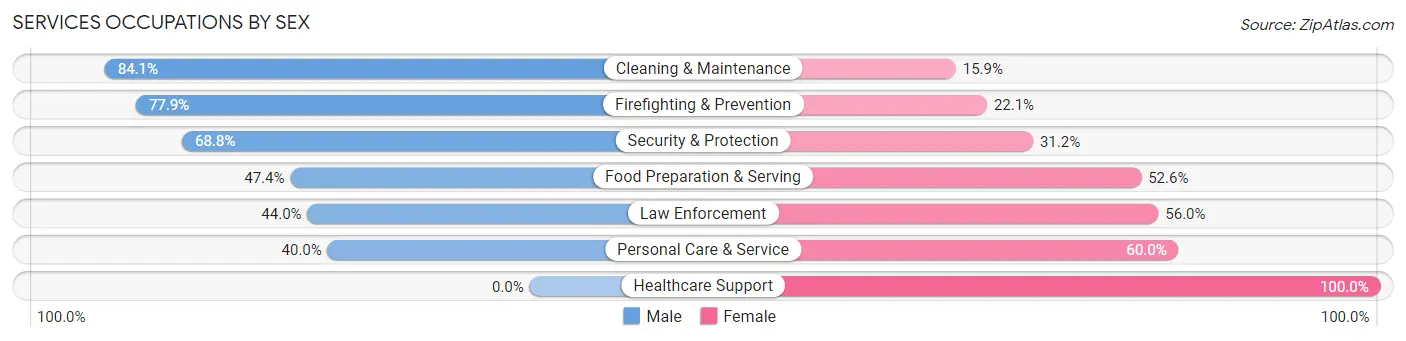
Services Occupations by Sex
Within the Services occupations in Covington, the most male-oriented occupations are Cleaning & Maintenance (84.1%), Firefighting & Prevention (77.9%), and Security & Protection (68.8%), while the most female-oriented occupations are Healthcare Support (100.0%), Personal Care & Service (60.0%), and Law Enforcement (56.0%).
| Occupation | Male | Female |
| Healthcare Support | 0 (0.0%) | 71 (100.0%) |
| Security & Protection | 64 (68.8%) | 29 (31.2%) |
| Firefighting & Prevention | 53 (77.9%) | 15 (22.1%) |
| Law Enforcement | 11 (44.0%) | 14 (56.0%) |
| Food Preparation & Serving | 136 (47.4%) | 151 (52.6%) |
| Cleaning & Maintenance | 127 (84.1%) | 24 (15.9%) |
| Personal Care & Service | 38 (40.0%) | 57 (60.0%) |
| Total (Category) | 365 (52.4%) | 332 (47.6%) |
| Total (Overall) | 2,511 (51.6%) | 2,352 (48.4%) |
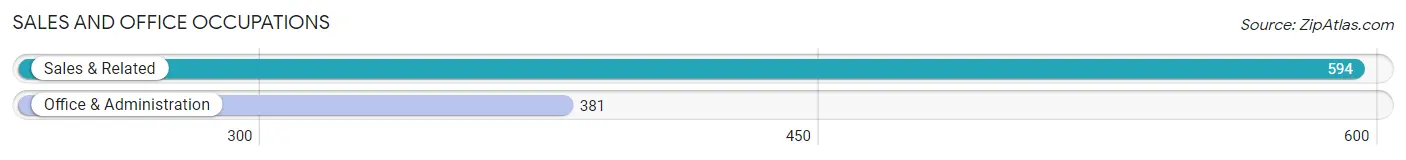
Sales and Office Occupations
The most common Sales and Office occupations in Covington are Sales & Related (594 | 12.2%), and Office & Administration (381 | 7.8%).
Sales and Office Occupations by Sex
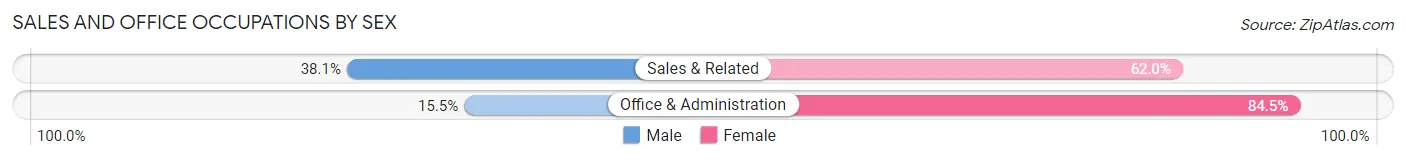
| Occupation | Male | Female |
| Sales & Related | 226 (38.1%) | 368 (62.0%) |
| Office & Administration | 59 (15.5%) | 322 (84.5%) |
| Total (Category) | 285 (29.2%) | 690 (70.8%) |
| Total (Overall) | 2,511 (51.6%) | 2,352 (48.4%) |
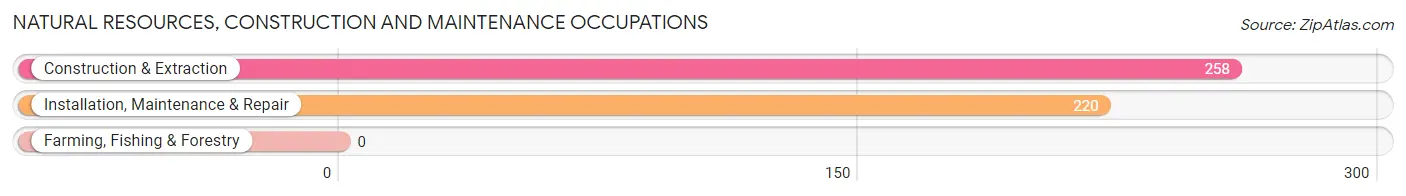
Natural Resources, Construction and Maintenance Occupations
The most common Natural Resources, Construction and Maintenance occupations in Covington are Construction & Extraction (258 | 5.3%), and Installation, Maintenance & Repair (220 | 4.5%).
Natural Resources, Construction and Maintenance Occupations by Sex
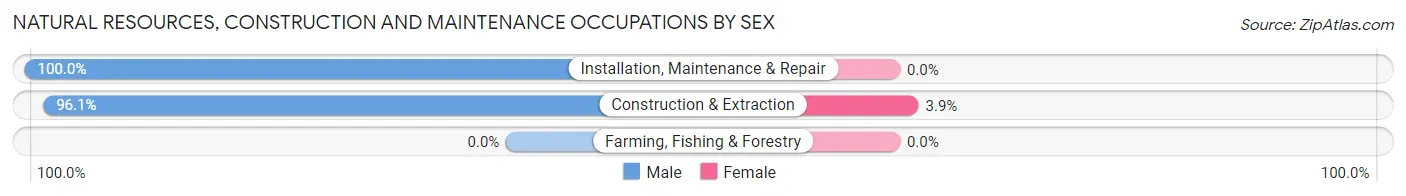
| Occupation | Male | Female |
| Farming, Fishing & Forestry | 0 (0.0%) | 0 (0.0%) |
| Construction & Extraction | 248 (96.1%) | 10 (3.9%) |
| Installation, Maintenance & Repair | 220 (100.0%) | 0 (0.0%) |
| Total (Category) | 468 (97.9%) | 10 (2.1%) |
| Total (Overall) | 2,511 (51.6%) | 2,352 (48.4%) |
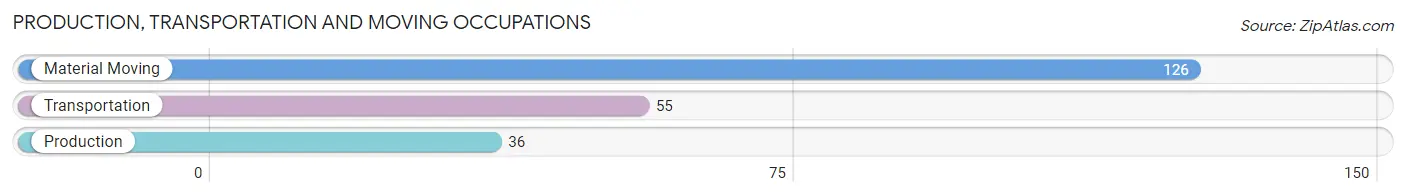
Production, Transportation and Moving Occupations
The most common Production, Transportation and Moving occupations in Covington are Material Moving (126 | 2.6%), Transportation (55 | 1.1%), and Production (36 | 0.7%).
Production, Transportation and Moving Occupations by Sex
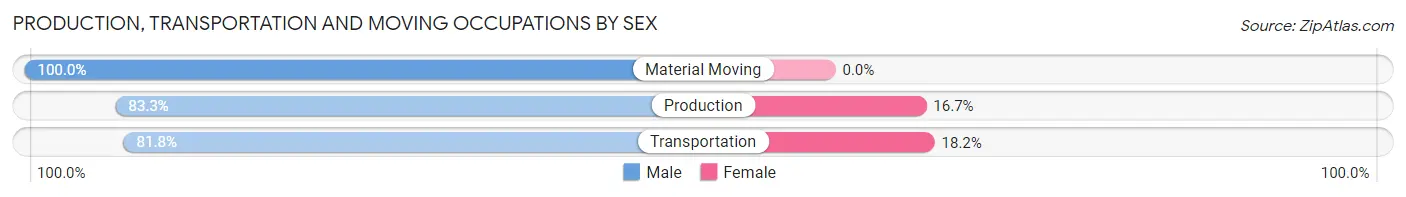
| Occupation | Male | Female |
| Production | 30 (83.3%) | 6 (16.7%) |
| Transportation | 45 (81.8%) | 10 (18.2%) |
| Material Moving | 126 (100.0%) | 0 (0.0%) |
| Total (Category) | 201 (92.6%) | 16 (7.4%) |
| Total (Overall) | 2,511 (51.6%) | 2,352 (48.4%) |
Employment Industries by Sex in Covington
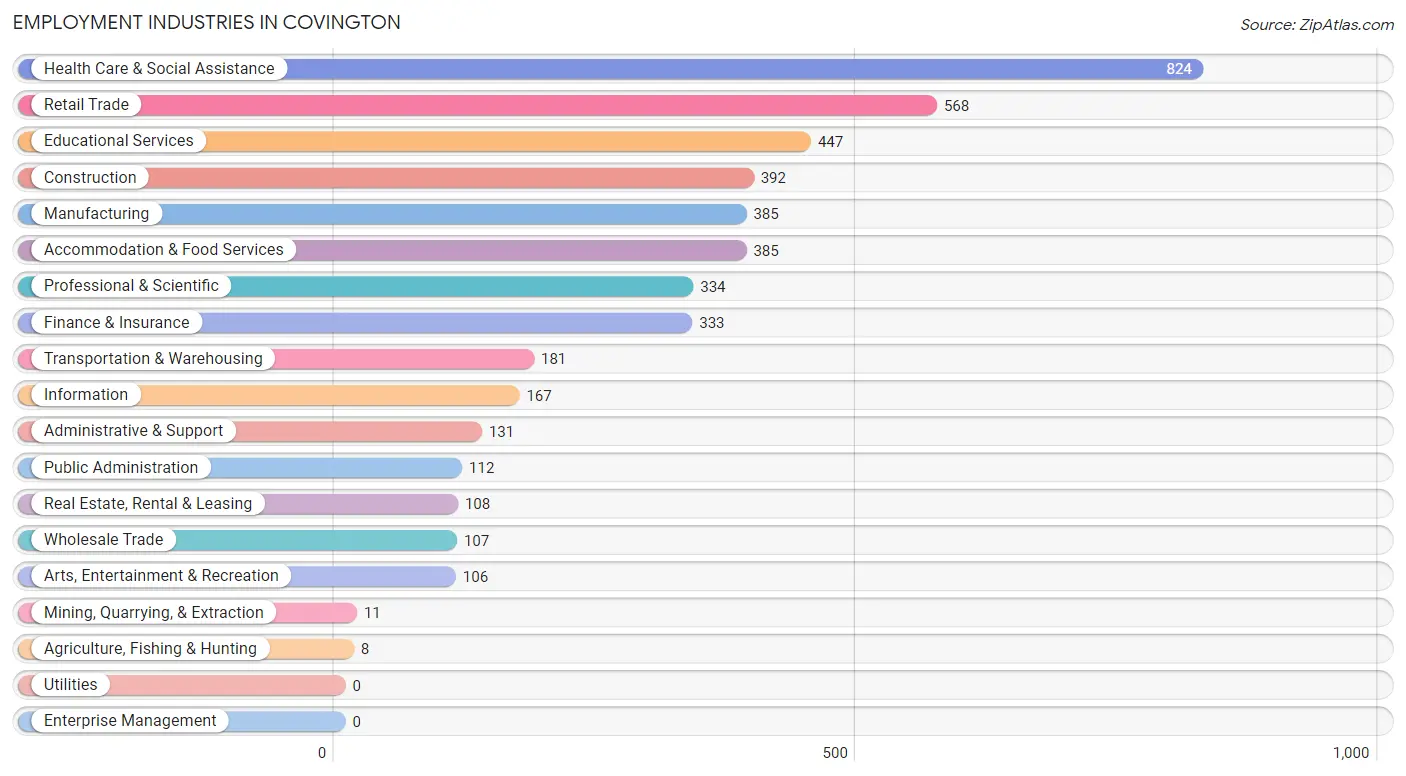
Employment Industries in Covington
The major employment industries in Covington include Health Care & Social Assistance (824 | 16.9%), Retail Trade (568 | 11.7%), Educational Services (447 | 9.2%), Construction (392 | 8.1%), and Manufacturing (385 | 7.9%).
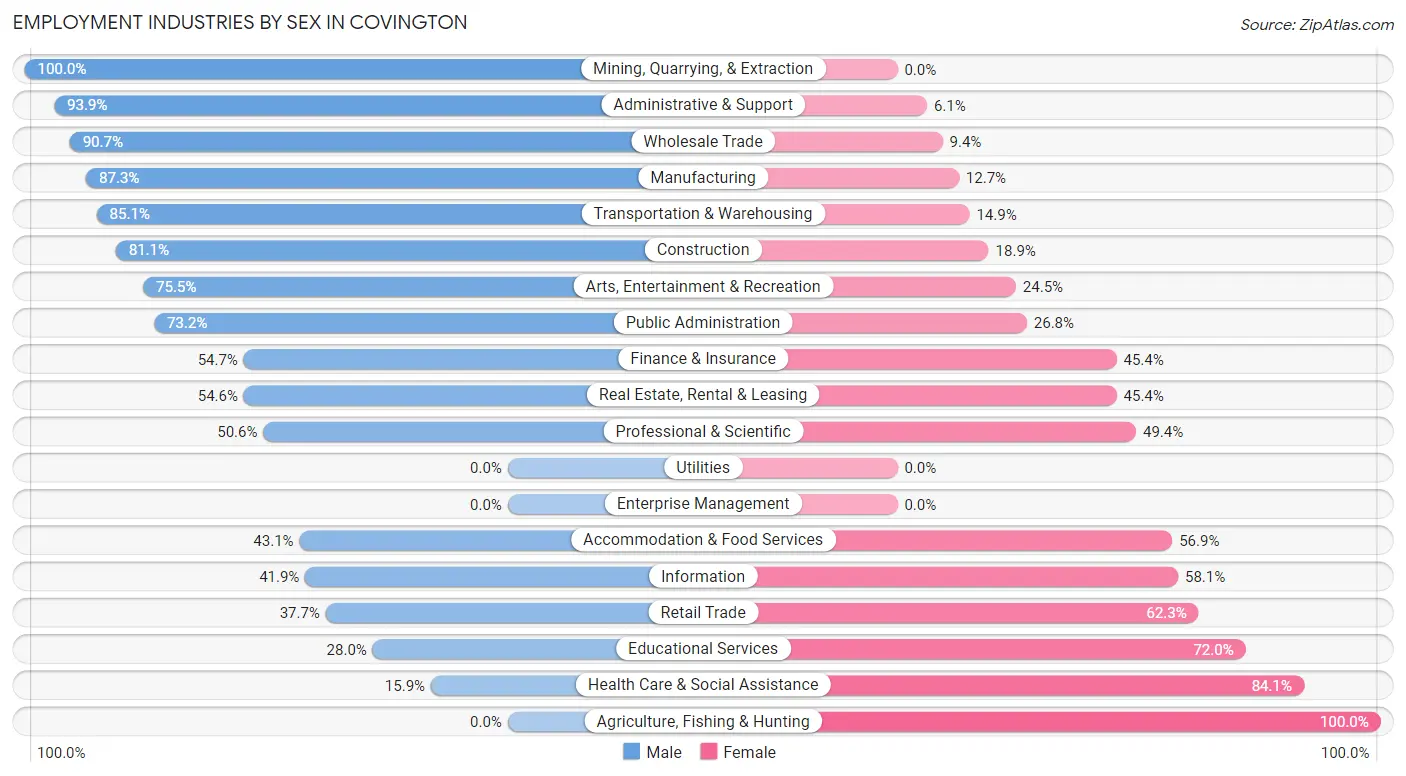
Employment Industries by Sex in Covington
The Covington industries that see more men than women are Mining, Quarrying, & Extraction (100.0%), Administrative & Support (93.9%), and Wholesale Trade (90.6%), whereas the industries that tend to have a higher number of women are Agriculture, Fishing & Hunting (100.0%), Health Care & Social Assistance (84.1%), and Educational Services (72.0%).
| Industry | Male | Female |
| Agriculture, Fishing & Hunting | 0 (0.0%) | 8 (100.0%) |
| Mining, Quarrying, & Extraction | 11 (100.0%) | 0 (0.0%) |
| Construction | 318 (81.1%) | 74 (18.9%) |
| Manufacturing | 336 (87.3%) | 49 (12.7%) |
| Wholesale Trade | 97 (90.6%) | 10 (9.3%) |
| Retail Trade | 214 (37.7%) | 354 (62.3%) |
| Transportation & Warehousing | 154 (85.1%) | 27 (14.9%) |
| Utilities | 0 (0.0%) | 0 (0.0%) |
| Information | 70 (41.9%) | 97 (58.1%) |
| Finance & Insurance | 182 (54.6%) | 151 (45.4%) |
| Real Estate, Rental & Leasing | 59 (54.6%) | 49 (45.4%) |
| Professional & Scientific | 169 (50.6%) | 165 (49.4%) |
| Enterprise Management | 0 (0.0%) | 0 (0.0%) |
| Administrative & Support | 123 (93.9%) | 8 (6.1%) |
| Educational Services | 125 (28.0%) | 322 (72.0%) |
| Health Care & Social Assistance | 131 (15.9%) | 693 (84.1%) |
| Arts, Entertainment & Recreation | 80 (75.5%) | 26 (24.5%) |
| Accommodation & Food Services | 166 (43.1%) | 219 (56.9%) |
| Public Administration | 82 (73.2%) | 30 (26.8%) |
| Total | 2,511 (51.6%) | 2,352 (48.4%) |
Education in Covington
School Enrollment in Covington
The most common levels of schooling among the 2,627 students in Covington are high school (846 | 32.2%), elementary school (753 | 28.7%), and middle school (426 | 16.2%).
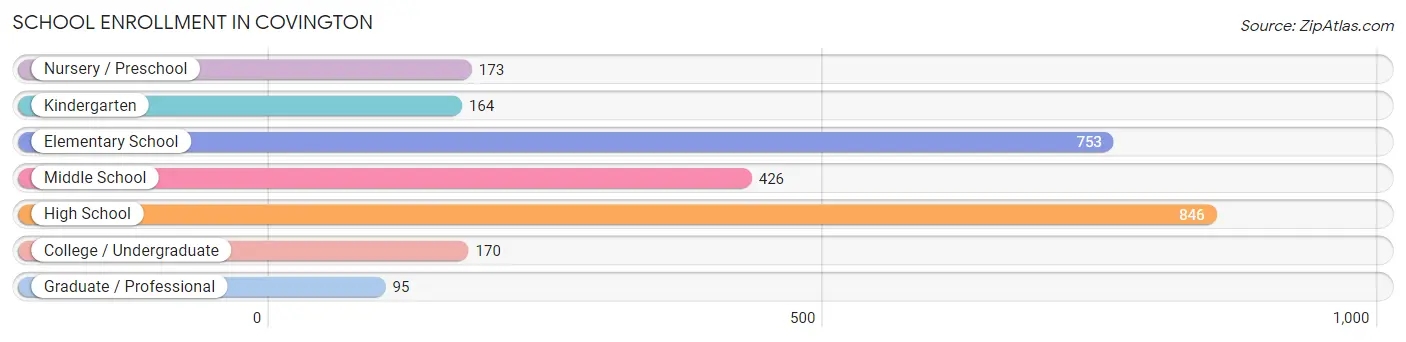
| School Level | # Students | % Students |
| Nursery / Preschool | 173 | 6.6% |
| Kindergarten | 164 | 6.2% |
| Elementary School | 753 | 28.7% |
| Middle School | 426 | 16.2% |
| High School | 846 | 32.2% |
| College / Undergraduate | 170 | 6.5% |
| Graduate / Professional | 95 | 3.6% |
| Total | 2,627 | 100.0% |
School Enrollment by Age by Funding Source in Covington
Out of a total of 2,627 students who are enrolled in schools in Covington, 1,132 (43.1%) attend a private institution, while the remaining 1,495 (56.9%) are enrolled in public schools. The age group of 3 to 4 year olds has the highest likelihood of being enrolled in private schools, with 142 (82.1% in the age bracket) enrolled. Conversely, the age group of 20 to 24 year olds has the lowest likelihood of being enrolled in a private school, with 45 (83.3% in the age bracket) attending a public institution.
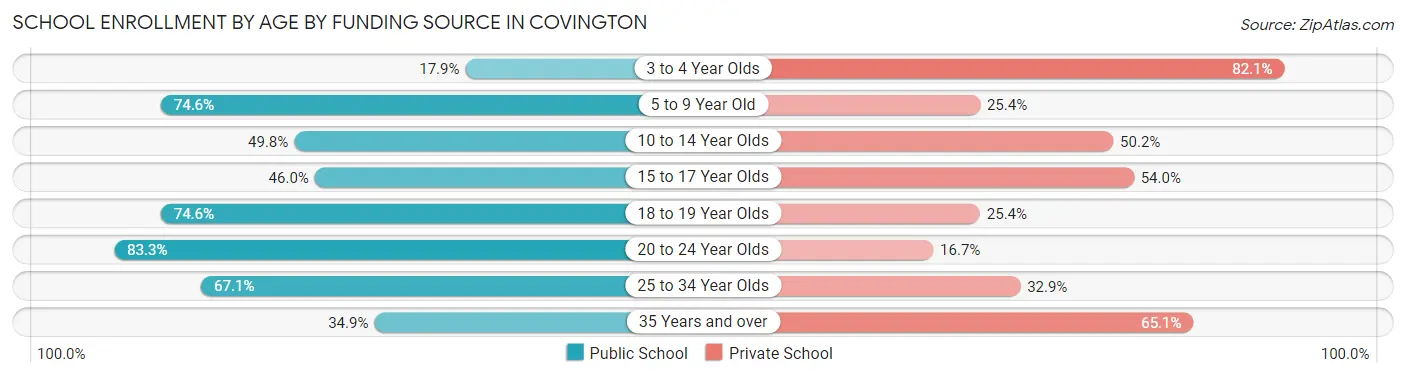
| Age Bracket | Public School | Private School |
| 3 to 4 Year Olds | 31 (17.9%) | 142 (82.1%) |
| 5 to 9 Year Old | 629 (74.6%) | 214 (25.4%) |
| 10 to 14 Year Olds | 376 (49.8%) | 379 (50.2%) |
| 15 to 17 Year Olds | 234 (46.0%) | 275 (54.0%) |
| 18 to 19 Year Olds | 100 (74.6%) | 34 (25.4%) |
| 20 to 24 Year Olds | 45 (83.3%) | 9 (16.7%) |
| 25 to 34 Year Olds | 49 (67.1%) | 24 (32.9%) |
| 35 Years and over | 30 (34.9%) | 56 (65.1%) |
| Total | 1,495 (56.9%) | 1,132 (43.1%) |
Educational Attainment by Field of Study in Covington
Business (707 | 20.3%), education (418 | 12.0%), science & technology (365 | 10.5%), bio, nature & agricultural (251 | 7.2%), and arts & humanities (248 | 7.1%) are the most common fields of study among 3,482 individuals in Covington who have obtained a bachelor's degree or higher.
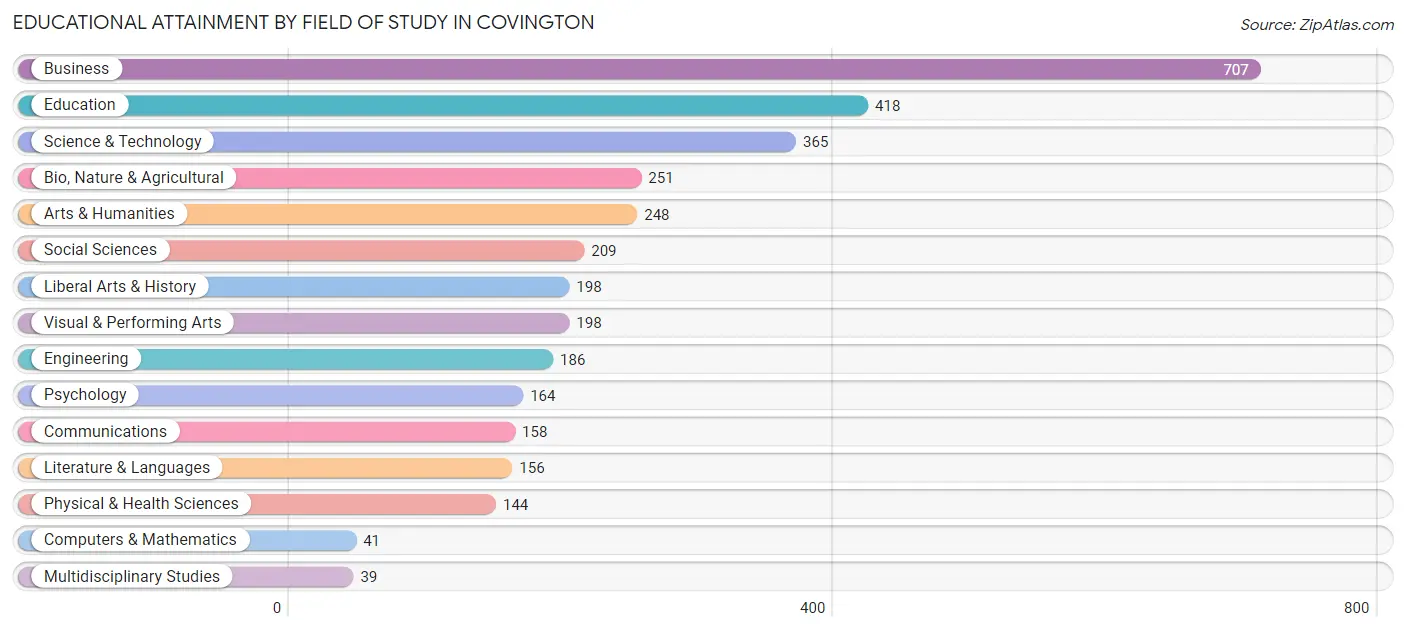
| Field of Study | # Graduates | % Graduates |
| Computers & Mathematics | 41 | 1.2% |
| Bio, Nature & Agricultural | 251 | 7.2% |
| Physical & Health Sciences | 144 | 4.1% |
| Psychology | 164 | 4.7% |
| Social Sciences | 209 | 6.0% |
| Engineering | 186 | 5.3% |
| Multidisciplinary Studies | 39 | 1.1% |
| Science & Technology | 365 | 10.5% |
| Business | 707 | 20.3% |
| Education | 418 | 12.0% |
| Literature & Languages | 156 | 4.5% |
| Liberal Arts & History | 198 | 5.7% |
| Visual & Performing Arts | 198 | 5.7% |
| Communications | 158 | 4.5% |
| Arts & Humanities | 248 | 7.1% |
| Total | 3,482 | 100.0% |
Transportation & Commute in Covington
Vehicle Availability by Sex in Covington
The most prevalent vehicle ownership categories in Covington are males with 2 vehicles (1,114, accounting for 47.4%) and females with 2 vehicles (1,115, making up 48.6%).
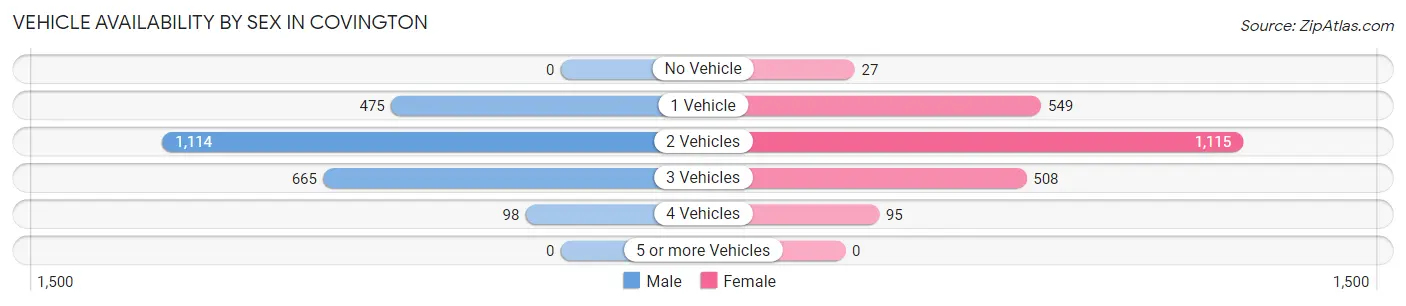
| Vehicles Available | Male | Female |
| No Vehicle | 0 (0.0%) | 27 (1.2%) |
| 1 Vehicle | 475 (20.2%) | 549 (23.9%) |
| 2 Vehicles | 1,114 (47.4%) | 1,115 (48.6%) |
| 3 Vehicles | 665 (28.3%) | 508 (22.1%) |
| 4 Vehicles | 98 (4.2%) | 95 (4.1%) |
| 5 or more Vehicles | 0 (0.0%) | 0 (0.0%) |
| Total | 2,352 (100.0%) | 2,294 (100.0%) |
Commute Time in Covington
The most frequently occuring commute durations in Covington are 15 to 19 minutes (989 commuters, 23.6%), 10 to 14 minutes (696 commuters, 16.6%), and 45 to 59 minutes (439 commuters, 10.5%).
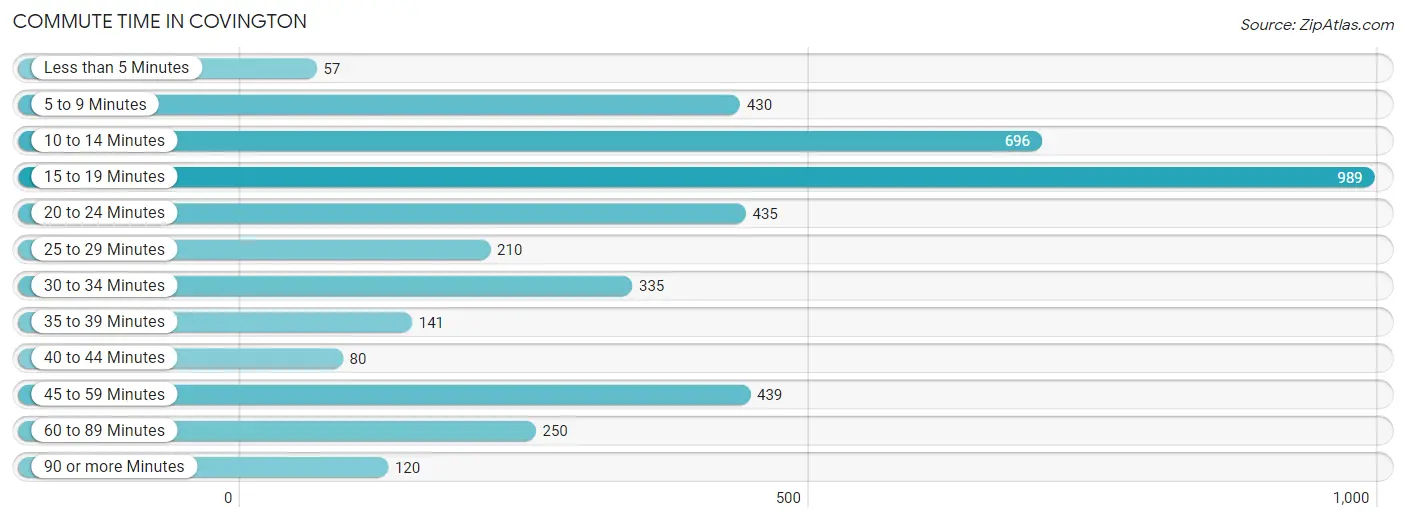
| Commute Time | # Commuters | % Commuters |
| Less than 5 Minutes | 57 | 1.4% |
| 5 to 9 Minutes | 430 | 10.3% |
| 10 to 14 Minutes | 696 | 16.6% |
| 15 to 19 Minutes | 989 | 23.6% |
| 20 to 24 Minutes | 435 | 10.4% |
| 25 to 29 Minutes | 210 | 5.0% |
| 30 to 34 Minutes | 335 | 8.0% |
| 35 to 39 Minutes | 141 | 3.4% |
| 40 to 44 Minutes | 80 | 1.9% |
| 45 to 59 Minutes | 439 | 10.5% |
| 60 to 89 Minutes | 250 | 6.0% |
| 90 or more Minutes | 120 | 2.9% |
Commute Time by Sex in Covington
The most common commute times in Covington are 15 to 19 minutes (462 commuters, 22.4%) for males and 15 to 19 minutes (527 commuters, 24.9%) for females.
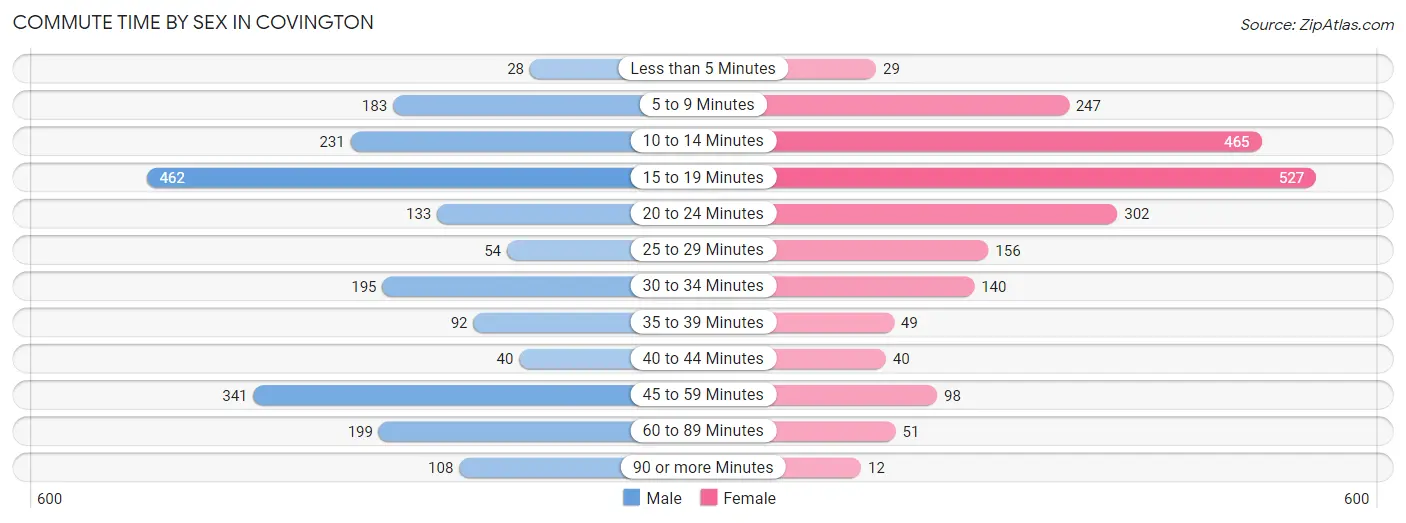
| Commute Time | Male | Female |
| Less than 5 Minutes | 28 (1.4%) | 29 (1.4%) |
| 5 to 9 Minutes | 183 (8.9%) | 247 (11.7%) |
| 10 to 14 Minutes | 231 (11.2%) | 465 (22.0%) |
| 15 to 19 Minutes | 462 (22.4%) | 527 (24.9%) |
| 20 to 24 Minutes | 133 (6.4%) | 302 (14.3%) |
| 25 to 29 Minutes | 54 (2.6%) | 156 (7.4%) |
| 30 to 34 Minutes | 195 (9.4%) | 140 (6.6%) |
| 35 to 39 Minutes | 92 (4.4%) | 49 (2.3%) |
| 40 to 44 Minutes | 40 (1.9%) | 40 (1.9%) |
| 45 to 59 Minutes | 341 (16.5%) | 98 (4.6%) |
| 60 to 89 Minutes | 199 (9.6%) | 51 (2.4%) |
| 90 or more Minutes | 108 (5.2%) | 12 (0.6%) |
Time of Departure to Work by Sex in Covington
The most frequent times of departure to work in Covington are 7:00 AM to 7:29 AM (469, 22.7%) for males and 7:30 AM to 7:59 AM (283, 13.4%) for females.
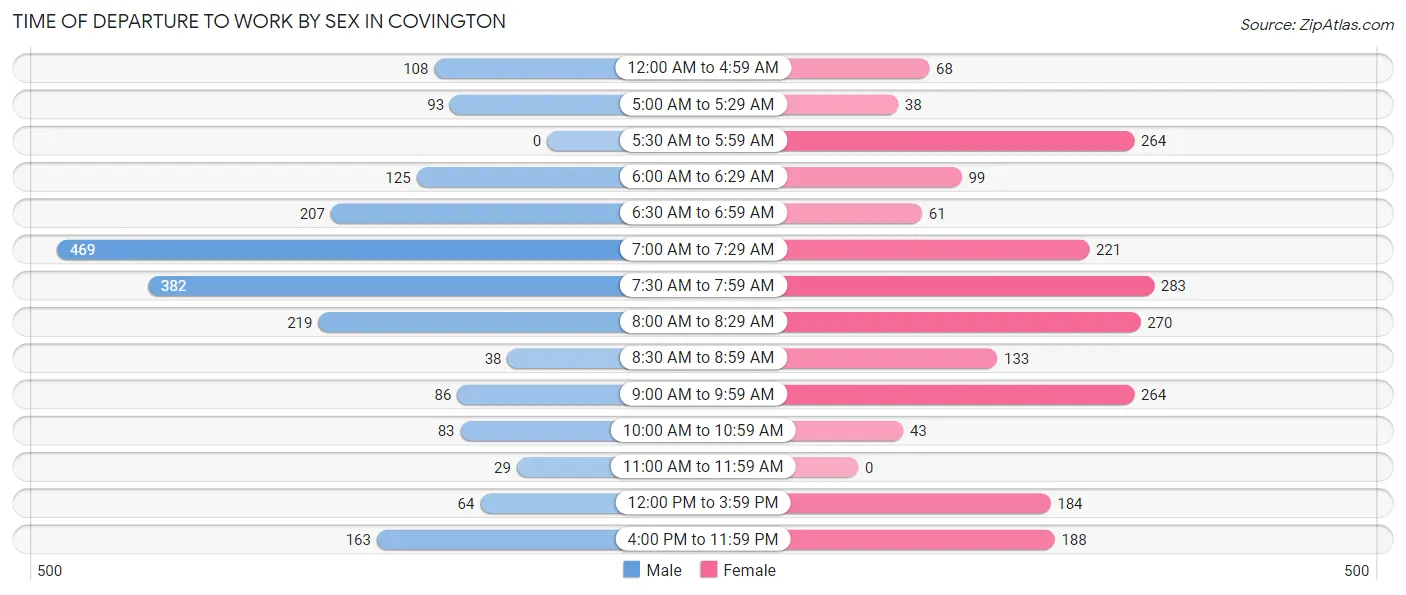
| Time of Departure | Male | Female |
| 12:00 AM to 4:59 AM | 108 (5.2%) | 68 (3.2%) |
| 5:00 AM to 5:29 AM | 93 (4.5%) | 38 (1.8%) |
| 5:30 AM to 5:59 AM | 0 (0.0%) | 264 (12.5%) |
| 6:00 AM to 6:29 AM | 125 (6.0%) | 99 (4.7%) |
| 6:30 AM to 6:59 AM | 207 (10.0%) | 61 (2.9%) |
| 7:00 AM to 7:29 AM | 469 (22.7%) | 221 (10.4%) |
| 7:30 AM to 7:59 AM | 382 (18.5%) | 283 (13.4%) |
| 8:00 AM to 8:29 AM | 219 (10.6%) | 270 (12.8%) |
| 8:30 AM to 8:59 AM | 38 (1.8%) | 133 (6.3%) |
| 9:00 AM to 9:59 AM | 86 (4.2%) | 264 (12.5%) |
| 10:00 AM to 10:59 AM | 83 (4.0%) | 43 (2.0%) |
| 11:00 AM to 11:59 AM | 29 (1.4%) | 0 (0.0%) |
| 12:00 PM to 3:59 PM | 64 (3.1%) | 184 (8.7%) |
| 4:00 PM to 11:59 PM | 163 (7.9%) | 188 (8.9%) |
| Total | 2,066 (100.0%) | 2,116 (100.0%) |
Housing Occupancy in Covington
Occupancy by Ownership in Covington
Of the total 4,241 dwellings in Covington, owner-occupied units account for 2,724 (64.2%), while renter-occupied units make up 1,517 (35.8%).
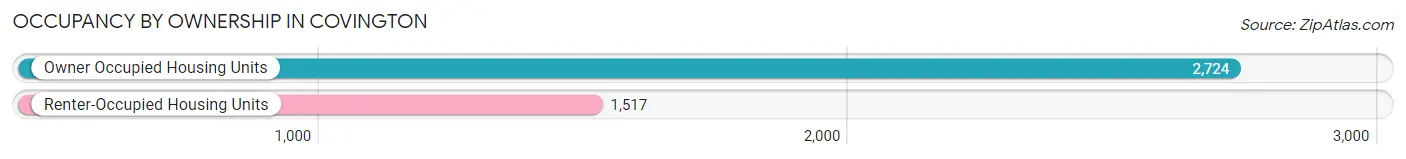
| Occupancy | # Housing Units | % Housing Units |
| Owner Occupied Housing Units | 2,724 | 64.2% |
| Renter-Occupied Housing Units | 1,517 | 35.8% |
| Total Occupied Housing Units | 4,241 | 100.0% |
Occupancy by Household Size in Covington
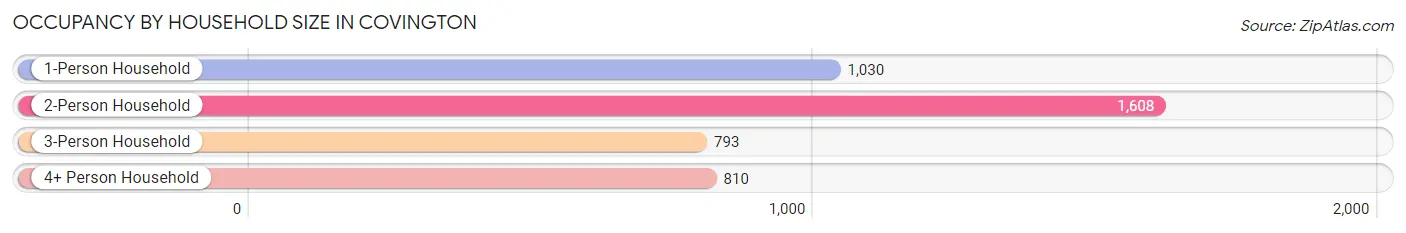
| Household Size | # Housing Units | % Housing Units |
| 1-Person Household | 1,030 | 24.3% |
| 2-Person Household | 1,608 | 37.9% |
| 3-Person Household | 793 | 18.7% |
| 4+ Person Household | 810 | 19.1% |
| Total Housing Units | 4,241 | 100.0% |
Occupancy by Ownership by Household Size in Covington
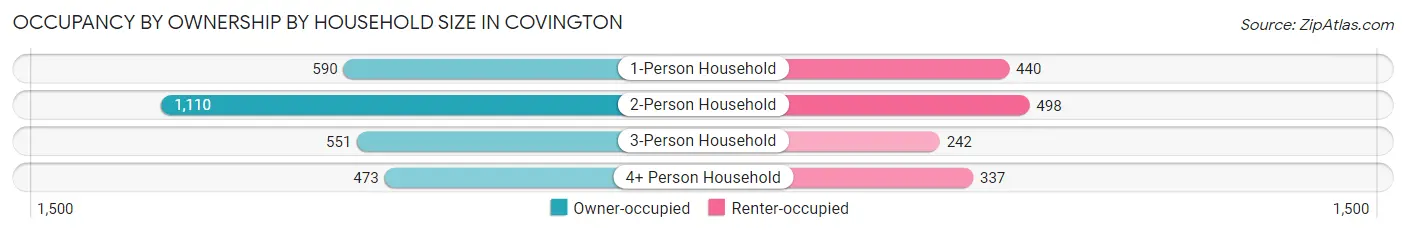
| Household Size | Owner-occupied | Renter-occupied |
| 1-Person Household | 590 (57.3%) | 440 (42.7%) |
| 2-Person Household | 1,110 (69.0%) | 498 (31.0%) |
| 3-Person Household | 551 (69.5%) | 242 (30.5%) |
| 4+ Person Household | 473 (58.4%) | 337 (41.6%) |
| Total Housing Units | 2,724 (64.2%) | 1,517 (35.8%) |
Occupancy by Educational Attainment in Covington
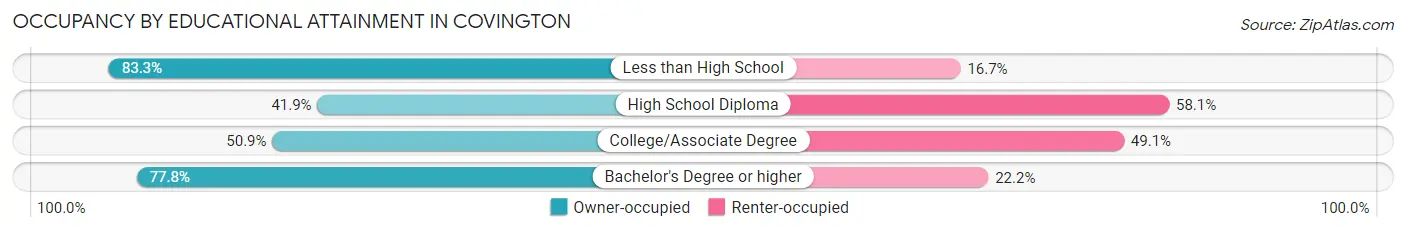
| Household Size | Owner-occupied | Renter-occupied |
| Less than High School | 289 (83.3%) | 58 (16.7%) |
| High School Diploma | 302 (41.9%) | 418 (58.1%) |
| College/Associate Degree | 635 (50.9%) | 613 (49.1%) |
| Bachelor's Degree or higher | 1,498 (77.8%) | 428 (22.2%) |
Occupancy by Age of Householder in Covington
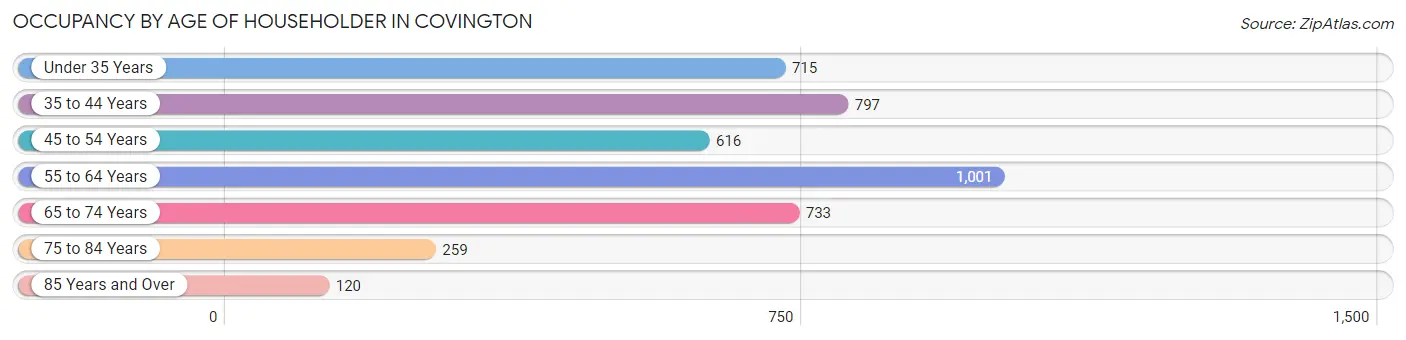
| Age Bracket | # Households | % Households |
| Under 35 Years | 715 | 16.9% |
| 35 to 44 Years | 797 | 18.8% |
| 45 to 54 Years | 616 | 14.5% |
| 55 to 64 Years | 1,001 | 23.6% |
| 65 to 74 Years | 733 | 17.3% |
| 75 to 84 Years | 259 | 6.1% |
| 85 Years and Over | 120 | 2.8% |
| Total | 4,241 | 100.0% |
Housing Finances in Covington
Median Income by Occupancy in Covington
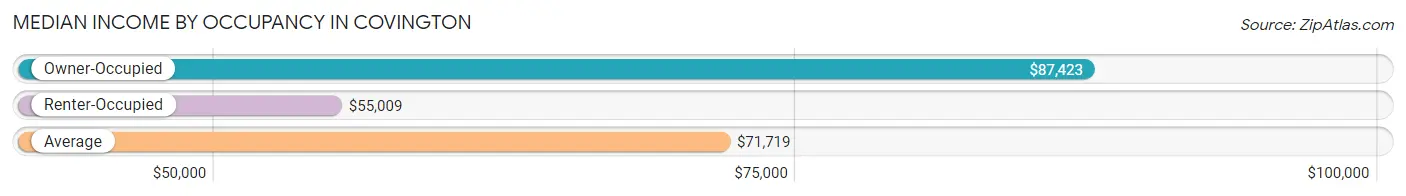
| Occupancy Type | # Households | Median Income |
| Owner-Occupied | 2,724 (64.2%) | $87,423 |
| Renter-Occupied | 1,517 (35.8%) | $55,009 |
| Average | 4,241 (100.0%) | $71,719 |
Occupancy by Householder Income Bracket in Covington
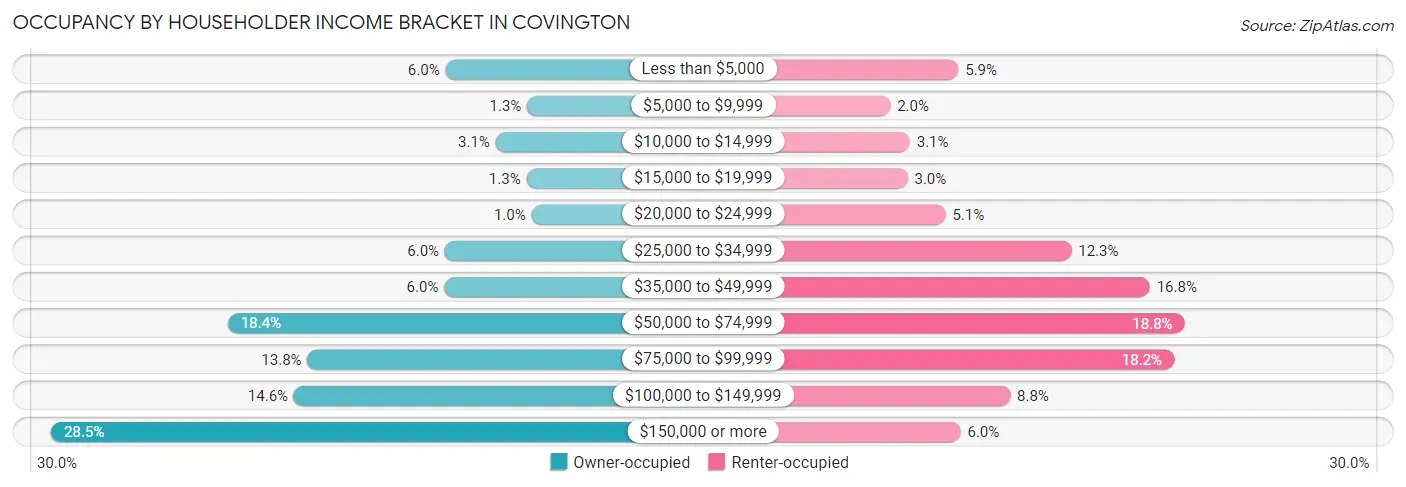
| Income Bracket | Owner-occupied | Renter-occupied |
| Less than $5,000 | 162 (5.9%) | 89 (5.9%) |
| $5,000 to $9,999 | 35 (1.3%) | 30 (2.0%) |
| $10,000 to $14,999 | 84 (3.1%) | 47 (3.1%) |
| $15,000 to $19,999 | 36 (1.3%) | 45 (3.0%) |
| $20,000 to $24,999 | 28 (1.0%) | 78 (5.1%) |
| $25,000 to $34,999 | 163 (6.0%) | 187 (12.3%) |
| $35,000 to $49,999 | 164 (6.0%) | 255 (16.8%) |
| $50,000 to $74,999 | 501 (18.4%) | 285 (18.8%) |
| $75,000 to $99,999 | 377 (13.8%) | 276 (18.2%) |
| $100,000 to $149,999 | 398 (14.6%) | 134 (8.8%) |
| $150,000 or more | 776 (28.5%) | 91 (6.0%) |
| Total | 2,724 (100.0%) | 1,517 (100.0%) |
Monthly Housing Cost Tiers in Covington
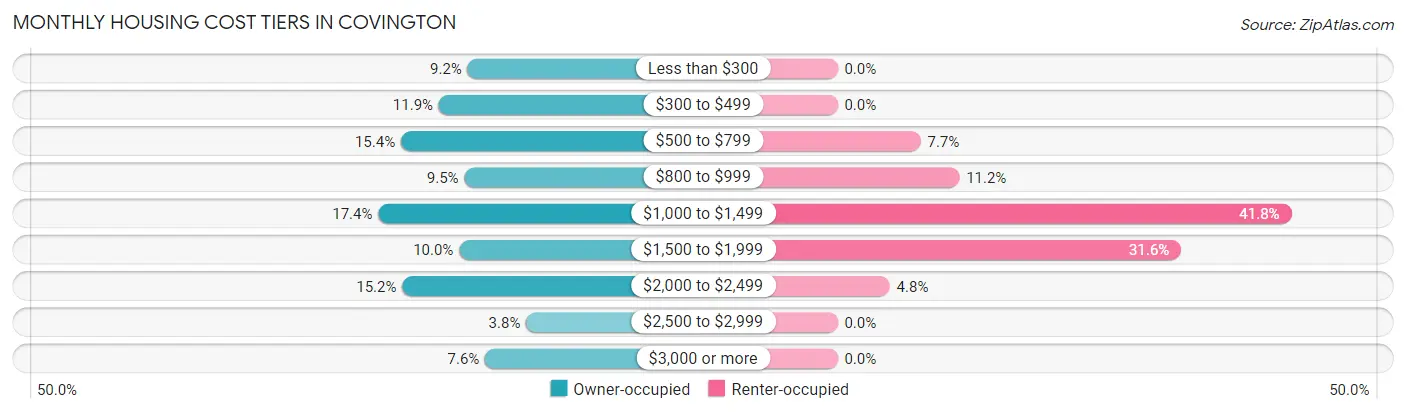
| Monthly Cost | Owner-occupied | Renter-occupied |
| Less than $300 | 251 (9.2%) | 0 (0.0%) |
| $300 to $499 | 323 (11.9%) | 0 (0.0%) |
| $500 to $799 | 418 (15.3%) | 116 (7.6%) |
| $800 to $999 | 259 (9.5%) | 170 (11.2%) |
| $1,000 to $1,499 | 475 (17.4%) | 634 (41.8%) |
| $1,500 to $1,999 | 272 (10.0%) | 480 (31.6%) |
| $2,000 to $2,499 | 415 (15.2%) | 73 (4.8%) |
| $2,500 to $2,999 | 104 (3.8%) | 0 (0.0%) |
| $3,000 or more | 207 (7.6%) | 0 (0.0%) |
| Total | 2,724 (100.0%) | 1,517 (100.0%) |
Physical Housing Characteristics in Covington
Housing Structures in Covington
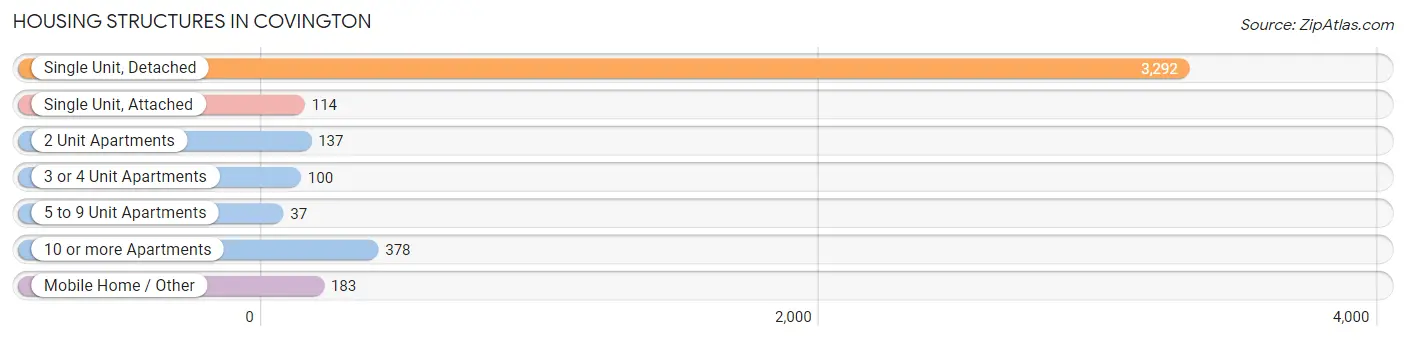
| Structure Type | # Housing Units | % Housing Units |
| Single Unit, Detached | 3,292 | 77.6% |
| Single Unit, Attached | 114 | 2.7% |
| 2 Unit Apartments | 137 | 3.2% |
| 3 or 4 Unit Apartments | 100 | 2.4% |
| 5 to 9 Unit Apartments | 37 | 0.9% |
| 10 or more Apartments | 378 | 8.9% |
| Mobile Home / Other | 183 | 4.3% |
| Total | 4,241 | 100.0% |
Housing Structures by Occupancy in Covington
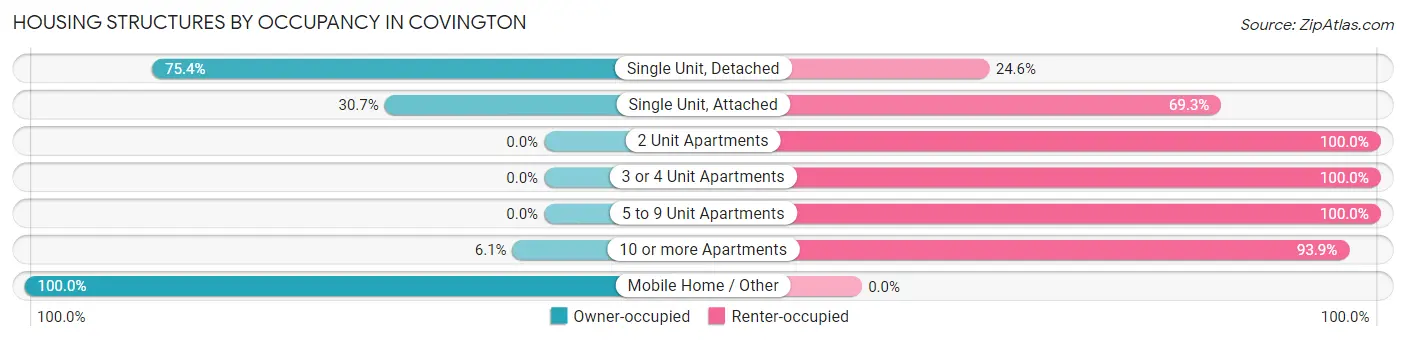
| Structure Type | Owner-occupied | Renter-occupied |
| Single Unit, Detached | 2,483 (75.4%) | 809 (24.6%) |
| Single Unit, Attached | 35 (30.7%) | 79 (69.3%) |
| 2 Unit Apartments | 0 (0.0%) | 137 (100.0%) |
| 3 or 4 Unit Apartments | 0 (0.0%) | 100 (100.0%) |
| 5 to 9 Unit Apartments | 0 (0.0%) | 37 (100.0%) |
| 10 or more Apartments | 23 (6.1%) | 355 (93.9%) |
| Mobile Home / Other | 183 (100.0%) | 0 (0.0%) |
| Total | 2,724 (64.2%) | 1,517 (35.8%) |
Housing Structures by Number of Rooms in Covington
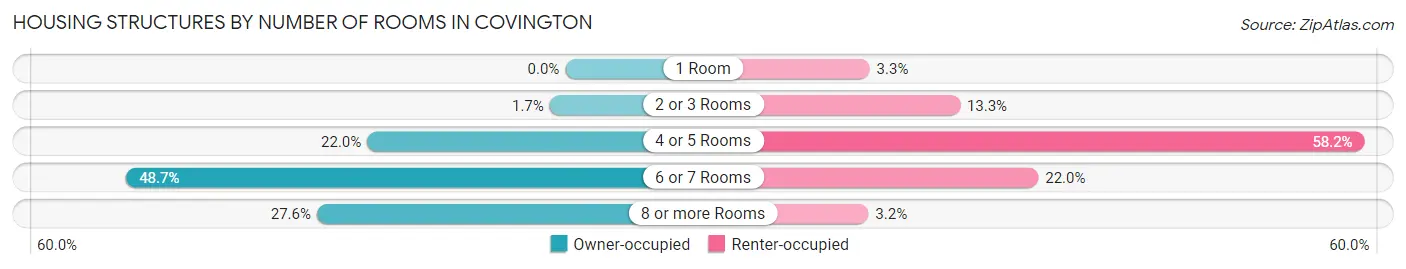
| Number of Rooms | Owner-occupied | Renter-occupied |
| 1 Room | 0 (0.0%) | 50 (3.3%) |
| 2 or 3 Rooms | 47 (1.7%) | 202 (13.3%) |
| 4 or 5 Rooms | 599 (22.0%) | 883 (58.2%) |
| 6 or 7 Rooms | 1,327 (48.7%) | 334 (22.0%) |
| 8 or more Rooms | 751 (27.6%) | 48 (3.2%) |
| Total | 2,724 (100.0%) | 1,517 (100.0%) |
Housing Structure by Heating Type in Covington
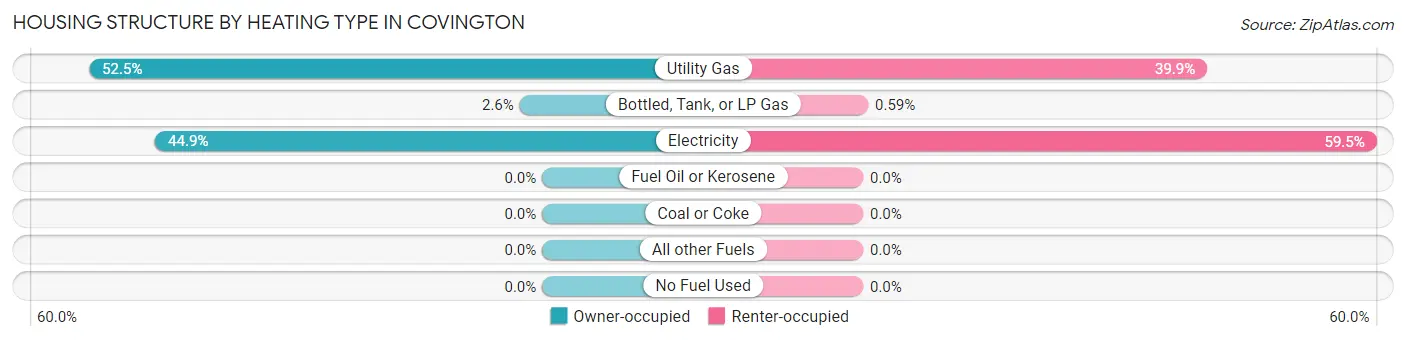
| Heating Type | Owner-occupied | Renter-occupied |
| Utility Gas | 1,431 (52.5%) | 605 (39.9%) |
| Bottled, Tank, or LP Gas | 71 (2.6%) | 9 (0.6%) |
| Electricity | 1,222 (44.9%) | 903 (59.5%) |
| Fuel Oil or Kerosene | 0 (0.0%) | 0 (0.0%) |
| Coal or Coke | 0 (0.0%) | 0 (0.0%) |
| All other Fuels | 0 (0.0%) | 0 (0.0%) |
| No Fuel Used | 0 (0.0%) | 0 (0.0%) |
| Total | 2,724 (100.0%) | 1,517 (100.0%) |
Household Vehicle Usage in Covington
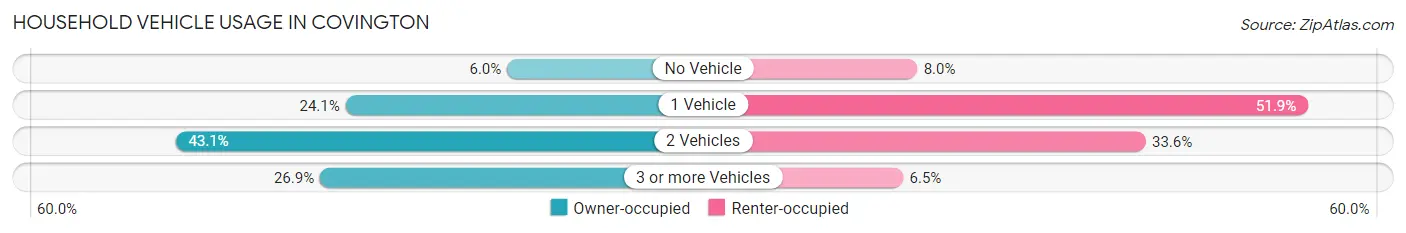
| Vehicles per Household | Owner-occupied | Renter-occupied |
| No Vehicle | 162 (5.9%) | 122 (8.0%) |
| 1 Vehicle | 655 (24.0%) | 787 (51.9%) |
| 2 Vehicles | 1,174 (43.1%) | 510 (33.6%) |
| 3 or more Vehicles | 733 (26.9%) | 98 (6.5%) |
| Total | 2,724 (100.0%) | 1,517 (100.0%) |
Real Estate & Mortgages in Covington
Real Estate and Mortgage Overview in Covington
| Characteristic | Without Mortgage | With Mortgage |
| Housing Units | 1,182 | 1,542 |
| Median Property Value | $264,400 | $288,100 |
| Median Household Income | $60,625 | $621 |
| Monthly Housing Costs | $519 | $207 |
| Real Estate Taxes | $1,766 | $83 |
Property Value by Mortgage Status in Covington
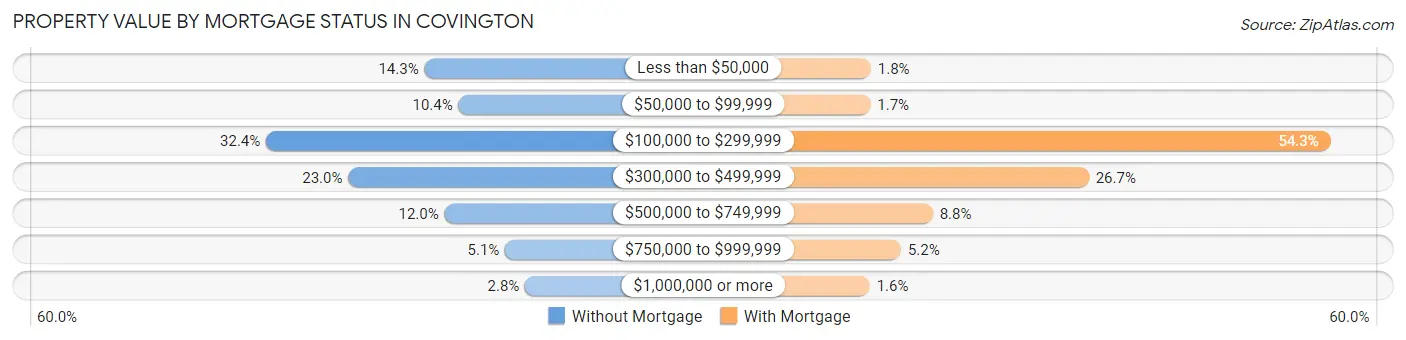
| Property Value | Without Mortgage | With Mortgage |
| Less than $50,000 | 169 (14.3%) | 27 (1.8%) |
| $50,000 to $99,999 | 123 (10.4%) | 26 (1.7%) |
| $100,000 to $299,999 | 383 (32.4%) | 837 (54.3%) |
| $300,000 to $499,999 | 272 (23.0%) | 411 (26.7%) |
| $500,000 to $749,999 | 142 (12.0%) | 136 (8.8%) |
| $750,000 to $999,999 | 60 (5.1%) | 80 (5.2%) |
| $1,000,000 or more | 33 (2.8%) | 25 (1.6%) |
| Total | 1,182 (100.0%) | 1,542 (100.0%) |
Household Income by Mortgage Status in Covington
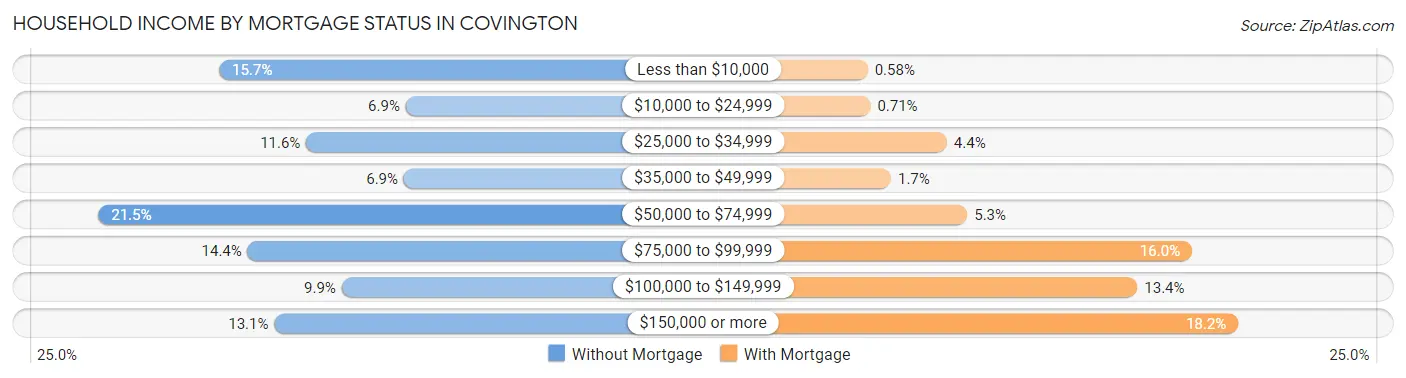
| Household Income | Without Mortgage | With Mortgage |
| Less than $10,000 | 186 (15.7%) | 9 (0.6%) |
| $10,000 to $24,999 | 81 (6.9%) | 11 (0.7%) |
| $25,000 to $34,999 | 137 (11.6%) | 67 (4.3%) |
| $35,000 to $49,999 | 82 (6.9%) | 26 (1.7%) |
| $50,000 to $74,999 | 254 (21.5%) | 82 (5.3%) |
| $75,000 to $99,999 | 170 (14.4%) | 247 (16.0%) |
| $100,000 to $149,999 | 117 (9.9%) | 207 (13.4%) |
| $150,000 or more | 155 (13.1%) | 281 (18.2%) |
| Total | 1,182 (100.0%) | 1,542 (100.0%) |
Property Value to Household Income Ratio in Covington
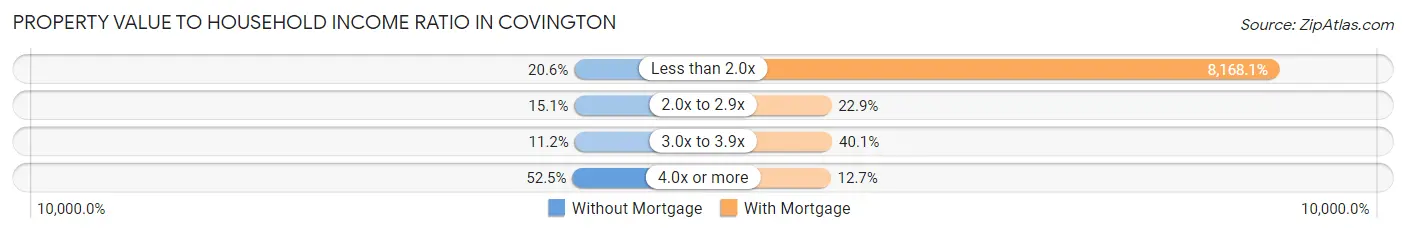
| Value-to-Income Ratio | Without Mortgage | With Mortgage |
| Less than 2.0x | 243 (20.6%) | 125,952 (8,168.1%) |
| 2.0x to 2.9x | 178 (15.1%) | 353 (22.9%) |
| 3.0x to 3.9x | 132 (11.2%) | 618 (40.1%) |
| 4.0x or more | 620 (52.4%) | 195 (12.7%) |
| Total | 1,182 (100.0%) | 1,542 (100.0%) |
Real Estate Taxes by Mortgage Status in Covington
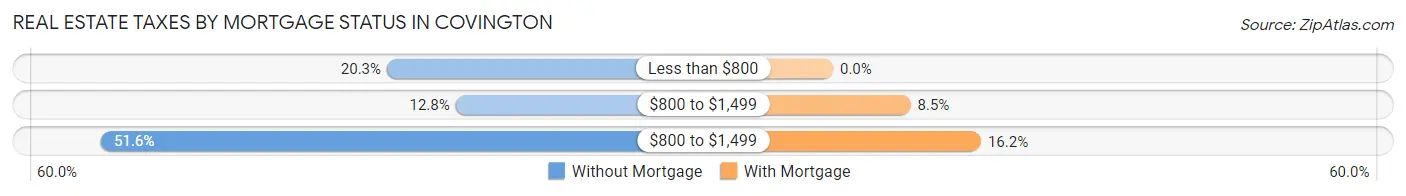
| Property Taxes | Without Mortgage | With Mortgage |
| Less than $800 | 240 (20.3%) | 0 (0.0%) |
| $800 to $1,499 | 151 (12.8%) | 131 (8.5%) |
| $800 to $1,499 | 610 (51.6%) | 250 (16.2%) |
| Total | 1,182 (100.0%) | 1,542 (100.0%) |
Health & Disability in Covington
Health Insurance Coverage by Age in Covington
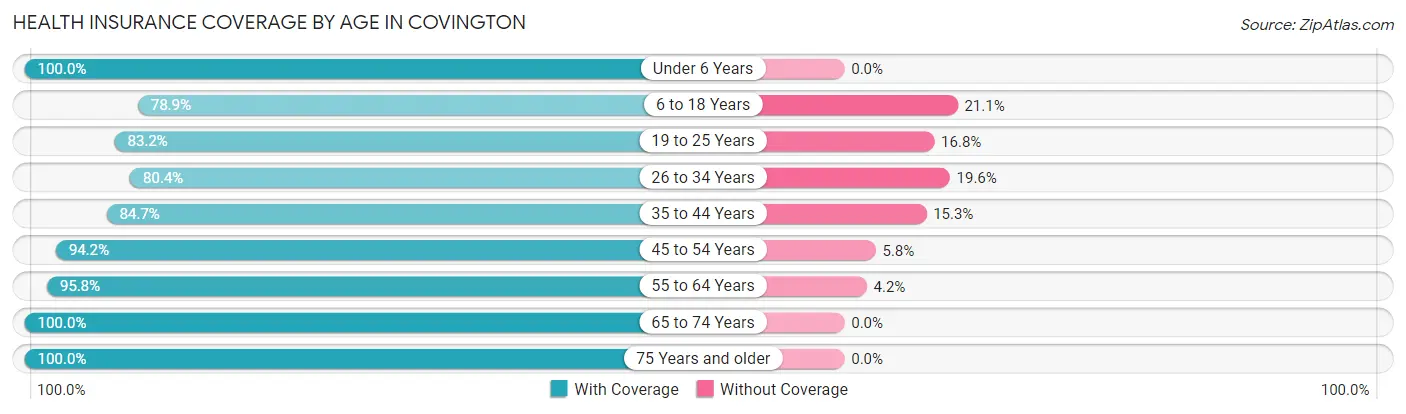
| Age Bracket | With Coverage | Without Coverage |
| Under 6 Years | 555 (100.0%) | 0 (0.0%) |
| 6 to 18 Years | 1,756 (78.9%) | 470 (21.1%) |
| 19 to 25 Years | 581 (83.2%) | 117 (16.8%) |
| 26 to 34 Years | 974 (80.4%) | 238 (19.6%) |
| 35 to 44 Years | 1,254 (84.7%) | 226 (15.3%) |
| 45 to 54 Years | 889 (94.2%) | 55 (5.8%) |
| 55 to 64 Years | 1,476 (95.8%) | 64 (4.2%) |
| 65 to 74 Years | 1,268 (100.0%) | 0 (0.0%) |
| 75 Years and older | 651 (100.0%) | 0 (0.0%) |
| Total | 9,404 (88.9%) | 1,170 (11.1%) |
Health Insurance Coverage by Citizenship Status in Covington
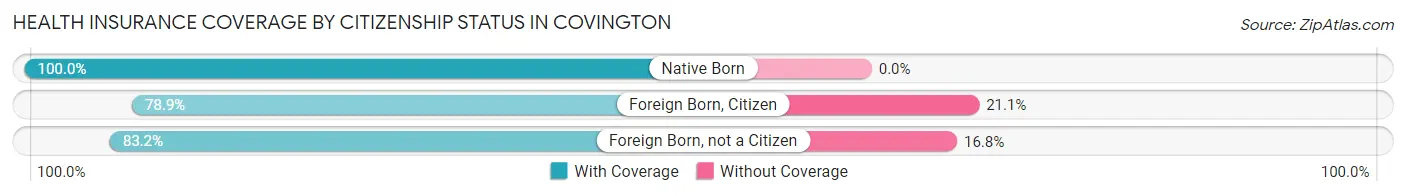
| Citizenship Status | With Coverage | Without Coverage |
| Native Born | 555 (100.0%) | 0 (0.0%) |
| Foreign Born, Citizen | 1,756 (78.9%) | 470 (21.1%) |
| Foreign Born, not a Citizen | 581 (83.2%) | 117 (16.8%) |
Health Insurance Coverage by Household Income in Covington
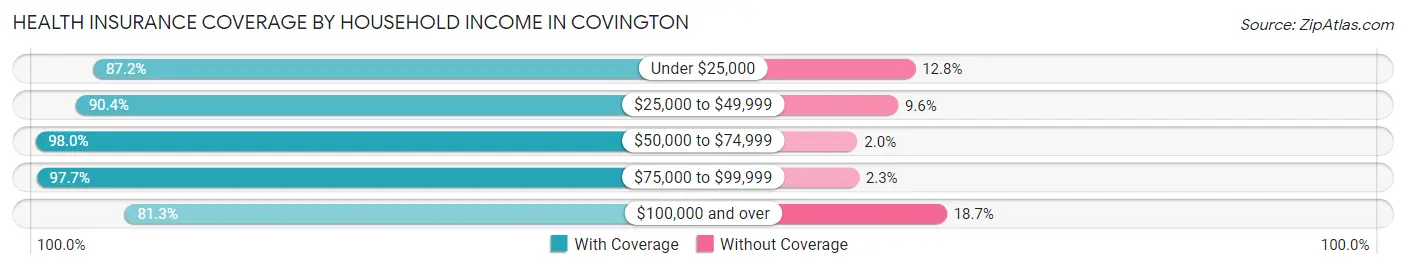
| Household Income | With Coverage | Without Coverage |
| Under $25,000 | 1,040 (87.2%) | 153 (12.8%) |
| $25,000 to $49,999 | 1,596 (90.4%) | 169 (9.6%) |
| $50,000 to $74,999 | 1,428 (98.0%) | 29 (2.0%) |
| $75,000 to $99,999 | 1,946 (97.7%) | 45 (2.3%) |
| $100,000 and over | 3,361 (81.3%) | 774 (18.7%) |
Public vs Private Health Insurance Coverage by Age in Covington
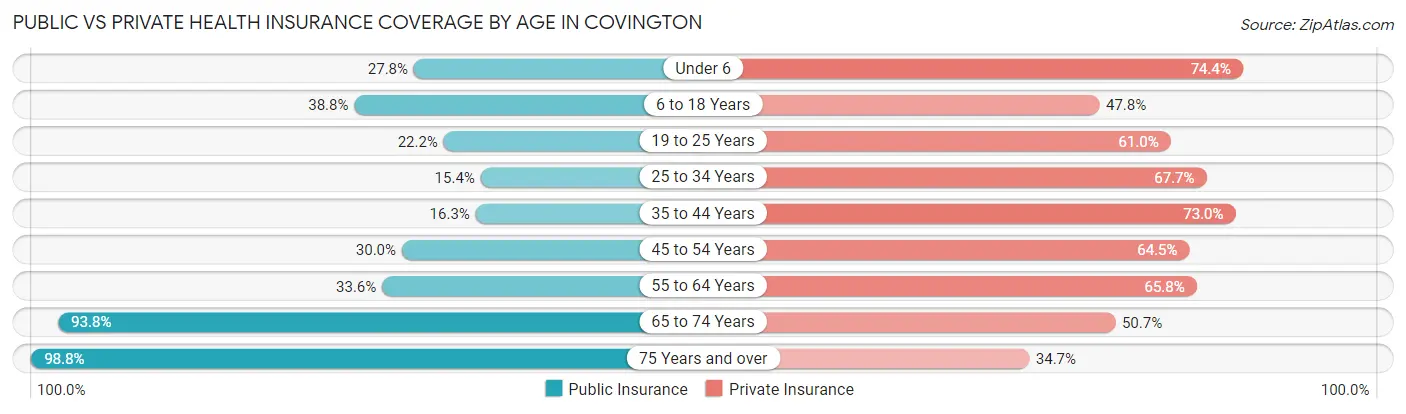
| Age Bracket | Public Insurance | Private Insurance |
| Under 6 | 154 (27.8%) | 413 (74.4%) |
| 6 to 18 Years | 864 (38.8%) | 1,063 (47.7%) |
| 19 to 25 Years | 155 (22.2%) | 426 (61.0%) |
| 25 to 34 Years | 186 (15.3%) | 820 (67.7%) |
| 35 to 44 Years | 241 (16.3%) | 1,081 (73.0%) |
| 45 to 54 Years | 283 (30.0%) | 609 (64.5%) |
| 55 to 64 Years | 518 (33.6%) | 1,014 (65.8%) |
| 65 to 74 Years | 1,189 (93.8%) | 643 (50.7%) |
| 75 Years and over | 643 (98.8%) | 226 (34.7%) |
| Total | 4,233 (40.0%) | 6,295 (59.5%) |
Disability Status by Sex by Age in Covington
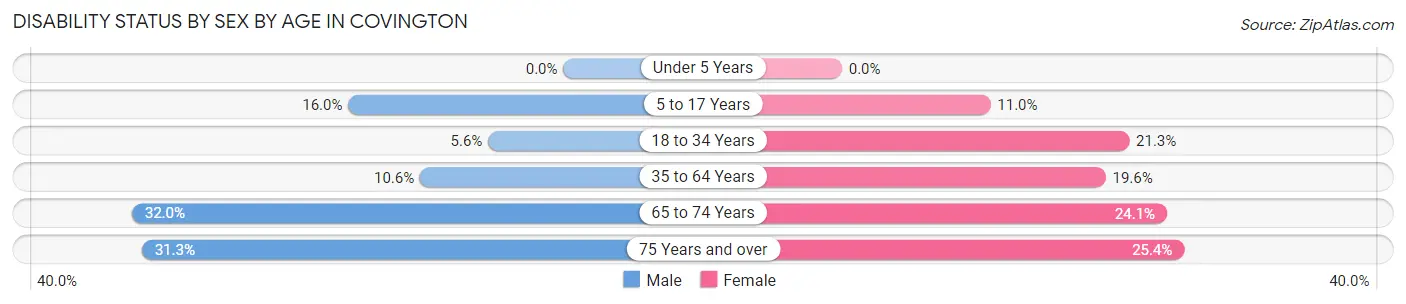
| Age Bracket | Male | Female |
| Under 5 Years | 0 (0.0%) | 0 (0.0%) |
| 5 to 17 Years | 200 (16.0%) | 101 (11.0%) |
| 18 to 34 Years | 56 (5.6%) | 221 (21.3%) |
| 35 to 64 Years | 223 (10.6%) | 366 (19.6%) |
| 65 to 74 Years | 174 (32.0%) | 175 (24.1%) |
| 75 Years and over | 72 (31.3%) | 107 (25.4%) |
Disability Class by Sex by Age in Covington
Disability Class: Hearing Difficulty
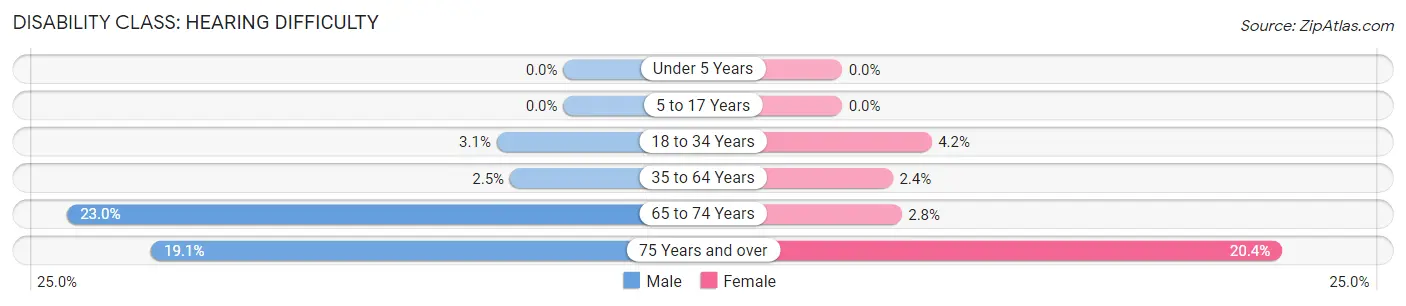
| Age Bracket | Male | Female |
| Under 5 Years | 0 (0.0%) | 0 (0.0%) |
| 5 to 17 Years | 0 (0.0%) | 0 (0.0%) |
| 18 to 34 Years | 31 (3.1%) | 43 (4.2%) |
| 35 to 64 Years | 52 (2.5%) | 44 (2.4%) |
| 65 to 74 Years | 125 (23.0%) | 20 (2.8%) |
| 75 Years and over | 44 (19.1%) | 86 (20.4%) |
Disability Class: Vision Difficulty
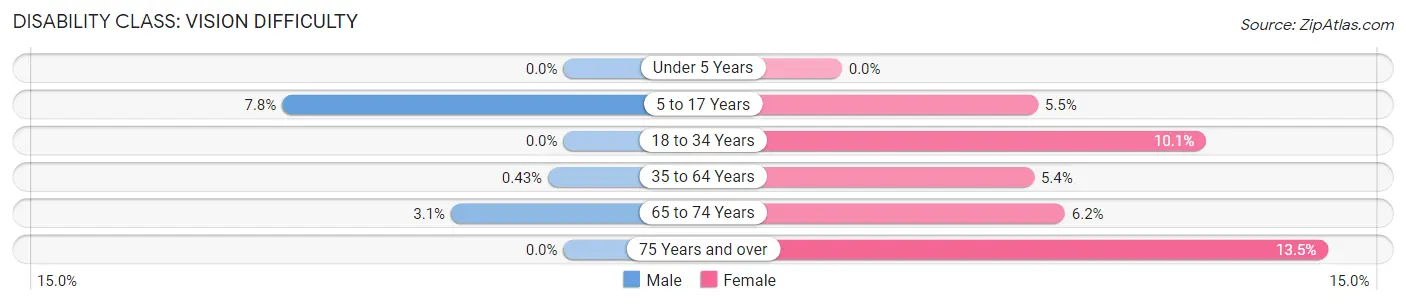
| Age Bracket | Male | Female |
| Under 5 Years | 0 (0.0%) | 0 (0.0%) |
| 5 to 17 Years | 98 (7.8%) | 50 (5.5%) |
| 18 to 34 Years | 0 (0.0%) | 105 (10.1%) |
| 35 to 64 Years | 9 (0.4%) | 100 (5.3%) |
| 65 to 74 Years | 17 (3.1%) | 45 (6.2%) |
| 75 Years and over | 0 (0.0%) | 57 (13.5%) |
Disability Class: Cognitive Difficulty
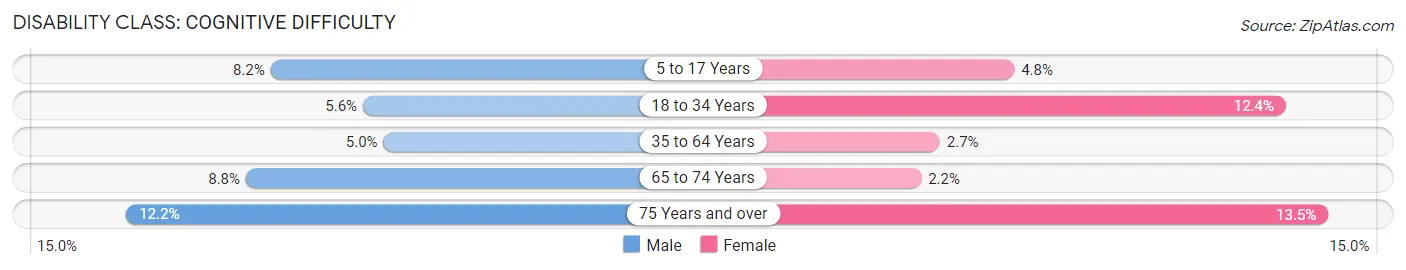
| Age Bracket | Male | Female |
| 5 to 17 Years | 102 (8.2%) | 44 (4.8%) |
| 18 to 34 Years | 56 (5.6%) | 128 (12.4%) |
| 35 to 64 Years | 105 (5.0%) | 51 (2.7%) |
| 65 to 74 Years | 48 (8.8%) | 16 (2.2%) |
| 75 Years and over | 28 (12.2%) | 57 (13.5%) |
Disability Class: Ambulatory Difficulty
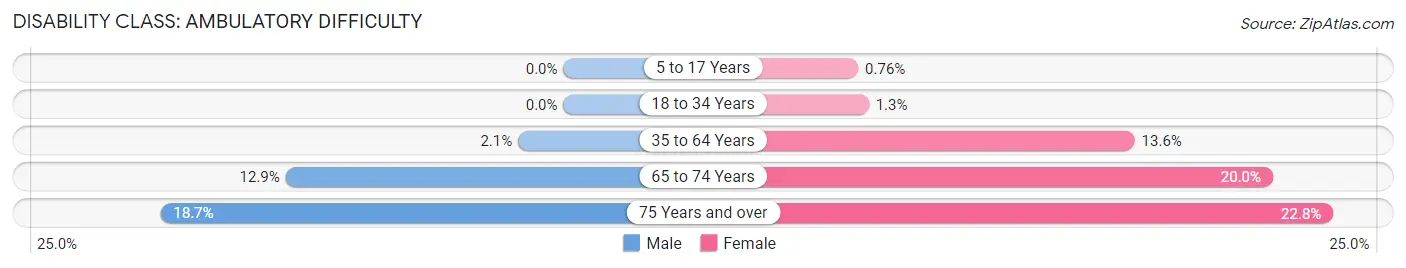
| Age Bracket | Male | Female |
| 5 to 17 Years | 0 (0.0%) | 7 (0.8%) |
| 18 to 34 Years | 0 (0.0%) | 13 (1.3%) |
| 35 to 64 Years | 44 (2.1%) | 254 (13.6%) |
| 65 to 74 Years | 70 (12.9%) | 145 (20.0%) |
| 75 Years and over | 43 (18.7%) | 96 (22.8%) |
Disability Class: Self-Care Difficulty
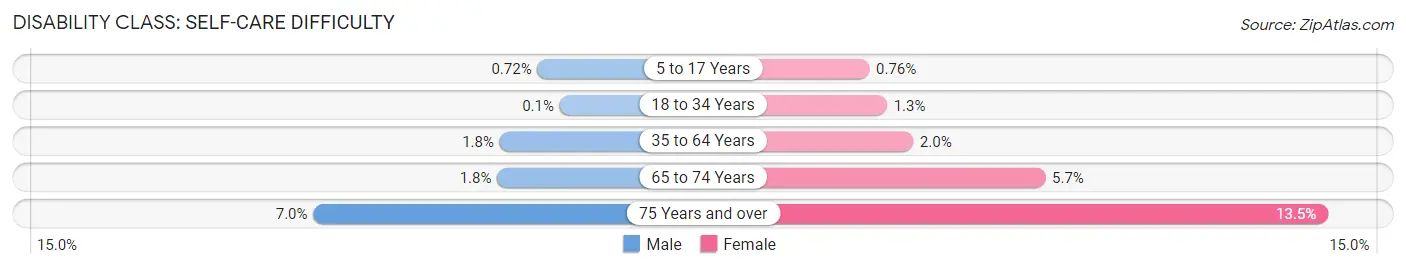
| Age Bracket | Male | Female |
| 5 to 17 Years | 9 (0.7%) | 7 (0.8%) |
| 18 to 34 Years | 1 (0.1%) | 13 (1.3%) |
| 35 to 64 Years | 37 (1.8%) | 37 (2.0%) |
| 65 to 74 Years | 10 (1.8%) | 41 (5.7%) |
| 75 Years and over | 16 (7.0%) | 57 (13.5%) |
Technology Access in Covington
Computing Device Access in Covington
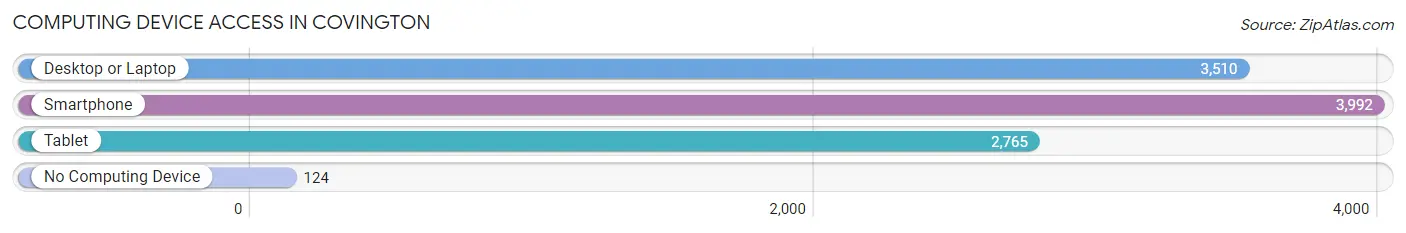
| Device Type | # Households | % Households |
| Desktop or Laptop | 3,510 | 82.8% |
| Smartphone | 3,992 | 94.1% |
| Tablet | 2,765 | 65.2% |
| No Computing Device | 124 | 2.9% |
| Total | 4,241 | 100.0% |
Internet Access in Covington
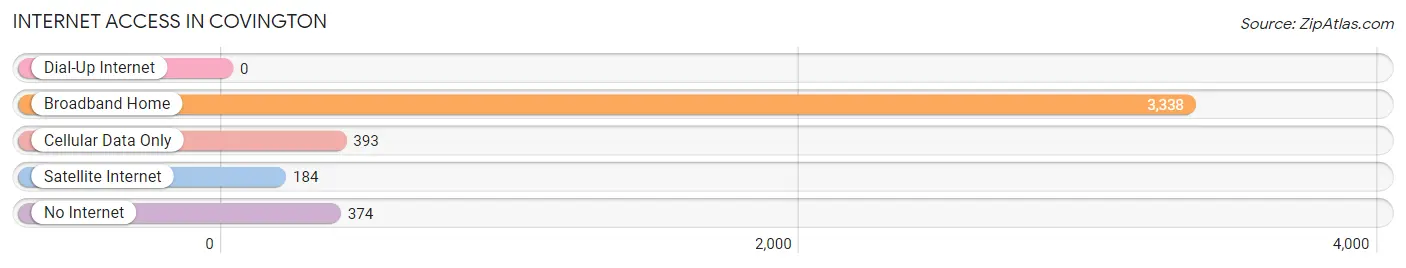
| Internet Type | # Households | % Households |
| Dial-Up Internet | 0 | 0.0% |
| Broadband Home | 3,338 | 78.7% |
| Cellular Data Only | 393 | 9.3% |
| Satellite Internet | 184 | 4.3% |
| No Internet | 374 | 8.8% |
| Total | 4,241 | 100.0% |
Covington Summary
Covington, Louisiana is a city located in St. Tammany Parish, Louisiana, United States. It is situated on the north shore of Lake Pontchartrain, about 40 miles north of New Orleans. The city is part of the New Orleans–Metairie–Kenner Metropolitan Statistical Area. As of the 2010 census, the population of Covington was 8,765.
History
Covington was founded in 1813 by John Wharton Collins, a settler from Virginia. The city was named after General Leonard Covington, a hero of the War of 1812. The city was incorporated in 1816 and has since grown to become a thriving community.
Geography
Covington is located at 30°28'25" North, 90°6'15" West (30.473611, -90.104167). It is situated on the north shore of Lake Pontchartrain, about 40 miles north of New Orleans. The city is part of the New Orleans–Metairie–Kenner Metropolitan Statistical Area.
The city has a total area of 8.2 square miles, of which 8.1 square miles is land and 0.1 square miles is water.
Economy
Covington is a major economic center for St. Tammany Parish. The city is home to a variety of businesses, including manufacturing, retail, and professional services. The city is also home to several large employers, including St. Tammany Parish Hospital, Northshore Technical Community College, and the St. Tammany Parish School Board.
Demographics
As of the 2010 census, the population of Covington was 8,765. The racial makeup of the city was 79.2% White, 15.3% African American, 0.3% Native American, 1.3% Asian, 0.1% Pacific Islander, 1.7% from other races, and 2.3% from two or more races. Hispanic or Latino of any race were 4.2% of the population.
The median income for a household in the city was $45,945, and the median income for a family was $54,844. The per capita income for the city was $25,845. About 11.2% of families and 14.2% of the population were below the poverty line, including 19.2% of those under age 18 and 10.2% of those age 65 or over.
Covington is a diverse city with a variety of cultures and backgrounds. The city is home to a variety of churches, including Catholic, Protestant, and non-denominational. The city also has a variety of restaurants, shops, and entertainment venues.
Covington is a vibrant and growing city with a strong sense of community. The city is committed to providing its residents with a high quality of life and a safe and secure environment. The city is also committed to preserving its unique history and culture.
Common Questions
What is Per Capita Income in Covington?
Per Capita income in Covington is $36,427.
What is the Median Family Income in Covington?
Median Family Income in Covington is $92,536.
What is the Median Household income in Covington?
Median Household Income in Covington is $71,719.
What is Income or Wage Gap in Covington?
Income or Wage Gap in Covington is 15.9%.
Women in Covington earn 84.1 cents for every dollar earned by a man.
What is Inequality or Gini Index in Covington?
Inequality or Gini Index in Covington is 0.47.
What is the Total Population of Covington?
Total Population of Covington is 11,444.
What is the Total Male Population of Covington?
Total Male Population of Covington is 6,052.
What is the Total Female Population of Covington?
Total Female Population of Covington is 5,392.
What is the Ratio of Males per 100 Females in Covington?
There are 112.24 Males per 100 Females in Covington.
What is the Ratio of Females per 100 Males in Covington?
There are 89.09 Females per 100 Males in Covington.
What is the Median Population Age in Covington?
Median Population Age in Covington is 38.7 Years.
What is the Average Family Size in Covington
Average Family Size in Covington is 2.9 People.
What is the Average Household Size in Covington
Average Household Size in Covington is 2.5 People.
How Large is the Labor Force in Covington?
There are 5,106 People in the Labor Forcein in Covington.
What is the Percentage of People in the Labor Force in Covington?
55.5% of People are in the Labor Force in Covington.
What is the Unemployment Rate in Covington?
Unemployment Rate in Covington is 4.7%.