Moss Bluff, LA Map & Demographics
Moss Bluff Map
Moss Bluff Overview
$47,213
PER CAPITA INCOME
$91,250
AVG FAMILY INCOME
$84,038
AVG HOUSEHOLD INCOME
51.4%
WAGE / INCOME GAP [ % ]
48.6¢/ $1
WAGE / INCOME GAP [ $ ]
0.41
INEQUALITY / GINI INDEX
11,582
TOTAL POPULATION
6,560
MALE POPULATION
5,022
FEMALE POPULATION
130.63
MALES / 100 FEMALES
76.55
FEMALES / 100 MALES
43.3
MEDIAN AGE
3.0
AVG FAMILY SIZE
2.4
AVG HOUSEHOLD SIZE
5,481
LABOR FORCE [ PEOPLE ]
59.3%
PERCENT IN LABOR FORCE
2.3%
UNEMPLOYMENT RATE
Moss Bluff Area Codes
Income in Moss Bluff
Income Overview in Moss Bluff
Per Capita Income in Moss Bluff is $47,213, while median incomes of families and households are $91,250 and $84,038 respectively.
| Characteristic | Number | Measure |
| Per Capita Income | 11,582 | $47,213 |
| Median Family Income | 2,983 | $91,250 |
| Mean Family Income | 2,983 | $111,389 |
| Median Household Income | 4,838 | $84,038 |
| Mean Household Income | 4,838 | $108,031 |
| Income Deficit | 2,983 | $0 |
| Wage / Income Gap (%) | 11,582 | 51.39% |
| Wage / Income Gap ($) | 11,582 | 48.61¢ per $1 |
| Gini / Inequality Index | 11,582 | 0.41 |
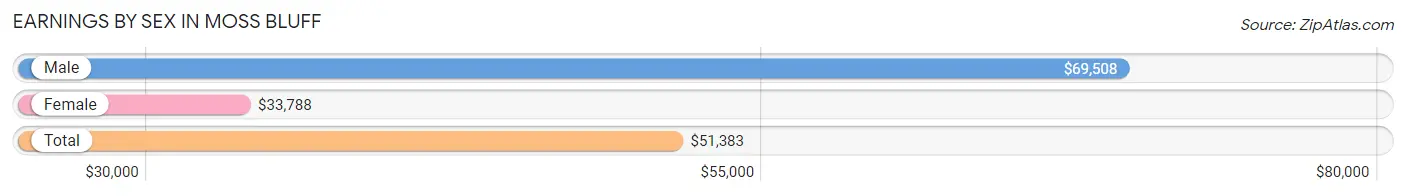
Earnings by Sex in Moss Bluff
Average Earnings in Moss Bluff are $51,383, $69,508 for men and $33,788 for women, a difference of 51.4%.
| Sex | Number | Average Earnings |
| Male | 3,678 (64.0%) | $69,508 |
| Female | 2,066 (36.0%) | $33,788 |
| Total | 5,744 (100.0%) | $51,383 |
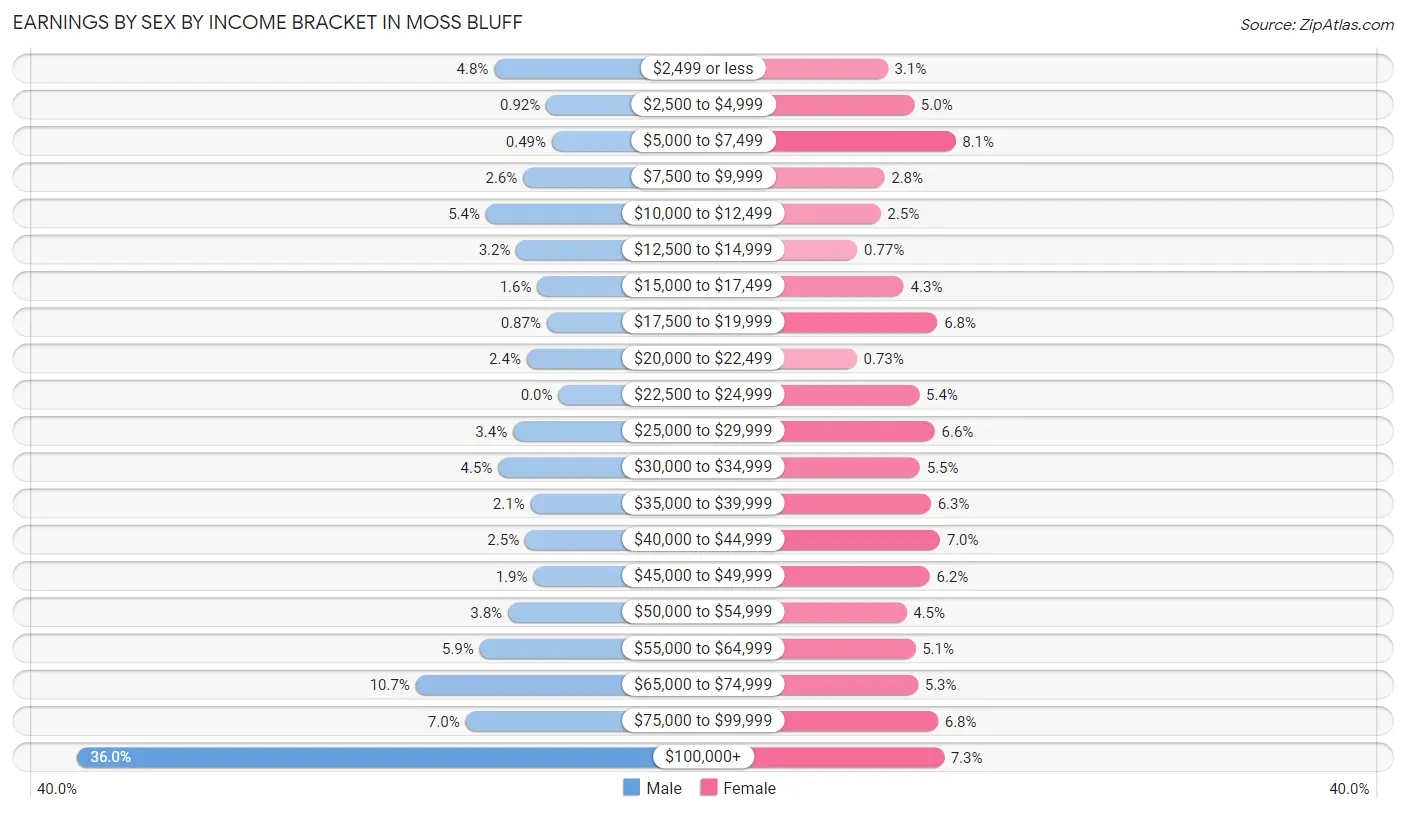
Earnings by Sex by Income Bracket in Moss Bluff
The most common earnings brackets in Moss Bluff are $100,000+ for men (1,325 | 36.0%) and $5,000 to $7,499 for women (168 | 8.1%).
| Income | Male | Female |
| $2,499 or less | 177 (4.8%) | 63 (3.0%) |
| $2,500 to $4,999 | 34 (0.9%) | 104 (5.0%) |
| $5,000 to $7,499 | 18 (0.5%) | 168 (8.1%) |
| $7,500 to $9,999 | 97 (2.6%) | 58 (2.8%) |
| $10,000 to $12,499 | 200 (5.4%) | 52 (2.5%) |
| $12,500 to $14,999 | 116 (3.2%) | 16 (0.8%) |
| $15,000 to $17,499 | 58 (1.6%) | 88 (4.3%) |
| $17,500 to $19,999 | 32 (0.9%) | 140 (6.8%) |
| $20,000 to $22,499 | 87 (2.4%) | 15 (0.7%) |
| $22,500 to $24,999 | 0 (0.0%) | 112 (5.4%) |
| $25,000 to $29,999 | 125 (3.4%) | 136 (6.6%) |
| $30,000 to $34,999 | 166 (4.5%) | 113 (5.5%) |
| $35,000 to $39,999 | 77 (2.1%) | 130 (6.3%) |
| $40,000 to $44,999 | 92 (2.5%) | 144 (7.0%) |
| $45,000 to $49,999 | 69 (1.9%) | 128 (6.2%) |
| $50,000 to $54,999 | 139 (3.8%) | 92 (4.4%) |
| $55,000 to $64,999 | 217 (5.9%) | 106 (5.1%) |
| $65,000 to $74,999 | 393 (10.7%) | 110 (5.3%) |
| $75,000 to $99,999 | 256 (7.0%) | 141 (6.8%) |
| $100,000+ | 1,325 (36.0%) | 150 (7.3%) |
| Total | 3,678 (100.0%) | 2,066 (100.0%) |
Earnings by Sex by Educational Attainment in Moss Bluff
Average earnings in Moss Bluff are $71,412 for men and $37,113 for women, a difference of 48.0%. Men with an educational attainment of bachelor's degree enjoy the highest average annual earnings of $227,800, while those with high school diploma education earn the least with $54,609. Women with an educational attainment of graduate degree earn the most with the average annual earnings of $72,813, while those with high school diploma education have the smallest earnings of $23,835.

| Educational Attainment | Male Income | Female Income |
| Less than High School | - | - |
| High School Diploma | $54,609 | $23,835 |
| College or Associate's Degree | $71,017 | $40,240 |
| Bachelor's Degree | $227,800 | $48,846 |
| Graduate Degree | $132,065 | $72,813 |
| Total | $71,412 | $37,113 |
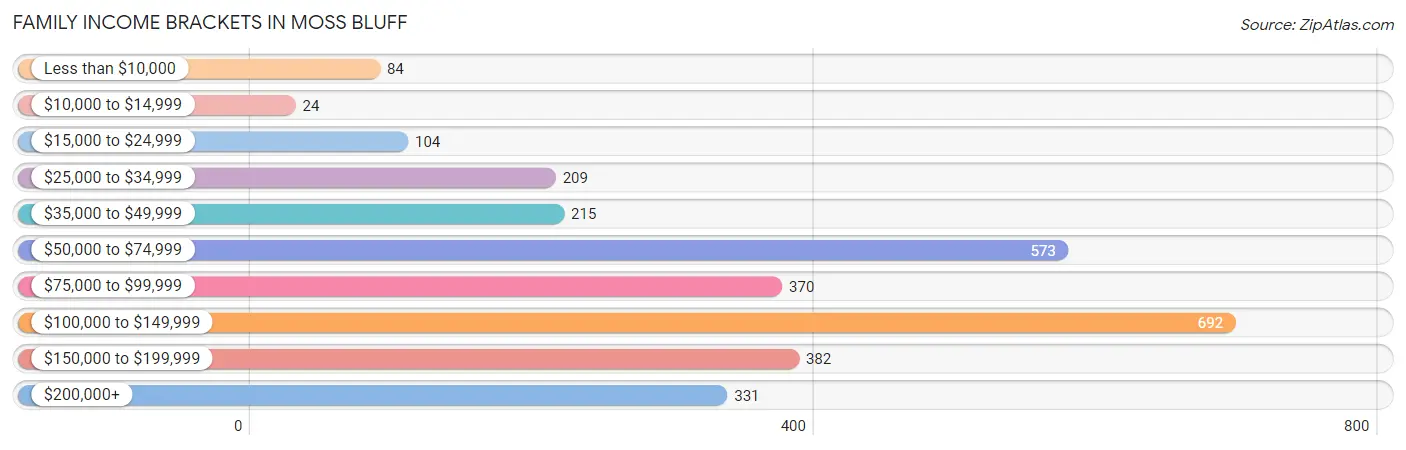
Family Income in Moss Bluff
Family Income Brackets in Moss Bluff
According to the Moss Bluff family income data, there are 692 families falling into the $100,000 to $149,999 income range, which is the most common income bracket and makes up 23.2% of all families. Conversely, the $10,000 to $14,999 income bracket is the least frequent group with only 24 families (0.8%) belonging to this category.
| Income Bracket | # Families | % Families |
| Less than $10,000 | 84 | 2.8% |
| $10,000 to $14,999 | 24 | 0.8% |
| $15,000 to $24,999 | 104 | 3.5% |
| $25,000 to $34,999 | 209 | 7.0% |
| $35,000 to $49,999 | 215 | 7.2% |
| $50,000 to $74,999 | 573 | 19.2% |
| $75,000 to $99,999 | 370 | 12.4% |
| $100,000 to $149,999 | 692 | 23.2% |
| $150,000 to $199,999 | 382 | 12.8% |
| $200,000+ | 331 | 11.1% |
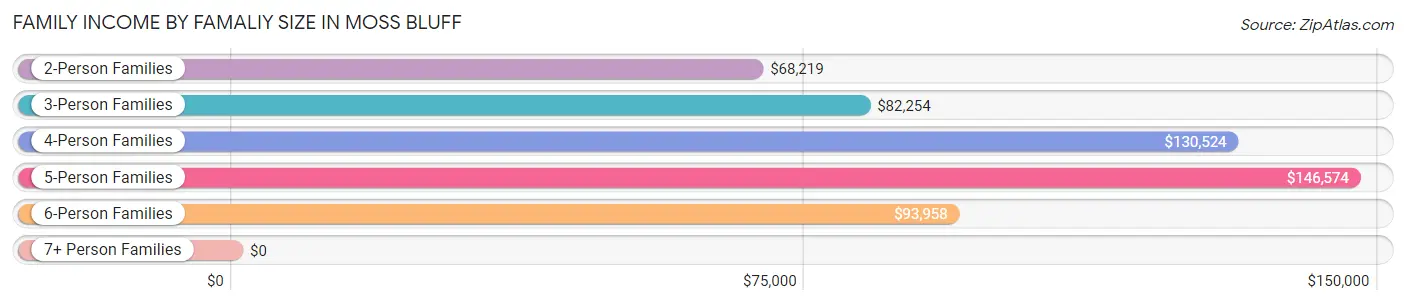
Family Income by Famaliy Size in Moss Bluff
5-person families (292 | 9.8%) account for the highest median family income in Moss Bluff with $146,574 per family, while 2-person families (1,547 | 51.9%) have the highest median income of $34,110 per family member.
| Income Bracket | # Families | Median Income |
| 2-Person Families | 1,547 (51.9%) | $68,219 |
| 3-Person Families | 715 (24.0%) | $82,254 |
| 4-Person Families | 397 (13.3%) | $130,524 |
| 5-Person Families | 292 (9.8%) | $146,574 |
| 6-Person Families | 32 (1.1%) | $93,958 |
| 7+ Person Families | 0 (0.0%) | $0 |
| Total | 2,983 (100.0%) | $91,250 |
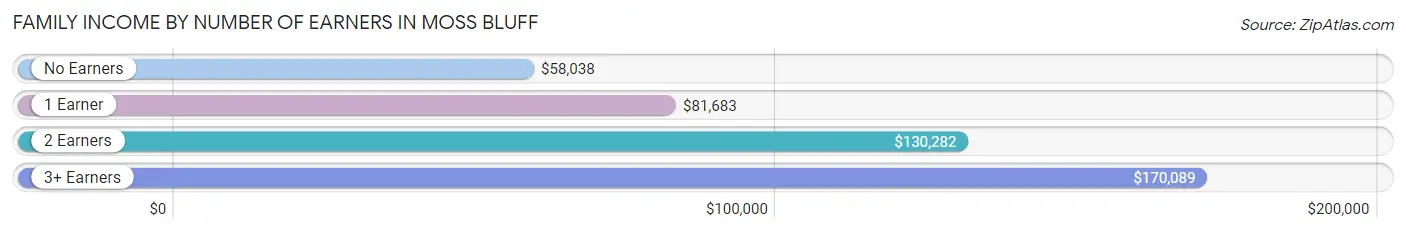
Family Income by Number of Earners in Moss Bluff
The median family income in Moss Bluff is $91,250, with families comprising 3+ earners (141) having the highest median family income of $170,089, while families with no earners (816) have the lowest median family income of $58,038, accounting for 4.7% and 27.4% of families, respectively.
| Number of Earners | # Families | Median Income |
| No Earners | 816 (27.4%) | $58,038 |
| 1 Earner | 823 (27.6%) | $81,683 |
| 2 Earners | 1,203 (40.3%) | $130,282 |
| 3+ Earners | 141 (4.7%) | $170,089 |
| Total | 2,983 (100.0%) | $91,250 |
Household Income in Moss Bluff
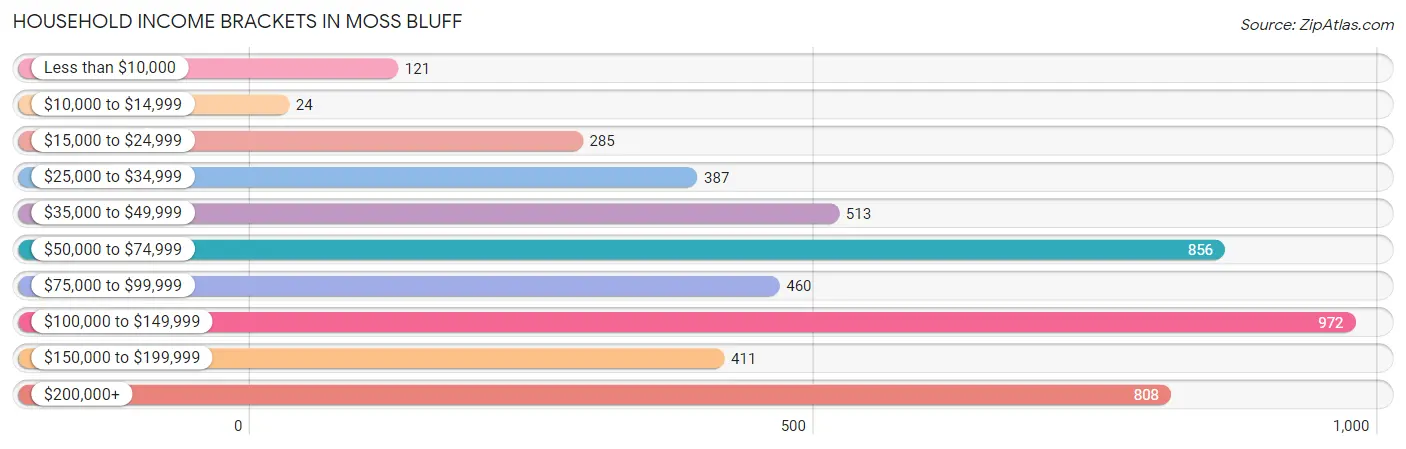
Household Income Brackets in Moss Bluff
With 972 households falling in the category, the $100,000 to $149,999 income range is the most frequent in Moss Bluff, accounting for 20.1% of all households. In contrast, only 24 households (0.5%) fall into the $10,000 to $14,999 income bracket, making it the least populous group.
| Income Bracket | # Households | % Households |
| Less than $10,000 | 121 | 2.5% |
| $10,000 to $14,999 | 24 | 0.5% |
| $15,000 to $24,999 | 285 | 5.9% |
| $25,000 to $34,999 | 387 | 8.0% |
| $35,000 to $49,999 | 513 | 10.6% |
| $50,000 to $74,999 | 856 | 17.7% |
| $75,000 to $99,999 | 460 | 9.5% |
| $100,000 to $149,999 | 972 | 20.1% |
| $150,000 to $199,999 | 411 | 8.5% |
| $200,000+ | 808 | 16.7% |
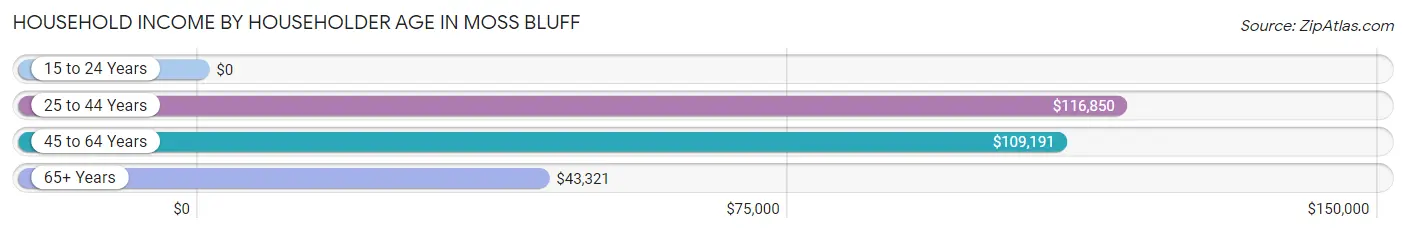
Household Income by Householder Age in Moss Bluff
The median household income in Moss Bluff is $84,038, with the highest median household income of $116,850 found in the 25 to 44 years age bracket for the primary householder. A total of 1,909 households (39.5%) fall into this category. Meanwhile, the 15 to 24 years age bracket for the primary householder has the lowest median household income of $0, with 10 households (0.2%) in this group.
| Income Bracket | # Households | Median Income |
| 15 to 24 Years | 10 (0.2%) | $0 |
| 25 to 44 Years | 1,909 (39.5%) | $116,850 |
| 45 to 64 Years | 1,499 (31.0%) | $109,191 |
| 65+ Years | 1,420 (29.3%) | $43,321 |
| Total | 4,838 (100.0%) | $84,038 |
Poverty in Moss Bluff
Income Below Poverty by Sex and Age in Moss Bluff
With 5.2% poverty level for males and 13.5% for females among the residents of Moss Bluff, 5 year old males and 16 and 17 year old females are the most vulnerable to poverty, with 20 males (22.5%) and 18 females (50.0%) in their respective age groups living below the poverty level.
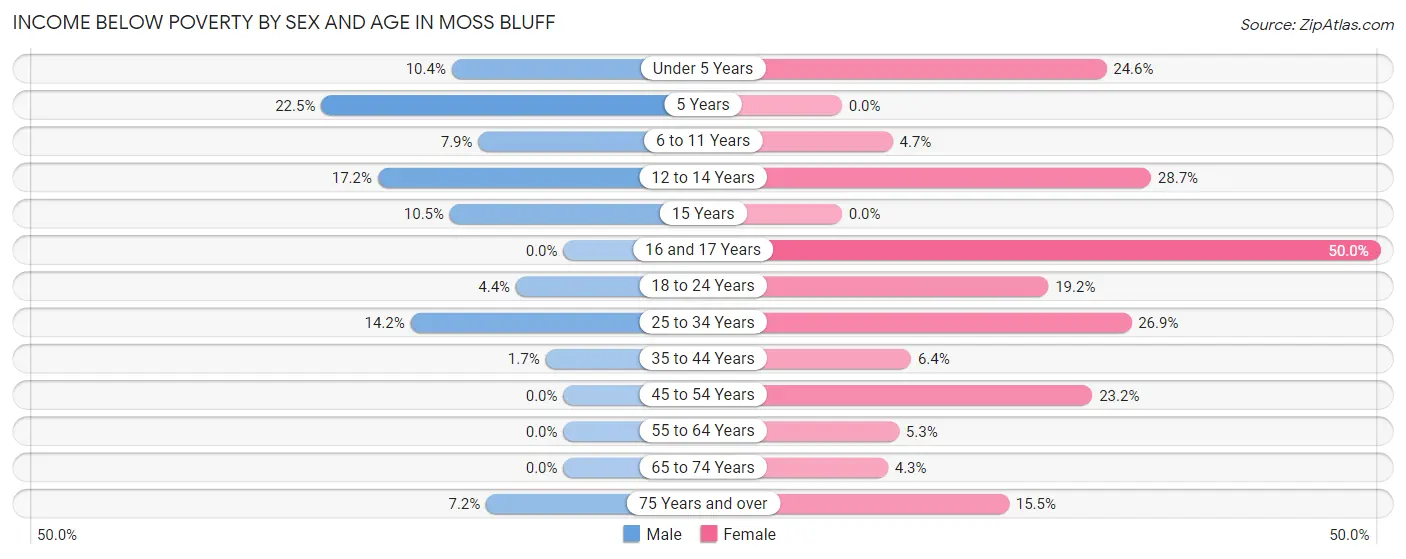
| Age Bracket | Male | Female |
| Under 5 Years | 26 (10.4%) | 41 (24.5%) |
| 5 Years | 20 (22.5%) | 0 (0.0%) |
| 6 to 11 Years | 55 (7.9%) | 21 (4.7%) |
| 12 to 14 Years | 36 (17.2%) | 68 (28.7%) |
| 15 Years | 12 (10.5%) | 0 (0.0%) |
| 16 and 17 Years | 0 (0.0%) | 18 (50.0%) |
| 18 to 24 Years | 16 (4.4%) | 41 (19.2%) |
| 25 to 34 Years | 136 (14.2%) | 191 (26.9%) |
| 35 to 44 Years | 17 (1.7%) | 48 (6.4%) |
| 45 to 54 Years | 0 (0.0%) | 122 (23.2%) |
| 55 to 64 Years | 0 (0.0%) | 46 (5.3%) |
| 65 to 74 Years | 0 (0.0%) | 26 (4.3%) |
| 75 Years and over | 22 (7.2%) | 53 (15.5%) |
| Total | 340 (5.2%) | 675 (13.5%) |
Income Above Poverty by Sex and Age in Moss Bluff
According to the poverty statistics in Moss Bluff, males aged 16 and 17 years and females aged 5 years are the age groups that are most secure financially, with 100.0% of males and 100.0% of females in these age groups living above the poverty line.
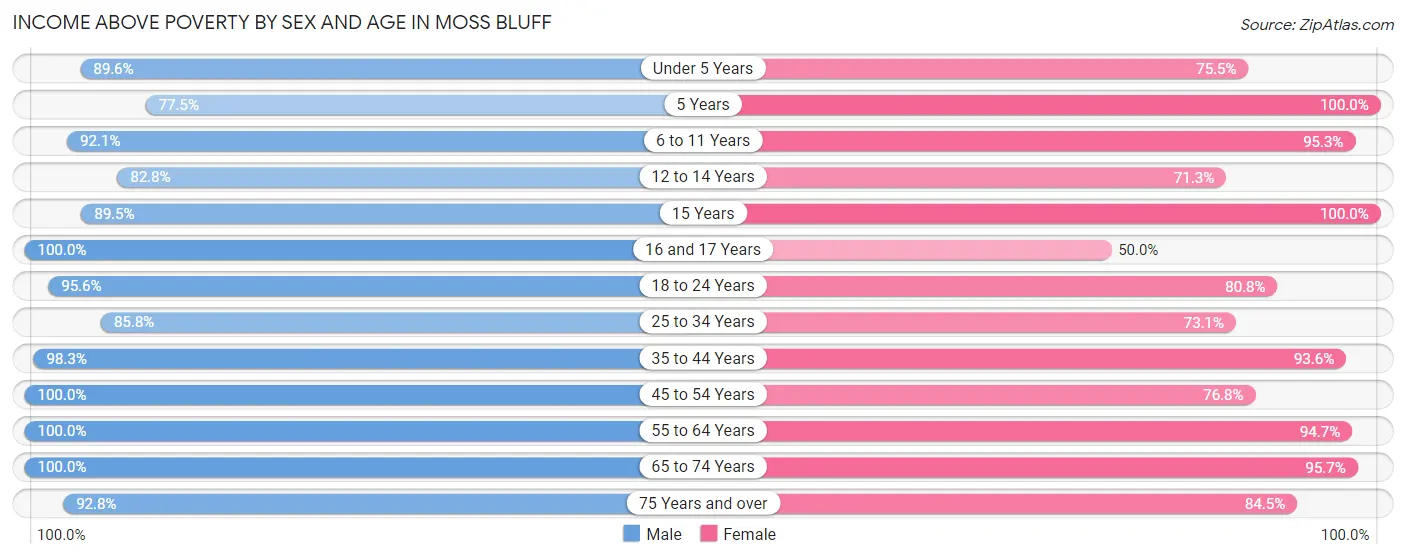
| Age Bracket | Male | Female |
| Under 5 Years | 225 (89.6%) | 126 (75.4%) |
| 5 Years | 69 (77.5%) | 7 (100.0%) |
| 6 to 11 Years | 642 (92.1%) | 425 (95.3%) |
| 12 to 14 Years | 173 (82.8%) | 169 (71.3%) |
| 15 Years | 102 (89.5%) | 103 (100.0%) |
| 16 and 17 Years | 48 (100.0%) | 18 (50.0%) |
| 18 to 24 Years | 348 (95.6%) | 173 (80.8%) |
| 25 to 34 Years | 823 (85.8%) | 520 (73.1%) |
| 35 to 44 Years | 1,007 (98.3%) | 700 (93.6%) |
| 45 to 54 Years | 840 (100.0%) | 403 (76.8%) |
| 55 to 64 Years | 676 (100.0%) | 822 (94.7%) |
| 65 to 74 Years | 972 (100.0%) | 583 (95.7%) |
| 75 Years and over | 285 (92.8%) | 289 (84.5%) |
| Total | 6,210 (94.8%) | 4,338 (86.5%) |
Income Below Poverty Among Married-Couple Families in Moss Bluff
The poverty statistics for married-couple families in Moss Bluff show that 1.3% or 31 of the total 2,422 families live below the poverty line. Families with 1 or 2 children have the highest poverty rate of 3.9%, comprising of 25 families. On the other hand, families with 3 or 4 children have the lowest poverty rate of 0.0%, which includes 0 families.
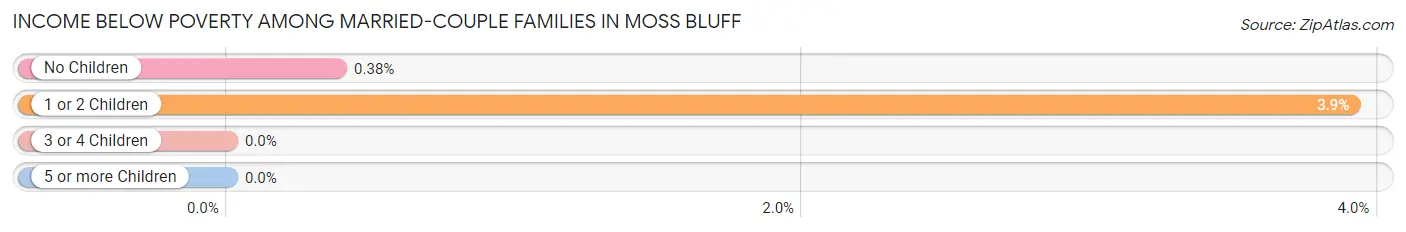
| Children | Above Poverty | Below Poverty |
| No Children | 1,562 (99.6%) | 6 (0.4%) |
| 1 or 2 Children | 614 (96.1%) | 25 (3.9%) |
| 3 or 4 Children | 215 (100.0%) | 0 (0.0%) |
| 5 or more Children | 0 (0.0%) | 0 (0.0%) |
| Total | 2,391 (98.7%) | 31 (1.3%) |
Income Below Poverty Among Single-Parent Households in Moss Bluff
According to the poverty data in Moss Bluff, 9.4% or 16 single-father households and 35.5% or 139 single-mother households are living below the poverty line. Among single-father households, those with 1 or 2 children have the highest poverty rate, with 16 households (15.7%) experiencing poverty. Likewise, among single-mother households, those with 1 or 2 children have the highest poverty rate, with 127 households (58.5%) falling below the poverty line.
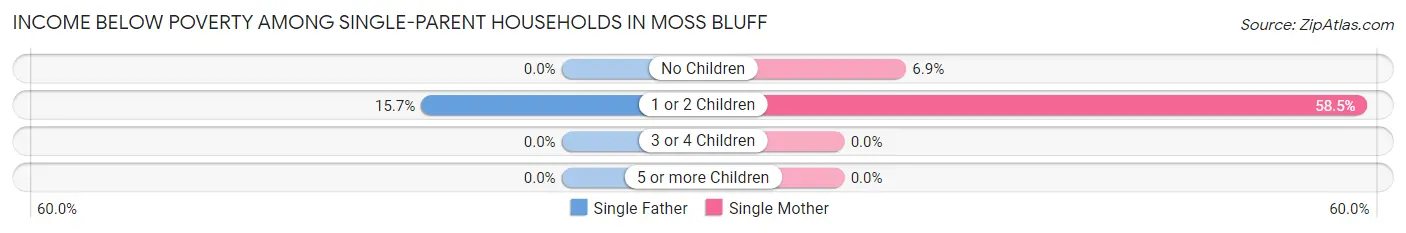
| Children | Single Father | Single Mother |
| No Children | 0 (0.0%) | 12 (6.9%) |
| 1 or 2 Children | 16 (15.7%) | 127 (58.5%) |
| 3 or 4 Children | 0 (0.0%) | 0 (0.0%) |
| 5 or more Children | 0 (0.0%) | 0 (0.0%) |
| Total | 16 (9.4%) | 139 (35.5%) |
Income Below Poverty Among Married-Couple vs Single-Parent Households in Moss Bluff
The poverty data for Moss Bluff shows that 31 of the married-couple family households (1.3%) and 155 of the single-parent households (27.6%) are living below the poverty level. Within the married-couple family households, those with 1 or 2 children have the highest poverty rate, with 25 households (3.9%) falling below the poverty line. Among the single-parent households, those with 1 or 2 children have the highest poverty rate, with 143 household (44.8%) living below poverty.
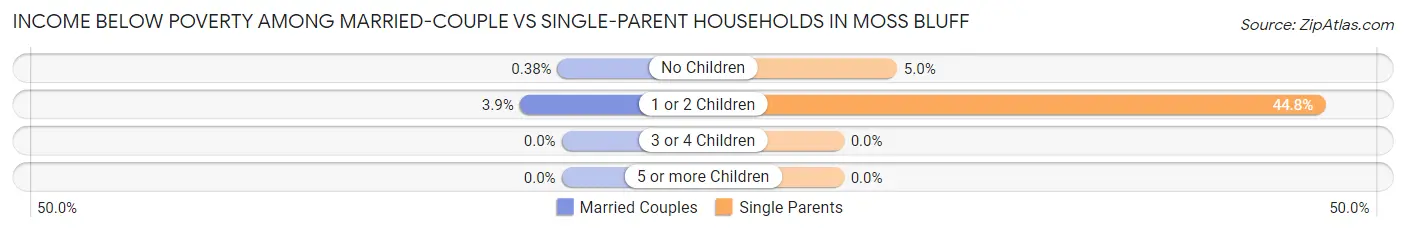
| Children | Married-Couple Families | Single-Parent Households |
| No Children | 6 (0.4%) | 12 (5.0%) |
| 1 or 2 Children | 25 (3.9%) | 143 (44.8%) |
| 3 or 4 Children | 0 (0.0%) | 0 (0.0%) |
| 5 or more Children | 0 (0.0%) | 0 (0.0%) |
| Total | 31 (1.3%) | 155 (27.6%) |
Race in Moss Bluff
The most populous races in Moss Bluff are White / Caucasian (9,807 | 84.7%), Black / African American (1,206 | 10.4%), and Two or more Races (343 | 3.0%).
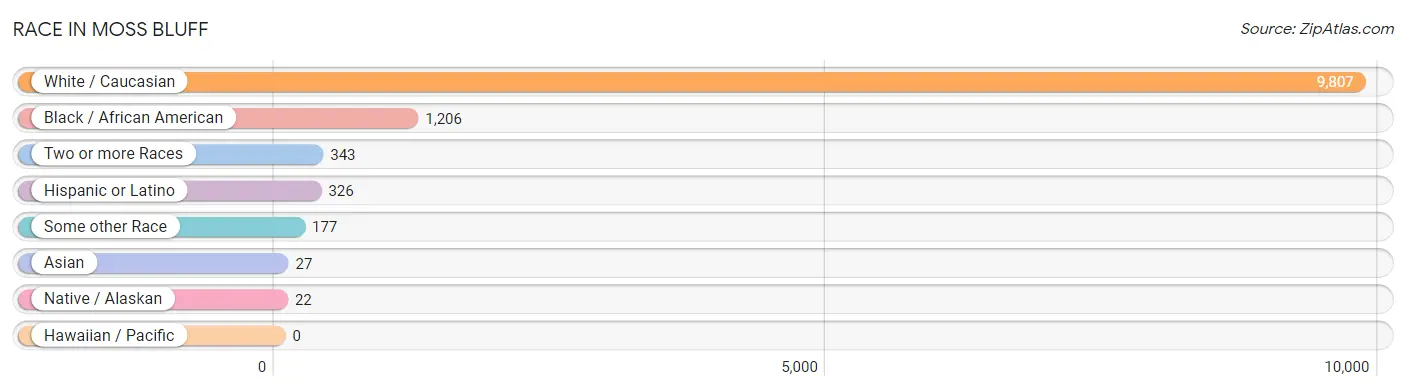
| Race | # Population | % Population |
| Asian | 27 | 0.2% |
| Black / African American | 1,206 | 10.4% |
| Hawaiian / Pacific | 0 | 0.0% |
| Hispanic or Latino | 326 | 2.8% |
| Native / Alaskan | 22 | 0.2% |
| White / Caucasian | 9,807 | 84.7% |
| Two or more Races | 343 | 3.0% |
| Some other Race | 177 | 1.5% |
| Total | 11,582 | 100.0% |
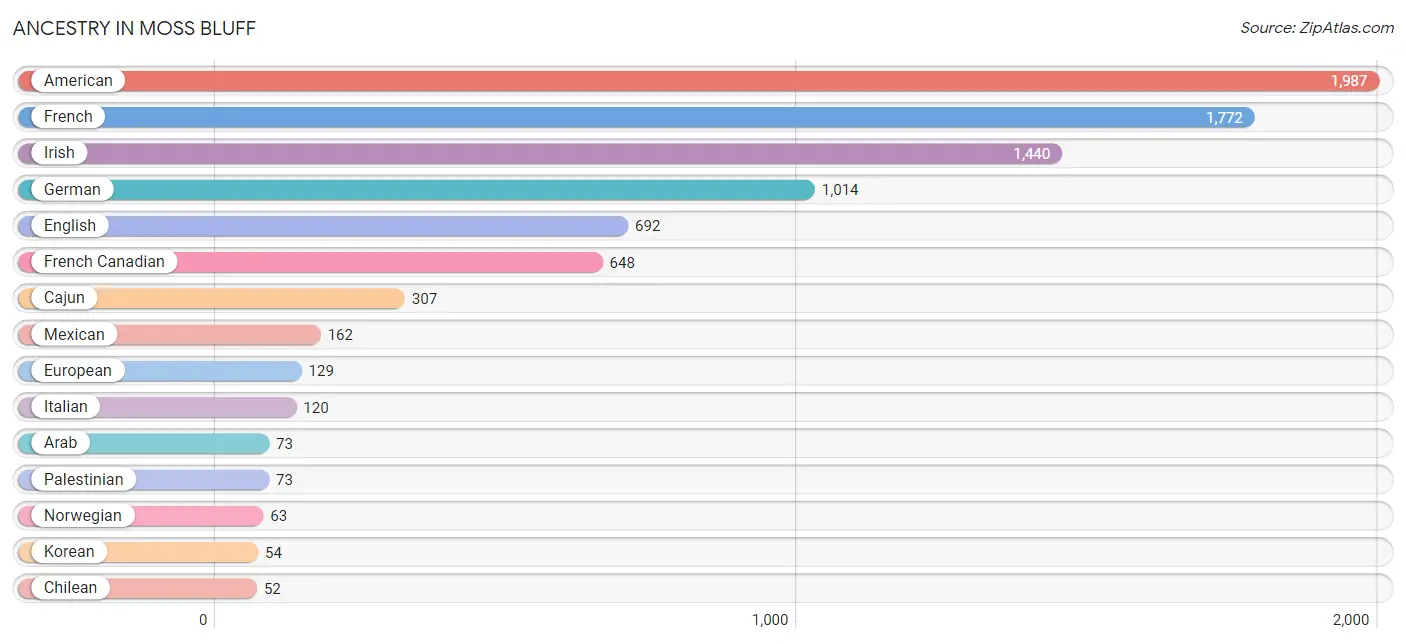
Ancestry in Moss Bluff
The most populous ancestries reported in Moss Bluff are American (1,987 | 17.2%), French (1,772 | 15.3%), Irish (1,440 | 12.4%), German (1,014 | 8.7%), and English (692 | 6.0%), together accounting for 59.6% of all Moss Bluff residents.
| Ancestry | # Population | % Population |
| African | 51 | 0.4% |
| American | 1,987 | 17.2% |
| Arab | 73 | 0.6% |
| Austrian | 9 | 0.1% |
| Brazilian | 14 | 0.1% |
| British | 46 | 0.4% |
| Cajun | 307 | 2.6% |
| Chilean | 52 | 0.4% |
| Danish | 19 | 0.2% |
| Dutch | 16 | 0.1% |
| English | 692 | 6.0% |
| European | 129 | 1.1% |
| French | 1,772 | 15.3% |
| French Canadian | 648 | 5.6% |
| German | 1,014 | 8.7% |
| Hungarian | 32 | 0.3% |
| Indian (Asian) | 1 | 0.0% |
| Irish | 1,440 | 12.4% |
| Italian | 120 | 1.0% |
| Korean | 54 | 0.5% |
| Mexican | 162 | 1.4% |
| Native Hawaiian | 1 | 0.0% |
| Norwegian | 63 | 0.5% |
| Pakistani | 9 | 0.1% |
| Palestinian | 73 | 0.6% |
| Polish | 25 | 0.2% |
| Puerto Rican | 44 | 0.4% |
| Romanian | 12 | 0.1% |
| Samoan | 33 | 0.3% |
| Scotch-Irish | 15 | 0.1% |
| Scottish | 21 | 0.2% |
| South American | 52 | 0.4% |
| Spaniard | 4 | 0.0% |
| Subsaharan African | 51 | 0.4% |
| Swedish | 16 | 0.1% |
| Thai | 18 | 0.2% |
| Turkish | 34 | 0.3% |
| Ukrainian | 12 | 0.1% |
| Welsh | 36 | 0.3% | View All 39 Rows |
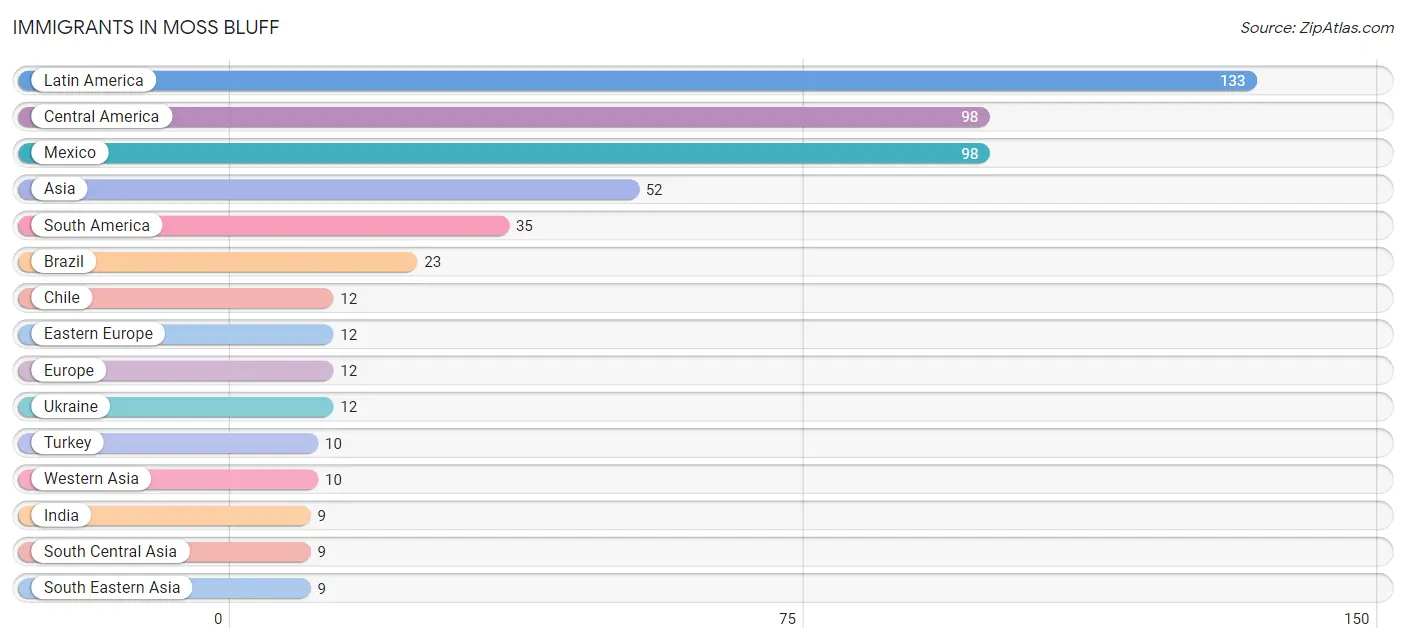
Immigrants in Moss Bluff
The most numerous immigrant groups reported in Moss Bluff came from Latin America (133 | 1.1%), Central America (98 | 0.9%), Mexico (98 | 0.9%), Asia (52 | 0.4%), and South America (35 | 0.3%), together accounting for 3.6% of all Moss Bluff residents.
| Immigration Origin | # Population | % Population |
| Asia | 52 | 0.4% |
| Brazil | 23 | 0.2% |
| Central America | 98 | 0.9% |
| Chile | 12 | 0.1% |
| Eastern Europe | 12 | 0.1% |
| Europe | 12 | 0.1% |
| India | 9 | 0.1% |
| Latin America | 133 | 1.1% |
| Mexico | 98 | 0.9% |
| South America | 35 | 0.3% |
| South Central Asia | 9 | 0.1% |
| South Eastern Asia | 9 | 0.1% |
| Thailand | 9 | 0.1% |
| Turkey | 10 | 0.1% |
| Ukraine | 12 | 0.1% |
| Western Asia | 10 | 0.1% | View All 16 Rows |
Sex and Age in Moss Bluff
Sex and Age in Moss Bluff
The most populous age groups in Moss Bluff are 40 to 44 Years (698 | 10.6%) for men and 60 to 64 Years (482 | 9.6%) for women.
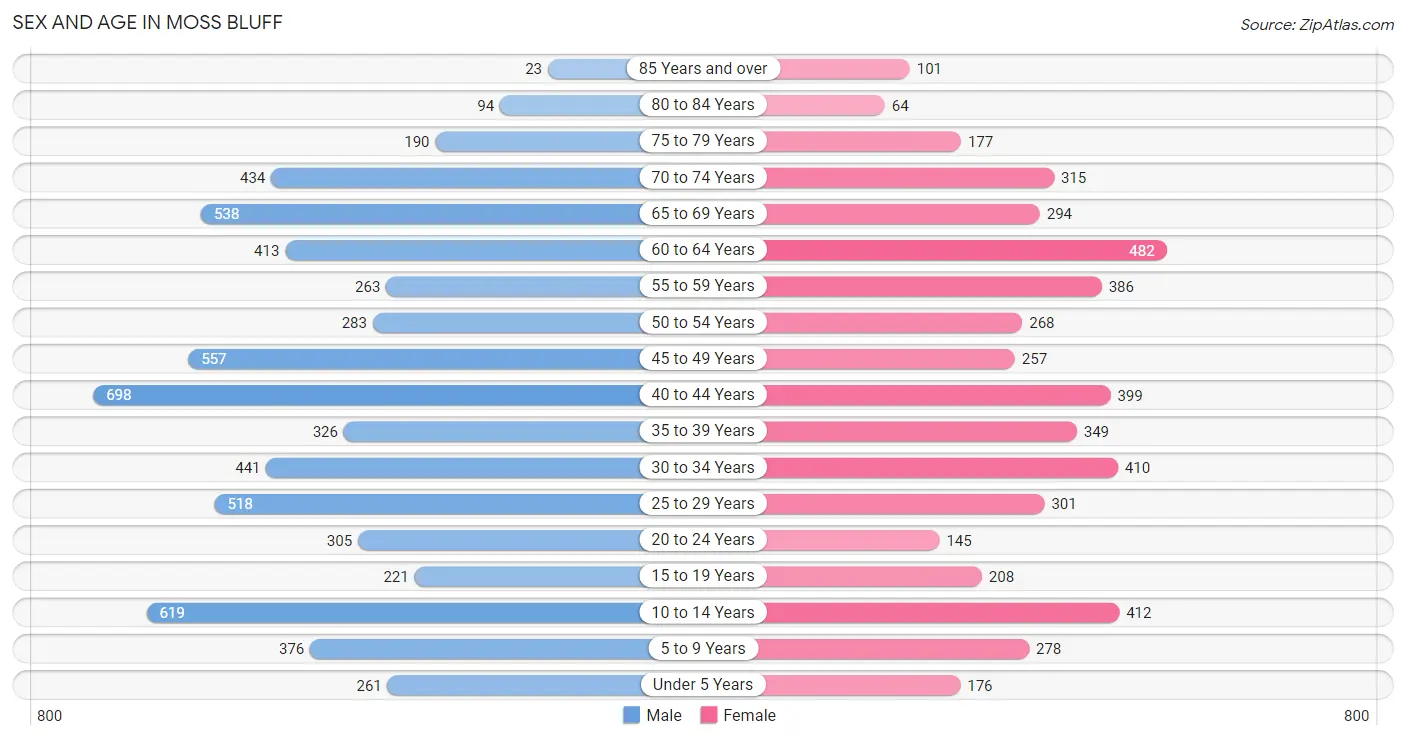
| Age Bracket | Male | Female |
| Under 5 Years | 261 (4.0%) | 176 (3.5%) |
| 5 to 9 Years | 376 (5.7%) | 278 (5.5%) |
| 10 to 14 Years | 619 (9.4%) | 412 (8.2%) |
| 15 to 19 Years | 221 (3.4%) | 208 (4.1%) |
| 20 to 24 Years | 305 (4.6%) | 145 (2.9%) |
| 25 to 29 Years | 518 (7.9%) | 301 (6.0%) |
| 30 to 34 Years | 441 (6.7%) | 410 (8.2%) |
| 35 to 39 Years | 326 (5.0%) | 349 (7.0%) |
| 40 to 44 Years | 698 (10.6%) | 399 (8.0%) |
| 45 to 49 Years | 557 (8.5%) | 257 (5.1%) |
| 50 to 54 Years | 283 (4.3%) | 268 (5.3%) |
| 55 to 59 Years | 263 (4.0%) | 386 (7.7%) |
| 60 to 64 Years | 413 (6.3%) | 482 (9.6%) |
| 65 to 69 Years | 538 (8.2%) | 294 (5.9%) |
| 70 to 74 Years | 434 (6.6%) | 315 (6.3%) |
| 75 to 79 Years | 190 (2.9%) | 177 (3.5%) |
| 80 to 84 Years | 94 (1.4%) | 64 (1.3%) |
| 85 Years and over | 23 (0.4%) | 101 (2.0%) |
| Total | 6,560 (100.0%) | 5,022 (100.0%) |
Families and Households in Moss Bluff
Median Family Size in Moss Bluff
The median family size in Moss Bluff is 3.00 persons per family, with married-couple families (2,422 | 81.2%) accounting for the largest median family size of 3.04 persons per family. On the other hand, single male/father families (170 | 5.7%) represent the smallest median family size with 2.78 persons per family.
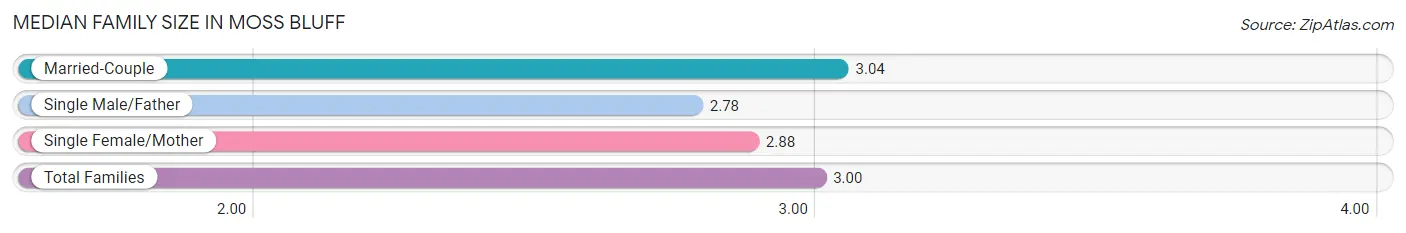
| Family Type | # Families | Family Size |
| Married-Couple | 2,422 (81.2%) | 3.04 |
| Single Male/Father | 170 (5.7%) | 2.78 |
| Single Female/Mother | 391 (13.1%) | 2.88 |
| Total Families | 2,983 (100.0%) | 3.00 |
Median Household Size in Moss Bluff
The median household size in Moss Bluff is 2.39 persons per household, with single male/father households (170 | 3.5%) accounting for the largest median household size of 3.33 persons per household. non-family households (1,855 | 38.3%) represent the smallest median household size with 1.30 persons per household.
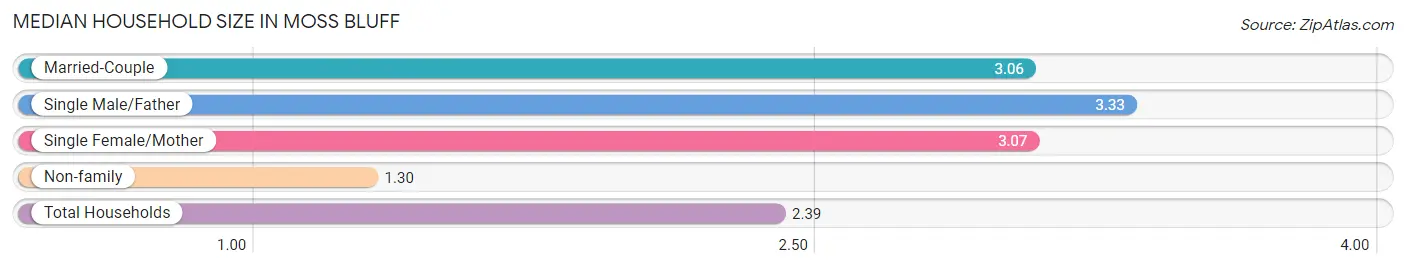
| Household Type | # Households | Household Size |
| Married-Couple | 2,422 (50.1%) | 3.06 |
| Single Male/Father | 170 (3.5%) | 3.33 |
| Single Female/Mother | 391 (8.1%) | 3.07 |
| Non-family | 1,855 (38.3%) | 1.30 |
| Total Households | 4,838 (100.0%) | 2.39 |
Household Size by Marriage Status in Moss Bluff
Out of a total of 4,838 households in Moss Bluff, 2,983 (61.7%) are family households, while 1,855 (38.3%) are nonfamily households. The most numerous type of family households are 2-person households, comprising 1,455, and the most common type of nonfamily households are 1-person households, comprising 1,439.
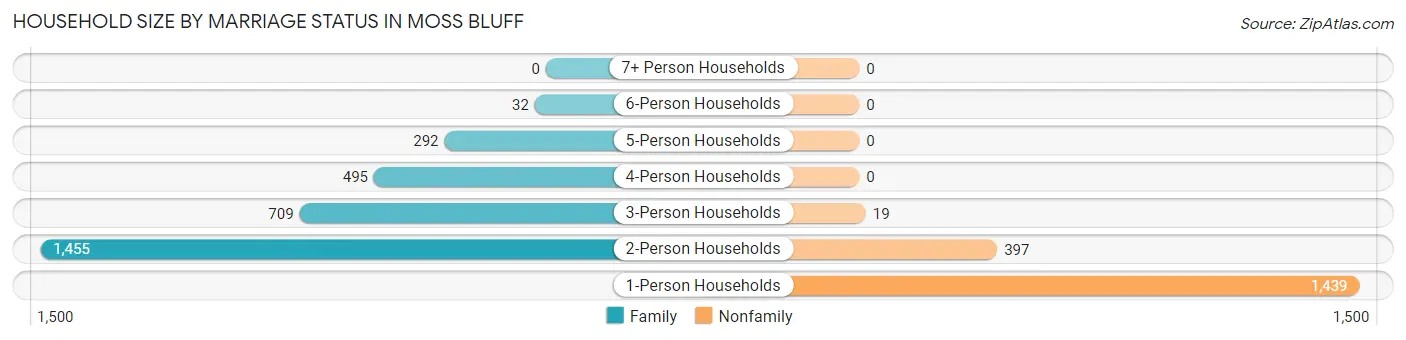
| Household Size | Family Households | Nonfamily Households |
| 1-Person Households | - | 1,439 (29.7%) |
| 2-Person Households | 1,455 (30.1%) | 397 (8.2%) |
| 3-Person Households | 709 (14.6%) | 19 (0.4%) |
| 4-Person Households | 495 (10.2%) | 0 (0.0%) |
| 5-Person Households | 292 (6.0%) | 0 (0.0%) |
| 6-Person Households | 32 (0.7%) | 0 (0.0%) |
| 7+ Person Households | 0 (0.0%) | 0 (0.0%) |
| Total | 2,983 (61.7%) | 1,855 (38.3%) |
Female Fertility in Moss Bluff
Fertility by Age in Moss Bluff
Average fertility rate in Moss Bluff is 54.0 births per 1,000 women. Women in the age bracket of 20 to 34 years have the highest fertility rate with 117.0 births per 1,000 women. Women in the age bracket of 20 to 34 years acount for 87.7% of all women with births.
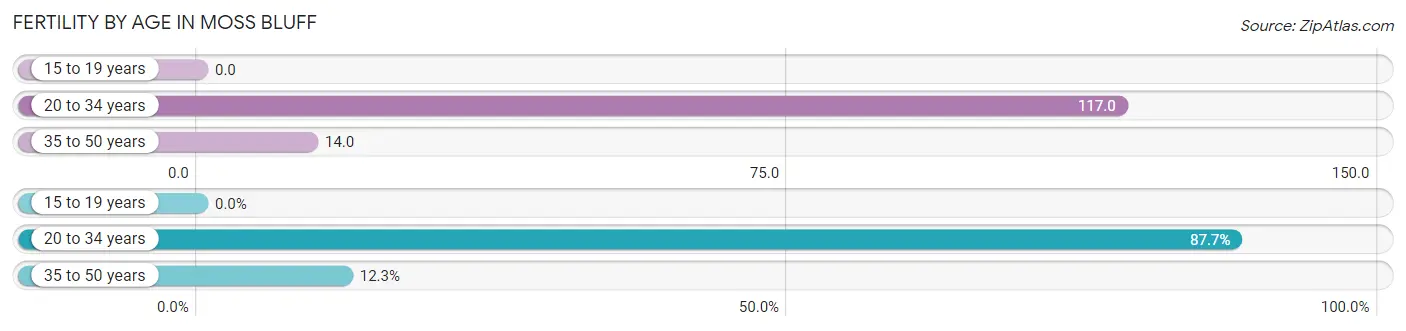
| Age Bracket | Women with Births | Births / 1,000 Women |
| 15 to 19 years | 0 (0.0%) | 0.0 |
| 20 to 34 years | 100 (87.7%) | 117.0 |
| 35 to 50 years | 14 (12.3%) | 14.0 |
| Total | 114 (100.0%) | 54.0 |
Fertility by Age by Marriage Status in Moss Bluff
91.2% of women with births (114) in Moss Bluff are married. The highest percentage of unmarried women with births falls into 20 to 34 years age bracket with 10.0% of them unmarried at the time of birth, while the lowest percentage of unmarried women with births belong to 35 to 50 years age bracket with 0.0% of them unmarried.
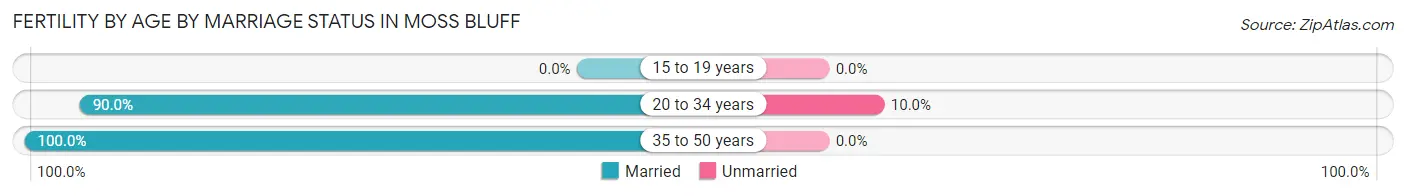
| Age Bracket | Married | Unmarried |
| 15 to 19 years | 0 (0.0%) | 0 (0.0%) |
| 20 to 34 years | 90 (90.0%) | 10 (10.0%) |
| 35 to 50 years | 14 (100.0%) | 0 (0.0%) |
| Total | 104 (91.2%) | 10 (8.8%) |
Fertility by Education in Moss Bluff
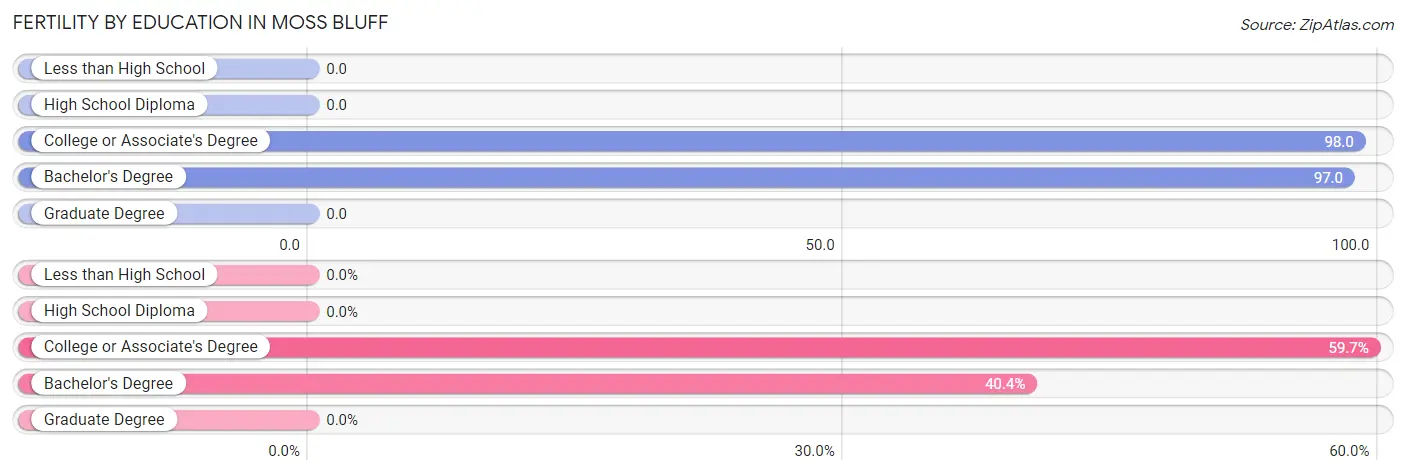
| Educational Attainment | Women with Births | Births / 1,000 Women |
| Less than High School | 0 (0.0%) | 0.0 |
| High School Diploma | 0 (0.0%) | 0.0 |
| College or Associate's Degree | 68 (59.7%) | 98.0 |
| Bachelor's Degree | 46 (40.4%) | 97.0 |
| Graduate Degree | 0 (0.0%) | 0.0 |
| Total | 114 (100.0%) | 54.0 |
Fertility by Education by Marriage Status in Moss Bluff
8.8% of women with births in Moss Bluff are unmarried. Women with the educational attainment of bachelor's degree are most likely to be married with 100.0% of them married at childbirth, while women with the educational attainment of college or associate's degree are least likely to be married with 14.7% of them unmarried at childbirth.
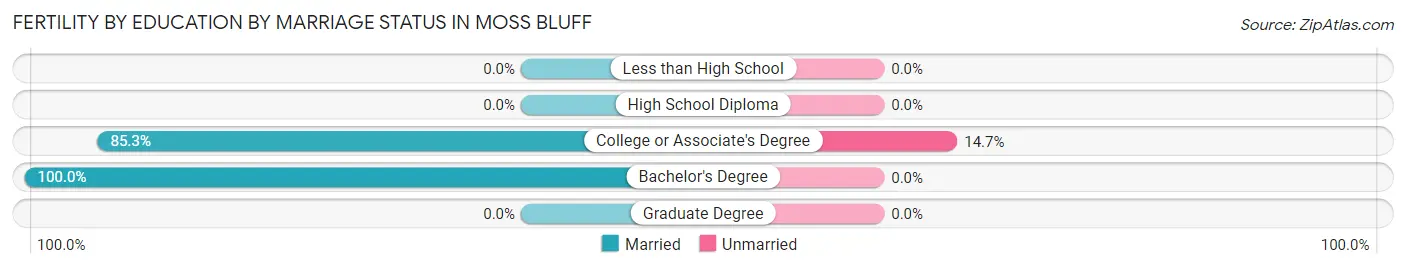
| Educational Attainment | Married | Unmarried |
| Less than High School | 0 (0.0%) | 0 (0.0%) |
| High School Diploma | 0 (0.0%) | 0 (0.0%) |
| College or Associate's Degree | 58 (85.3%) | 10 (14.7%) |
| Bachelor's Degree | 46 (100.0%) | 0 (0.0%) |
| Graduate Degree | 0 (0.0%) | 0 (0.0%) |
| Total | 104 (91.2%) | 10 (8.8%) |
Employment Characteristics in Moss Bluff
Employment by Class of Employer in Moss Bluff
Among the 5,313 employed individuals in Moss Bluff, private company employees (3,711 | 69.9%), local government employees (514 | 9.7%), and self-employed (not incorporated) (449 | 8.5%) make up the most common classes of employment.
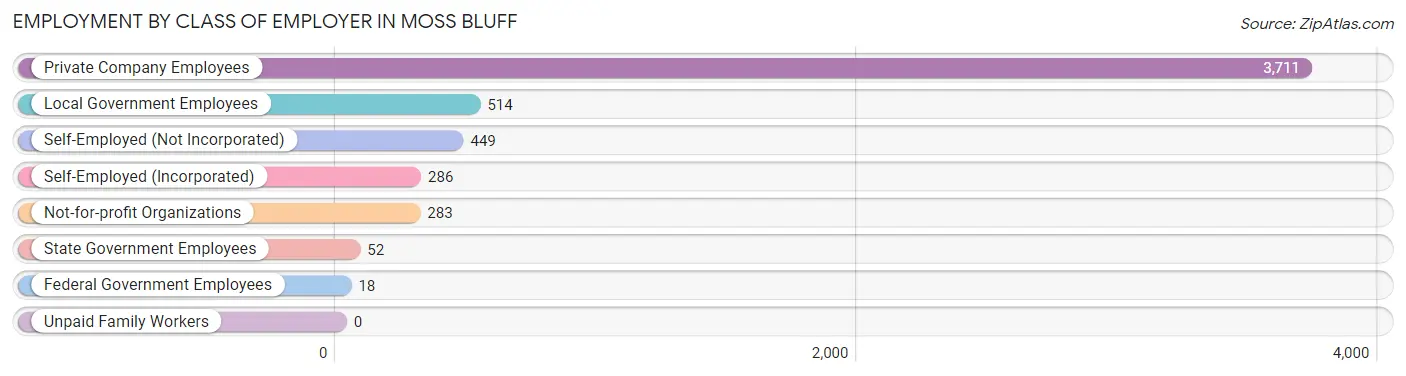
| Employer Class | # Employees | % Employees |
| Private Company Employees | 3,711 | 69.9% |
| Self-Employed (Incorporated) | 286 | 5.4% |
| Self-Employed (Not Incorporated) | 449 | 8.5% |
| Not-for-profit Organizations | 283 | 5.3% |
| Local Government Employees | 514 | 9.7% |
| State Government Employees | 52 | 1.0% |
| Federal Government Employees | 18 | 0.3% |
| Unpaid Family Workers | 0 | 0.0% |
| Total | 5,313 | 100.0% |
Employment Status by Age in Moss Bluff
According to the labor force statistics for Moss Bluff, out of the total population over 16 years of age (9,243), 59.3% or 5,481 individuals are in the labor force, with 2.3% or 126 of them unemployed. The age group with the highest labor force participation rate is 25 to 29 years, with 93.3% or 764 individuals in the labor force. Within the labor force, the 16 to 19 years age range has the highest percentage of unemployed individuals, with 27.6% or 29 of them being unemployed.
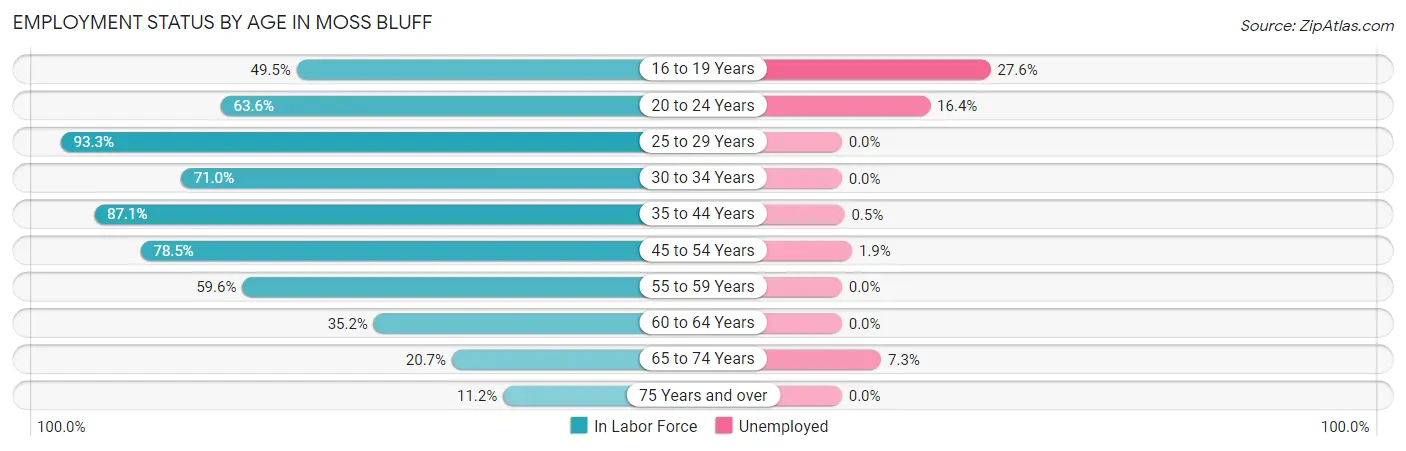
| Age Bracket | In Labor Force | Unemployed |
| 16 to 19 Years | 105 (49.5%) | 29 (27.6%) |
| 20 to 24 Years | 286 (63.6%) | 47 (16.4%) |
| 25 to 29 Years | 764 (93.3%) | 0 (0.0%) |
| 30 to 34 Years | 604 (71.0%) | 0 (0.0%) |
| 35 to 44 Years | 1,543 (87.1%) | 8 (0.5%) |
| 45 to 54 Years | 1,072 (78.5%) | 20 (1.9%) |
| 55 to 59 Years | 387 (59.6%) | 0 (0.0%) |
| 60 to 64 Years | 315 (35.2%) | 0 (0.0%) |
| 65 to 74 Years | 327 (20.7%) | 24 (7.3%) |
| 75 Years and over | 73 (11.2%) | 0 (0.0%) |
| Total | 5,481 (59.3%) | 126 (2.3%) |
Employment Status by Educational Attainment in Moss Bluff
According to labor force statistics for Moss Bluff, 73.8% of individuals (4,687) out of the total population between 25 and 64 years of age (6,351) are in the labor force, with 0.6% or 28 of them being unemployed. The group with the highest labor force participation rate are those with the educational attainment of bachelor's degree or higher, with 87.6% or 1,587 individuals in the labor force. Within the labor force, individuals with high school diploma education have the highest percentage of unemployment, with 1.6% or 20 of them being unemployed.
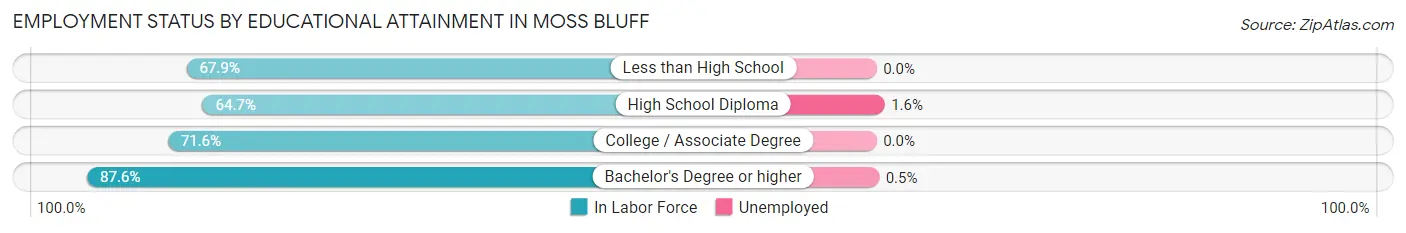
| Educational Attainment | In Labor Force | Unemployed |
| Less than High School | 303 (67.9%) | 0 (0.0%) |
| High School Diploma | 1,268 (64.7%) | 31 (1.6%) |
| College / Associate Degree | 1,527 (71.6%) | 0 (0.0%) |
| Bachelor's Degree or higher | 1,587 (87.6%) | 9 (0.5%) |
| Total | 4,687 (73.8%) | 38 (0.6%) |
Employment Occupations by Sex in Moss Bluff
Management, Business, Science and Arts Occupations
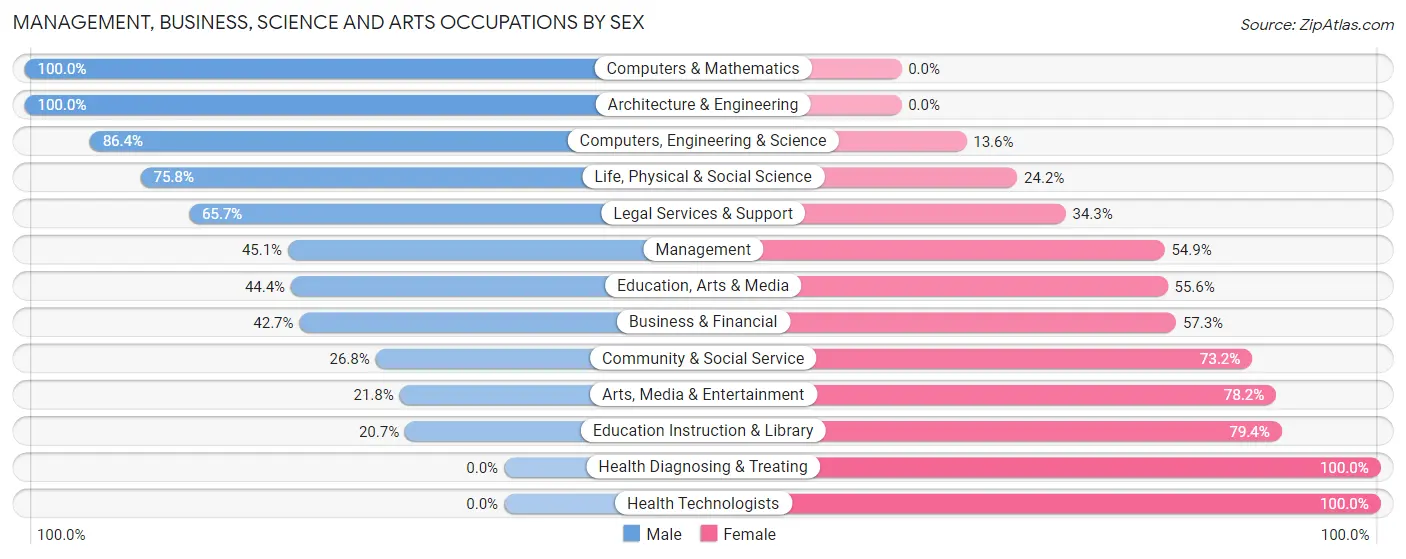
The most common Management, Business, Science and Arts occupations in Moss Bluff are Community & Social Service (515 | 9.6%), Management (426 | 8.0%), Computers, Engineering & Science (390 | 7.3%), Education Instruction & Library (339 | 6.3%), and Health Diagnosing & Treating (294 | 5.5%).
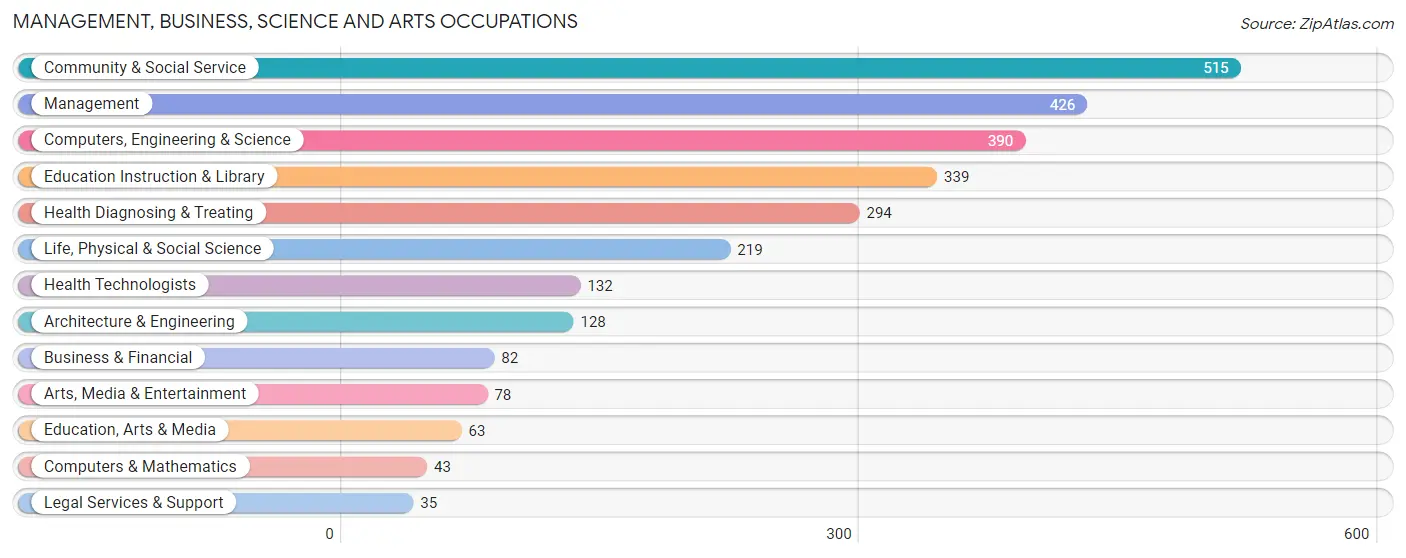
Management, Business, Science and Arts Occupations by Sex
Within the Management, Business, Science and Arts occupations in Moss Bluff, the most male-oriented occupations are Computers & Mathematics (100.0%), Architecture & Engineering (100.0%), and Computers, Engineering & Science (86.4%), while the most female-oriented occupations are Health Diagnosing & Treating (100.0%), Health Technologists (100.0%), and Education Instruction & Library (79.3%).
| Occupation | Male | Female |
| Management | 192 (45.1%) | 234 (54.9%) |
| Business & Financial | 35 (42.7%) | 47 (57.3%) |
| Computers, Engineering & Science | 337 (86.4%) | 53 (13.6%) |
| Computers & Mathematics | 43 (100.0%) | 0 (0.0%) |
| Architecture & Engineering | 128 (100.0%) | 0 (0.0%) |
| Life, Physical & Social Science | 166 (75.8%) | 53 (24.2%) |
| Community & Social Service | 138 (26.8%) | 377 (73.2%) |
| Education, Arts & Media | 28 (44.4%) | 35 (55.6%) |
| Legal Services & Support | 23 (65.7%) | 12 (34.3%) |
| Education Instruction & Library | 70 (20.6%) | 269 (79.3%) |
| Arts, Media & Entertainment | 17 (21.8%) | 61 (78.2%) |
| Health Diagnosing & Treating | 0 (0.0%) | 294 (100.0%) |
| Health Technologists | 0 (0.0%) | 132 (100.0%) |
| Total (Category) | 702 (41.1%) | 1,005 (58.9%) |
| Total (Overall) | 3,402 (63.6%) | 1,947 (36.4%) |
Services Occupations
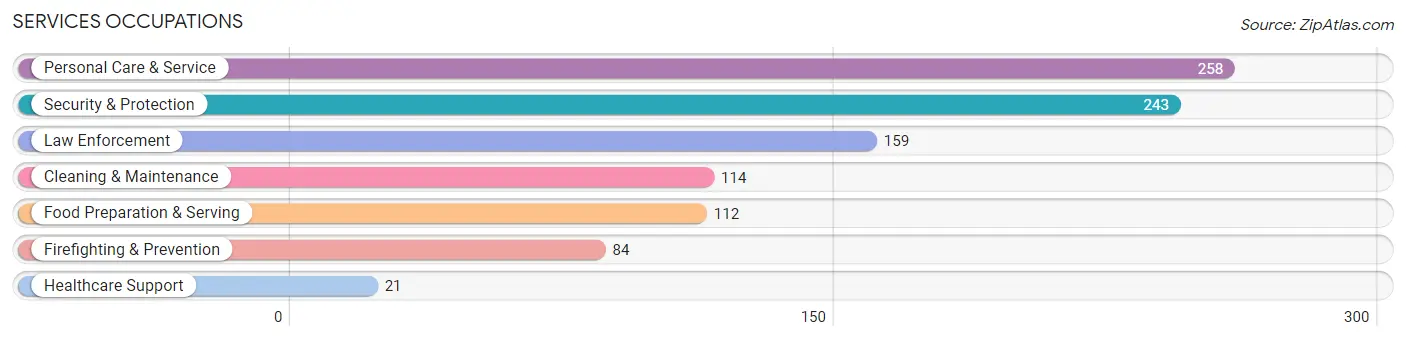
The most common Services occupations in Moss Bluff are Personal Care & Service (258 | 4.8%), Security & Protection (243 | 4.5%), Law Enforcement (159 | 3.0%), Cleaning & Maintenance (114 | 2.1%), and Food Preparation & Serving (112 | 2.1%).
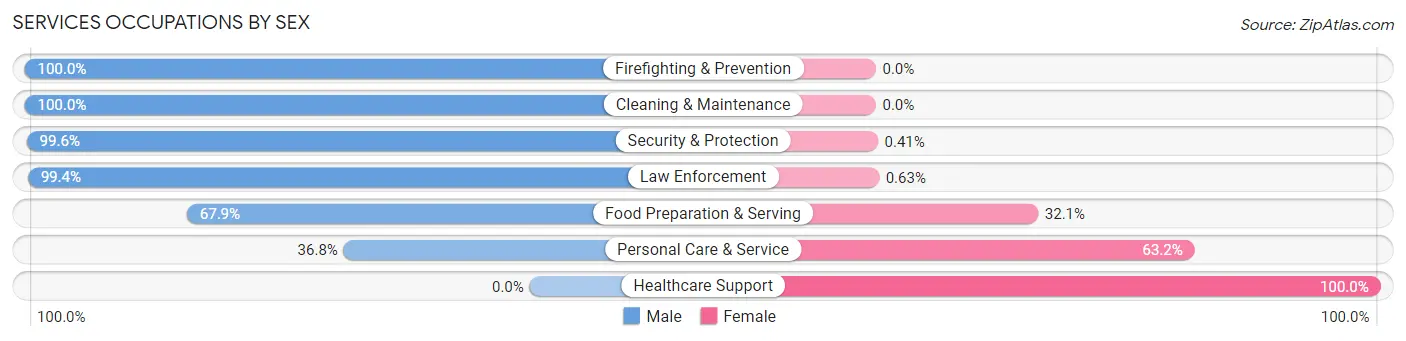
Services Occupations by Sex
Within the Services occupations in Moss Bluff, the most male-oriented occupations are Firefighting & Prevention (100.0%), Cleaning & Maintenance (100.0%), and Security & Protection (99.6%), while the most female-oriented occupations are Healthcare Support (100.0%), Personal Care & Service (63.2%), and Food Preparation & Serving (32.1%).
| Occupation | Male | Female |
| Healthcare Support | 0 (0.0%) | 21 (100.0%) |
| Security & Protection | 242 (99.6%) | 1 (0.4%) |
| Firefighting & Prevention | 84 (100.0%) | 0 (0.0%) |
| Law Enforcement | 158 (99.4%) | 1 (0.6%) |
| Food Preparation & Serving | 76 (67.9%) | 36 (32.1%) |
| Cleaning & Maintenance | 114 (100.0%) | 0 (0.0%) |
| Personal Care & Service | 95 (36.8%) | 163 (63.2%) |
| Total (Category) | 527 (70.5%) | 221 (29.5%) |
| Total (Overall) | 3,402 (63.6%) | 1,947 (36.4%) |
Sales and Office Occupations
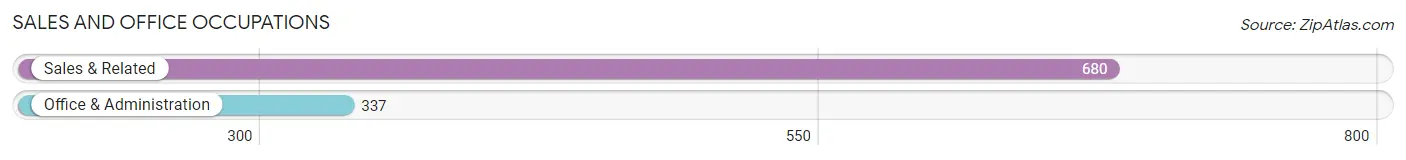
The most common Sales and Office occupations in Moss Bluff are Sales & Related (680 | 12.7%), and Office & Administration (337 | 6.3%).
Sales and Office Occupations by Sex
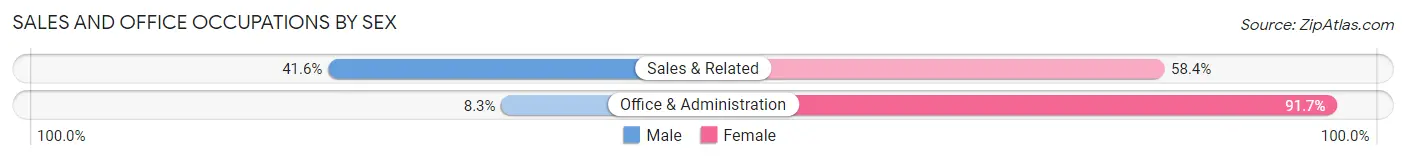
| Occupation | Male | Female |
| Sales & Related | 283 (41.6%) | 397 (58.4%) |
| Office & Administration | 28 (8.3%) | 309 (91.7%) |
| Total (Category) | 311 (30.6%) | 706 (69.4%) |
| Total (Overall) | 3,402 (63.6%) | 1,947 (36.4%) |
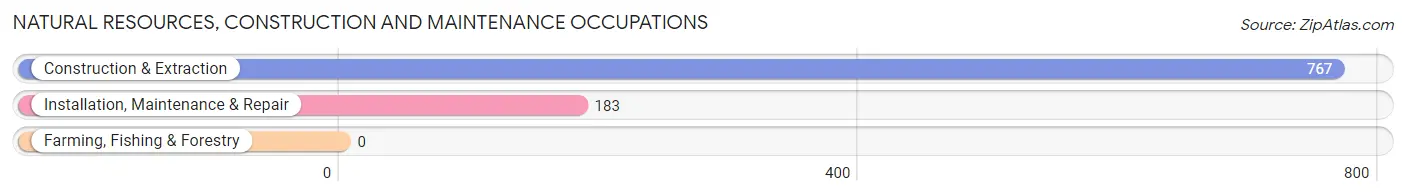
Natural Resources, Construction and Maintenance Occupations
The most common Natural Resources, Construction and Maintenance occupations in Moss Bluff are Construction & Extraction (767 | 14.3%), and Installation, Maintenance & Repair (183 | 3.4%).
Natural Resources, Construction and Maintenance Occupations by Sex
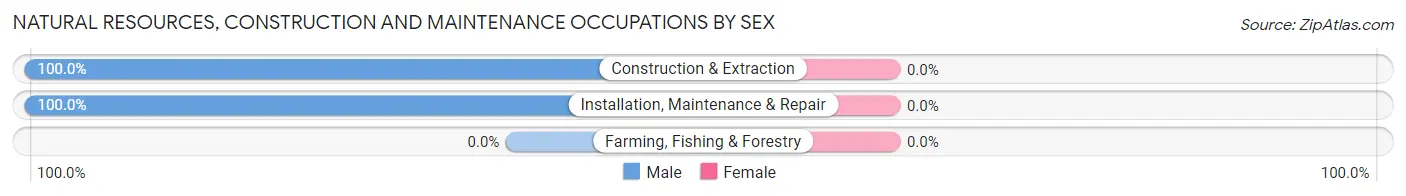
| Occupation | Male | Female |
| Farming, Fishing & Forestry | 0 (0.0%) | 0 (0.0%) |
| Construction & Extraction | 767 (100.0%) | 0 (0.0%) |
| Installation, Maintenance & Repair | 183 (100.0%) | 0 (0.0%) |
| Total (Category) | 950 (100.0%) | 0 (0.0%) |
| Total (Overall) | 3,402 (63.6%) | 1,947 (36.4%) |
Production, Transportation and Moving Occupations
The most common Production, Transportation and Moving occupations in Moss Bluff are Production (765 | 14.3%), Transportation (108 | 2.0%), and Material Moving (54 | 1.0%).
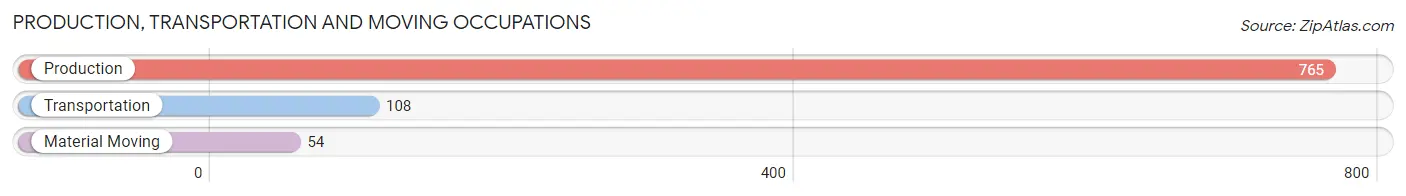
Production, Transportation and Moving Occupations by Sex
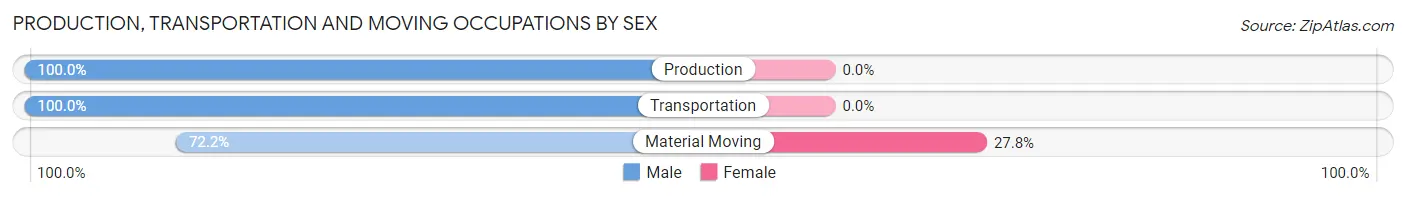
| Occupation | Male | Female |
| Production | 765 (100.0%) | 0 (0.0%) |
| Transportation | 108 (100.0%) | 0 (0.0%) |
| Material Moving | 39 (72.2%) | 15 (27.8%) |
| Total (Category) | 912 (98.4%) | 15 (1.6%) |
| Total (Overall) | 3,402 (63.6%) | 1,947 (36.4%) |
Employment Industries by Sex in Moss Bluff
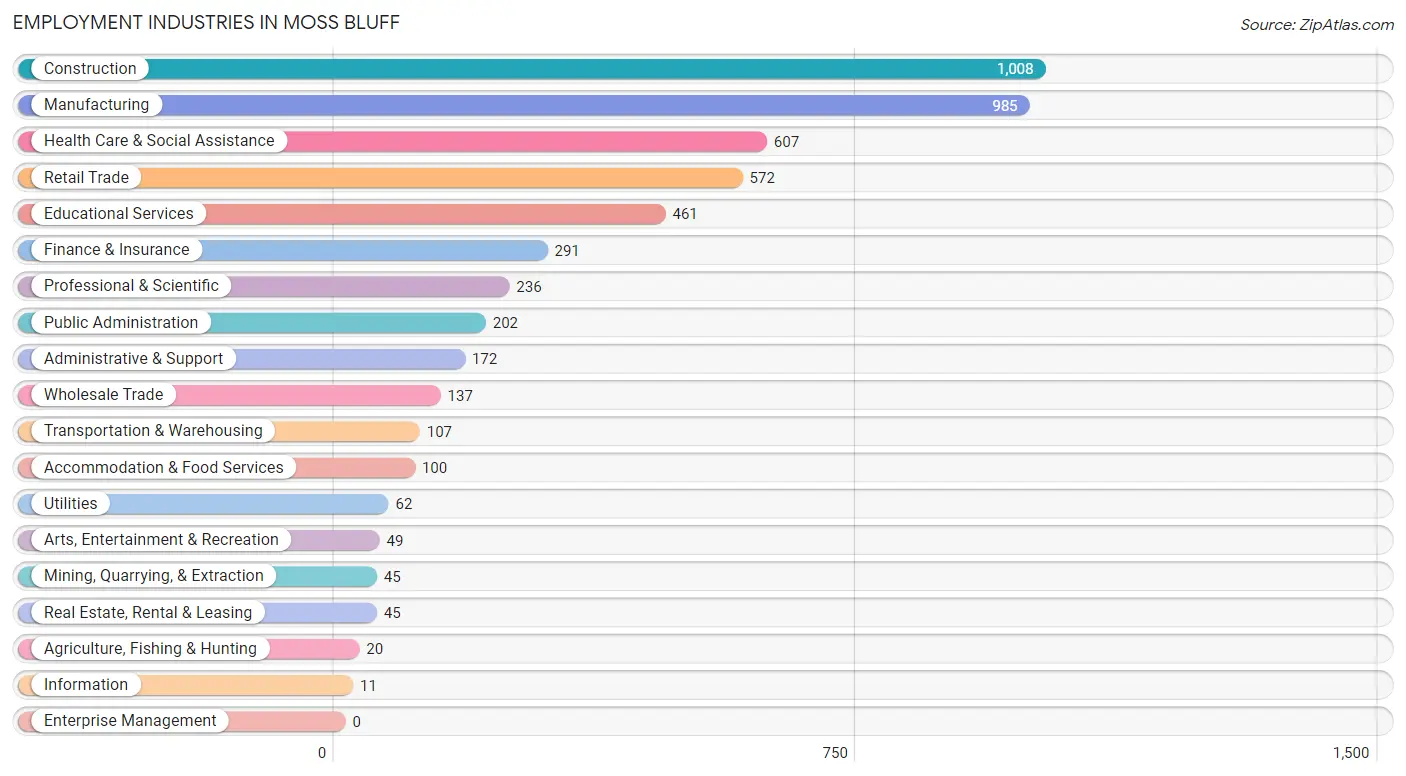
Employment Industries in Moss Bluff
The major employment industries in Moss Bluff include Construction (1,008 | 18.8%), Manufacturing (985 | 18.4%), Health Care & Social Assistance (607 | 11.4%), Retail Trade (572 | 10.7%), and Educational Services (461 | 8.6%).
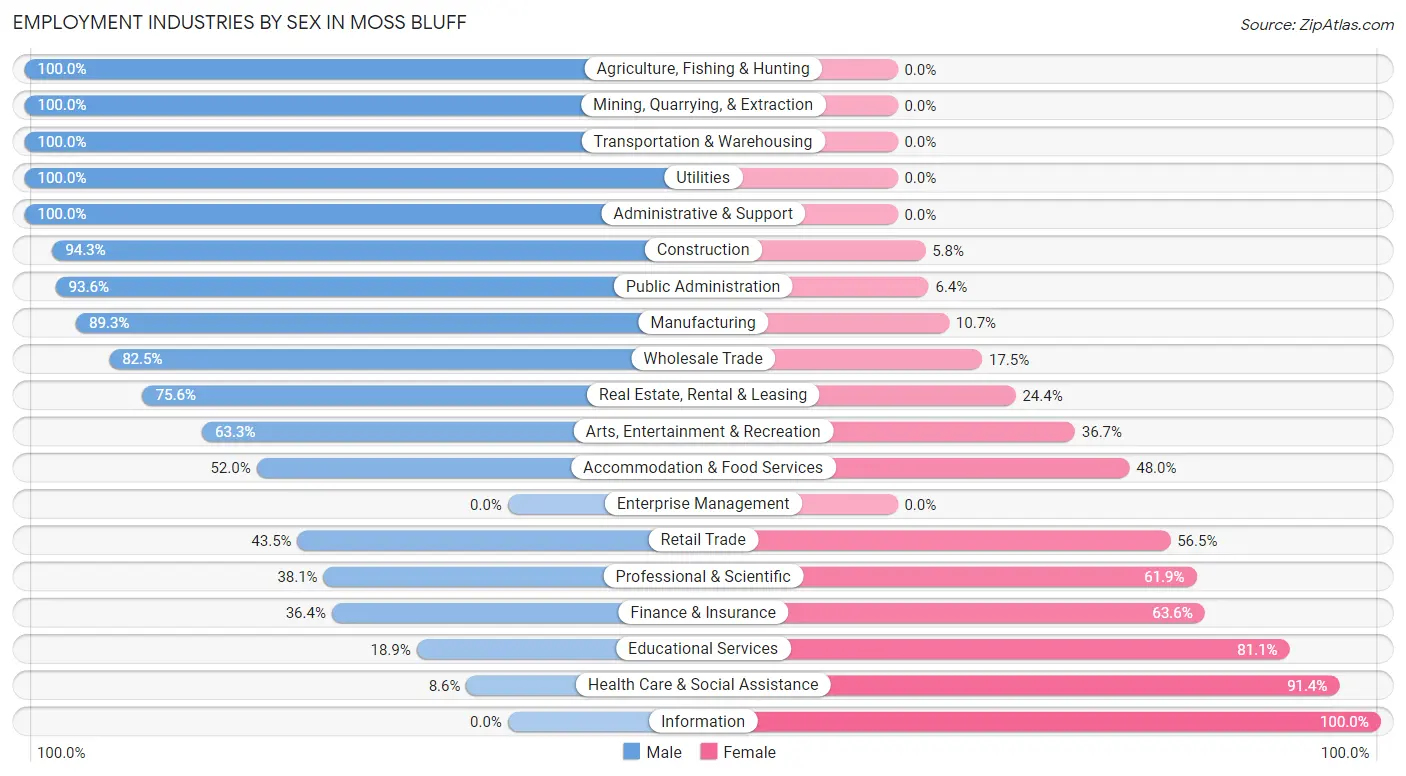
Employment Industries by Sex in Moss Bluff
The Moss Bluff industries that see more men than women are Agriculture, Fishing & Hunting (100.0%), Mining, Quarrying, & Extraction (100.0%), and Transportation & Warehousing (100.0%), whereas the industries that tend to have a higher number of women are Information (100.0%), Health Care & Social Assistance (91.4%), and Educational Services (81.1%).
| Industry | Male | Female |
| Agriculture, Fishing & Hunting | 20 (100.0%) | 0 (0.0%) |
| Mining, Quarrying, & Extraction | 45 (100.0%) | 0 (0.0%) |
| Construction | 950 (94.3%) | 58 (5.8%) |
| Manufacturing | 880 (89.3%) | 105 (10.7%) |
| Wholesale Trade | 113 (82.5%) | 24 (17.5%) |
| Retail Trade | 249 (43.5%) | 323 (56.5%) |
| Transportation & Warehousing | 107 (100.0%) | 0 (0.0%) |
| Utilities | 62 (100.0%) | 0 (0.0%) |
| Information | 0 (0.0%) | 11 (100.0%) |
| Finance & Insurance | 106 (36.4%) | 185 (63.6%) |
| Real Estate, Rental & Leasing | 34 (75.6%) | 11 (24.4%) |
| Professional & Scientific | 90 (38.1%) | 146 (61.9%) |
| Enterprise Management | 0 (0.0%) | 0 (0.0%) |
| Administrative & Support | 172 (100.0%) | 0 (0.0%) |
| Educational Services | 87 (18.9%) | 374 (81.1%) |
| Health Care & Social Assistance | 52 (8.6%) | 555 (91.4%) |
| Arts, Entertainment & Recreation | 31 (63.3%) | 18 (36.7%) |
| Accommodation & Food Services | 52 (52.0%) | 48 (48.0%) |
| Public Administration | 189 (93.6%) | 13 (6.4%) |
| Total | 3,402 (63.6%) | 1,947 (36.4%) |
Education in Moss Bluff
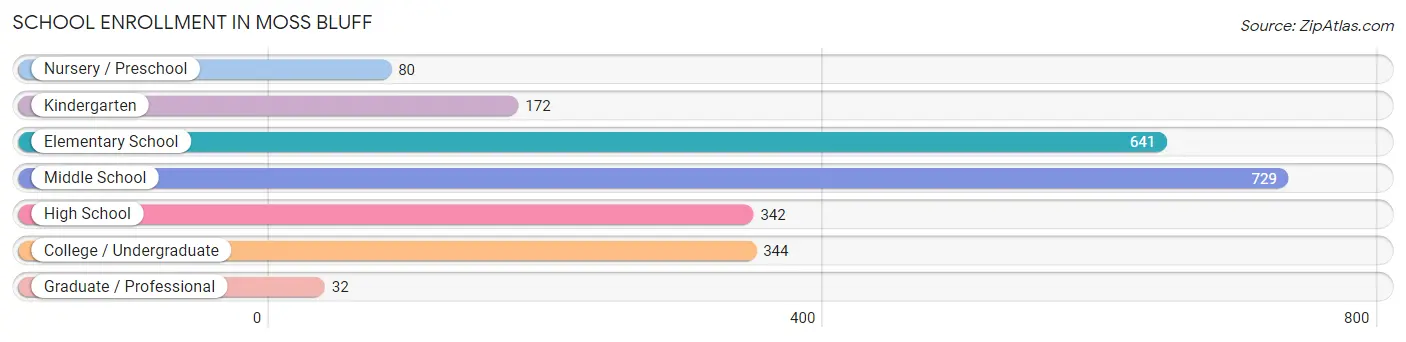
School Enrollment in Moss Bluff
The most common levels of schooling among the 2,340 students in Moss Bluff are middle school (729 | 31.1%), elementary school (641 | 27.4%), and college / undergraduate (344 | 14.7%).
| School Level | # Students | % Students |
| Nursery / Preschool | 80 | 3.4% |
| Kindergarten | 172 | 7.3% |
| Elementary School | 641 | 27.4% |
| Middle School | 729 | 31.1% |
| High School | 342 | 14.6% |
| College / Undergraduate | 344 | 14.7% |
| Graduate / Professional | 32 | 1.4% |
| Total | 2,340 | 100.0% |
School Enrollment by Age by Funding Source in Moss Bluff
Out of a total of 2,340 students who are enrolled in schools in Moss Bluff, 414 (17.7%) attend a private institution, while the remaining 1,926 (82.3%) are enrolled in public schools. The age group of 3 to 4 year olds has the highest likelihood of being enrolled in private schools, with 56 (100.0% in the age bracket) enrolled. Conversely, the age group of 25 to 34 year olds has the lowest likelihood of being enrolled in a private school, with 23 (100.0% in the age bracket) attending a public institution.
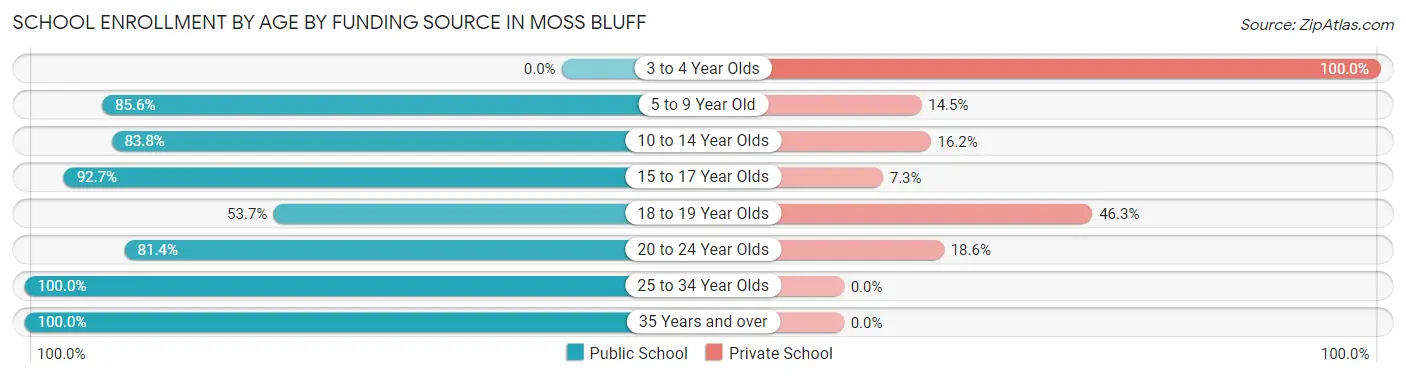
| Age Bracket | Public School | Private School |
| 3 to 4 Year Olds | 0 (0.0%) | 56 (100.0%) |
| 5 to 9 Year Old | 515 (85.6%) | 87 (14.4%) |
| 10 to 14 Year Olds | 808 (83.8%) | 156 (16.2%) |
| 15 to 17 Year Olds | 267 (92.7%) | 21 (7.3%) |
| 18 to 19 Year Olds | 58 (53.7%) | 50 (46.3%) |
| 20 to 24 Year Olds | 192 (81.4%) | 44 (18.6%) |
| 25 to 34 Year Olds | 23 (100.0%) | 0 (0.0%) |
| 35 Years and over | 63 (100.0%) | 0 (0.0%) |
| Total | 1,926 (82.3%) | 414 (17.7%) |
Educational Attainment by Field of Study in Moss Bluff
Engineering (611 | 29.4%), education (195 | 9.4%), business (193 | 9.3%), arts & humanities (187 | 9.0%), and computers & mathematics (168 | 8.1%) are the most common fields of study among 2,075 individuals in Moss Bluff who have obtained a bachelor's degree or higher.
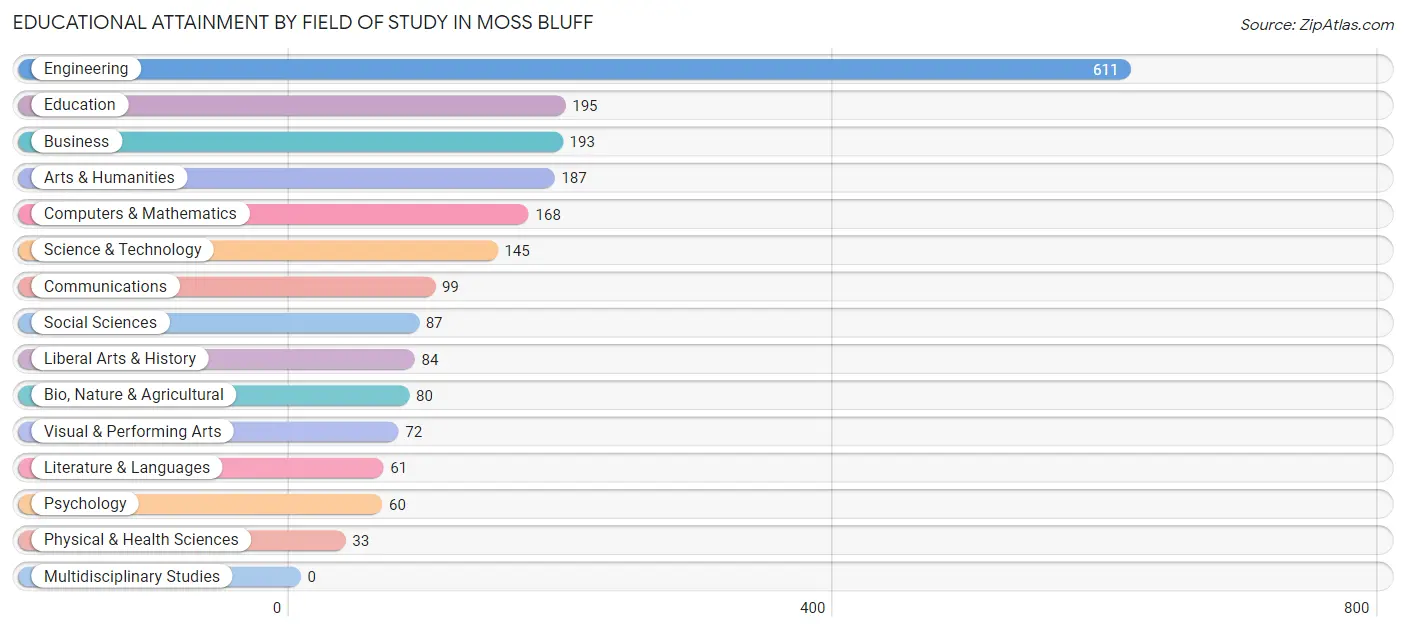
| Field of Study | # Graduates | % Graduates |
| Computers & Mathematics | 168 | 8.1% |
| Bio, Nature & Agricultural | 80 | 3.9% |
| Physical & Health Sciences | 33 | 1.6% |
| Psychology | 60 | 2.9% |
| Social Sciences | 87 | 4.2% |
| Engineering | 611 | 29.4% |
| Multidisciplinary Studies | 0 | 0.0% |
| Science & Technology | 145 | 7.0% |
| Business | 193 | 9.3% |
| Education | 195 | 9.4% |
| Literature & Languages | 61 | 2.9% |
| Liberal Arts & History | 84 | 4.1% |
| Visual & Performing Arts | 72 | 3.5% |
| Communications | 99 | 4.8% |
| Arts & Humanities | 187 | 9.0% |
| Total | 2,075 | 100.0% |
Transportation & Commute in Moss Bluff
Vehicle Availability by Sex in Moss Bluff
The most prevalent vehicle ownership categories in Moss Bluff are males with 2 vehicles (1,444, accounting for 42.7%) and females with 2 vehicles (989, making up 74.8%).
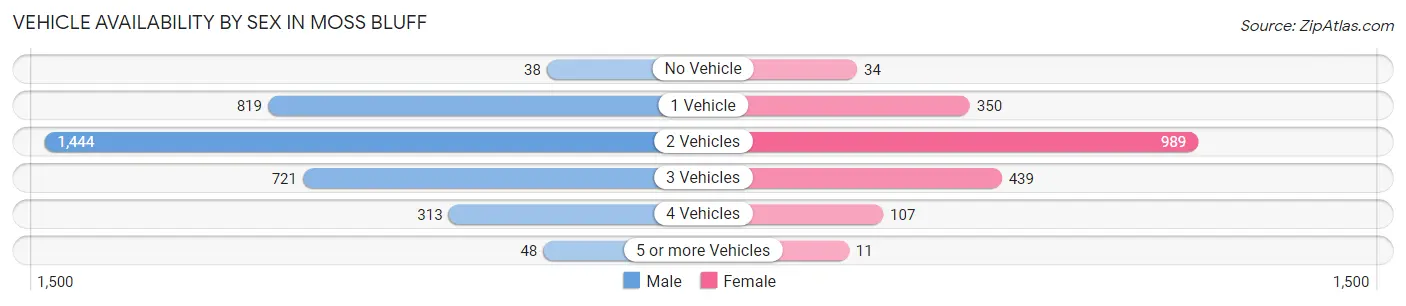
| Vehicles Available | Male | Female |
| No Vehicle | 38 (1.1%) | 34 (1.8%) |
| 1 Vehicle | 819 (24.2%) | 350 (18.1%) |
| 2 Vehicles | 1,444 (42.7%) | 989 (51.2%) |
| 3 Vehicles | 721 (21.3%) | 439 (22.8%) |
| 4 Vehicles | 313 (9.2%) | 107 (5.5%) |
| 5 or more Vehicles | 48 (1.4%) | 11 (0.6%) |
| Total | 3,383 (100.0%) | 1,930 (100.0%) |
Commute Time in Moss Bluff
The most frequently occuring commute durations in Moss Bluff are 20 to 24 minutes (1,237 commuters, 24.5%), 25 to 29 minutes (990 commuters, 19.6%), and 15 to 19 minutes (721 commuters, 14.3%).
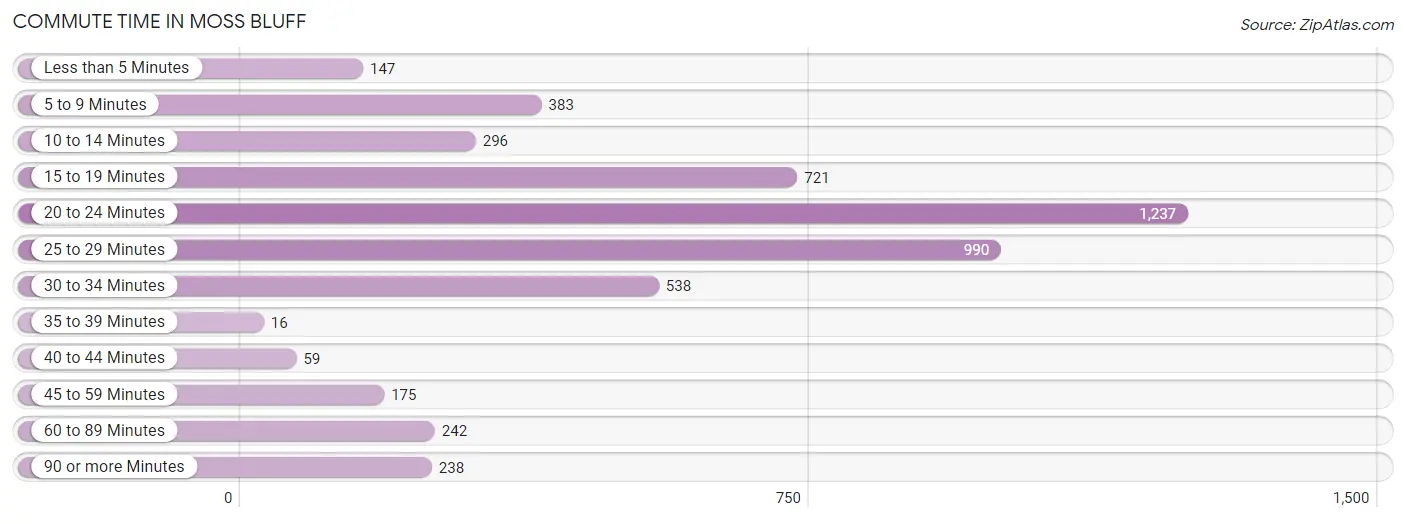
| Commute Time | # Commuters | % Commuters |
| Less than 5 Minutes | 147 | 2.9% |
| 5 to 9 Minutes | 383 | 7.6% |
| 10 to 14 Minutes | 296 | 5.9% |
| 15 to 19 Minutes | 721 | 14.3% |
| 20 to 24 Minutes | 1,237 | 24.5% |
| 25 to 29 Minutes | 990 | 19.6% |
| 30 to 34 Minutes | 538 | 10.7% |
| 35 to 39 Minutes | 16 | 0.3% |
| 40 to 44 Minutes | 59 | 1.2% |
| 45 to 59 Minutes | 175 | 3.5% |
| 60 to 89 Minutes | 242 | 4.8% |
| 90 or more Minutes | 238 | 4.7% |
Commute Time by Sex in Moss Bluff
The most common commute times in Moss Bluff are 20 to 24 minutes (905 commuters, 27.3%) for males and 20 to 24 minutes (332 commuters, 19.3%) for females.
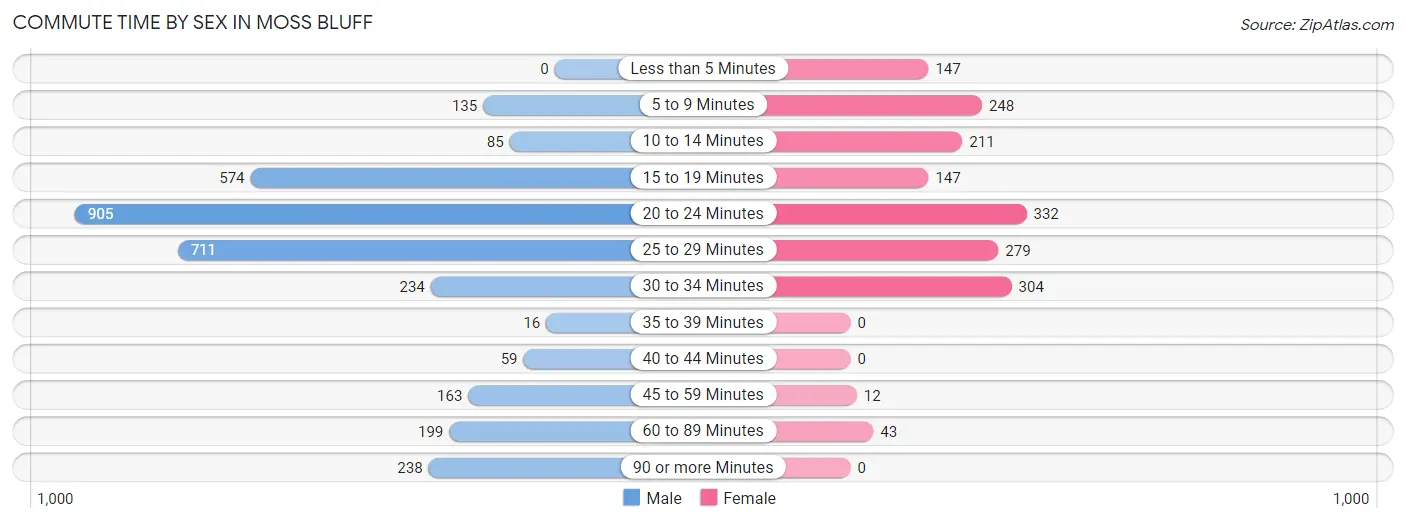
| Commute Time | Male | Female |
| Less than 5 Minutes | 0 (0.0%) | 147 (8.5%) |
| 5 to 9 Minutes | 135 (4.1%) | 248 (14.4%) |
| 10 to 14 Minutes | 85 (2.6%) | 211 (12.2%) |
| 15 to 19 Minutes | 574 (17.3%) | 147 (8.5%) |
| 20 to 24 Minutes | 905 (27.3%) | 332 (19.3%) |
| 25 to 29 Minutes | 711 (21.4%) | 279 (16.2%) |
| 30 to 34 Minutes | 234 (7.0%) | 304 (17.6%) |
| 35 to 39 Minutes | 16 (0.5%) | 0 (0.0%) |
| 40 to 44 Minutes | 59 (1.8%) | 0 (0.0%) |
| 45 to 59 Minutes | 163 (4.9%) | 12 (0.7%) |
| 60 to 89 Minutes | 199 (6.0%) | 43 (2.5%) |
| 90 or more Minutes | 238 (7.2%) | 0 (0.0%) |
Time of Departure to Work by Sex in Moss Bluff
The most frequent times of departure to work in Moss Bluff are 6:30 AM to 6:59 AM (721, 21.7%) for males and 7:00 AM to 7:29 AM (301, 17.5%) for females.
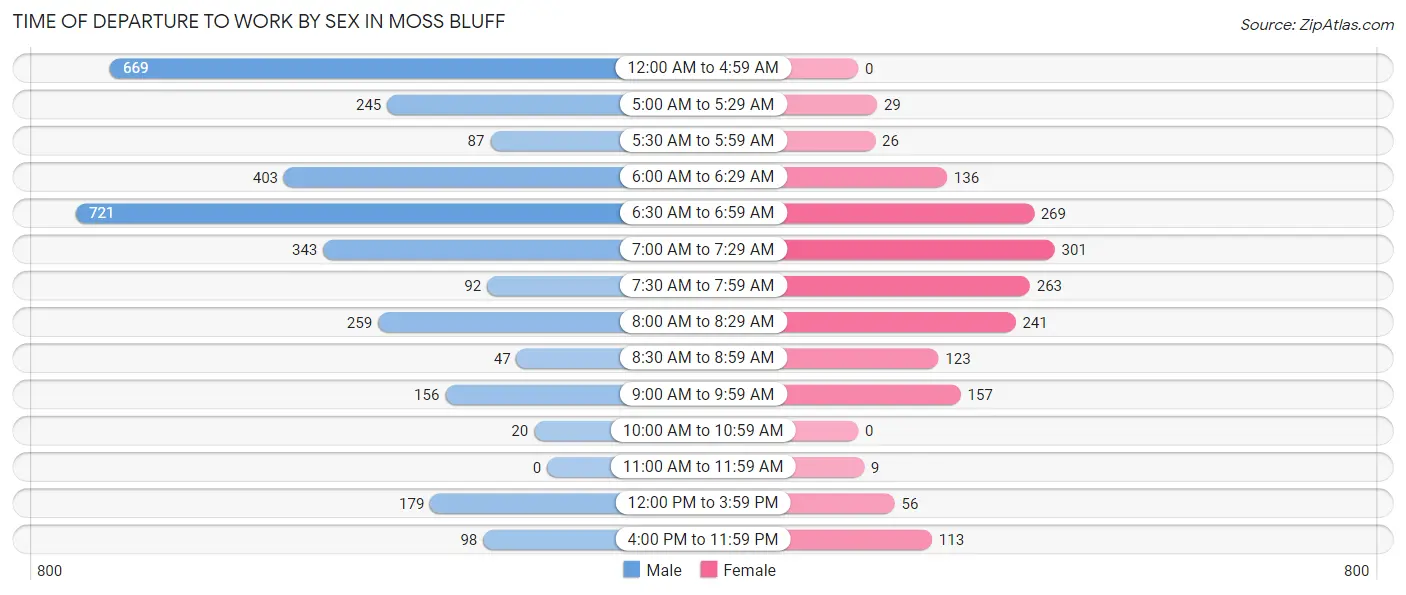
| Time of Departure | Male | Female |
| 12:00 AM to 4:59 AM | 669 (20.2%) | 0 (0.0%) |
| 5:00 AM to 5:29 AM | 245 (7.4%) | 29 (1.7%) |
| 5:30 AM to 5:59 AM | 87 (2.6%) | 26 (1.5%) |
| 6:00 AM to 6:29 AM | 403 (12.1%) | 136 (7.9%) |
| 6:30 AM to 6:59 AM | 721 (21.7%) | 269 (15.6%) |
| 7:00 AM to 7:29 AM | 343 (10.3%) | 301 (17.5%) |
| 7:30 AM to 7:59 AM | 92 (2.8%) | 263 (15.3%) |
| 8:00 AM to 8:29 AM | 259 (7.8%) | 241 (14.0%) |
| 8:30 AM to 8:59 AM | 47 (1.4%) | 123 (7.1%) |
| 9:00 AM to 9:59 AM | 156 (4.7%) | 157 (9.1%) |
| 10:00 AM to 10:59 AM | 20 (0.6%) | 0 (0.0%) |
| 11:00 AM to 11:59 AM | 0 (0.0%) | 9 (0.5%) |
| 12:00 PM to 3:59 PM | 179 (5.4%) | 56 (3.3%) |
| 4:00 PM to 11:59 PM | 98 (2.9%) | 113 (6.6%) |
| Total | 3,319 (100.0%) | 1,723 (100.0%) |
Housing Occupancy in Moss Bluff
Occupancy by Ownership in Moss Bluff
Of the total 4,838 dwellings in Moss Bluff, owner-occupied units account for 3,719 (76.9%), while renter-occupied units make up 1,119 (23.1%).
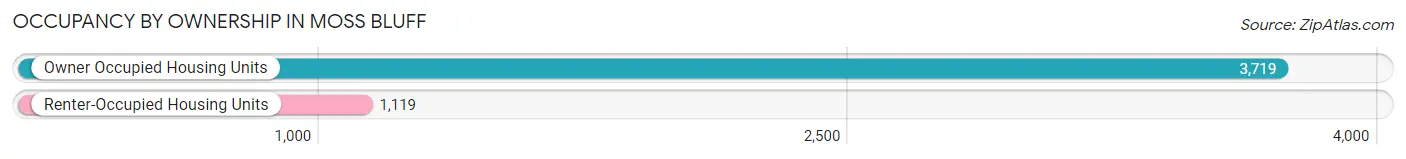
| Occupancy | # Housing Units | % Housing Units |
| Owner Occupied Housing Units | 3,719 | 76.9% |
| Renter-Occupied Housing Units | 1,119 | 23.1% |
| Total Occupied Housing Units | 4,838 | 100.0% |
Occupancy by Household Size in Moss Bluff
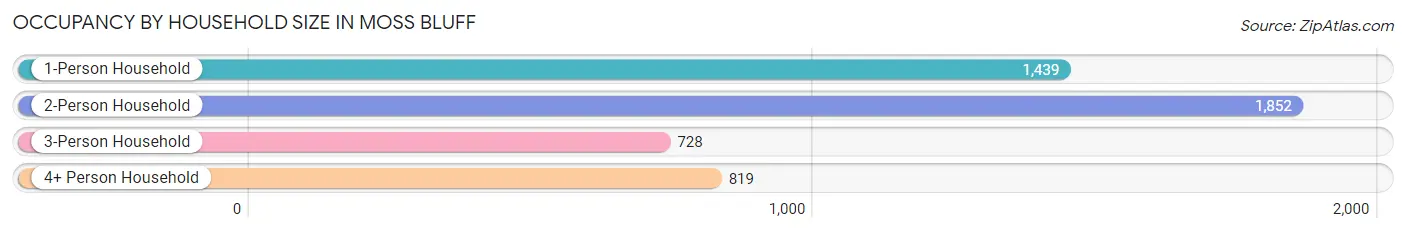
| Household Size | # Housing Units | % Housing Units |
| 1-Person Household | 1,439 | 29.7% |
| 2-Person Household | 1,852 | 38.3% |
| 3-Person Household | 728 | 15.0% |
| 4+ Person Household | 819 | 16.9% |
| Total Housing Units | 4,838 | 100.0% |
Occupancy by Ownership by Household Size in Moss Bluff
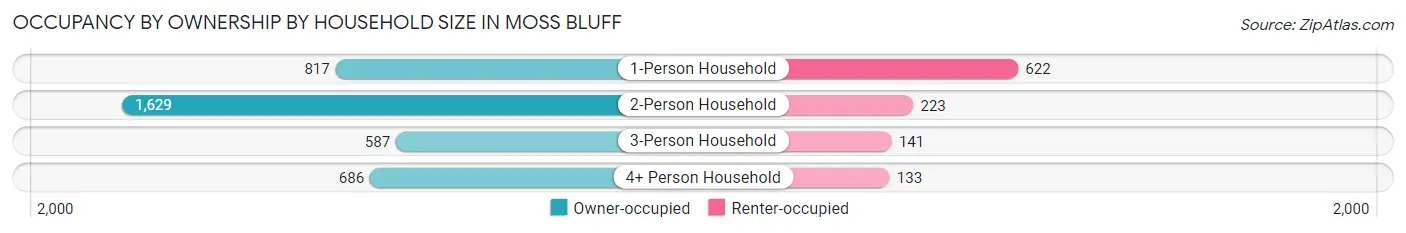
| Household Size | Owner-occupied | Renter-occupied |
| 1-Person Household | 817 (56.8%) | 622 (43.2%) |
| 2-Person Household | 1,629 (88.0%) | 223 (12.0%) |
| 3-Person Household | 587 (80.6%) | 141 (19.4%) |
| 4+ Person Household | 686 (83.8%) | 133 (16.2%) |
| Total Housing Units | 3,719 (76.9%) | 1,119 (23.1%) |
Occupancy by Educational Attainment in Moss Bluff
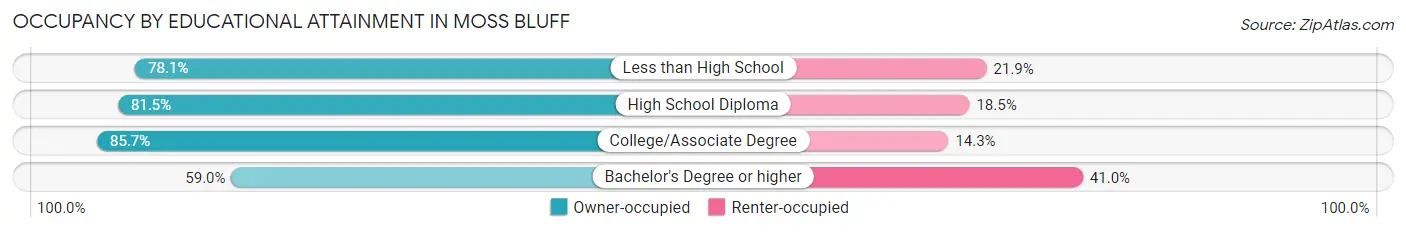
| Household Size | Owner-occupied | Renter-occupied |
| Less than High School | 353 (78.1%) | 99 (21.9%) |
| High School Diploma | 1,119 (81.5%) | 254 (18.5%) |
| College/Associate Degree | 1,507 (85.7%) | 252 (14.3%) |
| Bachelor's Degree or higher | 740 (59.0%) | 514 (41.0%) |
Occupancy by Age of Householder in Moss Bluff
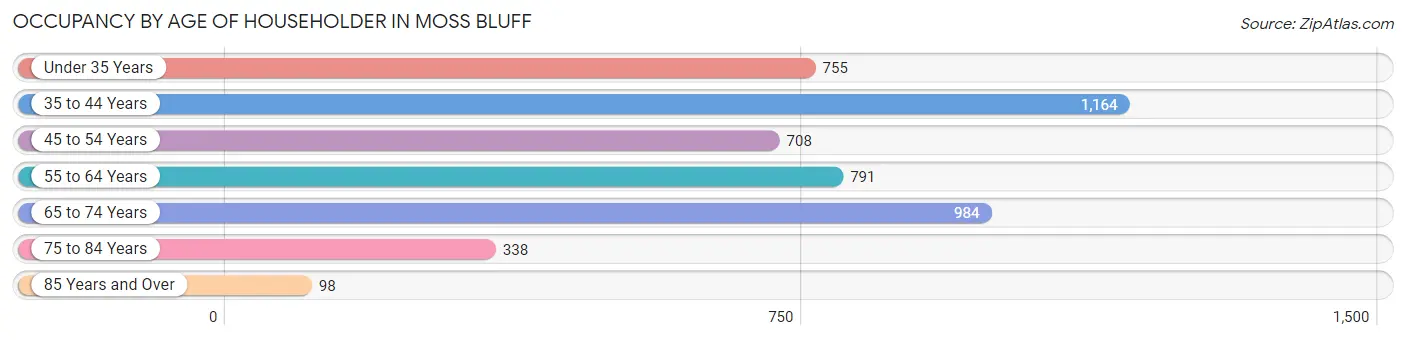
| Age Bracket | # Households | % Households |
| Under 35 Years | 755 | 15.6% |
| 35 to 44 Years | 1,164 | 24.1% |
| 45 to 54 Years | 708 | 14.6% |
| 55 to 64 Years | 791 | 16.4% |
| 65 to 74 Years | 984 | 20.3% |
| 75 to 84 Years | 338 | 7.0% |
| 85 Years and Over | 98 | 2.0% |
| Total | 4,838 | 100.0% |
Housing Finances in Moss Bluff
Median Income by Occupancy in Moss Bluff
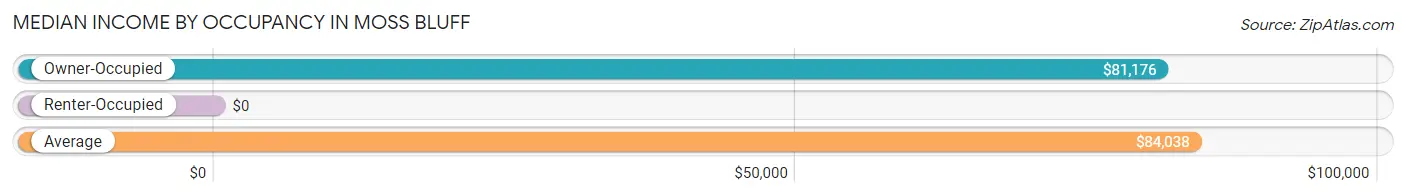
| Occupancy Type | # Households | Median Income |
| Owner-Occupied | 3,719 (76.9%) | $81,176 |
| Renter-Occupied | 1,119 (23.1%) | $0 |
| Average | 4,838 (100.0%) | $84,038 |
Occupancy by Householder Income Bracket in Moss Bluff
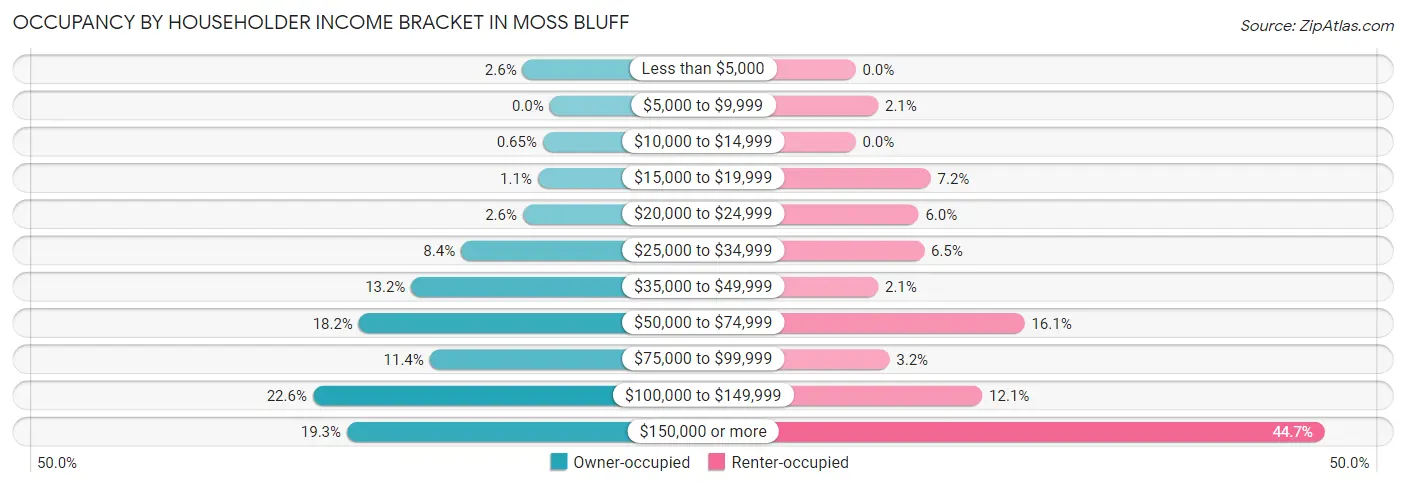
| Income Bracket | Owner-occupied | Renter-occupied |
| Less than $5,000 | 96 (2.6%) | 0 (0.0%) |
| $5,000 to $9,999 | 0 (0.0%) | 24 (2.1%) |
| $10,000 to $14,999 | 24 (0.6%) | 0 (0.0%) |
| $15,000 to $19,999 | 42 (1.1%) | 80 (7.1%) |
| $20,000 to $24,999 | 95 (2.5%) | 67 (6.0%) |
| $25,000 to $34,999 | 314 (8.4%) | 73 (6.5%) |
| $35,000 to $49,999 | 490 (13.2%) | 24 (2.1%) |
| $50,000 to $74,999 | 676 (18.2%) | 180 (16.1%) |
| $75,000 to $99,999 | 425 (11.4%) | 36 (3.2%) |
| $100,000 to $149,999 | 839 (22.6%) | 135 (12.1%) |
| $150,000 or more | 718 (19.3%) | 500 (44.7%) |
| Total | 3,719 (100.0%) | 1,119 (100.0%) |
Monthly Housing Cost Tiers in Moss Bluff
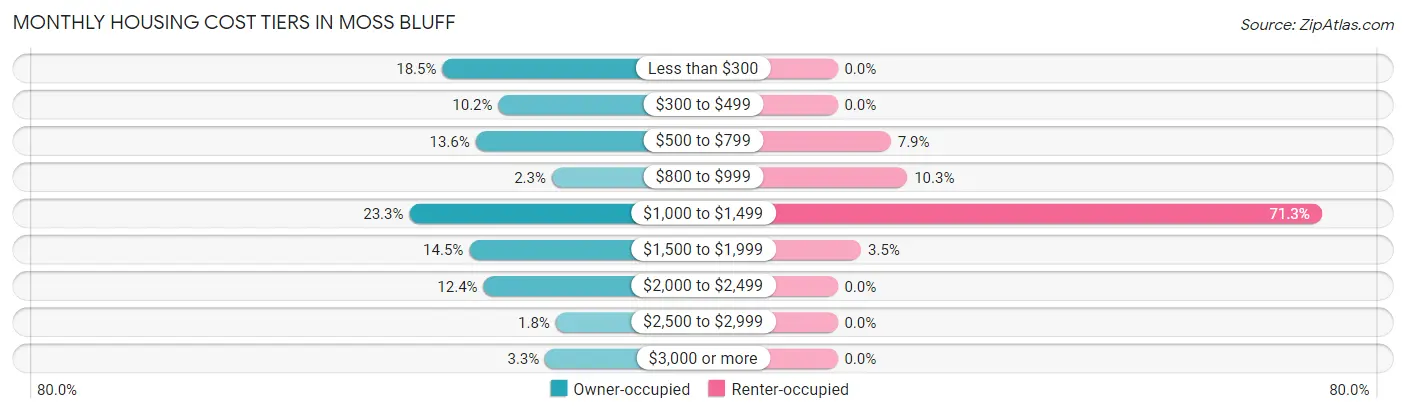
| Monthly Cost | Owner-occupied | Renter-occupied |
| Less than $300 | 687 (18.5%) | 0 (0.0%) |
| $300 to $499 | 380 (10.2%) | 0 (0.0%) |
| $500 to $799 | 505 (13.6%) | 88 (7.9%) |
| $800 to $999 | 87 (2.3%) | 115 (10.3%) |
| $1,000 to $1,499 | 868 (23.3%) | 798 (71.3%) |
| $1,500 to $1,999 | 540 (14.5%) | 39 (3.5%) |
| $2,000 to $2,499 | 462 (12.4%) | 0 (0.0%) |
| $2,500 to $2,999 | 66 (1.8%) | 0 (0.0%) |
| $3,000 or more | 124 (3.3%) | 0 (0.0%) |
| Total | 3,719 (100.0%) | 1,119 (100.0%) |
Physical Housing Characteristics in Moss Bluff
Housing Structures in Moss Bluff
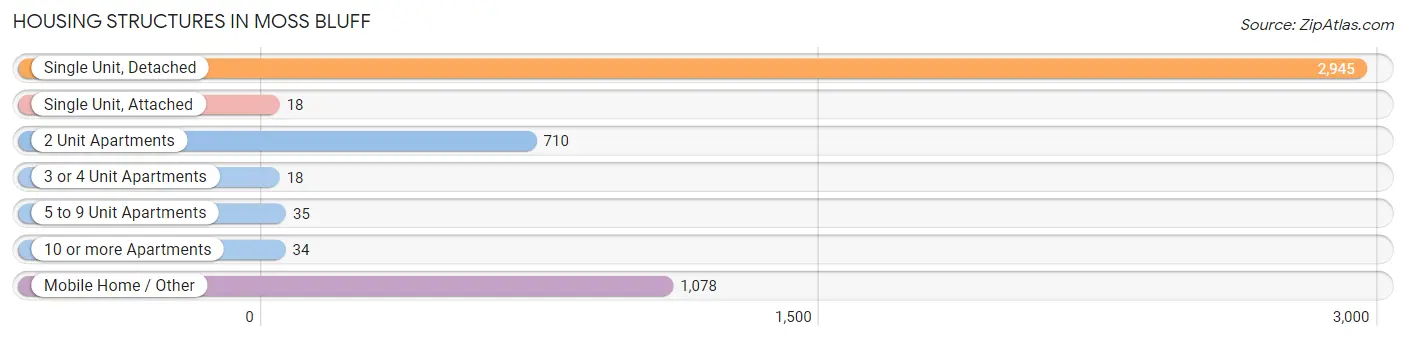
| Structure Type | # Housing Units | % Housing Units |
| Single Unit, Detached | 2,945 | 60.9% |
| Single Unit, Attached | 18 | 0.4% |
| 2 Unit Apartments | 710 | 14.7% |
| 3 or 4 Unit Apartments | 18 | 0.4% |
| 5 to 9 Unit Apartments | 35 | 0.7% |
| 10 or more Apartments | 34 | 0.7% |
| Mobile Home / Other | 1,078 | 22.3% |
| Total | 4,838 | 100.0% |
Housing Structures by Occupancy in Moss Bluff
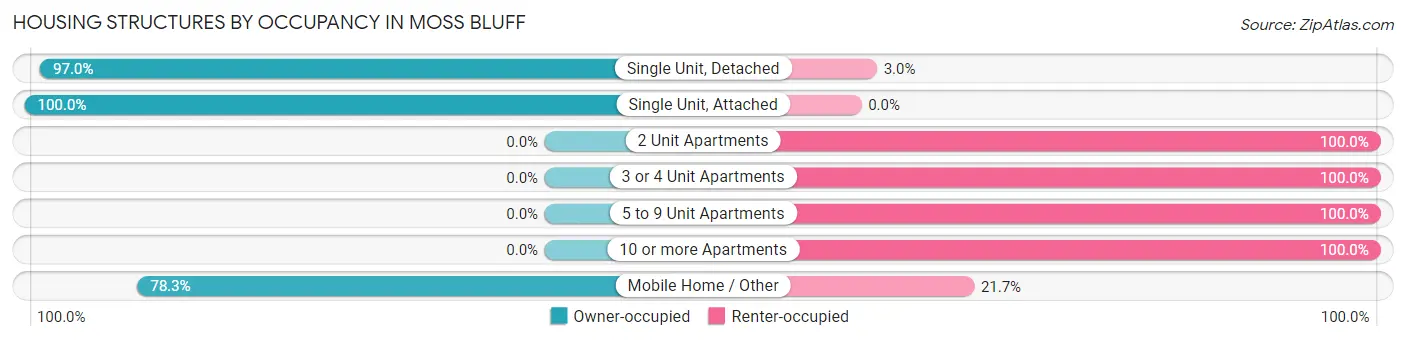
| Structure Type | Owner-occupied | Renter-occupied |
| Single Unit, Detached | 2,857 (97.0%) | 88 (3.0%) |
| Single Unit, Attached | 18 (100.0%) | 0 (0.0%) |
| 2 Unit Apartments | 0 (0.0%) | 710 (100.0%) |
| 3 or 4 Unit Apartments | 0 (0.0%) | 18 (100.0%) |
| 5 to 9 Unit Apartments | 0 (0.0%) | 35 (100.0%) |
| 10 or more Apartments | 0 (0.0%) | 34 (100.0%) |
| Mobile Home / Other | 844 (78.3%) | 234 (21.7%) |
| Total | 3,719 (76.9%) | 1,119 (23.1%) |
Housing Structures by Number of Rooms in Moss Bluff
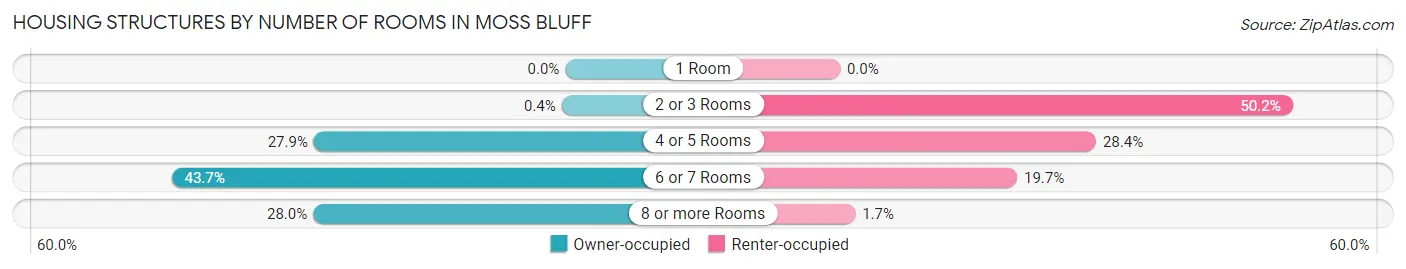
| Number of Rooms | Owner-occupied | Renter-occupied |
| 1 Room | 0 (0.0%) | 0 (0.0%) |
| 2 or 3 Rooms | 15 (0.4%) | 562 (50.2%) |
| 4 or 5 Rooms | 1,038 (27.9%) | 318 (28.4%) |
| 6 or 7 Rooms | 1,625 (43.7%) | 220 (19.7%) |
| 8 or more Rooms | 1,041 (28.0%) | 19 (1.7%) |
| Total | 3,719 (100.0%) | 1,119 (100.0%) |
Housing Structure by Heating Type in Moss Bluff
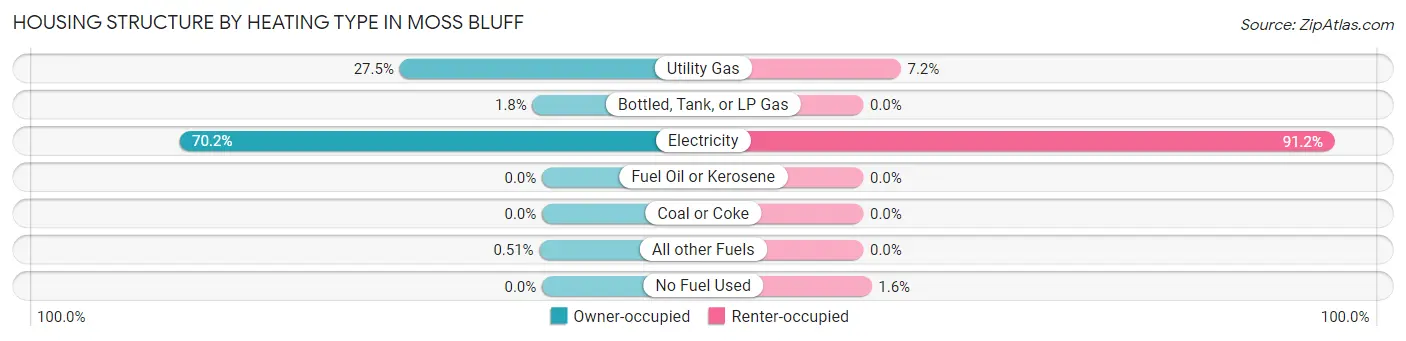
| Heating Type | Owner-occupied | Renter-occupied |
| Utility Gas | 1,023 (27.5%) | 81 (7.2%) |
| Bottled, Tank, or LP Gas | 68 (1.8%) | 0 (0.0%) |
| Electricity | 2,609 (70.2%) | 1,020 (91.1%) |
| Fuel Oil or Kerosene | 0 (0.0%) | 0 (0.0%) |
| Coal or Coke | 0 (0.0%) | 0 (0.0%) |
| All other Fuels | 19 (0.5%) | 0 (0.0%) |
| No Fuel Used | 0 (0.0%) | 18 (1.6%) |
| Total | 3,719 (100.0%) | 1,119 (100.0%) |
Household Vehicle Usage in Moss Bluff
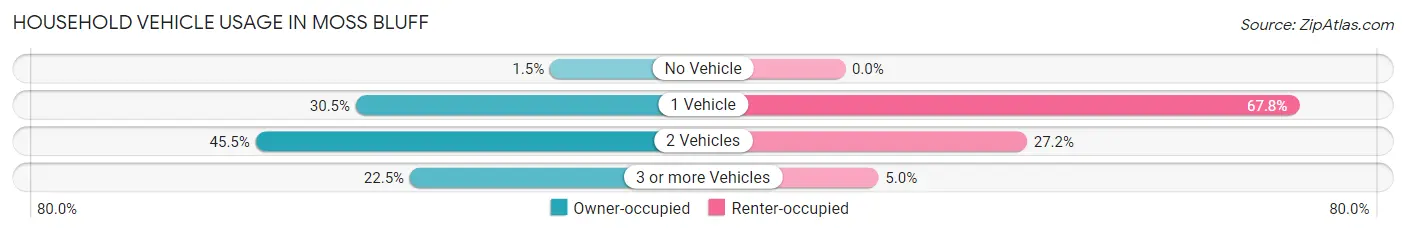
| Vehicles per Household | Owner-occupied | Renter-occupied |
| No Vehicle | 57 (1.5%) | 0 (0.0%) |
| 1 Vehicle | 1,135 (30.5%) | 759 (67.8%) |
| 2 Vehicles | 1,692 (45.5%) | 304 (27.2%) |
| 3 or more Vehicles | 835 (22.5%) | 56 (5.0%) |
| Total | 3,719 (100.0%) | 1,119 (100.0%) |
Real Estate & Mortgages in Moss Bluff
Real Estate and Mortgage Overview in Moss Bluff
| Characteristic | Without Mortgage | With Mortgage |
| Housing Units | 1,598 | 2,121 |
| Median Property Value | $203,400 | $245,100 |
| Median Household Income | $50,949 | $534 |
| Monthly Housing Costs | $409 | $124 |
| Real Estate Taxes | $1,276 | $433 |
Property Value by Mortgage Status in Moss Bluff
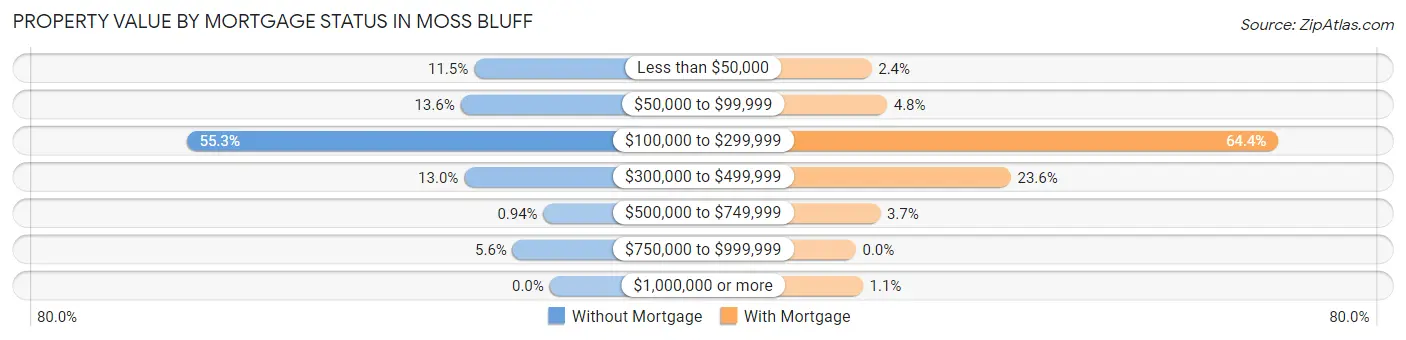
| Property Value | Without Mortgage | With Mortgage |
| Less than $50,000 | 184 (11.5%) | 51 (2.4%) |
| $50,000 to $99,999 | 217 (13.6%) | 101 (4.8%) |
| $100,000 to $299,999 | 884 (55.3%) | 1,366 (64.4%) |
| $300,000 to $499,999 | 208 (13.0%) | 501 (23.6%) |
| $500,000 to $749,999 | 15 (0.9%) | 79 (3.7%) |
| $750,000 to $999,999 | 90 (5.6%) | 0 (0.0%) |
| $1,000,000 or more | 0 (0.0%) | 23 (1.1%) |
| Total | 1,598 (100.0%) | 2,121 (100.0%) |
Household Income by Mortgage Status in Moss Bluff
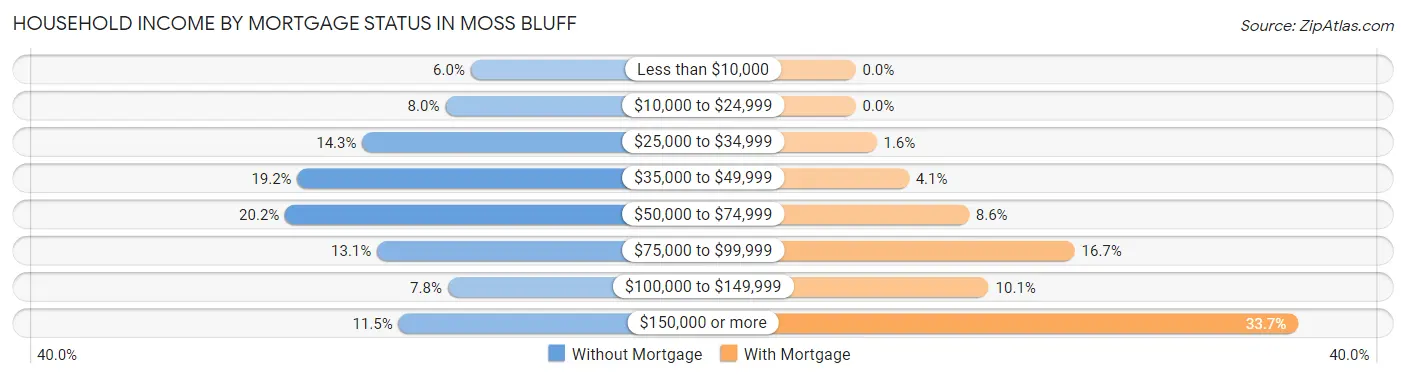
| Household Income | Without Mortgage | With Mortgage |
| Less than $10,000 | 96 (6.0%) | 0 (0.0%) |
| $10,000 to $24,999 | 127 (8.0%) | 0 (0.0%) |
| $25,000 to $34,999 | 228 (14.3%) | 34 (1.6%) |
| $35,000 to $49,999 | 307 (19.2%) | 86 (4.1%) |
| $50,000 to $74,999 | 322 (20.2%) | 183 (8.6%) |
| $75,000 to $99,999 | 210 (13.1%) | 354 (16.7%) |
| $100,000 to $149,999 | 124 (7.8%) | 215 (10.1%) |
| $150,000 or more | 184 (11.5%) | 715 (33.7%) |
| Total | 1,598 (100.0%) | 2,121 (100.0%) |
Property Value to Household Income Ratio in Moss Bluff
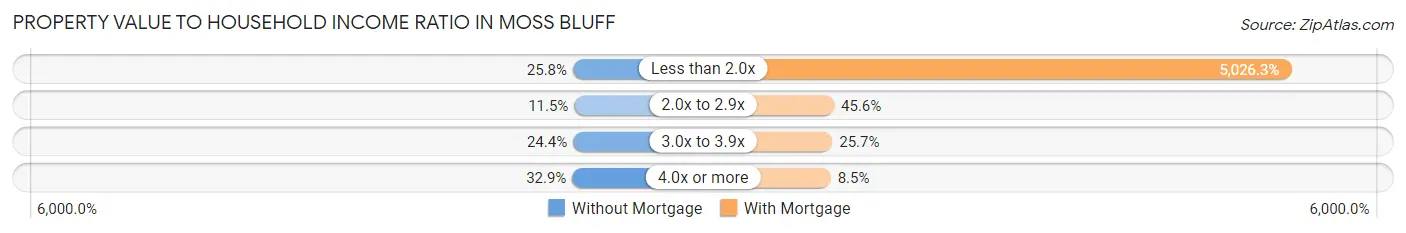
| Value-to-Income Ratio | Without Mortgage | With Mortgage |
| Less than 2.0x | 412 (25.8%) | 106,607 (5,026.3%) |
| 2.0x to 2.9x | 183 (11.5%) | 967 (45.6%) |
| 3.0x to 3.9x | 390 (24.4%) | 545 (25.7%) |
| 4.0x or more | 526 (32.9%) | 180 (8.5%) |
| Total | 1,598 (100.0%) | 2,121 (100.0%) |
Real Estate Taxes by Mortgage Status in Moss Bluff
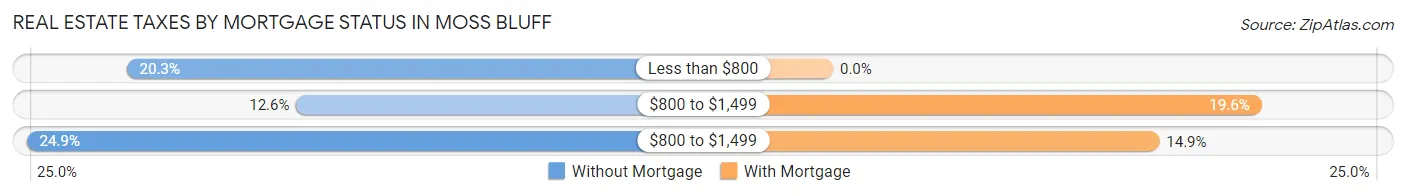
| Property Taxes | Without Mortgage | With Mortgage |
| Less than $800 | 325 (20.3%) | 0 (0.0%) |
| $800 to $1,499 | 202 (12.6%) | 415 (19.6%) |
| $800 to $1,499 | 398 (24.9%) | 316 (14.9%) |
| Total | 1,598 (100.0%) | 2,121 (100.0%) |
Health & Disability in Moss Bluff
Health Insurance Coverage by Age in Moss Bluff
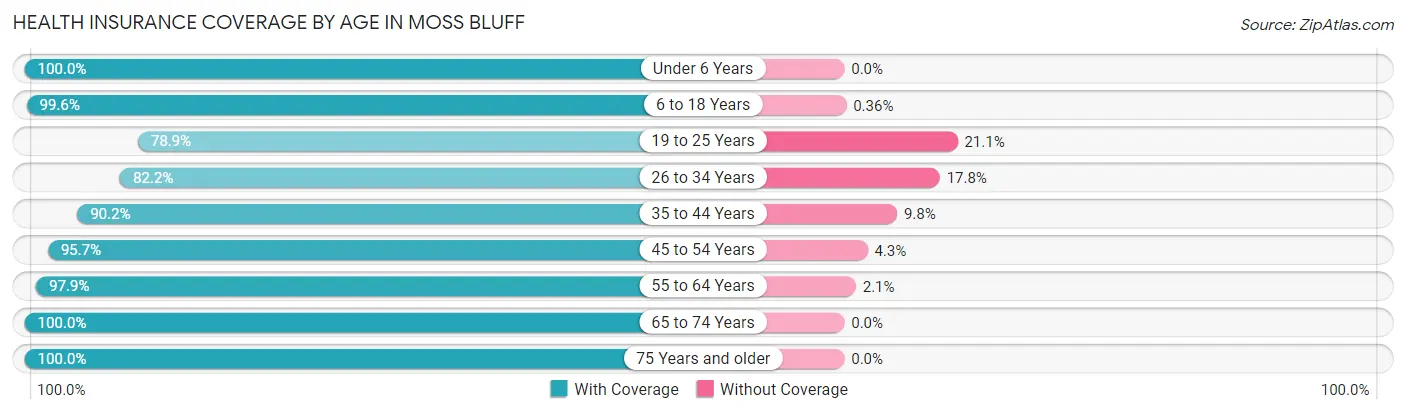
| Age Bracket | With Coverage | Without Coverage |
| Under 6 Years | 533 (100.0%) | 0 (0.0%) |
| 6 to 18 Years | 1,951 (99.6%) | 7 (0.4%) |
| 19 to 25 Years | 527 (78.9%) | 141 (21.1%) |
| 26 to 34 Years | 1,243 (82.2%) | 269 (17.8%) |
| 35 to 44 Years | 1,598 (90.2%) | 174 (9.8%) |
| 45 to 54 Years | 1,306 (95.7%) | 59 (4.3%) |
| 55 to 64 Years | 1,511 (97.9%) | 33 (2.1%) |
| 65 to 74 Years | 1,581 (100.0%) | 0 (0.0%) |
| 75 Years and older | 649 (100.0%) | 0 (0.0%) |
| Total | 10,899 (94.1%) | 683 (5.9%) |
Health Insurance Coverage by Citizenship Status in Moss Bluff
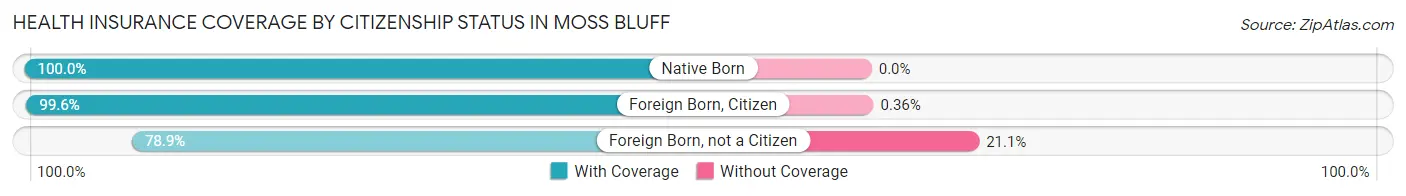
| Citizenship Status | With Coverage | Without Coverage |
| Native Born | 533 (100.0%) | 0 (0.0%) |
| Foreign Born, Citizen | 1,951 (99.6%) | 7 (0.4%) |
| Foreign Born, not a Citizen | 527 (78.9%) | 141 (21.1%) |
Health Insurance Coverage by Household Income in Moss Bluff
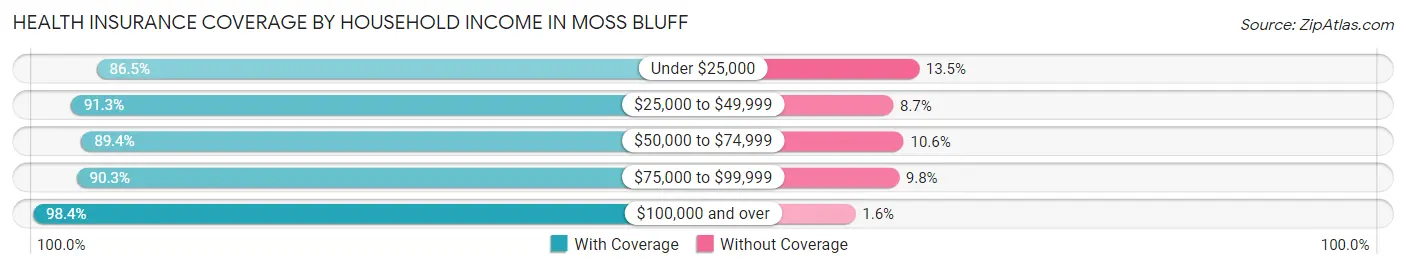
| Household Income | With Coverage | Without Coverage |
| Under $25,000 | 680 (86.5%) | 106 (13.5%) |
| $25,000 to $49,999 | 1,466 (91.3%) | 139 (8.7%) |
| $50,000 to $74,999 | 1,993 (89.4%) | 237 (10.6%) |
| $75,000 to $99,999 | 990 (90.2%) | 107 (9.8%) |
| $100,000 and over | 5,770 (98.4%) | 94 (1.6%) |
Public vs Private Health Insurance Coverage by Age in Moss Bluff
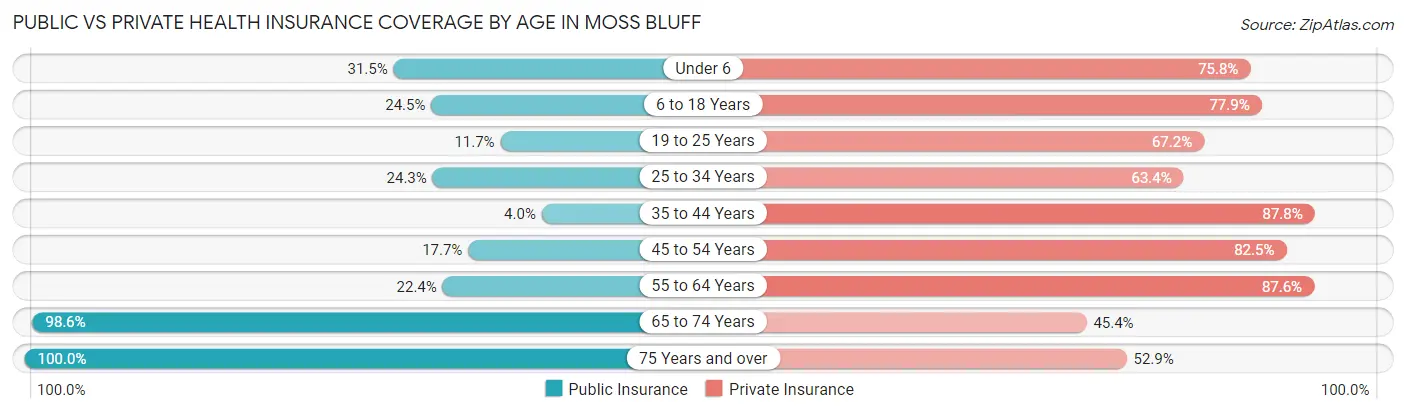
| Age Bracket | Public Insurance | Private Insurance |
| Under 6 | 168 (31.5%) | 404 (75.8%) |
| 6 to 18 Years | 480 (24.5%) | 1,525 (77.9%) |
| 19 to 25 Years | 78 (11.7%) | 449 (67.2%) |
| 25 to 34 Years | 367 (24.3%) | 959 (63.4%) |
| 35 to 44 Years | 71 (4.0%) | 1,555 (87.7%) |
| 45 to 54 Years | 241 (17.7%) | 1,126 (82.5%) |
| 55 to 64 Years | 346 (22.4%) | 1,353 (87.6%) |
| 65 to 74 Years | 1,558 (98.6%) | 718 (45.4%) |
| 75 Years and over | 649 (100.0%) | 343 (52.8%) |
| Total | 3,958 (34.2%) | 8,432 (72.8%) |
Disability Status by Sex by Age in Moss Bluff
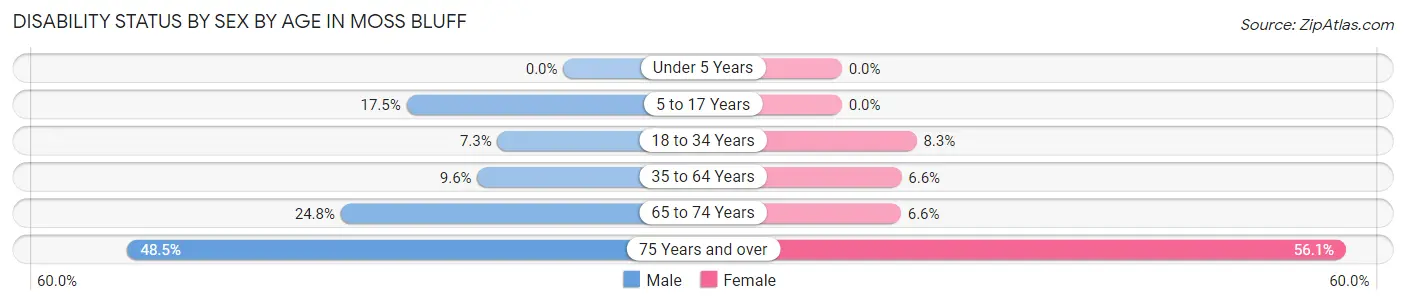
| Age Bracket | Male | Female |
| Under 5 Years | 0 (0.0%) | 0 (0.0%) |
| 5 to 17 Years | 202 (17.5%) | 0 (0.0%) |
| 18 to 34 Years | 97 (7.3%) | 77 (8.3%) |
| 35 to 64 Years | 243 (9.6%) | 142 (6.6%) |
| 65 to 74 Years | 241 (24.8%) | 40 (6.6%) |
| 75 Years and over | 149 (48.5%) | 192 (56.1%) |
Disability Class by Sex by Age in Moss Bluff
Disability Class: Hearing Difficulty
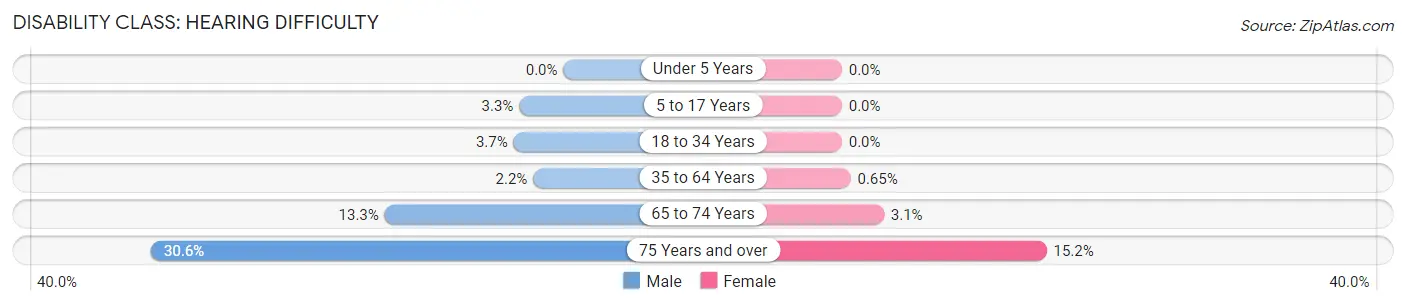
| Age Bracket | Male | Female |
| Under 5 Years | 0 (0.0%) | 0 (0.0%) |
| 5 to 17 Years | 38 (3.3%) | 0 (0.0%) |
| 18 to 34 Years | 49 (3.7%) | 0 (0.0%) |
| 35 to 64 Years | 57 (2.2%) | 14 (0.6%) |
| 65 to 74 Years | 129 (13.3%) | 19 (3.1%) |
| 75 Years and over | 94 (30.6%) | 52 (15.2%) |
Disability Class: Vision Difficulty
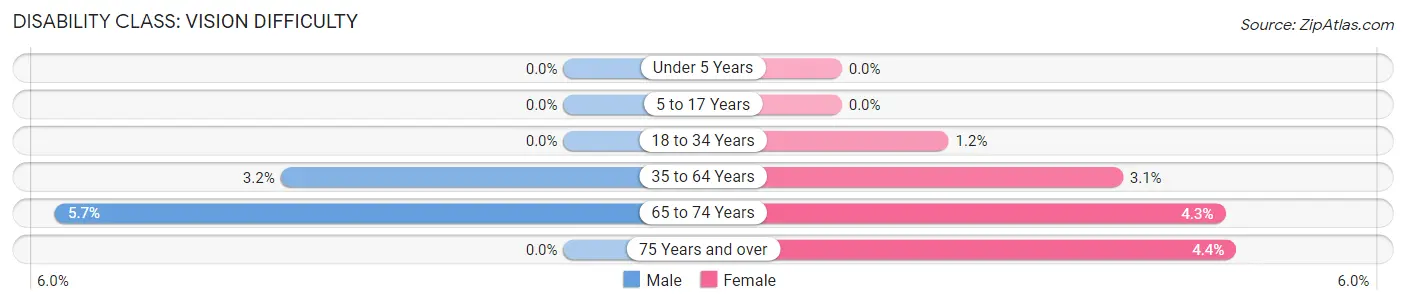
| Age Bracket | Male | Female |
| Under 5 Years | 0 (0.0%) | 0 (0.0%) |
| 5 to 17 Years | 0 (0.0%) | 0 (0.0%) |
| 18 to 34 Years | 0 (0.0%) | 11 (1.2%) |
| 35 to 64 Years | 80 (3.2%) | 67 (3.1%) |
| 65 to 74 Years | 55 (5.7%) | 26 (4.3%) |
| 75 Years and over | 0 (0.0%) | 15 (4.4%) |
Disability Class: Cognitive Difficulty
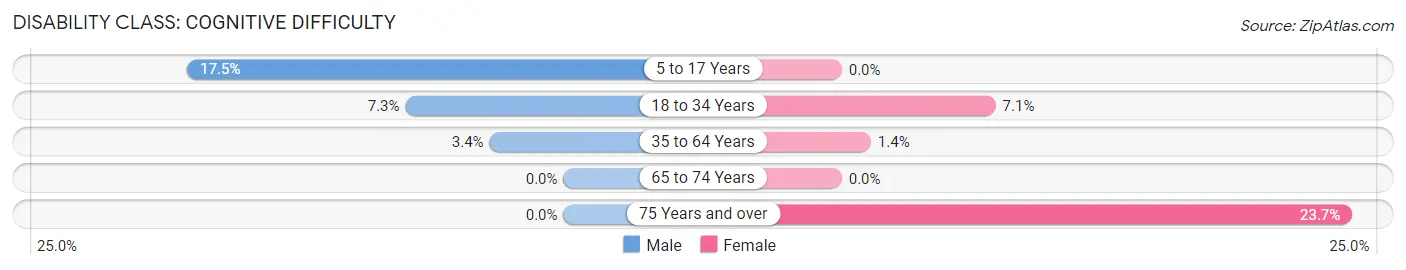
| Age Bracket | Male | Female |
| 5 to 17 Years | 202 (17.5%) | 0 (0.0%) |
| 18 to 34 Years | 97 (7.3%) | 66 (7.1%) |
| 35 to 64 Years | 87 (3.4%) | 29 (1.3%) |
| 65 to 74 Years | 0 (0.0%) | 0 (0.0%) |
| 75 Years and over | 0 (0.0%) | 81 (23.7%) |
Disability Class: Ambulatory Difficulty
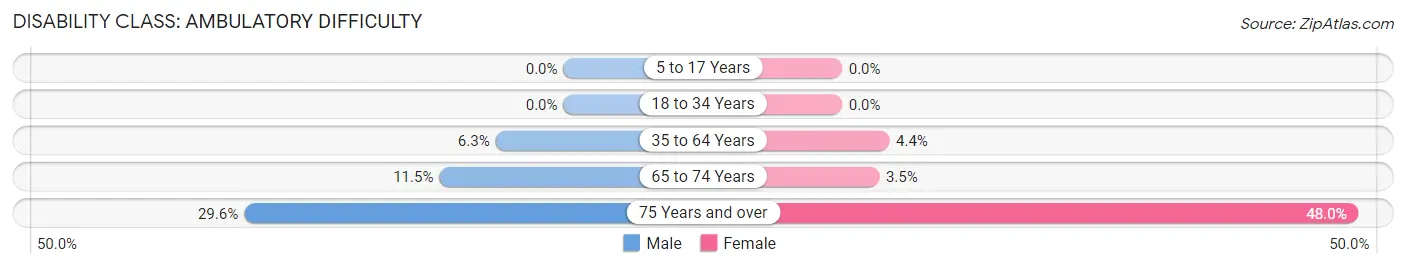
| Age Bracket | Male | Female |
| 5 to 17 Years | 0 (0.0%) | 0 (0.0%) |
| 18 to 34 Years | 0 (0.0%) | 0 (0.0%) |
| 35 to 64 Years | 160 (6.3%) | 94 (4.4%) |
| 65 to 74 Years | 112 (11.5%) | 21 (3.5%) |
| 75 Years and over | 91 (29.6%) | 164 (47.9%) |
Disability Class: Self-Care Difficulty
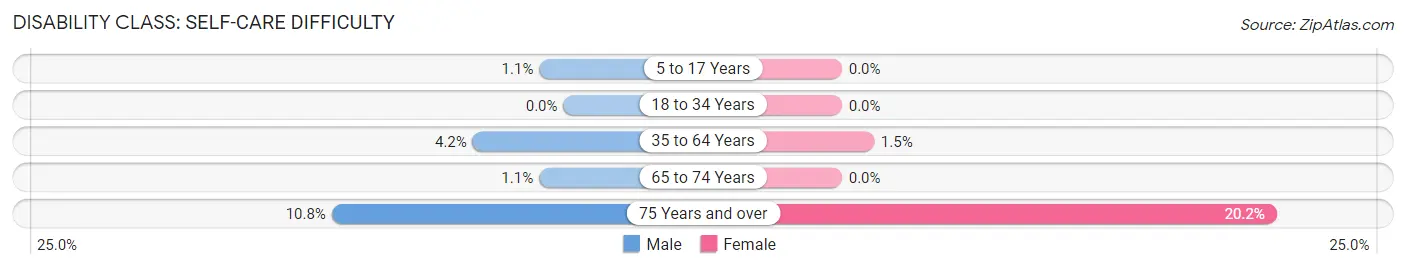
| Age Bracket | Male | Female |
| 5 to 17 Years | 13 (1.1%) | 0 (0.0%) |
| 18 to 34 Years | 0 (0.0%) | 0 (0.0%) |
| 35 to 64 Years | 107 (4.2%) | 32 (1.5%) |
| 65 to 74 Years | 11 (1.1%) | 0 (0.0%) |
| 75 Years and over | 33 (10.7%) | 69 (20.2%) |
Technology Access in Moss Bluff
Computing Device Access in Moss Bluff
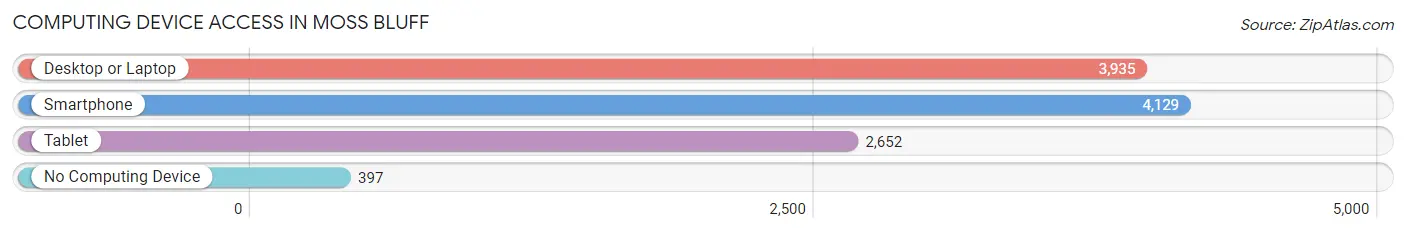
| Device Type | # Households | % Households |
| Desktop or Laptop | 3,935 | 81.3% |
| Smartphone | 4,129 | 85.4% |
| Tablet | 2,652 | 54.8% |
| No Computing Device | 397 | 8.2% |
| Total | 4,838 | 100.0% |
Internet Access in Moss Bluff
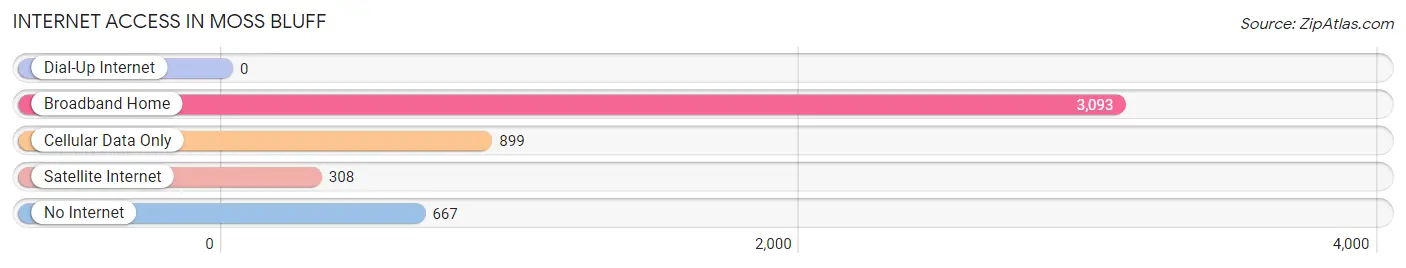
| Internet Type | # Households | % Households |
| Dial-Up Internet | 0 | 0.0% |
| Broadband Home | 3,093 | 63.9% |
| Cellular Data Only | 899 | 18.6% |
| Satellite Internet | 308 | 6.4% |
| No Internet | 667 | 13.8% |
| Total | 4,838 | 100.0% |
Moss Bluff Summary
Moss Bluff is a census-designated place (CDP) located in Calcasieu Parish, Louisiana, United States. It is situated on the western shore of Lake Charles, approximately 15 miles east of the city of Lake Charles. The population of Moss Bluff was 8,945 at the 2010 census.
History
Moss Bluff was first settled in the early 1800s by the Moss family, who were among the first settlers in the area. The Moss family owned a large tract of land in the area, which was eventually divided up and sold to other settlers. The area was known as Moss Bluff by the mid-1800s, and the first post office was established in 1871.
In the early 1900s, Moss Bluff began to grow as a small farming community. The area was home to several small farms, as well as a few stores and businesses. The area was also home to a number of churches, including the First Baptist Church of Moss Bluff, which was established in 1906.
In the 1950s, Moss Bluff began to experience rapid growth as the city of Lake Charles began to expand. The area was annexed by the city of Lake Charles in 1957, and the population of Moss Bluff began to grow rapidly. By the 1970s, Moss Bluff had become a thriving suburban community, and the population had grown to over 8,000.
Geography
Moss Bluff is located at 30°14'25" North, 93°14'45" West (30.240278, -93.245833). The CDP has a total area of 8.3 square miles, all of which is land.
The terrain of Moss Bluff is mostly flat, with some rolling hills in the northern part of the CDP. The area is located on the western shore of Lake Charles, and is bordered by the cities of Lake Charles and Sulphur to the west and south, respectively.
Economy
Moss Bluff is primarily a residential community, with most of its residents commuting to nearby cities for work. The area is home to a number of small businesses, including restaurants, retail stores, and service providers.
The largest employer in Moss Bluff is the Calcasieu Parish School Board, which employs over 1,000 people. Other major employers in the area include the Calcasieu Parish Sheriff's Office, the Calcasieu Parish Fire Department, and the Calcasieu Parish Public Works Department.
Demographics
As of the 2010 census, there were 8,945 people, 3,541 households, and 2,541 families residing in the CDP. The population density was 1,074.3 people per square mile. The racial makeup of the CDP was 79.2% White, 15.2% African American, 0.5% Native American, 1.2% Asian, 0.1% Pacific Islander, 1.7% from other races, and 2.3% from two or more races. Hispanic or Latino of any race were 4.3% of the population.
There were 3,541 households, out of which 33.2% had children under the age of 18 living with them, 54.2% were married couples living together, 12.7% had a female householder with no husband present, and 28.2% were non-families. 22.7% of all households were made up of individuals, and 8.2% had someone living alone who was 65 years of age or older. The average household size was 2.53 and the average family size was 2.97.
In the CDP, the population was spread out, with 25.2% under the age of 18, 8.2% from 18 to 24, 28.2% from 25 to 44, 25.3% from 45 to 64, and 13.1% who were 65 years of age or older. The median age was 37 years. For every 100 females, there were 94.2 males. For every 100 females age 18 and over, there were 91.2 males.
The median income for a household in the CDP was $41,944, and the median income for a family was $48,958. Males had a median income of $37,917 versus $25,917 for females. The per capita income for the CDP was $20,845. About 8.3% of families and 10.2% of the population were below the poverty line, including 14.2% of those under age 18 and 8.2% of those age 65 or over.
Common Questions
What is Per Capita Income in Moss Bluff?
Per Capita income in Moss Bluff is $47,213.
What is the Median Family Income in Moss Bluff?
Median Family Income in Moss Bluff is $91,250.
What is the Median Household income in Moss Bluff?
Median Household Income in Moss Bluff is $84,038.
What is Income or Wage Gap in Moss Bluff?
Income or Wage Gap in Moss Bluff is 51.4%.
Women in Moss Bluff earn 48.6 cents for every dollar earned by a man.
What is Inequality or Gini Index in Moss Bluff?
Inequality or Gini Index in Moss Bluff is 0.41.
What is the Total Population of Moss Bluff?
Total Population of Moss Bluff is 11,582.
What is the Total Male Population of Moss Bluff?
Total Male Population of Moss Bluff is 6,560.
What is the Total Female Population of Moss Bluff?
Total Female Population of Moss Bluff is 5,022.
What is the Ratio of Males per 100 Females in Moss Bluff?
There are 130.63 Males per 100 Females in Moss Bluff.
What is the Ratio of Females per 100 Males in Moss Bluff?
There are 76.55 Females per 100 Males in Moss Bluff.
What is the Median Population Age in Moss Bluff?
Median Population Age in Moss Bluff is 43.3 Years.
What is the Average Family Size in Moss Bluff
Average Family Size in Moss Bluff is 3.0 People.
What is the Average Household Size in Moss Bluff
Average Household Size in Moss Bluff is 2.4 People.
How Large is the Labor Force in Moss Bluff?
There are 5,481 People in the Labor Forcein in Moss Bluff.
What is the Percentage of People in the Labor Force in Moss Bluff?
59.3% of People are in the Labor Force in Moss Bluff.
What is the Unemployment Rate in Moss Bluff?
Unemployment Rate in Moss Bluff is 2.3%.