New Sarpy, LA Map & Demographics
New Sarpy Map
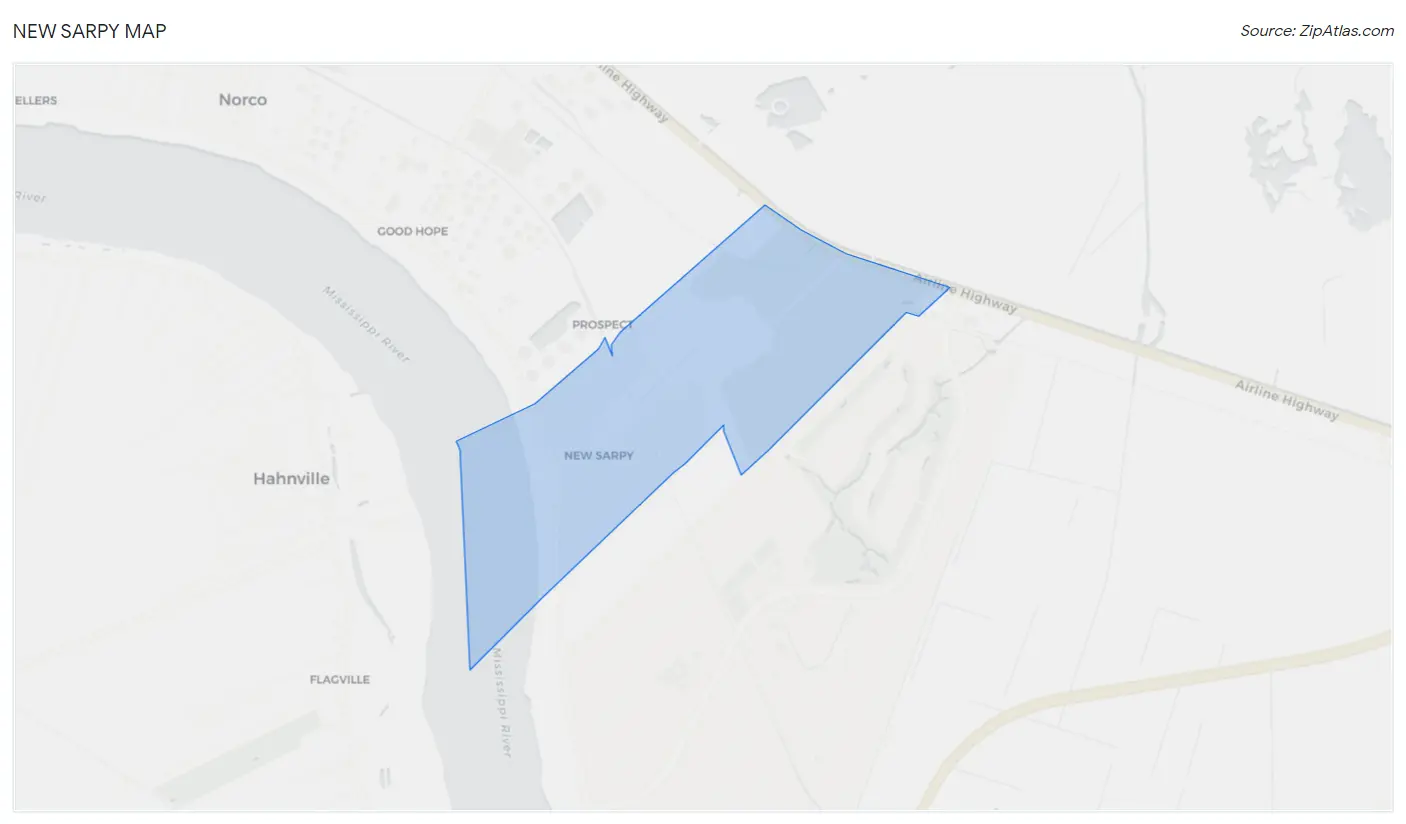
New Sarpy Overview
$28,699
PER CAPITA INCOME
$54,787
AVG FAMILY INCOME
$55,147
AVG HOUSEHOLD INCOME
11.9%
WAGE / INCOME GAP [ % ]
88.1¢/ $1
WAGE / INCOME GAP [ $ ]
0.40
INEQUALITY / GINI INDEX
1,140
TOTAL POPULATION
445
MALE POPULATION
695
FEMALE POPULATION
64.03
MALES / 100 FEMALES
156.18
FEMALES / 100 MALES
37.4
MEDIAN AGE
3.2
AVG FAMILY SIZE
2.7
AVG HOUSEHOLD SIZE
554
LABOR FORCE [ PEOPLE ]
63.5%
PERCENT IN LABOR FORCE
5.1%
UNEMPLOYMENT RATE
New Sarpy Area Codes
Income in New Sarpy
Income Overview in New Sarpy
Per Capita Income in New Sarpy is $28,699, while median incomes of families and households are $54,787 and $55,147 respectively.
| Characteristic | Number | Measure |
| Per Capita Income | 1,140 | $28,699 |
| Median Family Income | 300 | $54,787 |
| Mean Family Income | 300 | $80,166 |
| Median Household Income | 424 | $55,147 |
| Mean Household Income | 424 | $71,524 |
| Income Deficit | 300 | $0 |
| Wage / Income Gap (%) | 1,140 | 11.91% |
| Wage / Income Gap ($) | 1,140 | 88.09¢ per $1 |
| Gini / Inequality Index | 1,140 | 0.40 |
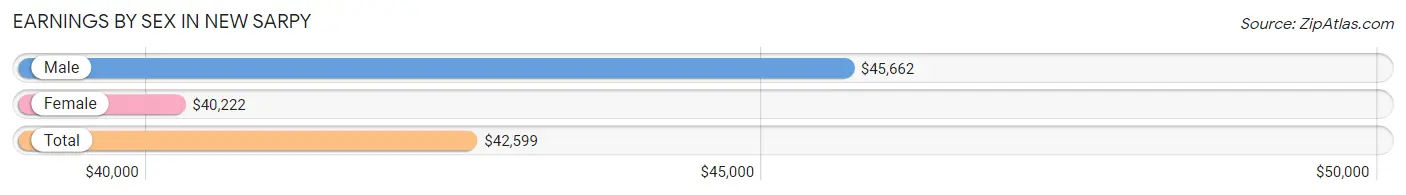
Earnings by Sex in New Sarpy
Average Earnings in New Sarpy are $42,599, $45,662 for men and $40,222 for women, a difference of 11.9%.
| Sex | Number | Average Earnings |
| Male | 247 (44.7%) | $45,662 |
| Female | 306 (55.3%) | $40,222 |
| Total | 553 (100.0%) | $42,599 |
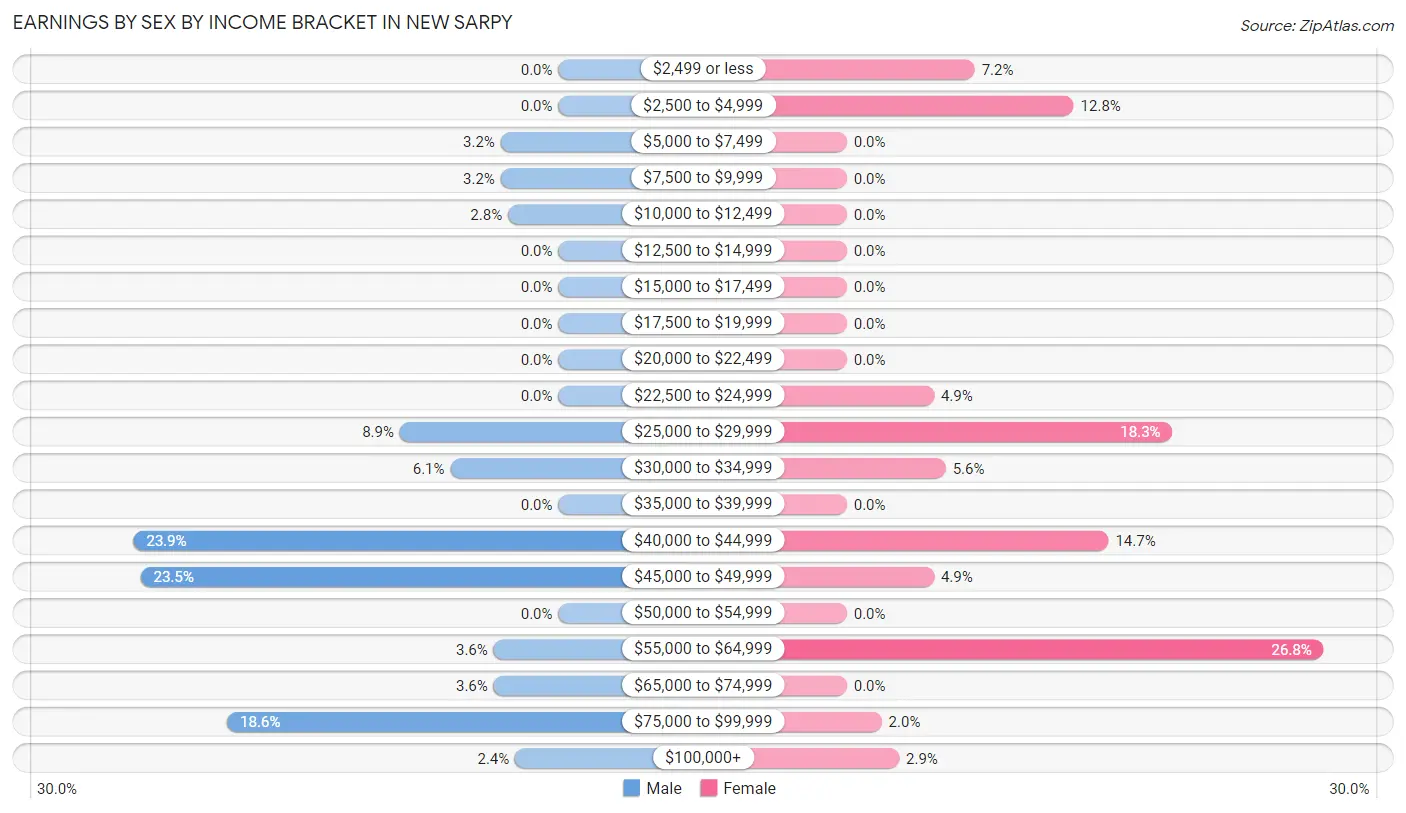
Earnings by Sex by Income Bracket in New Sarpy
The most common earnings brackets in New Sarpy are $40,000 to $44,999 for men (59 | 23.9%) and $55,000 to $64,999 for women (82 | 26.8%).
| Income | Male | Female |
| $2,499 or less | 0 (0.0%) | 22 (7.2%) |
| $2,500 to $4,999 | 0 (0.0%) | 39 (12.8%) |
| $5,000 to $7,499 | 8 (3.2%) | 0 (0.0%) |
| $7,500 to $9,999 | 8 (3.2%) | 0 (0.0%) |
| $10,000 to $12,499 | 7 (2.8%) | 0 (0.0%) |
| $12,500 to $14,999 | 0 (0.0%) | 0 (0.0%) |
| $15,000 to $17,499 | 0 (0.0%) | 0 (0.0%) |
| $17,500 to $19,999 | 0 (0.0%) | 0 (0.0%) |
| $20,000 to $22,499 | 0 (0.0%) | 0 (0.0%) |
| $22,500 to $24,999 | 0 (0.0%) | 15 (4.9%) |
| $25,000 to $29,999 | 22 (8.9%) | 56 (18.3%) |
| $30,000 to $34,999 | 15 (6.1%) | 17 (5.6%) |
| $35,000 to $39,999 | 0 (0.0%) | 0 (0.0%) |
| $40,000 to $44,999 | 59 (23.9%) | 45 (14.7%) |
| $45,000 to $49,999 | 58 (23.5%) | 15 (4.9%) |
| $50,000 to $54,999 | 0 (0.0%) | 0 (0.0%) |
| $55,000 to $64,999 | 9 (3.6%) | 82 (26.8%) |
| $65,000 to $74,999 | 9 (3.6%) | 0 (0.0%) |
| $75,000 to $99,999 | 46 (18.6%) | 6 (2.0%) |
| $100,000+ | 6 (2.4%) | 9 (2.9%) |
| Total | 247 (100.0%) | 306 (100.0%) |
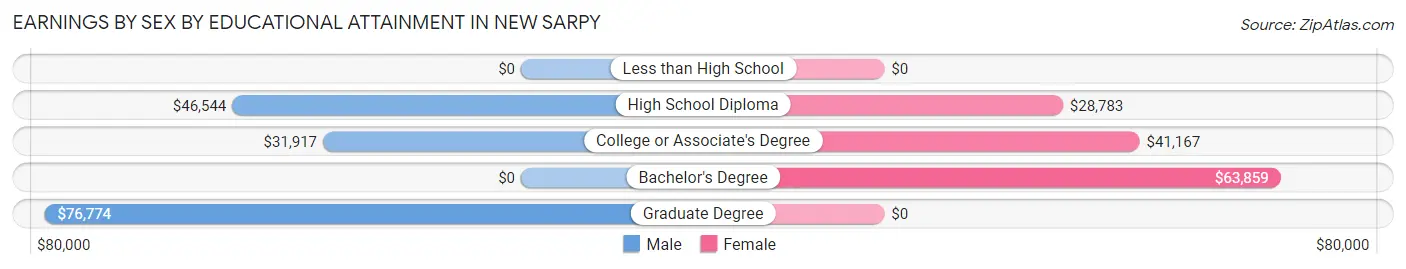
Earnings by Sex by Educational Attainment in New Sarpy
Average earnings in New Sarpy are $45,662 for men and $41,611 for women, a difference of 8.9%. Men with an educational attainment of graduate degree enjoy the highest average annual earnings of $76,774, while those with college or associate's degree education earn the least with $31,917. Women with an educational attainment of bachelor's degree earn the most with the average annual earnings of $63,859, while those with high school diploma education have the smallest earnings of $28,783.
| Educational Attainment | Male Income | Female Income |
| Less than High School | - | - |
| High School Diploma | $46,544 | $28,783 |
| College or Associate's Degree | $31,917 | $41,167 |
| Bachelor's Degree | - | - |
| Graduate Degree | $76,774 | $0 |
| Total | $45,662 | $41,611 |
Family Income in New Sarpy
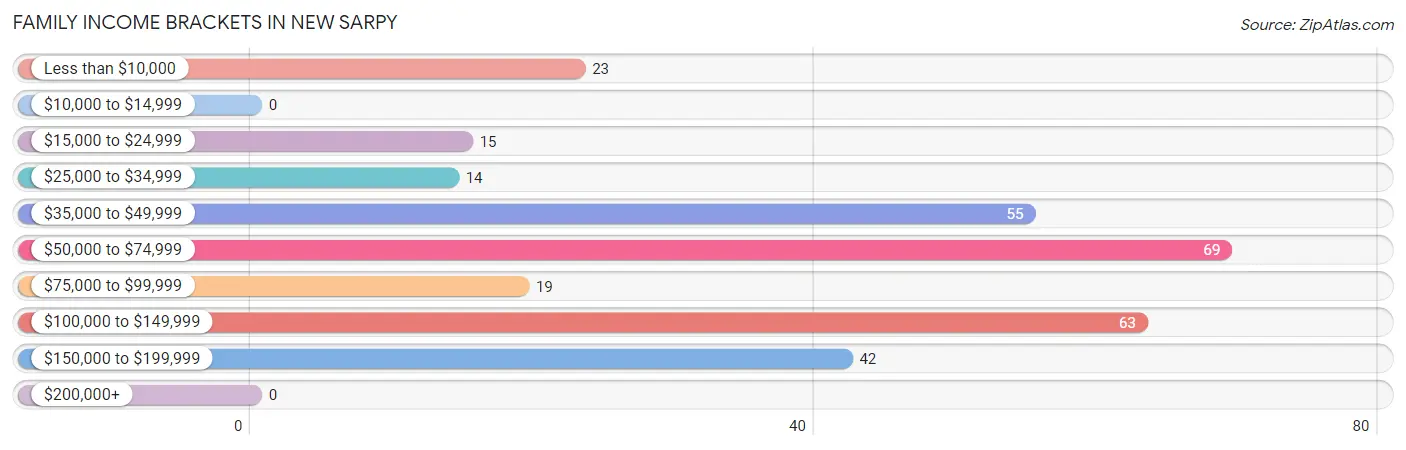
Family Income Brackets in New Sarpy
According to the New Sarpy family income data, there are 69 families falling into the $50,000 to $74,999 income range, which is the most common income bracket and makes up 23.0% of all families.
| Income Bracket | # Families | % Families |
| Less than $10,000 | 23 | 7.7% |
| $10,000 to $14,999 | 0 | 0.0% |
| $15,000 to $24,999 | 15 | 5.0% |
| $25,000 to $34,999 | 14 | 4.7% |
| $35,000 to $49,999 | 55 | 18.3% |
| $50,000 to $74,999 | 69 | 23.0% |
| $75,000 to $99,999 | 19 | 6.3% |
| $100,000 to $149,999 | 63 | 21.0% |
| $150,000 to $199,999 | 42 | 14.0% |
| $200,000+ | 0 | 0.0% |
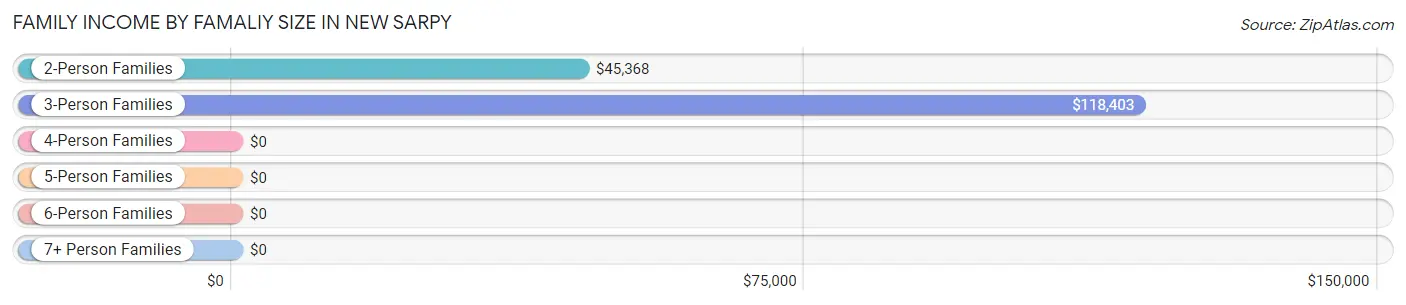
Family Income by Famaliy Size in New Sarpy
3-person families (46 | 15.3%) account for the highest median family income in New Sarpy with $118,403 per family, while 3-person families (46 | 15.3%) have the highest median income of $39,468 per family member.
| Income Bracket | # Families | Median Income |
| 2-Person Families | 157 (52.3%) | $45,368 |
| 3-Person Families | 46 (15.3%) | $118,403 |
| 4-Person Families | 23 (7.7%) | $0 |
| 5-Person Families | 65 (21.7%) | $0 |
| 6-Person Families | 9 (3.0%) | $0 |
| 7+ Person Families | 0 (0.0%) | $0 |
| Total | 300 (100.0%) | $54,787 |
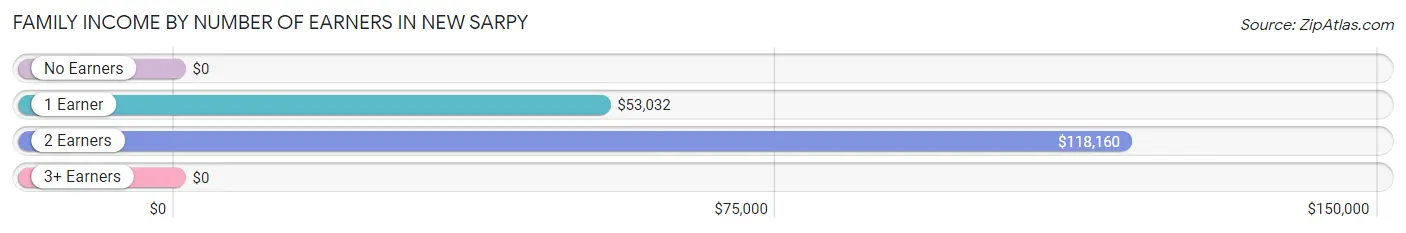
Family Income by Number of Earners in New Sarpy
| Number of Earners | # Families | Median Income |
| No Earners | 39 (13.0%) | $0 |
| 1 Earner | 154 (51.3%) | $53,032 |
| 2 Earners | 89 (29.7%) | $118,160 |
| 3+ Earners | 18 (6.0%) | $0 |
| Total | 300 (100.0%) | $54,787 |
Household Income in New Sarpy
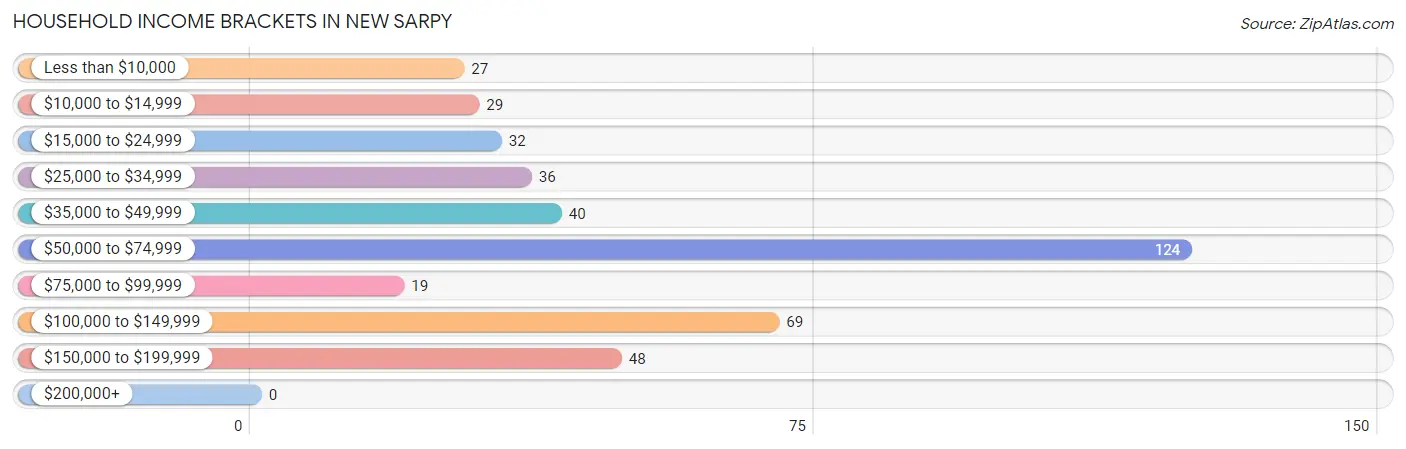
Household Income Brackets in New Sarpy
With 124 households falling in the category, the $50,000 to $74,999 income range is the most frequent in New Sarpy, accounting for 29.2% of all households.
| Income Bracket | # Households | % Households |
| Less than $10,000 | 27 | 6.4% |
| $10,000 to $14,999 | 29 | 6.8% |
| $15,000 to $24,999 | 32 | 7.5% |
| $25,000 to $34,999 | 36 | 8.5% |
| $35,000 to $49,999 | 40 | 9.4% |
| $50,000 to $74,999 | 124 | 29.2% |
| $75,000 to $99,999 | 19 | 4.5% |
| $100,000 to $149,999 | 69 | 16.3% |
| $150,000 to $199,999 | 48 | 11.3% |
| $200,000+ | 0 | 0.0% |
Household Income by Householder Age in New Sarpy
The median household income in New Sarpy is $55,147, with the highest median household income of $70,954 found in the 45 to 64 years age bracket for the primary householder. A total of 125 households (29.5%) fall into this category. Meanwhile, the 15 to 24 years age bracket for the primary householder has the lowest median household income of $0, with 4 households (0.9%) in this group.
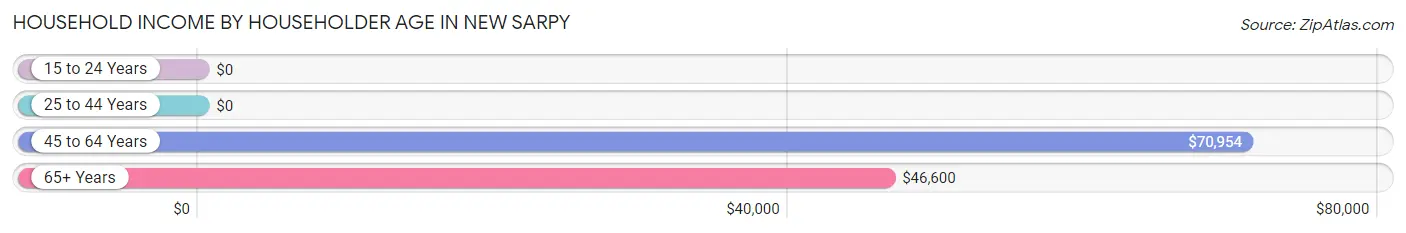
| Income Bracket | # Households | Median Income |
| 15 to 24 Years | 4 (0.9%) | $0 |
| 25 to 44 Years | 125 (29.5%) | $0 |
| 45 to 64 Years | 125 (29.5%) | $70,954 |
| 65+ Years | 170 (40.1%) | $46,600 |
| Total | 424 (100.0%) | $55,147 |
Poverty in New Sarpy
Income Below Poverty by Sex and Age in New Sarpy
With 11.2% poverty level for males and 15.8% for females among the residents of New Sarpy, 18 to 24 year old males and 12 to 14 year old females are the most vulnerable to poverty, with 4 males (100.0%) and 21 females (100.0%) in their respective age groups living below the poverty level.
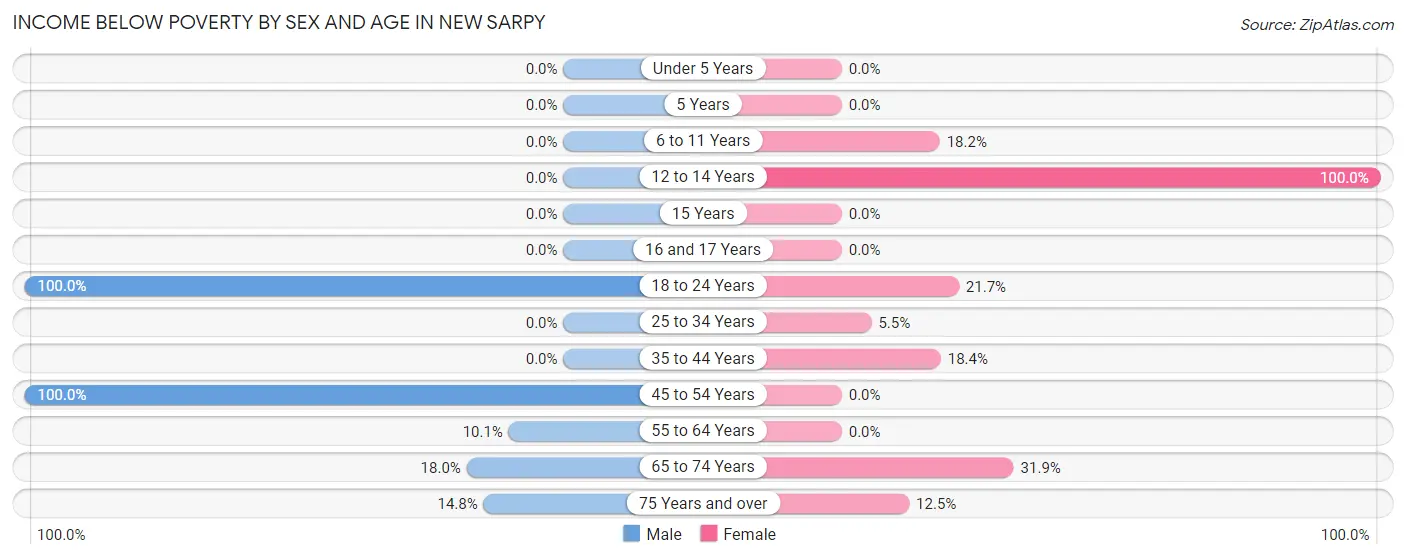
| Age Bracket | Male | Female |
| Under 5 Years | 0 (0.0%) | 0 (0.0%) |
| 5 Years | 0 (0.0%) | 0 (0.0%) |
| 6 to 11 Years | 0 (0.0%) | 14 (18.2%) |
| 12 to 14 Years | 0 (0.0%) | 21 (100.0%) |
| 15 Years | 0 (0.0%) | 0 (0.0%) |
| 16 and 17 Years | 0 (0.0%) | 0 (0.0%) |
| 18 to 24 Years | 4 (100.0%) | 5 (21.7%) |
| 25 to 34 Years | 0 (0.0%) | 7 (5.5%) |
| 35 to 44 Years | 0 (0.0%) | 18 (18.4%) |
| 45 to 54 Years | 17 (100.0%) | 0 (0.0%) |
| 55 to 64 Years | 7 (10.1%) | 0 (0.0%) |
| 65 to 74 Years | 14 (17.9%) | 37 (31.9%) |
| 75 Years and over | 8 (14.8%) | 8 (12.5%) |
| Total | 50 (11.2%) | 110 (15.8%) |
Income Above Poverty by Sex and Age in New Sarpy
According to the poverty statistics in New Sarpy, males aged under 5 years and females aged under 5 years are the age groups that are most secure financially, with 100.0% of males and 100.0% of females in these age groups living above the poverty line.
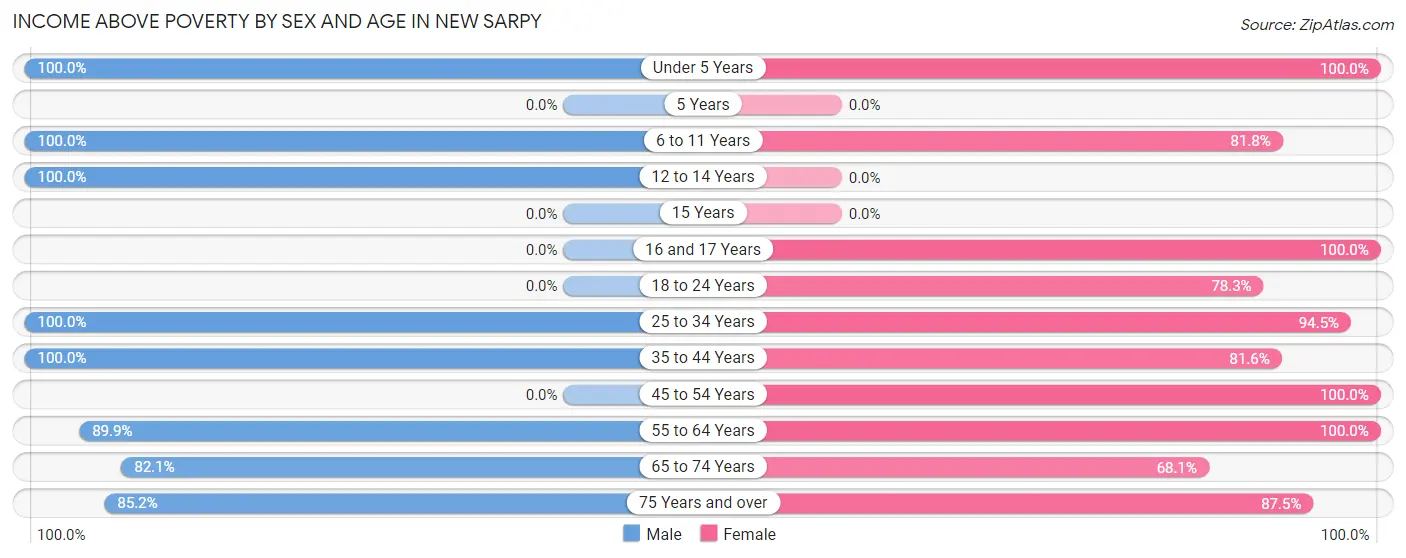
| Age Bracket | Male | Female |
| Under 5 Years | 35 (100.0%) | 70 (100.0%) |
| 5 Years | 0 (0.0%) | 0 (0.0%) |
| 6 to 11 Years | 8 (100.0%) | 63 (81.8%) |
| 12 to 14 Years | 56 (100.0%) | 0 (0.0%) |
| 15 Years | 0 (0.0%) | 0 (0.0%) |
| 16 and 17 Years | 0 (0.0%) | 27 (100.0%) |
| 18 to 24 Years | 0 (0.0%) | 18 (78.3%) |
| 25 to 34 Years | 62 (100.0%) | 120 (94.5%) |
| 35 to 44 Years | 62 (100.0%) | 80 (81.6%) |
| 45 to 54 Years | 0 (0.0%) | 13 (100.0%) |
| 55 to 64 Years | 62 (89.9%) | 59 (100.0%) |
| 65 to 74 Years | 64 (82.1%) | 79 (68.1%) |
| 75 Years and over | 46 (85.2%) | 56 (87.5%) |
| Total | 395 (88.8%) | 585 (84.2%) |
Income Below Poverty Among Married-Couple Families in New Sarpy
The poverty statistics for married-couple families in New Sarpy show that 9.9% or 22 of the total 222 families live below the poverty line. Families with 1 or 2 children have the highest poverty rate of 20.6%, comprising of 14 families. On the other hand, families with 3 or 4 children have the lowest poverty rate of 0.0%, which includes 0 families.
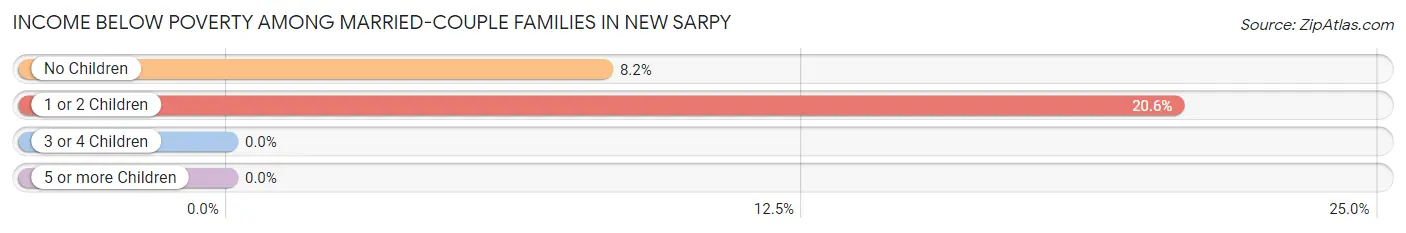
| Children | Above Poverty | Below Poverty |
| No Children | 90 (91.8%) | 8 (8.2%) |
| 1 or 2 Children | 54 (79.4%) | 14 (20.6%) |
| 3 or 4 Children | 56 (100.0%) | 0 (0.0%) |
| 5 or more Children | 0 (0.0%) | 0 (0.0%) |
| Total | 200 (90.1%) | 22 (9.9%) |
Income Below Poverty Among Single-Parent Households in New Sarpy
According to the poverty data in New Sarpy, 15.6% or 7 single-father households and 69.7% or 23 single-mother households are living below the poverty line. Among single-father households, those with no children have the highest poverty rate, with 7 households (100.0%) experiencing poverty. Likewise, among single-mother households, those with no children have the highest poverty rate, with 16 households (100.0%) falling below the poverty line.
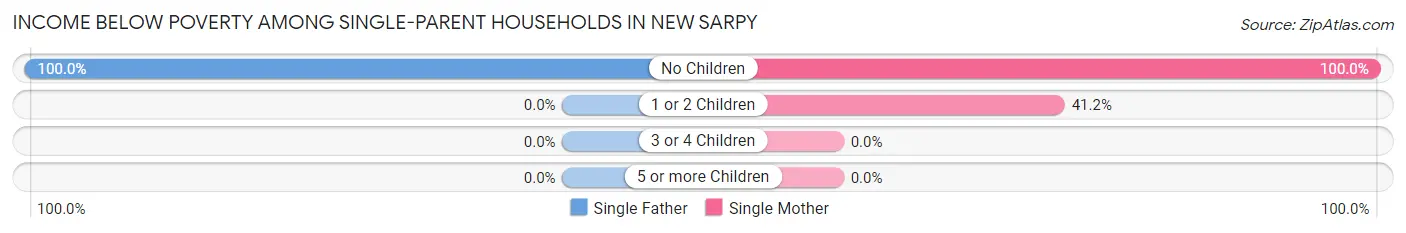
| Children | Single Father | Single Mother |
| No Children | 7 (100.0%) | 16 (100.0%) |
| 1 or 2 Children | 0 (0.0%) | 7 (41.2%) |
| 3 or 4 Children | 0 (0.0%) | 0 (0.0%) |
| 5 or more Children | 0 (0.0%) | 0 (0.0%) |
| Total | 7 (15.6%) | 23 (69.7%) |
Income Below Poverty Among Married-Couple vs Single-Parent Households in New Sarpy
The poverty data for New Sarpy shows that 22 of the married-couple family households (9.9%) and 30 of the single-parent households (38.5%) are living below the poverty level. Within the married-couple family households, those with 1 or 2 children have the highest poverty rate, with 14 households (20.6%) falling below the poverty line. Among the single-parent households, those with no children have the highest poverty rate, with 23 household (100.0%) living below poverty.
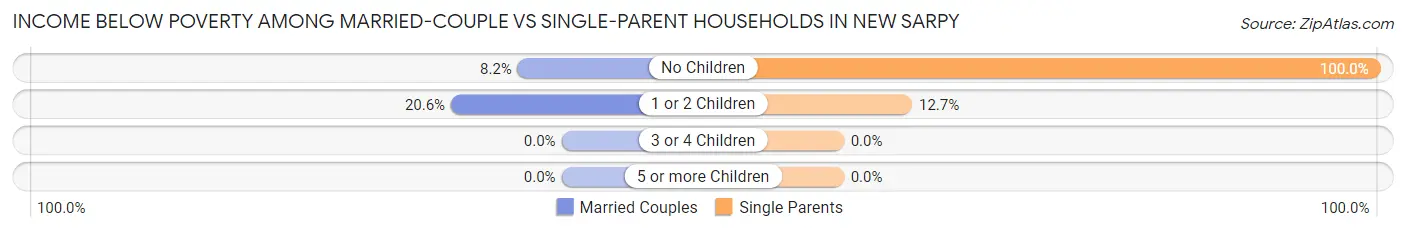
| Children | Married-Couple Families | Single-Parent Households |
| No Children | 8 (8.2%) | 23 (100.0%) |
| 1 or 2 Children | 14 (20.6%) | 7 (12.7%) |
| 3 or 4 Children | 0 (0.0%) | 0 (0.0%) |
| 5 or more Children | 0 (0.0%) | 0 (0.0%) |
| Total | 22 (9.9%) | 30 (38.5%) |
Race in New Sarpy
The most populous races in New Sarpy are White / Caucasian (701 | 61.5%), Black / African American (349 | 30.6%), and Asian (64 | 5.6%).
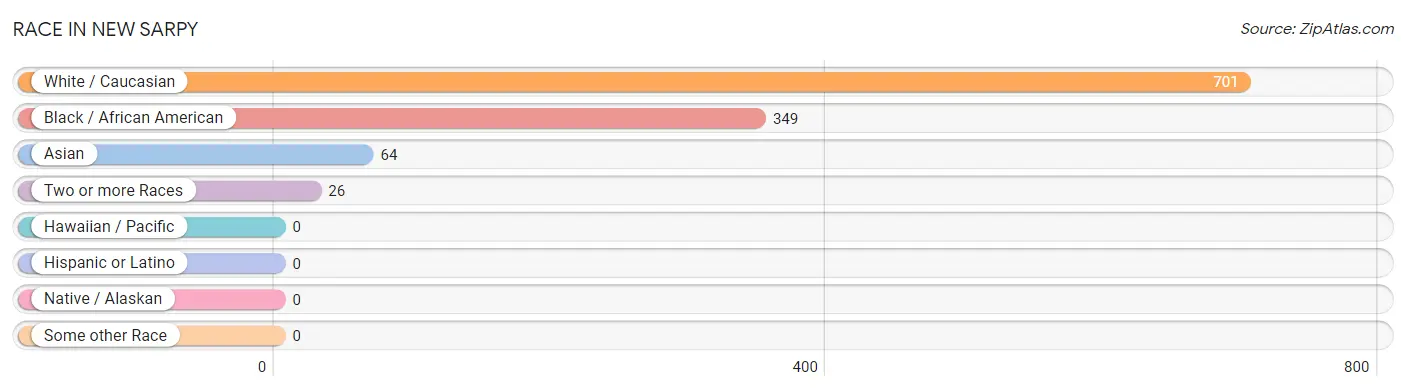
| Race | # Population | % Population |
| Asian | 64 | 5.6% |
| Black / African American | 349 | 30.6% |
| Hawaiian / Pacific | 0 | 0.0% |
| Hispanic or Latino | 0 | 0.0% |
| Native / Alaskan | 0 | 0.0% |
| White / Caucasian | 701 | 61.5% |
| Two or more Races | 26 | 2.3% |
| Some other Race | 0 | 0.0% |
| Total | 1,140 | 100.0% |
Ancestry in New Sarpy
The most populous ancestries reported in New Sarpy are French (190 | 16.7%), American (71 | 6.2%), Cajun (68 | 6.0%), Sri Lankan (64 | 5.6%), and Irish (43 | 3.8%), together accounting for 38.2% of all New Sarpy residents.
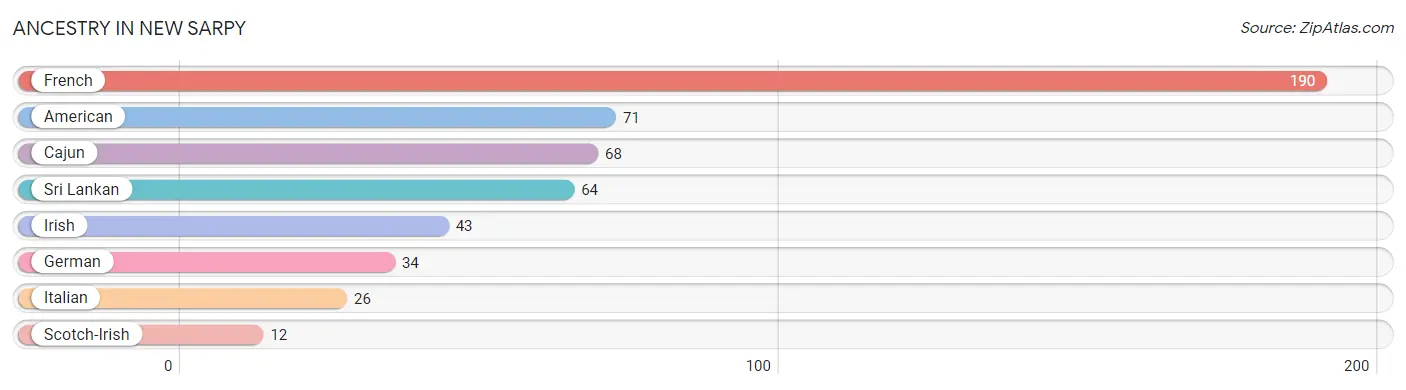
| Ancestry | # Population | % Population |
| American | 71 | 6.2% |
| Cajun | 68 | 6.0% |
| French | 190 | 16.7% |
| German | 34 | 3.0% |
| Irish | 43 | 3.8% |
| Italian | 26 | 2.3% |
| Scotch-Irish | 12 | 1.1% |
| Sri Lankan | 64 | 5.6% | View All 8 Rows |
Immigrants in New Sarpy
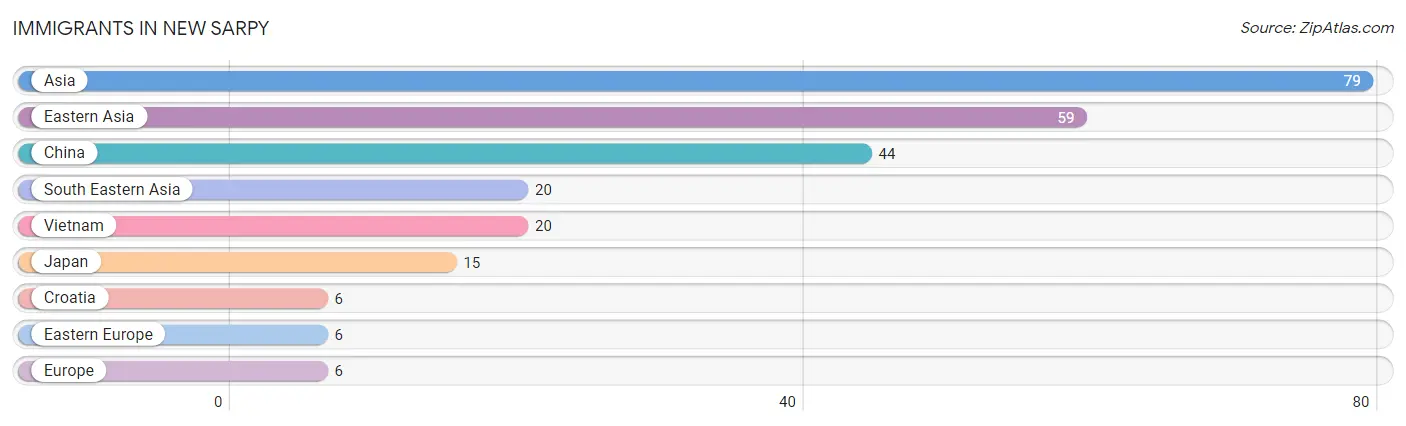
The most numerous immigrant groups reported in New Sarpy came from Asia (79 | 6.9%), Eastern Asia (59 | 5.2%), China (44 | 3.9%), South Eastern Asia (20 | 1.8%), and Vietnam (20 | 1.8%), together accounting for 19.5% of all New Sarpy residents.
| Immigration Origin | # Population | % Population |
| Asia | 79 | 6.9% |
| China | 44 | 3.9% |
| Croatia | 6 | 0.5% |
| Eastern Asia | 59 | 5.2% |
| Eastern Europe | 6 | 0.5% |
| Europe | 6 | 0.5% |
| Japan | 15 | 1.3% |
| South Eastern Asia | 20 | 1.8% |
| Vietnam | 20 | 1.8% | View All 9 Rows |
Sex and Age in New Sarpy
Sex and Age in New Sarpy
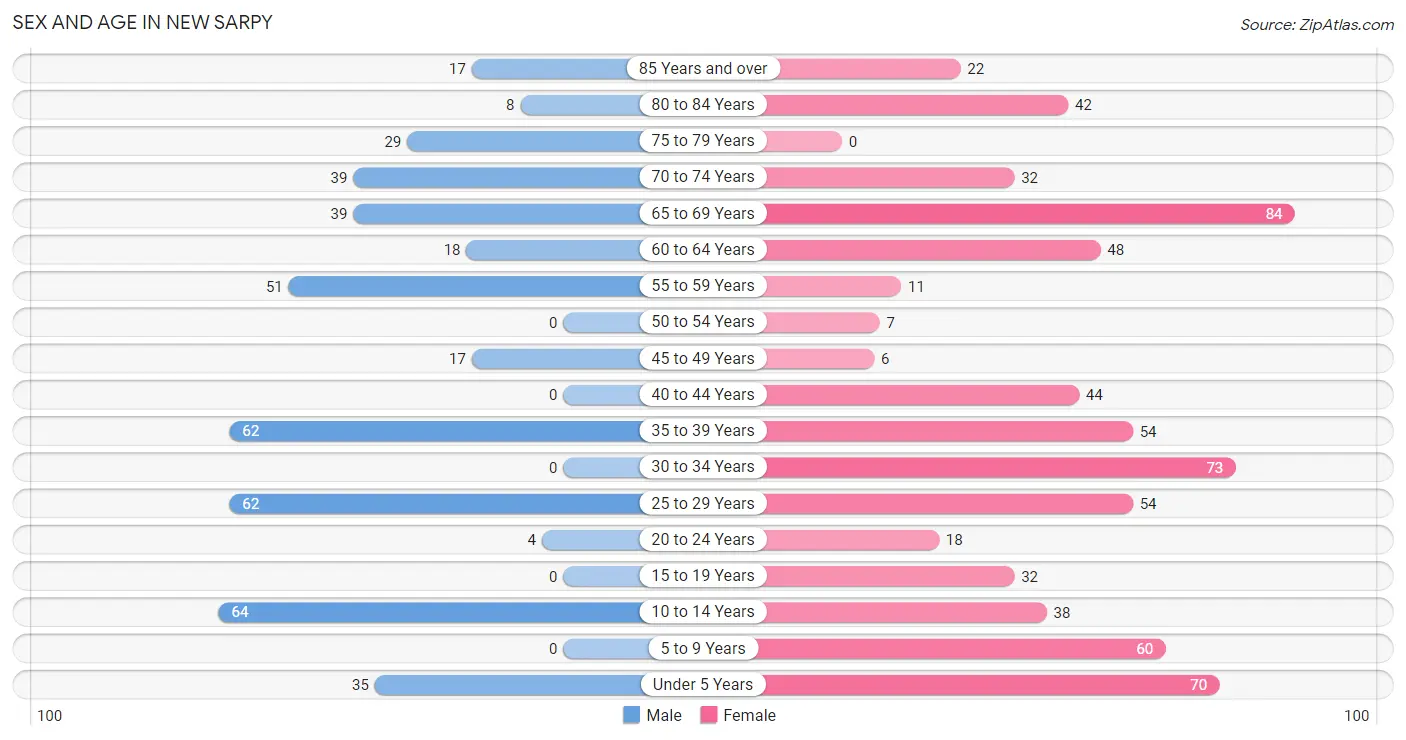
The most populous age groups in New Sarpy are 10 to 14 Years (64 | 14.4%) for men and 65 to 69 Years (84 | 12.1%) for women.
| Age Bracket | Male | Female |
| Under 5 Years | 35 (7.9%) | 70 (10.1%) |
| 5 to 9 Years | 0 (0.0%) | 60 (8.6%) |
| 10 to 14 Years | 64 (14.4%) | 38 (5.5%) |
| 15 to 19 Years | 0 (0.0%) | 32 (4.6%) |
| 20 to 24 Years | 4 (0.9%) | 18 (2.6%) |
| 25 to 29 Years | 62 (13.9%) | 54 (7.8%) |
| 30 to 34 Years | 0 (0.0%) | 73 (10.5%) |
| 35 to 39 Years | 62 (13.9%) | 54 (7.8%) |
| 40 to 44 Years | 0 (0.0%) | 44 (6.3%) |
| 45 to 49 Years | 17 (3.8%) | 6 (0.9%) |
| 50 to 54 Years | 0 (0.0%) | 7 (1.0%) |
| 55 to 59 Years | 51 (11.5%) | 11 (1.6%) |
| 60 to 64 Years | 18 (4.0%) | 48 (6.9%) |
| 65 to 69 Years | 39 (8.8%) | 84 (12.1%) |
| 70 to 74 Years | 39 (8.8%) | 32 (4.6%) |
| 75 to 79 Years | 29 (6.5%) | 0 (0.0%) |
| 80 to 84 Years | 8 (1.8%) | 42 (6.0%) |
| 85 Years and over | 17 (3.8%) | 22 (3.2%) |
| Total | 445 (100.0%) | 695 (100.0%) |
Families and Households in New Sarpy
Median Family Size in New Sarpy
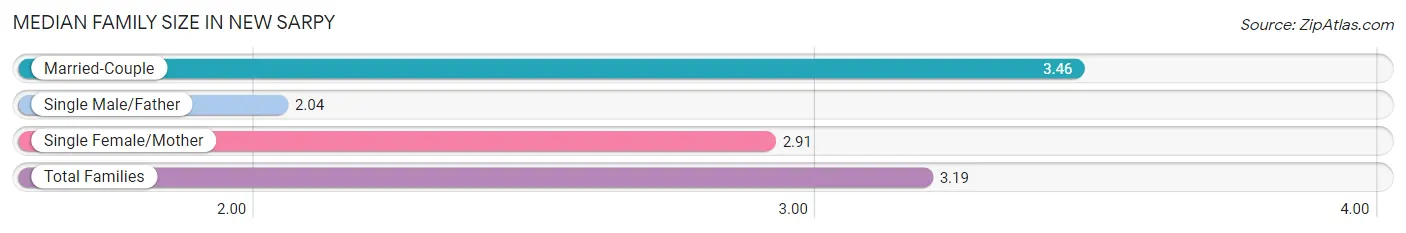
The median family size in New Sarpy is 3.19 persons per family, with married-couple families (222 | 74.0%) accounting for the largest median family size of 3.46 persons per family. On the other hand, single male/father families (45 | 15.0%) represent the smallest median family size with 2.04 persons per family.
| Family Type | # Families | Family Size |
| Married-Couple | 222 (74.0%) | 3.46 |
| Single Male/Father | 45 (15.0%) | 2.04 |
| Single Female/Mother | 33 (11.0%) | 2.91 |
| Total Families | 300 (100.0%) | 3.19 |
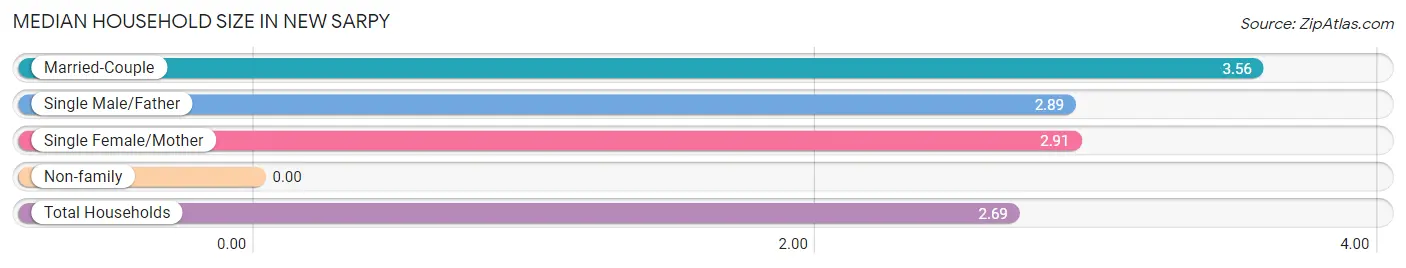
Median Household Size in New Sarpy
| Household Type | # Households | Household Size |
| Married-Couple | 222 (52.4%) | 3.56 |
| Single Male/Father | 45 (10.6%) | 2.89 |
| Single Female/Mother | 33 (7.8%) | 2.91 |
| Non-family | 124 (29.2%) | - |
| Total Households | 424 (100.0%) | 2.69 |
Household Size by Marriage Status in New Sarpy
Out of a total of 424 households in New Sarpy, 300 (70.8%) are family households, while 124 (29.2%) are nonfamily households. The most numerous type of family households are 2-person households, comprising 111, and the most common type of nonfamily households are 1-person households, comprising 124.
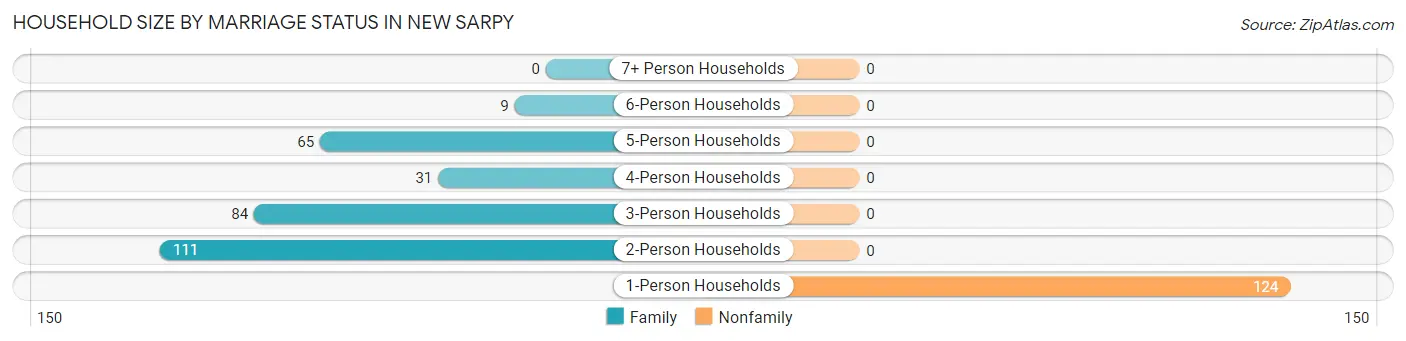
| Household Size | Family Households | Nonfamily Households |
| 1-Person Households | - | 124 (29.2%) |
| 2-Person Households | 111 (26.2%) | 0 (0.0%) |
| 3-Person Households | 84 (19.8%) | 0 (0.0%) |
| 4-Person Households | 31 (7.3%) | 0 (0.0%) |
| 5-Person Households | 65 (15.3%) | 0 (0.0%) |
| 6-Person Households | 9 (2.1%) | 0 (0.0%) |
| 7+ Person Households | 0 (0.0%) | 0 (0.0%) |
| Total | 300 (70.8%) | 124 (29.2%) |
Female Fertility in New Sarpy
Fertility by Age in New Sarpy
Average fertility rate in New Sarpy is 167.0 births per 1,000 women. Women in the age bracket of 20 to 34 years have the highest fertility rate with 324.0 births per 1,000 women. Women in the age bracket of 20 to 34 years acount for 100.0% of all women with births.
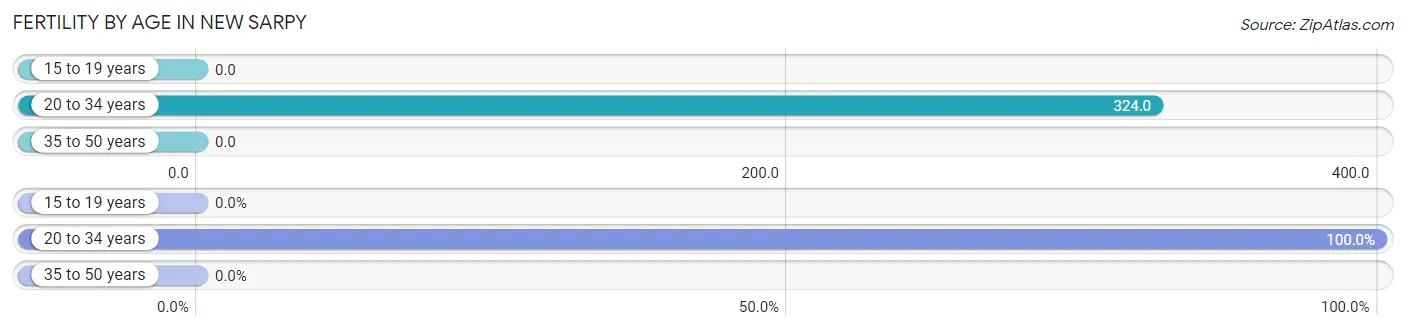
| Age Bracket | Women with Births | Births / 1,000 Women |
| 15 to 19 years | 0 (0.0%) | 0.0 |
| 20 to 34 years | 47 (100.0%) | 324.0 |
| 35 to 50 years | 0 (0.0%) | 0.0 |
| Total | 47 (100.0%) | 167.0 |
Fertility by Age by Marriage Status in New Sarpy
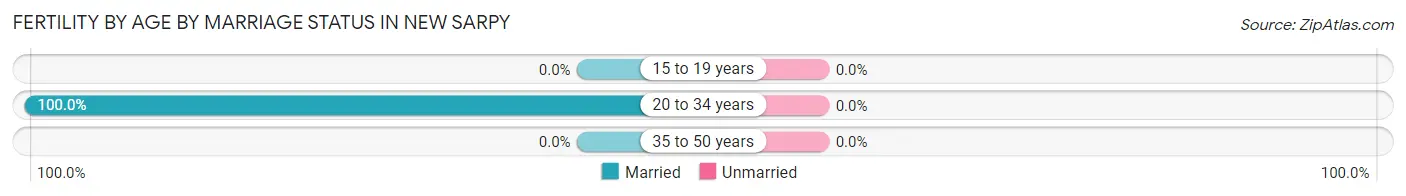
| Age Bracket | Married | Unmarried |
| 15 to 19 years | 0 (0.0%) | 0 (0.0%) |
| 20 to 34 years | 47 (100.0%) | 0 (0.0%) |
| 35 to 50 years | 0 (0.0%) | 0 (0.0%) |
| Total | 47 (100.0%) | 0 (0.0%) |
Fertility by Education in New Sarpy
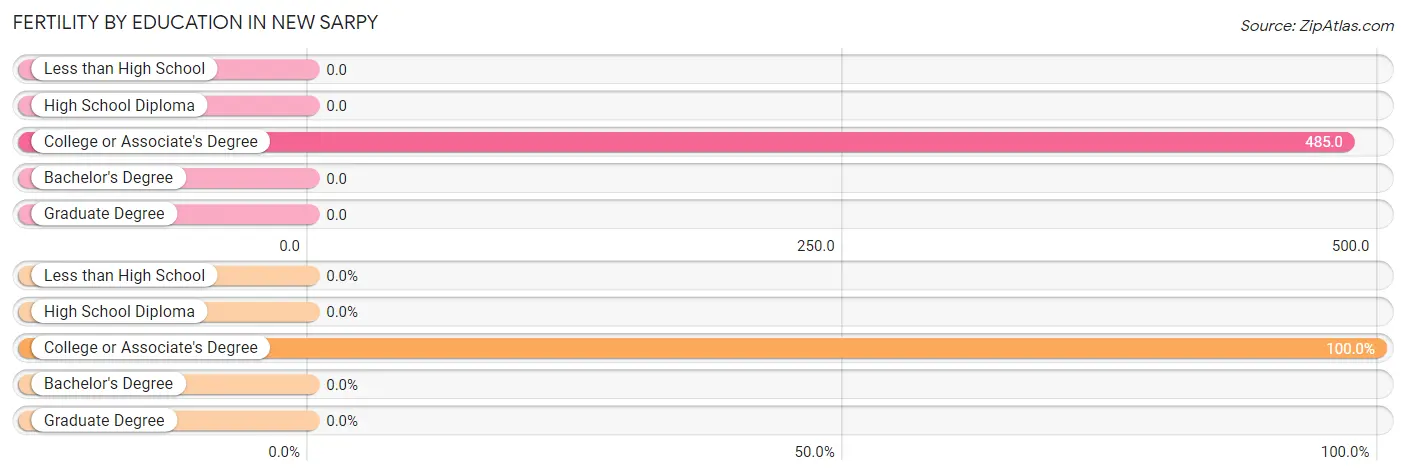
| Educational Attainment | Women with Births | Births / 1,000 Women |
| Less than High School | 0 (0.0%) | 0.0 |
| High School Diploma | 0 (0.0%) | 0.0 |
| College or Associate's Degree | 47 (100.0%) | 485.0 |
| Bachelor's Degree | 0 (0.0%) | 0.0 |
| Graduate Degree | 0 (0.0%) | 0.0 |
| Total | 47 (100.0%) | 167.0 |
Fertility by Education by Marriage Status in New Sarpy
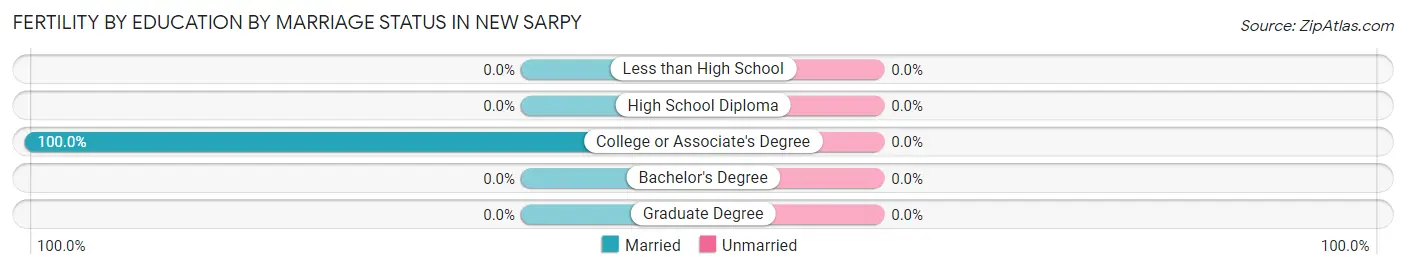
| Educational Attainment | Married | Unmarried |
| Less than High School | 0 (0.0%) | 0 (0.0%) |
| High School Diploma | 0 (0.0%) | 0 (0.0%) |
| College or Associate's Degree | 47 (100.0%) | 0 (0.0%) |
| Bachelor's Degree | 0 (0.0%) | 0 (0.0%) |
| Graduate Degree | 0 (0.0%) | 0 (0.0%) |
| Total | 47 (100.0%) | 0 (0.0%) |
Employment Characteristics in New Sarpy
Employment by Class of Employer in New Sarpy
Among the 526 employed individuals in New Sarpy, private company employees (285 | 54.2%), local government employees (136 | 25.9%), and self-employed (not incorporated) (46 | 8.7%) make up the most common classes of employment.
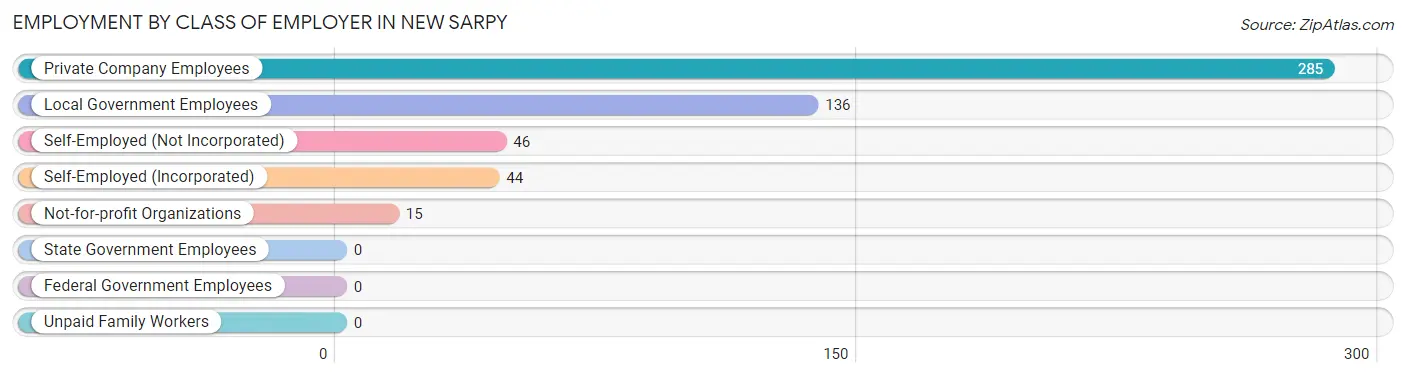
| Employer Class | # Employees | % Employees |
| Private Company Employees | 285 | 54.2% |
| Self-Employed (Incorporated) | 44 | 8.4% |
| Self-Employed (Not Incorporated) | 46 | 8.7% |
| Not-for-profit Organizations | 15 | 2.9% |
| Local Government Employees | 136 | 25.9% |
| State Government Employees | 0 | 0.0% |
| Federal Government Employees | 0 | 0.0% |
| Unpaid Family Workers | 0 | 0.0% |
| Total | 526 | 100.0% |
Employment Status by Age in New Sarpy
According to the labor force statistics for New Sarpy, out of the total population over 16 years of age (873), 63.5% or 554 individuals are in the labor force, with 5.1% or 28 of them unemployed. The age group with the highest labor force participation rate is 16 to 19 years, with 100.0% or 32 individuals in the labor force. Within the labor force, the 45 to 54 years age range has the highest percentage of unemployed individuals, with 56.7% or 17 of them being unemployed.
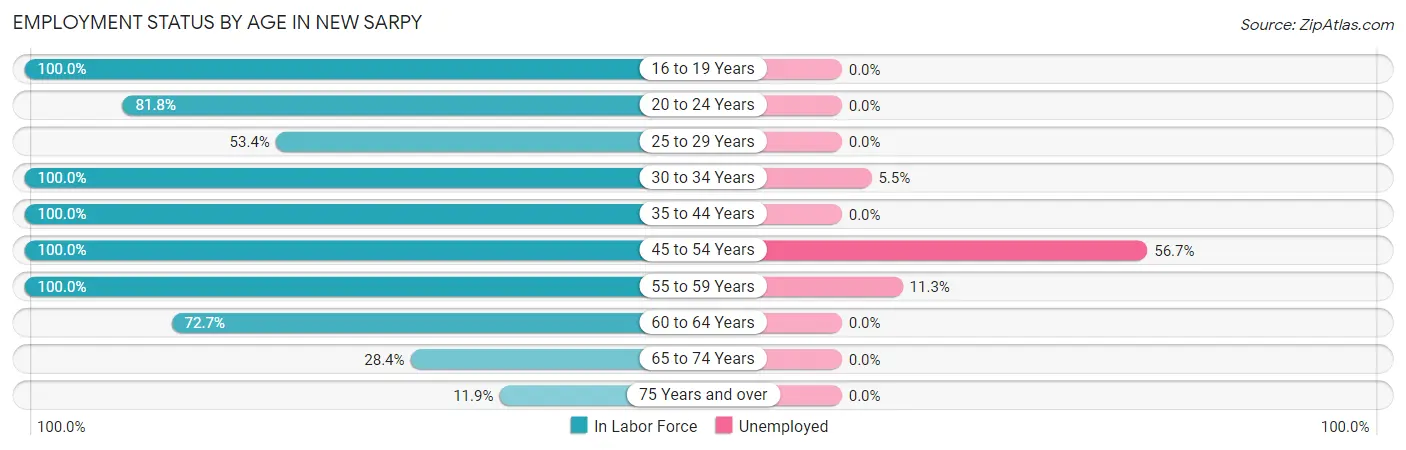
| Age Bracket | In Labor Force | Unemployed |
| 16 to 19 Years | 32 (100.0%) | 0 (0.0%) |
| 20 to 24 Years | 18 (81.8%) | 0 (0.0%) |
| 25 to 29 Years | 62 (53.4%) | 0 (0.0%) |
| 30 to 34 Years | 73 (100.0%) | 4 (5.5%) |
| 35 to 44 Years | 160 (100.0%) | 0 (0.0%) |
| 45 to 54 Years | 30 (100.0%) | 17 (56.7%) |
| 55 to 59 Years | 62 (100.0%) | 7 (11.3%) |
| 60 to 64 Years | 48 (72.7%) | 0 (0.0%) |
| 65 to 74 Years | 55 (28.4%) | 0 (0.0%) |
| 75 Years and over | 14 (11.9%) | 0 (0.0%) |
| Total | 554 (63.5%) | 28 (5.1%) |
Employment Status by Educational Attainment in New Sarpy
According to labor force statistics for New Sarpy, 85.8% of individuals (435) out of the total population between 25 and 64 years of age (507) are in the labor force, with 6.4% or 28 of them being unemployed. The group with the highest labor force participation rate are those with the educational attainment of less than high school, with 100.0% or 49 individuals in the labor force. Within the labor force, individuals with less than high school education have the highest percentage of unemployment, with 14.3% or 7 of them being unemployed.
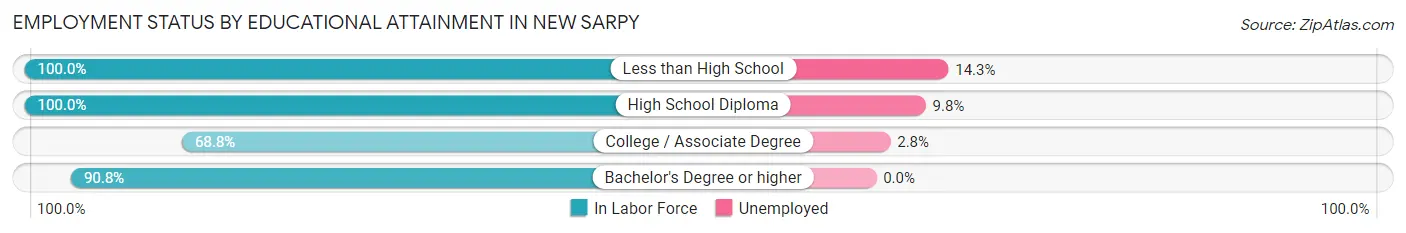
| Educational Attainment | In Labor Force | Unemployed |
| Less than High School | 49 (100.0%) | 7 (14.3%) |
| High School Diploma | 174 (100.0%) | 17 (9.8%) |
| College / Associate Degree | 143 (68.8%) | 6 (2.8%) |
| Bachelor's Degree or higher | 69 (90.8%) | 0 (0.0%) |
| Total | 435 (85.8%) | 32 (6.4%) |
Employment Occupations by Sex in New Sarpy
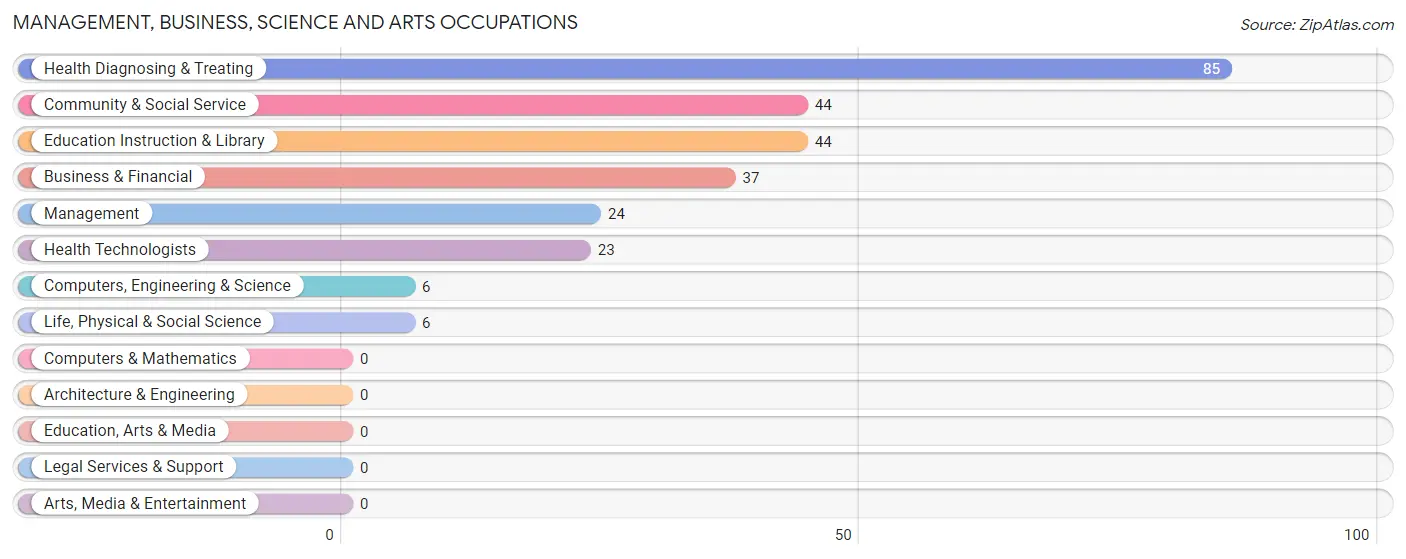
Management, Business, Science and Arts Occupations
The most common Management, Business, Science and Arts occupations in New Sarpy are Health Diagnosing & Treating (85 | 16.2%), Community & Social Service (44 | 8.4%), Education Instruction & Library (44 | 8.4%), Business & Financial (37 | 7.0%), and Management (24 | 4.6%).
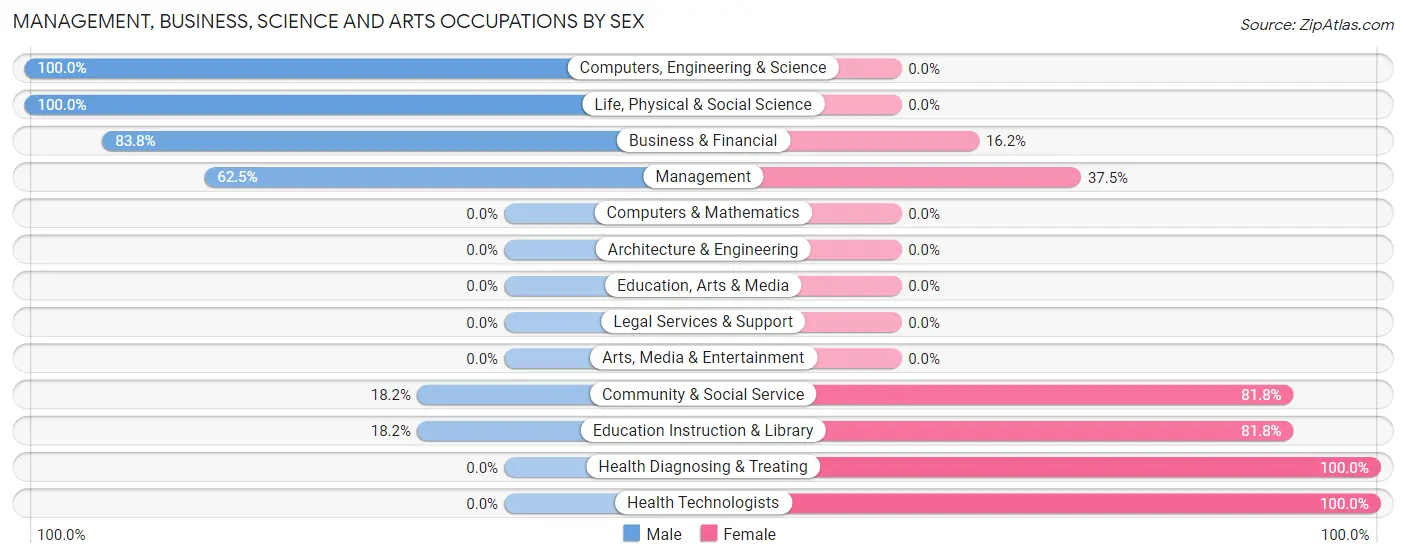
Management, Business, Science and Arts Occupations by Sex
Within the Management, Business, Science and Arts occupations in New Sarpy, the most male-oriented occupations are Computers, Engineering & Science (100.0%), Life, Physical & Social Science (100.0%), and Business & Financial (83.8%), while the most female-oriented occupations are Health Diagnosing & Treating (100.0%), Health Technologists (100.0%), and Community & Social Service (81.8%).
| Occupation | Male | Female |
| Management | 15 (62.5%) | 9 (37.5%) |
| Business & Financial | 31 (83.8%) | 6 (16.2%) |
| Computers, Engineering & Science | 6 (100.0%) | 0 (0.0%) |
| Computers & Mathematics | 0 (0.0%) | 0 (0.0%) |
| Architecture & Engineering | 0 (0.0%) | 0 (0.0%) |
| Life, Physical & Social Science | 6 (100.0%) | 0 (0.0%) |
| Community & Social Service | 8 (18.2%) | 36 (81.8%) |
| Education, Arts & Media | 0 (0.0%) | 0 (0.0%) |
| Legal Services & Support | 0 (0.0%) | 0 (0.0%) |
| Education Instruction & Library | 8 (18.2%) | 36 (81.8%) |
| Arts, Media & Entertainment | 0 (0.0%) | 0 (0.0%) |
| Health Diagnosing & Treating | 0 (0.0%) | 85 (100.0%) |
| Health Technologists | 0 (0.0%) | 23 (100.0%) |
| Total (Category) | 60 (30.6%) | 136 (69.4%) |
| Total (Overall) | 231 (43.9%) | 295 (56.1%) |
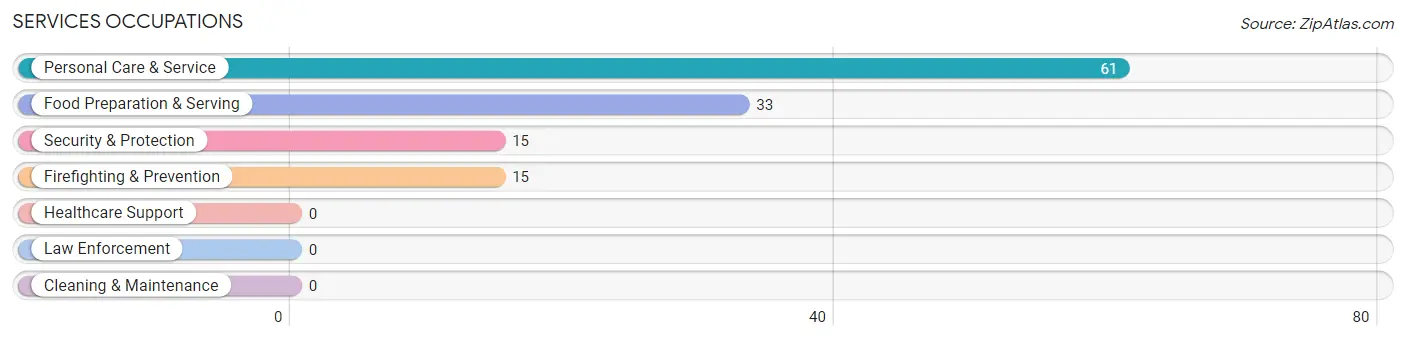
Services Occupations
The most common Services occupations in New Sarpy are Personal Care & Service (61 | 11.6%), Food Preparation & Serving (33 | 6.3%), Security & Protection (15 | 2.9%), and Firefighting & Prevention (15 | 2.9%).
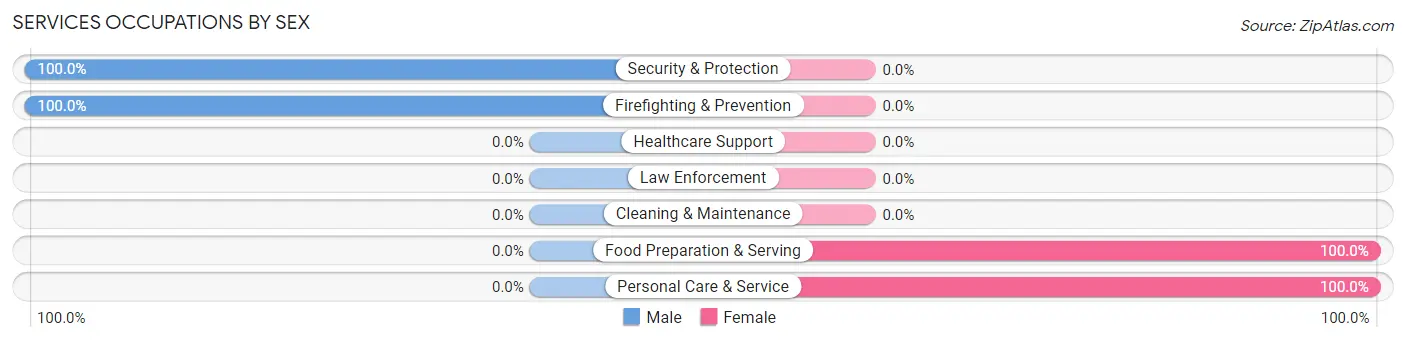
Services Occupations by Sex
Within the Services occupations in New Sarpy, the most male-oriented occupations are Security & Protection (100.0%), and Firefighting & Prevention (100.0%), while the most female-oriented occupations are Food Preparation & Serving (100.0%), and Personal Care & Service (100.0%).
| Occupation | Male | Female |
| Healthcare Support | 0 (0.0%) | 0 (0.0%) |
| Security & Protection | 15 (100.0%) | 0 (0.0%) |
| Firefighting & Prevention | 15 (100.0%) | 0 (0.0%) |
| Law Enforcement | 0 (0.0%) | 0 (0.0%) |
| Food Preparation & Serving | 0 (0.0%) | 33 (100.0%) |
| Cleaning & Maintenance | 0 (0.0%) | 0 (0.0%) |
| Personal Care & Service | 0 (0.0%) | 61 (100.0%) |
| Total (Category) | 15 (13.8%) | 94 (86.2%) |
| Total (Overall) | 231 (43.9%) | 295 (56.1%) |
Sales and Office Occupations
The most common Sales and Office occupations in New Sarpy are Office & Administration (52 | 9.9%), and Sales & Related (28 | 5.3%).
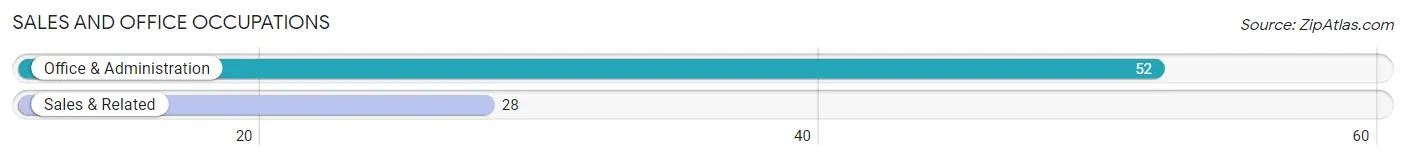
Sales and Office Occupations by Sex
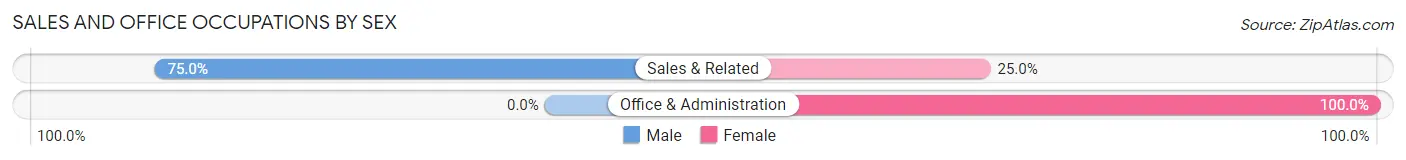
| Occupation | Male | Female |
| Sales & Related | 21 (75.0%) | 7 (25.0%) |
| Office & Administration | 0 (0.0%) | 52 (100.0%) |
| Total (Category) | 21 (26.3%) | 59 (73.8%) |
| Total (Overall) | 231 (43.9%) | 295 (56.1%) |
Natural Resources, Construction and Maintenance Occupations
The most common Natural Resources, Construction and Maintenance occupations in New Sarpy are , and Construction & Extraction (88 | 16.7%).
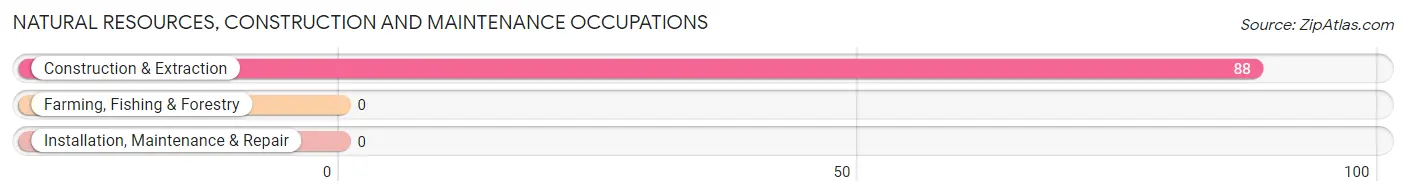
Natural Resources, Construction and Maintenance Occupations by Sex
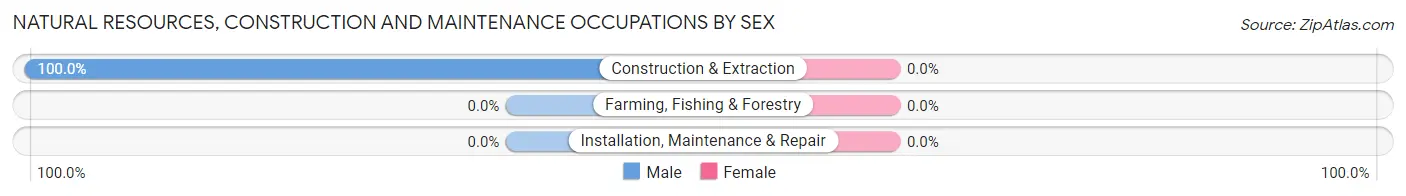
| Occupation | Male | Female |
| Farming, Fishing & Forestry | 0 (0.0%) | 0 (0.0%) |
| Construction & Extraction | 88 (100.0%) | 0 (0.0%) |
| Installation, Maintenance & Repair | 0 (0.0%) | 0 (0.0%) |
| Total (Category) | 88 (100.0%) | 0 (0.0%) |
| Total (Overall) | 231 (43.9%) | 295 (56.1%) |
Production, Transportation and Moving Occupations
The most common Production, Transportation and Moving occupations in New Sarpy are Transportation (38 | 7.2%), and Production (15 | 2.9%).
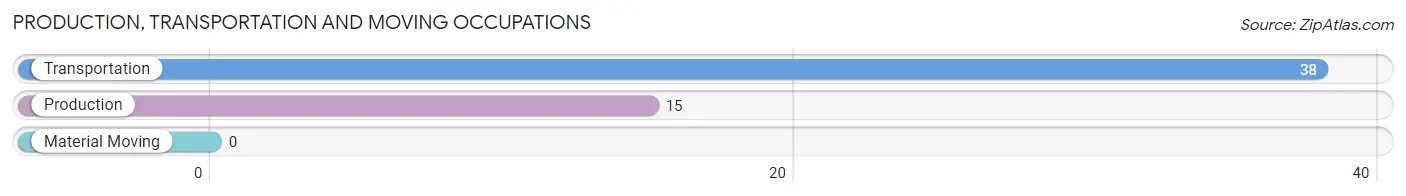
Production, Transportation and Moving Occupations by Sex
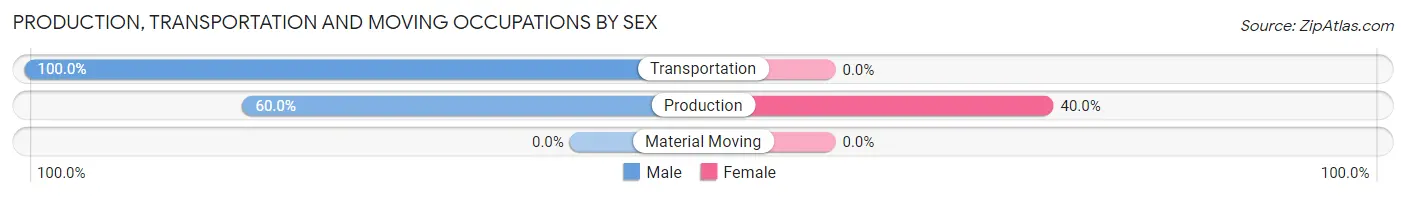
| Occupation | Male | Female |
| Production | 9 (60.0%) | 6 (40.0%) |
| Transportation | 38 (100.0%) | 0 (0.0%) |
| Material Moving | 0 (0.0%) | 0 (0.0%) |
| Total (Category) | 47 (88.7%) | 6 (11.3%) |
| Total (Overall) | 231 (43.9%) | 295 (56.1%) |
Employment Industries by Sex in New Sarpy
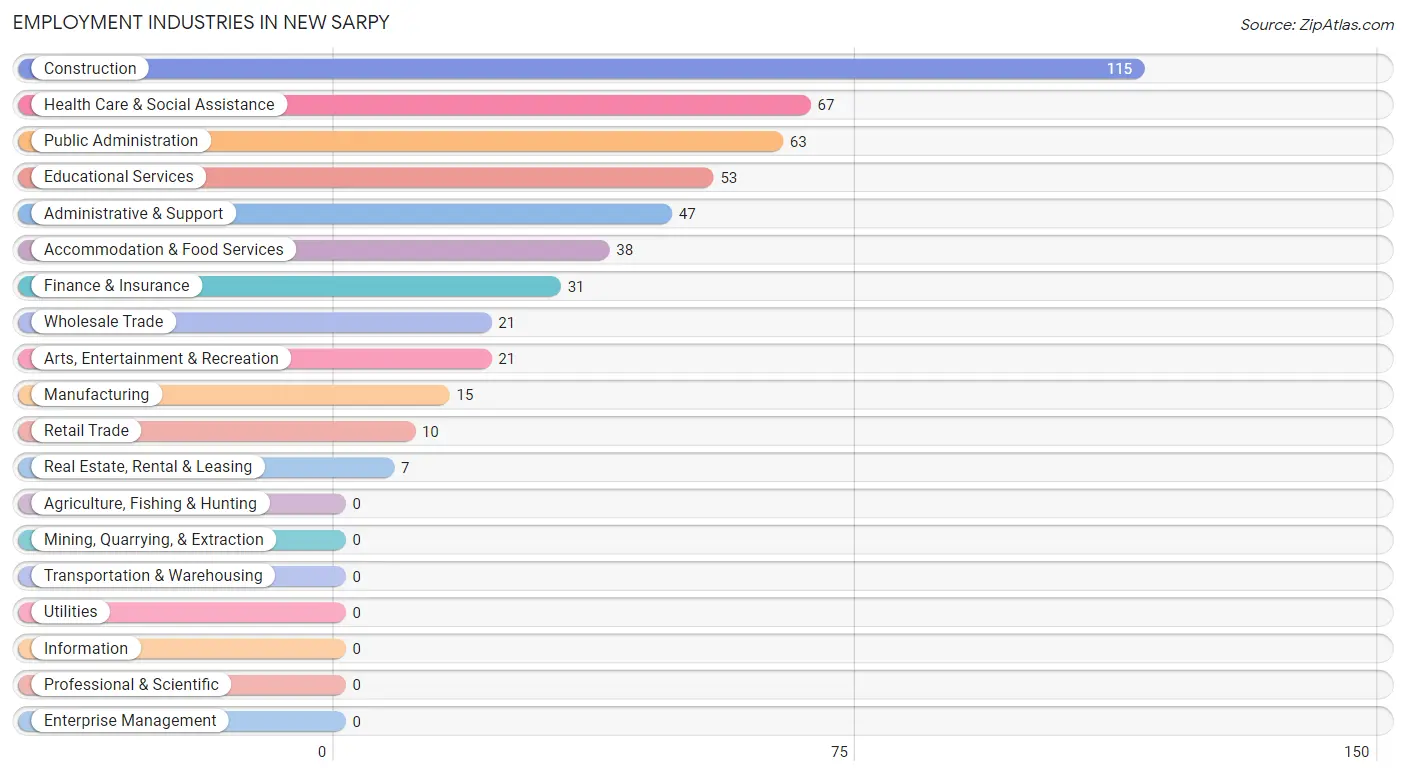
Employment Industries in New Sarpy
The major employment industries in New Sarpy include Construction (115 | 21.9%), Health Care & Social Assistance (67 | 12.7%), Public Administration (63 | 12.0%), Educational Services (53 | 10.1%), and Administrative & Support (47 | 8.9%).
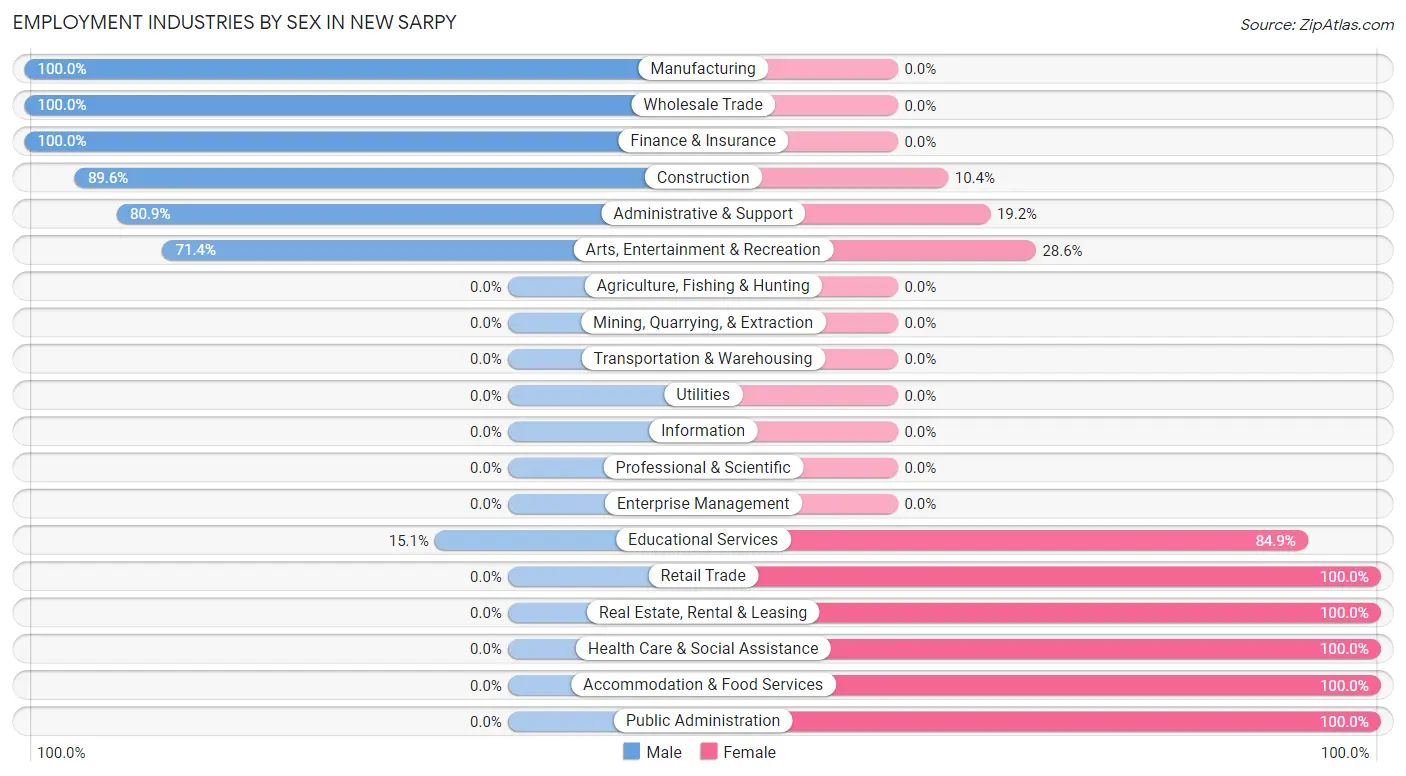
Employment Industries by Sex in New Sarpy
The New Sarpy industries that see more men than women are Manufacturing (100.0%), Wholesale Trade (100.0%), and Finance & Insurance (100.0%), whereas the industries that tend to have a higher number of women are Retail Trade (100.0%), Real Estate, Rental & Leasing (100.0%), and Health Care & Social Assistance (100.0%).
| Industry | Male | Female |
| Agriculture, Fishing & Hunting | 0 (0.0%) | 0 (0.0%) |
| Mining, Quarrying, & Extraction | 0 (0.0%) | 0 (0.0%) |
| Construction | 103 (89.6%) | 12 (10.4%) |
| Manufacturing | 15 (100.0%) | 0 (0.0%) |
| Wholesale Trade | 21 (100.0%) | 0 (0.0%) |
| Retail Trade | 0 (0.0%) | 10 (100.0%) |
| Transportation & Warehousing | 0 (0.0%) | 0 (0.0%) |
| Utilities | 0 (0.0%) | 0 (0.0%) |
| Information | 0 (0.0%) | 0 (0.0%) |
| Finance & Insurance | 31 (100.0%) | 0 (0.0%) |
| Real Estate, Rental & Leasing | 0 (0.0%) | 7 (100.0%) |
| Professional & Scientific | 0 (0.0%) | 0 (0.0%) |
| Enterprise Management | 0 (0.0%) | 0 (0.0%) |
| Administrative & Support | 38 (80.8%) | 9 (19.2%) |
| Educational Services | 8 (15.1%) | 45 (84.9%) |
| Health Care & Social Assistance | 0 (0.0%) | 67 (100.0%) |
| Arts, Entertainment & Recreation | 15 (71.4%) | 6 (28.6%) |
| Accommodation & Food Services | 0 (0.0%) | 38 (100.0%) |
| Public Administration | 0 (0.0%) | 63 (100.0%) |
| Total | 231 (43.9%) | 295 (56.1%) |
Education in New Sarpy
School Enrollment in New Sarpy
The most common levels of schooling among the 231 students in New Sarpy are middle school (92 | 39.8%), elementary school (62 | 26.8%), and nursery / preschool (35 | 15.1%).
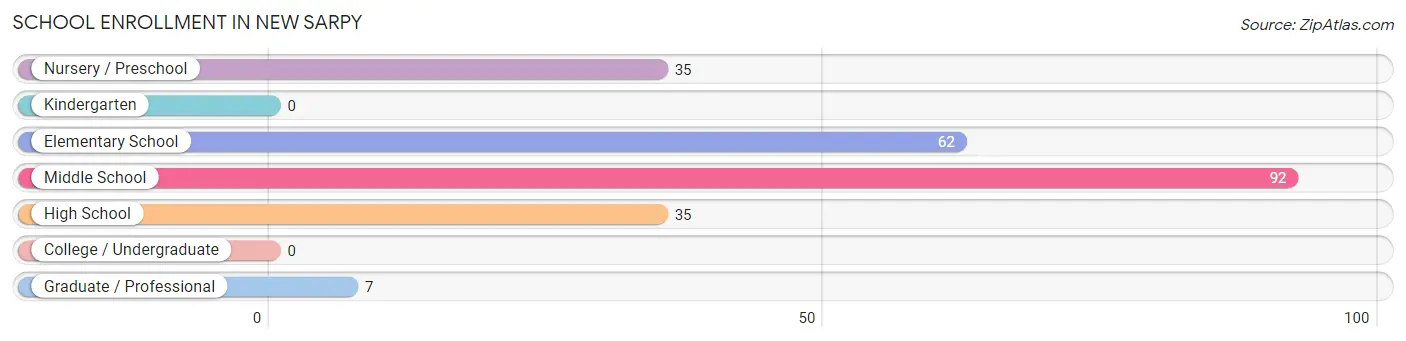
| School Level | # Students | % Students |
| Nursery / Preschool | 35 | 15.1% |
| Kindergarten | 0 | 0.0% |
| Elementary School | 62 | 26.8% |
| Middle School | 92 | 39.8% |
| High School | 35 | 15.1% |
| College / Undergraduate | 0 | 0.0% |
| Graduate / Professional | 7 | 3.0% |
| Total | 231 | 100.0% |
School Enrollment by Age by Funding Source in New Sarpy
Out of a total of 231 students who are enrolled in schools in New Sarpy, 65 (28.1%) attend a private institution, while the remaining 166 (71.9%) are enrolled in public schools. The age group of 3 to 4 year olds has the highest likelihood of being enrolled in private schools, with 35 (100.0% in the age bracket) enrolled. Conversely, the age group of 15 to 17 year olds has the lowest likelihood of being enrolled in a private school, with 27 (100.0% in the age bracket) attending a public institution.
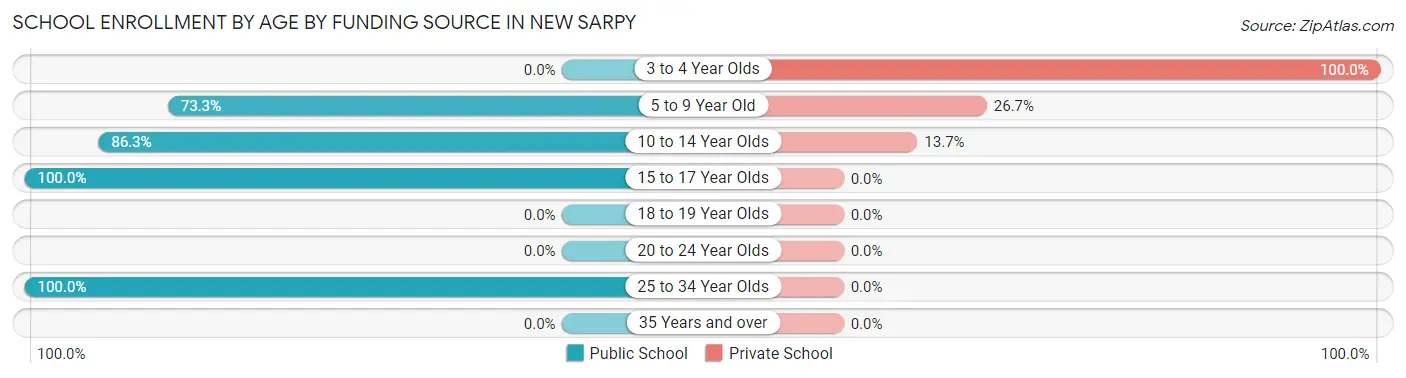
| Age Bracket | Public School | Private School |
| 3 to 4 Year Olds | 0 (0.0%) | 35 (100.0%) |
| 5 to 9 Year Old | 44 (73.3%) | 16 (26.7%) |
| 10 to 14 Year Olds | 88 (86.3%) | 14 (13.7%) |
| 15 to 17 Year Olds | 27 (100.0%) | 0 (0.0%) |
| 18 to 19 Year Olds | 0 (0.0%) | 0 (0.0%) |
| 20 to 24 Year Olds | 0 (0.0%) | 0 (0.0%) |
| 25 to 34 Year Olds | 7 (100.0%) | 0 (0.0%) |
| 35 Years and over | 0 (0.0%) | 0 (0.0%) |
| Total | 166 (71.9%) | 65 (28.1%) |
Educational Attainment by Field of Study in New Sarpy
Business (40 | 40.4%), arts & humanities (30 | 30.3%), engineering (15 | 15.1%), education (8 | 8.1%), and physical & health sciences (6 | 6.1%) are the most common fields of study among 99 individuals in New Sarpy who have obtained a bachelor's degree or higher.
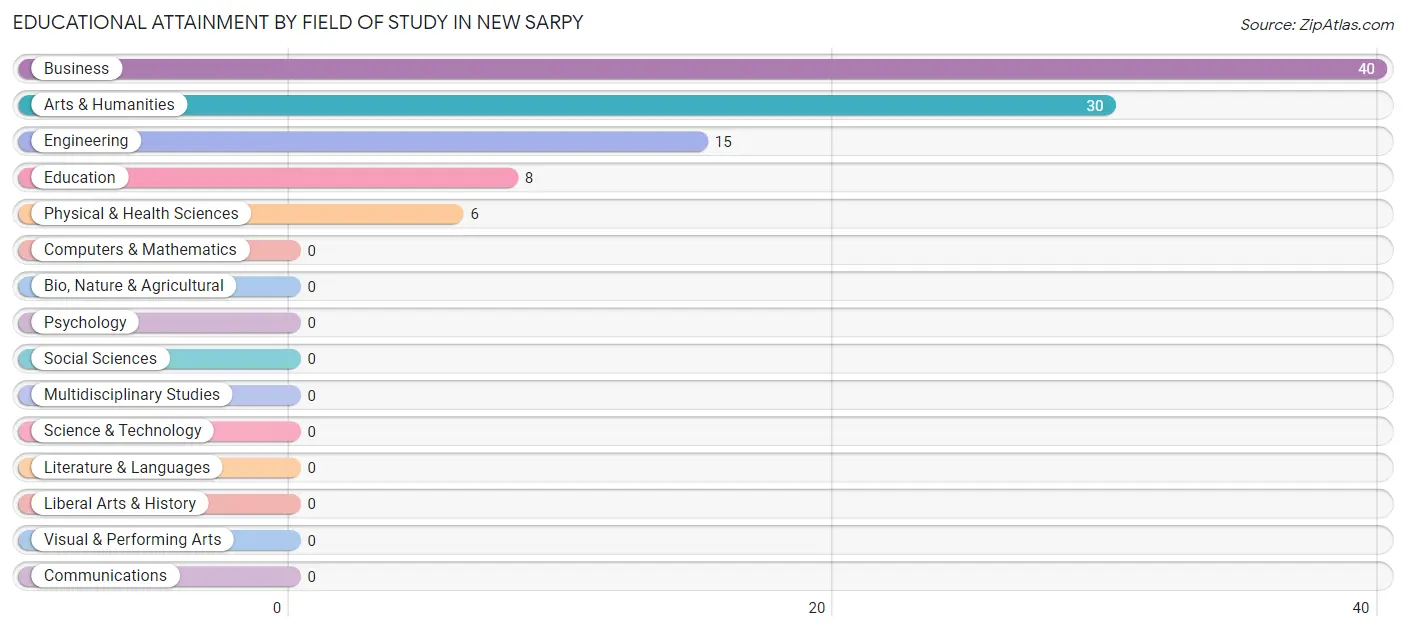
| Field of Study | # Graduates | % Graduates |
| Computers & Mathematics | 0 | 0.0% |
| Bio, Nature & Agricultural | 0 | 0.0% |
| Physical & Health Sciences | 6 | 6.1% |
| Psychology | 0 | 0.0% |
| Social Sciences | 0 | 0.0% |
| Engineering | 15 | 15.1% |
| Multidisciplinary Studies | 0 | 0.0% |
| Science & Technology | 0 | 0.0% |
| Business | 40 | 40.4% |
| Education | 8 | 8.1% |
| Literature & Languages | 0 | 0.0% |
| Liberal Arts & History | 0 | 0.0% |
| Visual & Performing Arts | 0 | 0.0% |
| Communications | 0 | 0.0% |
| Arts & Humanities | 30 | 30.3% |
| Total | 99 | 100.0% |
Transportation & Commute in New Sarpy
Vehicle Availability by Sex in New Sarpy
The most prevalent vehicle ownership categories in New Sarpy are males with 2 vehicles (151, accounting for 65.4%) and females with 2 vehicles (168, making up 51.2%).
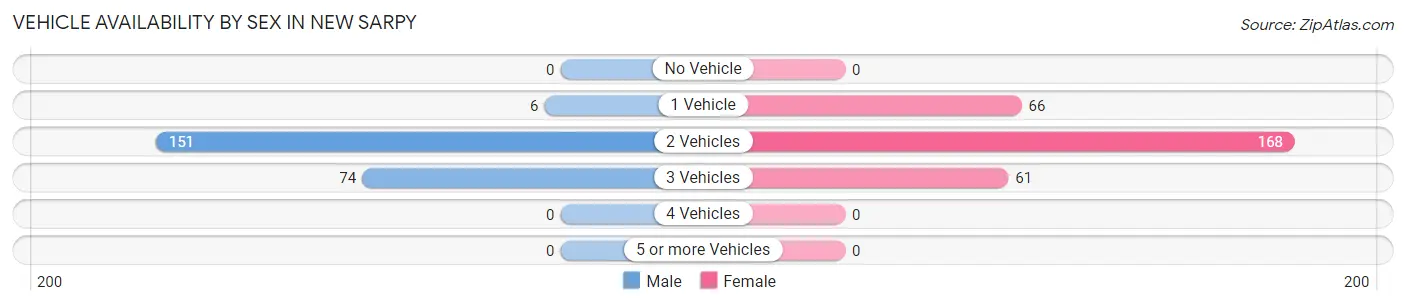
| Vehicles Available | Male | Female |
| No Vehicle | 0 (0.0%) | 0 (0.0%) |
| 1 Vehicle | 6 (2.6%) | 66 (22.4%) |
| 2 Vehicles | 151 (65.4%) | 168 (57.0%) |
| 3 Vehicles | 74 (32.0%) | 61 (20.7%) |
| 4 Vehicles | 0 (0.0%) | 0 (0.0%) |
| 5 or more Vehicles | 0 (0.0%) | 0 (0.0%) |
| Total | 231 (100.0%) | 295 (100.0%) |
Commute Time in New Sarpy
The most frequently occuring commute durations in New Sarpy are 45 to 59 minutes (97 commuters, 19.9%), 15 to 19 minutes (91 commuters, 18.6%), and 30 to 34 minutes (83 commuters, 17.0%).
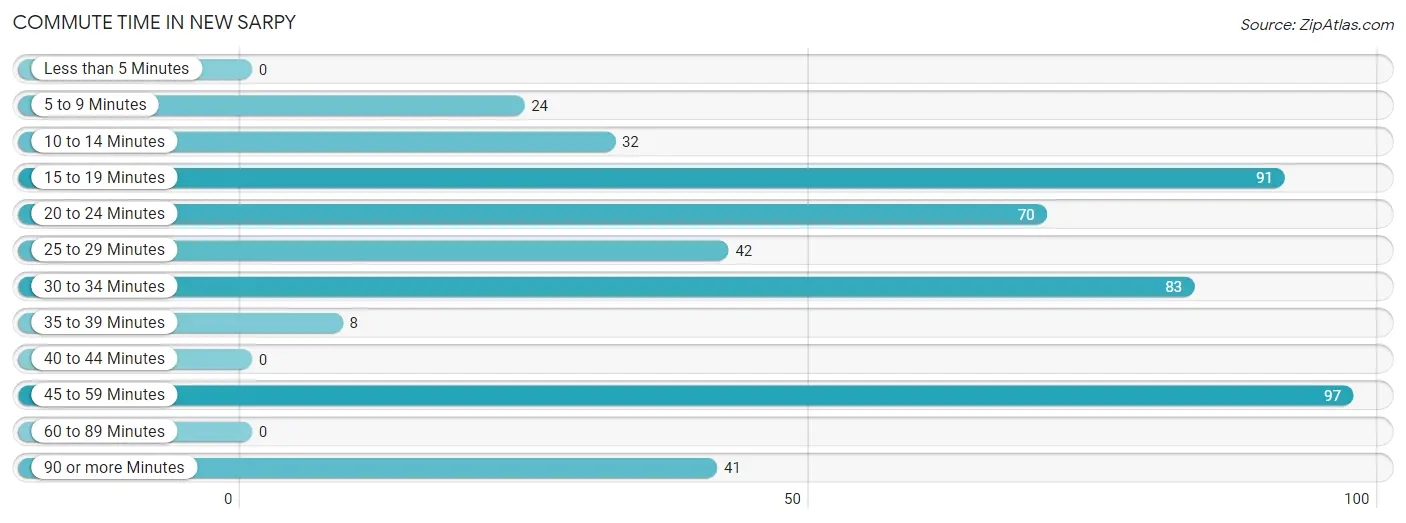
| Commute Time | # Commuters | % Commuters |
| Less than 5 Minutes | 0 | 0.0% |
| 5 to 9 Minutes | 24 | 4.9% |
| 10 to 14 Minutes | 32 | 6.6% |
| 15 to 19 Minutes | 91 | 18.6% |
| 20 to 24 Minutes | 70 | 14.3% |
| 25 to 29 Minutes | 42 | 8.6% |
| 30 to 34 Minutes | 83 | 17.0% |
| 35 to 39 Minutes | 8 | 1.6% |
| 40 to 44 Minutes | 0 | 0.0% |
| 45 to 59 Minutes | 97 | 19.9% |
| 60 to 89 Minutes | 0 | 0.0% |
| 90 or more Minutes | 41 | 8.4% |
Commute Time by Sex in New Sarpy
The most common commute times in New Sarpy are 15 to 19 minutes (63 commuters, 27.3%) for males and 45 to 59 minutes (97 commuters, 37.7%) for females.
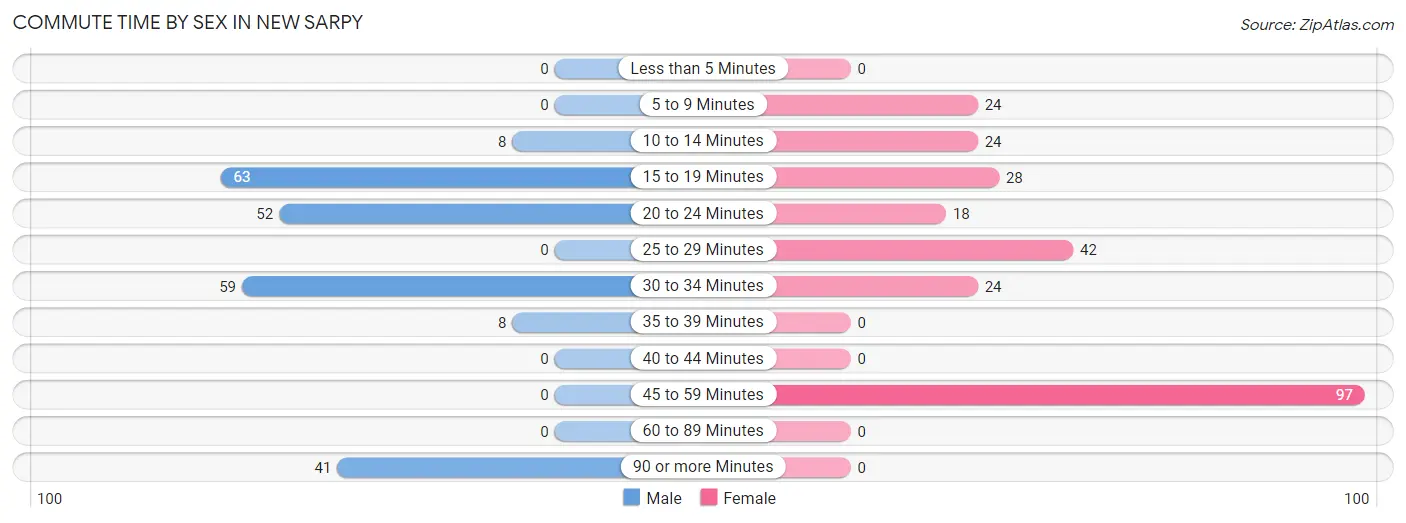
| Commute Time | Male | Female |
| Less than 5 Minutes | 0 (0.0%) | 0 (0.0%) |
| 5 to 9 Minutes | 0 (0.0%) | 24 (9.3%) |
| 10 to 14 Minutes | 8 (3.5%) | 24 (9.3%) |
| 15 to 19 Minutes | 63 (27.3%) | 28 (10.9%) |
| 20 to 24 Minutes | 52 (22.5%) | 18 (7.0%) |
| 25 to 29 Minutes | 0 (0.0%) | 42 (16.3%) |
| 30 to 34 Minutes | 59 (25.5%) | 24 (9.3%) |
| 35 to 39 Minutes | 8 (3.5%) | 0 (0.0%) |
| 40 to 44 Minutes | 0 (0.0%) | 0 (0.0%) |
| 45 to 59 Minutes | 0 (0.0%) | 97 (37.7%) |
| 60 to 89 Minutes | 0 (0.0%) | 0 (0.0%) |
| 90 or more Minutes | 41 (17.7%) | 0 (0.0%) |
Time of Departure to Work by Sex in New Sarpy
The most frequent times of departure to work in New Sarpy are 7:00 AM to 7:29 AM (60, 26.0%) for males and 12:00 AM to 4:59 AM (59, 23.0%) for females.
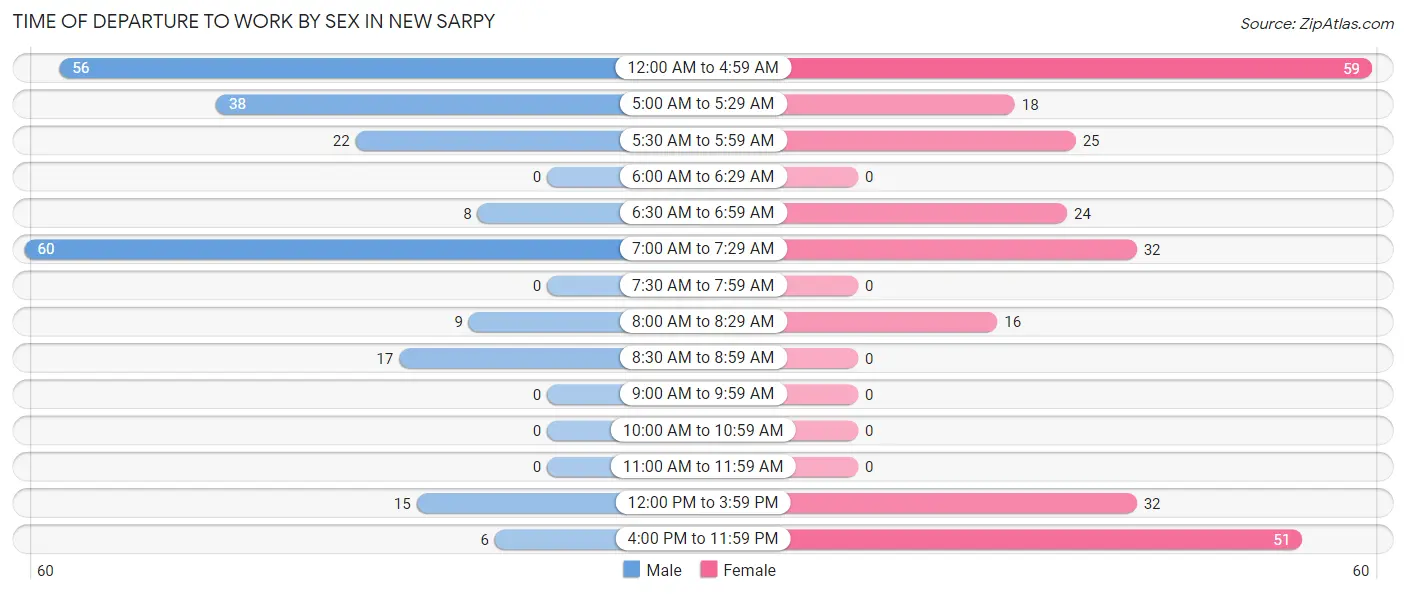
| Time of Departure | Male | Female |
| 12:00 AM to 4:59 AM | 56 (24.2%) | 59 (23.0%) |
| 5:00 AM to 5:29 AM | 38 (16.5%) | 18 (7.0%) |
| 5:30 AM to 5:59 AM | 22 (9.5%) | 25 (9.7%) |
| 6:00 AM to 6:29 AM | 0 (0.0%) | 0 (0.0%) |
| 6:30 AM to 6:59 AM | 8 (3.5%) | 24 (9.3%) |
| 7:00 AM to 7:29 AM | 60 (26.0%) | 32 (12.4%) |
| 7:30 AM to 7:59 AM | 0 (0.0%) | 0 (0.0%) |
| 8:00 AM to 8:29 AM | 9 (3.9%) | 16 (6.2%) |
| 8:30 AM to 8:59 AM | 17 (7.4%) | 0 (0.0%) |
| 9:00 AM to 9:59 AM | 0 (0.0%) | 0 (0.0%) |
| 10:00 AM to 10:59 AM | 0 (0.0%) | 0 (0.0%) |
| 11:00 AM to 11:59 AM | 0 (0.0%) | 0 (0.0%) |
| 12:00 PM to 3:59 PM | 15 (6.5%) | 32 (12.4%) |
| 4:00 PM to 11:59 PM | 6 (2.6%) | 51 (19.8%) |
| Total | 231 (100.0%) | 257 (100.0%) |
Housing Occupancy in New Sarpy
Occupancy by Ownership in New Sarpy
Of the total 424 dwellings in New Sarpy, owner-occupied units account for 304 (71.7%), while renter-occupied units make up 120 (28.3%).
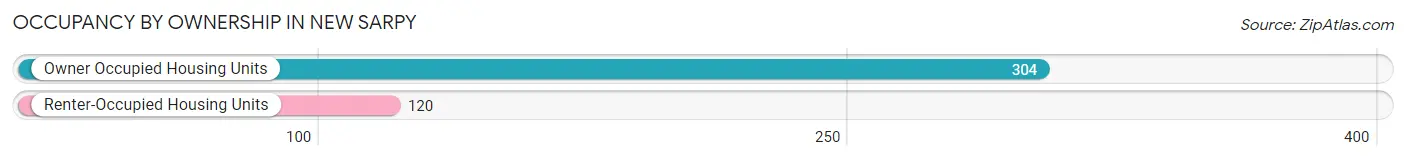
| Occupancy | # Housing Units | % Housing Units |
| Owner Occupied Housing Units | 304 | 71.7% |
| Renter-Occupied Housing Units | 120 | 28.3% |
| Total Occupied Housing Units | 424 | 100.0% |
Occupancy by Household Size in New Sarpy
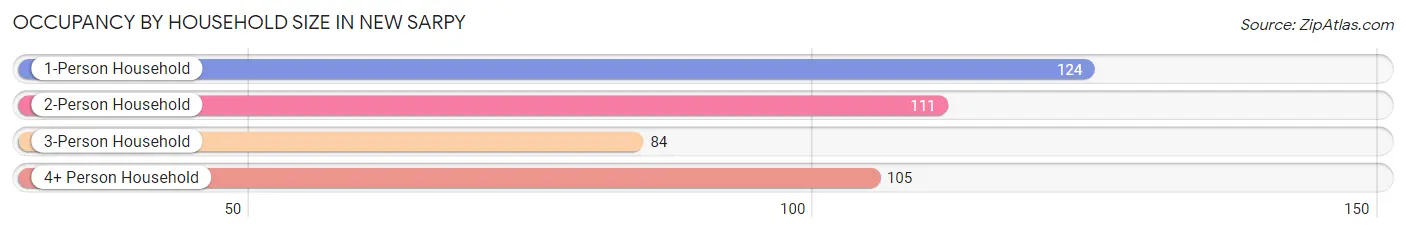
| Household Size | # Housing Units | % Housing Units |
| 1-Person Household | 124 | 29.2% |
| 2-Person Household | 111 | 26.2% |
| 3-Person Household | 84 | 19.8% |
| 4+ Person Household | 105 | 24.8% |
| Total Housing Units | 424 | 100.0% |
Occupancy by Ownership by Household Size in New Sarpy
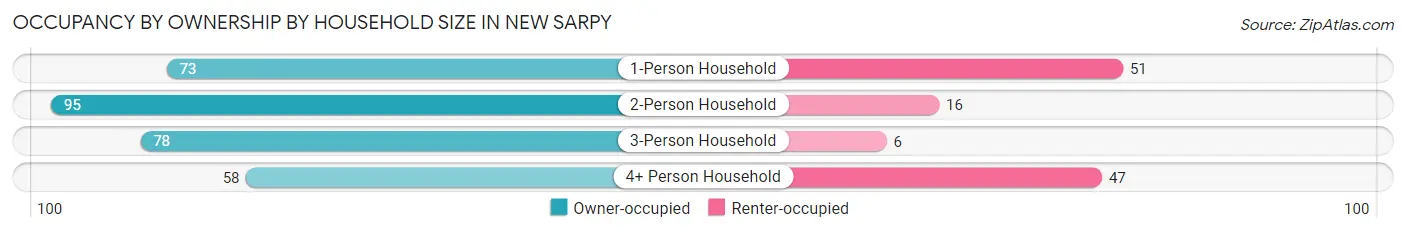
| Household Size | Owner-occupied | Renter-occupied |
| 1-Person Household | 73 (58.9%) | 51 (41.1%) |
| 2-Person Household | 95 (85.6%) | 16 (14.4%) |
| 3-Person Household | 78 (92.9%) | 6 (7.1%) |
| 4+ Person Household | 58 (55.2%) | 47 (44.8%) |
| Total Housing Units | 304 (71.7%) | 120 (28.3%) |
Occupancy by Educational Attainment in New Sarpy
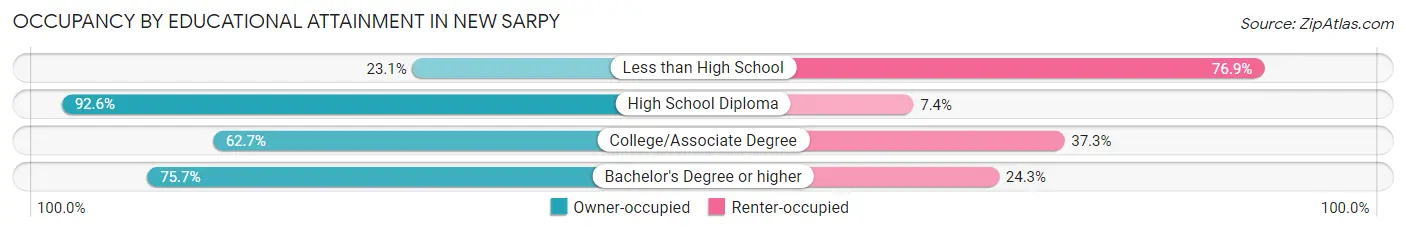
| Household Size | Owner-occupied | Renter-occupied |
| Less than High School | 9 (23.1%) | 30 (76.9%) |
| High School Diploma | 151 (92.6%) | 12 (7.4%) |
| College/Associate Degree | 116 (62.7%) | 69 (37.3%) |
| Bachelor's Degree or higher | 28 (75.7%) | 9 (24.3%) |
Occupancy by Age of Householder in New Sarpy
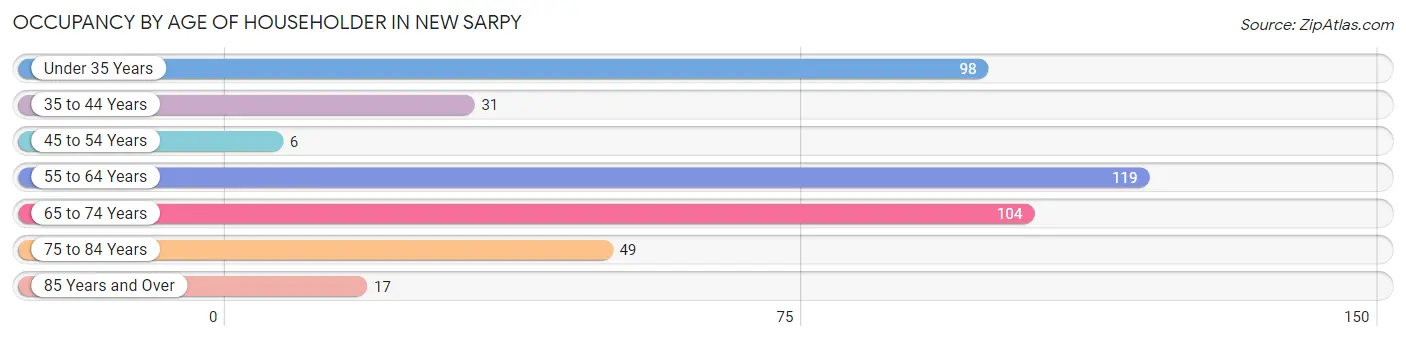
| Age Bracket | # Households | % Households |
| Under 35 Years | 98 | 23.1% |
| 35 to 44 Years | 31 | 7.3% |
| 45 to 54 Years | 6 | 1.4% |
| 55 to 64 Years | 119 | 28.1% |
| 65 to 74 Years | 104 | 24.5% |
| 75 to 84 Years | 49 | 11.6% |
| 85 Years and Over | 17 | 4.0% |
| Total | 424 | 100.0% |
Housing Finances in New Sarpy
Median Income by Occupancy in New Sarpy
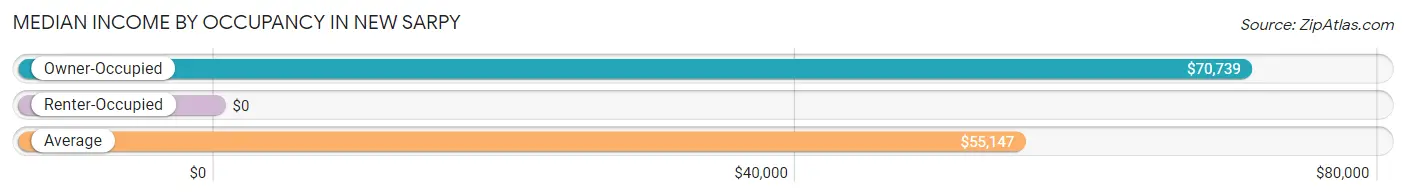
| Occupancy Type | # Households | Median Income |
| Owner-Occupied | 304 (71.7%) | $70,739 |
| Renter-Occupied | 120 (28.3%) | $0 |
| Average | 424 (100.0%) | $55,147 |
Occupancy by Householder Income Bracket in New Sarpy
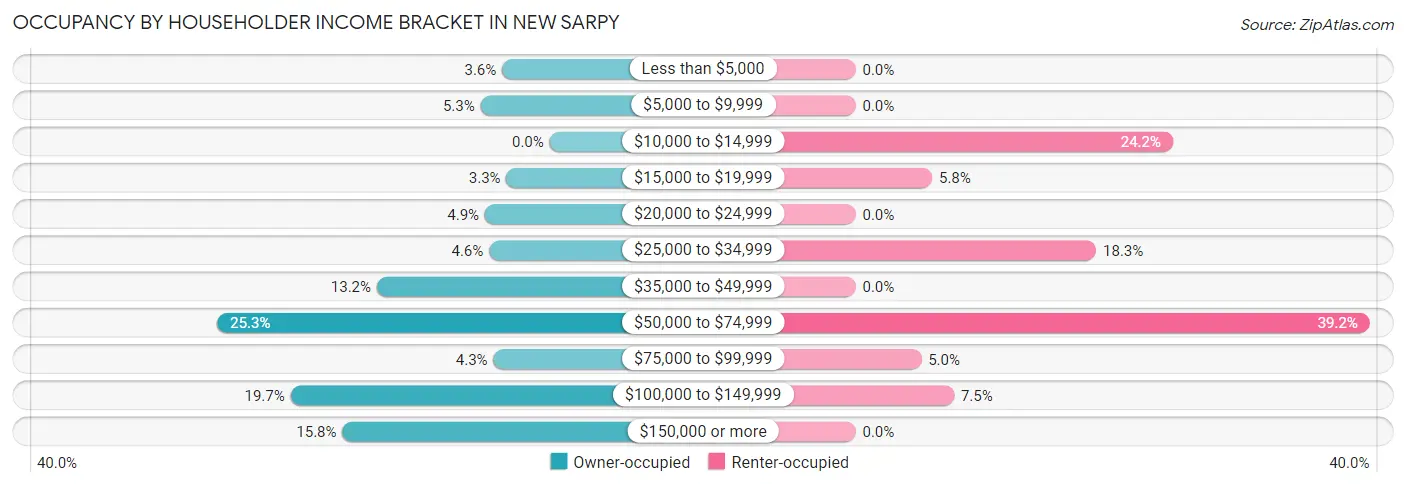
| Income Bracket | Owner-occupied | Renter-occupied |
| Less than $5,000 | 11 (3.6%) | 0 (0.0%) |
| $5,000 to $9,999 | 16 (5.3%) | 0 (0.0%) |
| $10,000 to $14,999 | 0 (0.0%) | 29 (24.2%) |
| $15,000 to $19,999 | 10 (3.3%) | 7 (5.8%) |
| $20,000 to $24,999 | 15 (4.9%) | 0 (0.0%) |
| $25,000 to $34,999 | 14 (4.6%) | 22 (18.3%) |
| $35,000 to $49,999 | 40 (13.2%) | 0 (0.0%) |
| $50,000 to $74,999 | 77 (25.3%) | 47 (39.2%) |
| $75,000 to $99,999 | 13 (4.3%) | 6 (5.0%) |
| $100,000 to $149,999 | 60 (19.7%) | 9 (7.5%) |
| $150,000 or more | 48 (15.8%) | 0 (0.0%) |
| Total | 304 (100.0%) | 120 (100.0%) |
Monthly Housing Cost Tiers in New Sarpy
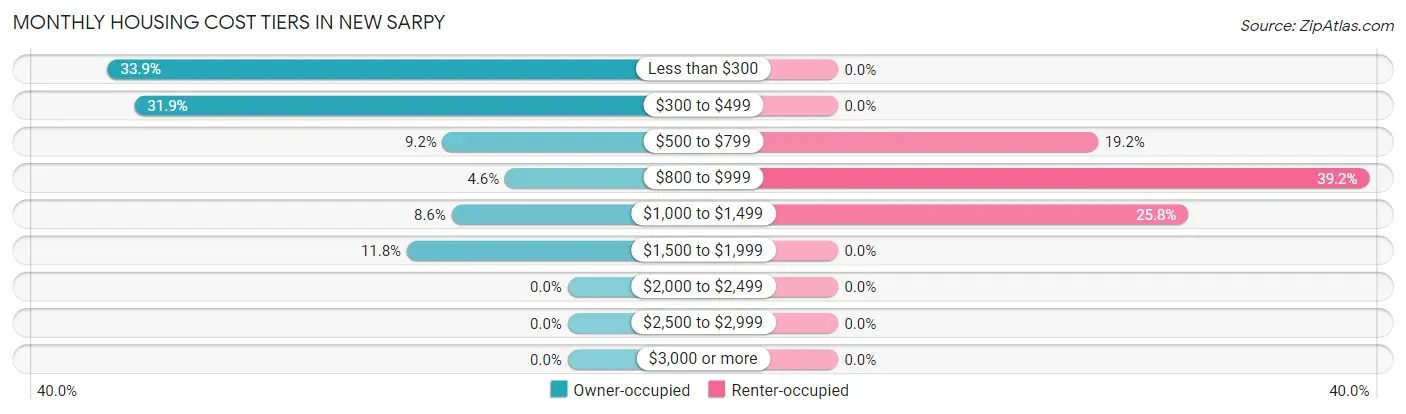
| Monthly Cost | Owner-occupied | Renter-occupied |
| Less than $300 | 103 (33.9%) | 0 (0.0%) |
| $300 to $499 | 97 (31.9%) | 0 (0.0%) |
| $500 to $799 | 28 (9.2%) | 23 (19.2%) |
| $800 to $999 | 14 (4.6%) | 47 (39.2%) |
| $1,000 to $1,499 | 26 (8.6%) | 31 (25.8%) |
| $1,500 to $1,999 | 36 (11.8%) | 0 (0.0%) |
| $2,000 to $2,499 | 0 (0.0%) | 0 (0.0%) |
| $2,500 to $2,999 | 0 (0.0%) | 0 (0.0%) |
| $3,000 or more | 0 (0.0%) | 0 (0.0%) |
| Total | 304 (100.0%) | 120 (100.0%) |
Physical Housing Characteristics in New Sarpy
Housing Structures in New Sarpy
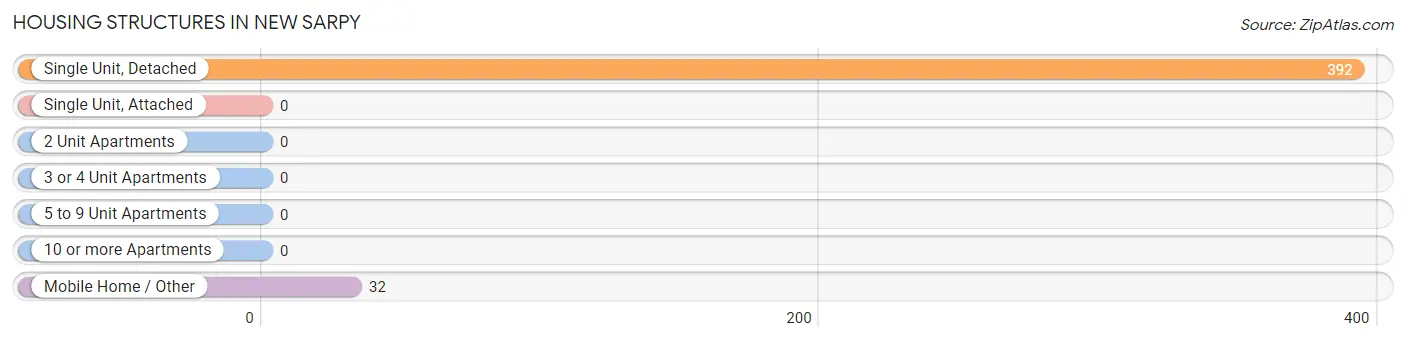
| Structure Type | # Housing Units | % Housing Units |
| Single Unit, Detached | 392 | 92.4% |
| Single Unit, Attached | 0 | 0.0% |
| 2 Unit Apartments | 0 | 0.0% |
| 3 or 4 Unit Apartments | 0 | 0.0% |
| 5 to 9 Unit Apartments | 0 | 0.0% |
| 10 or more Apartments | 0 | 0.0% |
| Mobile Home / Other | 32 | 7.5% |
| Total | 424 | 100.0% |
Housing Structures by Occupancy in New Sarpy
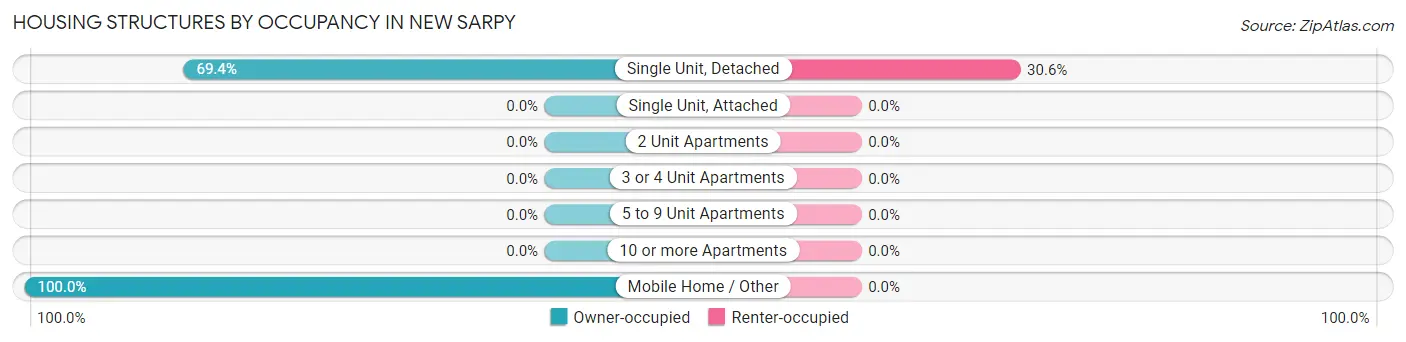
| Structure Type | Owner-occupied | Renter-occupied |
| Single Unit, Detached | 272 (69.4%) | 120 (30.6%) |
| Single Unit, Attached | 0 (0.0%) | 0 (0.0%) |
| 2 Unit Apartments | 0 (0.0%) | 0 (0.0%) |
| 3 or 4 Unit Apartments | 0 (0.0%) | 0 (0.0%) |
| 5 to 9 Unit Apartments | 0 (0.0%) | 0 (0.0%) |
| 10 or more Apartments | 0 (0.0%) | 0 (0.0%) |
| Mobile Home / Other | 32 (100.0%) | 0 (0.0%) |
| Total | 304 (71.7%) | 120 (28.3%) |
Housing Structures by Number of Rooms in New Sarpy
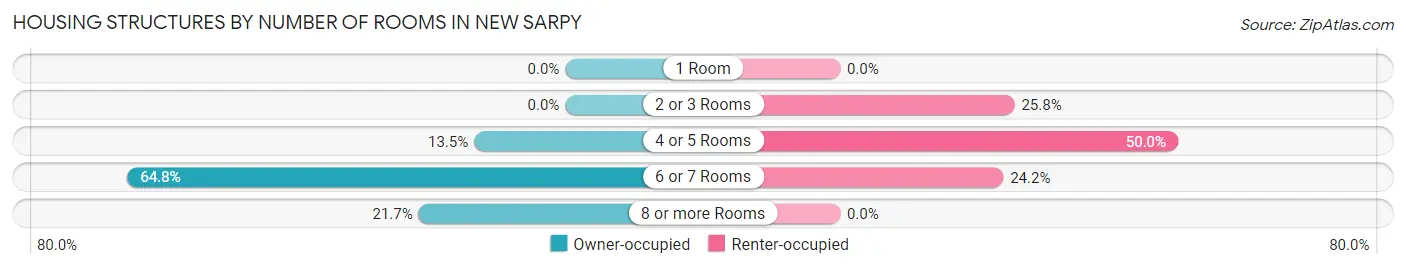
| Number of Rooms | Owner-occupied | Renter-occupied |
| 1 Room | 0 (0.0%) | 0 (0.0%) |
| 2 or 3 Rooms | 0 (0.0%) | 31 (25.8%) |
| 4 or 5 Rooms | 41 (13.5%) | 60 (50.0%) |
| 6 or 7 Rooms | 197 (64.8%) | 29 (24.2%) |
| 8 or more Rooms | 66 (21.7%) | 0 (0.0%) |
| Total | 304 (100.0%) | 120 (100.0%) |
Housing Structure by Heating Type in New Sarpy
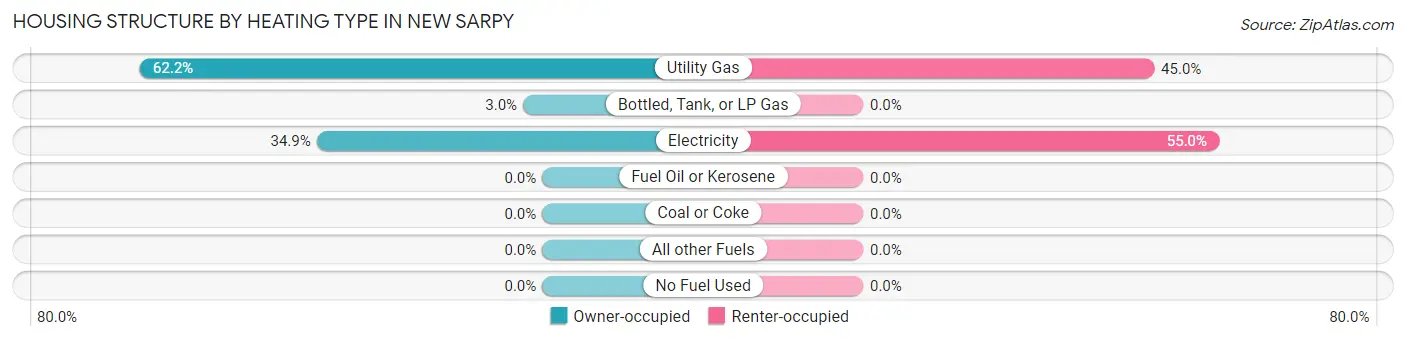
| Heating Type | Owner-occupied | Renter-occupied |
| Utility Gas | 189 (62.2%) | 54 (45.0%) |
| Bottled, Tank, or LP Gas | 9 (3.0%) | 0 (0.0%) |
| Electricity | 106 (34.9%) | 66 (55.0%) |
| Fuel Oil or Kerosene | 0 (0.0%) | 0 (0.0%) |
| Coal or Coke | 0 (0.0%) | 0 (0.0%) |
| All other Fuels | 0 (0.0%) | 0 (0.0%) |
| No Fuel Used | 0 (0.0%) | 0 (0.0%) |
| Total | 304 (100.0%) | 120 (100.0%) |
Household Vehicle Usage in New Sarpy
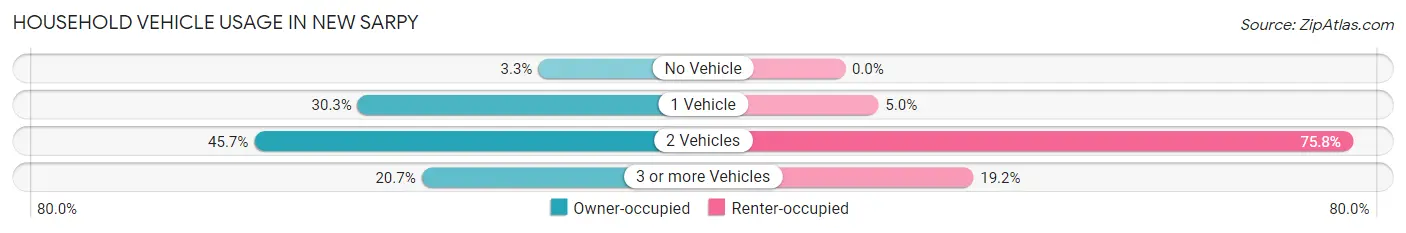
| Vehicles per Household | Owner-occupied | Renter-occupied |
| No Vehicle | 10 (3.3%) | 0 (0.0%) |
| 1 Vehicle | 92 (30.3%) | 6 (5.0%) |
| 2 Vehicles | 139 (45.7%) | 91 (75.8%) |
| 3 or more Vehicles | 63 (20.7%) | 23 (19.2%) |
| Total | 304 (100.0%) | 120 (100.0%) |
Real Estate & Mortgages in New Sarpy
Real Estate and Mortgage Overview in New Sarpy
| Characteristic | Without Mortgage | With Mortgage |
| Housing Units | 248 | 56 |
| Median Property Value | $123,400 | $218,900 |
| Median Household Income | $61,875 | $0 |
| Monthly Housing Costs | $380 | $0 |
| Real Estate Taxes | - | - |
Property Value by Mortgage Status in New Sarpy
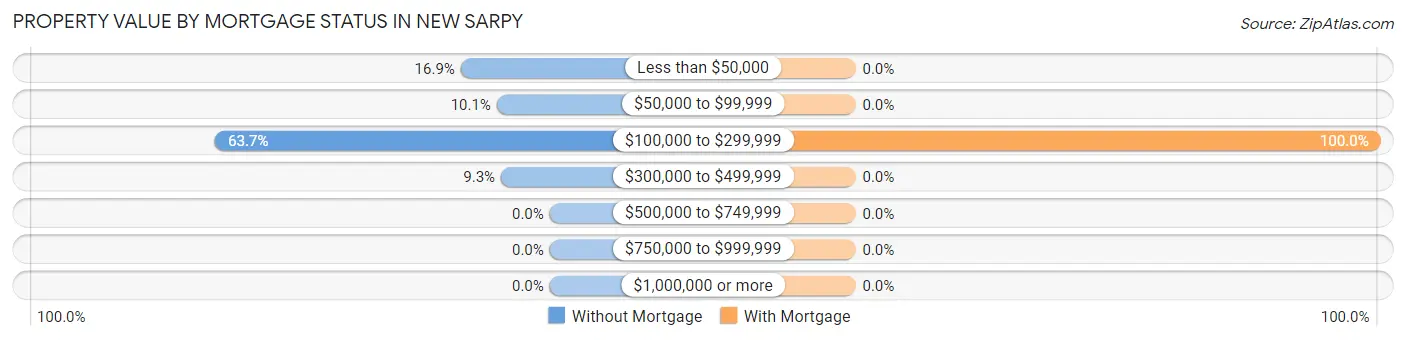
| Property Value | Without Mortgage | With Mortgage |
| Less than $50,000 | 42 (16.9%) | 0 (0.0%) |
| $50,000 to $99,999 | 25 (10.1%) | 0 (0.0%) |
| $100,000 to $299,999 | 158 (63.7%) | 56 (100.0%) |
| $300,000 to $499,999 | 23 (9.3%) | 0 (0.0%) |
| $500,000 to $749,999 | 0 (0.0%) | 0 (0.0%) |
| $750,000 to $999,999 | 0 (0.0%) | 0 (0.0%) |
| $1,000,000 or more | 0 (0.0%) | 0 (0.0%) |
| Total | 248 (100.0%) | 56 (100.0%) |
Household Income by Mortgage Status in New Sarpy
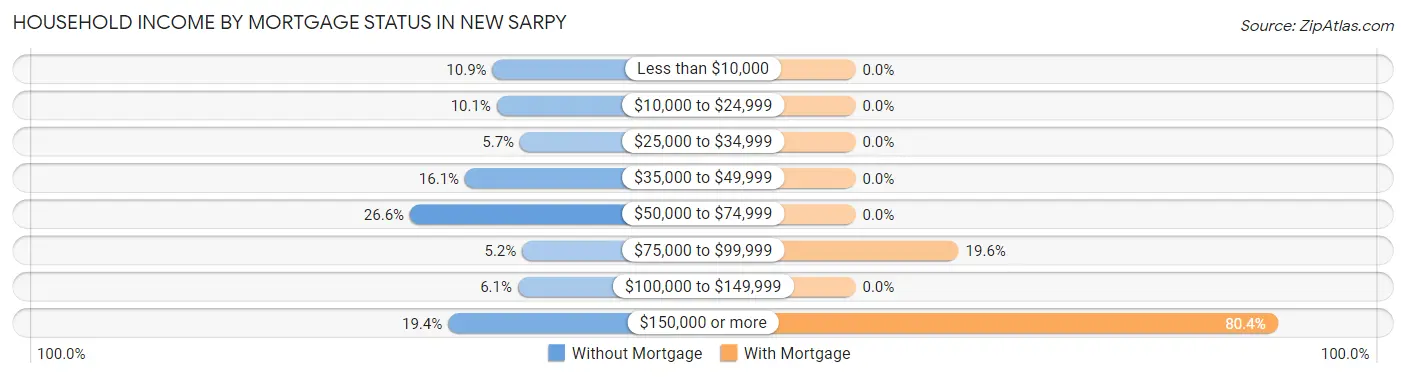
| Household Income | Without Mortgage | With Mortgage |
| Less than $10,000 | 27 (10.9%) | 0 (0.0%) |
| $10,000 to $24,999 | 25 (10.1%) | 0 (0.0%) |
| $25,000 to $34,999 | 14 (5.7%) | 0 (0.0%) |
| $35,000 to $49,999 | 40 (16.1%) | 0 (0.0%) |
| $50,000 to $74,999 | 66 (26.6%) | 0 (0.0%) |
| $75,000 to $99,999 | 13 (5.2%) | 11 (19.6%) |
| $100,000 to $149,999 | 15 (6.0%) | 0 (0.0%) |
| $150,000 or more | 48 (19.4%) | 45 (80.4%) |
| Total | 248 (100.0%) | 56 (100.0%) |
Property Value to Household Income Ratio in New Sarpy
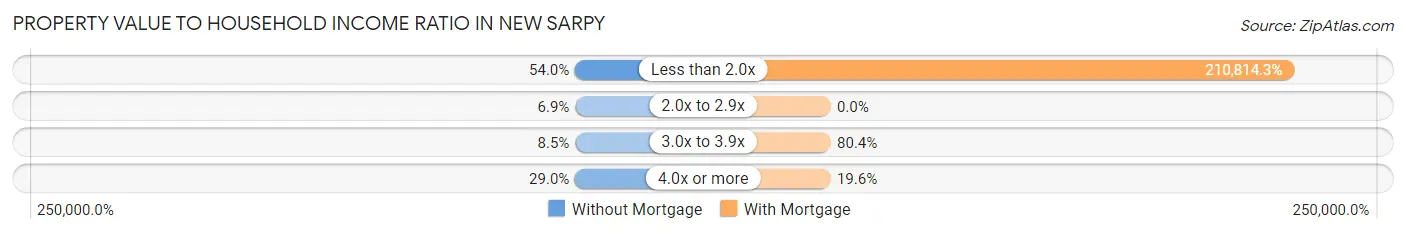
| Value-to-Income Ratio | Without Mortgage | With Mortgage |
| Less than 2.0x | 134 (54.0%) | 118,056 (210,814.3%) |
| 2.0x to 2.9x | 17 (6.9%) | 0 (0.0%) |
| 3.0x to 3.9x | 21 (8.5%) | 45 (80.4%) |
| 4.0x or more | 72 (29.0%) | 11 (19.6%) |
| Total | 248 (100.0%) | 56 (100.0%) |
Real Estate Taxes by Mortgage Status in New Sarpy
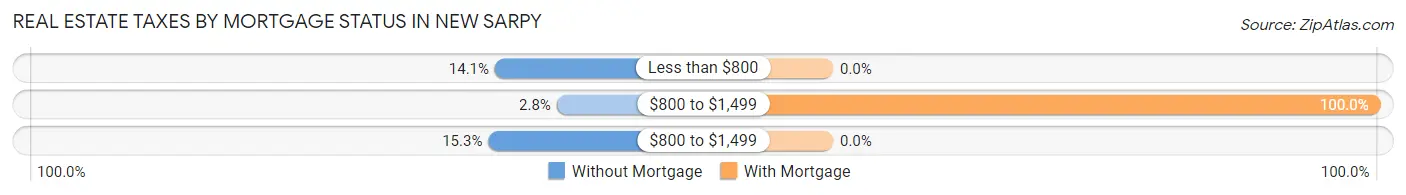
| Property Taxes | Without Mortgage | With Mortgage |
| Less than $800 | 35 (14.1%) | 0 (0.0%) |
| $800 to $1,499 | 7 (2.8%) | 56 (100.0%) |
| $800 to $1,499 | 38 (15.3%) | 0 (0.0%) |
| Total | 248 (100.0%) | 56 (100.0%) |
Health & Disability in New Sarpy
Health Insurance Coverage by Age in New Sarpy
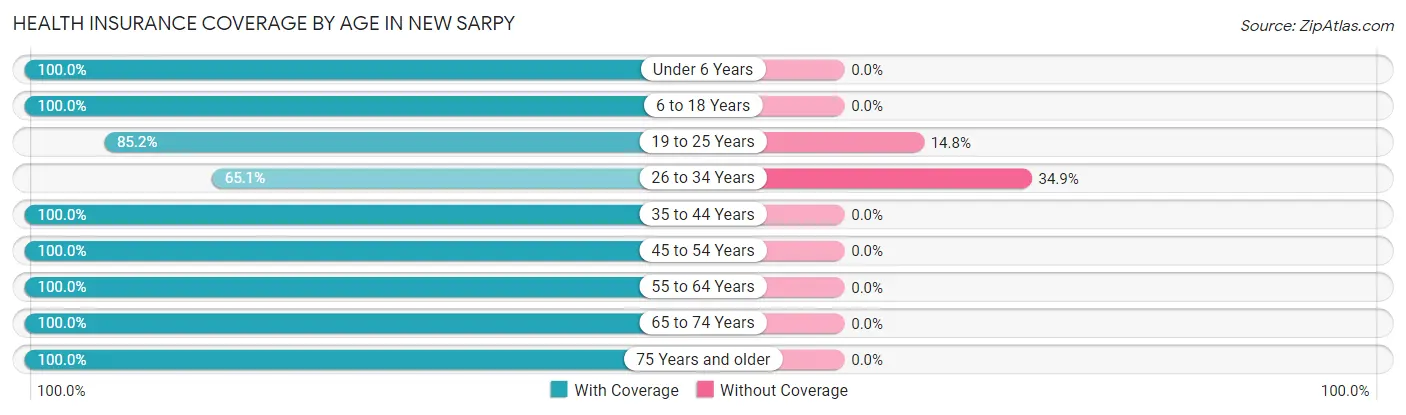
| Age Bracket | With Coverage | Without Coverage |
| Under 6 Years | 105 (100.0%) | 0 (0.0%) |
| 6 to 18 Years | 189 (100.0%) | 0 (0.0%) |
| 19 to 25 Years | 23 (85.2%) | 4 (14.8%) |
| 26 to 34 Years | 123 (65.1%) | 66 (34.9%) |
| 35 to 44 Years | 160 (100.0%) | 0 (0.0%) |
| 45 to 54 Years | 30 (100.0%) | 0 (0.0%) |
| 55 to 64 Years | 128 (100.0%) | 0 (0.0%) |
| 65 to 74 Years | 194 (100.0%) | 0 (0.0%) |
| 75 Years and older | 118 (100.0%) | 0 (0.0%) |
| Total | 1,070 (93.9%) | 70 (6.1%) |
Health Insurance Coverage by Citizenship Status in New Sarpy
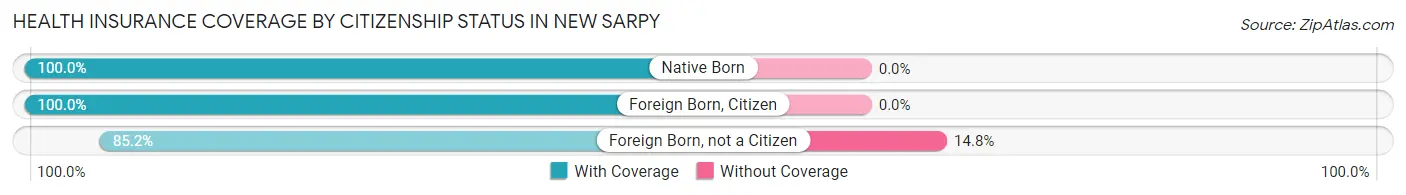
| Citizenship Status | With Coverage | Without Coverage |
| Native Born | 105 (100.0%) | 0 (0.0%) |
| Foreign Born, Citizen | 189 (100.0%) | 0 (0.0%) |
| Foreign Born, not a Citizen | 23 (85.2%) | 4 (14.8%) |
Health Insurance Coverage by Household Income in New Sarpy
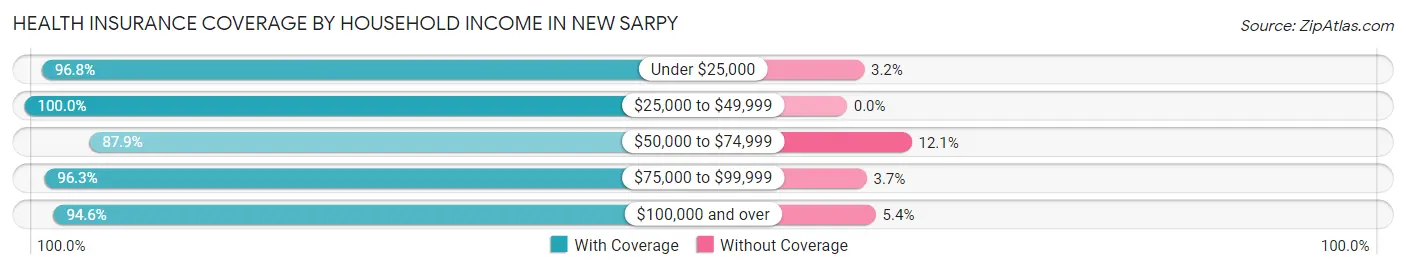
| Household Income | With Coverage | Without Coverage |
| Under $25,000 | 120 (96.8%) | 4 (3.2%) |
| $25,000 to $49,999 | 182 (100.0%) | 0 (0.0%) |
| $50,000 to $74,999 | 297 (87.9%) | 41 (12.1%) |
| $75,000 to $99,999 | 104 (96.3%) | 4 (3.7%) |
| $100,000 and over | 367 (94.6%) | 21 (5.4%) |
Public vs Private Health Insurance Coverage by Age in New Sarpy
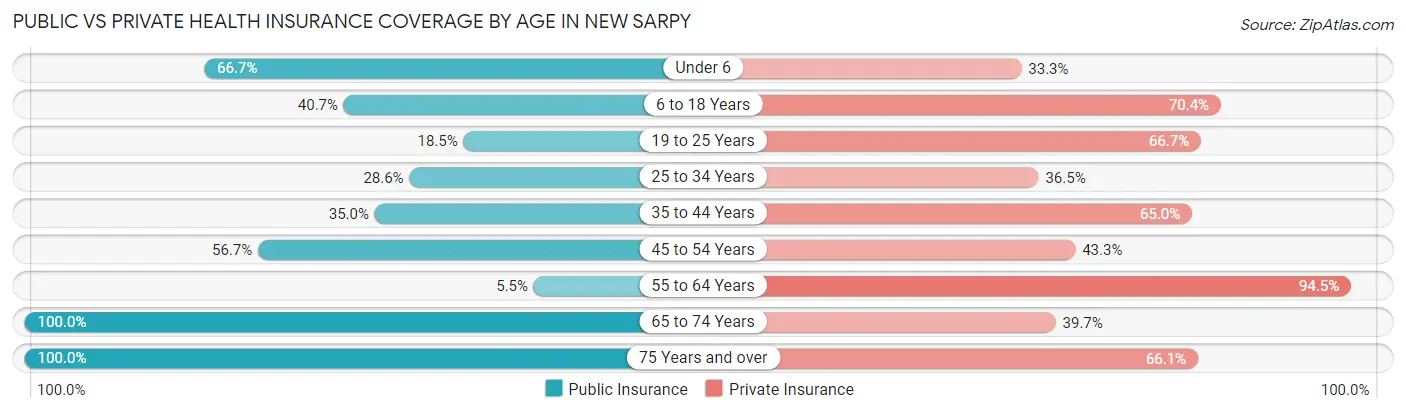
| Age Bracket | Public Insurance | Private Insurance |
| Under 6 | 70 (66.7%) | 35 (33.3%) |
| 6 to 18 Years | 77 (40.7%) | 133 (70.4%) |
| 19 to 25 Years | 5 (18.5%) | 18 (66.7%) |
| 25 to 34 Years | 54 (28.6%) | 69 (36.5%) |
| 35 to 44 Years | 56 (35.0%) | 104 (65.0%) |
| 45 to 54 Years | 17 (56.7%) | 13 (43.3%) |
| 55 to 64 Years | 7 (5.5%) | 121 (94.5%) |
| 65 to 74 Years | 194 (100.0%) | 77 (39.7%) |
| 75 Years and over | 118 (100.0%) | 78 (66.1%) |
| Total | 598 (52.5%) | 648 (56.8%) |
Disability Status by Sex by Age in New Sarpy
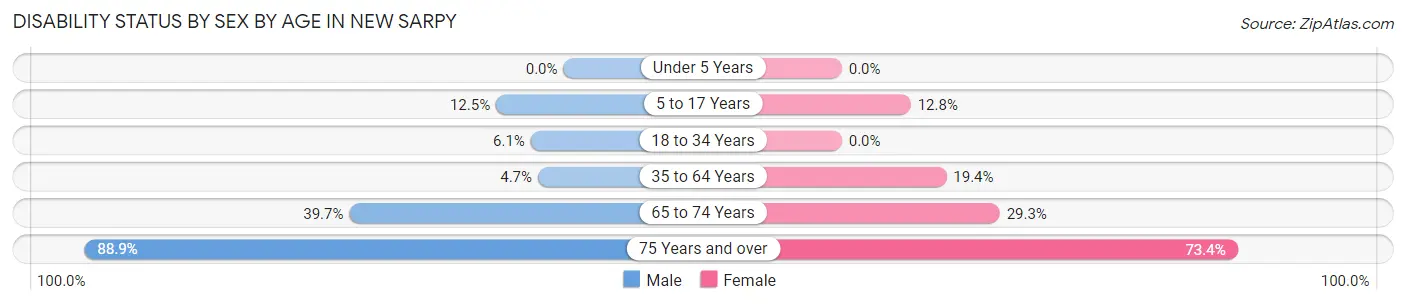
| Age Bracket | Male | Female |
| Under 5 Years | 0 (0.0%) | 0 (0.0%) |
| 5 to 17 Years | 8 (12.5%) | 16 (12.8%) |
| 18 to 34 Years | 4 (6.1%) | 0 (0.0%) |
| 35 to 64 Years | 7 (4.7%) | 33 (19.4%) |
| 65 to 74 Years | 31 (39.7%) | 34 (29.3%) |
| 75 Years and over | 48 (88.9%) | 47 (73.4%) |
Disability Class by Sex by Age in New Sarpy
Disability Class: Hearing Difficulty
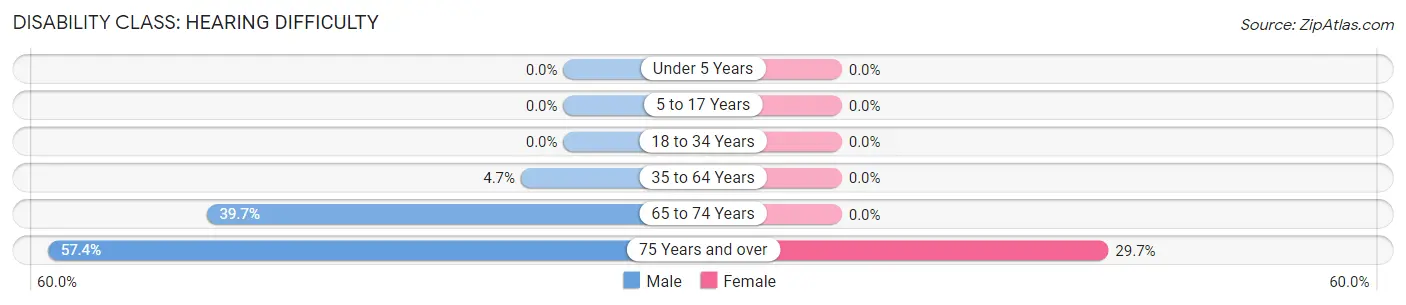
| Age Bracket | Male | Female |
| Under 5 Years | 0 (0.0%) | 0 (0.0%) |
| 5 to 17 Years | 0 (0.0%) | 0 (0.0%) |
| 18 to 34 Years | 0 (0.0%) | 0 (0.0%) |
| 35 to 64 Years | 7 (4.7%) | 0 (0.0%) |
| 65 to 74 Years | 31 (39.7%) | 0 (0.0%) |
| 75 Years and over | 31 (57.4%) | 19 (29.7%) |
Disability Class: Vision Difficulty
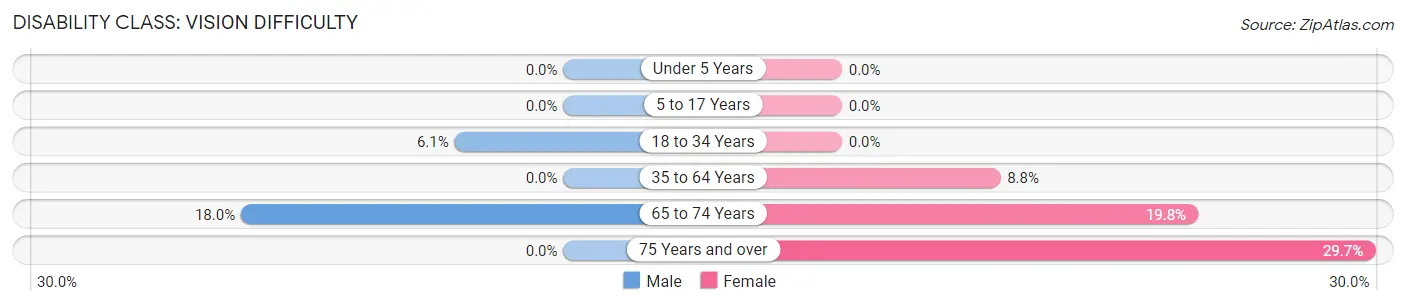
| Age Bracket | Male | Female |
| Under 5 Years | 0 (0.0%) | 0 (0.0%) |
| 5 to 17 Years | 0 (0.0%) | 0 (0.0%) |
| 18 to 34 Years | 4 (6.1%) | 0 (0.0%) |
| 35 to 64 Years | 0 (0.0%) | 15 (8.8%) |
| 65 to 74 Years | 14 (17.9%) | 23 (19.8%) |
| 75 Years and over | 0 (0.0%) | 19 (29.7%) |
Disability Class: Cognitive Difficulty

| Age Bracket | Male | Female |
| 5 to 17 Years | 8 (12.5%) | 16 (12.8%) |
| 18 to 34 Years | 0 (0.0%) | 0 (0.0%) |
| 35 to 64 Years | 0 (0.0%) | 0 (0.0%) |
| 65 to 74 Years | 14 (17.9%) | 11 (9.5%) |
| 75 Years and over | 0 (0.0%) | 25 (39.1%) |
Disability Class: Ambulatory Difficulty
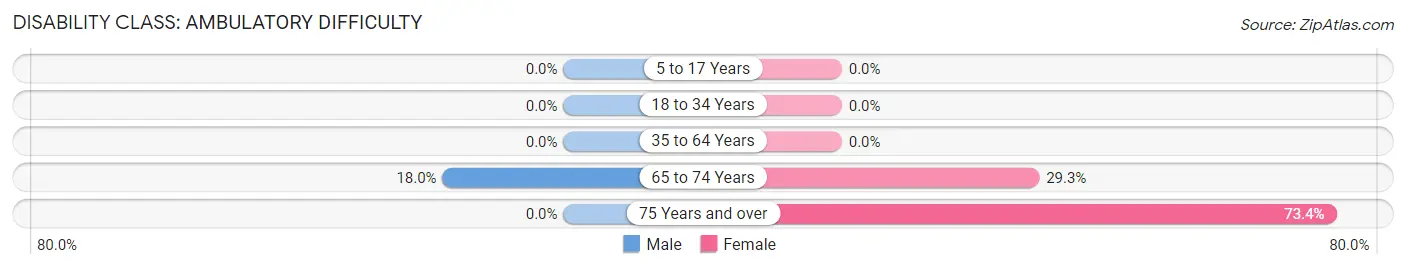
| Age Bracket | Male | Female |
| 5 to 17 Years | 0 (0.0%) | 0 (0.0%) |
| 18 to 34 Years | 0 (0.0%) | 0 (0.0%) |
| 35 to 64 Years | 0 (0.0%) | 0 (0.0%) |
| 65 to 74 Years | 14 (17.9%) | 34 (29.3%) |
| 75 Years and over | 0 (0.0%) | 47 (73.4%) |
Disability Class: Self-Care Difficulty
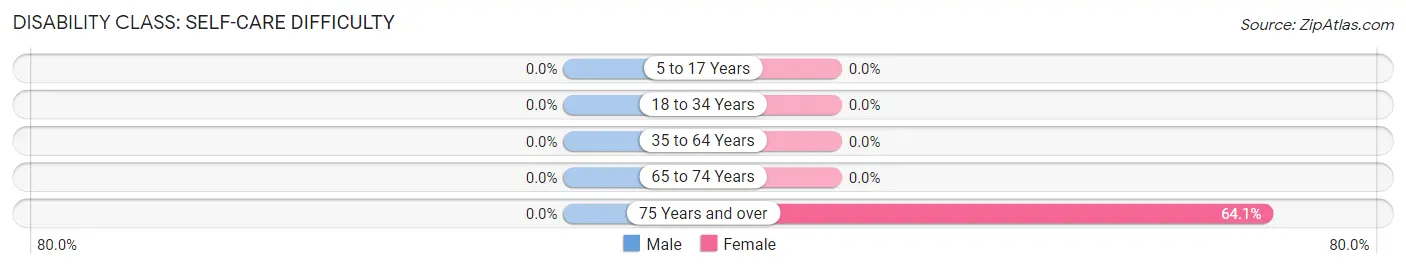
| Age Bracket | Male | Female |
| 5 to 17 Years | 0 (0.0%) | 0 (0.0%) |
| 18 to 34 Years | 0 (0.0%) | 0 (0.0%) |
| 35 to 64 Years | 0 (0.0%) | 0 (0.0%) |
| 65 to 74 Years | 0 (0.0%) | 0 (0.0%) |
| 75 Years and over | 0 (0.0%) | 41 (64.1%) |
Technology Access in New Sarpy
Computing Device Access in New Sarpy
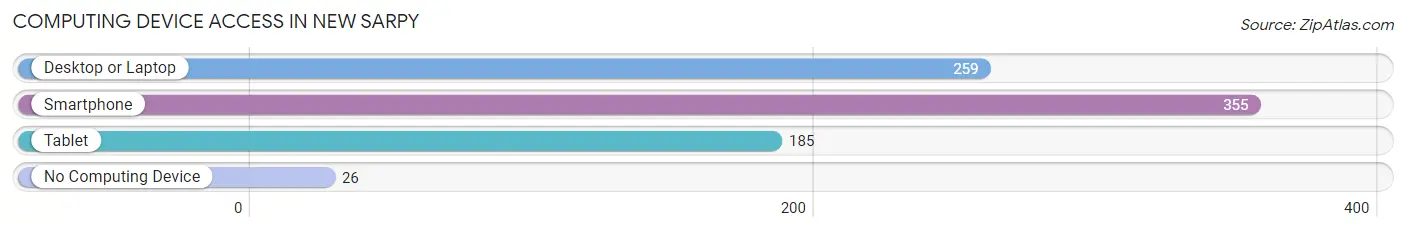
| Device Type | # Households | % Households |
| Desktop or Laptop | 259 | 61.1% |
| Smartphone | 355 | 83.7% |
| Tablet | 185 | 43.6% |
| No Computing Device | 26 | 6.1% |
| Total | 424 | 100.0% |
Internet Access in New Sarpy
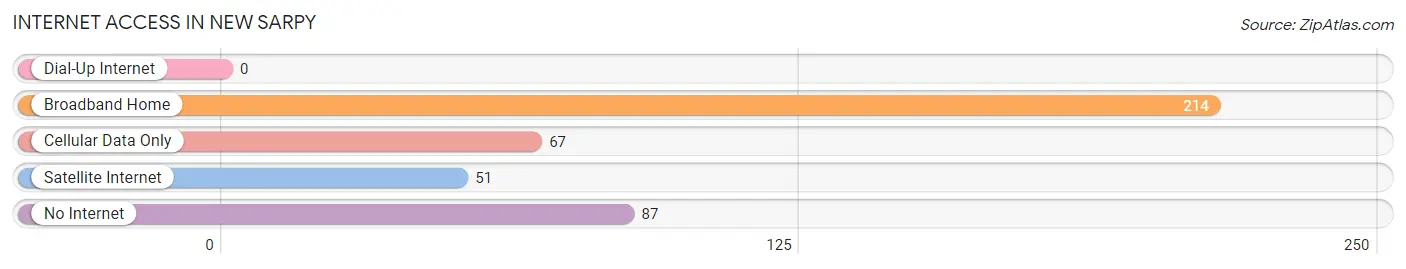
| Internet Type | # Households | % Households |
| Dial-Up Internet | 0 | 0.0% |
| Broadband Home | 214 | 50.5% |
| Cellular Data Only | 67 | 15.8% |
| Satellite Internet | 51 | 12.0% |
| No Internet | 87 | 20.5% |
| Total | 424 | 100.0% |
New Sarpy Summary
Sarpy County, Nebraska is located in the southeastern corner of the state, just south of Omaha. It is bordered by Cass County to the north, Douglas County to the east, and Saunders County to the south. The county seat is Papillion, and the county is named after Peter Sarpy, a fur trader and early settler in the area.
History
The area that is now Sarpy County was originally inhabited by the Omaha and Pawnee tribes. The first Europeans to settle in the area were French fur traders, who established trading posts in the area in the early 1800s. In 1854, the Nebraska Territory was created, and Sarpy County was established in 1857.
The county was named after Peter Sarpy, a French-Canadian fur trader who had established a trading post in the area in 1822. He was also a prominent figure in the early development of the area, and was instrumental in the establishment of the first post office in the county.
In the late 1800s, the county experienced a period of rapid growth, as settlers moved into the area to take advantage of the fertile soil and abundant natural resources. The county was also home to several small towns, including Papillion, La Vista, and Bellevue.
Geography
Sarpy County covers an area of 545 square miles, and is located in the southeastern corner of Nebraska. It is bordered by Cass County to the north, Douglas County to the east, and Saunders County to the south. The county seat is Papillion, and the county is named after Peter Sarpy, a fur trader and early settler in the area.
The county is mostly flat, with some rolling hills in the northern and western parts. The Platte River runs through the county, and there are several small lakes and ponds scattered throughout the area. The county is also home to several state parks, including Platte River State Park and Two Rivers State Recreation Area.
Economy
Sarpy County has a diverse economy, with a mix of agriculture, manufacturing, and services. The county is home to several large employers, including the Offutt Air Force Base, the University of Nebraska Medical Center, and the Nebraska State Penitentiary.
Agriculture is an important part of the county’s economy, with corn, soybeans, and wheat being the main crops. Livestock production is also important, with cattle, hogs, and poultry being the main animals raised.
Manufacturing is also an important part of the county’s economy, with several large companies located in the area. These include ConAgra Foods, Cargill, and Union Pacific Railroad.
Demographics
As of the 2010 census, Sarpy County had a population of 156,760. The population is fairly evenly split between men and women, with 50.3% of the population being male and 49.7% being female. The median age of the population is 35.7 years, and the median household income is $68,945.
The largest racial group in the county is white, making up 84.3% of the population. The next largest group is Hispanic or Latino, making up 8.3% of the population. Other racial groups include African American (3.7%), Asian (2.2%), and Native American (0.7%).
Conclusion
Sarpy County is a diverse and vibrant county located in the southeastern corner of Nebraska. It is home to a mix of agriculture, manufacturing, and services, and has a population of 156,760. The county is also home to several large employers, including the Offutt Air Force Base, the University of Nebraska Medical Center, and the Nebraska State Penitentiary. The largest racial group in the county is white, making up 84.3% of the population, followed by Hispanic or Latino (8.3%), African American (3.7%), Asian (2.2%), and Native American (0.7%).
Common Questions
What is Per Capita Income in New Sarpy?
Per Capita income in New Sarpy is $28,699.
What is the Median Family Income in New Sarpy?
Median Family Income in New Sarpy is $54,787.
What is the Median Household income in New Sarpy?
Median Household Income in New Sarpy is $55,147.
What is Income or Wage Gap in New Sarpy?
Income or Wage Gap in New Sarpy is 11.9%.
Women in New Sarpy earn 88.1 cents for every dollar earned by a man.
What is Inequality or Gini Index in New Sarpy?
Inequality or Gini Index in New Sarpy is 0.40.
What is the Total Population of New Sarpy?
Total Population of New Sarpy is 1,140.
What is the Total Male Population of New Sarpy?
Total Male Population of New Sarpy is 445.
What is the Total Female Population of New Sarpy?
Total Female Population of New Sarpy is 695.
What is the Ratio of Males per 100 Females in New Sarpy?
There are 64.03 Males per 100 Females in New Sarpy.
What is the Ratio of Females per 100 Males in New Sarpy?
There are 156.18 Females per 100 Males in New Sarpy.
What is the Median Population Age in New Sarpy?
Median Population Age in New Sarpy is 37.4 Years.
What is the Average Family Size in New Sarpy
Average Family Size in New Sarpy is 3.2 People.
What is the Average Household Size in New Sarpy
Average Household Size in New Sarpy is 2.7 People.
How Large is the Labor Force in New Sarpy?
There are 554 People in the Labor Forcein in New Sarpy.
What is the Percentage of People in the Labor Force in New Sarpy?
63.5% of People are in the Labor Force in New Sarpy.
What is the Unemployment Rate in New Sarpy?
Unemployment Rate in New Sarpy is 5.1%.