Westlake, LA Map & Demographics
Westlake Map
Westlake Overview
$32,083
PER CAPITA INCOME
$66,967
AVG FAMILY INCOME
$63,841
AVG HOUSEHOLD INCOME
38.8%
WAGE / INCOME GAP [ % ]
61.2¢/ $1
WAGE / INCOME GAP [ $ ]
$12,193
FAMILY INCOME DEFICIT
0.37
INEQUALITY / GINI INDEX
4,847
TOTAL POPULATION
2,595
MALE POPULATION
2,252
FEMALE POPULATION
115.23
MALES / 100 FEMALES
86.78
FEMALES / 100 MALES
37.8
MEDIAN AGE
3.0
AVG FAMILY SIZE
2.4
AVG HOUSEHOLD SIZE
2,217
LABOR FORCE [ PEOPLE ]
56.2%
PERCENT IN LABOR FORCE
1.0%
UNEMPLOYMENT RATE
Westlake Zip Codes
Westlake Area Codes
Income in Westlake
Income Overview in Westlake
Per Capita Income in Westlake is $32,083, while median incomes of families and households are $66,967 and $63,841 respectively.
| Characteristic | Number | Measure |
| Per Capita Income | 4,847 | $32,083 |
| Median Family Income | 1,328 | $66,967 |
| Mean Family Income | 1,328 | $86,351 |
| Median Household Income | 2,061 | $63,841 |
| Mean Household Income | 2,061 | $71,619 |
| Income Deficit | 1,328 | $12,193 |
| Wage / Income Gap (%) | 4,847 | 38.80% |
| Wage / Income Gap ($) | 4,847 | 61.20¢ per $1 |
| Gini / Inequality Index | 4,847 | 0.37 |
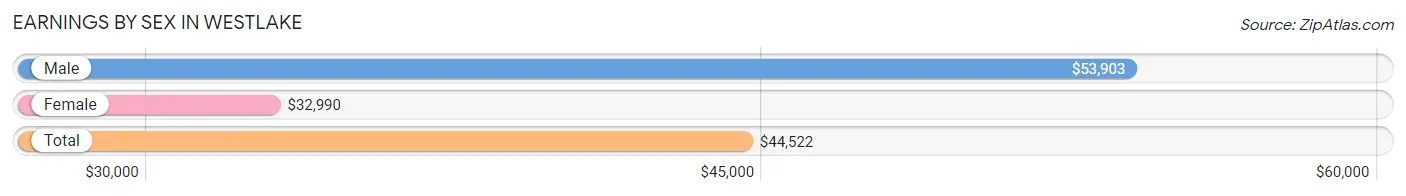
Earnings by Sex in Westlake
Average Earnings in Westlake are $44,522, $53,903 for men and $32,990 for women, a difference of 38.8%.
| Sex | Number | Average Earnings |
| Male | 1,331 (59.2%) | $53,903 |
| Female | 917 (40.8%) | $32,990 |
| Total | 2,248 (100.0%) | $44,522 |
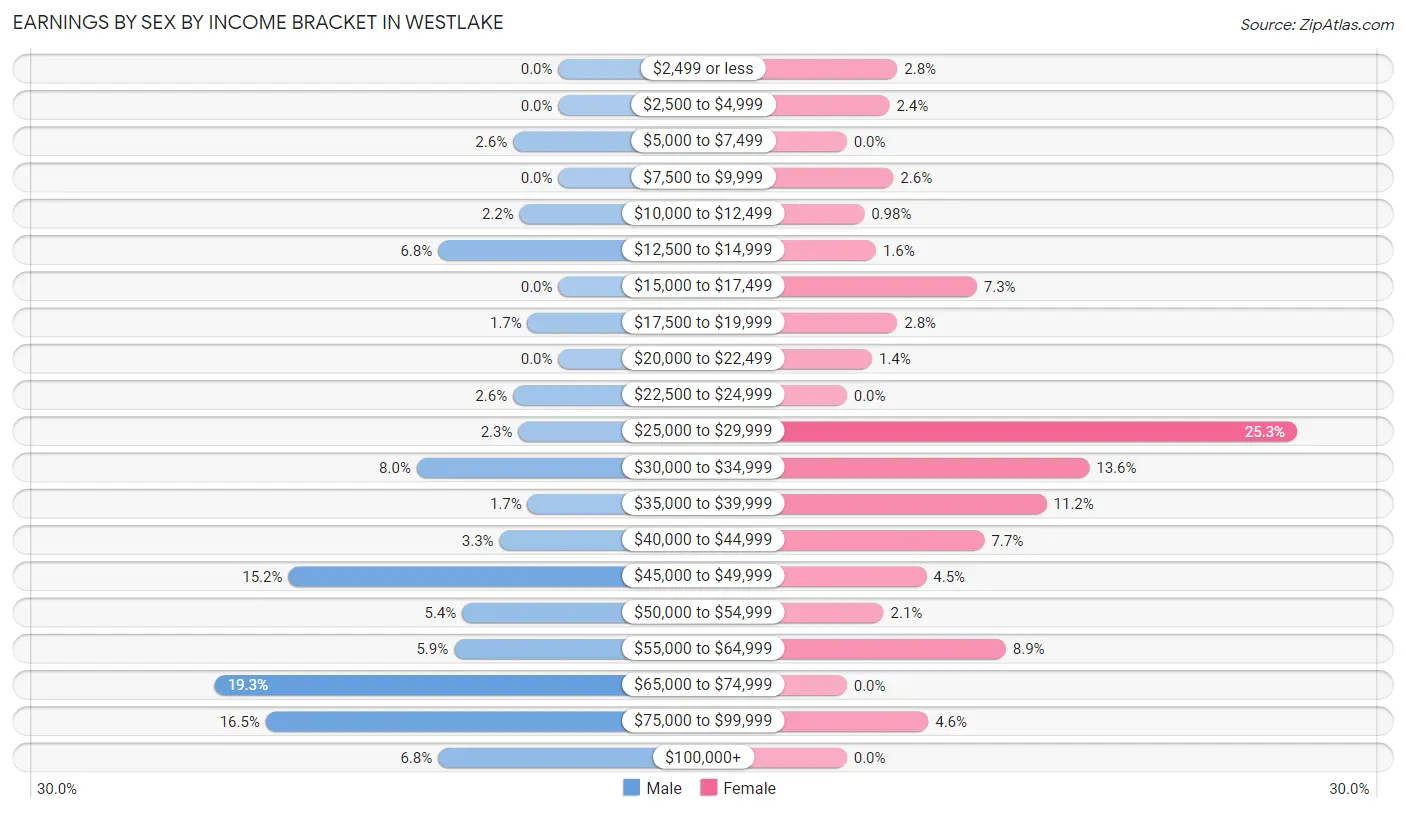
Earnings by Sex by Income Bracket in Westlake
The most common earnings brackets in Westlake are $65,000 to $74,999 for men (257 | 19.3%) and $25,000 to $29,999 for women (232 | 25.3%).
| Income | Male | Female |
| $2,499 or less | 0 (0.0%) | 26 (2.8%) |
| $2,500 to $4,999 | 0 (0.0%) | 22 (2.4%) |
| $5,000 to $7,499 | 34 (2.5%) | 0 (0.0%) |
| $7,500 to $9,999 | 0 (0.0%) | 24 (2.6%) |
| $10,000 to $12,499 | 29 (2.2%) | 9 (1.0%) |
| $12,500 to $14,999 | 90 (6.8%) | 15 (1.6%) |
| $15,000 to $17,499 | 0 (0.0%) | 67 (7.3%) |
| $17,500 to $19,999 | 23 (1.7%) | 26 (2.8%) |
| $20,000 to $22,499 | 0 (0.0%) | 13 (1.4%) |
| $22,500 to $24,999 | 34 (2.5%) | 0 (0.0%) |
| $25,000 to $29,999 | 30 (2.2%) | 232 (25.3%) |
| $30,000 to $34,999 | 106 (8.0%) | 125 (13.6%) |
| $35,000 to $39,999 | 23 (1.7%) | 103 (11.2%) |
| $40,000 to $44,999 | 44 (3.3%) | 71 (7.7%) |
| $45,000 to $49,999 | 202 (15.2%) | 41 (4.5%) |
| $50,000 to $54,999 | 72 (5.4%) | 19 (2.1%) |
| $55,000 to $64,999 | 78 (5.9%) | 82 (8.9%) |
| $65,000 to $74,999 | 257 (19.3%) | 0 (0.0%) |
| $75,000 to $99,999 | 219 (16.5%) | 42 (4.6%) |
| $100,000+ | 90 (6.8%) | 0 (0.0%) |
| Total | 1,331 (100.0%) | 917 (100.0%) |
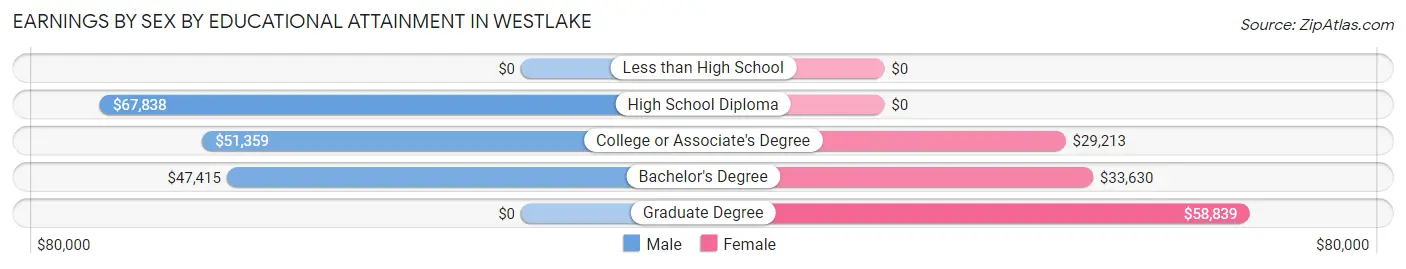
Earnings by Sex by Educational Attainment in Westlake
Average earnings in Westlake are $54,566 for men and $33,310 for women, a difference of 39.0%. Men with an educational attainment of high school diploma enjoy the highest average annual earnings of $67,838, while those with bachelor's degree education earn the least with $47,415. Women with an educational attainment of graduate degree earn the most with the average annual earnings of $58,839, while those with college or associate's degree education have the smallest earnings of $29,213.
| Educational Attainment | Male Income | Female Income |
| Less than High School | - | - |
| High School Diploma | $67,838 | $0 |
| College or Associate's Degree | $51,359 | $29,213 |
| Bachelor's Degree | $47,415 | $33,630 |
| Graduate Degree | - | - |
| Total | $54,566 | $33,310 |
Family Income in Westlake
Family Income Brackets in Westlake
According to the Westlake family income data, there are 368 families falling into the $50,000 to $74,999 income range, which is the most common income bracket and makes up 27.7% of all families.
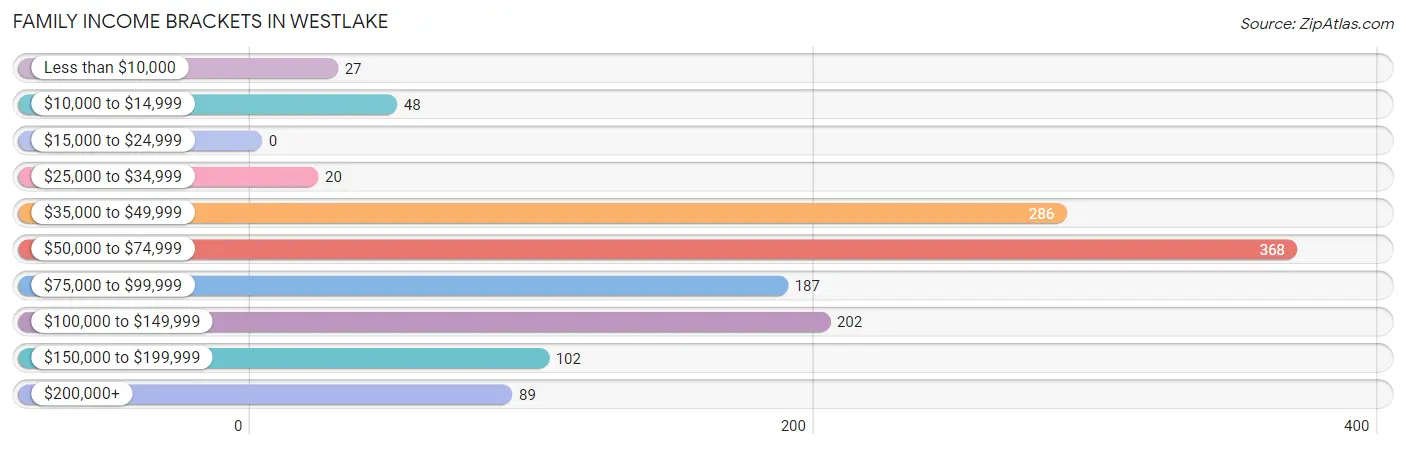
| Income Bracket | # Families | % Families |
| Less than $10,000 | 27 | 2.0% |
| $10,000 to $14,999 | 48 | 3.6% |
| $15,000 to $24,999 | 0 | 0.0% |
| $25,000 to $34,999 | 20 | 1.5% |
| $35,000 to $49,999 | 286 | 21.5% |
| $50,000 to $74,999 | 368 | 27.7% |
| $75,000 to $99,999 | 187 | 14.1% |
| $100,000 to $149,999 | 202 | 15.2% |
| $150,000 to $199,999 | 102 | 7.7% |
| $200,000+ | 89 | 6.7% |
Family Income by Famaliy Size in Westlake
4-person families (146 | 11.0%) account for the highest median family income in Westlake with $84,015 per family, while 2-person families (576 | 43.4%) have the highest median income of $32,106 per family member.
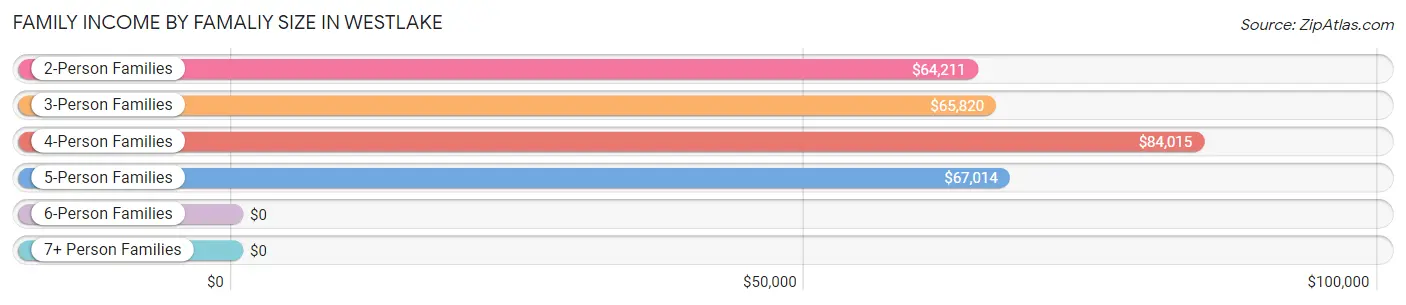
| Income Bracket | # Families | Median Income |
| 2-Person Families | 576 (43.4%) | $64,211 |
| 3-Person Families | 503 (37.9%) | $65,820 |
| 4-Person Families | 146 (11.0%) | $84,015 |
| 5-Person Families | 87 (6.6%) | $67,014 |
| 6-Person Families | 16 (1.2%) | $0 |
| 7+ Person Families | 0 (0.0%) | $0 |
| Total | 1,328 (100.0%) | $66,967 |
Family Income by Number of Earners in Westlake
The median family income in Westlake is $66,967, with families comprising 3+ earners (99) having the highest median family income of $166,353, while families with 1 earner (628) have the lowest median family income of $52,286, accounting for 7.4% and 47.3% of families, respectively.
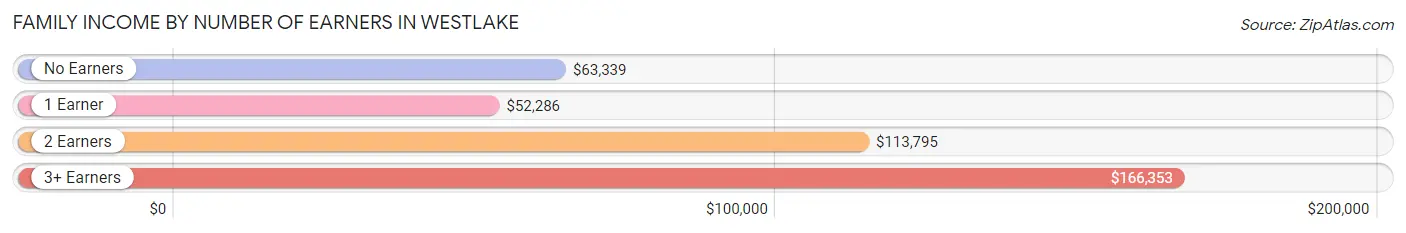
| Number of Earners | # Families | Median Income |
| No Earners | 272 (20.5%) | $63,339 |
| 1 Earner | 628 (47.3%) | $52,286 |
| 2 Earners | 329 (24.8%) | $113,795 |
| 3+ Earners | 99 (7.4%) | $166,353 |
| Total | 1,328 (100.0%) | $66,967 |
Household Income in Westlake
Household Income Brackets in Westlake
With 725 households falling in the category, the $50,000 to $74,999 income range is the most frequent in Westlake, accounting for 35.2% of all households. In contrast, only 82 households (4.0%) fall into the $10,000 to $14,999 income bracket, making it the least populous group.
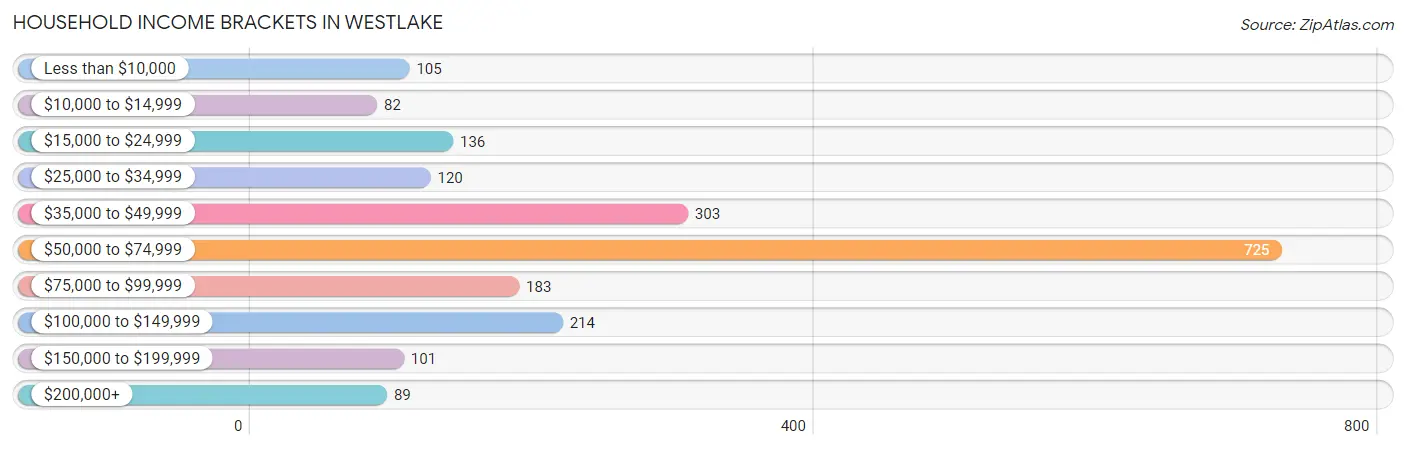
| Income Bracket | # Households | % Households |
| Less than $10,000 | 105 | 5.1% |
| $10,000 to $14,999 | 82 | 4.0% |
| $15,000 to $24,999 | 136 | 6.6% |
| $25,000 to $34,999 | 120 | 5.8% |
| $35,000 to $49,999 | 303 | 14.7% |
| $50,000 to $74,999 | 725 | 35.2% |
| $75,000 to $99,999 | 183 | 8.9% |
| $100,000 to $149,999 | 214 | 10.4% |
| $150,000 to $199,999 | 101 | 4.9% |
| $200,000+ | 89 | 4.3% |
Household Income by Householder Age in Westlake
The median household income in Westlake is $63,841, with the highest median household income of $72,732 found in the 45 to 64 years age bracket for the primary householder. A total of 620 households (30.1%) fall into this category. Meanwhile, the 15 to 24 years age bracket for the primary householder has the lowest median household income of $0, with 9 households (0.4%) in this group.
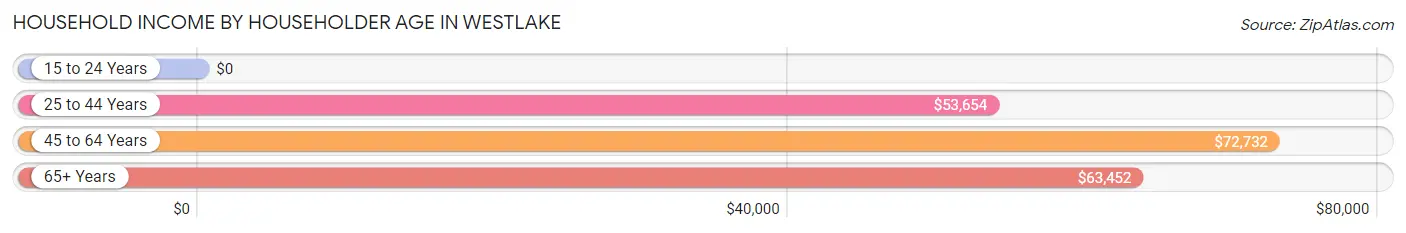
| Income Bracket | # Households | Median Income |
| 15 to 24 Years | 9 (0.4%) | $0 |
| 25 to 44 Years | 642 (31.1%) | $53,654 |
| 45 to 64 Years | 620 (30.1%) | $72,732 |
| 65+ Years | 790 (38.3%) | $63,452 |
| Total | 2,061 (100.0%) | $63,841 |
Poverty in Westlake
Income Below Poverty by Sex and Age in Westlake
With 8.1% poverty level for males and 5.8% for females among the residents of Westlake, 6 to 11 year old males and 55 to 64 year old females are the most vulnerable to poverty, with 77 males (44.8%) and 26 females (14.0%) in their respective age groups living below the poverty level.
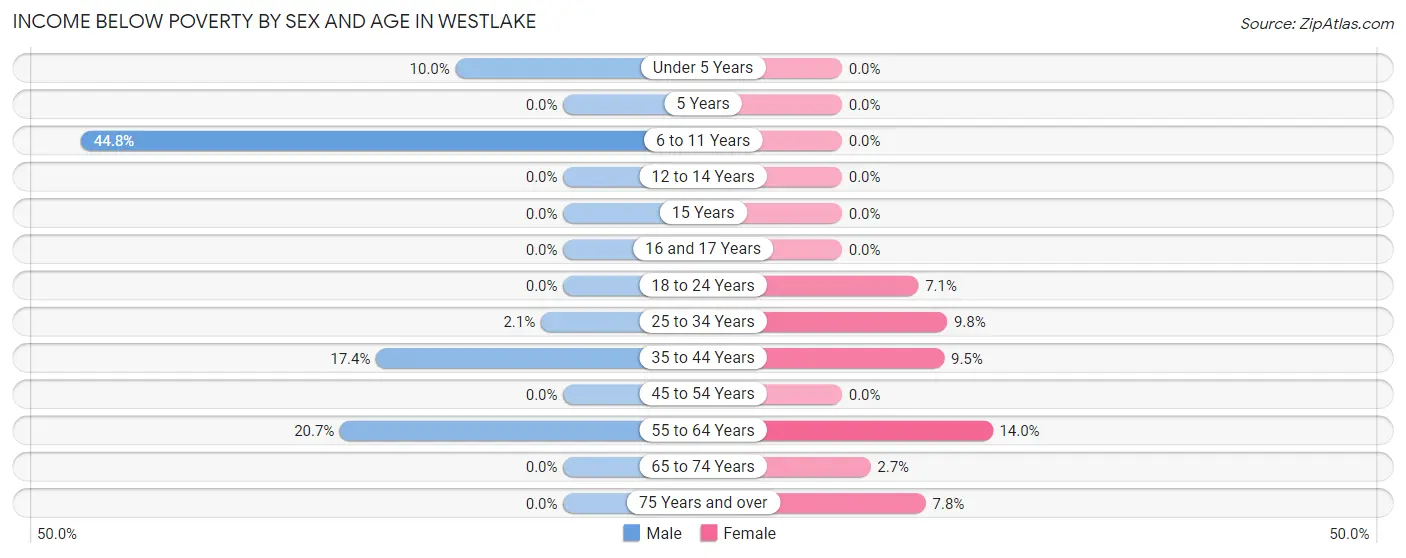
| Age Bracket | Male | Female |
| Under 5 Years | 14 (10.0%) | 0 (0.0%) |
| 5 Years | 0 (0.0%) | 0 (0.0%) |
| 6 to 11 Years | 77 (44.8%) | 0 (0.0%) |
| 12 to 14 Years | 0 (0.0%) | 0 (0.0%) |
| 15 Years | 0 (0.0%) | 0 (0.0%) |
| 16 and 17 Years | 0 (0.0%) | 0 (0.0%) |
| 18 to 24 Years | 0 (0.0%) | 9 (7.1%) |
| 25 to 34 Years | 12 (2.1%) | 48 (9.8%) |
| 35 to 44 Years | 50 (17.4%) | 26 (9.5%) |
| 45 to 54 Years | 0 (0.0%) | 0 (0.0%) |
| 55 to 64 Years | 58 (20.7%) | 26 (14.0%) |
| 65 to 74 Years | 0 (0.0%) | 7 (2.6%) |
| 75 Years and over | 0 (0.0%) | 14 (7.8%) |
| Total | 211 (8.1%) | 130 (5.8%) |
Income Above Poverty by Sex and Age in Westlake
According to the poverty statistics in Westlake, males aged 5 years and females aged under 5 years are the age groups that are most secure financially, with 100.0% of males and 100.0% of females in these age groups living above the poverty line.
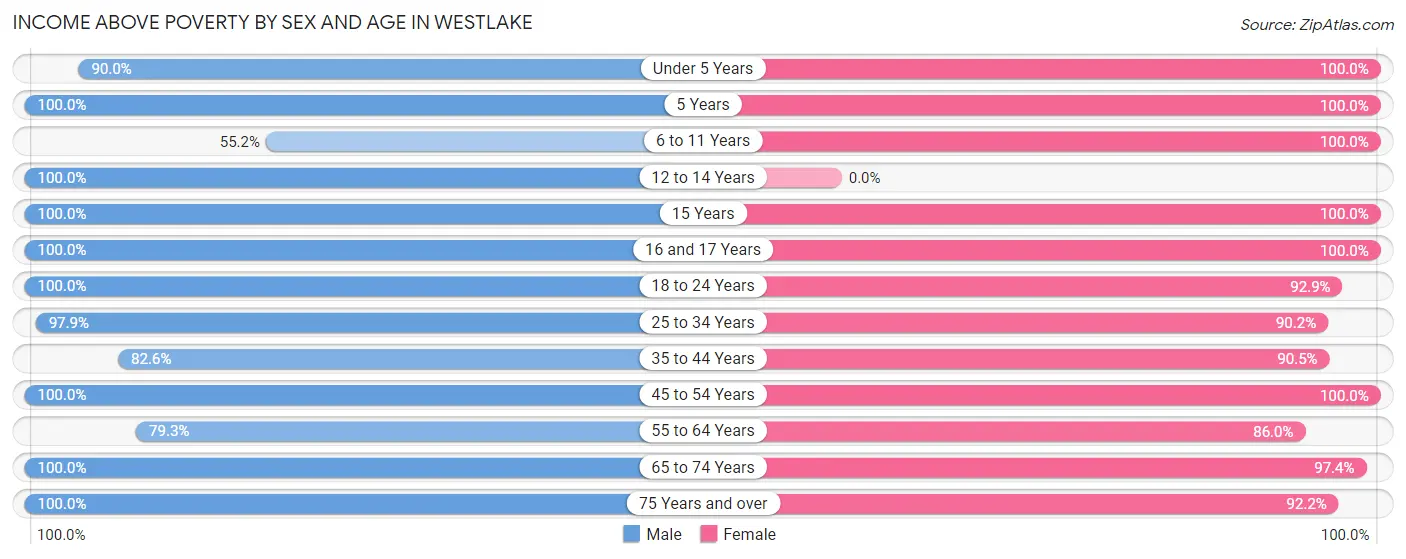
| Age Bracket | Male | Female |
| Under 5 Years | 126 (90.0%) | 176 (100.0%) |
| 5 Years | 22 (100.0%) | 10 (100.0%) |
| 6 to 11 Years | 95 (55.2%) | 180 (100.0%) |
| 12 to 14 Years | 125 (100.0%) | 0 (0.0%) |
| 15 Years | 23 (100.0%) | 55 (100.0%) |
| 16 and 17 Years | 62 (100.0%) | 29 (100.0%) |
| 18 to 24 Years | 75 (100.0%) | 118 (92.9%) |
| 25 to 34 Years | 567 (97.9%) | 444 (90.2%) |
| 35 to 44 Years | 238 (82.6%) | 248 (90.5%) |
| 45 to 54 Years | 199 (100.0%) | 279 (100.0%) |
| 55 to 64 Years | 222 (79.3%) | 160 (86.0%) |
| 65 to 74 Years | 383 (100.0%) | 257 (97.4%) |
| 75 Years and over | 247 (100.0%) | 166 (92.2%) |
| Total | 2,384 (91.9%) | 2,122 (94.2%) |
Income Below Poverty Among Married-Couple Families in Westlake
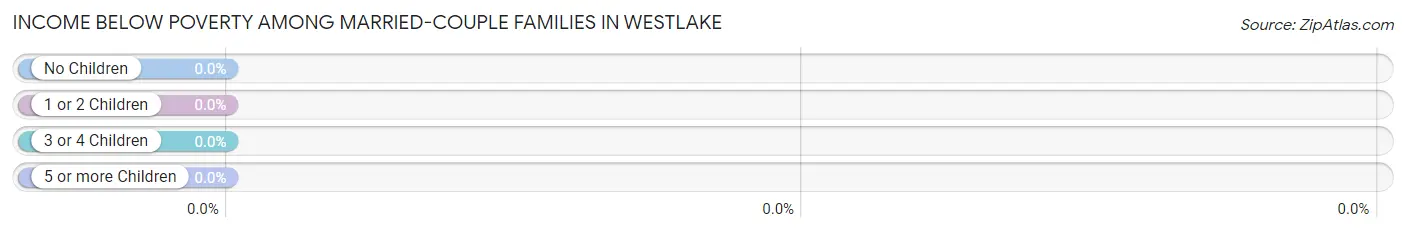
| Children | Above Poverty | Below Poverty |
| No Children | 457 (100.0%) | 0 (0.0%) |
| 1 or 2 Children | 416 (100.0%) | 0 (0.0%) |
| 3 or 4 Children | 64 (100.0%) | 0 (0.0%) |
| 5 or more Children | 0 (0.0%) | 0 (0.0%) |
| Total | 937 (100.0%) | 0 (0.0%) |
Income Below Poverty Among Single-Parent Households in Westlake
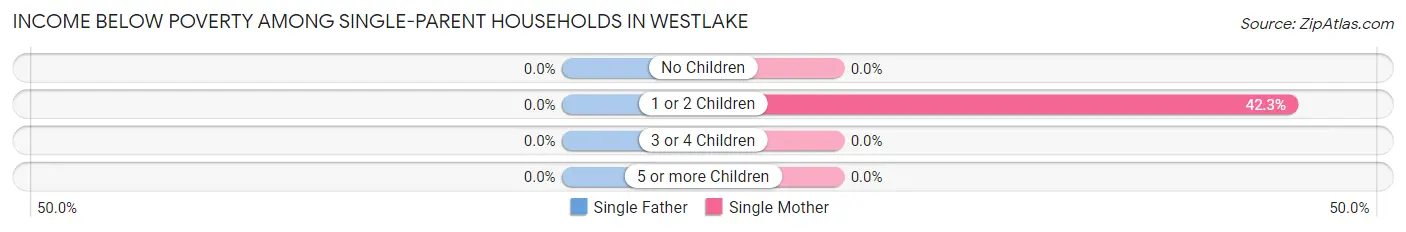
| Children | Single Father | Single Mother |
| No Children | 0 (0.0%) | 0 (0.0%) |
| 1 or 2 Children | 0 (0.0%) | 74 (42.3%) |
| 3 or 4 Children | 0 (0.0%) | 0 (0.0%) |
| 5 or more Children | 0 (0.0%) | 0 (0.0%) |
| Total | 0 (0.0%) | 74 (35.1%) |
Income Below Poverty Among Married-Couple vs Single-Parent Households in Westlake
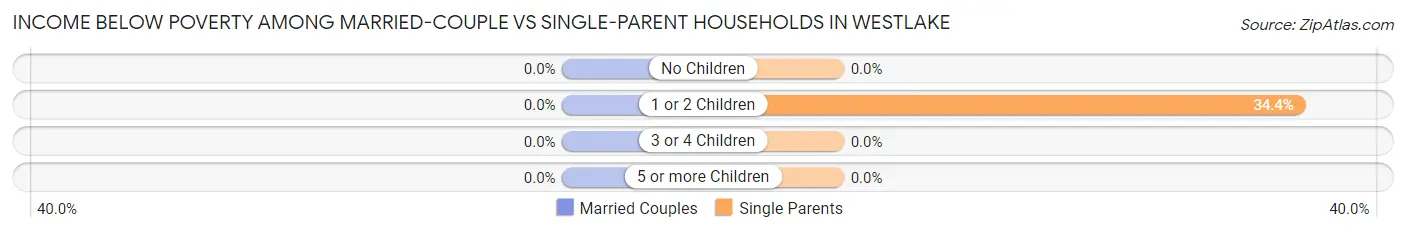
| Children | Married-Couple Families | Single-Parent Households |
| No Children | 0 (0.0%) | 0 (0.0%) |
| 1 or 2 Children | 0 (0.0%) | 74 (34.4%) |
| 3 or 4 Children | 0 (0.0%) | 0 (0.0%) |
| 5 or more Children | 0 (0.0%) | 0 (0.0%) |
| Total | 0 (0.0%) | 74 (18.9%) |
Race in Westlake
The most populous races in Westlake are White / Caucasian (3,640 | 75.1%), Black / African American (834 | 17.2%), and Asian (218 | 4.5%).
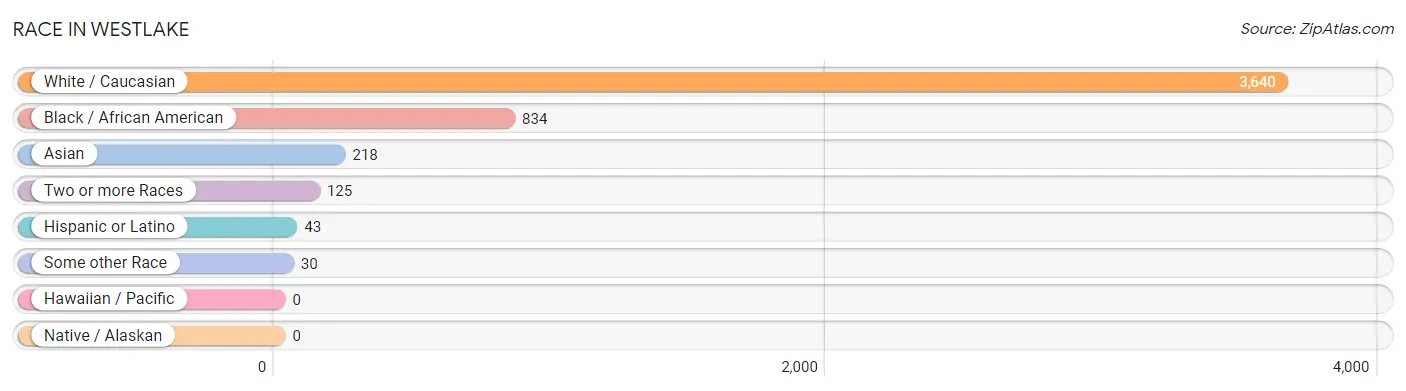
| Race | # Population | % Population |
| Asian | 218 | 4.5% |
| Black / African American | 834 | 17.2% |
| Hawaiian / Pacific | 0 | 0.0% |
| Hispanic or Latino | 43 | 0.9% |
| Native / Alaskan | 0 | 0.0% |
| White / Caucasian | 3,640 | 75.1% |
| Two or more Races | 125 | 2.6% |
| Some other Race | 30 | 0.6% |
| Total | 4,847 | 100.0% |
Ancestry in Westlake
The most populous ancestries reported in Westlake are French Canadian (664 | 13.7%), German (500 | 10.3%), Irish (459 | 9.5%), French (400 | 8.3%), and American (245 | 5.1%), together accounting for 46.8% of all Westlake residents.
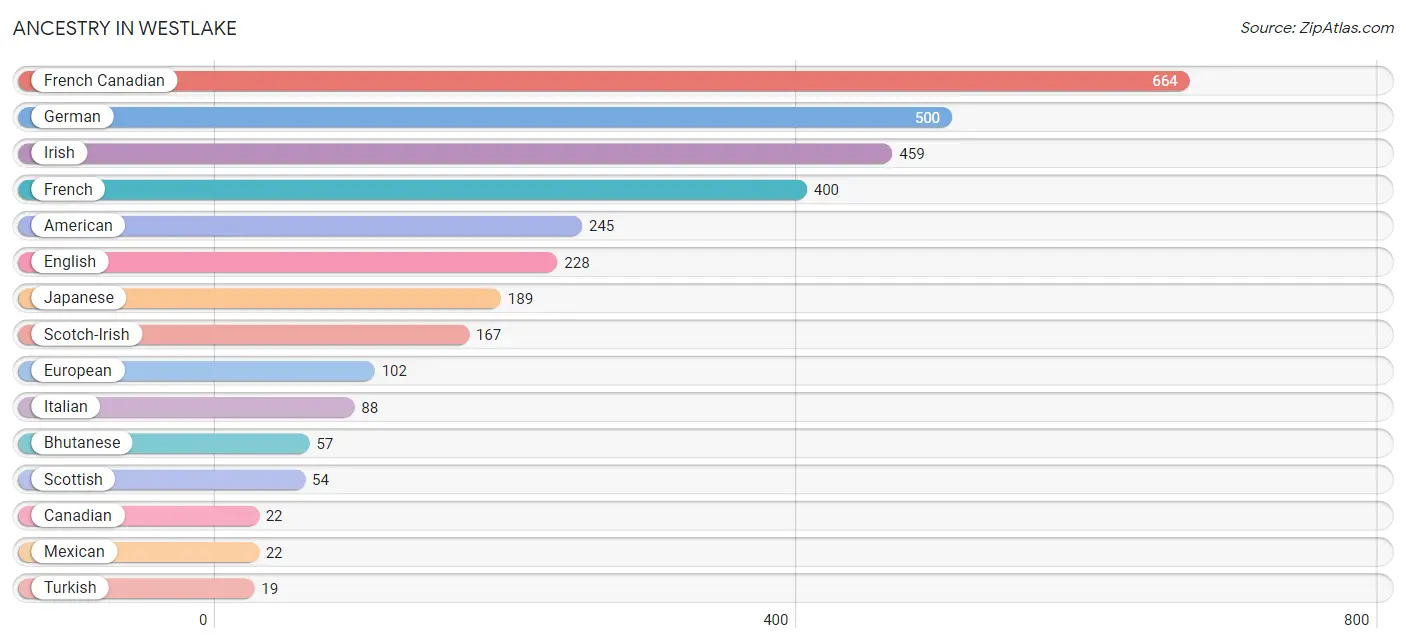
| Ancestry | # Population | % Population |
| American | 245 | 5.1% |
| Bhutanese | 57 | 1.2% |
| Canadian | 22 | 0.4% |
| Central American | 18 | 0.4% |
| English | 228 | 4.7% |
| European | 102 | 2.1% |
| French | 400 | 8.3% |
| French Canadian | 664 | 13.7% |
| German | 500 | 10.3% |
| Irish | 459 | 9.5% |
| Italian | 88 | 1.8% |
| Japanese | 189 | 3.9% |
| Korean | 18 | 0.4% |
| Mexican | 22 | 0.4% |
| Panamanian | 18 | 0.4% |
| Puerto Rican | 3 | 0.1% |
| Scotch-Irish | 167 | 3.5% |
| Scottish | 54 | 1.1% |
| Turkish | 19 | 0.4% | View All 19 Rows |
Immigrants in Westlake
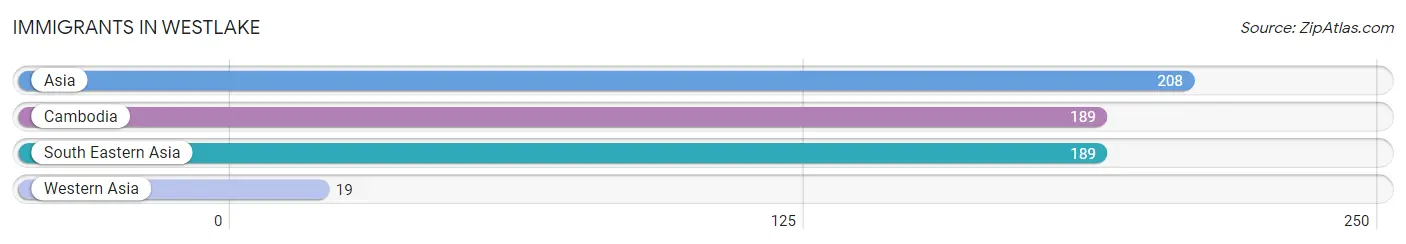
The most numerous immigrant groups reported in Westlake came from Asia (208 | 4.3%), Cambodia (189 | 3.9%), South Eastern Asia (189 | 3.9%), and Western Asia (19 | 0.4%), together accounting for 12.5% of all Westlake residents.
| Immigration Origin | # Population | % Population |
| Asia | 208 | 4.3% |
| Cambodia | 189 | 3.9% |
| South Eastern Asia | 189 | 3.9% |
| Western Asia | 19 | 0.4% | View All 4 Rows |
Sex and Age in Westlake
Sex and Age in Westlake
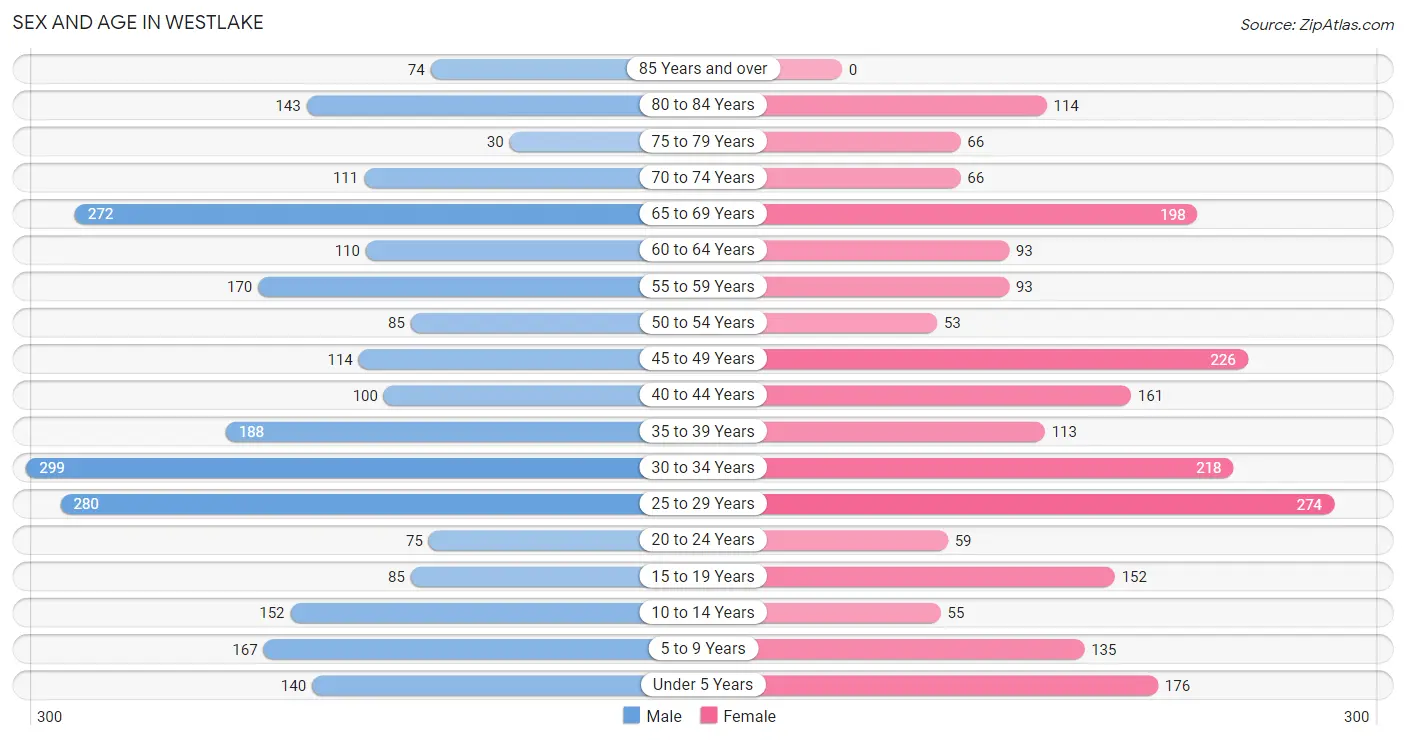
The most populous age groups in Westlake are 30 to 34 Years (299 | 11.5%) for men and 25 to 29 Years (274 | 12.2%) for women.
| Age Bracket | Male | Female |
| Under 5 Years | 140 (5.4%) | 176 (7.8%) |
| 5 to 9 Years | 167 (6.4%) | 135 (6.0%) |
| 10 to 14 Years | 152 (5.9%) | 55 (2.4%) |
| 15 to 19 Years | 85 (3.3%) | 152 (6.8%) |
| 20 to 24 Years | 75 (2.9%) | 59 (2.6%) |
| 25 to 29 Years | 280 (10.8%) | 274 (12.2%) |
| 30 to 34 Years | 299 (11.5%) | 218 (9.7%) |
| 35 to 39 Years | 188 (7.2%) | 113 (5.0%) |
| 40 to 44 Years | 100 (3.8%) | 161 (7.1%) |
| 45 to 49 Years | 114 (4.4%) | 226 (10.0%) |
| 50 to 54 Years | 85 (3.3%) | 53 (2.4%) |
| 55 to 59 Years | 170 (6.6%) | 93 (4.1%) |
| 60 to 64 Years | 110 (4.2%) | 93 (4.1%) |
| 65 to 69 Years | 272 (10.5%) | 198 (8.8%) |
| 70 to 74 Years | 111 (4.3%) | 66 (2.9%) |
| 75 to 79 Years | 30 (1.2%) | 66 (2.9%) |
| 80 to 84 Years | 143 (5.5%) | 114 (5.1%) |
| 85 Years and over | 74 (2.9%) | 0 (0.0%) |
| Total | 2,595 (100.0%) | 2,252 (100.0%) |
Families and Households in Westlake
Median Family Size in Westlake
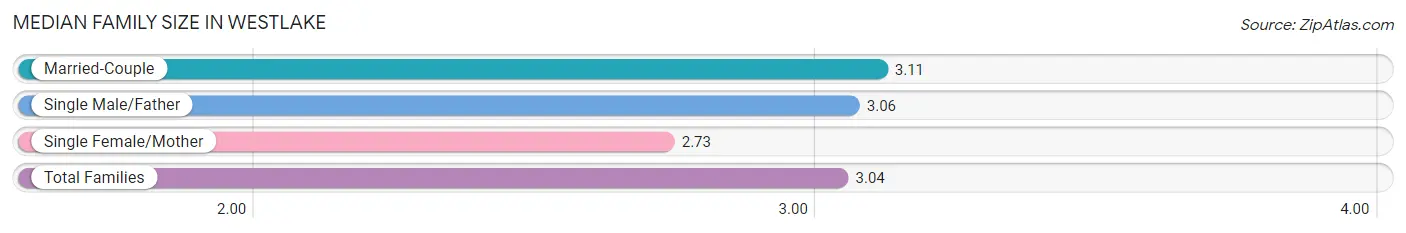
The median family size in Westlake is 3.04 persons per family, with married-couple families (937 | 70.6%) accounting for the largest median family size of 3.11 persons per family. On the other hand, single female/mother families (211 | 15.9%) represent the smallest median family size with 2.73 persons per family.
| Family Type | # Families | Family Size |
| Married-Couple | 937 (70.6%) | 3.11 |
| Single Male/Father | 180 (13.6%) | 3.06 |
| Single Female/Mother | 211 (15.9%) | 2.73 |
| Total Families | 1,328 (100.0%) | 3.04 |
Median Household Size in Westlake
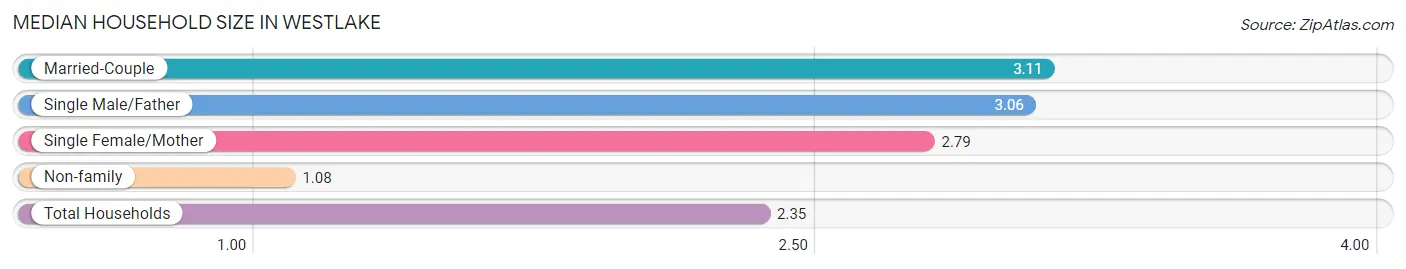
The median household size in Westlake is 2.35 persons per household, with married-couple households (937 | 45.5%) accounting for the largest median household size of 3.11 persons per household. non-family households (733 | 35.6%) represent the smallest median household size with 1.08 persons per household.
| Household Type | # Households | Household Size |
| Married-Couple | 937 (45.5%) | 3.11 |
| Single Male/Father | 180 (8.7%) | 3.06 |
| Single Female/Mother | 211 (10.2%) | 2.79 |
| Non-family | 733 (35.6%) | 1.08 |
| Total Households | 2,061 (100.0%) | 2.35 |
Household Size by Marriage Status in Westlake
Out of a total of 2,061 households in Westlake, 1,328 (64.4%) are family households, while 733 (35.6%) are nonfamily households. The most numerous type of family households are 2-person households, comprising 564, and the most common type of nonfamily households are 1-person households, comprising 531.
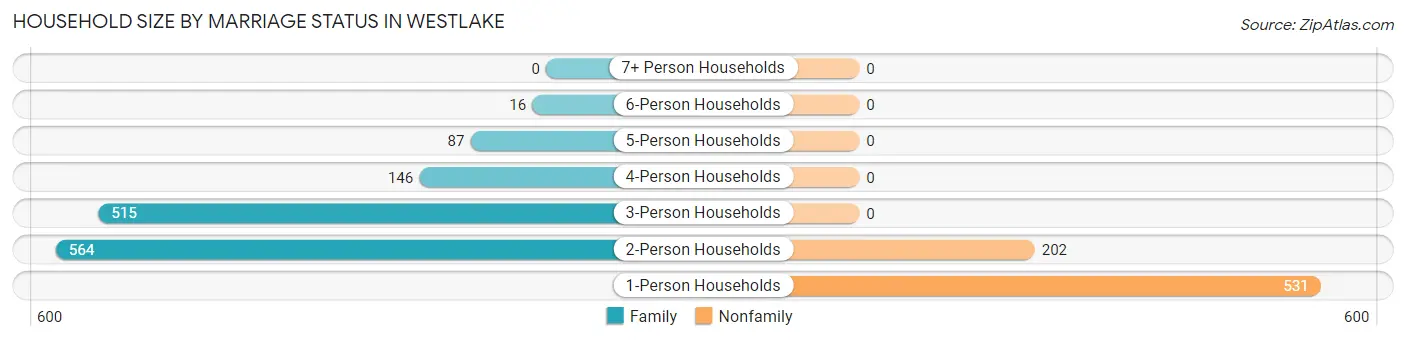
| Household Size | Family Households | Nonfamily Households |
| 1-Person Households | - | 531 (25.8%) |
| 2-Person Households | 564 (27.4%) | 202 (9.8%) |
| 3-Person Households | 515 (25.0%) | 0 (0.0%) |
| 4-Person Households | 146 (7.1%) | 0 (0.0%) |
| 5-Person Households | 87 (4.2%) | 0 (0.0%) |
| 6-Person Households | 16 (0.8%) | 0 (0.0%) |
| 7+ Person Households | 0 (0.0%) | 0 (0.0%) |
| Total | 1,328 (64.4%) | 733 (35.6%) |
Female Fertility in Westlake
Fertility by Age in Westlake
Average fertility rate in Westlake is 75.0 births per 1,000 women. Women in the age bracket of 20 to 34 years have the highest fertility rate with 165.0 births per 1,000 women. Women in the age bracket of 20 to 34 years acount for 100.0% of all women with births.
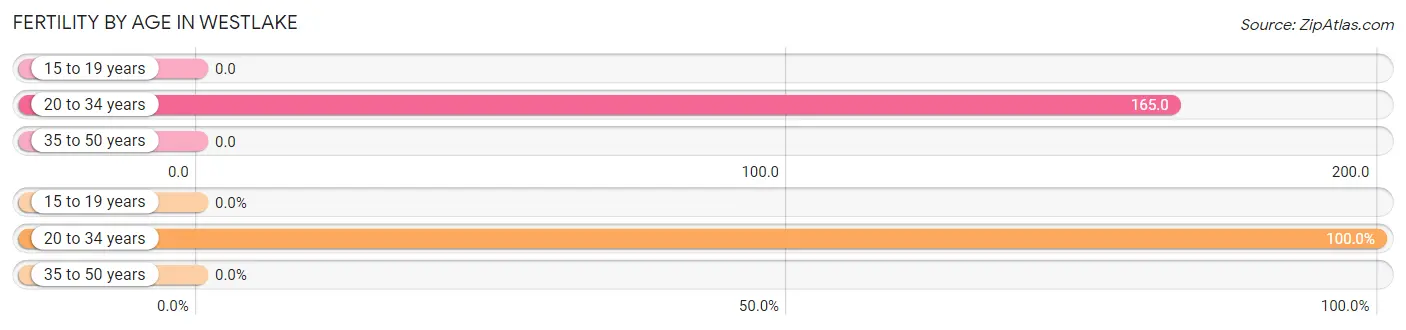
| Age Bracket | Women with Births | Births / 1,000 Women |
| 15 to 19 years | 0 (0.0%) | 0.0 |
| 20 to 34 years | 91 (100.0%) | 165.0 |
| 35 to 50 years | 0 (0.0%) | 0.0 |
| Total | 91 (100.0%) | 75.0 |
Fertility by Age by Marriage Status in Westlake
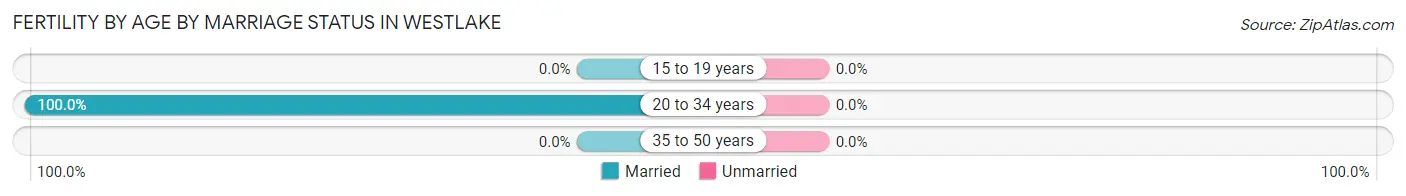
| Age Bracket | Married | Unmarried |
| 15 to 19 years | 0 (0.0%) | 0 (0.0%) |
| 20 to 34 years | 91 (100.0%) | 0 (0.0%) |
| 35 to 50 years | 0 (0.0%) | 0 (0.0%) |
| Total | 91 (100.0%) | 0 (0.0%) |
Fertility by Education in Westlake
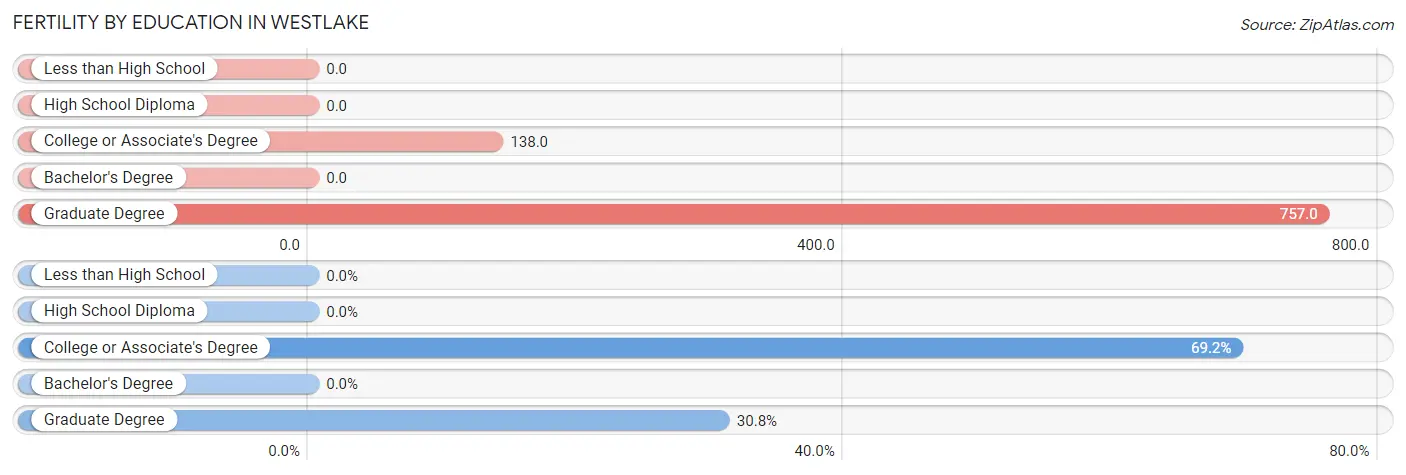
| Educational Attainment | Women with Births | Births / 1,000 Women |
| Less than High School | 0 (0.0%) | 0.0 |
| High School Diploma | 0 (0.0%) | 0.0 |
| College or Associate's Degree | 63 (69.2%) | 138.0 |
| Bachelor's Degree | 0 (0.0%) | 0.0 |
| Graduate Degree | 28 (30.8%) | 757.0 |
| Total | 91 (100.0%) | 75.0 |
Fertility by Education by Marriage Status in Westlake
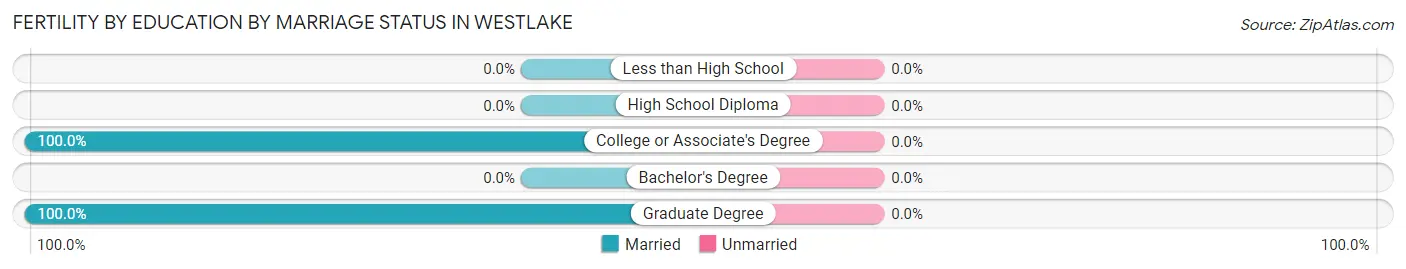
| Educational Attainment | Married | Unmarried |
| Less than High School | 0 (0.0%) | 0 (0.0%) |
| High School Diploma | 0 (0.0%) | 0 (0.0%) |
| College or Associate's Degree | 63 (100.0%) | 0 (0.0%) |
| Bachelor's Degree | 0 (0.0%) | 0 (0.0%) |
| Graduate Degree | 28 (100.0%) | 0 (0.0%) |
| Total | 91 (100.0%) | 0 (0.0%) |
Employment Characteristics in Westlake
Employment by Class of Employer in Westlake
Among the 2,149 employed individuals in Westlake, private company employees (1,407 | 65.5%), local government employees (472 | 22.0%), and self-employed (not incorporated) (167 | 7.8%) make up the most common classes of employment.
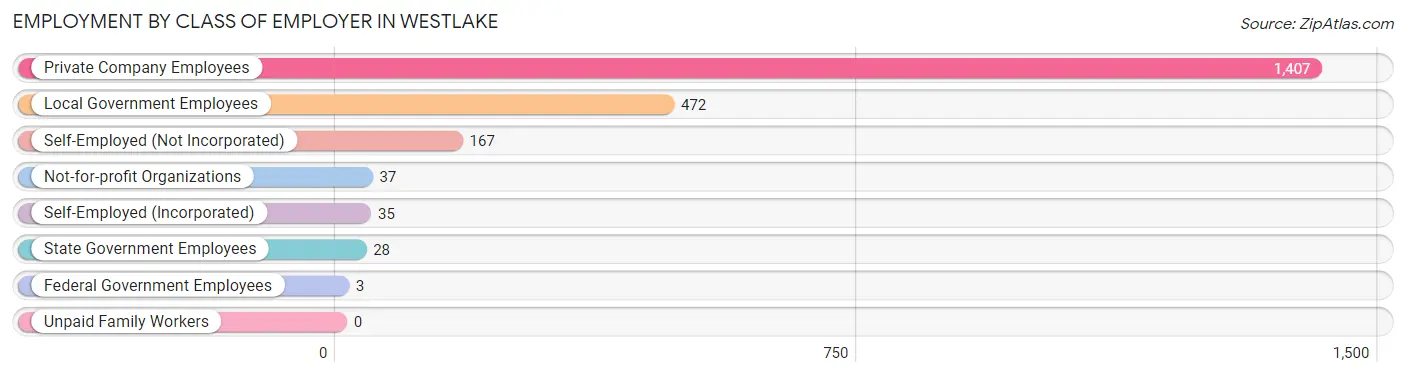
| Employer Class | # Employees | % Employees |
| Private Company Employees | 1,407 | 65.5% |
| Self-Employed (Incorporated) | 35 | 1.6% |
| Self-Employed (Not Incorporated) | 167 | 7.8% |
| Not-for-profit Organizations | 37 | 1.7% |
| Local Government Employees | 472 | 22.0% |
| State Government Employees | 28 | 1.3% |
| Federal Government Employees | 3 | 0.1% |
| Unpaid Family Workers | 0 | 0.0% |
| Total | 2,149 | 100.0% |
Employment Status by Age in Westlake
According to the labor force statistics for Westlake, out of the total population over 16 years of age (3,944), 56.2% or 2,217 individuals are in the labor force, with 1.0% or 22 of them unemployed. The age group with the highest labor force participation rate is 45 to 54 years, with 94.6% or 452 individuals in the labor force. Within the labor force, the 55 to 59 years age range has the highest percentage of unemployed individuals, with 18.5% or 23 of them being unemployed.
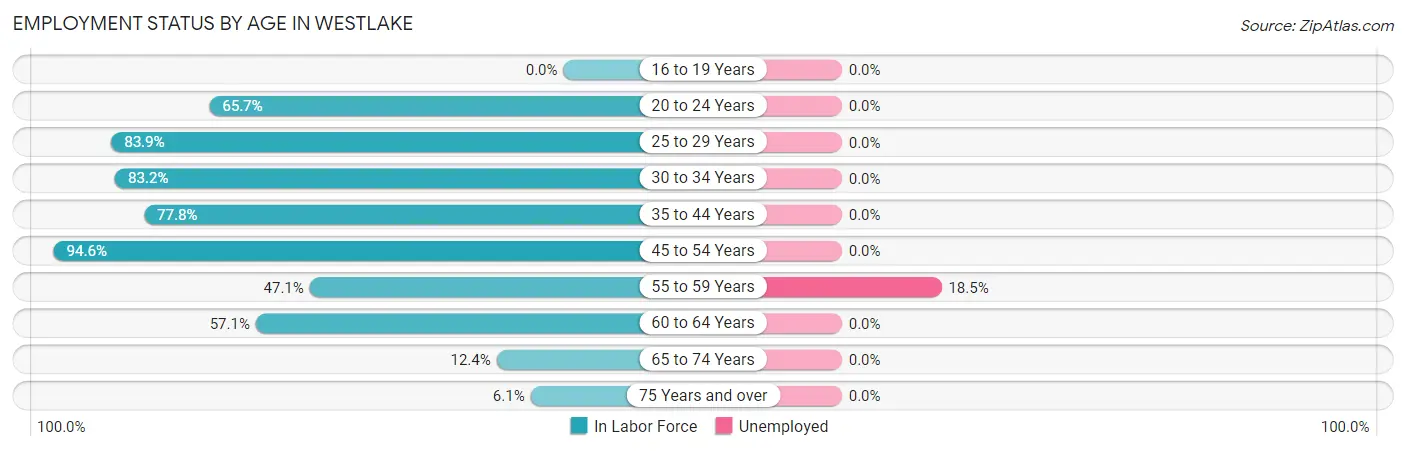
| Age Bracket | In Labor Force | Unemployed |
| 16 to 19 Years | 0 (0.0%) | 0 (0.0%) |
| 20 to 24 Years | 88 (65.7%) | 0 (0.0%) |
| 25 to 29 Years | 465 (83.9%) | 0 (0.0%) |
| 30 to 34 Years | 430 (83.2%) | 0 (0.0%) |
| 35 to 44 Years | 437 (77.8%) | 0 (0.0%) |
| 45 to 54 Years | 452 (94.6%) | 0 (0.0%) |
| 55 to 59 Years | 124 (47.1%) | 23 (18.5%) |
| 60 to 64 Years | 116 (57.1%) | 0 (0.0%) |
| 65 to 74 Years | 80 (12.4%) | 0 (0.0%) |
| 75 Years and over | 26 (6.1%) | 0 (0.0%) |
| Total | 2,217 (56.2%) | 22 (1.0%) |
Employment Status by Educational Attainment in Westlake
According to labor force statistics for Westlake, 78.5% of individuals (2,023) out of the total population between 25 and 64 years of age (2,577) are in the labor force, with 1.1% or 22 of them being unemployed. The group with the highest labor force participation rate are those with the educational attainment of bachelor's degree or higher, with 95.5% or 635 individuals in the labor force. Within the labor force, individuals with high school diploma education have the highest percentage of unemployment, with 4.2% or 23 of them being unemployed.
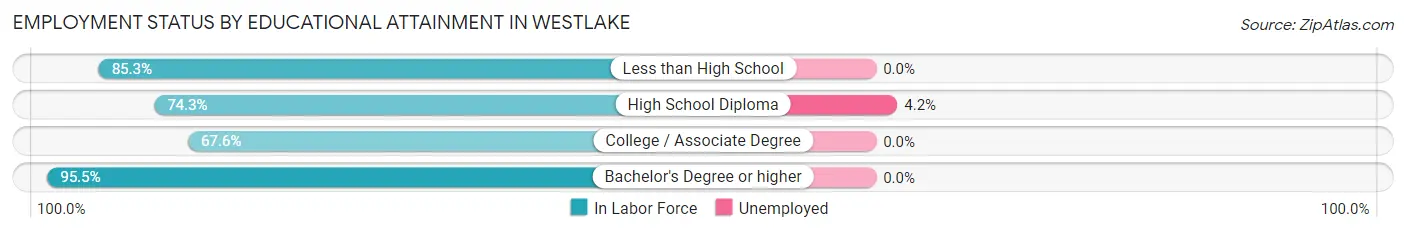
| Educational Attainment | In Labor Force | Unemployed |
| Less than High School | 226 (85.3%) | 0 (0.0%) |
| High School Diploma | 553 (74.3%) | 31 (4.2%) |
| College / Associate Degree | 610 (67.6%) | 0 (0.0%) |
| Bachelor's Degree or higher | 635 (95.5%) | 0 (0.0%) |
| Total | 2,023 (78.5%) | 28 (1.1%) |
Employment Occupations by Sex in Westlake
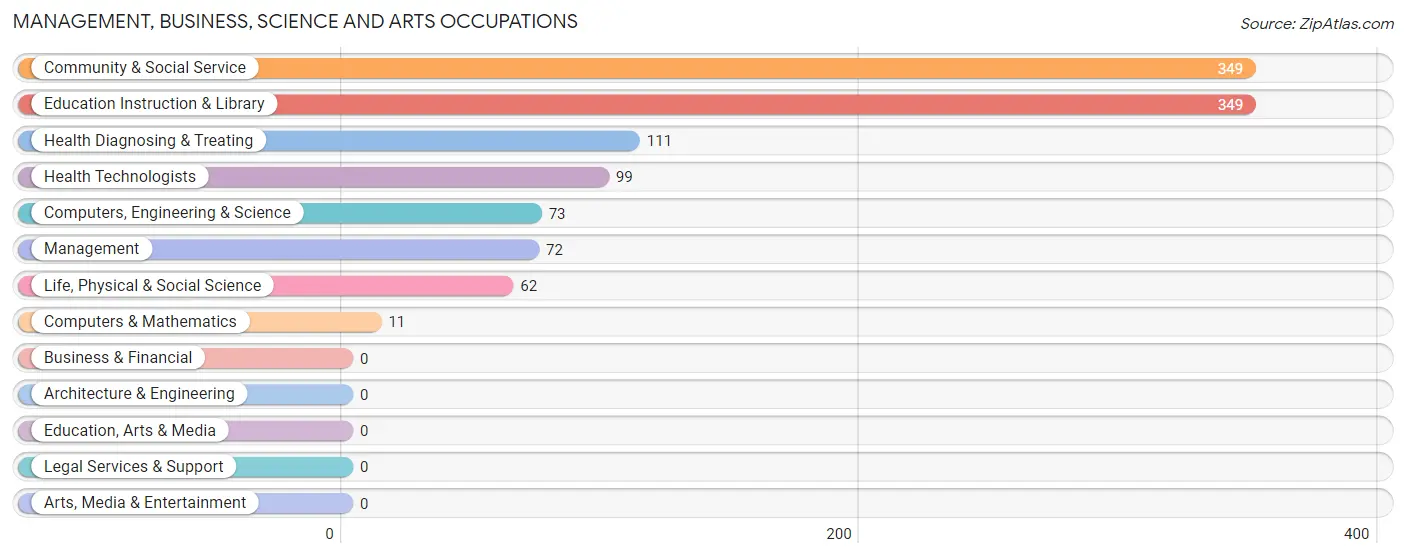
Management, Business, Science and Arts Occupations
The most common Management, Business, Science and Arts occupations in Westlake are Community & Social Service (349 | 15.9%), Education Instruction & Library (349 | 15.9%), Health Diagnosing & Treating (111 | 5.1%), Health Technologists (99 | 4.5%), and Computers, Engineering & Science (73 | 3.3%).
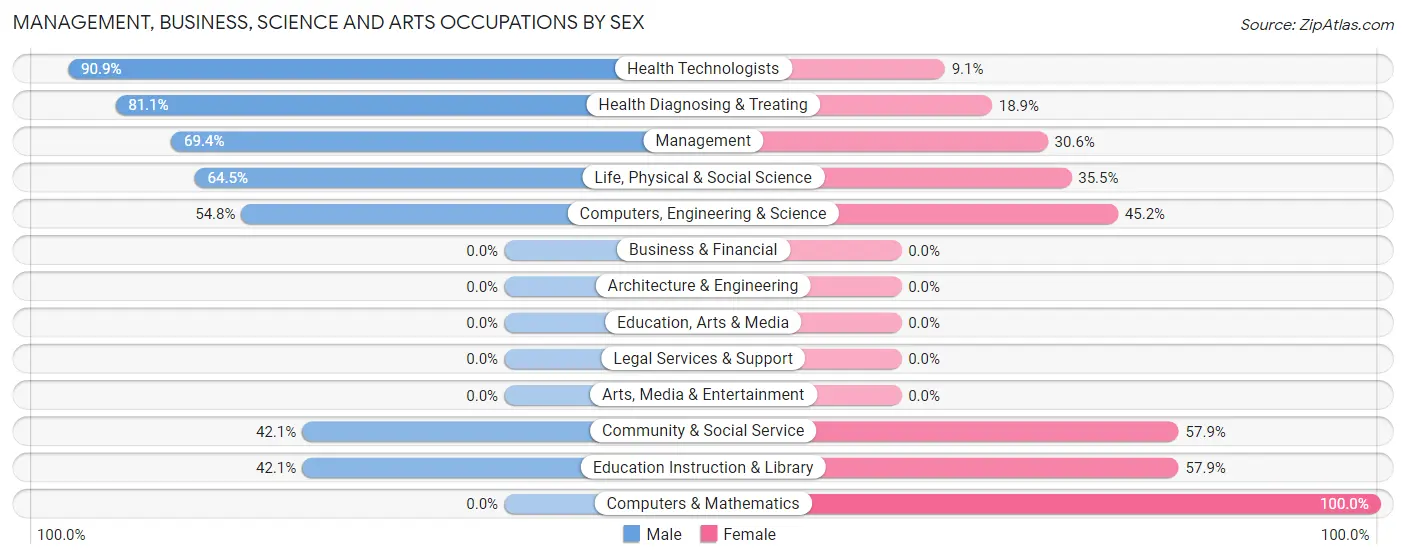
Management, Business, Science and Arts Occupations by Sex
Within the Management, Business, Science and Arts occupations in Westlake, the most male-oriented occupations are Health Technologists (90.9%), Health Diagnosing & Treating (81.1%), and Management (69.4%), while the most female-oriented occupations are Computers & Mathematics (100.0%), Community & Social Service (57.9%), and Education Instruction & Library (57.9%).
| Occupation | Male | Female |
| Management | 50 (69.4%) | 22 (30.6%) |
| Business & Financial | 0 (0.0%) | 0 (0.0%) |
| Computers, Engineering & Science | 40 (54.8%) | 33 (45.2%) |
| Computers & Mathematics | 0 (0.0%) | 11 (100.0%) |
| Architecture & Engineering | 0 (0.0%) | 0 (0.0%) |
| Life, Physical & Social Science | 40 (64.5%) | 22 (35.5%) |
| Community & Social Service | 147 (42.1%) | 202 (57.9%) |
| Education, Arts & Media | 0 (0.0%) | 0 (0.0%) |
| Legal Services & Support | 0 (0.0%) | 0 (0.0%) |
| Education Instruction & Library | 147 (42.1%) | 202 (57.9%) |
| Arts, Media & Entertainment | 0 (0.0%) | 0 (0.0%) |
| Health Diagnosing & Treating | 90 (81.1%) | 21 (18.9%) |
| Health Technologists | 90 (90.9%) | 9 (9.1%) |
| Total (Category) | 327 (54.0%) | 278 (46.0%) |
| Total (Overall) | 1,290 (58.8%) | 905 (41.2%) |
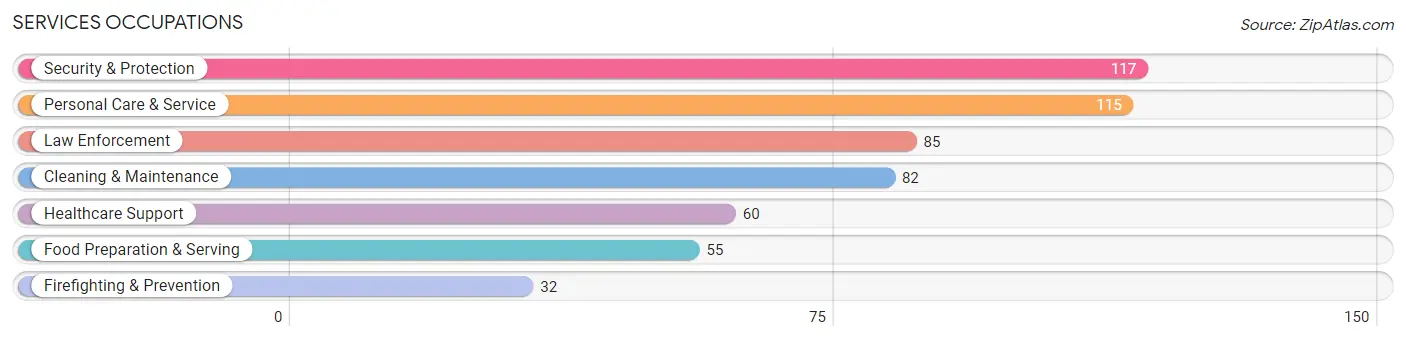
Services Occupations
The most common Services occupations in Westlake are Security & Protection (117 | 5.3%), Personal Care & Service (115 | 5.2%), Law Enforcement (85 | 3.9%), Cleaning & Maintenance (82 | 3.7%), and Healthcare Support (60 | 2.7%).
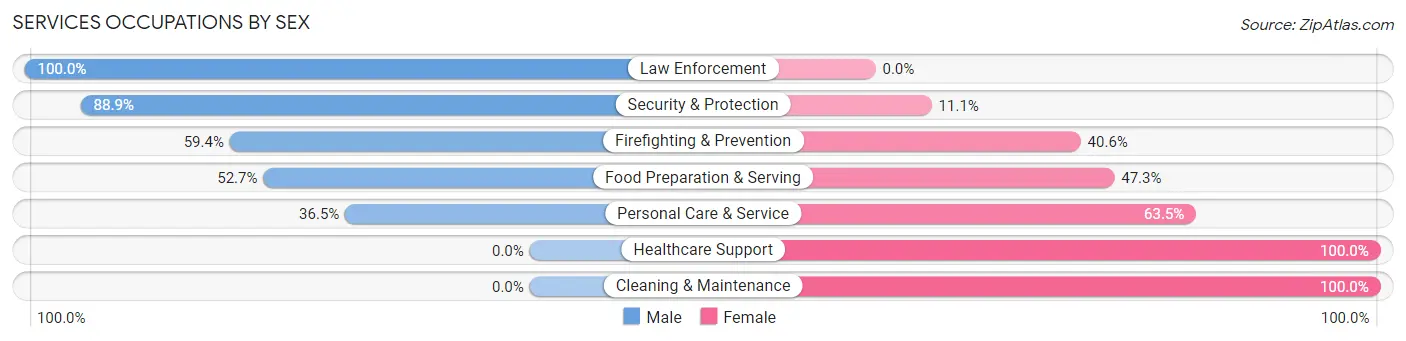
Services Occupations by Sex
Within the Services occupations in Westlake, the most male-oriented occupations are Law Enforcement (100.0%), Security & Protection (88.9%), and Firefighting & Prevention (59.4%), while the most female-oriented occupations are Healthcare Support (100.0%), Cleaning & Maintenance (100.0%), and Personal Care & Service (63.5%).
| Occupation | Male | Female |
| Healthcare Support | 0 (0.0%) | 60 (100.0%) |
| Security & Protection | 104 (88.9%) | 13 (11.1%) |
| Firefighting & Prevention | 19 (59.4%) | 13 (40.6%) |
| Law Enforcement | 85 (100.0%) | 0 (0.0%) |
| Food Preparation & Serving | 29 (52.7%) | 26 (47.3%) |
| Cleaning & Maintenance | 0 (0.0%) | 82 (100.0%) |
| Personal Care & Service | 42 (36.5%) | 73 (63.5%) |
| Total (Category) | 175 (40.8%) | 254 (59.2%) |
| Total (Overall) | 1,290 (58.8%) | 905 (41.2%) |
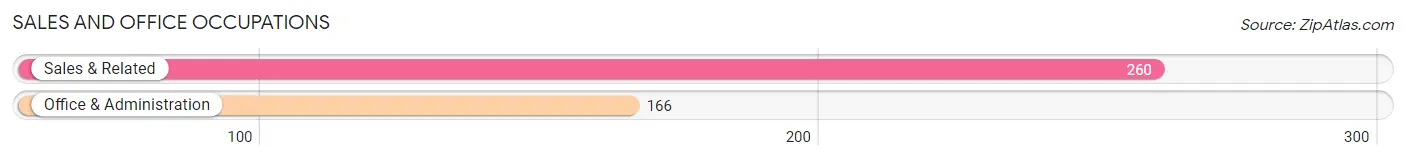
Sales and Office Occupations
The most common Sales and Office occupations in Westlake are Sales & Related (260 | 11.8%), and Office & Administration (166 | 7.6%).
Sales and Office Occupations by Sex
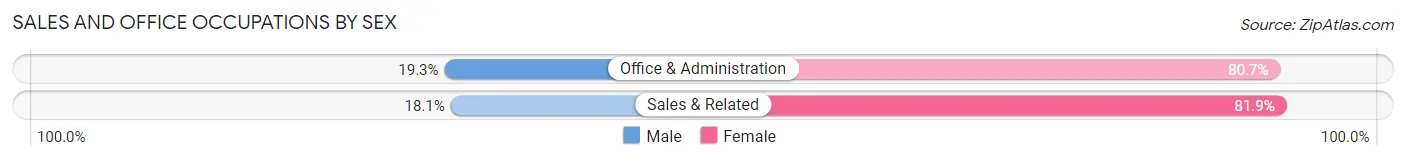
| Occupation | Male | Female |
| Sales & Related | 47 (18.1%) | 213 (81.9%) |
| Office & Administration | 32 (19.3%) | 134 (80.7%) |
| Total (Category) | 79 (18.5%) | 347 (81.5%) |
| Total (Overall) | 1,290 (58.8%) | 905 (41.2%) |
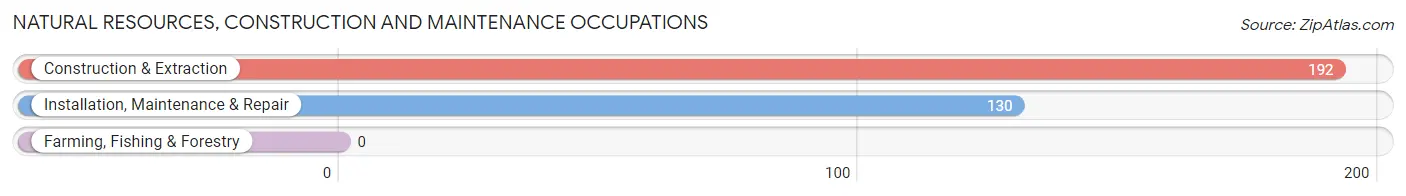
Natural Resources, Construction and Maintenance Occupations
The most common Natural Resources, Construction and Maintenance occupations in Westlake are Construction & Extraction (192 | 8.7%), and Installation, Maintenance & Repair (130 | 5.9%).
Natural Resources, Construction and Maintenance Occupations by Sex
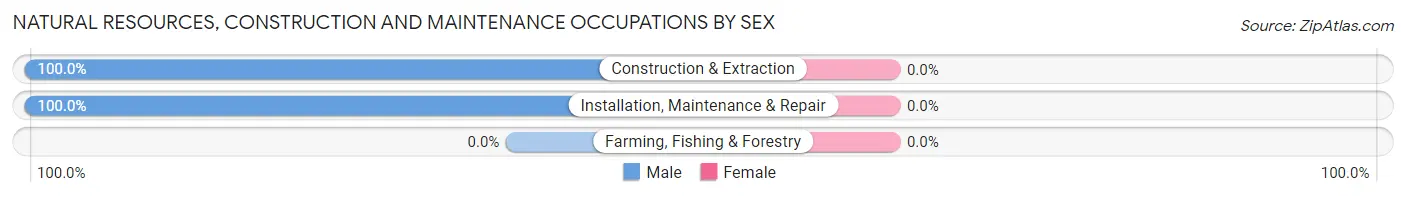
| Occupation | Male | Female |
| Farming, Fishing & Forestry | 0 (0.0%) | 0 (0.0%) |
| Construction & Extraction | 192 (100.0%) | 0 (0.0%) |
| Installation, Maintenance & Repair | 130 (100.0%) | 0 (0.0%) |
| Total (Category) | 322 (100.0%) | 0 (0.0%) |
| Total (Overall) | 1,290 (58.8%) | 905 (41.2%) |
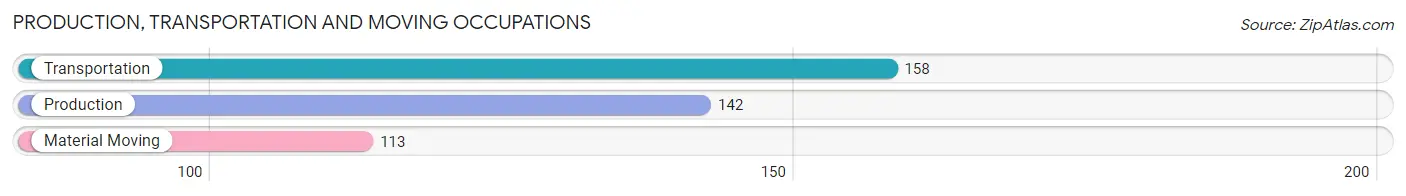
Production, Transportation and Moving Occupations
The most common Production, Transportation and Moving occupations in Westlake are Transportation (158 | 7.2%), Production (142 | 6.5%), and Material Moving (113 | 5.1%).
Production, Transportation and Moving Occupations by Sex
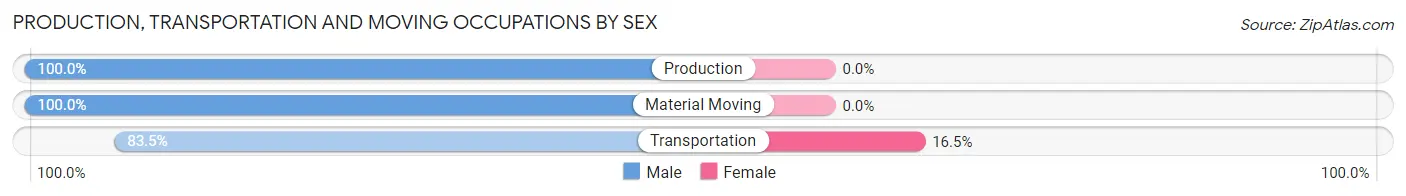
| Occupation | Male | Female |
| Production | 142 (100.0%) | 0 (0.0%) |
| Transportation | 132 (83.5%) | 26 (16.5%) |
| Material Moving | 113 (100.0%) | 0 (0.0%) |
| Total (Category) | 387 (93.7%) | 26 (6.3%) |
| Total (Overall) | 1,290 (58.8%) | 905 (41.2%) |
Employment Industries by Sex in Westlake
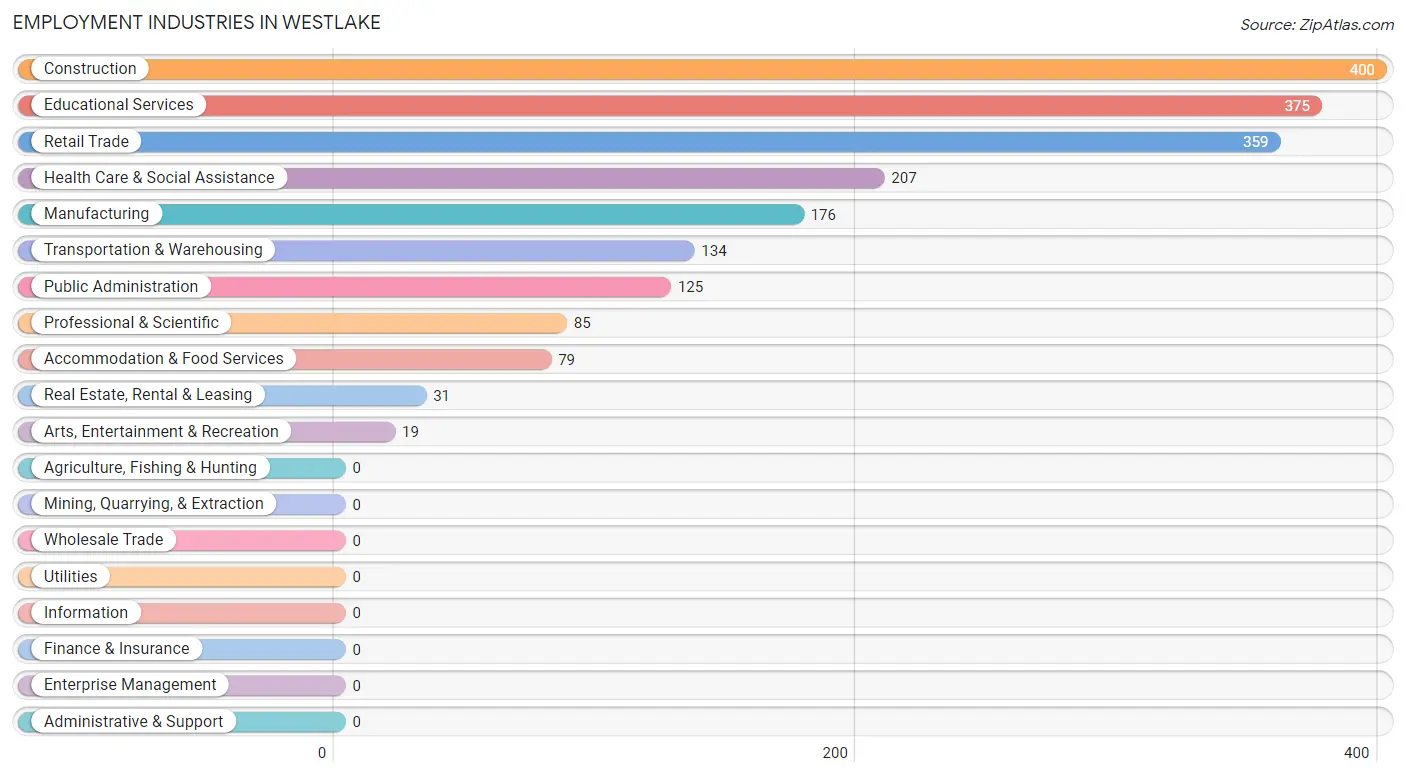
Employment Industries in Westlake
The major employment industries in Westlake include Construction (400 | 18.2%), Educational Services (375 | 17.1%), Retail Trade (359 | 16.4%), Health Care & Social Assistance (207 | 9.4%), and Manufacturing (176 | 8.0%).
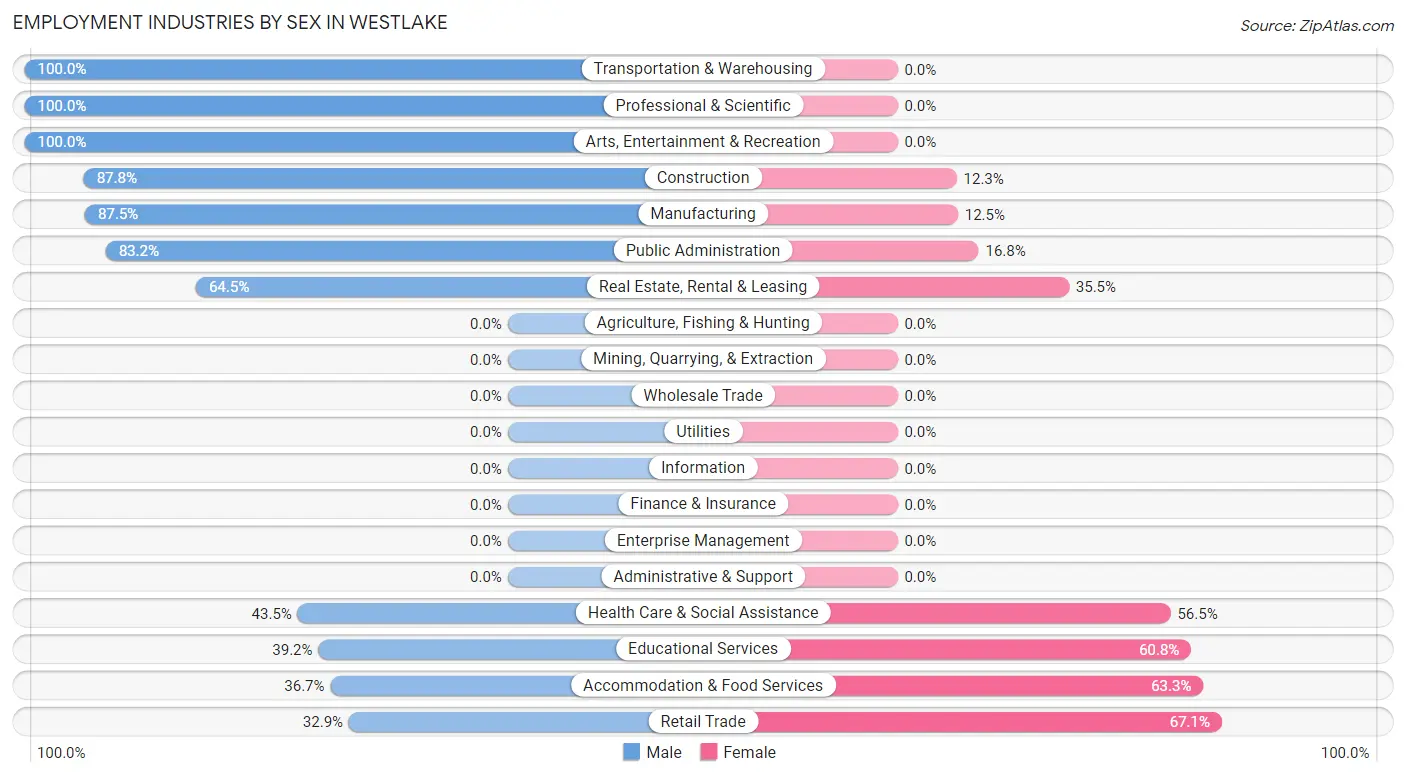
Employment Industries by Sex in Westlake
The Westlake industries that see more men than women are Transportation & Warehousing (100.0%), Professional & Scientific (100.0%), and Arts, Entertainment & Recreation (100.0%), whereas the industries that tend to have a higher number of women are Retail Trade (67.1%), Accommodation & Food Services (63.3%), and Educational Services (60.8%).
| Industry | Male | Female |
| Agriculture, Fishing & Hunting | 0 (0.0%) | 0 (0.0%) |
| Mining, Quarrying, & Extraction | 0 (0.0%) | 0 (0.0%) |
| Construction | 351 (87.7%) | 49 (12.2%) |
| Manufacturing | 154 (87.5%) | 22 (12.5%) |
| Wholesale Trade | 0 (0.0%) | 0 (0.0%) |
| Retail Trade | 118 (32.9%) | 241 (67.1%) |
| Transportation & Warehousing | 134 (100.0%) | 0 (0.0%) |
| Utilities | 0 (0.0%) | 0 (0.0%) |
| Information | 0 (0.0%) | 0 (0.0%) |
| Finance & Insurance | 0 (0.0%) | 0 (0.0%) |
| Real Estate, Rental & Leasing | 20 (64.5%) | 11 (35.5%) |
| Professional & Scientific | 85 (100.0%) | 0 (0.0%) |
| Enterprise Management | 0 (0.0%) | 0 (0.0%) |
| Administrative & Support | 0 (0.0%) | 0 (0.0%) |
| Educational Services | 147 (39.2%) | 228 (60.8%) |
| Health Care & Social Assistance | 90 (43.5%) | 117 (56.5%) |
| Arts, Entertainment & Recreation | 19 (100.0%) | 0 (0.0%) |
| Accommodation & Food Services | 29 (36.7%) | 50 (63.3%) |
| Public Administration | 104 (83.2%) | 21 (16.8%) |
| Total | 1,290 (58.8%) | 905 (41.2%) |
Education in Westlake
School Enrollment in Westlake
The most common levels of schooling among the 800 students in Westlake are middle school (271 | 33.9%), high school (208 | 26.0%), and elementary school (188 | 23.5%).
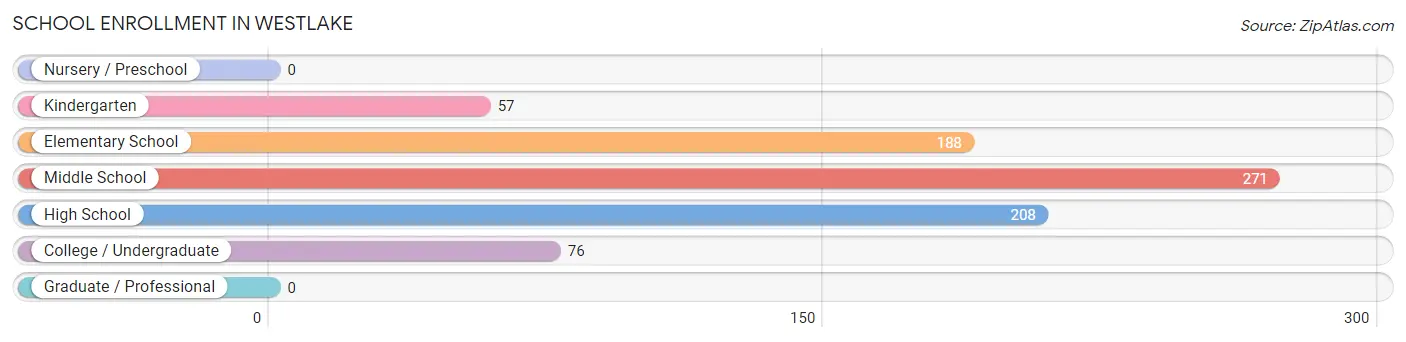
| School Level | # Students | % Students |
| Nursery / Preschool | 0 | 0.0% |
| Kindergarten | 57 | 7.1% |
| Elementary School | 188 | 23.5% |
| Middle School | 271 | 33.9% |
| High School | 208 | 26.0% |
| College / Undergraduate | 76 | 9.5% |
| Graduate / Professional | 0 | 0.0% |
| Total | 800 | 100.0% |
School Enrollment by Age by Funding Source in Westlake
Out of a total of 800 students who are enrolled in schools in Westlake, 22 (2.8%) attend a private institution, while the remaining 778 (97.2%) are enrolled in public schools. The age group of 10 to 14 year olds has the highest likelihood of being enrolled in private schools, with 22 (10.6% in the age bracket) enrolled. Conversely, the age group of 5 to 9 year old has the lowest likelihood of being enrolled in a private school, with 280 (100.0% in the age bracket) attending a public institution.
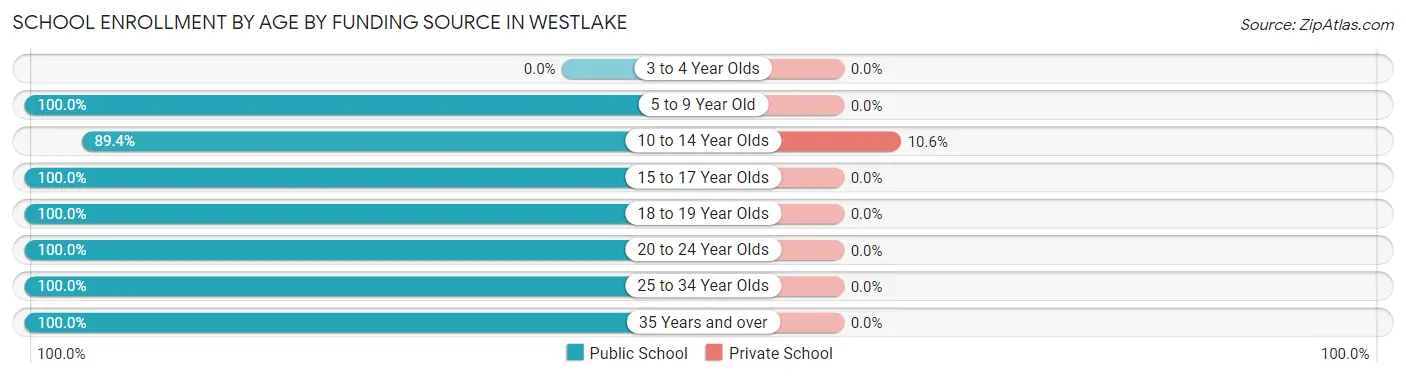
| Age Bracket | Public School | Private School |
| 3 to 4 Year Olds | 0 (0.0%) | 0 (0.0%) |
| 5 to 9 Year Old | 280 (100.0%) | 0 (0.0%) |
| 10 to 14 Year Olds | 185 (89.4%) | 22 (10.6%) |
| 15 to 17 Year Olds | 169 (100.0%) | 0 (0.0%) |
| 18 to 19 Year Olds | 68 (100.0%) | 0 (0.0%) |
| 20 to 24 Year Olds | 9 (100.0%) | 0 (0.0%) |
| 25 to 34 Year Olds | 27 (100.0%) | 0 (0.0%) |
| 35 Years and over | 40 (100.0%) | 0 (0.0%) |
| Total | 778 (97.3%) | 22 (2.8%) |
Educational Attainment by Field of Study in Westlake
Arts & humanities (269 | 35.2%), psychology (118 | 15.4%), business (91 | 11.9%), education (86 | 11.3%), and engineering (66 | 8.6%) are the most common fields of study among 764 individuals in Westlake who have obtained a bachelor's degree or higher.
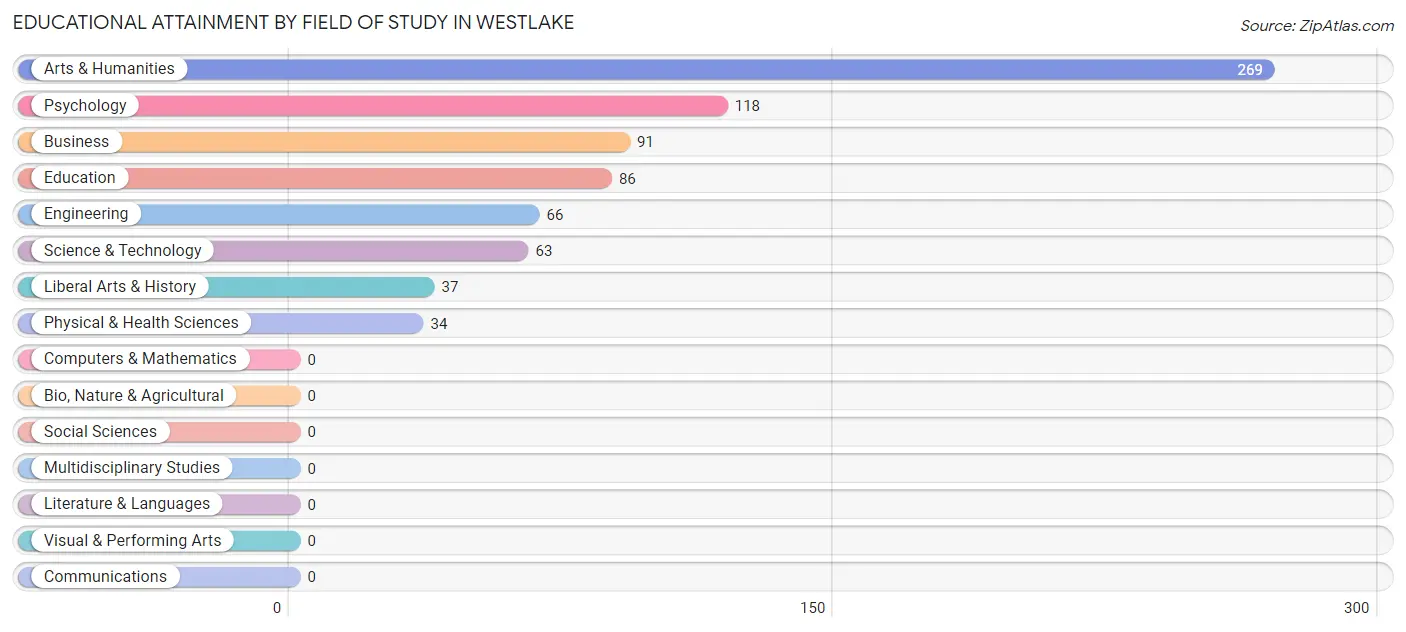
| Field of Study | # Graduates | % Graduates |
| Computers & Mathematics | 0 | 0.0% |
| Bio, Nature & Agricultural | 0 | 0.0% |
| Physical & Health Sciences | 34 | 4.4% |
| Psychology | 118 | 15.4% |
| Social Sciences | 0 | 0.0% |
| Engineering | 66 | 8.6% |
| Multidisciplinary Studies | 0 | 0.0% |
| Science & Technology | 63 | 8.3% |
| Business | 91 | 11.9% |
| Education | 86 | 11.3% |
| Literature & Languages | 0 | 0.0% |
| Liberal Arts & History | 37 | 4.8% |
| Visual & Performing Arts | 0 | 0.0% |
| Communications | 0 | 0.0% |
| Arts & Humanities | 269 | 35.2% |
| Total | 764 | 100.0% |
Transportation & Commute in Westlake
Vehicle Availability by Sex in Westlake
The most prevalent vehicle ownership categories in Westlake are males with 2 vehicles (599, accounting for 46.9%) and females with 2 vehicles (328, making up 68.7%).
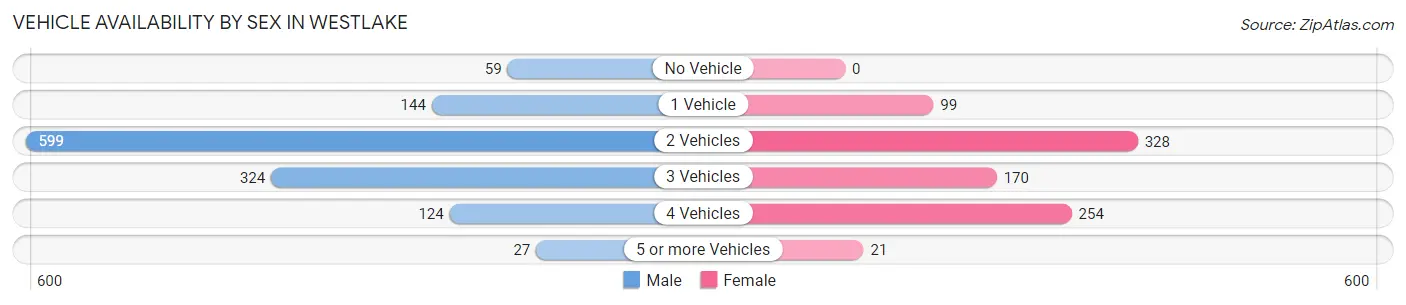
| Vehicles Available | Male | Female |
| No Vehicle | 59 (4.6%) | 0 (0.0%) |
| 1 Vehicle | 144 (11.3%) | 99 (11.4%) |
| 2 Vehicles | 599 (46.9%) | 328 (37.6%) |
| 3 Vehicles | 324 (25.4%) | 170 (19.5%) |
| 4 Vehicles | 124 (9.7%) | 254 (29.1%) |
| 5 or more Vehicles | 27 (2.1%) | 21 (2.4%) |
| Total | 1,277 (100.0%) | 872 (100.0%) |
Commute Time in Westlake
The most frequently occuring commute durations in Westlake are 15 to 19 minutes (907 commuters, 42.7%), 45 to 59 minutes (305 commuters, 14.3%), and 20 to 24 minutes (274 commuters, 12.9%).
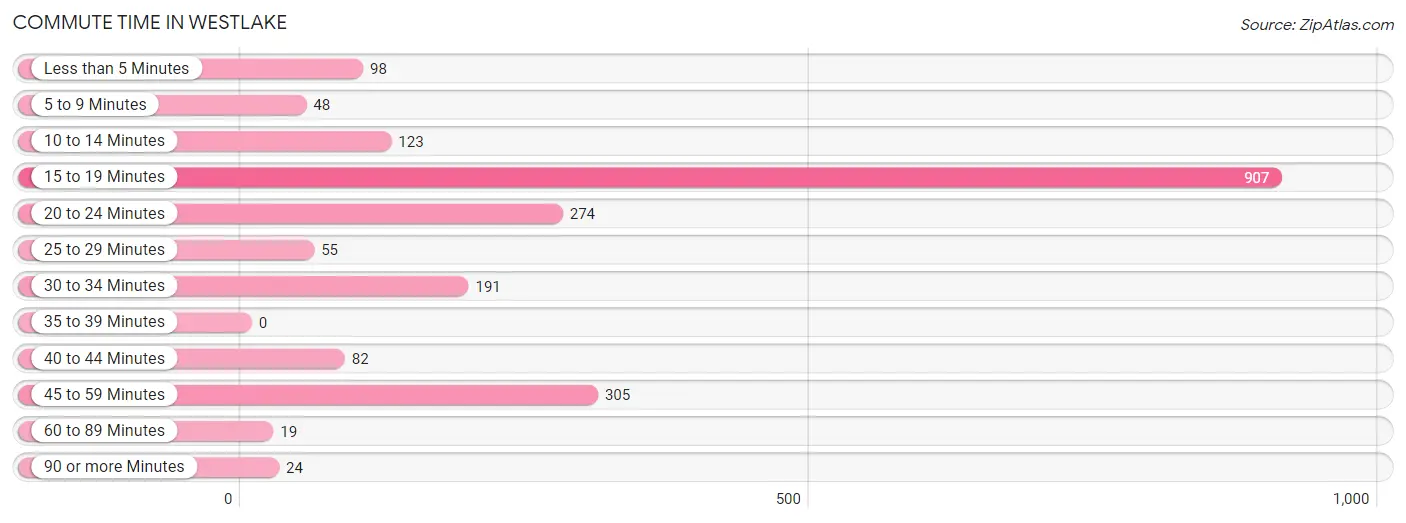
| Commute Time | # Commuters | % Commuters |
| Less than 5 Minutes | 98 | 4.6% |
| 5 to 9 Minutes | 48 | 2.3% |
| 10 to 14 Minutes | 123 | 5.8% |
| 15 to 19 Minutes | 907 | 42.7% |
| 20 to 24 Minutes | 274 | 12.9% |
| 25 to 29 Minutes | 55 | 2.6% |
| 30 to 34 Minutes | 191 | 9.0% |
| 35 to 39 Minutes | 0 | 0.0% |
| 40 to 44 Minutes | 82 | 3.9% |
| 45 to 59 Minutes | 305 | 14.3% |
| 60 to 89 Minutes | 19 | 0.9% |
| 90 or more Minutes | 24 | 1.1% |
Commute Time by Sex in Westlake
The most common commute times in Westlake are 15 to 19 minutes (517 commuters, 41.2%) for males and 15 to 19 minutes (390 commuters, 44.7%) for females.
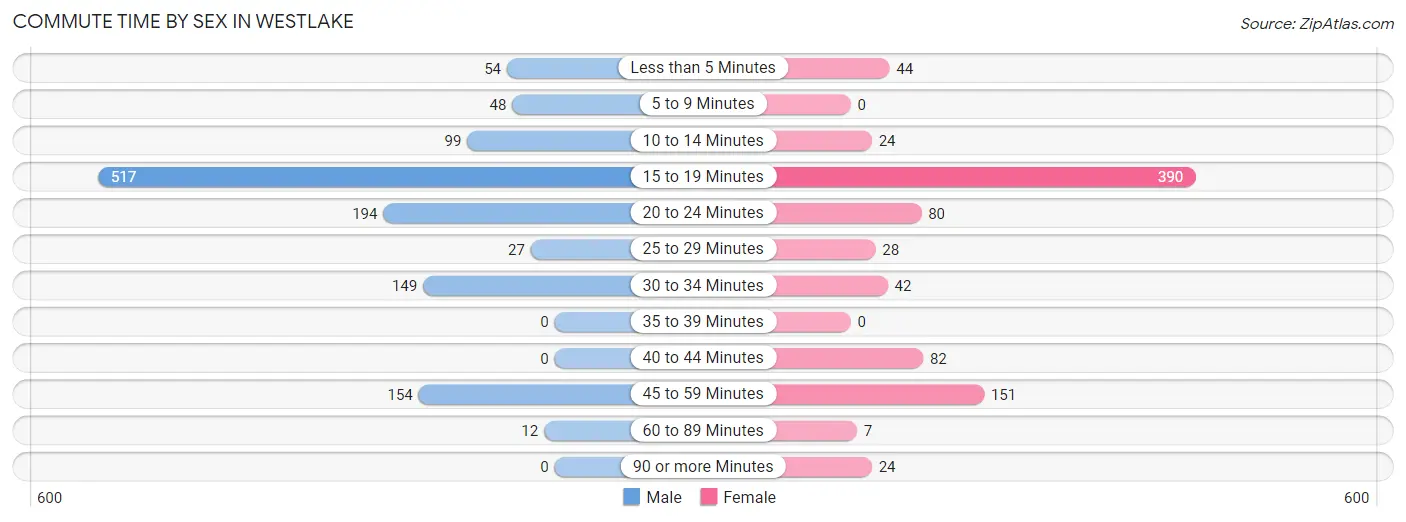
| Commute Time | Male | Female |
| Less than 5 Minutes | 54 (4.3%) | 44 (5.1%) |
| 5 to 9 Minutes | 48 (3.8%) | 0 (0.0%) |
| 10 to 14 Minutes | 99 (7.9%) | 24 (2.8%) |
| 15 to 19 Minutes | 517 (41.2%) | 390 (44.7%) |
| 20 to 24 Minutes | 194 (15.5%) | 80 (9.2%) |
| 25 to 29 Minutes | 27 (2.1%) | 28 (3.2%) |
| 30 to 34 Minutes | 149 (11.9%) | 42 (4.8%) |
| 35 to 39 Minutes | 0 (0.0%) | 0 (0.0%) |
| 40 to 44 Minutes | 0 (0.0%) | 82 (9.4%) |
| 45 to 59 Minutes | 154 (12.3%) | 151 (17.3%) |
| 60 to 89 Minutes | 12 (1.0%) | 7 (0.8%) |
| 90 or more Minutes | 0 (0.0%) | 24 (2.8%) |
Time of Departure to Work by Sex in Westlake
The most frequent times of departure to work in Westlake are 6:30 AM to 6:59 AM (326, 26.0%) for males and 7:30 AM to 7:59 AM (254, 29.1%) for females.
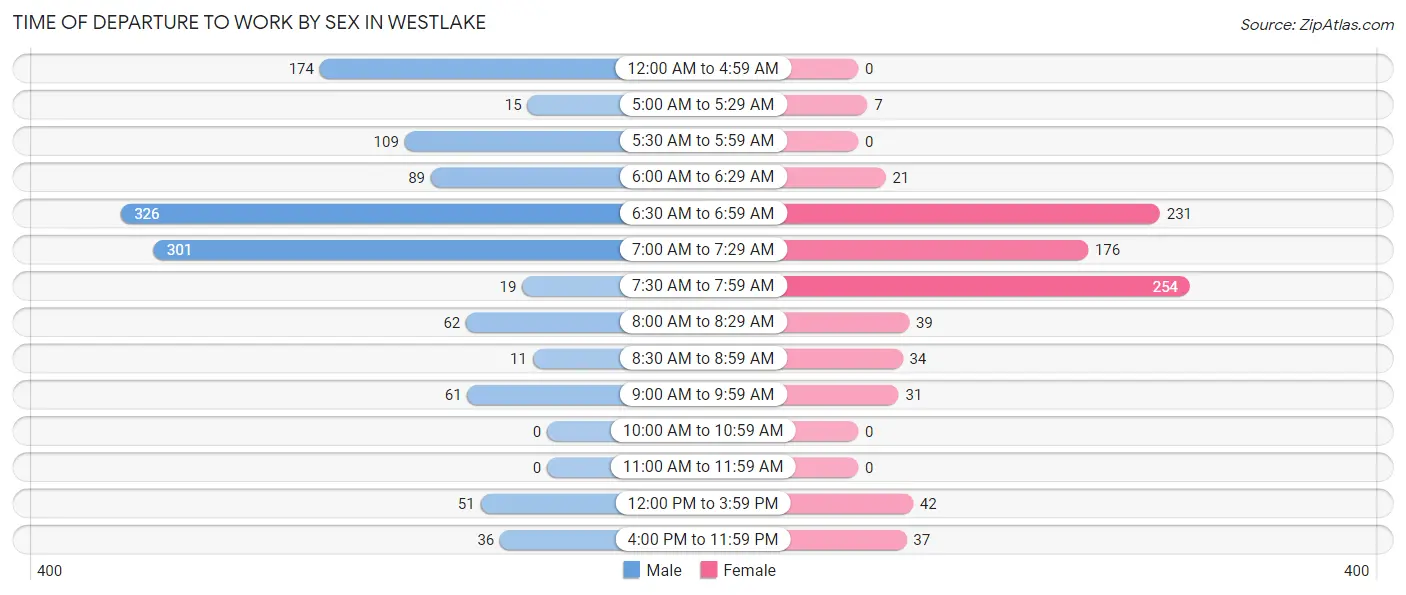
| Time of Departure | Male | Female |
| 12:00 AM to 4:59 AM | 174 (13.9%) | 0 (0.0%) |
| 5:00 AM to 5:29 AM | 15 (1.2%) | 7 (0.8%) |
| 5:30 AM to 5:59 AM | 109 (8.7%) | 0 (0.0%) |
| 6:00 AM to 6:29 AM | 89 (7.1%) | 21 (2.4%) |
| 6:30 AM to 6:59 AM | 326 (26.0%) | 231 (26.5%) |
| 7:00 AM to 7:29 AM | 301 (24.0%) | 176 (20.2%) |
| 7:30 AM to 7:59 AM | 19 (1.5%) | 254 (29.1%) |
| 8:00 AM to 8:29 AM | 62 (4.9%) | 39 (4.5%) |
| 8:30 AM to 8:59 AM | 11 (0.9%) | 34 (3.9%) |
| 9:00 AM to 9:59 AM | 61 (4.9%) | 31 (3.6%) |
| 10:00 AM to 10:59 AM | 0 (0.0%) | 0 (0.0%) |
| 11:00 AM to 11:59 AM | 0 (0.0%) | 0 (0.0%) |
| 12:00 PM to 3:59 PM | 51 (4.1%) | 42 (4.8%) |
| 4:00 PM to 11:59 PM | 36 (2.9%) | 37 (4.2%) |
| Total | 1,254 (100.0%) | 872 (100.0%) |
Housing Occupancy in Westlake
Occupancy by Ownership in Westlake
Of the total 2,061 dwellings in Westlake, owner-occupied units account for 1,692 (82.1%), while renter-occupied units make up 369 (17.9%).
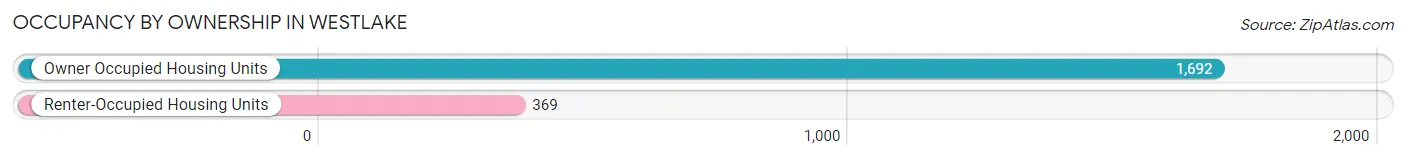
| Occupancy | # Housing Units | % Housing Units |
| Owner Occupied Housing Units | 1,692 | 82.1% |
| Renter-Occupied Housing Units | 369 | 17.9% |
| Total Occupied Housing Units | 2,061 | 100.0% |
Occupancy by Household Size in Westlake
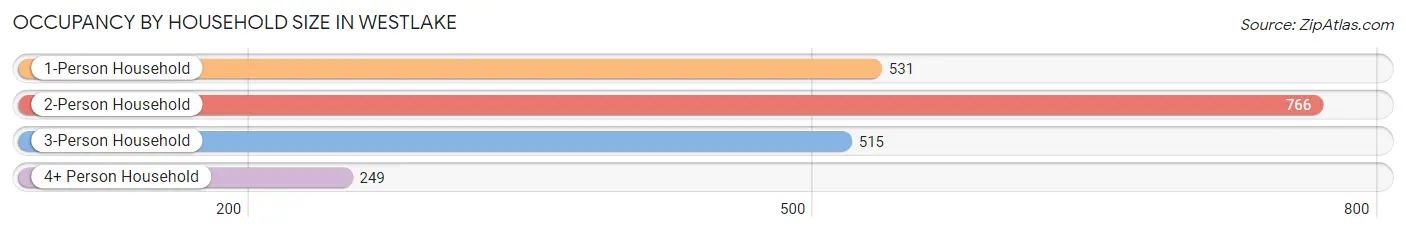
| Household Size | # Housing Units | % Housing Units |
| 1-Person Household | 531 | 25.8% |
| 2-Person Household | 766 | 37.2% |
| 3-Person Household | 515 | 25.0% |
| 4+ Person Household | 249 | 12.1% |
| Total Housing Units | 2,061 | 100.0% |
Occupancy by Ownership by Household Size in Westlake
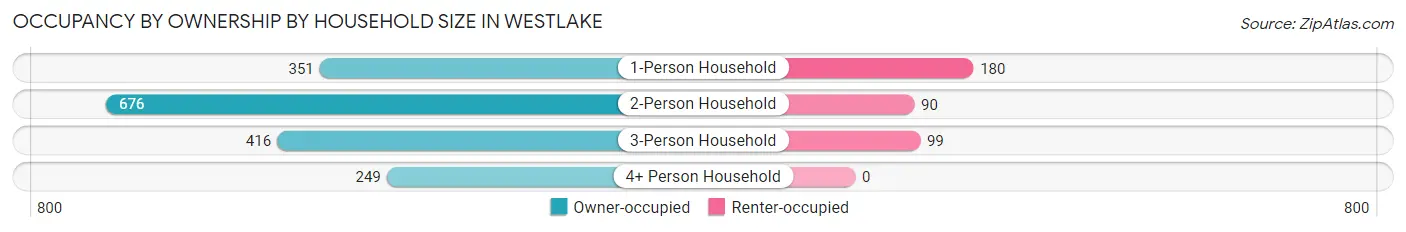
| Household Size | Owner-occupied | Renter-occupied |
| 1-Person Household | 351 (66.1%) | 180 (33.9%) |
| 2-Person Household | 676 (88.2%) | 90 (11.7%) |
| 3-Person Household | 416 (80.8%) | 99 (19.2%) |
| 4+ Person Household | 249 (100.0%) | 0 (0.0%) |
| Total Housing Units | 1,692 (82.1%) | 369 (17.9%) |
Occupancy by Educational Attainment in Westlake
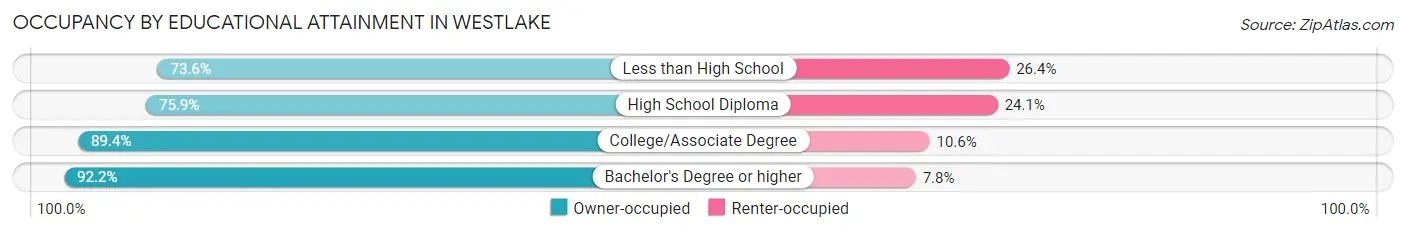
| Household Size | Owner-occupied | Renter-occupied |
| Less than High School | 254 (73.6%) | 91 (26.4%) |
| High School Diploma | 583 (75.9%) | 185 (24.1%) |
| College/Associate Degree | 608 (89.4%) | 72 (10.6%) |
| Bachelor's Degree or higher | 247 (92.2%) | 21 (7.8%) |
Occupancy by Age of Householder in Westlake
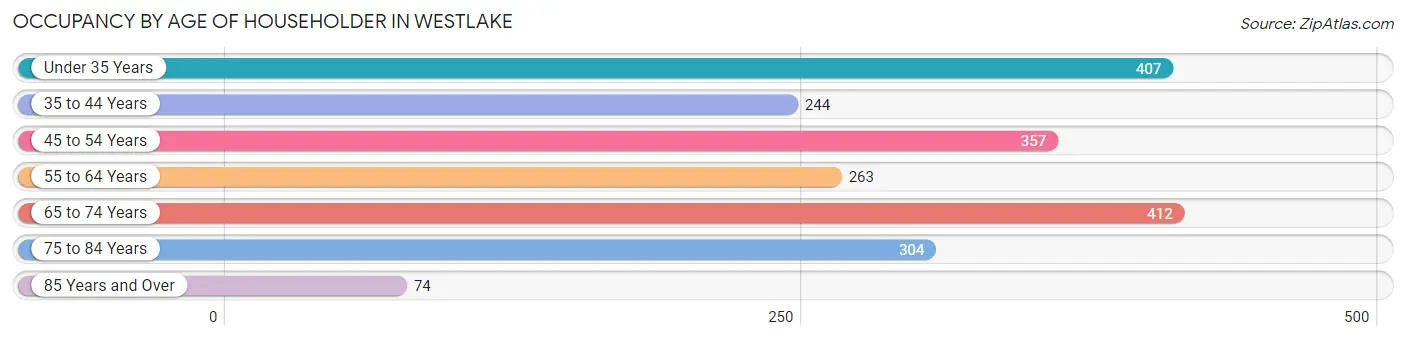
| Age Bracket | # Households | % Households |
| Under 35 Years | 407 | 19.8% |
| 35 to 44 Years | 244 | 11.8% |
| 45 to 54 Years | 357 | 17.3% |
| 55 to 64 Years | 263 | 12.8% |
| 65 to 74 Years | 412 | 20.0% |
| 75 to 84 Years | 304 | 14.7% |
| 85 Years and Over | 74 | 3.6% |
| Total | 2,061 | 100.0% |
Housing Finances in Westlake
Median Income by Occupancy in Westlake
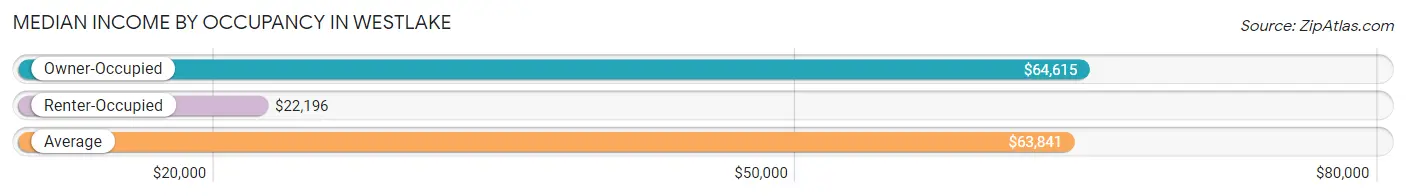
| Occupancy Type | # Households | Median Income |
| Owner-Occupied | 1,692 (82.1%) | $64,615 |
| Renter-Occupied | 369 (17.9%) | $22,196 |
| Average | 2,061 (100.0%) | $63,841 |
Occupancy by Householder Income Bracket in Westlake
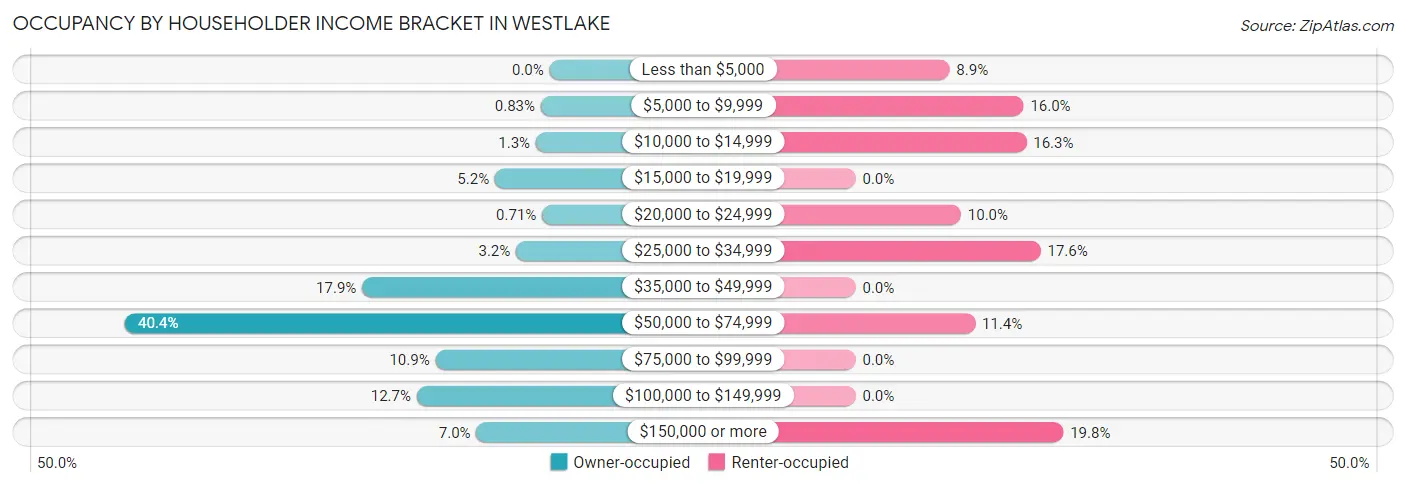
| Income Bracket | Owner-occupied | Renter-occupied |
| Less than $5,000 | 0 (0.0%) | 33 (8.9%) |
| $5,000 to $9,999 | 14 (0.8%) | 59 (16.0%) |
| $10,000 to $14,999 | 22 (1.3%) | 60 (16.3%) |
| $15,000 to $19,999 | 88 (5.2%) | 0 (0.0%) |
| $20,000 to $24,999 | 12 (0.7%) | 37 (10.0%) |
| $25,000 to $34,999 | 54 (3.2%) | 65 (17.6%) |
| $35,000 to $49,999 | 302 (17.8%) | 0 (0.0%) |
| $50,000 to $74,999 | 684 (40.4%) | 42 (11.4%) |
| $75,000 to $99,999 | 184 (10.9%) | 0 (0.0%) |
| $100,000 to $149,999 | 214 (12.7%) | 0 (0.0%) |
| $150,000 or more | 118 (7.0%) | 73 (19.8%) |
| Total | 1,692 (100.0%) | 369 (100.0%) |
Monthly Housing Cost Tiers in Westlake
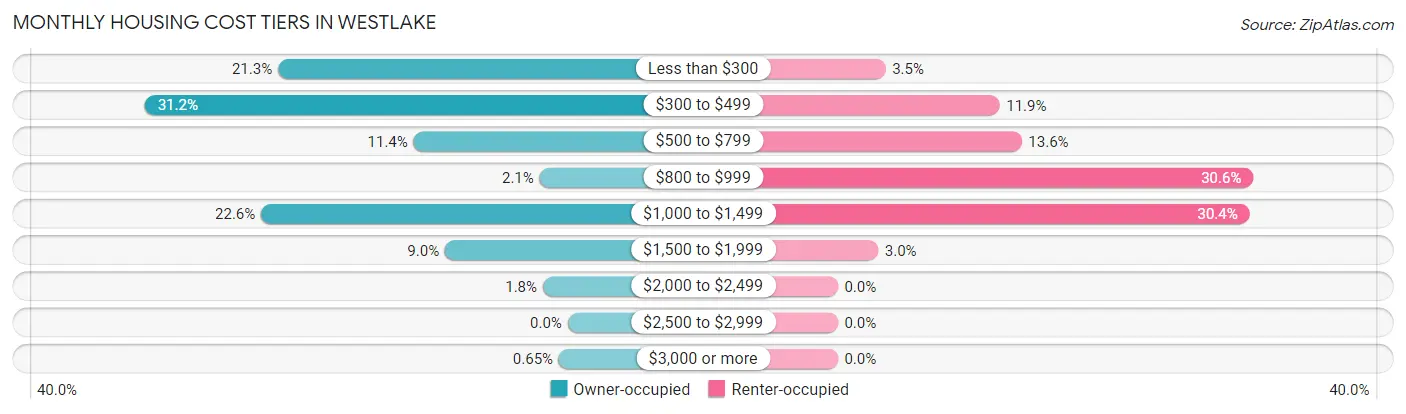
| Monthly Cost | Owner-occupied | Renter-occupied |
| Less than $300 | 361 (21.3%) | 13 (3.5%) |
| $300 to $499 | 527 (31.1%) | 44 (11.9%) |
| $500 to $799 | 192 (11.4%) | 50 (13.6%) |
| $800 to $999 | 35 (2.1%) | 113 (30.6%) |
| $1,000 to $1,499 | 382 (22.6%) | 112 (30.3%) |
| $1,500 to $1,999 | 153 (9.0%) | 11 (3.0%) |
| $2,000 to $2,499 | 31 (1.8%) | 0 (0.0%) |
| $2,500 to $2,999 | 0 (0.0%) | 0 (0.0%) |
| $3,000 or more | 11 (0.6%) | 0 (0.0%) |
| Total | 1,692 (100.0%) | 369 (100.0%) |
Physical Housing Characteristics in Westlake
Housing Structures in Westlake
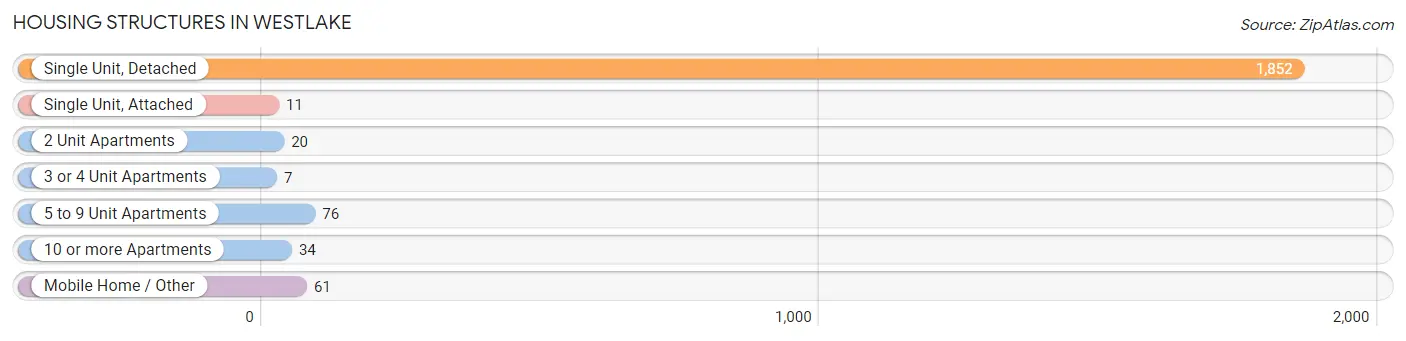
| Structure Type | # Housing Units | % Housing Units |
| Single Unit, Detached | 1,852 | 89.9% |
| Single Unit, Attached | 11 | 0.5% |
| 2 Unit Apartments | 20 | 1.0% |
| 3 or 4 Unit Apartments | 7 | 0.3% |
| 5 to 9 Unit Apartments | 76 | 3.7% |
| 10 or more Apartments | 34 | 1.7% |
| Mobile Home / Other | 61 | 3.0% |
| Total | 2,061 | 100.0% |
Housing Structures by Occupancy in Westlake
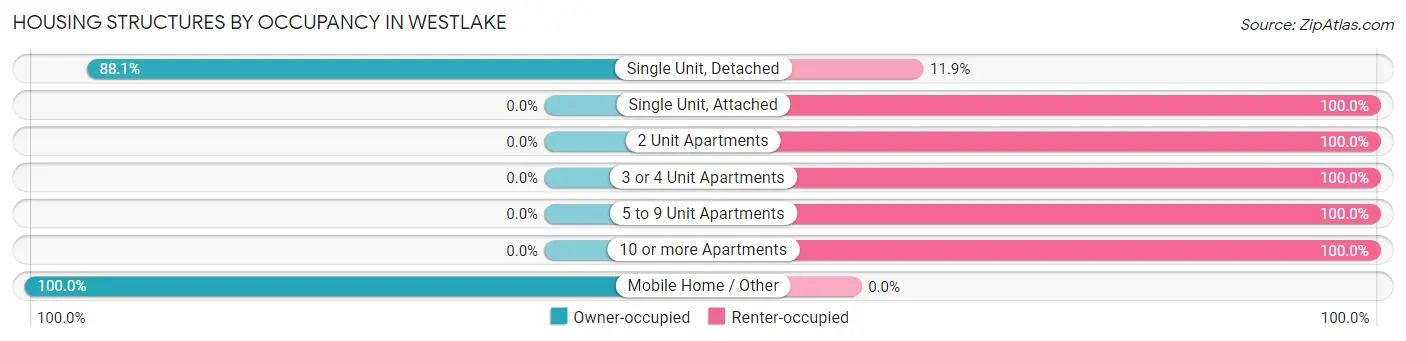
| Structure Type | Owner-occupied | Renter-occupied |
| Single Unit, Detached | 1,631 (88.1%) | 221 (11.9%) |
| Single Unit, Attached | 0 (0.0%) | 11 (100.0%) |
| 2 Unit Apartments | 0 (0.0%) | 20 (100.0%) |
| 3 or 4 Unit Apartments | 0 (0.0%) | 7 (100.0%) |
| 5 to 9 Unit Apartments | 0 (0.0%) | 76 (100.0%) |
| 10 or more Apartments | 0 (0.0%) | 34 (100.0%) |
| Mobile Home / Other | 61 (100.0%) | 0 (0.0%) |
| Total | 1,692 (82.1%) | 369 (17.9%) |
Housing Structures by Number of Rooms in Westlake
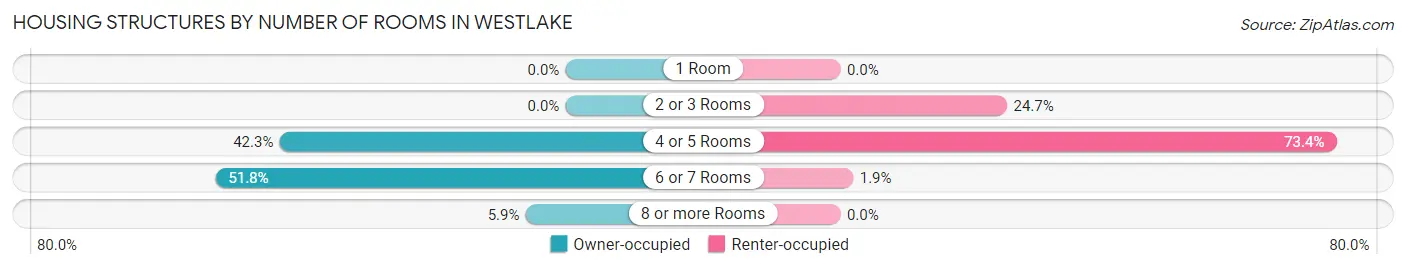
| Number of Rooms | Owner-occupied | Renter-occupied |
| 1 Room | 0 (0.0%) | 0 (0.0%) |
| 2 or 3 Rooms | 0 (0.0%) | 91 (24.7%) |
| 4 or 5 Rooms | 716 (42.3%) | 271 (73.4%) |
| 6 or 7 Rooms | 876 (51.8%) | 7 (1.9%) |
| 8 or more Rooms | 100 (5.9%) | 0 (0.0%) |
| Total | 1,692 (100.0%) | 369 (100.0%) |
Housing Structure by Heating Type in Westlake
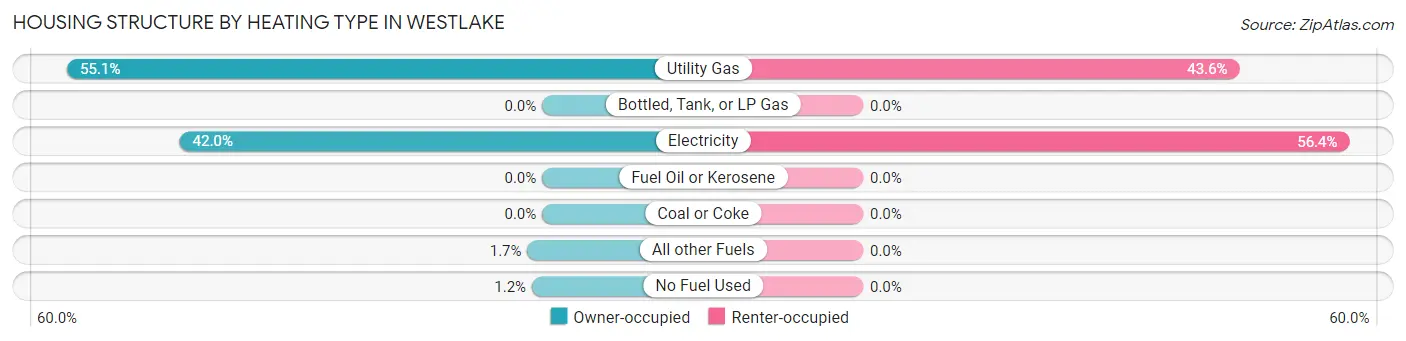
| Heating Type | Owner-occupied | Renter-occupied |
| Utility Gas | 932 (55.1%) | 161 (43.6%) |
| Bottled, Tank, or LP Gas | 0 (0.0%) | 0 (0.0%) |
| Electricity | 711 (42.0%) | 208 (56.4%) |
| Fuel Oil or Kerosene | 0 (0.0%) | 0 (0.0%) |
| Coal or Coke | 0 (0.0%) | 0 (0.0%) |
| All other Fuels | 29 (1.7%) | 0 (0.0%) |
| No Fuel Used | 20 (1.2%) | 0 (0.0%) |
| Total | 1,692 (100.0%) | 369 (100.0%) |
Household Vehicle Usage in Westlake
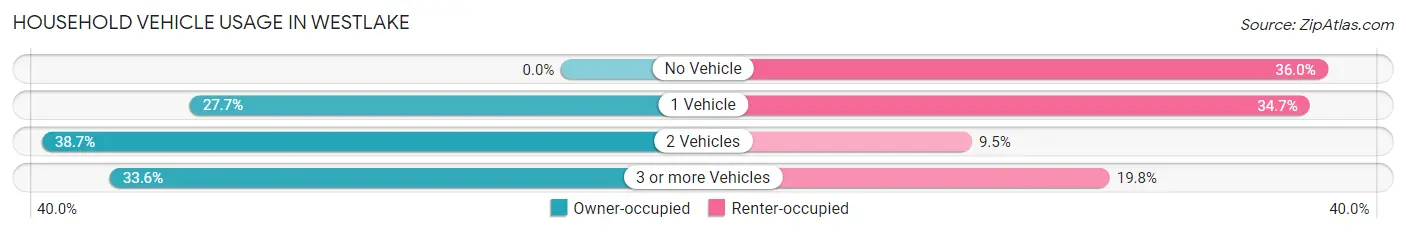
| Vehicles per Household | Owner-occupied | Renter-occupied |
| No Vehicle | 0 (0.0%) | 133 (36.0%) |
| 1 Vehicle | 468 (27.7%) | 128 (34.7%) |
| 2 Vehicles | 655 (38.7%) | 35 (9.5%) |
| 3 or more Vehicles | 569 (33.6%) | 73 (19.8%) |
| Total | 1,692 (100.0%) | 369 (100.0%) |
Real Estate & Mortgages in Westlake
Real Estate and Mortgage Overview in Westlake
| Characteristic | Without Mortgage | With Mortgage |
| Housing Units | 1,013 | 679 |
| Median Property Value | $144,200 | $175,200 |
| Median Household Income | $63,639 | $118 |
| Monthly Housing Costs | $349 | $11 |
| Real Estate Taxes | $465 | $82 |
Property Value by Mortgage Status in Westlake
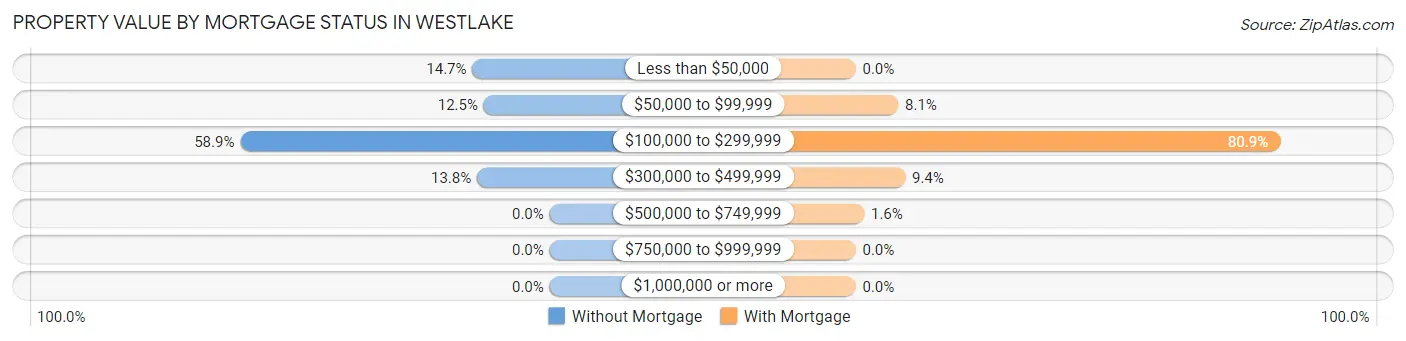
| Property Value | Without Mortgage | With Mortgage |
| Less than $50,000 | 149 (14.7%) | 0 (0.0%) |
| $50,000 to $99,999 | 127 (12.5%) | 55 (8.1%) |
| $100,000 to $299,999 | 597 (58.9%) | 549 (80.8%) |
| $300,000 to $499,999 | 140 (13.8%) | 64 (9.4%) |
| $500,000 to $749,999 | 0 (0.0%) | 11 (1.6%) |
| $750,000 to $999,999 | 0 (0.0%) | 0 (0.0%) |
| $1,000,000 or more | 0 (0.0%) | 0 (0.0%) |
| Total | 1,013 (100.0%) | 679 (100.0%) |
Household Income by Mortgage Status in Westlake
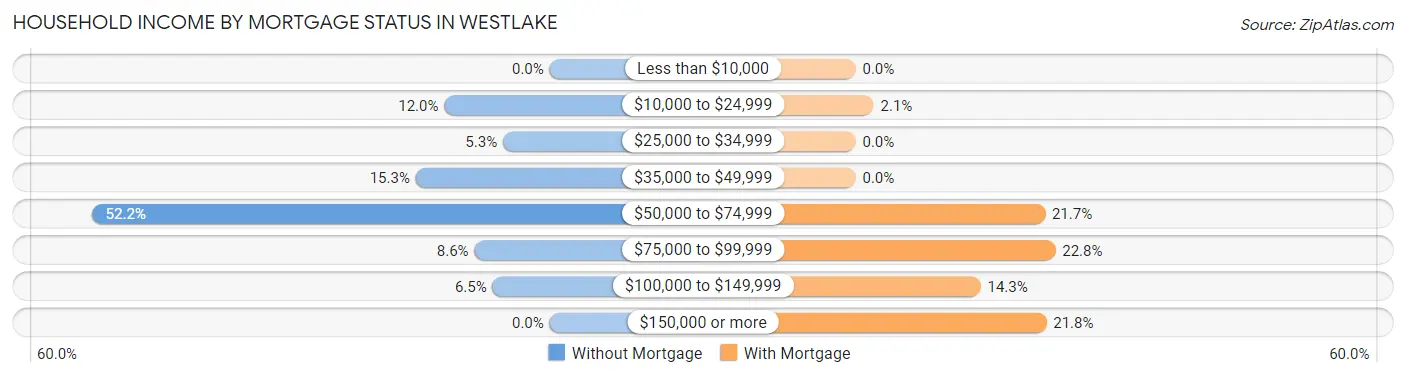
| Household Income | Without Mortgage | With Mortgage |
| Less than $10,000 | 0 (0.0%) | 0 (0.0%) |
| $10,000 to $24,999 | 122 (12.0%) | 14 (2.1%) |
| $25,000 to $34,999 | 54 (5.3%) | 0 (0.0%) |
| $35,000 to $49,999 | 155 (15.3%) | 0 (0.0%) |
| $50,000 to $74,999 | 529 (52.2%) | 147 (21.6%) |
| $75,000 to $99,999 | 87 (8.6%) | 155 (22.8%) |
| $100,000 to $149,999 | 66 (6.5%) | 97 (14.3%) |
| $150,000 or more | 0 (0.0%) | 148 (21.8%) |
| Total | 1,013 (100.0%) | 679 (100.0%) |
Property Value to Household Income Ratio in Westlake
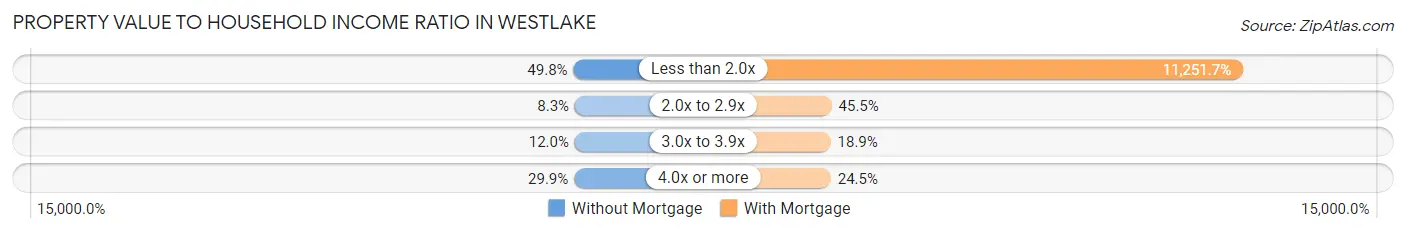
| Value-to-Income Ratio | Without Mortgage | With Mortgage |
| Less than 2.0x | 504 (49.7%) | 76,399 (11,251.7%) |
| 2.0x to 2.9x | 84 (8.3%) | 309 (45.5%) |
| 3.0x to 3.9x | 122 (12.0%) | 128 (18.9%) |
| 4.0x or more | 303 (29.9%) | 166 (24.4%) |
| Total | 1,013 (100.0%) | 679 (100.0%) |
Real Estate Taxes by Mortgage Status in Westlake
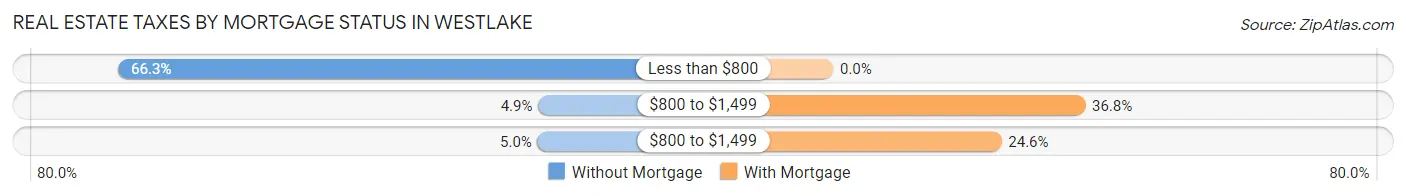
| Property Taxes | Without Mortgage | With Mortgage |
| Less than $800 | 672 (66.3%) | 0 (0.0%) |
| $800 to $1,499 | 50 (4.9%) | 250 (36.8%) |
| $800 to $1,499 | 51 (5.0%) | 167 (24.6%) |
| Total | 1,013 (100.0%) | 679 (100.0%) |
Health & Disability in Westlake
Health Insurance Coverage by Age in Westlake
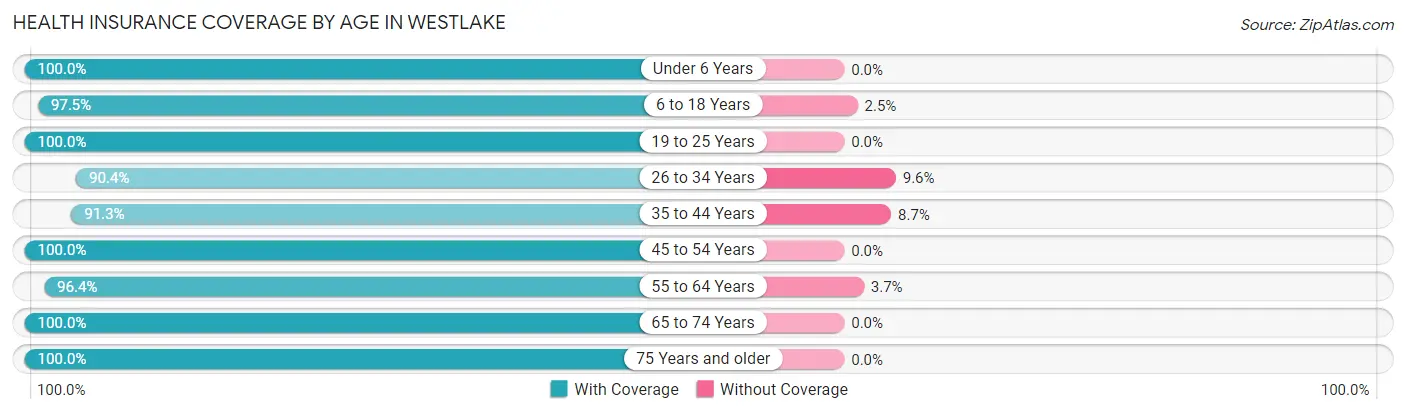
| Age Bracket | With Coverage | Without Coverage |
| Under 6 Years | 348 (100.0%) | 0 (0.0%) |
| 6 to 18 Years | 630 (97.5%) | 16 (2.5%) |
| 19 to 25 Years | 211 (100.0%) | 0 (0.0%) |
| 26 to 34 Years | 960 (90.4%) | 102 (9.6%) |
| 35 to 44 Years | 513 (91.3%) | 49 (8.7%) |
| 45 to 54 Years | 478 (100.0%) | 0 (0.0%) |
| 55 to 64 Years | 449 (96.4%) | 17 (3.6%) |
| 65 to 74 Years | 647 (100.0%) | 0 (0.0%) |
| 75 Years and older | 427 (100.0%) | 0 (0.0%) |
| Total | 4,663 (96.2%) | 184 (3.8%) |
Health Insurance Coverage by Citizenship Status in Westlake
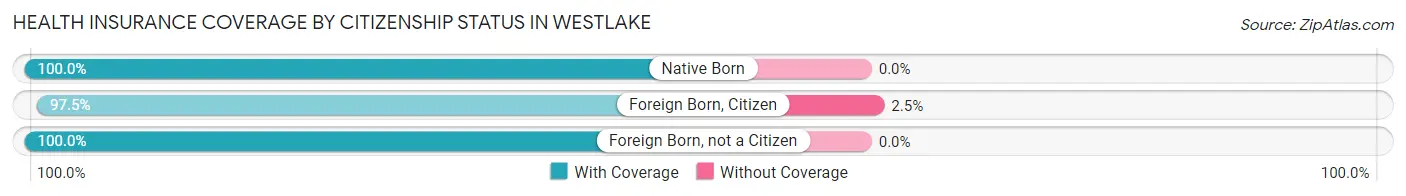
| Citizenship Status | With Coverage | Without Coverage |
| Native Born | 348 (100.0%) | 0 (0.0%) |
| Foreign Born, Citizen | 630 (97.5%) | 16 (2.5%) |
| Foreign Born, not a Citizen | 211 (100.0%) | 0 (0.0%) |
Health Insurance Coverage by Household Income in Westlake
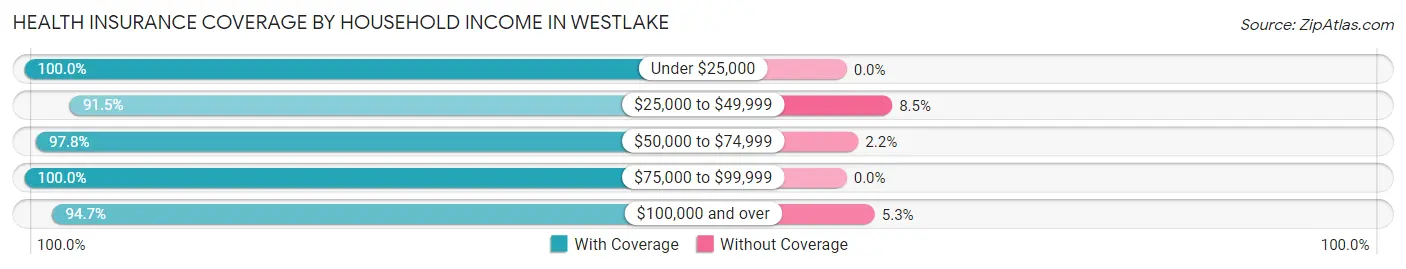
| Household Income | With Coverage | Without Coverage |
| Under $25,000 | 478 (100.0%) | 0 (0.0%) |
| $25,000 to $49,999 | 806 (91.5%) | 75 (8.5%) |
| $50,000 to $74,999 | 1,354 (97.8%) | 30 (2.2%) |
| $75,000 to $99,999 | 603 (100.0%) | 0 (0.0%) |
| $100,000 and over | 1,422 (94.7%) | 79 (5.3%) |
Public vs Private Health Insurance Coverage by Age in Westlake
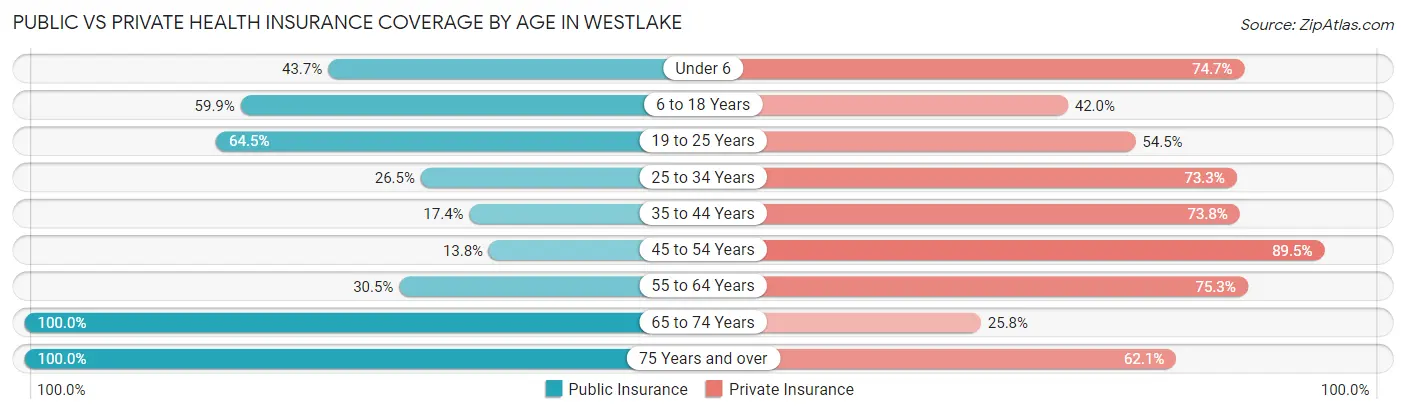
| Age Bracket | Public Insurance | Private Insurance |
| Under 6 | 152 (43.7%) | 260 (74.7%) |
| 6 to 18 Years | 387 (59.9%) | 271 (41.9%) |
| 19 to 25 Years | 136 (64.4%) | 115 (54.5%) |
| 25 to 34 Years | 281 (26.5%) | 778 (73.3%) |
| 35 to 44 Years | 98 (17.4%) | 415 (73.8%) |
| 45 to 54 Years | 66 (13.8%) | 428 (89.5%) |
| 55 to 64 Years | 142 (30.5%) | 351 (75.3%) |
| 65 to 74 Years | 647 (100.0%) | 167 (25.8%) |
| 75 Years and over | 427 (100.0%) | 265 (62.1%) |
| Total | 2,336 (48.2%) | 3,050 (62.9%) |
Disability Status by Sex by Age in Westlake
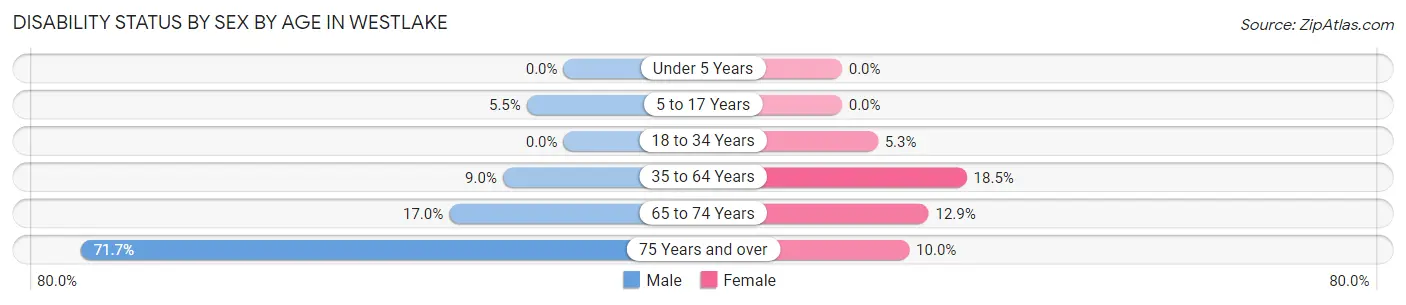
| Age Bracket | Male | Female |
| Under 5 Years | 0 (0.0%) | 0 (0.0%) |
| 5 to 17 Years | 22 (5.4%) | 0 (0.0%) |
| 18 to 34 Years | 0 (0.0%) | 33 (5.3%) |
| 35 to 64 Years | 69 (9.0%) | 137 (18.5%) |
| 65 to 74 Years | 65 (17.0%) | 34 (12.9%) |
| 75 Years and over | 177 (71.7%) | 18 (10.0%) |
Disability Class by Sex by Age in Westlake
Disability Class: Hearing Difficulty
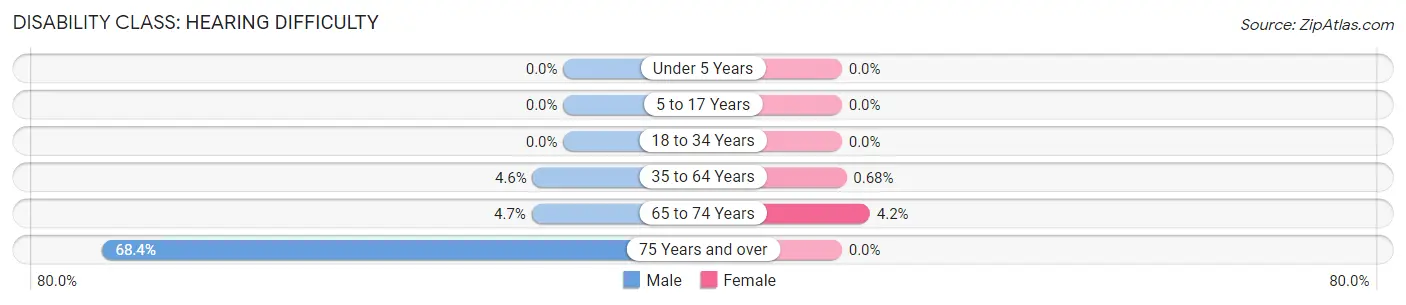
| Age Bracket | Male | Female |
| Under 5 Years | 0 (0.0%) | 0 (0.0%) |
| 5 to 17 Years | 0 (0.0%) | 0 (0.0%) |
| 18 to 34 Years | 0 (0.0%) | 0 (0.0%) |
| 35 to 64 Years | 35 (4.6%) | 5 (0.7%) |
| 65 to 74 Years | 18 (4.7%) | 11 (4.2%) |
| 75 Years and over | 169 (68.4%) | 0 (0.0%) |
Disability Class: Vision Difficulty
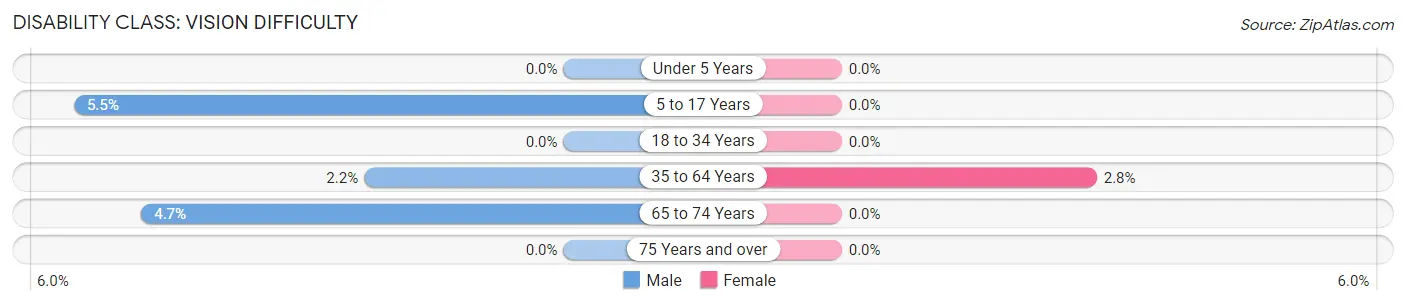
| Age Bracket | Male | Female |
| Under 5 Years | 0 (0.0%) | 0 (0.0%) |
| 5 to 17 Years | 22 (5.4%) | 0 (0.0%) |
| 18 to 34 Years | 0 (0.0%) | 0 (0.0%) |
| 35 to 64 Years | 17 (2.2%) | 21 (2.8%) |
| 65 to 74 Years | 18 (4.7%) | 0 (0.0%) |
| 75 Years and over | 0 (0.0%) | 0 (0.0%) |
Disability Class: Cognitive Difficulty
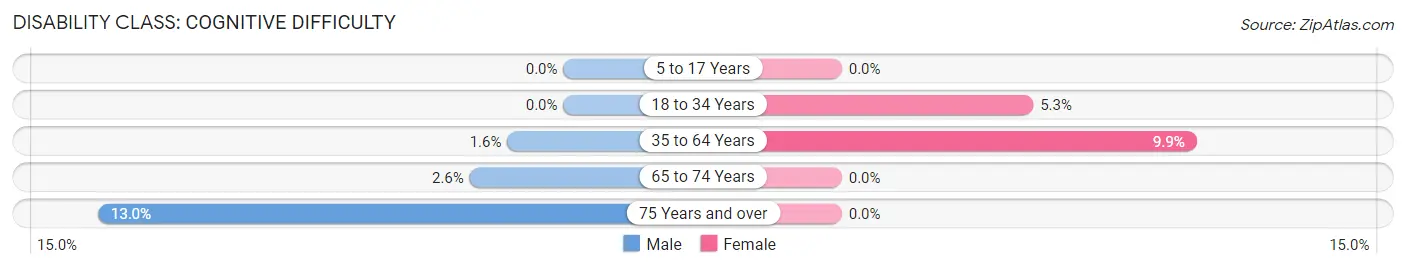
| Age Bracket | Male | Female |
| 5 to 17 Years | 0 (0.0%) | 0 (0.0%) |
| 18 to 34 Years | 0 (0.0%) | 33 (5.3%) |
| 35 to 64 Years | 12 (1.6%) | 73 (9.9%) |
| 65 to 74 Years | 10 (2.6%) | 0 (0.0%) |
| 75 Years and over | 32 (13.0%) | 0 (0.0%) |
Disability Class: Ambulatory Difficulty
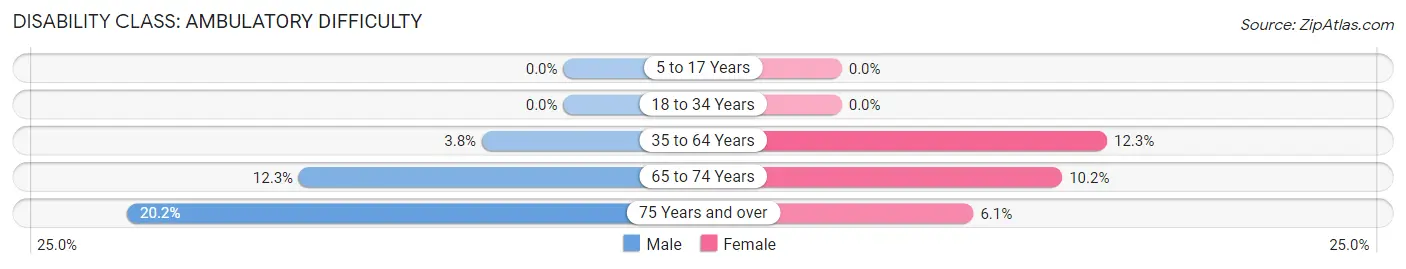
| Age Bracket | Male | Female |
| 5 to 17 Years | 0 (0.0%) | 0 (0.0%) |
| 18 to 34 Years | 0 (0.0%) | 0 (0.0%) |
| 35 to 64 Years | 29 (3.8%) | 91 (12.3%) |
| 65 to 74 Years | 47 (12.3%) | 27 (10.2%) |
| 75 Years and over | 50 (20.2%) | 11 (6.1%) |
Disability Class: Self-Care Difficulty
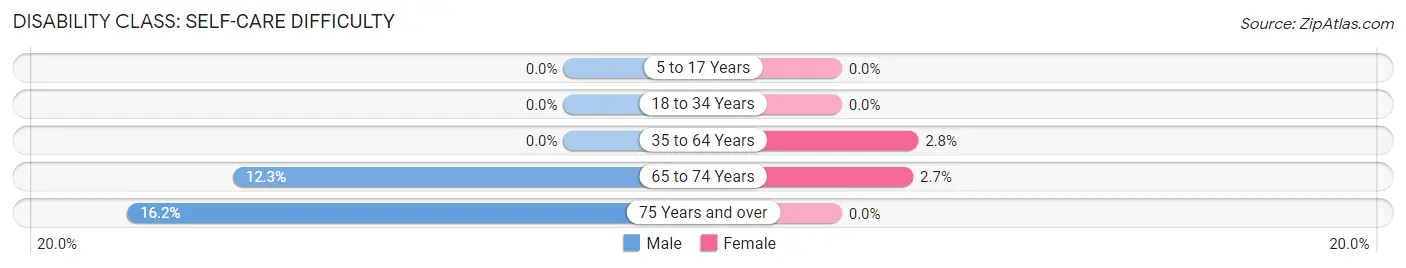
| Age Bracket | Male | Female |
| 5 to 17 Years | 0 (0.0%) | 0 (0.0%) |
| 18 to 34 Years | 0 (0.0%) | 0 (0.0%) |
| 35 to 64 Years | 0 (0.0%) | 21 (2.8%) |
| 65 to 74 Years | 47 (12.3%) | 7 (2.6%) |
| 75 Years and over | 40 (16.2%) | 0 (0.0%) |
Technology Access in Westlake
Computing Device Access in Westlake
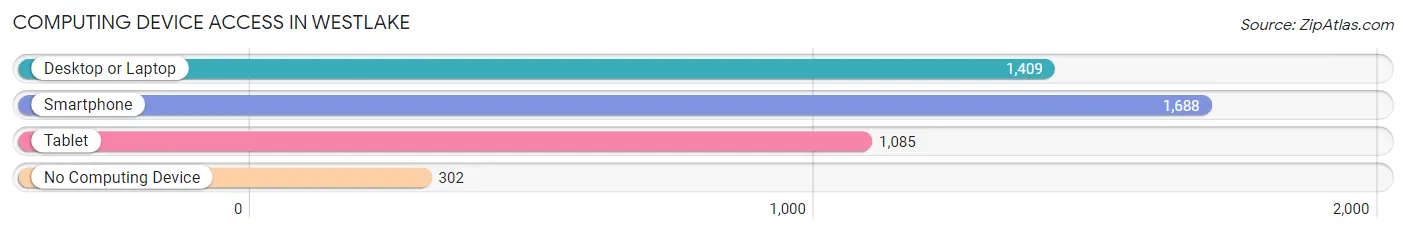
| Device Type | # Households | % Households |
| Desktop or Laptop | 1,409 | 68.4% |
| Smartphone | 1,688 | 81.9% |
| Tablet | 1,085 | 52.6% |
| No Computing Device | 302 | 14.6% |
| Total | 2,061 | 100.0% |
Internet Access in Westlake
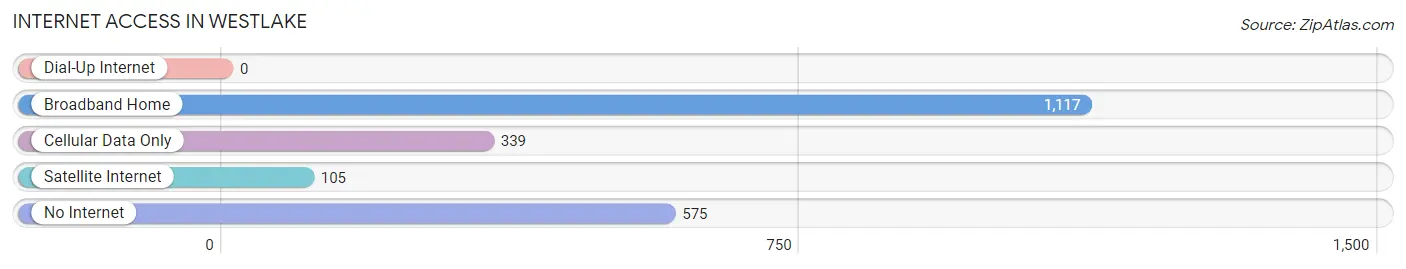
| Internet Type | # Households | % Households |
| Dial-Up Internet | 0 | 0.0% |
| Broadband Home | 1,117 | 54.2% |
| Cellular Data Only | 339 | 16.5% |
| Satellite Internet | 105 | 5.1% |
| No Internet | 575 | 27.9% |
| Total | 2,061 | 100.0% |
Westlake Summary
Westlake, Louisiana is a small city located in Calcasieu Parish, Louisiana. It is situated on the western shore of Lake Charles, a large lake in the Gulf of Mexico. The city has a population of approximately 8,000 people and is part of the Lake Charles Metropolitan Statistical Area.
History
Westlake was founded in the late 19th century as a small fishing village. The town was originally known as "Westlake Landing" and was located on the western shore of Lake Charles. The town was incorporated in 1906 and was named after the lake.
In the early 20th century, Westlake began to grow as a center for the oil and gas industry. The town was home to several oil refineries and other related businesses. The town also became a popular tourist destination, with many people visiting the lake for fishing and other recreational activities.
In the 1950s, Westlake began to experience a population boom as people moved to the area for jobs in the oil and gas industry. The town also experienced a period of economic growth, with new businesses and industries opening up in the area.
Geography
Westlake is located in Calcasieu Parish, Louisiana. It is situated on the western shore of Lake Charles, a large lake in the Gulf of Mexico. The city has a total area of 4.2 square miles, all of which is land.
The city is located in a humid subtropical climate zone, with hot, humid summers and mild winters. The average temperature in the summer is around 90 degrees Fahrenheit, while the average temperature in the winter is around 50 degrees Fahrenheit.
Economy
Westlake's economy is largely based on the oil and gas industry. The city is home to several oil refineries and other related businesses. The city also has a large tourism industry, with many people visiting the lake for fishing and other recreational activities.
Westlake also has a growing retail sector, with several stores and restaurants located in the city. The city also has a number of manufacturing businesses, including a paper mill and a chemical plant.
Demographics
As of the 2010 census, Westlake had a population of 8,000 people. The racial makeup of the city was 79.3% White, 15.2% African American, 0.7% Native American, 0.7% Asian, 0.1% Pacific Islander, and 3.9% from other races. Hispanic or Latino of any race were 4.3% of the population.
The median household income in Westlake was $41,944, and the median family income was $50,944. The per capita income for the city was $20,944. About 11.3% of families and 14.2% of the population were below the poverty line, including 19.2% of those under age 18 and 8.3% of those age 65 or over.
Common Questions
What is Per Capita Income in Westlake?
Per Capita income in Westlake is $32,083.
What is the Median Family Income in Westlake?
Median Family Income in Westlake is $66,967.
What is the Median Household income in Westlake?
Median Household Income in Westlake is $63,841.
What is Income or Wage Gap in Westlake?
Income or Wage Gap in Westlake is 38.8%.
Women in Westlake earn 61.2 cents for every dollar earned by a man.
What is Family Income Deficit in Westlake?
Family Income Deficit in Westlake is $12,193.
Families that are below poverty line in Westlake earn $12,193 less on average than the poverty threshold level.
What is Inequality or Gini Index in Westlake?
Inequality or Gini Index in Westlake is 0.37.
What is the Total Population of Westlake?
Total Population of Westlake is 4,847.
What is the Total Male Population of Westlake?
Total Male Population of Westlake is 2,595.
What is the Total Female Population of Westlake?
Total Female Population of Westlake is 2,252.
What is the Ratio of Males per 100 Females in Westlake?
There are 115.23 Males per 100 Females in Westlake.
What is the Ratio of Females per 100 Males in Westlake?
There are 86.78 Females per 100 Males in Westlake.
What is the Median Population Age in Westlake?
Median Population Age in Westlake is 37.8 Years.
What is the Average Family Size in Westlake
Average Family Size in Westlake is 3.0 People.
What is the Average Household Size in Westlake
Average Household Size in Westlake is 2.4 People.
How Large is the Labor Force in Westlake?
There are 2,217 People in the Labor Forcein in Westlake.
What is the Percentage of People in the Labor Force in Westlake?
56.2% of People are in the Labor Force in Westlake.
What is the Unemployment Rate in Westlake?
Unemployment Rate in Westlake is 1.0%.