Zip Codes with the Highest Percentage of Population Employed in Life, Physical & Social Science in Shreveport, LA
RELATED REPORTS & OPTIONS
Life, Physical & Social Science
Shreveport
Compare Zip Codes
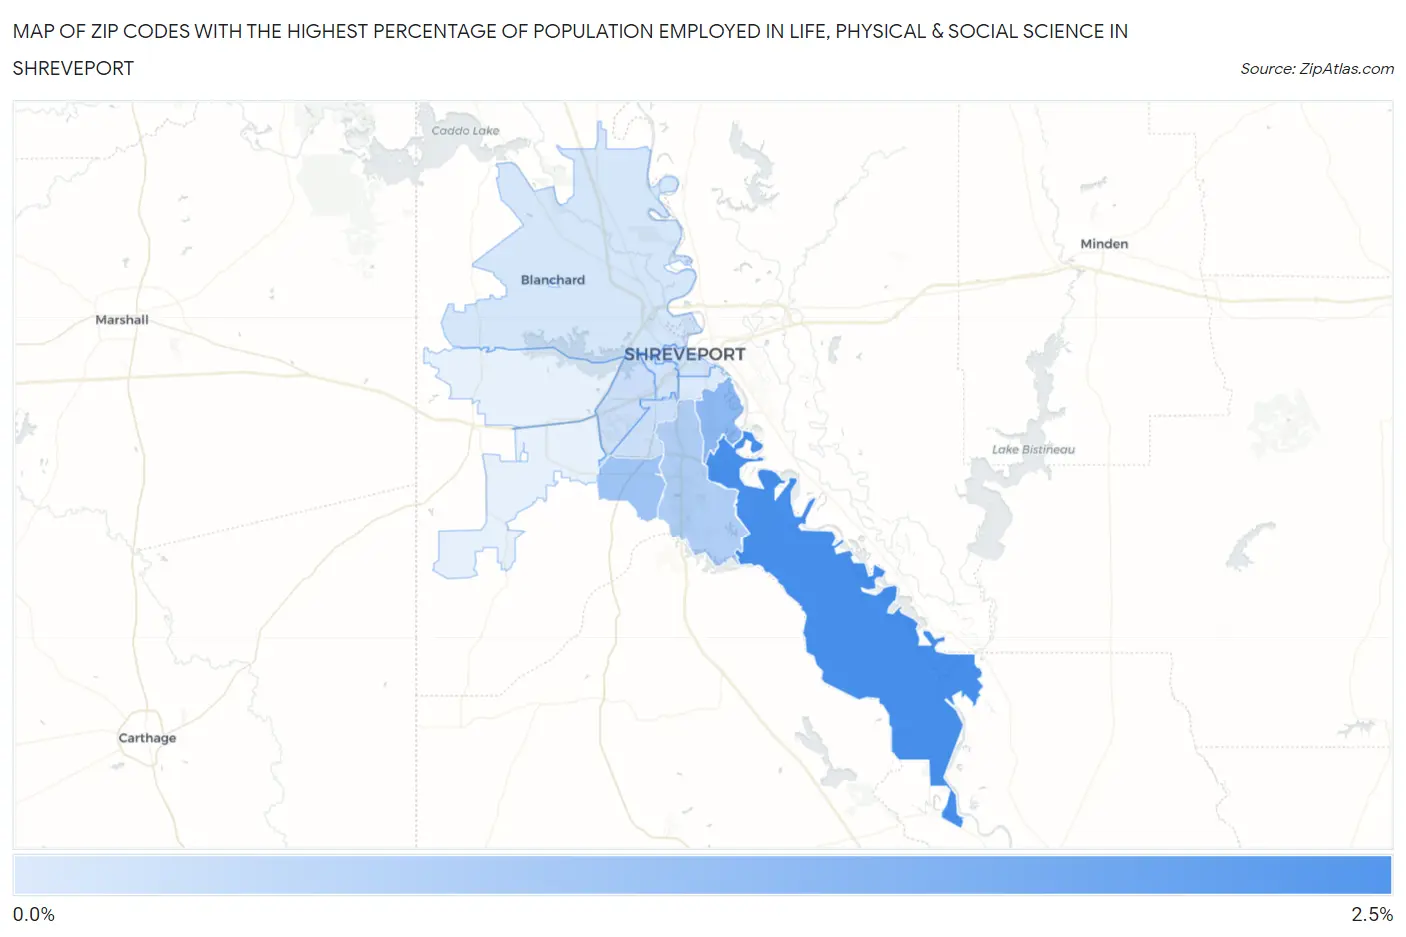
Map of Zip Codes with the Highest Percentage of Population Employed in Life, Physical & Social Science in Shreveport
0.22%
2.3%
Zip Codes with the Highest Percentage of Population Employed in Life, Physical & Social Science in Shreveport, LA
| Zip Code | % Employed | vs State | vs National | |
| 1. | 71115 | 2.3% | 0.98%(+1.35)#33 | 1.1%(+1.24)#2,879 |
| 2. | 71105 | 1.4% | 0.98%(+0.384)#84 | 1.1%(+0.271)#6,408 |
| 3. | 71118 | 1.1% | 0.98%(+0.118)#114 | 1.1%(+0.005)#8,260 |
| 4. | 71106 | 0.86% | 0.98%(-0.117)#141 | 1.1%(-0.230)#10,366 |
| 5. | 71109 | 0.47% | 0.98%(-0.513)#207 | 1.1%(-0.626)#14,953 |
| 6. | 71108 | 0.44% | 0.98%(-0.535)#210 | 1.1%(-0.648)#15,212 |
| 7. | 71103 | 0.38% | 0.98%(-0.602)#219 | 1.1%(-0.715)#16,073 |
| 8. | 71101 | 0.36% | 0.98%(-0.615)#221 | 1.1%(-0.728)#16,237 |
| 9. | 71107 | 0.31% | 0.98%(-0.670)#227 | 1.1%(-0.783)#16,970 |
| 10. | 71104 | 0.22% | 0.98%(-0.762)#245 | 1.1%(-0.875)#18,012 |
1
Common Questions
What are the Top 10 Zip Codes with the Highest Percentage of Population Employed in Life, Physical & Social Science in Shreveport, LA?
Top 10 Zip Codes with the Highest Percentage of Population Employed in Life, Physical & Social Science in Shreveport, LA are:
What zip code has the Highest Percentage of Population Employed in Life, Physical & Social Science in Shreveport, LA?
71115 has the Highest Percentage of Population Employed in Life, Physical & Social Science in Shreveport, LA with 2.3%.
What is the Percentage of Population Employed in Life, Physical & Social Science in Shreveport, LA?
Percentage of Population Employed in Life, Physical & Social Science in Shreveport is 0.83%.
What is the Percentage of Population Employed in Life, Physical & Social Science in Louisiana?
Percentage of Population Employed in Life, Physical & Social Science in Louisiana is 0.98%.
What is the Percentage of Population Employed in Life, Physical & Social Science in the United States?
Percentage of Population Employed in Life, Physical & Social Science in the United States is 1.1%.