Jean Lafitte, LA Map & Demographics
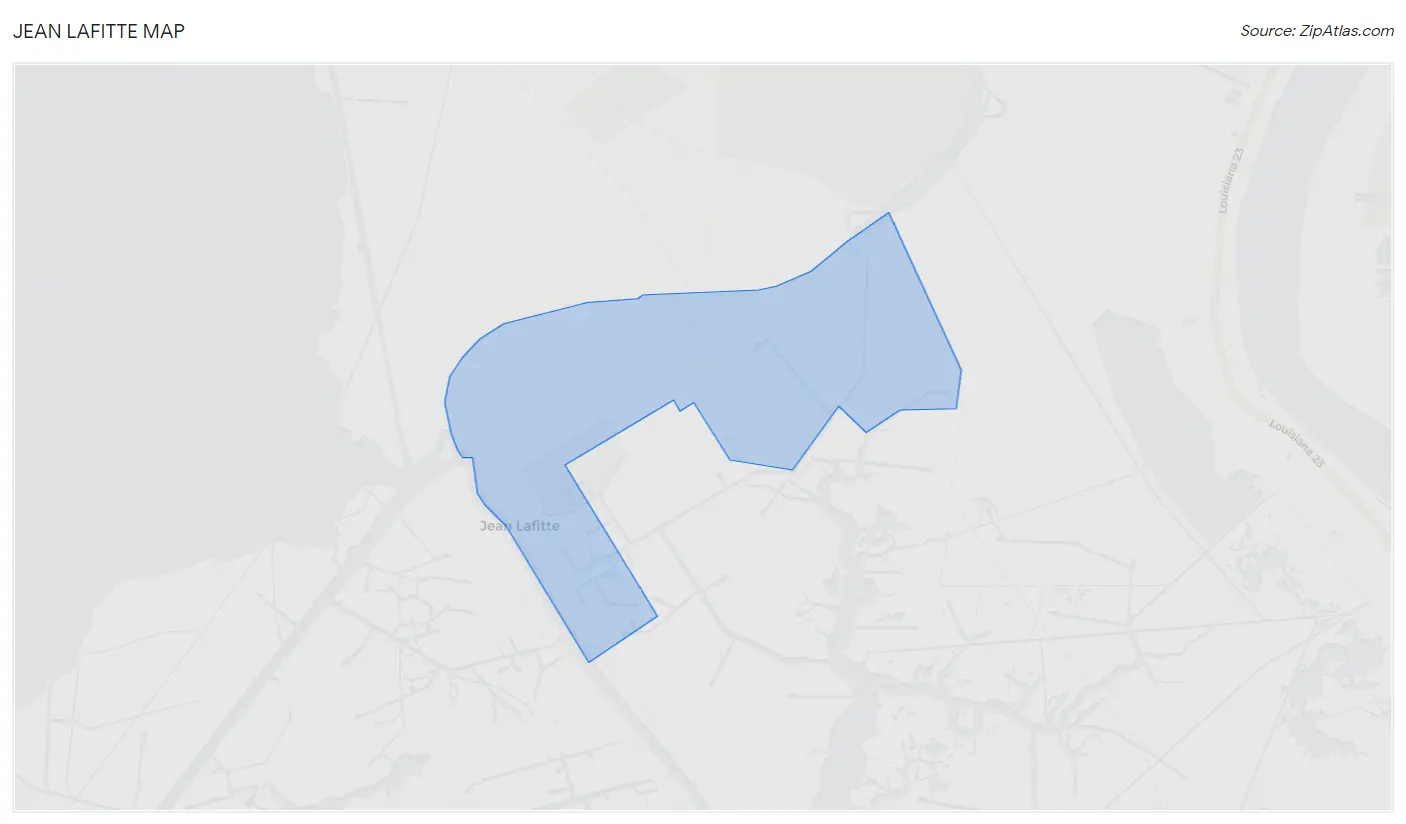
Jean Lafitte Map
Jean Lafitte Overview
$29,732
PER CAPITA INCOME
$70,000
AVG FAMILY INCOME
$59,225
AVG HOUSEHOLD INCOME
1.5%
WAGE / INCOME GAP [ % ]
98.5¢/ $1
WAGE / INCOME GAP [ $ ]
0.44
INEQUALITY / GINI INDEX
2,517
TOTAL POPULATION
1,376
MALE POPULATION
1,141
FEMALE POPULATION
120.60
MALES / 100 FEMALES
82.92
FEMALES / 100 MALES
35.9
MEDIAN AGE
3.6
AVG FAMILY SIZE
3.2
AVG HOUSEHOLD SIZE
1,109
LABOR FORCE [ PEOPLE ]
59.5%
PERCENT IN LABOR FORCE
17.9%
UNEMPLOYMENT RATE
Jean Lafitte Area Codes
Income in Jean Lafitte
Income Overview in Jean Lafitte
Per Capita Income in Jean Lafitte is $29,732, while median incomes of families and households are $70,000 and $59,225 respectively.
| Characteristic | Number | Measure |
| Per Capita Income | 2,517 | $29,732 |
| Median Family Income | 570 | $70,000 |
| Mean Family Income | 570 | $92,426 |
| Median Household Income | 792 | $59,225 |
| Mean Household Income | 792 | $80,739 |
| Income Deficit | 570 | $0 |
| Wage / Income Gap (%) | 2,517 | 1.46% |
| Wage / Income Gap ($) | 2,517 | 98.54¢ per $1 |
| Gini / Inequality Index | 2,517 | 0.44 |
Earnings by Sex in Jean Lafitte
Average Earnings in Jean Lafitte are $34,967, $35,417 for men and $34,900 for women, a difference of 1.5%.
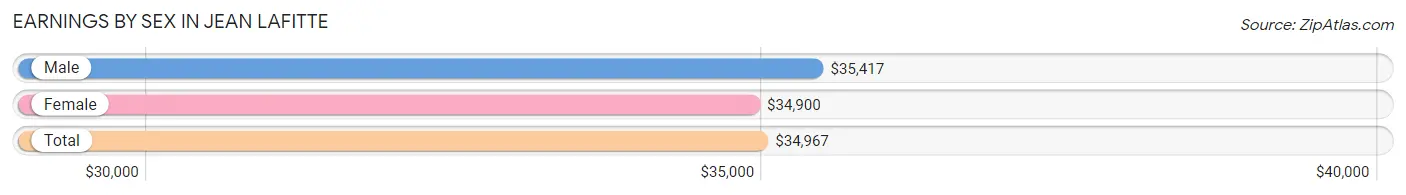
| Sex | Number | Average Earnings |
| Male | 610 (56.4%) | $35,417 |
| Female | 472 (43.6%) | $34,900 |
| Total | 1,082 (100.0%) | $34,967 |
Earnings by Sex by Income Bracket in Jean Lafitte
The most common earnings brackets in Jean Lafitte are $100,000+ for men (79 | 13.0%) and $25,000 to $29,999 for women (79 | 16.7%).
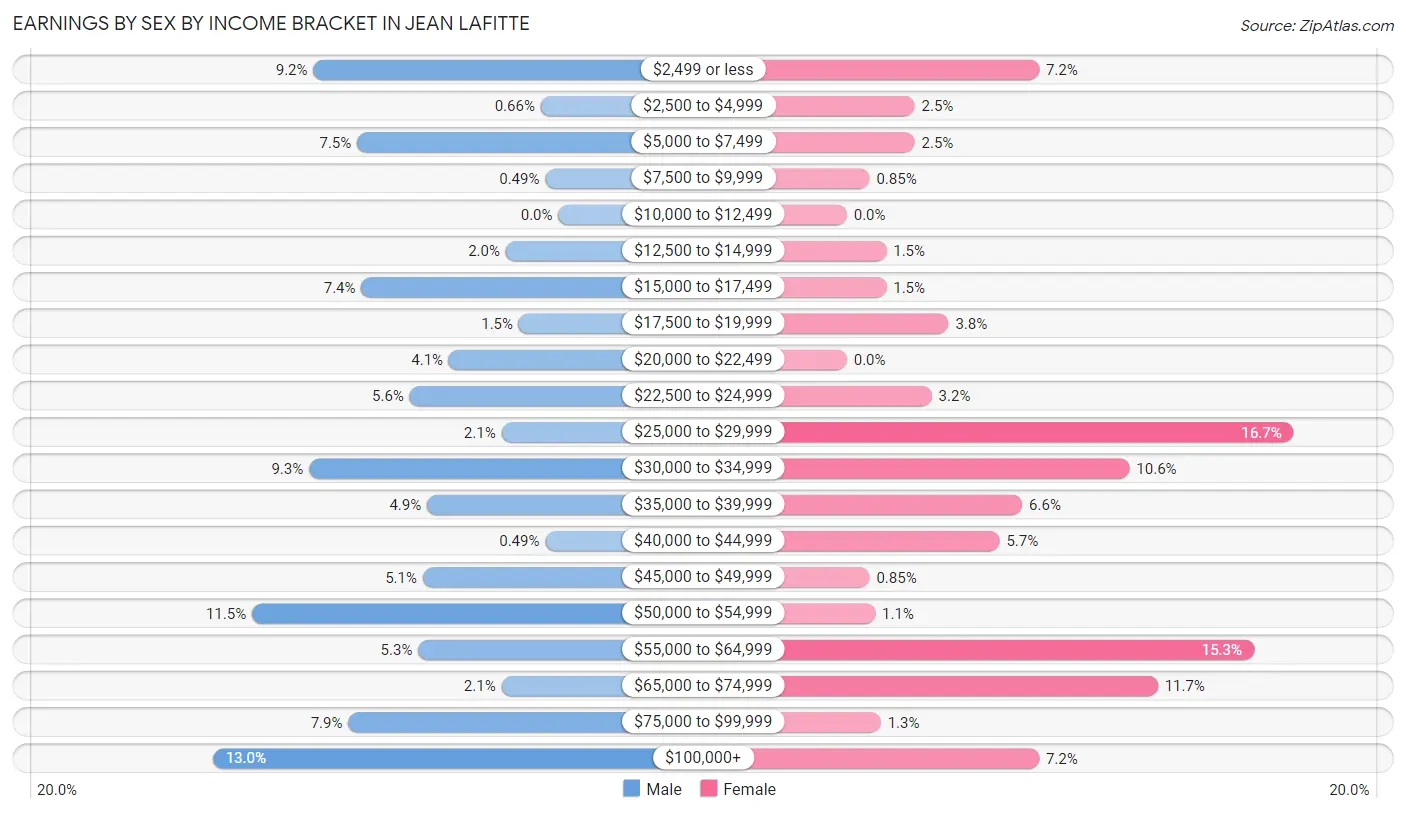
| Income | Male | Female |
| $2,499 or less | 56 (9.2%) | 34 (7.2%) |
| $2,500 to $4,999 | 4 (0.7%) | 12 (2.5%) |
| $5,000 to $7,499 | 46 (7.5%) | 12 (2.5%) |
| $7,500 to $9,999 | 3 (0.5%) | 4 (0.9%) |
| $10,000 to $12,499 | 0 (0.0%) | 0 (0.0%) |
| $12,500 to $14,999 | 12 (2.0%) | 7 (1.5%) |
| $15,000 to $17,499 | 45 (7.4%) | 7 (1.5%) |
| $17,500 to $19,999 | 9 (1.5%) | 18 (3.8%) |
| $20,000 to $22,499 | 25 (4.1%) | 0 (0.0%) |
| $22,500 to $24,999 | 34 (5.6%) | 15 (3.2%) |
| $25,000 to $29,999 | 13 (2.1%) | 79 (16.7%) |
| $30,000 to $34,999 | 57 (9.3%) | 50 (10.6%) |
| $35,000 to $39,999 | 30 (4.9%) | 31 (6.6%) |
| $40,000 to $44,999 | 3 (0.5%) | 27 (5.7%) |
| $45,000 to $49,999 | 31 (5.1%) | 4 (0.9%) |
| $50,000 to $54,999 | 70 (11.5%) | 5 (1.1%) |
| $55,000 to $64,999 | 32 (5.2%) | 72 (15.2%) |
| $65,000 to $74,999 | 13 (2.1%) | 55 (11.7%) |
| $75,000 to $99,999 | 48 (7.9%) | 6 (1.3%) |
| $100,000+ | 79 (13.0%) | 34 (7.2%) |
| Total | 610 (100.0%) | 472 (100.0%) |
Earnings by Sex by Educational Attainment in Jean Lafitte
Average earnings in Jean Lafitte are $39,583 for men and $42,868 for women, a difference of 7.7%. Men with an educational attainment of high school diploma enjoy the highest average annual earnings of $45,804, while those with less than high school education earn the least with $24,844. Women with an educational attainment of bachelor's degree earn the most with the average annual earnings of $56,719, while those with high school diploma education have the smallest earnings of $29,491.
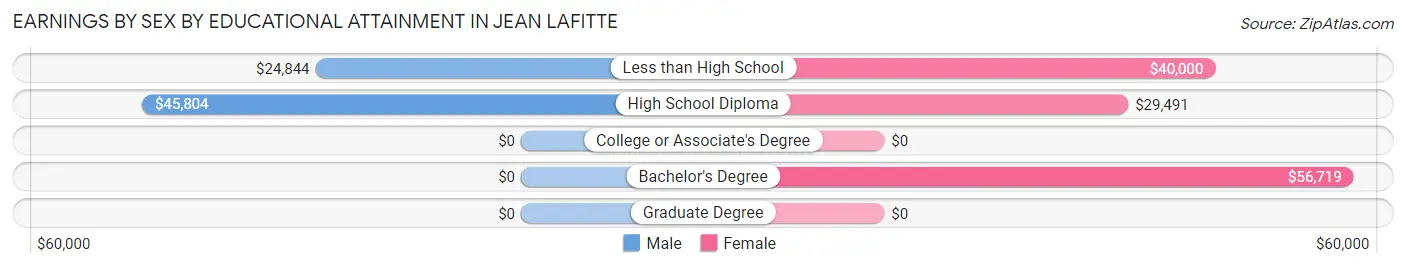
| Educational Attainment | Male Income | Female Income |
| Less than High School | $24,844 | $40,000 |
| High School Diploma | $45,804 | $29,491 |
| College or Associate's Degree | - | - |
| Bachelor's Degree | - | - |
| Graduate Degree | - | - |
| Total | $39,583 | $42,868 |
Family Income in Jean Lafitte
Family Income Brackets in Jean Lafitte
According to the Jean Lafitte family income data, there are 154 families falling into the $50,000 to $74,999 income range, which is the most common income bracket and makes up 27.0% of all families. Conversely, the $15,000 to $24,999 income bracket is the least frequent group with only 13 families (2.3%) belonging to this category.
| Income Bracket | # Families | % Families |
| Less than $10,000 | 19 | 3.3% |
| $10,000 to $14,999 | 15 | 2.6% |
| $15,000 to $24,999 | 13 | 2.3% |
| $25,000 to $34,999 | 61 | 10.7% |
| $35,000 to $49,999 | 33 | 5.8% |
| $50,000 to $74,999 | 154 | 27.0% |
| $75,000 to $99,999 | 67 | 11.8% |
| $100,000 to $149,999 | 118 | 20.7% |
| $150,000 to $199,999 | 64 | 11.2% |
| $200,000+ | 26 | 4.6% |
Family Income by Famaliy Size in Jean Lafitte
2-person families (180 | 31.6%) account for the highest median family income in Jean Lafitte with $76,042 per family, while 2-person families (180 | 31.6%) have the highest median income of $38,021 per family member.
| Income Bracket | # Families | Median Income |
| 2-Person Families | 180 (31.6%) | $76,042 |
| 3-Person Families | 97 (17.0%) | $58,393 |
| 4-Person Families | 210 (36.8%) | $0 |
| 5-Person Families | 73 (12.8%) | $0 |
| 6-Person Families | 10 (1.8%) | $0 |
| 7+ Person Families | 0 (0.0%) | $0 |
| Total | 570 (100.0%) | $70,000 |
Family Income by Number of Earners in Jean Lafitte
The median family income in Jean Lafitte is $70,000, with families comprising 2 earners (186) having the highest median family income of $130,667, while families with 1 earner (245) have the lowest median family income of $53,698, accounting for 32.6% and 43.0% of families, respectively.
| Number of Earners | # Families | Median Income |
| No Earners | 66 (11.6%) | $63,125 |
| 1 Earner | 245 (43.0%) | $53,698 |
| 2 Earners | 186 (32.6%) | $130,667 |
| 3+ Earners | 73 (12.8%) | $128,490 |
| Total | 570 (100.0%) | $70,000 |
Household Income in Jean Lafitte
Household Income Brackets in Jean Lafitte
With 178 households falling in the category, the $50,000 to $74,999 income range is the most frequent in Jean Lafitte, accounting for 22.5% of all households. In contrast, only 26 households (3.3%) fall into the $200,000+ income bracket, making it the least populous group.
| Income Bracket | # Households | % Households |
| Less than $10,000 | 30 | 3.8% |
| $10,000 to $14,999 | 48 | 6.1% |
| $15,000 to $24,999 | 72 | 9.1% |
| $25,000 to $34,999 | 84 | 10.6% |
| $35,000 to $49,999 | 53 | 6.7% |
| $50,000 to $74,999 | 178 | 22.5% |
| $75,000 to $99,999 | 84 | 10.6% |
| $100,000 to $149,999 | 136 | 17.2% |
| $150,000 to $199,999 | 81 | 10.2% |
| $200,000+ | 26 | 3.3% |
Household Income by Householder Age in Jean Lafitte
The median household income in Jean Lafitte is $59,225, with the highest median household income of $84,500 found in the 45 to 64 years age bracket for the primary householder. A total of 268 households (33.8%) fall into this category. Meanwhile, the 15 to 24 years age bracket for the primary householder has the lowest median household income of $0, with 26 households (3.3%) in this group.
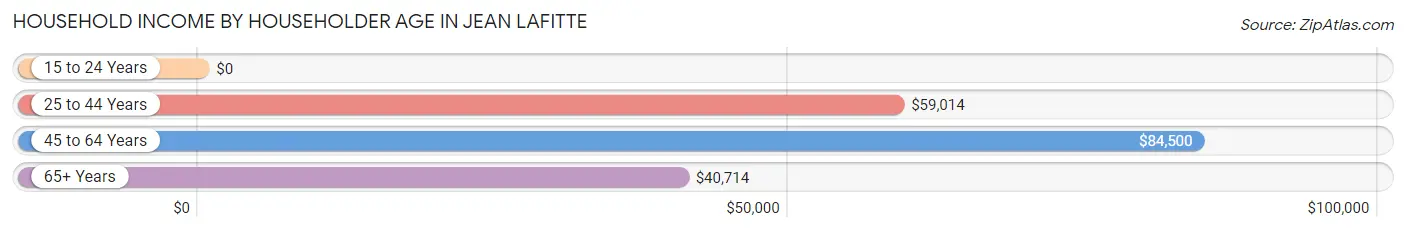
| Income Bracket | # Households | Median Income |
| 15 to 24 Years | 26 (3.3%) | $0 |
| 25 to 44 Years | 292 (36.9%) | $59,014 |
| 45 to 64 Years | 268 (33.8%) | $84,500 |
| 65+ Years | 206 (26.0%) | $40,714 |
| Total | 792 (100.0%) | $59,225 |
Poverty in Jean Lafitte
Income Below Poverty by Sex and Age in Jean Lafitte
With 14.2% poverty level for males and 21.2% for females among the residents of Jean Lafitte, 5 year old males and 35 to 44 year old females are the most vulnerable to poverty, with 5 males (50.0%) and 128 females (57.9%) in their respective age groups living below the poverty level.
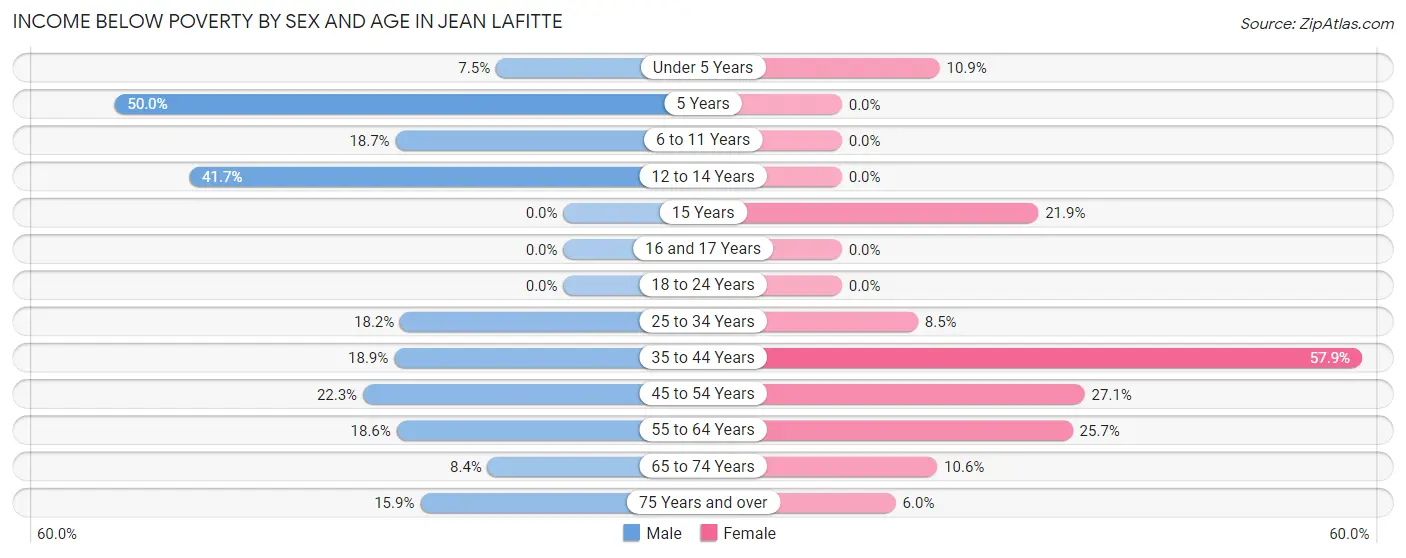
| Age Bracket | Male | Female |
| Under 5 Years | 9 (7.5%) | 11 (10.9%) |
| 5 Years | 5 (50.0%) | 0 (0.0%) |
| 6 to 11 Years | 23 (18.7%) | 0 (0.0%) |
| 12 to 14 Years | 25 (41.7%) | 0 (0.0%) |
| 15 Years | 0 (0.0%) | 7 (21.9%) |
| 16 and 17 Years | 0 (0.0%) | 0 (0.0%) |
| 18 to 24 Years | 0 (0.0%) | 0 (0.0%) |
| 25 to 34 Years | 18 (18.2%) | 10 (8.5%) |
| 35 to 44 Years | 46 (18.9%) | 128 (57.9%) |
| 45 to 54 Years | 25 (22.3%) | 33 (27.1%) |
| 55 to 64 Years | 26 (18.6%) | 36 (25.7%) |
| 65 to 74 Years | 7 (8.4%) | 12 (10.6%) |
| 75 Years and over | 11 (15.9%) | 3 (6.0%) |
| Total | 195 (14.2%) | 240 (21.2%) |
Income Above Poverty by Sex and Age in Jean Lafitte
According to the poverty statistics in Jean Lafitte, males aged 15 years and females aged 5 years are the age groups that are most secure financially, with 100.0% of males and 100.0% of females in these age groups living above the poverty line.
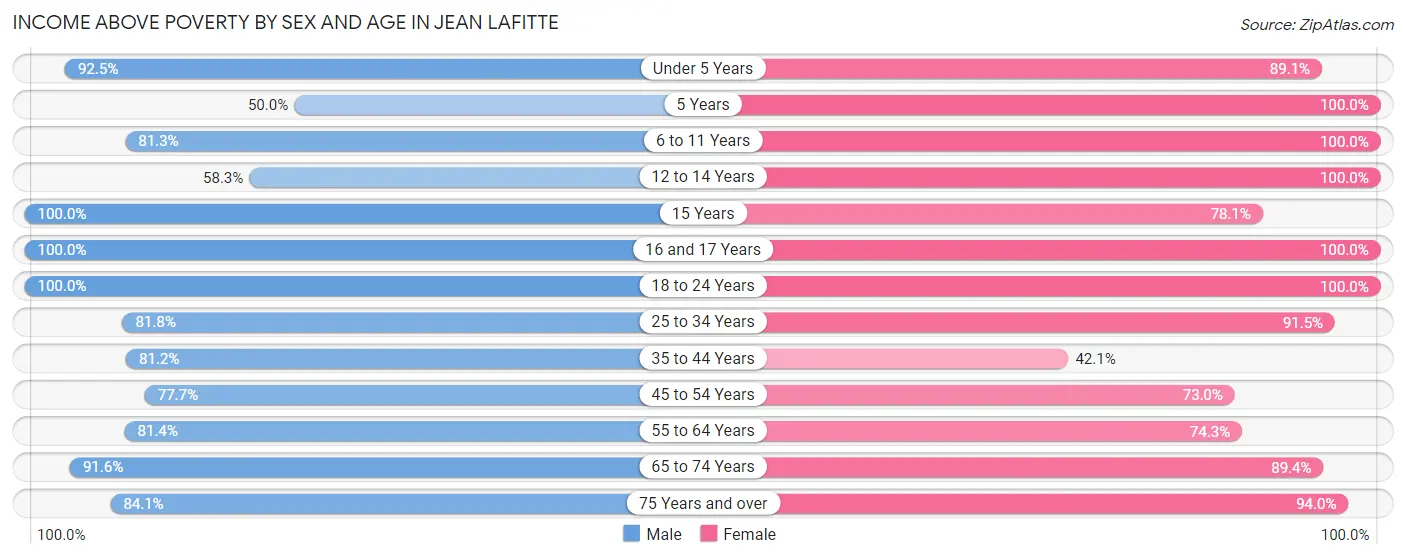
| Age Bracket | Male | Female |
| Under 5 Years | 111 (92.5%) | 90 (89.1%) |
| 5 Years | 5 (50.0%) | 7 (100.0%) |
| 6 to 11 Years | 100 (81.3%) | 91 (100.0%) |
| 12 to 14 Years | 35 (58.3%) | 34 (100.0%) |
| 15 Years | 67 (100.0%) | 25 (78.1%) |
| 16 and 17 Years | 8 (100.0%) | 9 (100.0%) |
| 18 to 24 Years | 241 (100.0%) | 95 (100.0%) |
| 25 to 34 Years | 81 (81.8%) | 108 (91.5%) |
| 35 to 44 Years | 198 (81.1%) | 93 (42.1%) |
| 45 to 54 Years | 87 (77.7%) | 89 (73.0%) |
| 55 to 64 Years | 114 (81.4%) | 104 (74.3%) |
| 65 to 74 Years | 76 (91.6%) | 101 (89.4%) |
| 75 Years and over | 58 (84.1%) | 47 (94.0%) |
| Total | 1,181 (85.8%) | 893 (78.8%) |
Income Below Poverty Among Married-Couple Families in Jean Lafitte
The poverty statistics for married-couple families in Jean Lafitte show that 12.0% or 49 of the total 408 families live below the poverty line. Families with 1 or 2 children have the highest poverty rate of 21.5%, comprising of 28 families. On the other hand, families with 3 or 4 children have the lowest poverty rate of 0.0%, which includes 0 families.
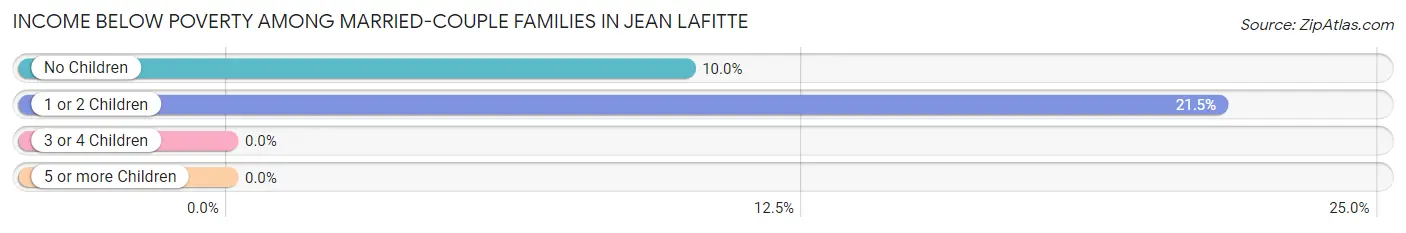
| Children | Above Poverty | Below Poverty |
| No Children | 190 (90.0%) | 21 (10.0%) |
| 1 or 2 Children | 102 (78.5%) | 28 (21.5%) |
| 3 or 4 Children | 67 (100.0%) | 0 (0.0%) |
| 5 or more Children | 0 (0.0%) | 0 (0.0%) |
| Total | 359 (88.0%) | 49 (12.0%) |
Income Below Poverty Among Single-Parent Households in Jean Lafitte
According to the poverty data in Jean Lafitte, 14.0% or 15 single-father households and 20.0% or 11 single-mother households are living below the poverty line. Among single-father households, those with no children have the highest poverty rate, with 10 households (58.8%) experiencing poverty. Likewise, among single-mother households, those with 1 or 2 children have the highest poverty rate, with 11 households (21.6%) falling below the poverty line.
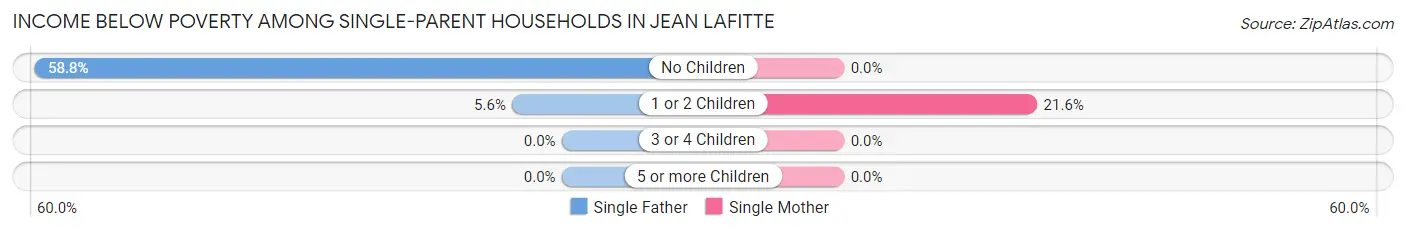
| Children | Single Father | Single Mother |
| No Children | 10 (58.8%) | 0 (0.0%) |
| 1 or 2 Children | 5 (5.6%) | 11 (21.6%) |
| 3 or 4 Children | 0 (0.0%) | 0 (0.0%) |
| 5 or more Children | 0 (0.0%) | 0 (0.0%) |
| Total | 15 (14.0%) | 11 (20.0%) |
Income Below Poverty Among Married-Couple vs Single-Parent Households in Jean Lafitte
The poverty data for Jean Lafitte shows that 49 of the married-couple family households (12.0%) and 26 of the single-parent households (16.1%) are living below the poverty level. Within the married-couple family households, those with 1 or 2 children have the highest poverty rate, with 28 households (21.5%) falling below the poverty line. Among the single-parent households, those with no children have the highest poverty rate, with 10 household (47.6%) living below poverty.
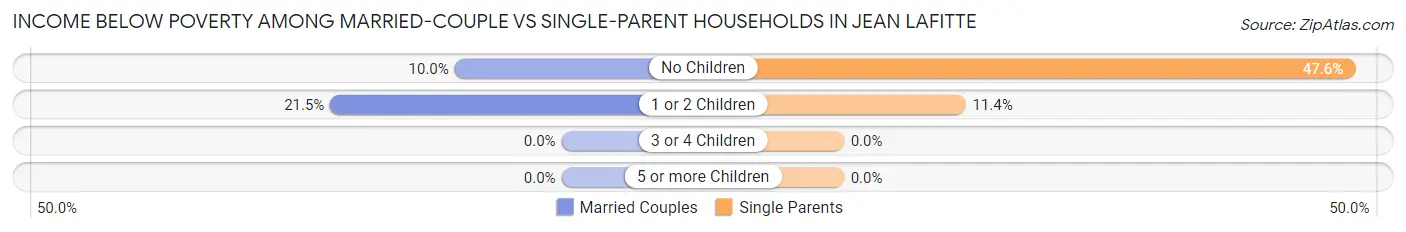
| Children | Married-Couple Families | Single-Parent Households |
| No Children | 21 (10.0%) | 10 (47.6%) |
| 1 or 2 Children | 28 (21.5%) | 16 (11.4%) |
| 3 or 4 Children | 0 (0.0%) | 0 (0.0%) |
| 5 or more Children | 0 (0.0%) | 0 (0.0%) |
| Total | 49 (12.0%) | 26 (16.1%) |
Race in Jean Lafitte
The most populous races in Jean Lafitte are White / Caucasian (2,333 | 92.7%), Two or more Races (133 | 5.3%), and Hispanic or Latino (72 | 2.9%).
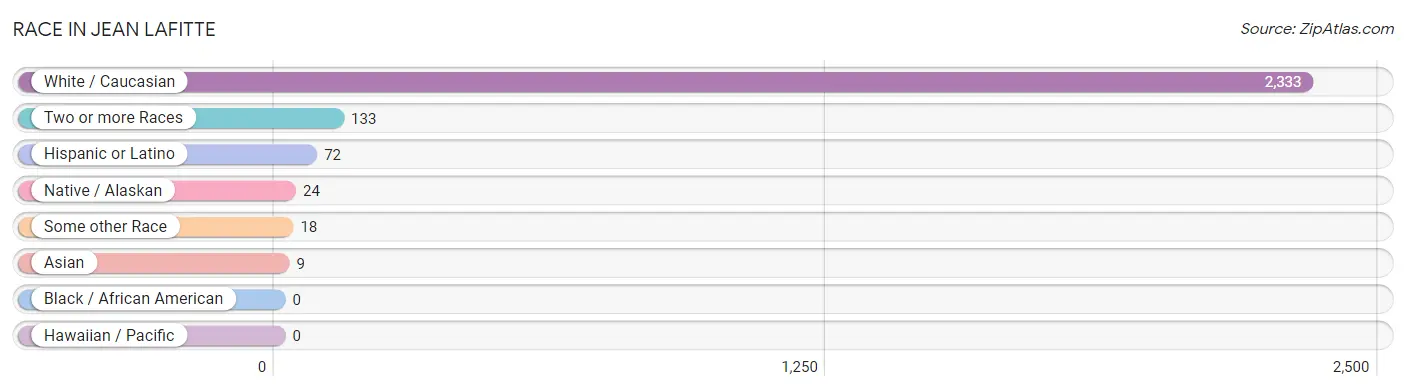
| Race | # Population | % Population |
| Asian | 9 | 0.4% |
| Black / African American | 0 | 0.0% |
| Hawaiian / Pacific | 0 | 0.0% |
| Hispanic or Latino | 72 | 2.9% |
| Native / Alaskan | 24 | 0.9% |
| White / Caucasian | 2,333 | 92.7% |
| Two or more Races | 133 | 5.3% |
| Some other Race | 18 | 0.7% |
| Total | 2,517 | 100.0% |
Ancestry in Jean Lafitte
The most populous ancestries reported in Jean Lafitte are French (644 | 25.6%), Italian (346 | 13.8%), English (205 | 8.1%), Irish (184 | 7.3%), and American (181 | 7.2%), together accounting for 62.0% of all Jean Lafitte residents.
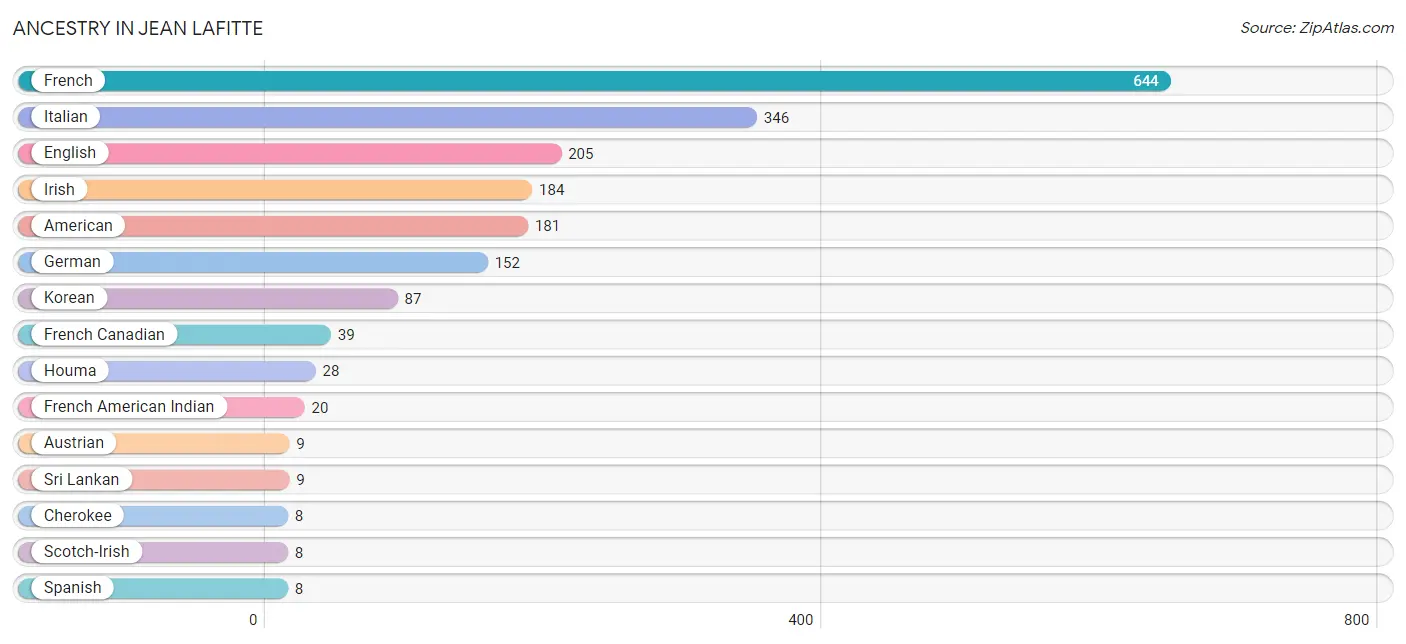
| Ancestry | # Population | % Population |
| American | 181 | 7.2% |
| Austrian | 9 | 0.4% |
| British | 4 | 0.2% |
| Cajun | 4 | 0.2% |
| Cherokee | 8 | 0.3% |
| Cuban | 7 | 0.3% |
| English | 205 | 8.1% |
| French | 644 | 25.6% |
| French American Indian | 20 | 0.8% |
| French Canadian | 39 | 1.5% |
| German | 152 | 6.0% |
| Houma | 28 | 1.1% |
| Irish | 184 | 7.3% |
| Italian | 346 | 13.8% |
| Korean | 87 | 3.5% |
| Polish | 6 | 0.2% |
| Scotch-Irish | 8 | 0.3% |
| Scottish | 3 | 0.1% |
| Spanish | 8 | 0.3% |
| Sri Lankan | 9 | 0.4% | View All 20 Rows |
Immigrants in Jean Lafitte
The most numerous immigrant groups reported in Jean Lafitte came from Central America (5 | 0.2%), Latin America (5 | 0.2%), and Nicaragua (5 | 0.2%), together accounting for 0.6% of all Jean Lafitte residents.
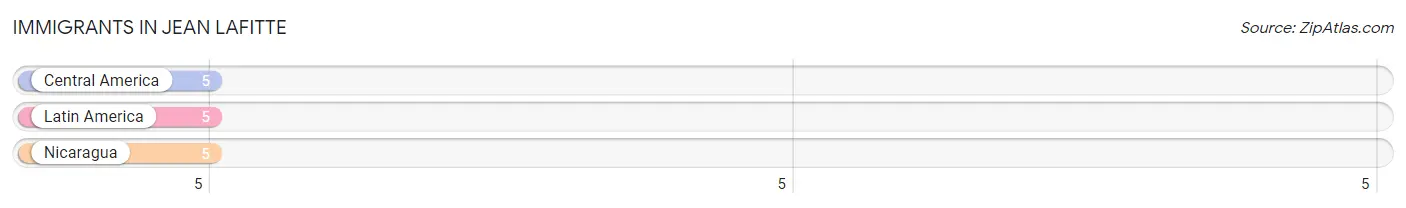
| Immigration Origin | # Population | % Population |
| Central America | 5 | 0.2% |
| Latin America | 5 | 0.2% |
| Nicaragua | 5 | 0.2% | View All 3 Rows |
Sex and Age in Jean Lafitte
Sex and Age in Jean Lafitte
The most populous age groups in Jean Lafitte are 15 to 19 Years (253 | 18.4%) for men and 40 to 44 Years (149 | 13.1%) for women.
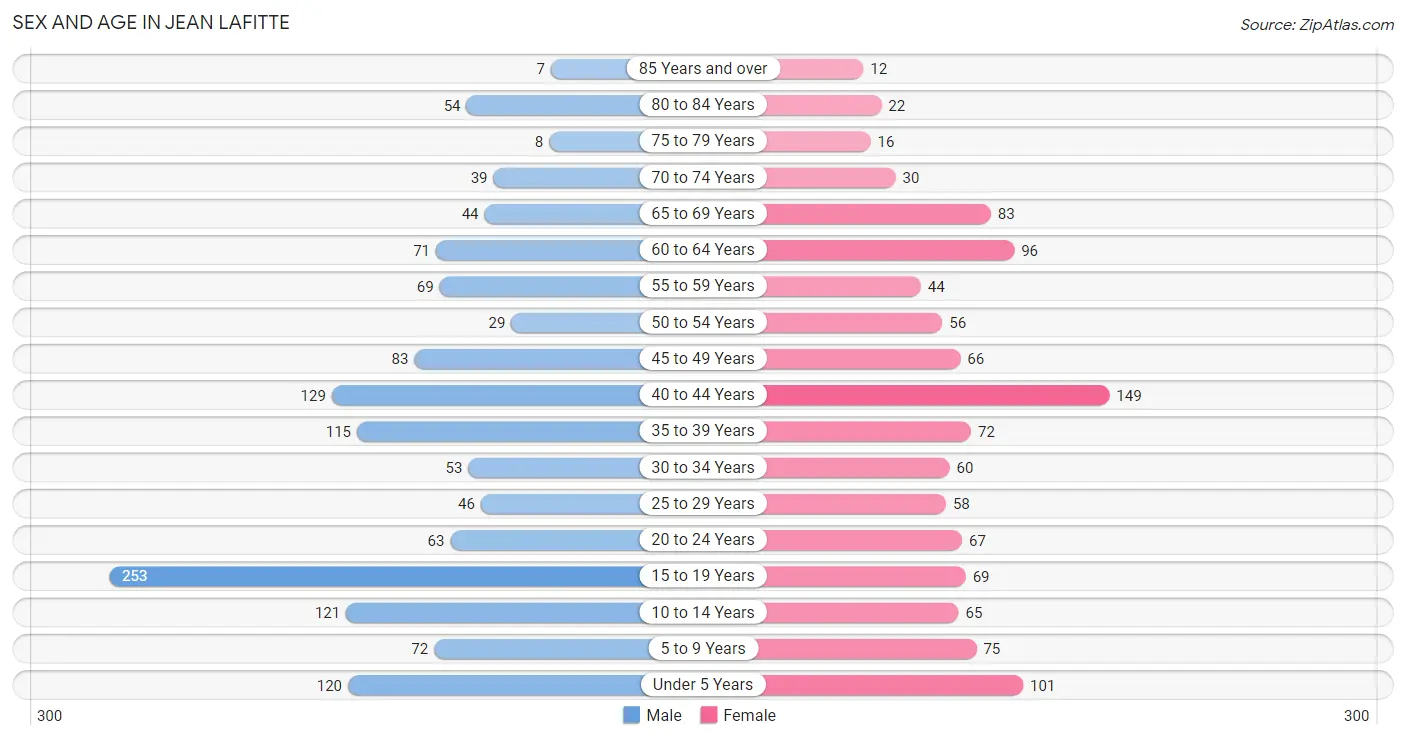
| Age Bracket | Male | Female |
| Under 5 Years | 120 (8.7%) | 101 (8.8%) |
| 5 to 9 Years | 72 (5.2%) | 75 (6.6%) |
| 10 to 14 Years | 121 (8.8%) | 65 (5.7%) |
| 15 to 19 Years | 253 (18.4%) | 69 (6.0%) |
| 20 to 24 Years | 63 (4.6%) | 67 (5.9%) |
| 25 to 29 Years | 46 (3.3%) | 58 (5.1%) |
| 30 to 34 Years | 53 (3.8%) | 60 (5.3%) |
| 35 to 39 Years | 115 (8.4%) | 72 (6.3%) |
| 40 to 44 Years | 129 (9.4%) | 149 (13.1%) |
| 45 to 49 Years | 83 (6.0%) | 66 (5.8%) |
| 50 to 54 Years | 29 (2.1%) | 56 (4.9%) |
| 55 to 59 Years | 69 (5.0%) | 44 (3.9%) |
| 60 to 64 Years | 71 (5.2%) | 96 (8.4%) |
| 65 to 69 Years | 44 (3.2%) | 83 (7.3%) |
| 70 to 74 Years | 39 (2.8%) | 30 (2.6%) |
| 75 to 79 Years | 8 (0.6%) | 16 (1.4%) |
| 80 to 84 Years | 54 (3.9%) | 22 (1.9%) |
| 85 Years and over | 7 (0.5%) | 12 (1.1%) |
| Total | 1,376 (100.0%) | 1,141 (100.0%) |
Families and Households in Jean Lafitte
Median Family Size in Jean Lafitte
The median family size in Jean Lafitte is 3.61 persons per family, with single male/father families (107 | 18.8%) accounting for the largest median family size of 4.63 persons per family. On the other hand, married-couple families (408 | 71.6%) represent the smallest median family size with 3.33 persons per family.
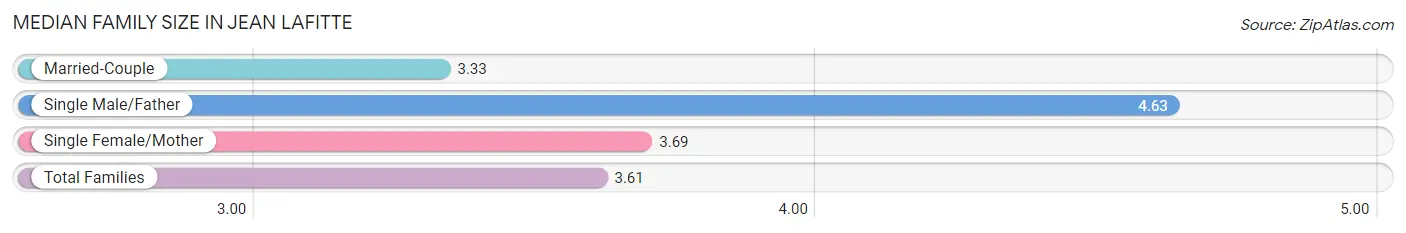
| Family Type | # Families | Family Size |
| Married-Couple | 408 (71.6%) | 3.33 |
| Single Male/Father | 107 (18.8%) | 4.63 |
| Single Female/Mother | 55 (9.7%) | 3.69 |
| Total Families | 570 (100.0%) | 3.61 |
Median Household Size in Jean Lafitte
The median household size in Jean Lafitte is 3.17 persons per household, with single male/father households (107 | 13.5%) accounting for the largest median household size of 5.58 persons per household. non-family households (222 | 28.0%) represent the smallest median household size with 1.44 persons per household.
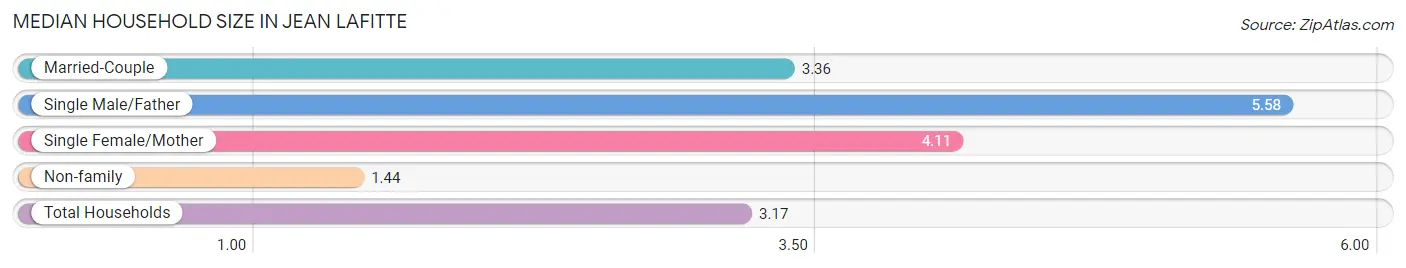
| Household Type | # Households | Household Size |
| Married-Couple | 408 (51.5%) | 3.36 |
| Single Male/Father | 107 (13.5%) | 5.58 |
| Single Female/Mother | 55 (6.9%) | 4.11 |
| Non-family | 222 (28.0%) | 1.44 |
| Total Households | 792 (100.0%) | 3.17 |
Household Size by Marriage Status in Jean Lafitte
Out of a total of 792 households in Jean Lafitte, 570 (72.0%) are family households, while 222 (28.0%) are nonfamily households. The most numerous type of family households are 4-person households, comprising 173, and the most common type of nonfamily households are 1-person households, comprising 172.
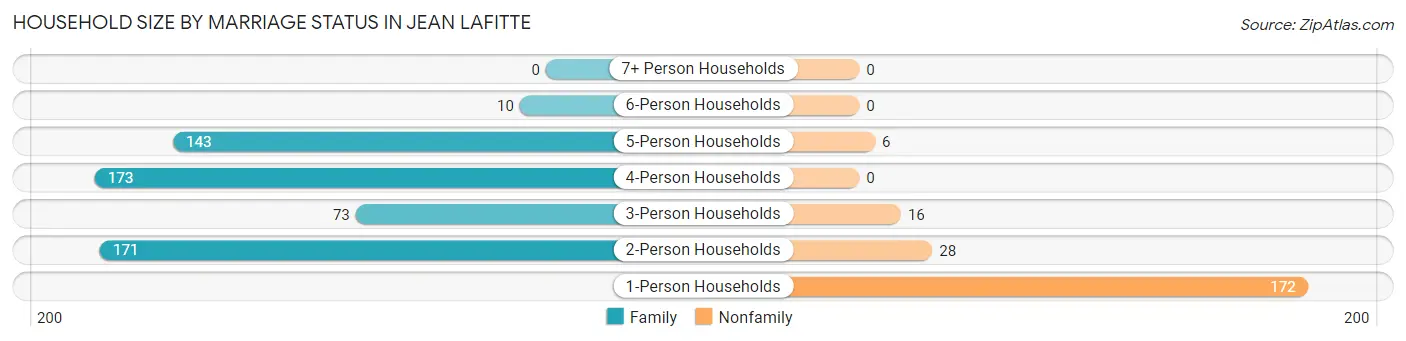
| Household Size | Family Households | Nonfamily Households |
| 1-Person Households | - | 172 (21.7%) |
| 2-Person Households | 171 (21.6%) | 28 (3.5%) |
| 3-Person Households | 73 (9.2%) | 16 (2.0%) |
| 4-Person Households | 173 (21.8%) | 0 (0.0%) |
| 5-Person Households | 143 (18.1%) | 6 (0.8%) |
| 6-Person Households | 10 (1.3%) | 0 (0.0%) |
| 7+ Person Households | 0 (0.0%) | 0 (0.0%) |
| Total | 570 (72.0%) | 222 (28.0%) |
Female Fertility in Jean Lafitte
Fertility by Age in Jean Lafitte
Average fertility rate in Jean Lafitte is 62.0 births per 1,000 women. Women in the age bracket of 20 to 34 years have the highest fertility rate with 114.0 births per 1,000 women. Women in the age bracket of 20 to 34 years acount for 61.8% of all women with births.
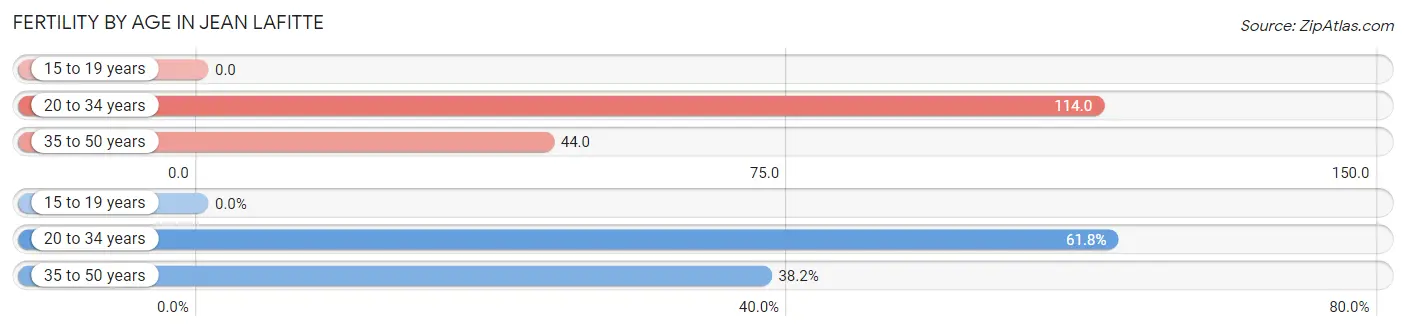
| Age Bracket | Women with Births | Births / 1,000 Women |
| 15 to 19 years | 0 (0.0%) | 0.0 |
| 20 to 34 years | 21 (61.8%) | 114.0 |
| 35 to 50 years | 13 (38.2%) | 44.0 |
| Total | 34 (100.0%) | 62.0 |
Fertility by Age by Marriage Status in Jean Lafitte
52.9% of women with births (34) in Jean Lafitte are married. The highest percentage of unmarried women with births falls into 20 to 34 years age bracket with 76.2% of them unmarried at the time of birth, while the lowest percentage of unmarried women with births belong to 35 to 50 years age bracket with 0.0% of them unmarried.
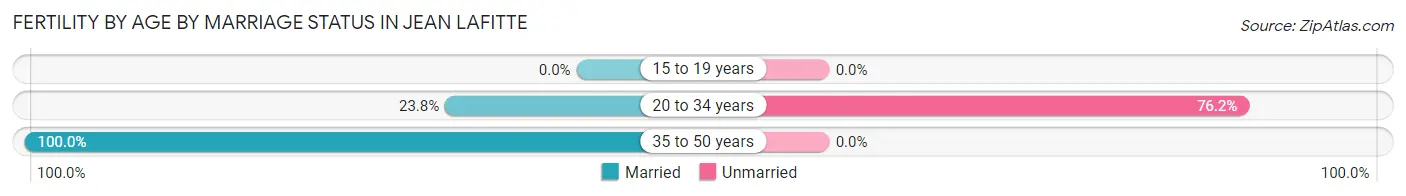
| Age Bracket | Married | Unmarried |
| 15 to 19 years | 0 (0.0%) | 0 (0.0%) |
| 20 to 34 years | 5 (23.8%) | 16 (76.2%) |
| 35 to 50 years | 13 (100.0%) | 0 (0.0%) |
| Total | 18 (52.9%) | 16 (47.1%) |
Fertility by Education in Jean Lafitte
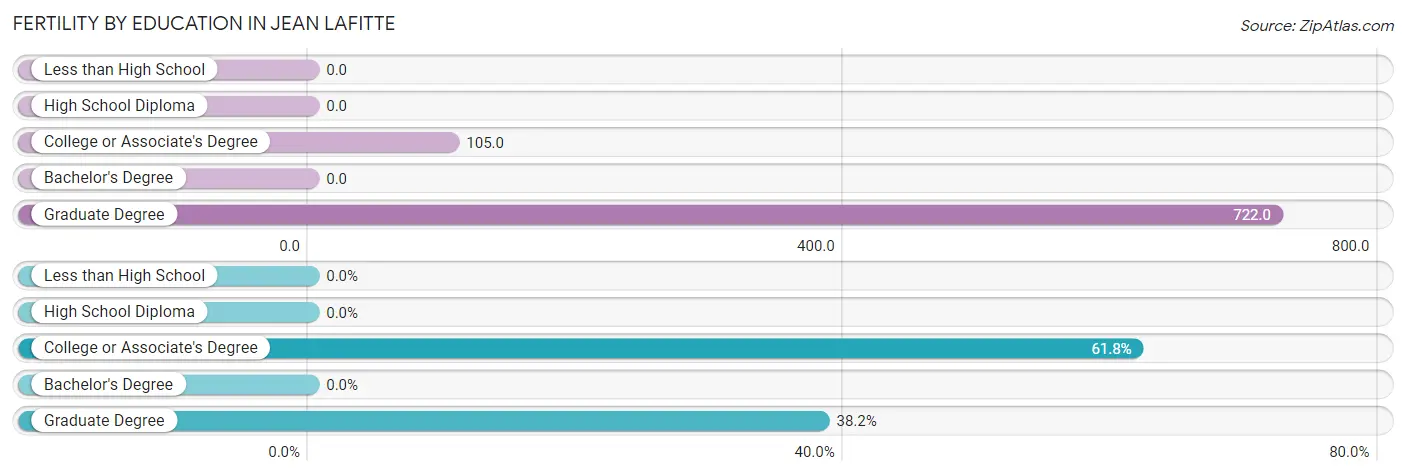
| Educational Attainment | Women with Births | Births / 1,000 Women |
| Less than High School | 0 (0.0%) | 0.0 |
| High School Diploma | 0 (0.0%) | 0.0 |
| College or Associate's Degree | 21 (61.8%) | 105.0 |
| Bachelor's Degree | 0 (0.0%) | 0.0 |
| Graduate Degree | 13 (38.2%) | 722.0 |
| Total | 34 (100.0%) | 62.0 |
Fertility by Education by Marriage Status in Jean Lafitte
47.1% of women with births in Jean Lafitte are unmarried. Women with the educational attainment of graduate degree are most likely to be married with 100.0% of them married at childbirth, while women with the educational attainment of college or associate's degree are least likely to be married with 76.2% of them unmarried at childbirth.
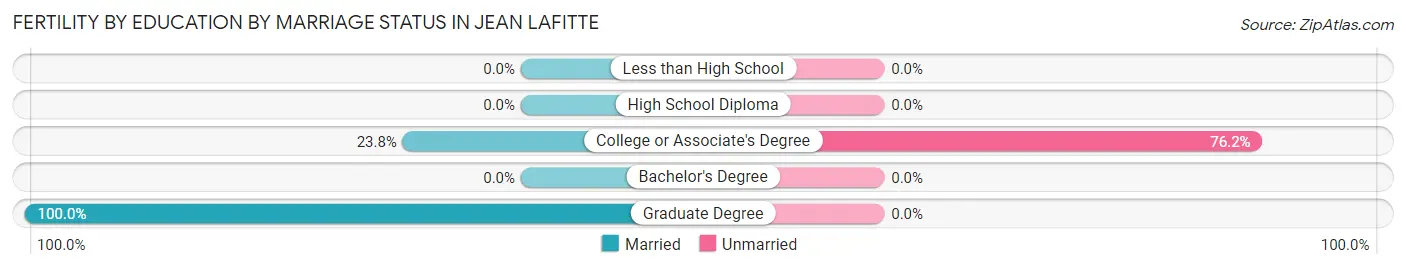
| Educational Attainment | Married | Unmarried |
| Less than High School | 0 (0.0%) | 0 (0.0%) |
| High School Diploma | 0 (0.0%) | 0 (0.0%) |
| College or Associate's Degree | 5 (23.8%) | 16 (76.2%) |
| Bachelor's Degree | 0 (0.0%) | 0 (0.0%) |
| Graduate Degree | 13 (100.0%) | 0 (0.0%) |
| Total | 18 (52.9%) | 16 (47.1%) |
Employment Characteristics in Jean Lafitte
Employment by Class of Employer in Jean Lafitte
Among the 895 employed individuals in Jean Lafitte, private company employees (646 | 72.2%), self-employed (incorporated) (77 | 8.6%), and local government employees (65 | 7.3%) make up the most common classes of employment.
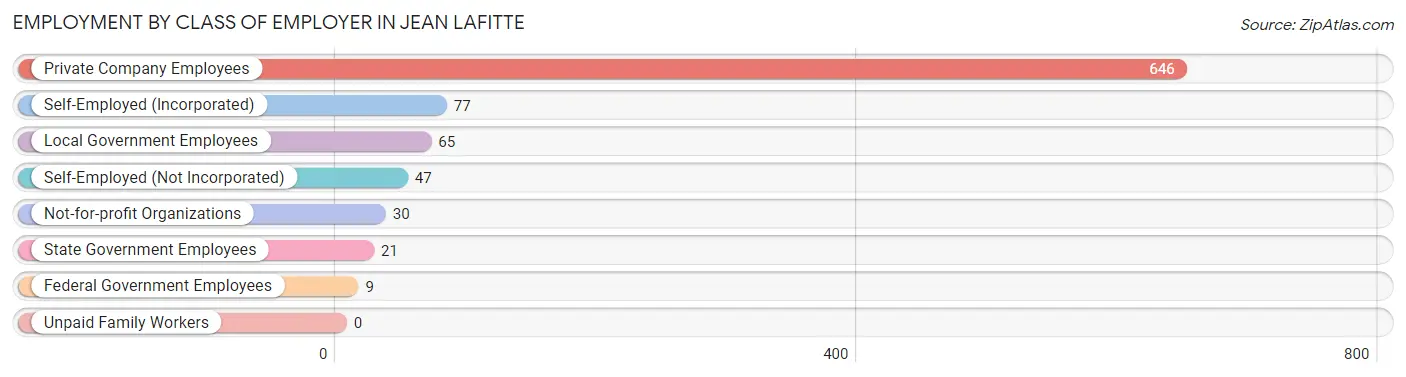
| Employer Class | # Employees | % Employees |
| Private Company Employees | 646 | 72.2% |
| Self-Employed (Incorporated) | 77 | 8.6% |
| Self-Employed (Not Incorporated) | 47 | 5.2% |
| Not-for-profit Organizations | 30 | 3.4% |
| Local Government Employees | 65 | 7.3% |
| State Government Employees | 21 | 2.4% |
| Federal Government Employees | 9 | 1.0% |
| Unpaid Family Workers | 0 | 0.0% |
| Total | 895 | 100.0% |
Employment Status by Age in Jean Lafitte
According to the labor force statistics for Jean Lafitte, out of the total population over 16 years of age (1,864), 59.5% or 1,109 individuals are in the labor force, with 17.9% or 199 of them unemployed. The age group with the highest labor force participation rate is 20 to 24 years, with 95.4% or 124 individuals in the labor force. Within the labor force, the 25 to 29 years age range has the highest percentage of unemployed individuals, with 41.9% or 39 of them being unemployed.
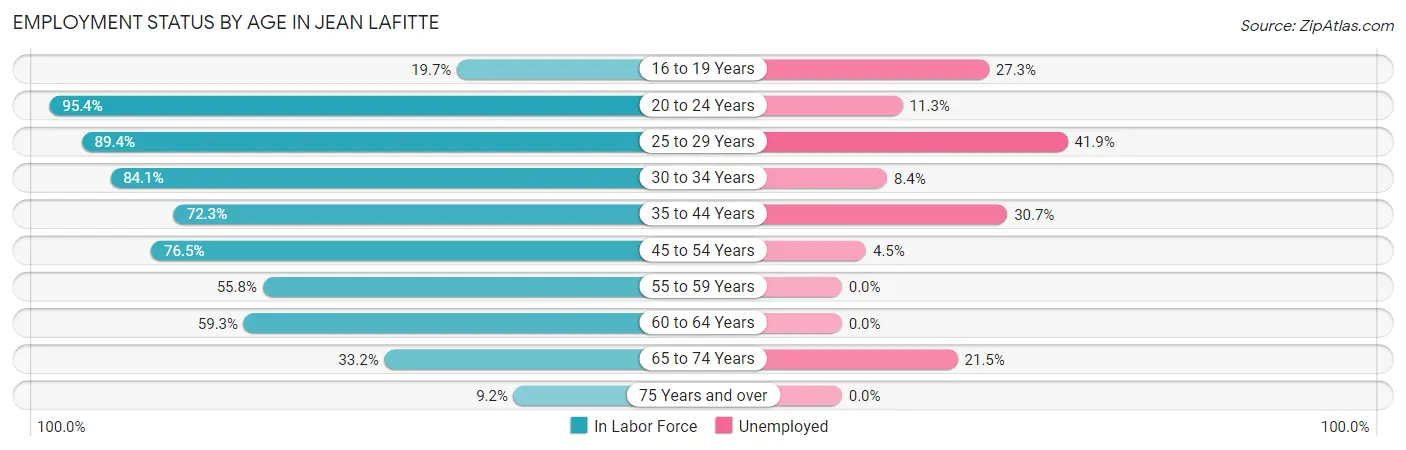
| Age Bracket | In Labor Force | Unemployed |
| 16 to 19 Years | 44 (19.7%) | 12 (27.3%) |
| 20 to 24 Years | 124 (95.4%) | 14 (11.3%) |
| 25 to 29 Years | 93 (89.4%) | 39 (41.9%) |
| 30 to 34 Years | 95 (84.1%) | 8 (8.4%) |
| 35 to 44 Years | 336 (72.3%) | 103 (30.7%) |
| 45 to 54 Years | 179 (76.5%) | 8 (4.5%) |
| 55 to 59 Years | 63 (55.8%) | 0 (0.0%) |
| 60 to 64 Years | 99 (59.3%) | 0 (0.0%) |
| 65 to 74 Years | 65 (33.2%) | 14 (21.5%) |
| 75 Years and over | 11 (9.2%) | 0 (0.0%) |
| Total | 1,109 (59.5%) | 199 (17.9%) |
Employment Status by Educational Attainment in Jean Lafitte
According to labor force statistics for Jean Lafitte, 72.3% of individuals (865) out of the total population between 25 and 64 years of age (1,196) are in the labor force, with 18.3% or 158 of them being unemployed. The group with the highest labor force participation rate are those with the educational attainment of college / associate degree, with 86.5% or 300 individuals in the labor force. Within the labor force, individuals with high school diploma education have the highest percentage of unemployment, with 24.9% or 88 of them being unemployed.
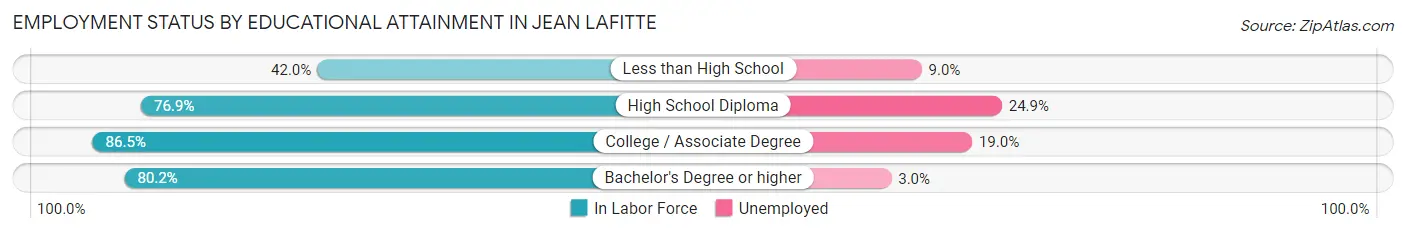
| Educational Attainment | In Labor Force | Unemployed |
| Less than High School | 111 (42.0%) | 24 (9.0%) |
| High School Diploma | 353 (76.9%) | 114 (24.9%) |
| College / Associate Degree | 300 (86.5%) | 66 (19.0%) |
| Bachelor's Degree or higher | 101 (80.2%) | 4 (3.0%) |
| Total | 865 (72.3%) | 219 (18.3%) |
Employment Occupations by Sex in Jean Lafitte
Management, Business, Science and Arts Occupations
The most common Management, Business, Science and Arts occupations in Jean Lafitte are Community & Social Service (84 | 9.2%), Management (71 | 7.8%), Health Diagnosing & Treating (57 | 6.3%), Legal Services & Support (43 | 4.7%), and Health Technologists (36 | 4.0%).
Management, Business, Science and Arts Occupations by Sex
Within the Management, Business, Science and Arts occupations in Jean Lafitte, the most male-oriented occupations are Computers, Engineering & Science (100.0%), Architecture & Engineering (100.0%), and Life, Physical & Social Science (100.0%), while the most female-oriented occupations are Education Instruction & Library (100.0%), Health Diagnosing & Treating (100.0%), and Health Technologists (100.0%).
| Occupation | Male | Female |
| Management | 54 (76.1%) | 17 (23.9%) |
| Business & Financial | 3 (18.8%) | 13 (81.2%) |
| Computers, Engineering & Science | 31 (100.0%) | 0 (0.0%) |
| Computers & Mathematics | 0 (0.0%) | 0 (0.0%) |
| Architecture & Engineering | 14 (100.0%) | 0 (0.0%) |
| Life, Physical & Social Science | 17 (100.0%) | 0 (0.0%) |
| Community & Social Service | 10 (11.9%) | 74 (88.1%) |
| Education, Arts & Media | 1 (8.3%) | 11 (91.7%) |
| Legal Services & Support | 9 (20.9%) | 34 (79.1%) |
| Education Instruction & Library | 0 (0.0%) | 29 (100.0%) |
| Arts, Media & Entertainment | 0 (0.0%) | 0 (0.0%) |
| Health Diagnosing & Treating | 0 (0.0%) | 57 (100.0%) |
| Health Technologists | 0 (0.0%) | 36 (100.0%) |
| Total (Category) | 98 (37.8%) | 161 (62.2%) |
| Total (Overall) | 473 (51.9%) | 438 (48.1%) |
Services Occupations
The most common Services occupations in Jean Lafitte are Food Preparation & Serving (47 | 5.2%), Personal Care & Service (33 | 3.6%), Cleaning & Maintenance (25 | 2.7%), Security & Protection (24 | 2.6%), and Firefighting & Prevention (24 | 2.6%).
Services Occupations by Sex
Within the Services occupations in Jean Lafitte, the most male-oriented occupations are Security & Protection (100.0%), Firefighting & Prevention (100.0%), and Personal Care & Service (39.4%), while the most female-oriented occupations are Food Preparation & Serving (72.3%), Cleaning & Maintenance (64.0%), and Personal Care & Service (60.6%).
| Occupation | Male | Female |
| Healthcare Support | 0 (0.0%) | 0 (0.0%) |
| Security & Protection | 24 (100.0%) | 0 (0.0%) |
| Firefighting & Prevention | 24 (100.0%) | 0 (0.0%) |
| Law Enforcement | 0 (0.0%) | 0 (0.0%) |
| Food Preparation & Serving | 13 (27.7%) | 34 (72.3%) |
| Cleaning & Maintenance | 9 (36.0%) | 16 (64.0%) |
| Personal Care & Service | 13 (39.4%) | 20 (60.6%) |
| Total (Category) | 59 (45.7%) | 70 (54.3%) |
| Total (Overall) | 473 (51.9%) | 438 (48.1%) |
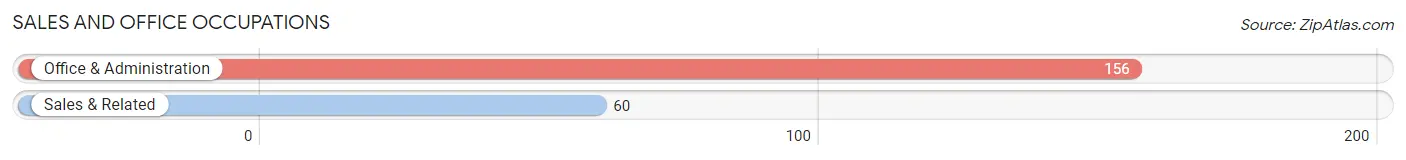
Sales and Office Occupations
The most common Sales and Office occupations in Jean Lafitte are Office & Administration (156 | 17.1%), and Sales & Related (60 | 6.6%).
Sales and Office Occupations by Sex
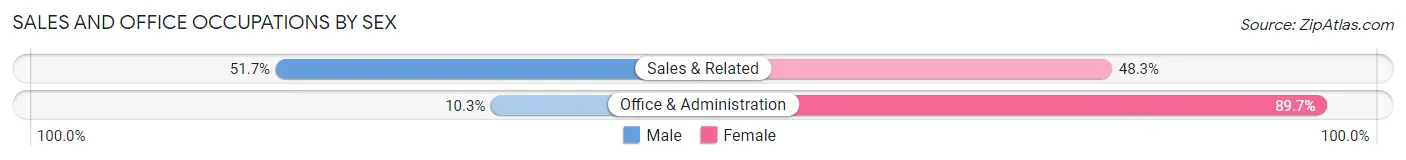
| Occupation | Male | Female |
| Sales & Related | 31 (51.7%) | 29 (48.3%) |
| Office & Administration | 16 (10.3%) | 140 (89.7%) |
| Total (Category) | 47 (21.8%) | 169 (78.2%) |
| Total (Overall) | 473 (51.9%) | 438 (48.1%) |
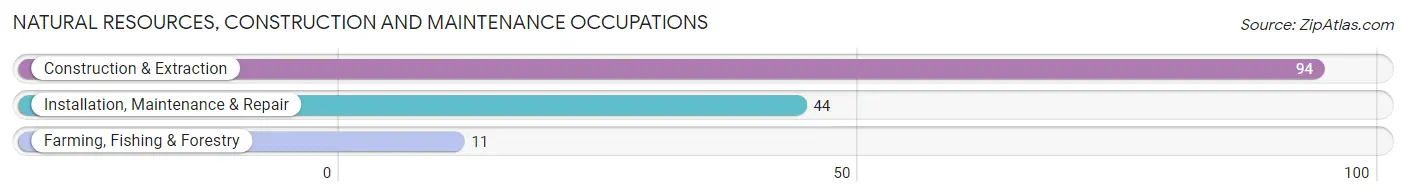
Natural Resources, Construction and Maintenance Occupations
The most common Natural Resources, Construction and Maintenance occupations in Jean Lafitte are Construction & Extraction (94 | 10.3%), Installation, Maintenance & Repair (44 | 4.8%), and Farming, Fishing & Forestry (11 | 1.2%).
Natural Resources, Construction and Maintenance Occupations by Sex
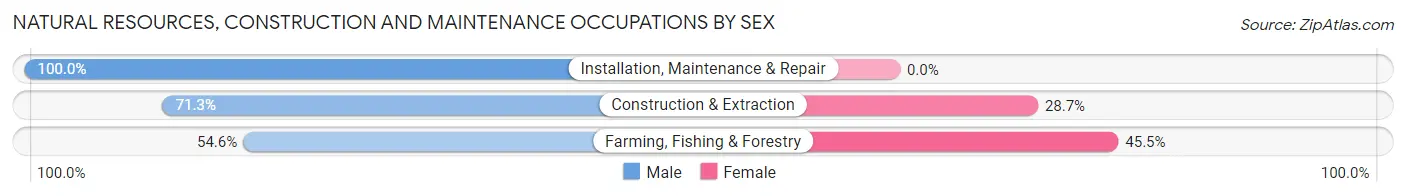
| Occupation | Male | Female |
| Farming, Fishing & Forestry | 6 (54.5%) | 5 (45.5%) |
| Construction & Extraction | 67 (71.3%) | 27 (28.7%) |
| Installation, Maintenance & Repair | 44 (100.0%) | 0 (0.0%) |
| Total (Category) | 117 (78.5%) | 32 (21.5%) |
| Total (Overall) | 473 (51.9%) | 438 (48.1%) |
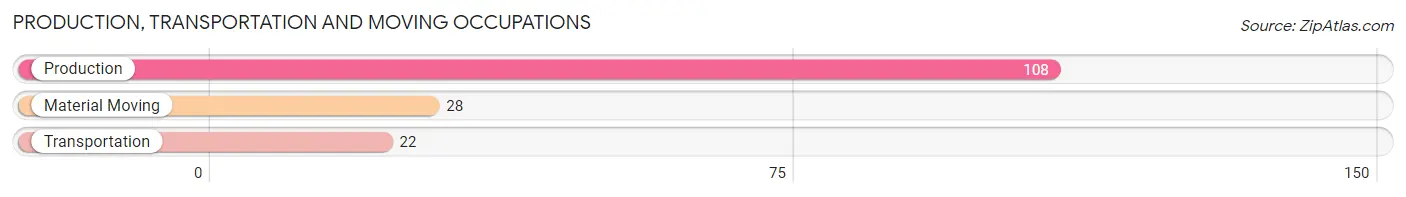
Production, Transportation and Moving Occupations
The most common Production, Transportation and Moving occupations in Jean Lafitte are Production (108 | 11.9%), Material Moving (28 | 3.1%), and Transportation (22 | 2.4%).
Production, Transportation and Moving Occupations by Sex
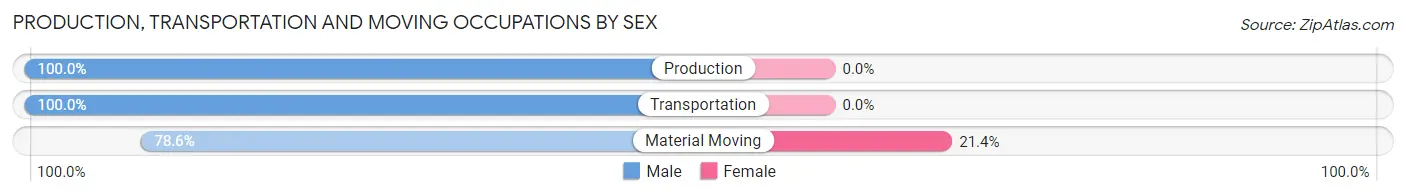
| Occupation | Male | Female |
| Production | 108 (100.0%) | 0 (0.0%) |
| Transportation | 22 (100.0%) | 0 (0.0%) |
| Material Moving | 22 (78.6%) | 6 (21.4%) |
| Total (Category) | 152 (96.2%) | 6 (3.8%) |
| Total (Overall) | 473 (51.9%) | 438 (48.1%) |
Employment Industries by Sex in Jean Lafitte
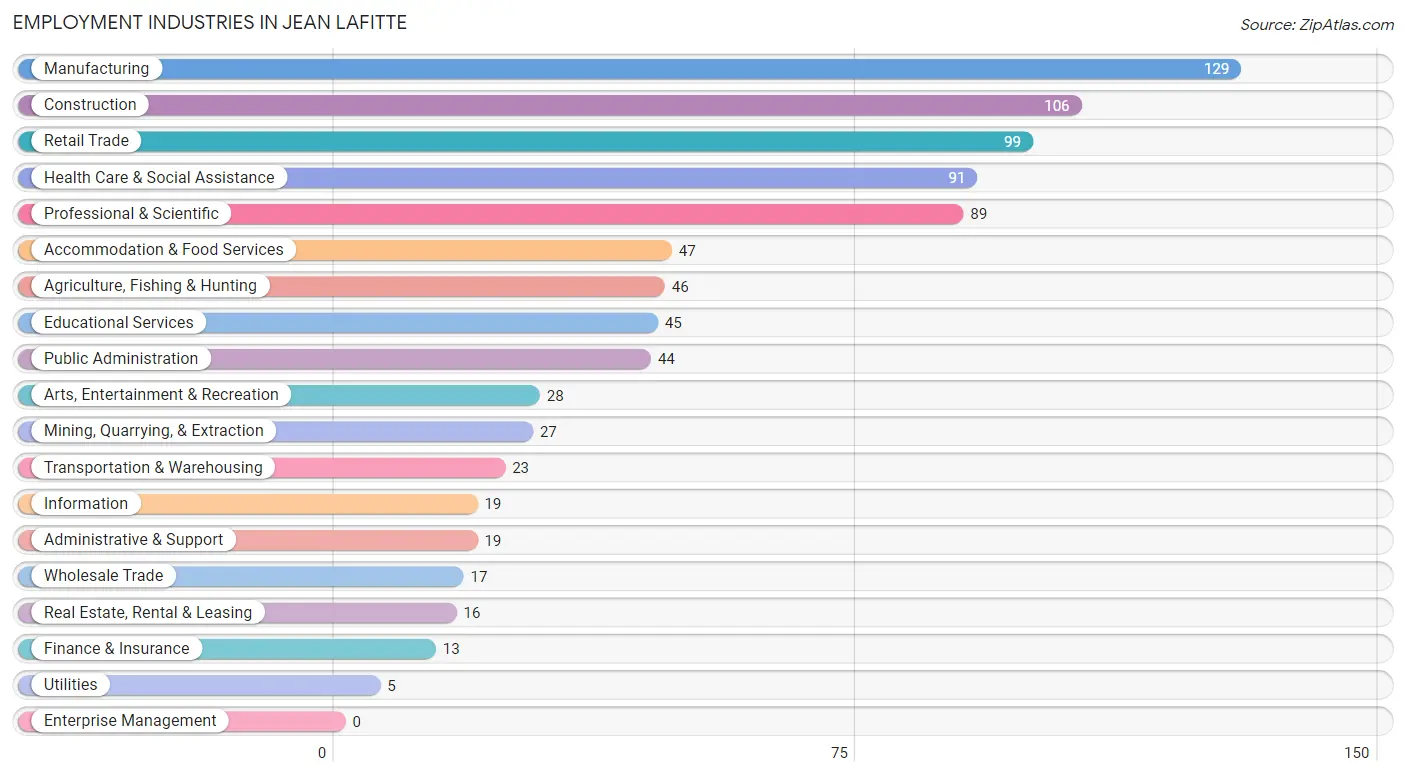
Employment Industries in Jean Lafitte
The major employment industries in Jean Lafitte include Manufacturing (129 | 14.2%), Construction (106 | 11.6%), Retail Trade (99 | 10.9%), Health Care & Social Assistance (91 | 10.0%), and Professional & Scientific (89 | 9.8%).
Employment Industries by Sex in Jean Lafitte
The Jean Lafitte industries that see more men than women are Mining, Quarrying, & Extraction (100.0%), Real Estate, Rental & Leasing (100.0%), and Administrative & Support (89.5%), whereas the industries that tend to have a higher number of women are Utilities (100.0%), Information (100.0%), and Finance & Insurance (100.0%).
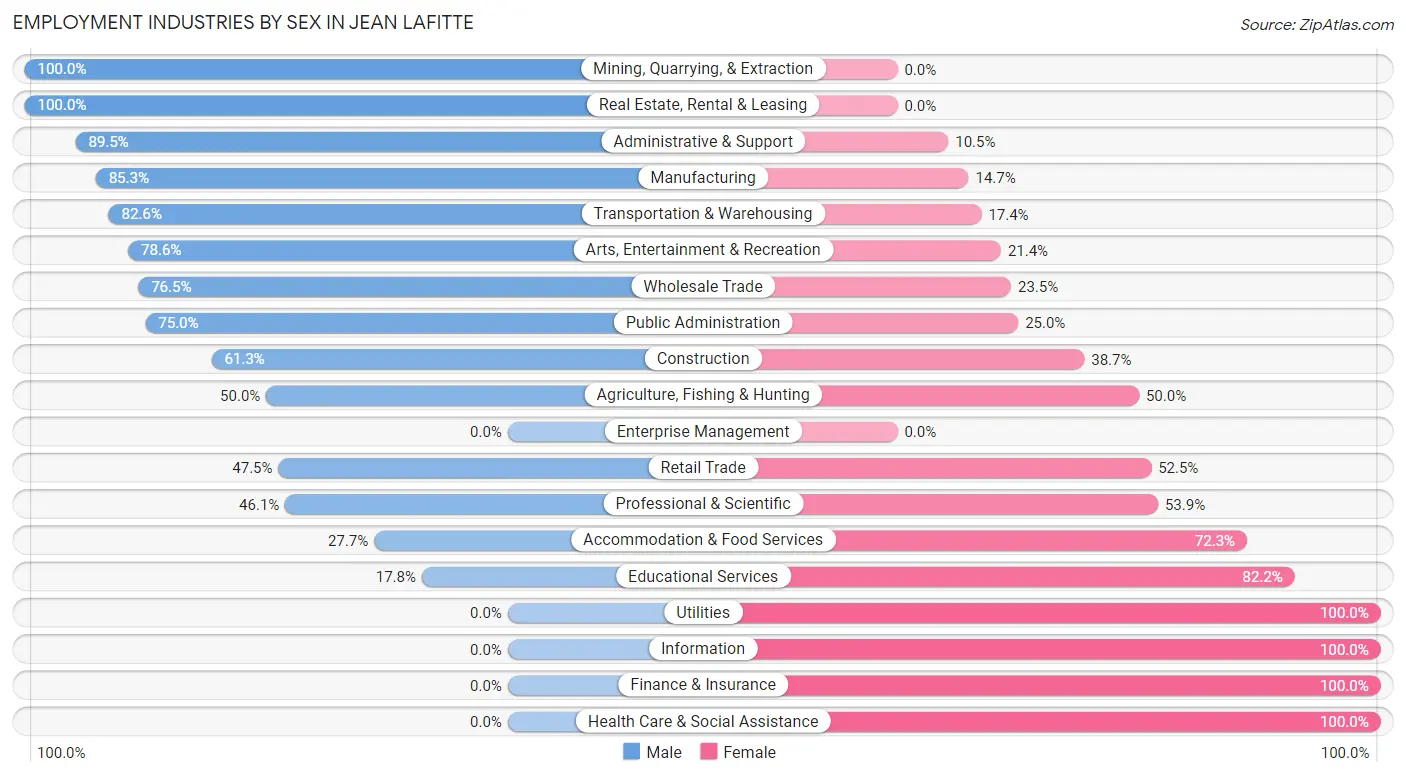
| Industry | Male | Female |
| Agriculture, Fishing & Hunting | 23 (50.0%) | 23 (50.0%) |
| Mining, Quarrying, & Extraction | 27 (100.0%) | 0 (0.0%) |
| Construction | 65 (61.3%) | 41 (38.7%) |
| Manufacturing | 110 (85.3%) | 19 (14.7%) |
| Wholesale Trade | 13 (76.5%) | 4 (23.5%) |
| Retail Trade | 47 (47.5%) | 52 (52.5%) |
| Transportation & Warehousing | 19 (82.6%) | 4 (17.4%) |
| Utilities | 0 (0.0%) | 5 (100.0%) |
| Information | 0 (0.0%) | 19 (100.0%) |
| Finance & Insurance | 0 (0.0%) | 13 (100.0%) |
| Real Estate, Rental & Leasing | 16 (100.0%) | 0 (0.0%) |
| Professional & Scientific | 41 (46.1%) | 48 (53.9%) |
| Enterprise Management | 0 (0.0%) | 0 (0.0%) |
| Administrative & Support | 17 (89.5%) | 2 (10.5%) |
| Educational Services | 8 (17.8%) | 37 (82.2%) |
| Health Care & Social Assistance | 0 (0.0%) | 91 (100.0%) |
| Arts, Entertainment & Recreation | 22 (78.6%) | 6 (21.4%) |
| Accommodation & Food Services | 13 (27.7%) | 34 (72.3%) |
| Public Administration | 33 (75.0%) | 11 (25.0%) |
| Total | 473 (51.9%) | 438 (48.1%) |
Education in Jean Lafitte
School Enrollment in Jean Lafitte
The most common levels of schooling among the 783 students in Jean Lafitte are college / undergraduate (233 | 29.8%), middle school (156 | 19.9%), and high school (133 | 17.0%).
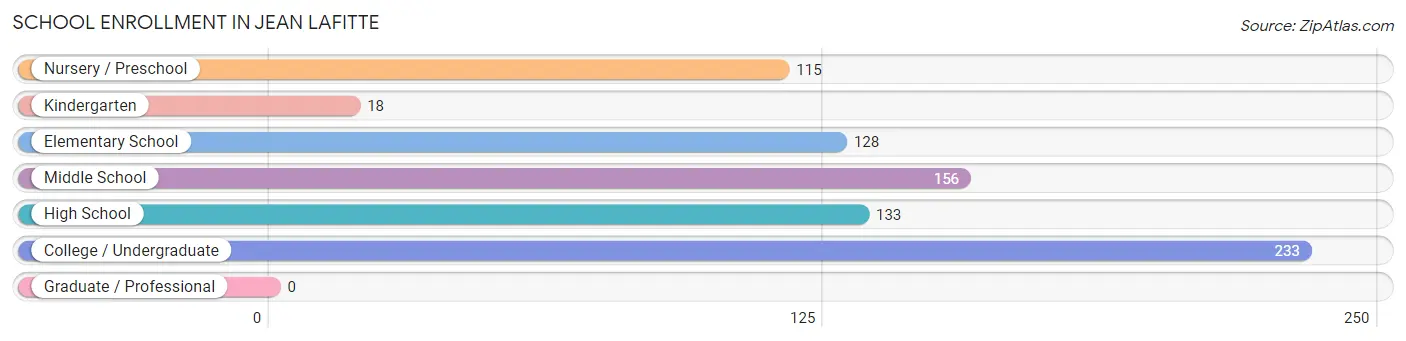
| School Level | # Students | % Students |
| Nursery / Preschool | 115 | 14.7% |
| Kindergarten | 18 | 2.3% |
| Elementary School | 128 | 16.4% |
| Middle School | 156 | 19.9% |
| High School | 133 | 17.0% |
| College / Undergraduate | 233 | 29.8% |
| Graduate / Professional | 0 | 0.0% |
| Total | 783 | 100.0% |
School Enrollment by Age by Funding Source in Jean Lafitte
Out of a total of 783 students who are enrolled in schools in Jean Lafitte, 71 (9.1%) attend a private institution, while the remaining 712 (90.9%) are enrolled in public schools. The age group of 20 to 24 year olds has the highest likelihood of being enrolled in private schools, with 6 (25.0% in the age bracket) enrolled. Conversely, the age group of 3 to 4 year olds has the lowest likelihood of being enrolled in a private school, with 108 (100.0% in the age bracket) attending a public institution.
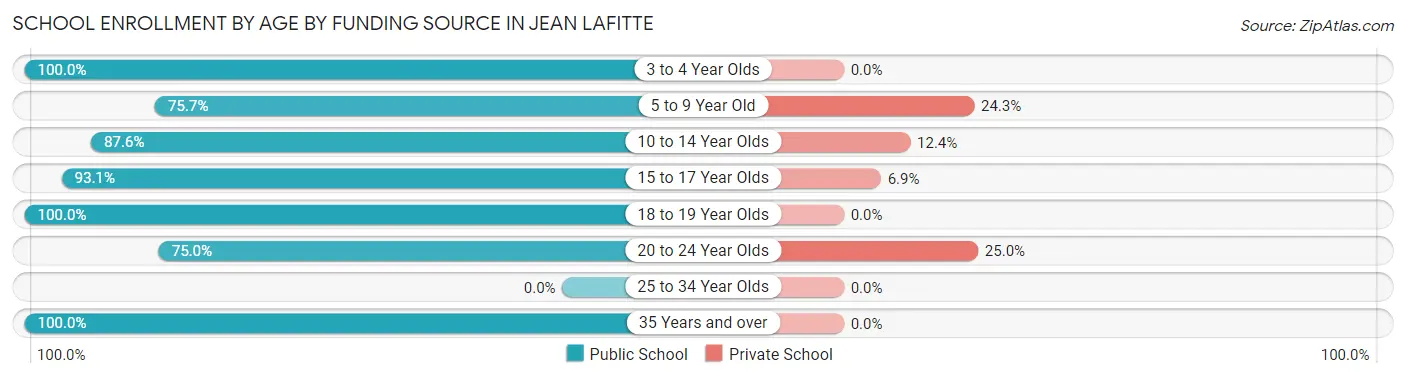
| Age Bracket | Public School | Private School |
| 3 to 4 Year Olds | 108 (100.0%) | 0 (0.0%) |
| 5 to 9 Year Old | 106 (75.7%) | 34 (24.3%) |
| 10 to 14 Year Olds | 163 (87.6%) | 23 (12.4%) |
| 15 to 17 Year Olds | 108 (93.1%) | 8 (6.9%) |
| 18 to 19 Year Olds | 177 (100.0%) | 0 (0.0%) |
| 20 to 24 Year Olds | 18 (75.0%) | 6 (25.0%) |
| 25 to 34 Year Olds | 0 (0.0%) | 0 (0.0%) |
| 35 Years and over | 32 (100.0%) | 0 (0.0%) |
| Total | 712 (90.9%) | 71 (9.1%) |
Educational Attainment by Field of Study in Jean Lafitte
Business (34 | 18.2%), liberal arts & history (30 | 16.0%), social sciences (27 | 14.4%), science & technology (19 | 10.2%), and education (16 | 8.6%) are the most common fields of study among 187 individuals in Jean Lafitte who have obtained a bachelor's degree or higher.
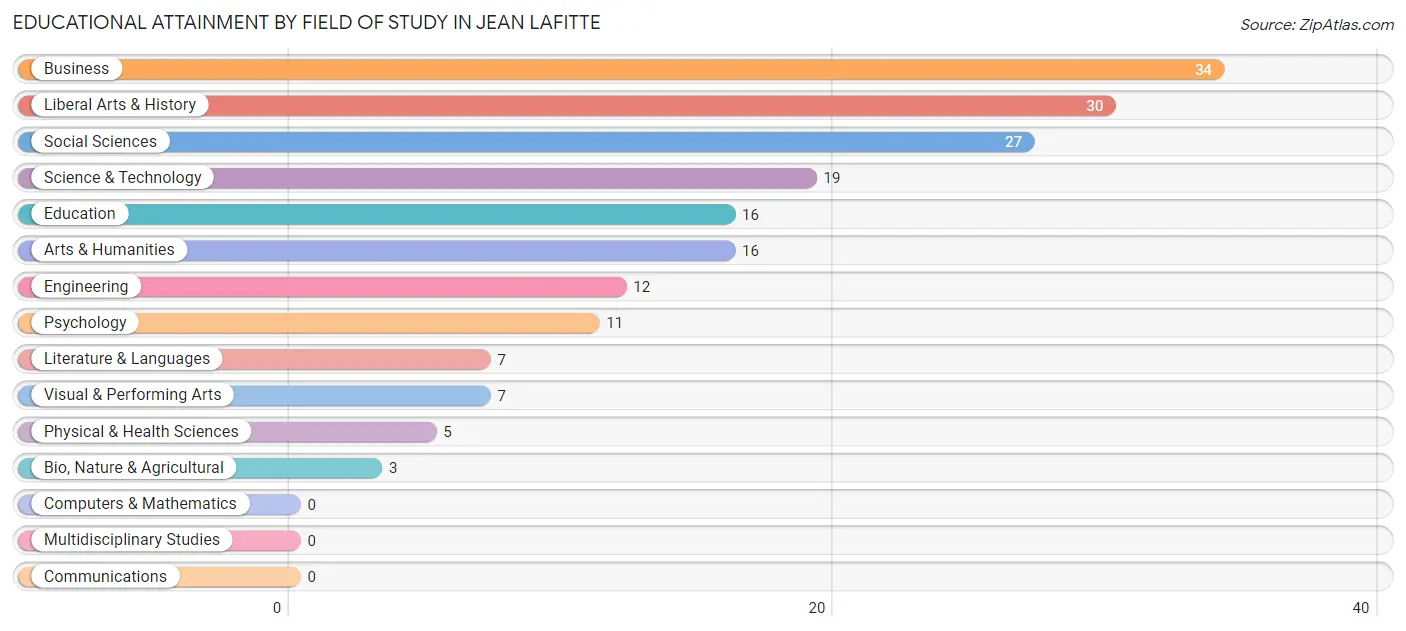
| Field of Study | # Graduates | % Graduates |
| Computers & Mathematics | 0 | 0.0% |
| Bio, Nature & Agricultural | 3 | 1.6% |
| Physical & Health Sciences | 5 | 2.7% |
| Psychology | 11 | 5.9% |
| Social Sciences | 27 | 14.4% |
| Engineering | 12 | 6.4% |
| Multidisciplinary Studies | 0 | 0.0% |
| Science & Technology | 19 | 10.2% |
| Business | 34 | 18.2% |
| Education | 16 | 8.6% |
| Literature & Languages | 7 | 3.7% |
| Liberal Arts & History | 30 | 16.0% |
| Visual & Performing Arts | 7 | 3.7% |
| Communications | 0 | 0.0% |
| Arts & Humanities | 16 | 8.6% |
| Total | 187 | 100.0% |
Transportation & Commute in Jean Lafitte
Vehicle Availability by Sex in Jean Lafitte
The most prevalent vehicle ownership categories in Jean Lafitte are males with 2 vehicles (246, accounting for 52.2%) and females with 2 vehicles (207, making up 58.3%).
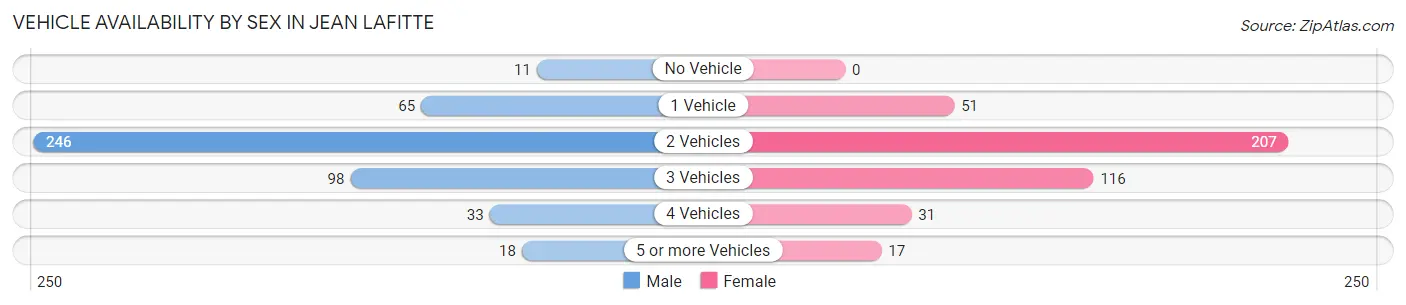
| Vehicles Available | Male | Female |
| No Vehicle | 11 (2.3%) | 0 (0.0%) |
| 1 Vehicle | 65 (13.8%) | 51 (12.1%) |
| 2 Vehicles | 246 (52.2%) | 207 (49.0%) |
| 3 Vehicles | 98 (20.8%) | 116 (27.5%) |
| 4 Vehicles | 33 (7.0%) | 31 (7.3%) |
| 5 or more Vehicles | 18 (3.8%) | 17 (4.0%) |
| Total | 471 (100.0%) | 422 (100.0%) |
Commute Time in Jean Lafitte
The most frequently occuring commute durations in Jean Lafitte are 30 to 34 minutes (276 commuters, 31.7%), 45 to 59 minutes (147 commuters, 16.9%), and 20 to 24 minutes (101 commuters, 11.6%).
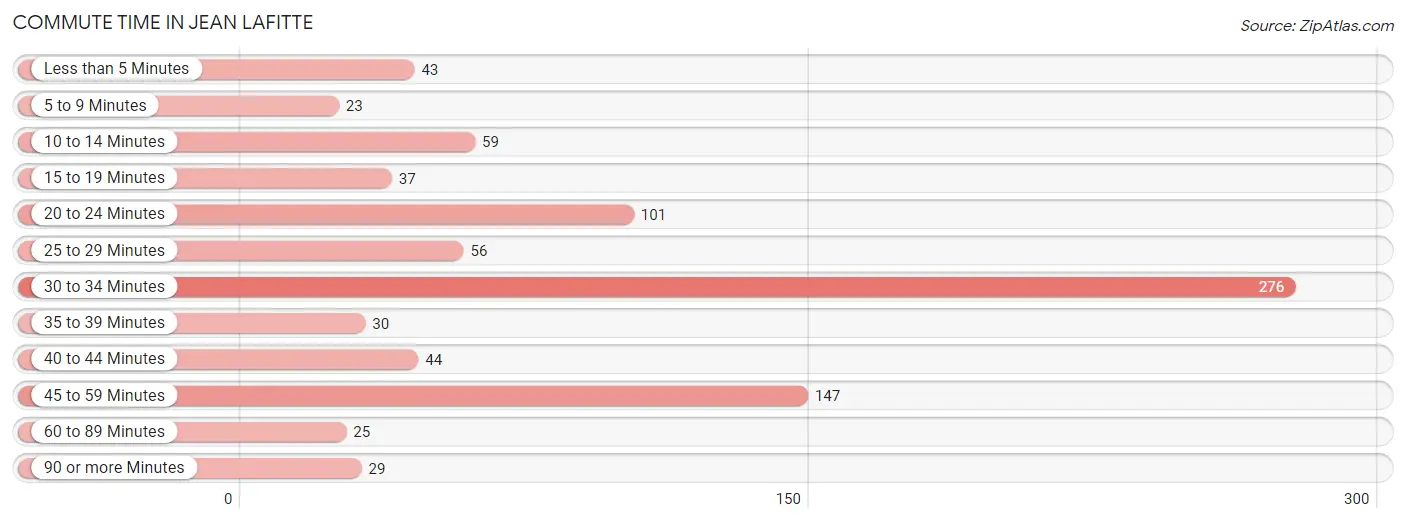
| Commute Time | # Commuters | % Commuters |
| Less than 5 Minutes | 43 | 4.9% |
| 5 to 9 Minutes | 23 | 2.6% |
| 10 to 14 Minutes | 59 | 6.8% |
| 15 to 19 Minutes | 37 | 4.3% |
| 20 to 24 Minutes | 101 | 11.6% |
| 25 to 29 Minutes | 56 | 6.4% |
| 30 to 34 Minutes | 276 | 31.7% |
| 35 to 39 Minutes | 30 | 3.5% |
| 40 to 44 Minutes | 44 | 5.1% |
| 45 to 59 Minutes | 147 | 16.9% |
| 60 to 89 Minutes | 25 | 2.9% |
| 90 or more Minutes | 29 | 3.3% |
Commute Time by Sex in Jean Lafitte
The most common commute times in Jean Lafitte are 45 to 59 minutes (120 commuters, 26.6%) for males and 30 to 34 minutes (181 commuters, 43.2%) for females.
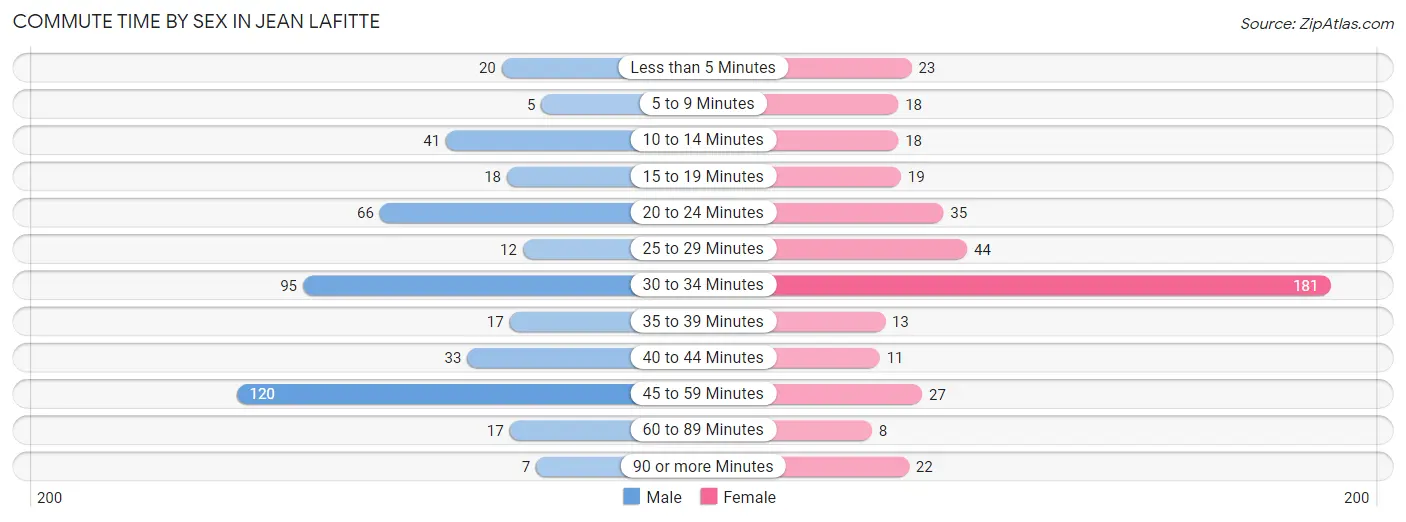
| Commute Time | Male | Female |
| Less than 5 Minutes | 20 (4.4%) | 23 (5.5%) |
| 5 to 9 Minutes | 5 (1.1%) | 18 (4.3%) |
| 10 to 14 Minutes | 41 (9.1%) | 18 (4.3%) |
| 15 to 19 Minutes | 18 (4.0%) | 19 (4.5%) |
| 20 to 24 Minutes | 66 (14.6%) | 35 (8.4%) |
| 25 to 29 Minutes | 12 (2.7%) | 44 (10.5%) |
| 30 to 34 Minutes | 95 (21.1%) | 181 (43.2%) |
| 35 to 39 Minutes | 17 (3.8%) | 13 (3.1%) |
| 40 to 44 Minutes | 33 (7.3%) | 11 (2.6%) |
| 45 to 59 Minutes | 120 (26.6%) | 27 (6.4%) |
| 60 to 89 Minutes | 17 (3.8%) | 8 (1.9%) |
| 90 or more Minutes | 7 (1.5%) | 22 (5.2%) |
Time of Departure to Work by Sex in Jean Lafitte
The most frequent times of departure to work in Jean Lafitte are 6:30 AM to 6:59 AM (75, 16.6%) for males and 7:30 AM to 7:59 AM (98, 23.4%) for females.
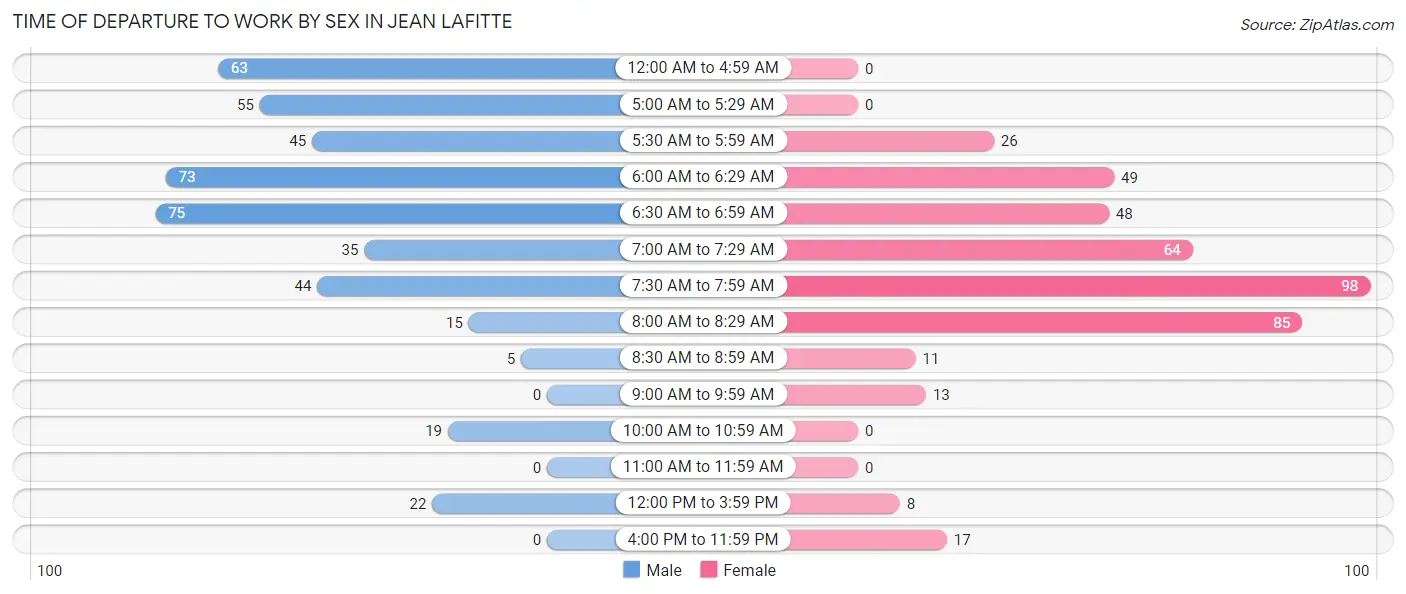
| Time of Departure | Male | Female |
| 12:00 AM to 4:59 AM | 63 (14.0%) | 0 (0.0%) |
| 5:00 AM to 5:29 AM | 55 (12.2%) | 0 (0.0%) |
| 5:30 AM to 5:59 AM | 45 (10.0%) | 26 (6.2%) |
| 6:00 AM to 6:29 AM | 73 (16.2%) | 49 (11.7%) |
| 6:30 AM to 6:59 AM | 75 (16.6%) | 48 (11.5%) |
| 7:00 AM to 7:29 AM | 35 (7.8%) | 64 (15.3%) |
| 7:30 AM to 7:59 AM | 44 (9.8%) | 98 (23.4%) |
| 8:00 AM to 8:29 AM | 15 (3.3%) | 85 (20.3%) |
| 8:30 AM to 8:59 AM | 5 (1.1%) | 11 (2.6%) |
| 9:00 AM to 9:59 AM | 0 (0.0%) | 13 (3.1%) |
| 10:00 AM to 10:59 AM | 19 (4.2%) | 0 (0.0%) |
| 11:00 AM to 11:59 AM | 0 (0.0%) | 0 (0.0%) |
| 12:00 PM to 3:59 PM | 22 (4.9%) | 8 (1.9%) |
| 4:00 PM to 11:59 PM | 0 (0.0%) | 17 (4.1%) |
| Total | 451 (100.0%) | 419 (100.0%) |
Housing Occupancy in Jean Lafitte
Occupancy by Ownership in Jean Lafitte
Of the total 792 dwellings in Jean Lafitte, owner-occupied units account for 650 (82.1%), while renter-occupied units make up 142 (17.9%).
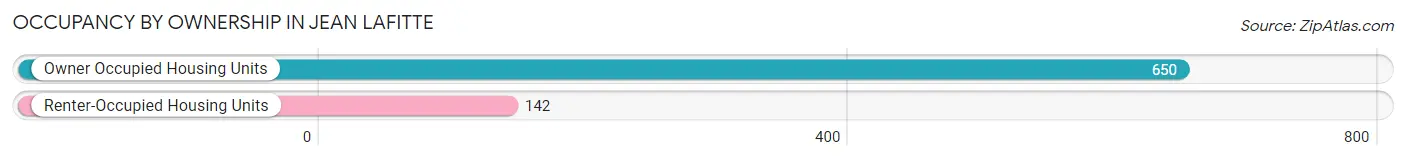
| Occupancy | # Housing Units | % Housing Units |
| Owner Occupied Housing Units | 650 | 82.1% |
| Renter-Occupied Housing Units | 142 | 17.9% |
| Total Occupied Housing Units | 792 | 100.0% |
Occupancy by Household Size in Jean Lafitte
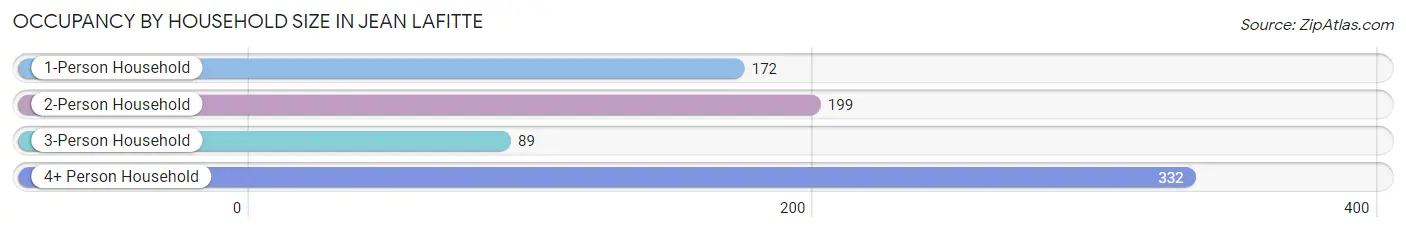
| Household Size | # Housing Units | % Housing Units |
| 1-Person Household | 172 | 21.7% |
| 2-Person Household | 199 | 25.1% |
| 3-Person Household | 89 | 11.2% |
| 4+ Person Household | 332 | 41.9% |
| Total Housing Units | 792 | 100.0% |
Occupancy by Ownership by Household Size in Jean Lafitte
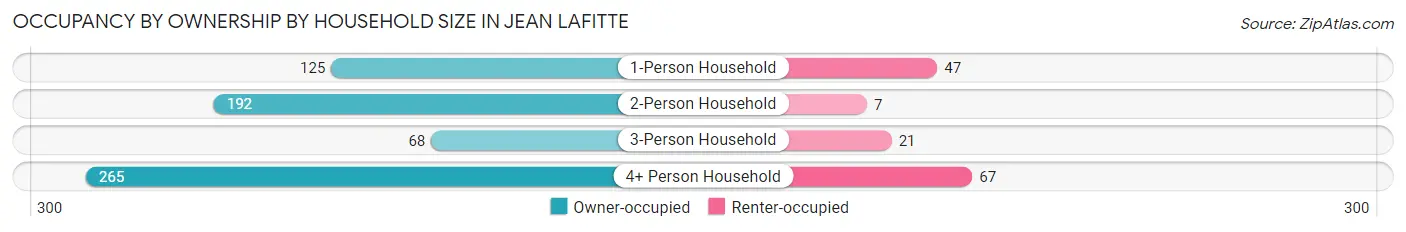
| Household Size | Owner-occupied | Renter-occupied |
| 1-Person Household | 125 (72.7%) | 47 (27.3%) |
| 2-Person Household | 192 (96.5%) | 7 (3.5%) |
| 3-Person Household | 68 (76.4%) | 21 (23.6%) |
| 4+ Person Household | 265 (79.8%) | 67 (20.2%) |
| Total Housing Units | 650 (82.1%) | 142 (17.9%) |
Occupancy by Educational Attainment in Jean Lafitte
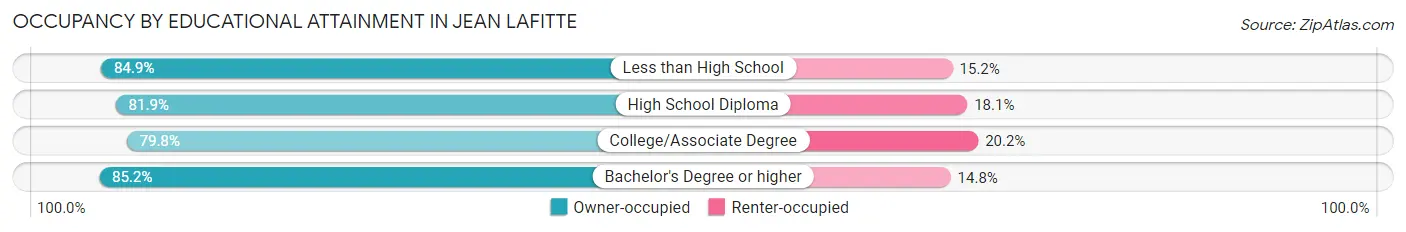
| Household Size | Owner-occupied | Renter-occupied |
| Less than High School | 112 (84.9%) | 20 (15.1%) |
| High School Diploma | 254 (81.9%) | 56 (18.1%) |
| College/Associate Degree | 209 (79.8%) | 53 (20.2%) |
| Bachelor's Degree or higher | 75 (85.2%) | 13 (14.8%) |
Occupancy by Age of Householder in Jean Lafitte
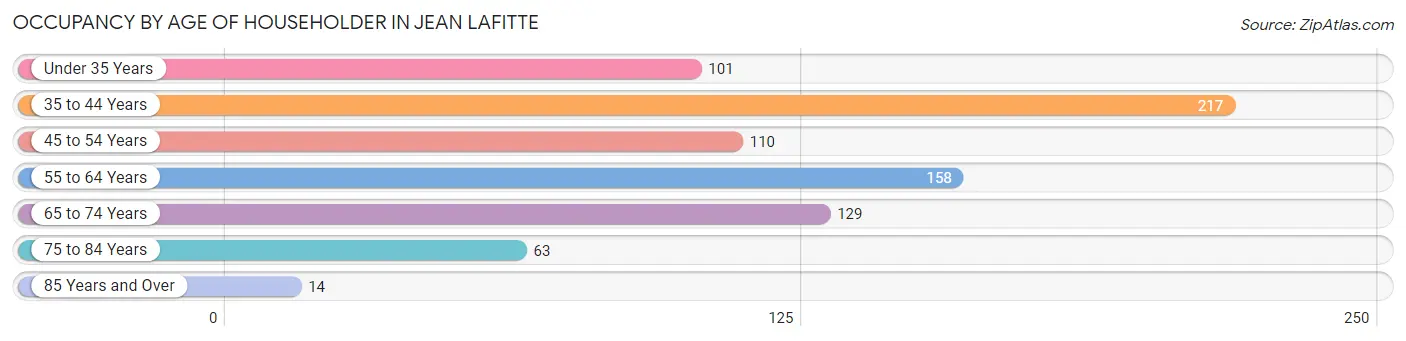
| Age Bracket | # Households | % Households |
| Under 35 Years | 101 | 12.8% |
| 35 to 44 Years | 217 | 27.4% |
| 45 to 54 Years | 110 | 13.9% |
| 55 to 64 Years | 158 | 20.0% |
| 65 to 74 Years | 129 | 16.3% |
| 75 to 84 Years | 63 | 8.0% |
| 85 Years and Over | 14 | 1.8% |
| Total | 792 | 100.0% |
Housing Finances in Jean Lafitte
Median Income by Occupancy in Jean Lafitte
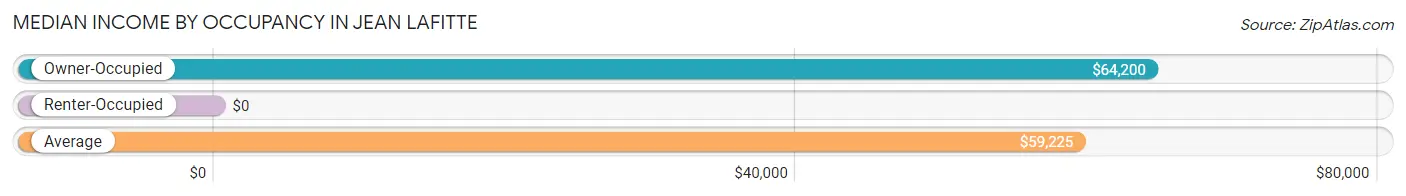
| Occupancy Type | # Households | Median Income |
| Owner-Occupied | 650 (82.1%) | $64,200 |
| Renter-Occupied | 142 (17.9%) | $0 |
| Average | 792 (100.0%) | $59,225 |
Occupancy by Householder Income Bracket in Jean Lafitte
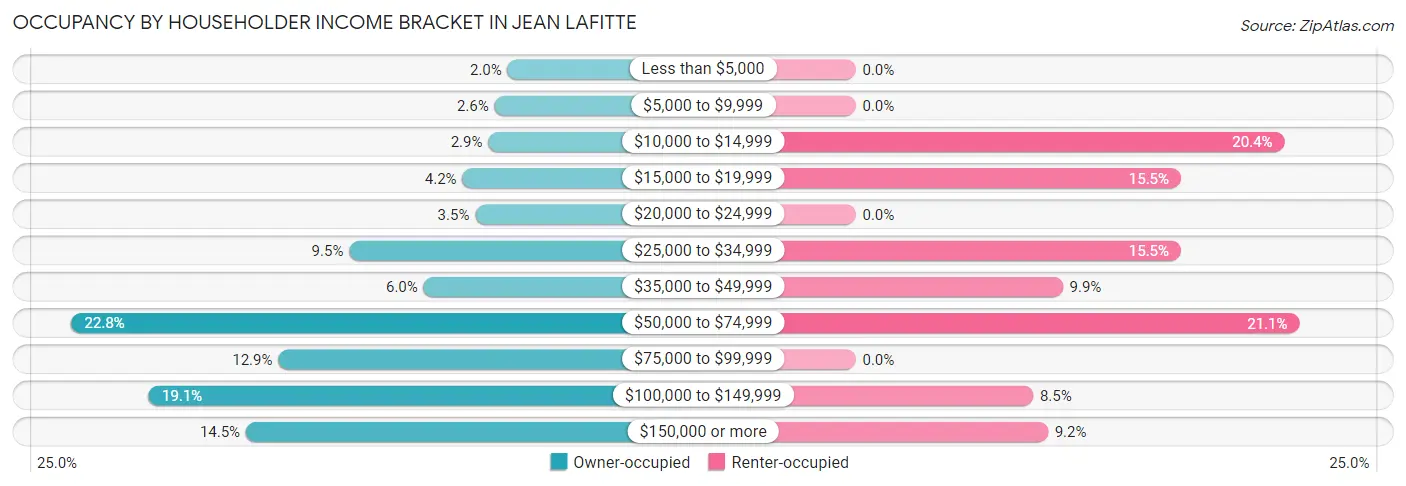
| Income Bracket | Owner-occupied | Renter-occupied |
| Less than $5,000 | 13 (2.0%) | 0 (0.0%) |
| $5,000 to $9,999 | 17 (2.6%) | 0 (0.0%) |
| $10,000 to $14,999 | 19 (2.9%) | 29 (20.4%) |
| $15,000 to $19,999 | 27 (4.2%) | 22 (15.5%) |
| $20,000 to $24,999 | 23 (3.5%) | 0 (0.0%) |
| $25,000 to $34,999 | 62 (9.5%) | 22 (15.5%) |
| $35,000 to $49,999 | 39 (6.0%) | 14 (9.9%) |
| $50,000 to $74,999 | 148 (22.8%) | 30 (21.1%) |
| $75,000 to $99,999 | 84 (12.9%) | 0 (0.0%) |
| $100,000 to $149,999 | 124 (19.1%) | 12 (8.5%) |
| $150,000 or more | 94 (14.5%) | 13 (9.1%) |
| Total | 650 (100.0%) | 142 (100.0%) |
Monthly Housing Cost Tiers in Jean Lafitte
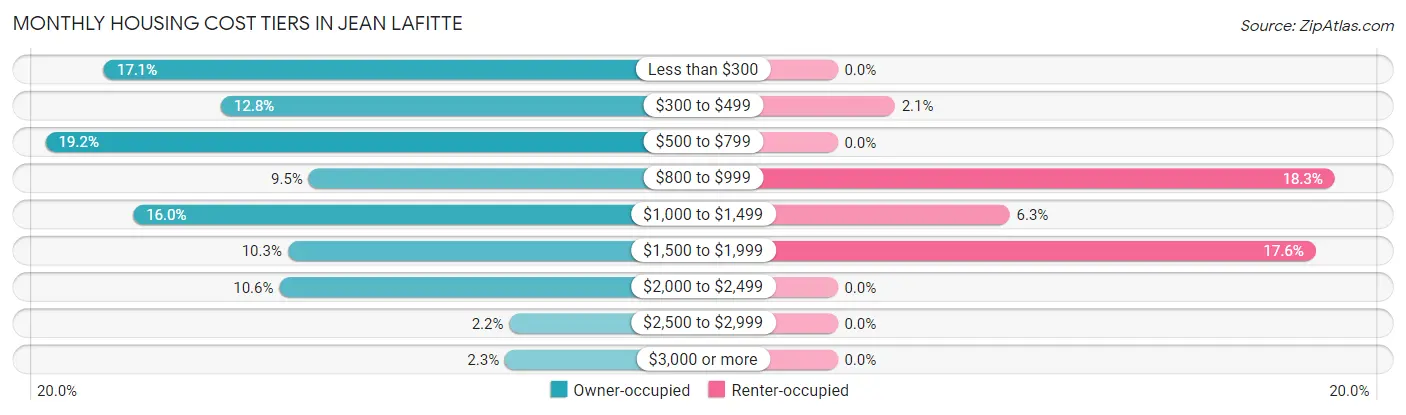
| Monthly Cost | Owner-occupied | Renter-occupied |
| Less than $300 | 111 (17.1%) | 0 (0.0%) |
| $300 to $499 | 83 (12.8%) | 3 (2.1%) |
| $500 to $799 | 125 (19.2%) | 0 (0.0%) |
| $800 to $999 | 62 (9.5%) | 26 (18.3%) |
| $1,000 to $1,499 | 104 (16.0%) | 9 (6.3%) |
| $1,500 to $1,999 | 67 (10.3%) | 25 (17.6%) |
| $2,000 to $2,499 | 69 (10.6%) | 0 (0.0%) |
| $2,500 to $2,999 | 14 (2.1%) | 0 (0.0%) |
| $3,000 or more | 15 (2.3%) | 0 (0.0%) |
| Total | 650 (100.0%) | 142 (100.0%) |
Physical Housing Characteristics in Jean Lafitte
Housing Structures in Jean Lafitte
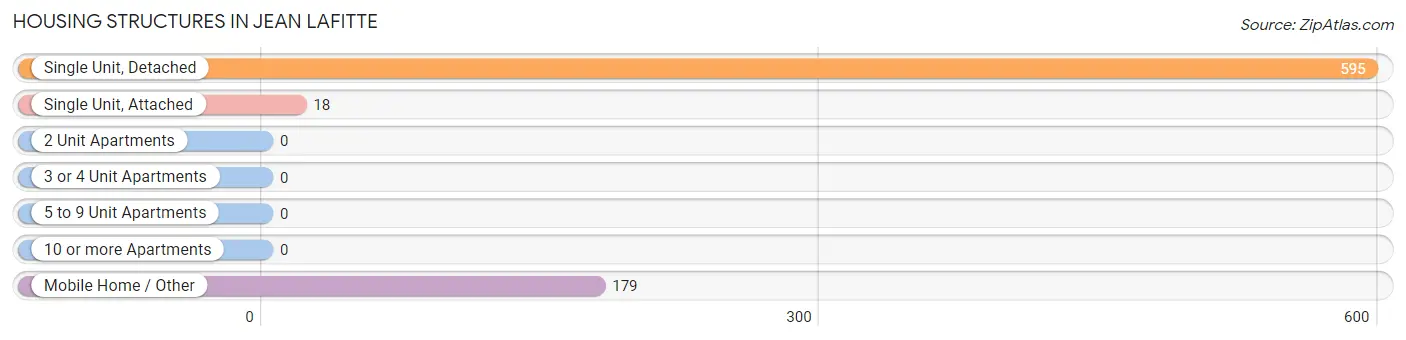
| Structure Type | # Housing Units | % Housing Units |
| Single Unit, Detached | 595 | 75.1% |
| Single Unit, Attached | 18 | 2.3% |
| 2 Unit Apartments | 0 | 0.0% |
| 3 or 4 Unit Apartments | 0 | 0.0% |
| 5 to 9 Unit Apartments | 0 | 0.0% |
| 10 or more Apartments | 0 | 0.0% |
| Mobile Home / Other | 179 | 22.6% |
| Total | 792 | 100.0% |
Housing Structures by Occupancy in Jean Lafitte
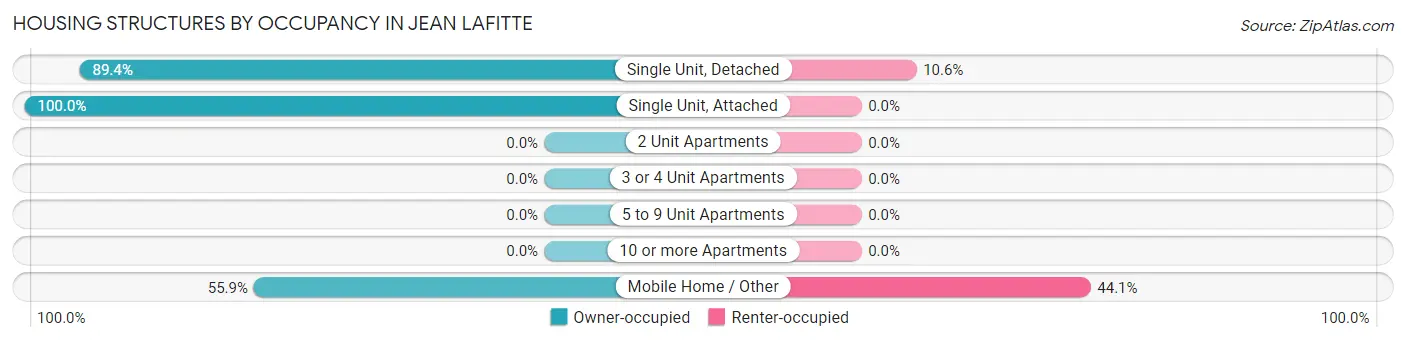
| Structure Type | Owner-occupied | Renter-occupied |
| Single Unit, Detached | 532 (89.4%) | 63 (10.6%) |
| Single Unit, Attached | 18 (100.0%) | 0 (0.0%) |
| 2 Unit Apartments | 0 (0.0%) | 0 (0.0%) |
| 3 or 4 Unit Apartments | 0 (0.0%) | 0 (0.0%) |
| 5 to 9 Unit Apartments | 0 (0.0%) | 0 (0.0%) |
| 10 or more Apartments | 0 (0.0%) | 0 (0.0%) |
| Mobile Home / Other | 100 (55.9%) | 79 (44.1%) |
| Total | 650 (82.1%) | 142 (17.9%) |
Housing Structures by Number of Rooms in Jean Lafitte
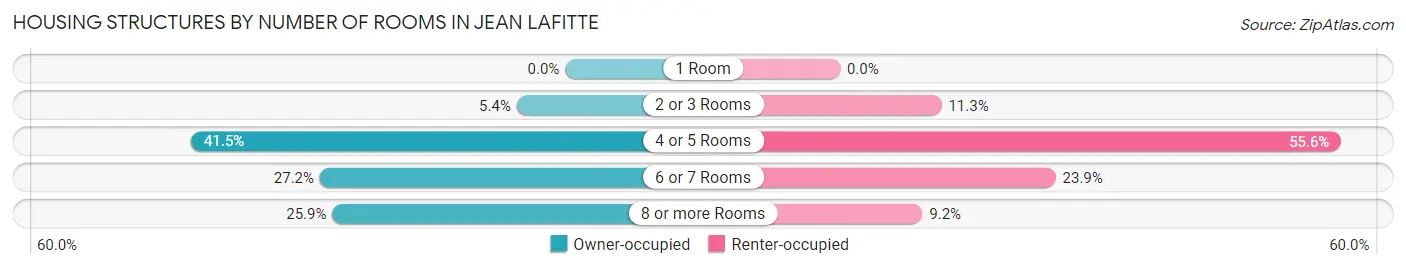
| Number of Rooms | Owner-occupied | Renter-occupied |
| 1 Room | 0 (0.0%) | 0 (0.0%) |
| 2 or 3 Rooms | 35 (5.4%) | 16 (11.3%) |
| 4 or 5 Rooms | 270 (41.5%) | 79 (55.6%) |
| 6 or 7 Rooms | 177 (27.2%) | 34 (23.9%) |
| 8 or more Rooms | 168 (25.9%) | 13 (9.1%) |
| Total | 650 (100.0%) | 142 (100.0%) |
Housing Structure by Heating Type in Jean Lafitte
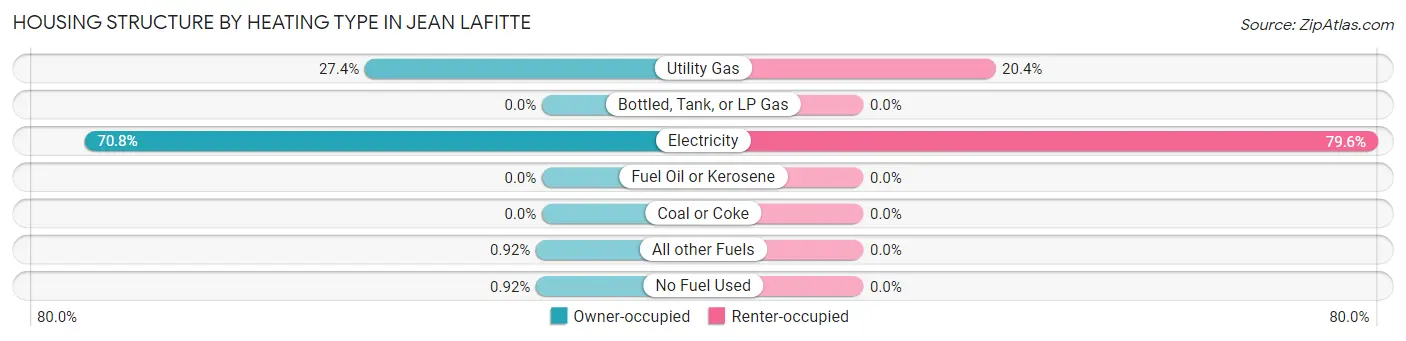
| Heating Type | Owner-occupied | Renter-occupied |
| Utility Gas | 178 (27.4%) | 29 (20.4%) |
| Bottled, Tank, or LP Gas | 0 (0.0%) | 0 (0.0%) |
| Electricity | 460 (70.8%) | 113 (79.6%) |
| Fuel Oil or Kerosene | 0 (0.0%) | 0 (0.0%) |
| Coal or Coke | 0 (0.0%) | 0 (0.0%) |
| All other Fuels | 6 (0.9%) | 0 (0.0%) |
| No Fuel Used | 6 (0.9%) | 0 (0.0%) |
| Total | 650 (100.0%) | 142 (100.0%) |
Household Vehicle Usage in Jean Lafitte
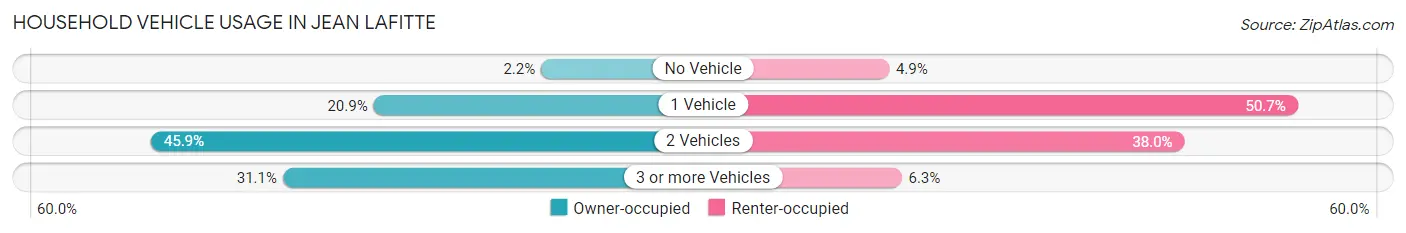
| Vehicles per Household | Owner-occupied | Renter-occupied |
| No Vehicle | 14 (2.1%) | 7 (4.9%) |
| 1 Vehicle | 136 (20.9%) | 72 (50.7%) |
| 2 Vehicles | 298 (45.9%) | 54 (38.0%) |
| 3 or more Vehicles | 202 (31.1%) | 9 (6.3%) |
| Total | 650 (100.0%) | 142 (100.0%) |
Real Estate & Mortgages in Jean Lafitte
Real Estate and Mortgage Overview in Jean Lafitte
| Characteristic | Without Mortgage | With Mortgage |
| Housing Units | 370 | 280 |
| Median Property Value | $178,000 | $223,800 |
| Median Household Income | $62,738 | $56 |
| Monthly Housing Costs | $476 | $15 |
| Real Estate Taxes | $1,094 | $84 |
Property Value by Mortgage Status in Jean Lafitte
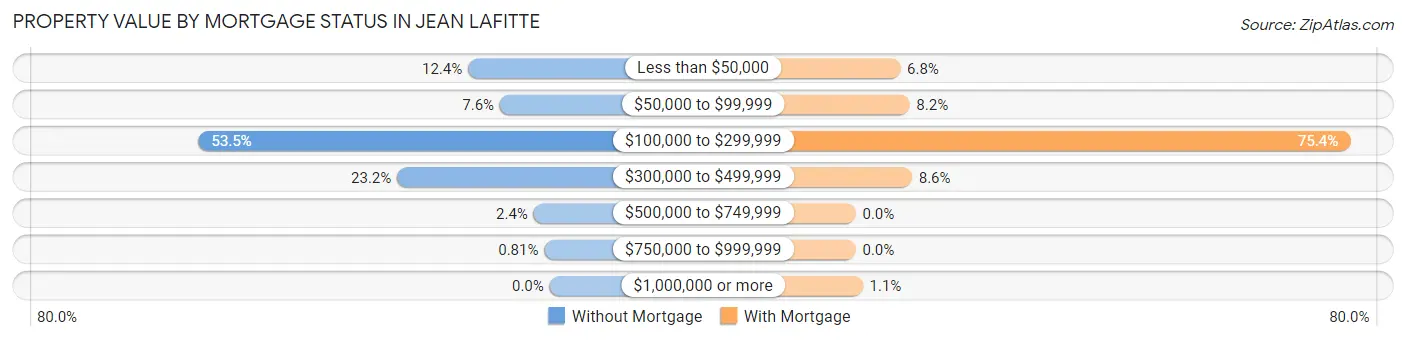
| Property Value | Without Mortgage | With Mortgage |
| Less than $50,000 | 46 (12.4%) | 19 (6.8%) |
| $50,000 to $99,999 | 28 (7.6%) | 23 (8.2%) |
| $100,000 to $299,999 | 198 (53.5%) | 211 (75.4%) |
| $300,000 to $499,999 | 86 (23.2%) | 24 (8.6%) |
| $500,000 to $749,999 | 9 (2.4%) | 0 (0.0%) |
| $750,000 to $999,999 | 3 (0.8%) | 0 (0.0%) |
| $1,000,000 or more | 0 (0.0%) | 3 (1.1%) |
| Total | 370 (100.0%) | 280 (100.0%) |
Household Income by Mortgage Status in Jean Lafitte
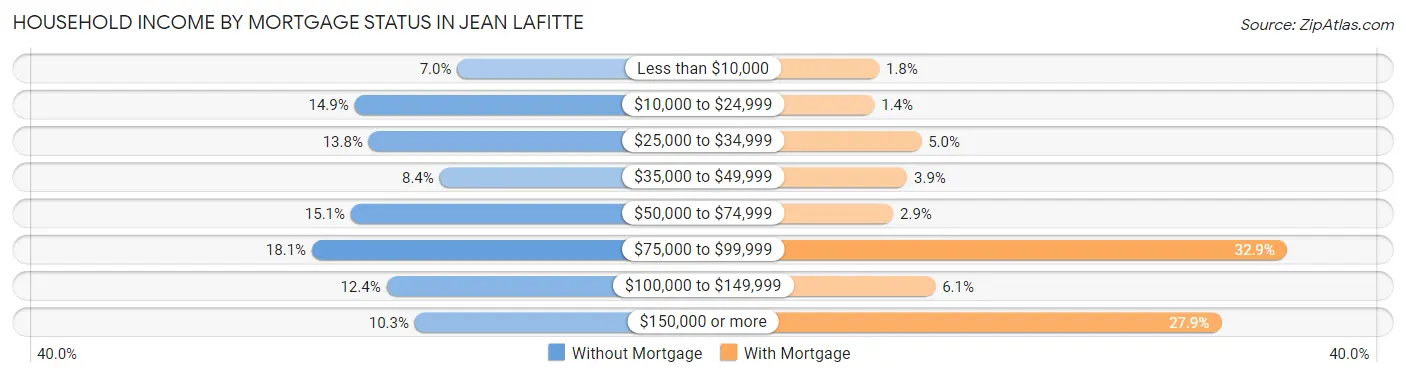
| Household Income | Without Mortgage | With Mortgage |
| Less than $10,000 | 26 (7.0%) | 5 (1.8%) |
| $10,000 to $24,999 | 55 (14.9%) | 4 (1.4%) |
| $25,000 to $34,999 | 51 (13.8%) | 14 (5.0%) |
| $35,000 to $49,999 | 31 (8.4%) | 11 (3.9%) |
| $50,000 to $74,999 | 56 (15.1%) | 8 (2.9%) |
| $75,000 to $99,999 | 67 (18.1%) | 92 (32.9%) |
| $100,000 to $149,999 | 46 (12.4%) | 17 (6.1%) |
| $150,000 or more | 38 (10.3%) | 78 (27.9%) |
| Total | 370 (100.0%) | 280 (100.0%) |
Property Value to Household Income Ratio in Jean Lafitte
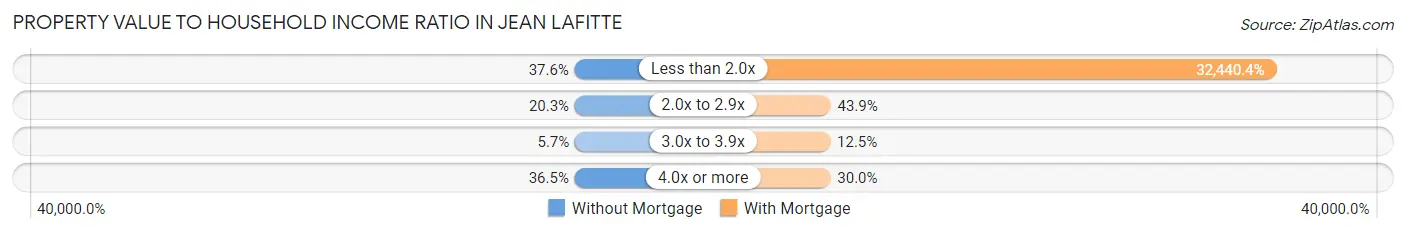
| Value-to-Income Ratio | Without Mortgage | With Mortgage |
| Less than 2.0x | 139 (37.6%) | 90,833 (32,440.4%) |
| 2.0x to 2.9x | 75 (20.3%) | 123 (43.9%) |
| 3.0x to 3.9x | 21 (5.7%) | 35 (12.5%) |
| 4.0x or more | 135 (36.5%) | 84 (30.0%) |
| Total | 370 (100.0%) | 280 (100.0%) |
Real Estate Taxes by Mortgage Status in Jean Lafitte
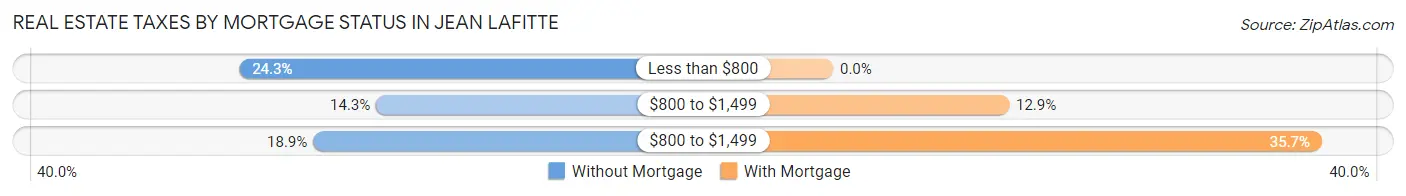
| Property Taxes | Without Mortgage | With Mortgage |
| Less than $800 | 90 (24.3%) | 0 (0.0%) |
| $800 to $1,499 | 53 (14.3%) | 36 (12.9%) |
| $800 to $1,499 | 70 (18.9%) | 100 (35.7%) |
| Total | 370 (100.0%) | 280 (100.0%) |
Health & Disability in Jean Lafitte
Health Insurance Coverage by Age in Jean Lafitte
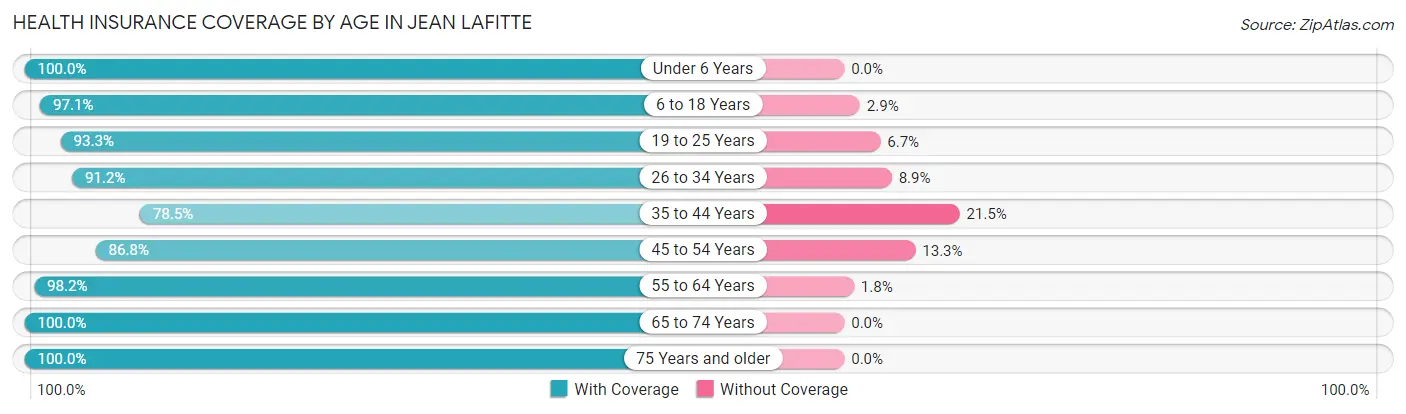
| Age Bracket | With Coverage | Without Coverage |
| Under 6 Years | 238 (100.0%) | 0 (0.0%) |
| 6 to 18 Years | 467 (97.1%) | 14 (2.9%) |
| 19 to 25 Years | 291 (93.3%) | 21 (6.7%) |
| 26 to 34 Years | 175 (91.1%) | 17 (8.8%) |
| 35 to 44 Years | 365 (78.5%) | 100 (21.5%) |
| 45 to 54 Years | 203 (86.8%) | 31 (13.3%) |
| 55 to 64 Years | 275 (98.2%) | 5 (1.8%) |
| 65 to 74 Years | 196 (100.0%) | 0 (0.0%) |
| 75 Years and older | 119 (100.0%) | 0 (0.0%) |
| Total | 2,329 (92.5%) | 188 (7.5%) |
Health Insurance Coverage by Citizenship Status in Jean Lafitte
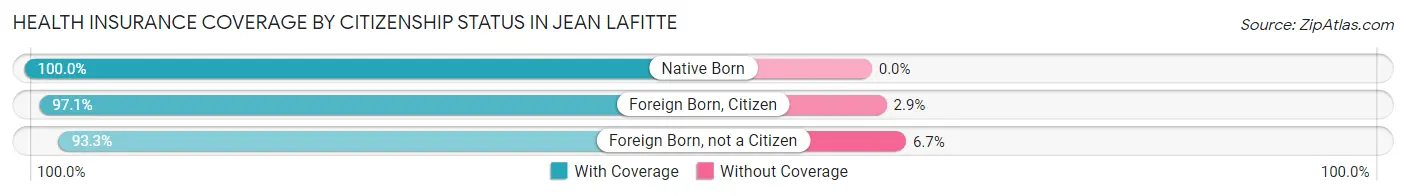
| Citizenship Status | With Coverage | Without Coverage |
| Native Born | 238 (100.0%) | 0 (0.0%) |
| Foreign Born, Citizen | 467 (97.1%) | 14 (2.9%) |
| Foreign Born, not a Citizen | 291 (93.3%) | 21 (6.7%) |
Health Insurance Coverage by Household Income in Jean Lafitte
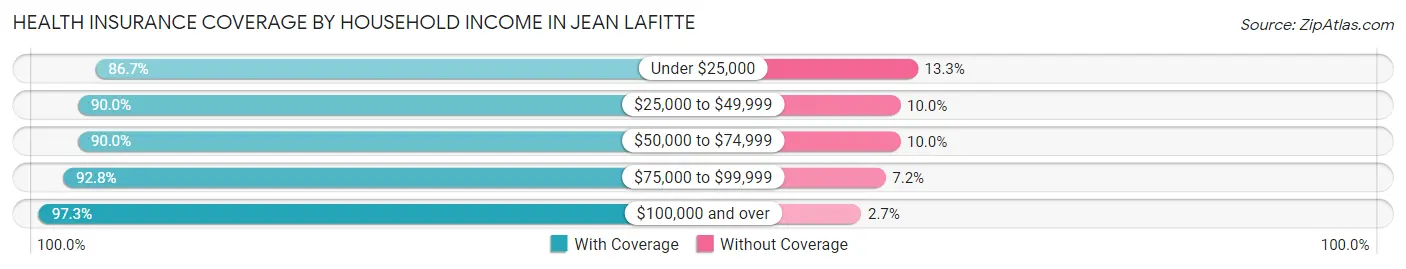
| Household Income | With Coverage | Without Coverage |
| Under $25,000 | 183 (86.7%) | 28 (13.3%) |
| $25,000 to $49,999 | 316 (90.0%) | 35 (10.0%) |
| $50,000 to $74,999 | 758 (90.0%) | 84 (10.0%) |
| $75,000 to $99,999 | 231 (92.8%) | 18 (7.2%) |
| $100,000 and over | 838 (97.3%) | 23 (2.7%) |
Public vs Private Health Insurance Coverage by Age in Jean Lafitte
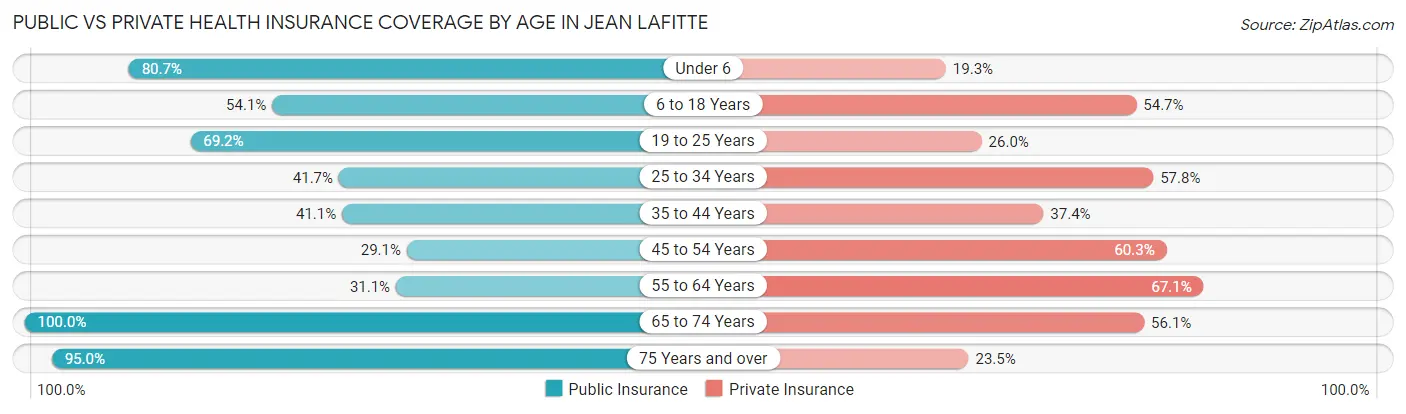
| Age Bracket | Public Insurance | Private Insurance |
| Under 6 | 192 (80.7%) | 46 (19.3%) |
| 6 to 18 Years | 260 (54.0%) | 263 (54.7%) |
| 19 to 25 Years | 216 (69.2%) | 81 (26.0%) |
| 25 to 34 Years | 80 (41.7%) | 111 (57.8%) |
| 35 to 44 Years | 191 (41.1%) | 174 (37.4%) |
| 45 to 54 Years | 68 (29.1%) | 141 (60.3%) |
| 55 to 64 Years | 87 (31.1%) | 188 (67.1%) |
| 65 to 74 Years | 196 (100.0%) | 110 (56.1%) |
| 75 Years and over | 113 (95.0%) | 28 (23.5%) |
| Total | 1,403 (55.7%) | 1,142 (45.4%) |
Disability Status by Sex by Age in Jean Lafitte
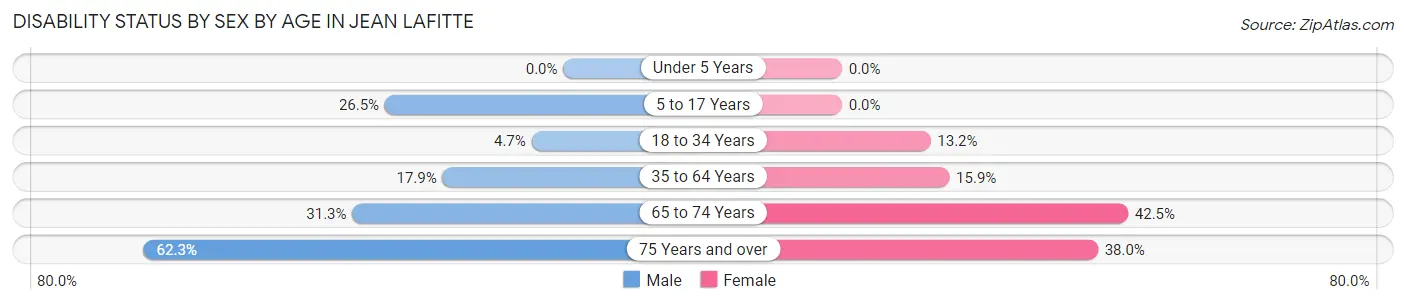
| Age Bracket | Male | Female |
| Under 5 Years | 0 (0.0%) | 0 (0.0%) |
| 5 to 17 Years | 71 (26.5%) | 0 (0.0%) |
| 18 to 34 Years | 16 (4.7%) | 28 (13.2%) |
| 35 to 64 Years | 89 (17.9%) | 77 (15.9%) |
| 65 to 74 Years | 26 (31.3%) | 48 (42.5%) |
| 75 Years and over | 43 (62.3%) | 19 (38.0%) |
Disability Class by Sex by Age in Jean Lafitte
Disability Class: Hearing Difficulty
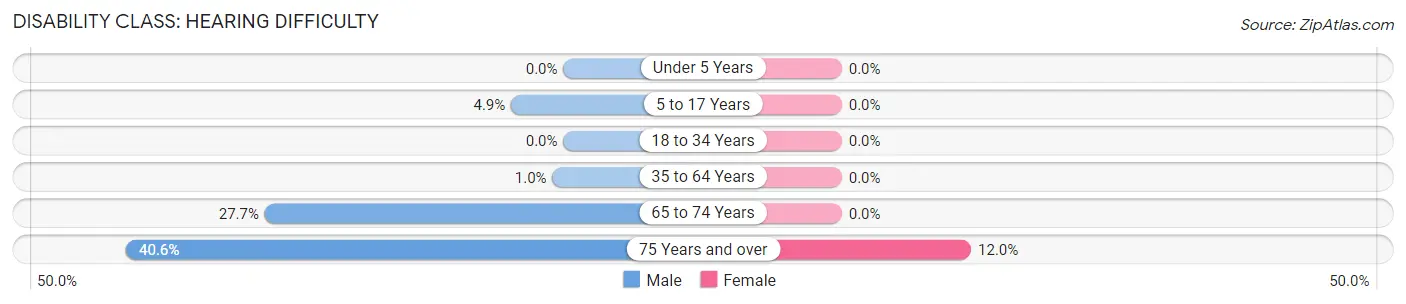
| Age Bracket | Male | Female |
| Under 5 Years | 0 (0.0%) | 0 (0.0%) |
| 5 to 17 Years | 13 (4.9%) | 0 (0.0%) |
| 18 to 34 Years | 0 (0.0%) | 0 (0.0%) |
| 35 to 64 Years | 5 (1.0%) | 0 (0.0%) |
| 65 to 74 Years | 23 (27.7%) | 0 (0.0%) |
| 75 Years and over | 28 (40.6%) | 6 (12.0%) |
Disability Class: Vision Difficulty
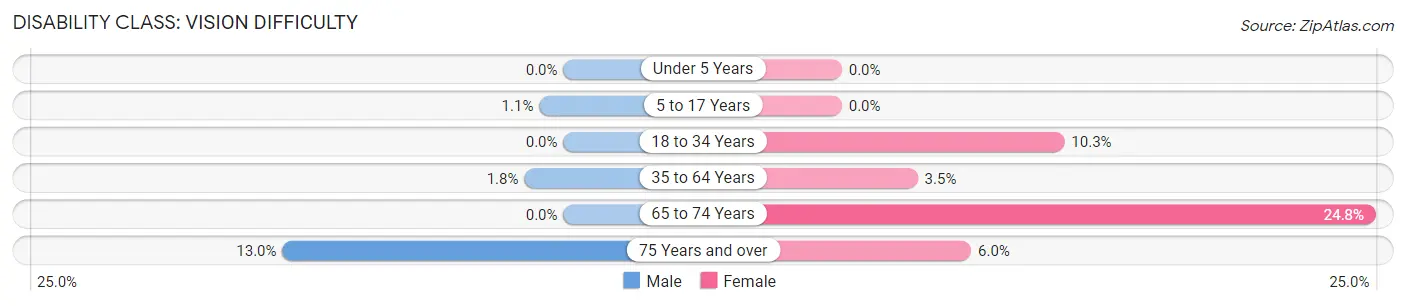
| Age Bracket | Male | Female |
| Under 5 Years | 0 (0.0%) | 0 (0.0%) |
| 5 to 17 Years | 3 (1.1%) | 0 (0.0%) |
| 18 to 34 Years | 0 (0.0%) | 22 (10.3%) |
| 35 to 64 Years | 9 (1.8%) | 17 (3.5%) |
| 65 to 74 Years | 0 (0.0%) | 28 (24.8%) |
| 75 Years and over | 9 (13.0%) | 3 (6.0%) |
Disability Class: Cognitive Difficulty
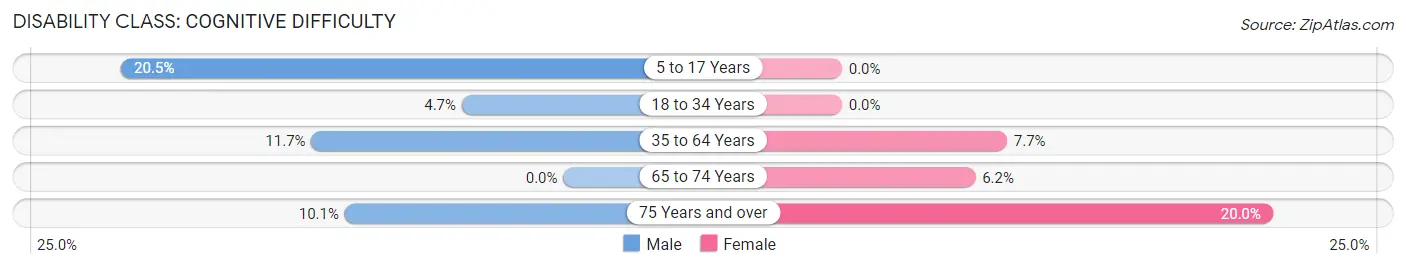
| Age Bracket | Male | Female |
| 5 to 17 Years | 55 (20.5%) | 0 (0.0%) |
| 18 to 34 Years | 16 (4.7%) | 0 (0.0%) |
| 35 to 64 Years | 58 (11.7%) | 37 (7.7%) |
| 65 to 74 Years | 0 (0.0%) | 7 (6.2%) |
| 75 Years and over | 7 (10.1%) | 10 (20.0%) |
Disability Class: Ambulatory Difficulty
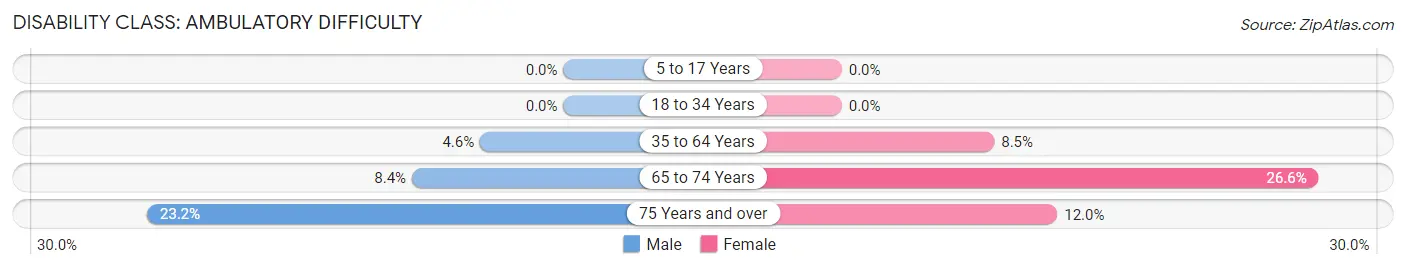
| Age Bracket | Male | Female |
| 5 to 17 Years | 0 (0.0%) | 0 (0.0%) |
| 18 to 34 Years | 0 (0.0%) | 0 (0.0%) |
| 35 to 64 Years | 23 (4.6%) | 41 (8.5%) |
| 65 to 74 Years | 7 (8.4%) | 30 (26.6%) |
| 75 Years and over | 16 (23.2%) | 6 (12.0%) |
Disability Class: Self-Care Difficulty
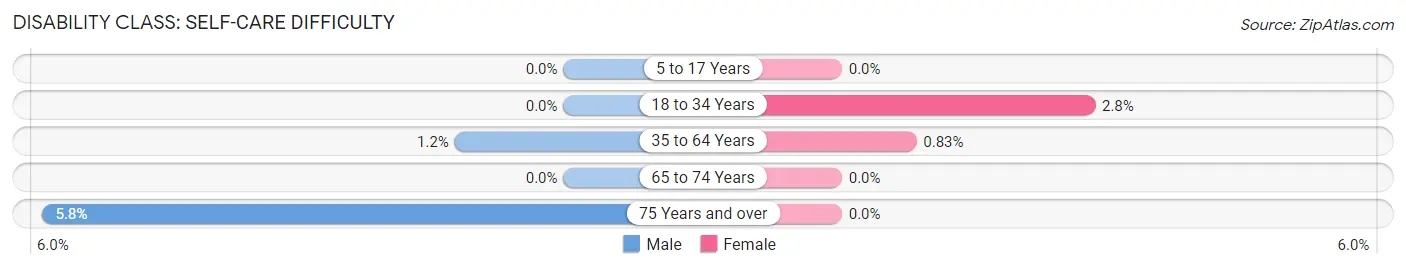
| Age Bracket | Male | Female |
| 5 to 17 Years | 0 (0.0%) | 0 (0.0%) |
| 18 to 34 Years | 0 (0.0%) | 6 (2.8%) |
| 35 to 64 Years | 6 (1.2%) | 4 (0.8%) |
| 65 to 74 Years | 0 (0.0%) | 0 (0.0%) |
| 75 Years and over | 4 (5.8%) | 0 (0.0%) |
Technology Access in Jean Lafitte
Computing Device Access in Jean Lafitte
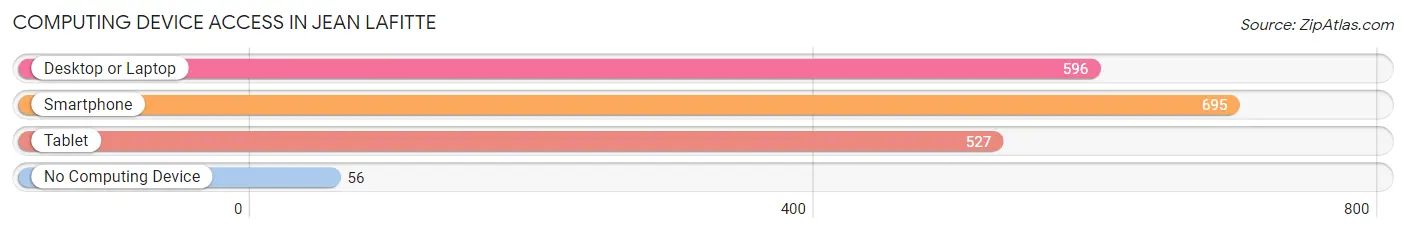
| Device Type | # Households | % Households |
| Desktop or Laptop | 596 | 75.2% |
| Smartphone | 695 | 87.7% |
| Tablet | 527 | 66.5% |
| No Computing Device | 56 | 7.1% |
| Total | 792 | 100.0% |
Internet Access in Jean Lafitte
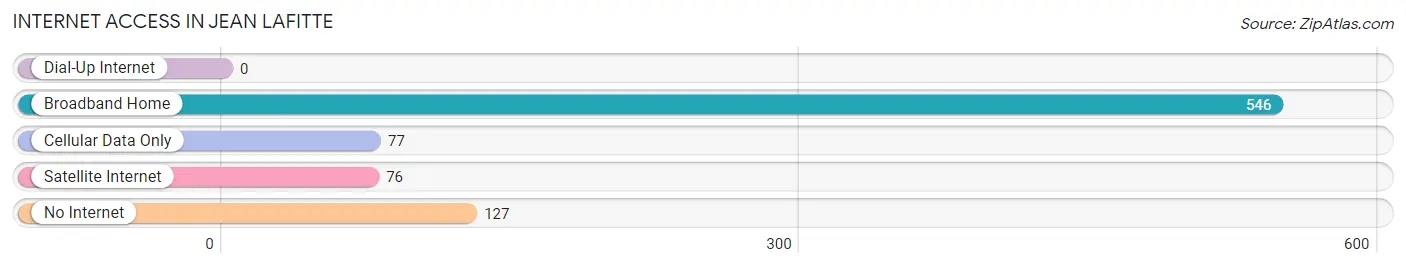
| Internet Type | # Households | % Households |
| Dial-Up Internet | 0 | 0.0% |
| Broadband Home | 546 | 68.9% |
| Cellular Data Only | 77 | 9.7% |
| Satellite Internet | 76 | 9.6% |
| No Internet | 127 | 16.0% |
| Total | 792 | 100.0% |
Jean Lafitte Summary
John Lafitte, Louisiana is a small town located in Jefferson Parish, Louisiana. It is situated on the Gulf of Mexico, just south of New Orleans. The town was named after the famous pirate Jean Lafitte, who was active in the area during the early 19th century. The town has a population of approximately 1,500 people and is known for its fishing and shrimping industry.
Geography
John Lafitte is located on the Gulf of Mexico, just south of New Orleans. The town is situated on a small peninsula, which is surrounded by the Barataria Bay and the Gulf of Mexico. The town is located in the southeastern part of Jefferson Parish, Louisiana. The town is bordered by the towns of Grand Isle, Barataria, and Lafitte. The town is located at an elevation of approximately 10 feet above sea level.
The town is located in a humid subtropical climate zone, with hot and humid summers and mild winters. The average annual temperature is around 70 degrees Fahrenheit. The average annual precipitation is around 60 inches.
Economy
John Lafitte is a small fishing and shrimping town. The town is home to several seafood processing plants, which process and package seafood for sale in the local area. The town is also home to several marinas, which provide services to local fishermen and shrimpers.
The town is also home to several small businesses, including restaurants, bars, and retail stores. The town is also home to several tourist attractions, including the Jean Lafitte National Historical Park and Preserve, which is a popular destination for visitors to the area.
Demographics
John Lafitte has a population of approximately 1,500 people. The town is predominantly white, with a small African American population. The median household income is around $35,000. The town has a high poverty rate, with approximately 25% of the population living below the poverty line.
The town is served by the Jefferson Parish Public School System. The town is home to several churches, including the First Baptist Church of John Lafitte.
Conclusion
John Lafitte, Louisiana is a small fishing and shrimping town located on the Gulf of Mexico, just south of New Orleans. The town has a population of approximately 1,500 people and is known for its seafood processing industry. The town is predominantly white, with a small African American population. The town is served by the Jefferson Parish Public School System and is home to several tourist attractions, including the Jean Lafitte National Historical Park and Preserve.
Common Questions
What is Per Capita Income in Jean Lafitte?
Per Capita income in Jean Lafitte is $29,732.
What is the Median Family Income in Jean Lafitte?
Median Family Income in Jean Lafitte is $70,000.
What is the Median Household income in Jean Lafitte?
Median Household Income in Jean Lafitte is $59,225.
What is Income or Wage Gap in Jean Lafitte?
Income or Wage Gap in Jean Lafitte is 1.5%.
Women in Jean Lafitte earn 98.5 cents for every dollar earned by a man.
What is Inequality or Gini Index in Jean Lafitte?
Inequality or Gini Index in Jean Lafitte is 0.44.
What is the Total Population of Jean Lafitte?
Total Population of Jean Lafitte is 2,517.
What is the Total Male Population of Jean Lafitte?
Total Male Population of Jean Lafitte is 1,376.
What is the Total Female Population of Jean Lafitte?
Total Female Population of Jean Lafitte is 1,141.
What is the Ratio of Males per 100 Females in Jean Lafitte?
There are 120.60 Males per 100 Females in Jean Lafitte.
What is the Ratio of Females per 100 Males in Jean Lafitte?
There are 82.92 Females per 100 Males in Jean Lafitte.
What is the Median Population Age in Jean Lafitte?
Median Population Age in Jean Lafitte is 35.9 Years.
What is the Average Family Size in Jean Lafitte
Average Family Size in Jean Lafitte is 3.6 People.
What is the Average Household Size in Jean Lafitte
Average Household Size in Jean Lafitte is 3.2 People.
How Large is the Labor Force in Jean Lafitte?
There are 1,109 People in the Labor Forcein in Jean Lafitte.
What is the Percentage of People in the Labor Force in Jean Lafitte?
59.5% of People are in the Labor Force in Jean Lafitte.
What is the Unemployment Rate in Jean Lafitte?
Unemployment Rate in Jean Lafitte is 17.9%.