Port Vincent, LA Map & Demographics
Port Vincent Map
Port Vincent Overview
$44,903
PER CAPITA INCOME
$61,250
AVG FAMILY INCOME
$65,269
AVG HOUSEHOLD INCOME
56.3%
WAGE / INCOME GAP [ % ]
43.7¢/ $1
WAGE / INCOME GAP [ $ ]
0.43
INEQUALITY / GINI INDEX
560
TOTAL POPULATION
321
MALE POPULATION
239
FEMALE POPULATION
134.31
MALES / 100 FEMALES
74.45
FEMALES / 100 MALES
47.5
MEDIAN AGE
2.6
AVG FAMILY SIZE
1.8
AVG HOUSEHOLD SIZE
335
LABOR FORCE [ PEOPLE ]
66.6%
PERCENT IN LABOR FORCE
0.6%
UNEMPLOYMENT RATE
Port Vincent Area Codes
Income in Port Vincent
Income Overview in Port Vincent
Per Capita Income in Port Vincent is $44,903, while median incomes of families and households are $61,250 and $65,269 respectively.
| Characteristic | Number | Measure |
| Per Capita Income | 560 | $44,903 |
| Median Family Income | 132 | $61,250 |
| Mean Family Income | 132 | $90,503 |
| Median Household Income | 308 | $65,269 |
| Mean Household Income | 308 | $75,958 |
| Income Deficit | 132 | $0 |
| Wage / Income Gap (%) | 560 | 56.29% |
| Wage / Income Gap ($) | 560 | 43.71¢ per $1 |
| Gini / Inequality Index | 560 | 0.43 |
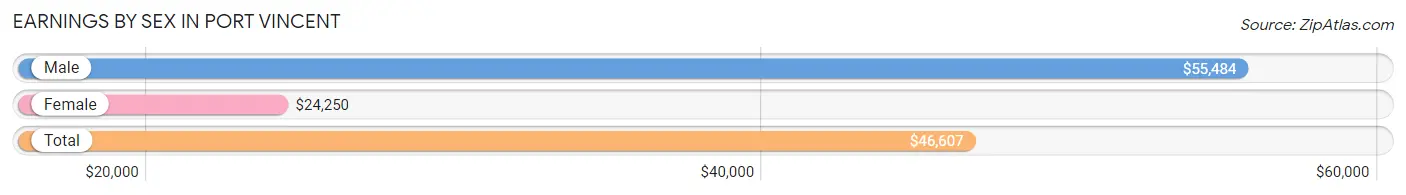
Earnings by Sex in Port Vincent
Average Earnings in Port Vincent are $46,607, $55,484 for men and $24,250 for women, a difference of 56.3%.
| Sex | Number | Average Earnings |
| Male | 242 (69.3%) | $55,484 |
| Female | 107 (30.7%) | $24,250 |
| Total | 349 (100.0%) | $46,607 |
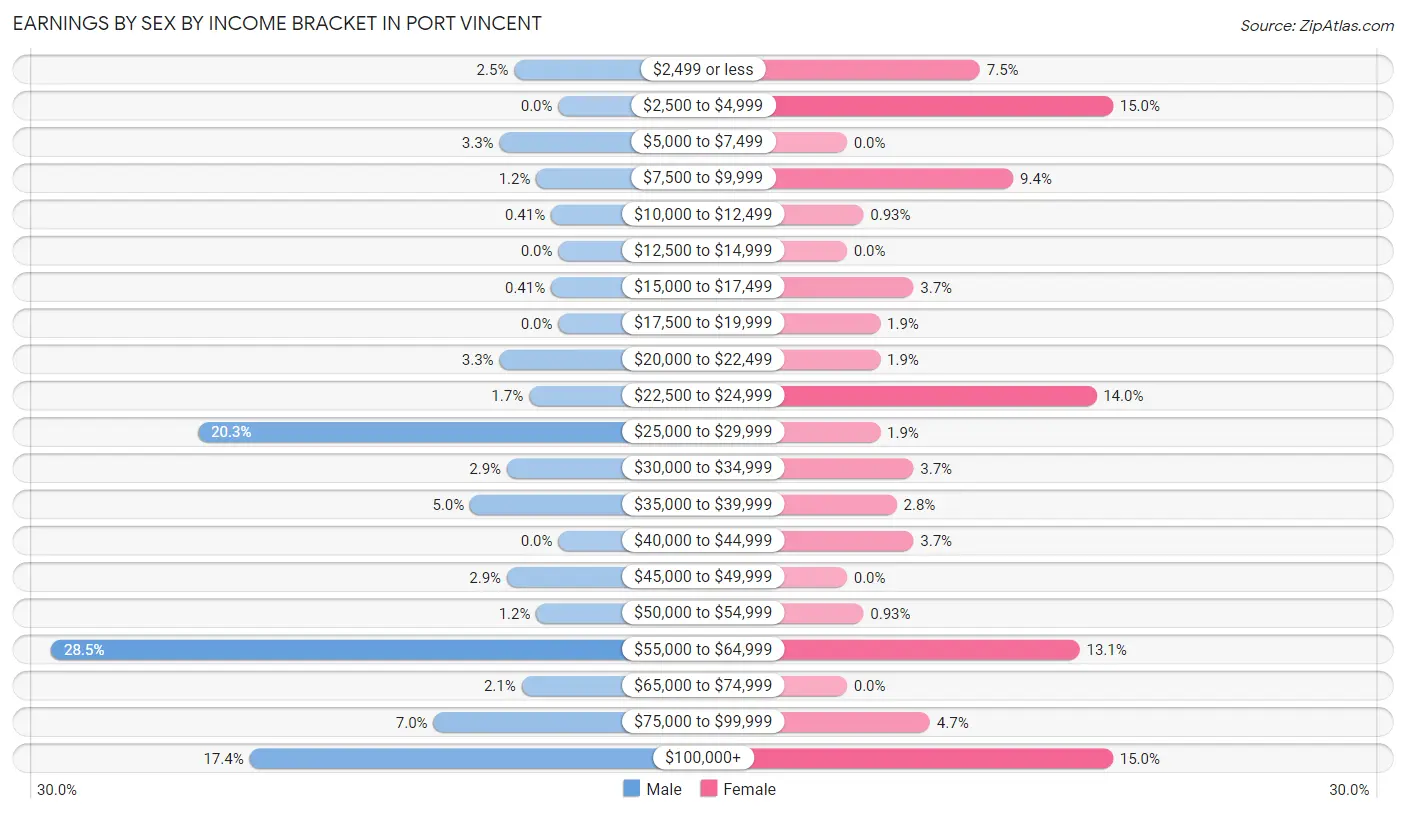
Earnings by Sex by Income Bracket in Port Vincent
The most common earnings brackets in Port Vincent are $55,000 to $64,999 for men (69 | 28.5%) and $2,500 to $4,999 for women (16 | 14.9%).
| Income | Male | Female |
| $2,499 or less | 6 (2.5%) | 8 (7.5%) |
| $2,500 to $4,999 | 0 (0.0%) | 16 (14.9%) |
| $5,000 to $7,499 | 8 (3.3%) | 0 (0.0%) |
| $7,500 to $9,999 | 3 (1.2%) | 10 (9.3%) |
| $10,000 to $12,499 | 1 (0.4%) | 1 (0.9%) |
| $12,500 to $14,999 | 0 (0.0%) | 0 (0.0%) |
| $15,000 to $17,499 | 1 (0.4%) | 4 (3.7%) |
| $17,500 to $19,999 | 0 (0.0%) | 2 (1.9%) |
| $20,000 to $22,499 | 8 (3.3%) | 2 (1.9%) |
| $22,500 to $24,999 | 4 (1.7%) | 15 (14.0%) |
| $25,000 to $29,999 | 49 (20.3%) | 2 (1.9%) |
| $30,000 to $34,999 | 7 (2.9%) | 4 (3.7%) |
| $35,000 to $39,999 | 12 (5.0%) | 3 (2.8%) |
| $40,000 to $44,999 | 0 (0.0%) | 4 (3.7%) |
| $45,000 to $49,999 | 7 (2.9%) | 0 (0.0%) |
| $50,000 to $54,999 | 3 (1.2%) | 1 (0.9%) |
| $55,000 to $64,999 | 69 (28.5%) | 14 (13.1%) |
| $65,000 to $74,999 | 5 (2.1%) | 0 (0.0%) |
| $75,000 to $99,999 | 17 (7.0%) | 5 (4.7%) |
| $100,000+ | 42 (17.4%) | 16 (14.9%) |
| Total | 242 (100.0%) | 107 (100.0%) |
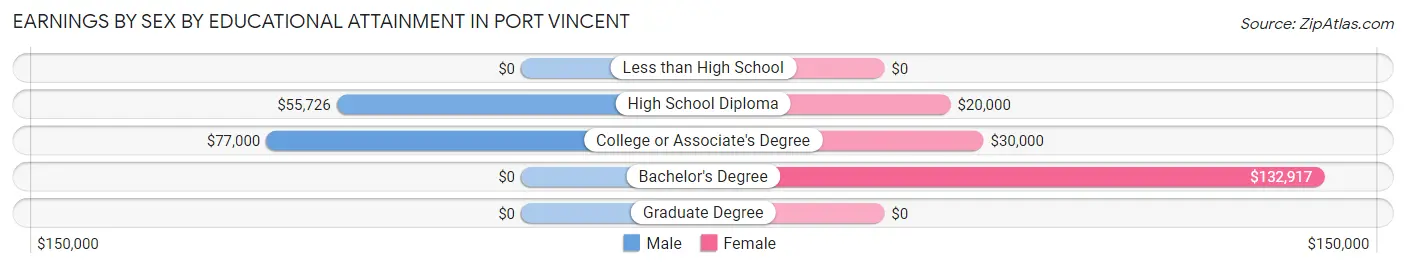
Earnings by Sex by Educational Attainment in Port Vincent
Average earnings in Port Vincent are $55,988 for men and $41,250 for women, a difference of 26.3%. Men with an educational attainment of college or associate's degree enjoy the highest average annual earnings of $77,000, while those with high school diploma education earn the least with $55,726. Women with an educational attainment of bachelor's degree earn the most with the average annual earnings of $132,917, while those with high school diploma education have the smallest earnings of $20,000.
| Educational Attainment | Male Income | Female Income |
| Less than High School | - | - |
| High School Diploma | $55,726 | $20,000 |
| College or Associate's Degree | $77,000 | $30,000 |
| Bachelor's Degree | - | - |
| Graduate Degree | - | - |
| Total | $55,988 | $41,250 |
Family Income in Port Vincent
Family Income Brackets in Port Vincent
According to the Port Vincent family income data, there are 26 families falling into the less than $10,000 income range, which is the most common income bracket and makes up 19.7% of all families.
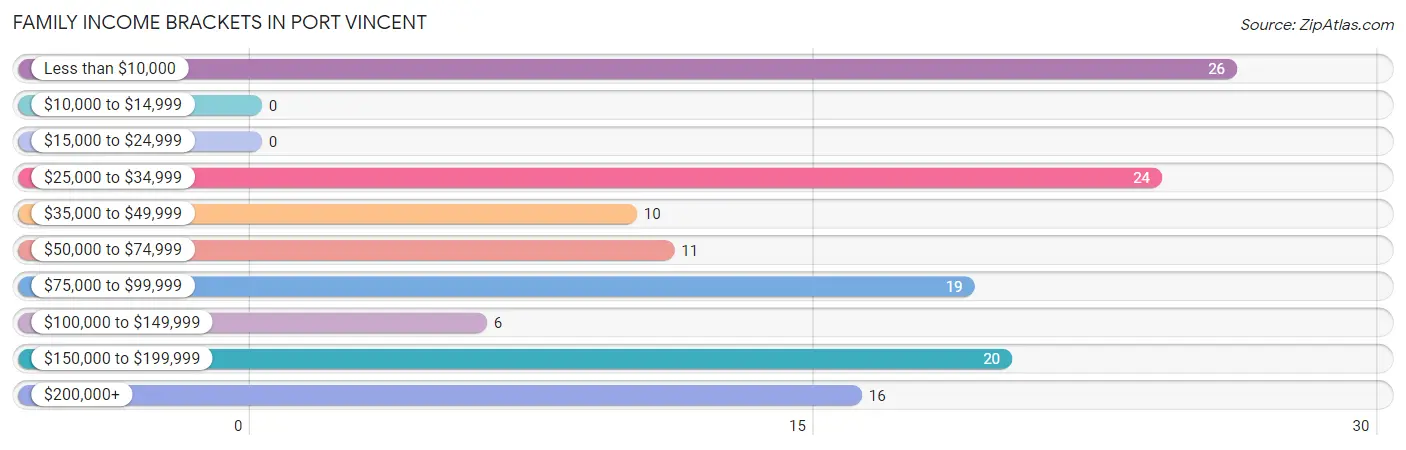
| Income Bracket | # Families | % Families |
| Less than $10,000 | 26 | 19.7% |
| $10,000 to $14,999 | 0 | 0.0% |
| $15,000 to $24,999 | 0 | 0.0% |
| $25,000 to $34,999 | 24 | 18.2% |
| $35,000 to $49,999 | 10 | 7.6% |
| $50,000 to $74,999 | 11 | 8.3% |
| $75,000 to $99,999 | 19 | 14.4% |
| $100,000 to $149,999 | 6 | 4.5% |
| $150,000 to $199,999 | 20 | 15.2% |
| $200,000+ | 16 | 12.1% |
Family Income by Famaliy Size in Port Vincent
2-person families (68 | 51.5%) account for the highest median family income in Port Vincent with $88,500 per family, while 2-person families (68 | 51.5%) have the highest median income of $44,250 per family member.
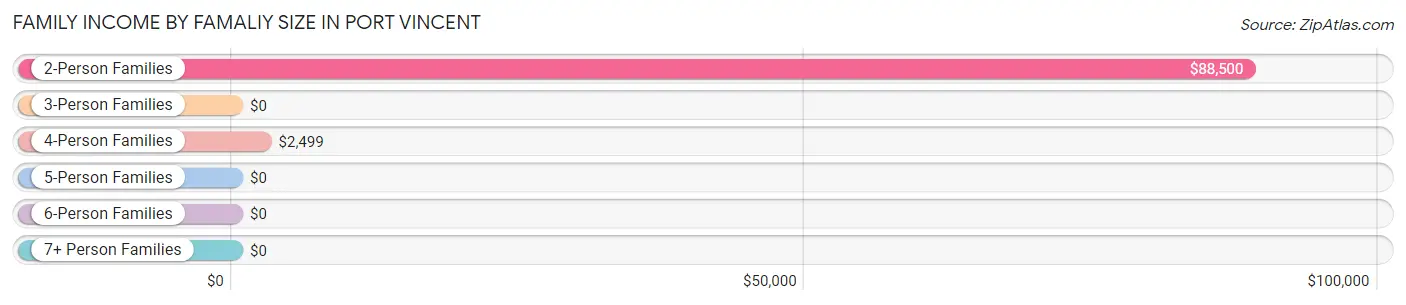
| Income Bracket | # Families | Median Income |
| 2-Person Families | 68 (51.5%) | $88,500 |
| 3-Person Families | 26 (19.7%) | $0 |
| 4-Person Families | 32 (24.2%) | $2,499 |
| 5-Person Families | 6 (4.5%) | $0 |
| 6-Person Families | 0 (0.0%) | $0 |
| 7+ Person Families | 0 (0.0%) | $0 |
| Total | 132 (100.0%) | $61,250 |
Family Income by Number of Earners in Port Vincent
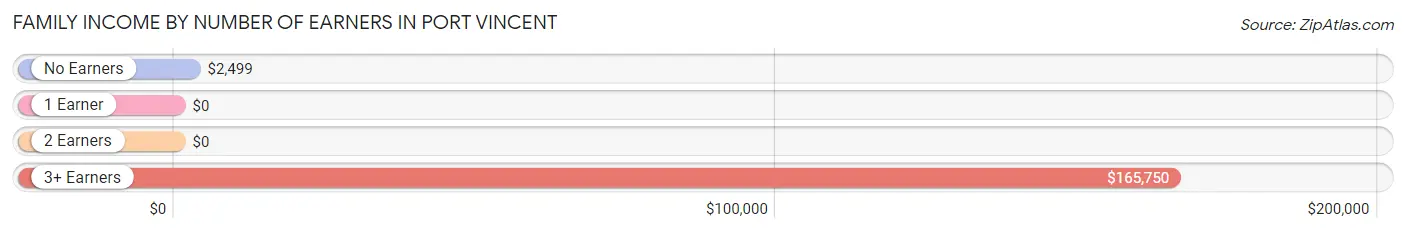
| Number of Earners | # Families | Median Income |
| No Earners | 49 (37.1%) | $2,499 |
| 1 Earner | 30 (22.7%) | $0 |
| 2 Earners | 36 (27.3%) | $0 |
| 3+ Earners | 17 (12.9%) | $165,750 |
| Total | 132 (100.0%) | $61,250 |
Household Income in Port Vincent
Household Income Brackets in Port Vincent
With 80 households falling in the category, the $25,000 to $34,999 income range is the most frequent in Port Vincent, accounting for 26.0% of all households. In contrast, only 3 households (1.0%) fall into the $10,000 to $14,999 income bracket, making it the least populous group.
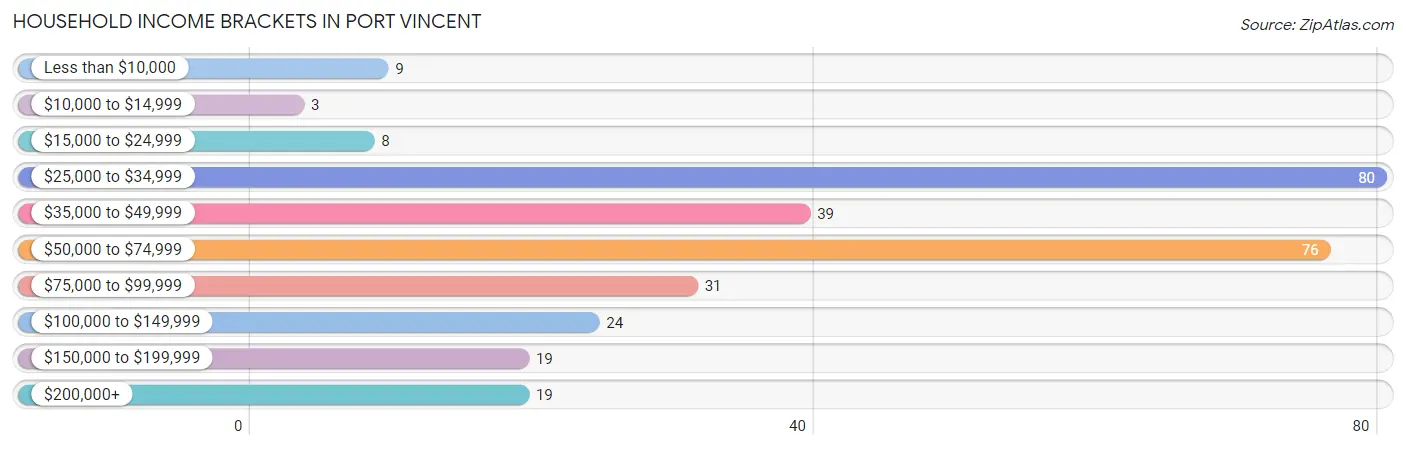
| Income Bracket | # Households | % Households |
| Less than $10,000 | 9 | 2.9% |
| $10,000 to $14,999 | 3 | 1.0% |
| $15,000 to $24,999 | 8 | 2.6% |
| $25,000 to $34,999 | 80 | 26.0% |
| $35,000 to $49,999 | 39 | 12.7% |
| $50,000 to $74,999 | 76 | 24.7% |
| $75,000 to $99,999 | 31 | 10.1% |
| $100,000 to $149,999 | 24 | 7.8% |
| $150,000 to $199,999 | 19 | 6.2% |
| $200,000+ | 19 | 6.2% |
Household Income by Householder Age in Port Vincent
The median household income in Port Vincent is $65,269, with the highest median household income of $66,169 found in the 45 to 64 years age bracket for the primary householder. A total of 196 households (63.6%) fall into this category. Meanwhile, the 25 to 44 years age bracket for the primary householder has the lowest median household income of $0, with 44 households (14.3%) in this group.
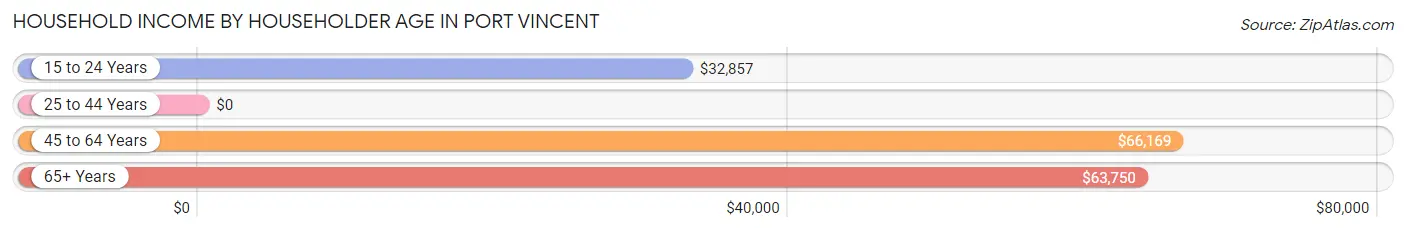
| Income Bracket | # Households | Median Income |
| 15 to 24 Years | 16 (5.2%) | $32,857 |
| 25 to 44 Years | 44 (14.3%) | $0 |
| 45 to 64 Years | 196 (63.6%) | $66,169 |
| 65+ Years | 52 (16.9%) | $63,750 |
| Total | 308 (100.0%) | $65,269 |
Poverty in Port Vincent
Income Below Poverty by Sex and Age in Port Vincent
With 5.3% poverty level for males and 25.9% for females among the residents of Port Vincent, under 5 year old males and 5 year old females are the most vulnerable to poverty, with 2 males (20.0%) and 2 females (100.0%) in their respective age groups living below the poverty level.
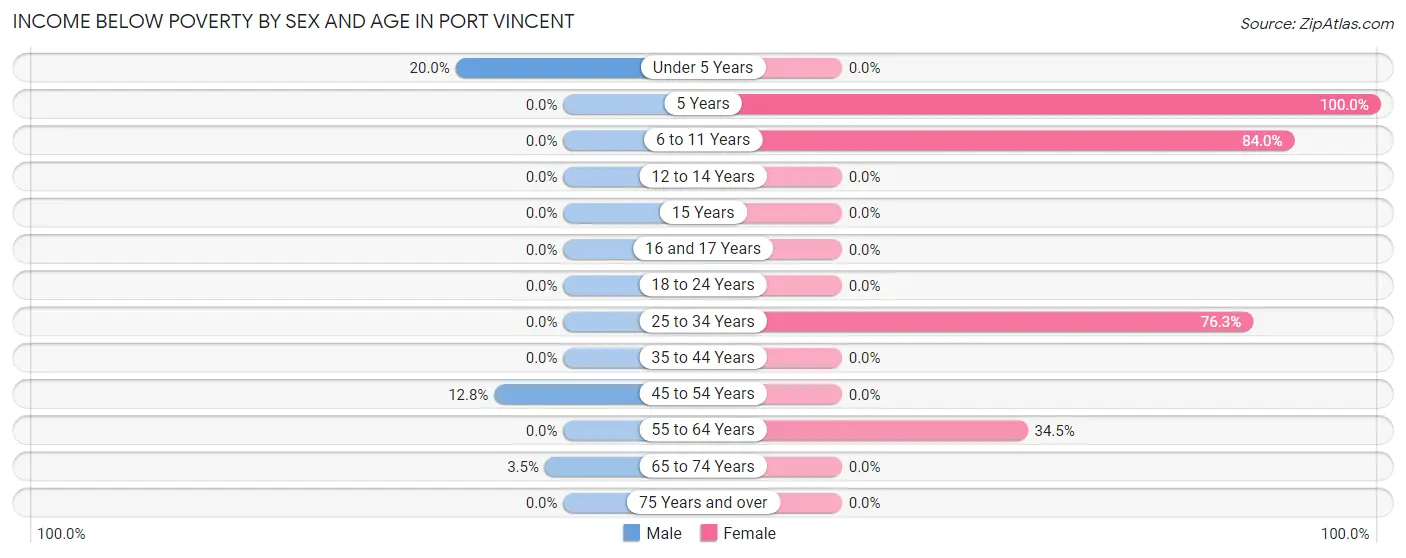
| Age Bracket | Male | Female |
| Under 5 Years | 2 (20.0%) | 0 (0.0%) |
| 5 Years | 0 (0.0%) | 2 (100.0%) |
| 6 to 11 Years | 0 (0.0%) | 21 (84.0%) |
| 12 to 14 Years | 0 (0.0%) | 0 (0.0%) |
| 15 Years | 0 (0.0%) | 0 (0.0%) |
| 16 and 17 Years | 0 (0.0%) | 0 (0.0%) |
| 18 to 24 Years | 0 (0.0%) | 0 (0.0%) |
| 25 to 34 Years | 0 (0.0%) | 29 (76.3%) |
| 35 to 44 Years | 0 (0.0%) | 0 (0.0%) |
| 45 to 54 Years | 14 (12.8%) | 0 (0.0%) |
| 55 to 64 Years | 0 (0.0%) | 10 (34.5%) |
| 65 to 74 Years | 1 (3.5%) | 0 (0.0%) |
| 75 Years and over | 0 (0.0%) | 0 (0.0%) |
| Total | 17 (5.3%) | 62 (25.9%) |
Income Above Poverty by Sex and Age in Port Vincent
According to the poverty statistics in Port Vincent, males aged 6 to 11 years and females aged under 5 years are the age groups that are most secure financially, with 100.0% of males and 100.0% of females in these age groups living above the poverty line.
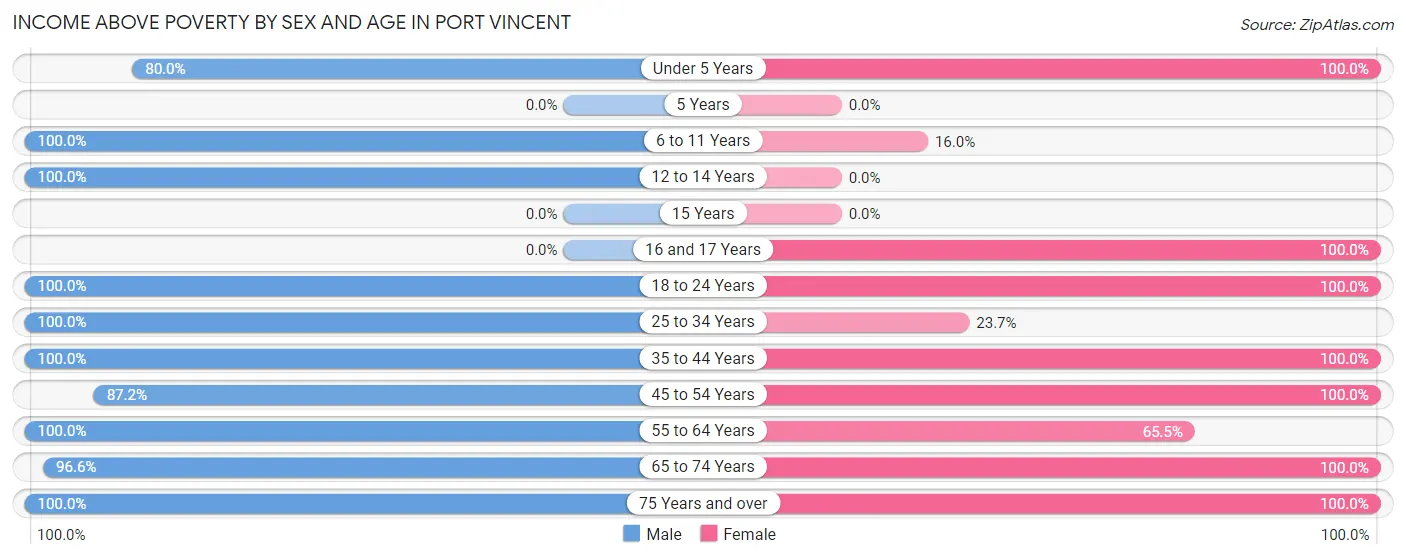
| Age Bracket | Male | Female |
| Under 5 Years | 8 (80.0%) | 10 (100.0%) |
| 5 Years | 0 (0.0%) | 0 (0.0%) |
| 6 to 11 Years | 7 (100.0%) | 4 (16.0%) |
| 12 to 14 Years | 3 (100.0%) | 0 (0.0%) |
| 15 Years | 0 (0.0%) | 0 (0.0%) |
| 16 and 17 Years | 0 (0.0%) | 10 (100.0%) |
| 18 to 24 Years | 25 (100.0%) | 42 (100.0%) |
| 25 to 34 Years | 30 (100.0%) | 9 (23.7%) |
| 35 to 44 Years | 3 (100.0%) | 23 (100.0%) |
| 45 to 54 Years | 95 (87.2%) | 26 (100.0%) |
| 55 to 64 Years | 90 (100.0%) | 19 (65.5%) |
| 65 to 74 Years | 28 (96.6%) | 17 (100.0%) |
| 75 Years and over | 15 (100.0%) | 17 (100.0%) |
| Total | 304 (94.7%) | 177 (74.1%) |
Income Below Poverty Among Married-Couple Families in Port Vincent
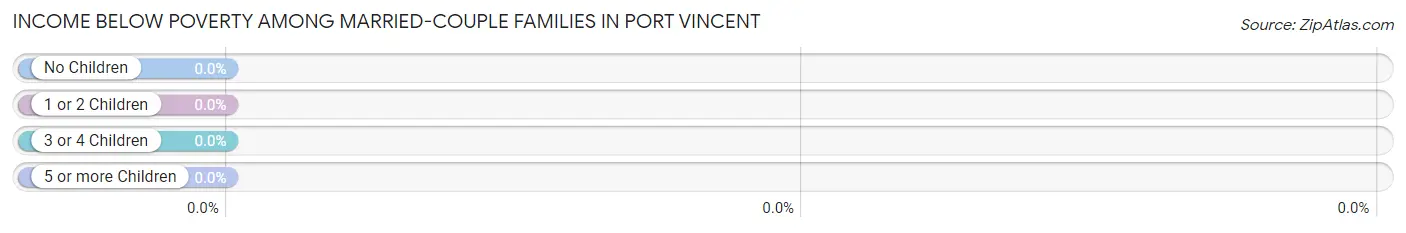
| Children | Above Poverty | Below Poverty |
| No Children | 66 (100.0%) | 0 (0.0%) |
| 1 or 2 Children | 11 (100.0%) | 0 (0.0%) |
| 3 or 4 Children | 3 (100.0%) | 0 (0.0%) |
| 5 or more Children | 0 (0.0%) | 0 (0.0%) |
| Total | 80 (100.0%) | 0 (0.0%) |
Income Below Poverty Among Single-Parent Households in Port Vincent
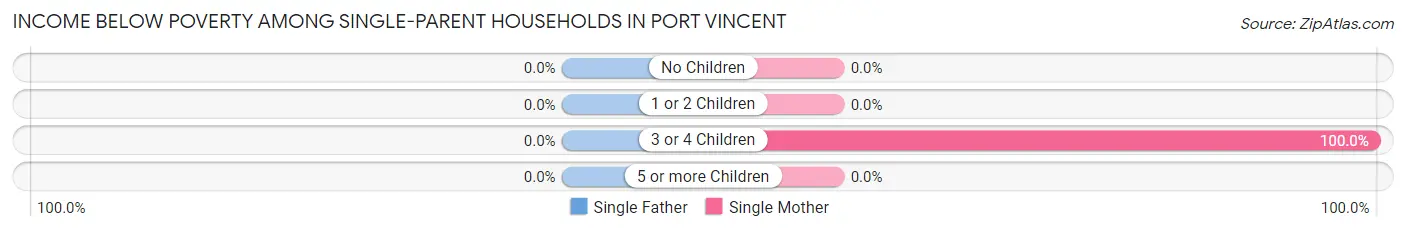
| Children | Single Father | Single Mother |
| No Children | 0 (0.0%) | 0 (0.0%) |
| 1 or 2 Children | 0 (0.0%) | 0 (0.0%) |
| 3 or 4 Children | 0 (0.0%) | 29 (100.0%) |
| 5 or more Children | 0 (0.0%) | 0 (0.0%) |
| Total | 0 (0.0%) | 29 (82.9%) |
Income Below Poverty Among Married-Couple vs Single-Parent Households in Port Vincent
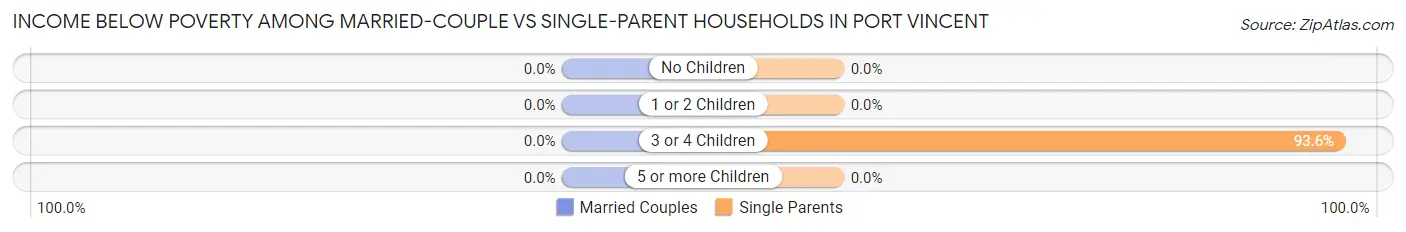
| Children | Married-Couple Families | Single-Parent Households |
| No Children | 0 (0.0%) | 0 (0.0%) |
| 1 or 2 Children | 0 (0.0%) | 0 (0.0%) |
| 3 or 4 Children | 0 (0.0%) | 29 (93.5%) |
| 5 or more Children | 0 (0.0%) | 0 (0.0%) |
| Total | 0 (0.0%) | 29 (55.8%) |
Race in Port Vincent
The most populous races in Port Vincent are White / Caucasian (536 | 95.7%), Two or more Races (22 | 3.9%), and Hispanic or Latino (6 | 1.1%).
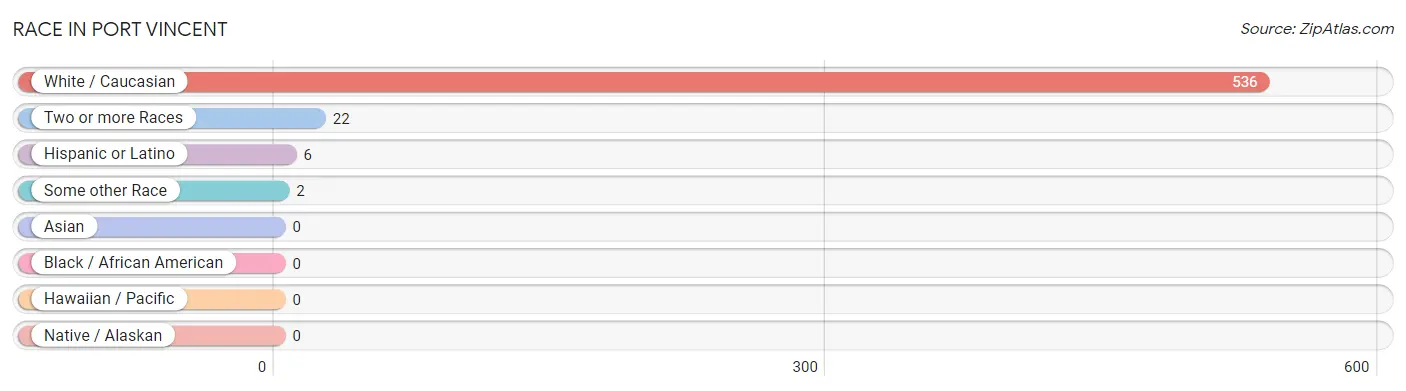
| Race | # Population | % Population |
| Asian | 0 | 0.0% |
| Black / African American | 0 | 0.0% |
| Hawaiian / Pacific | 0 | 0.0% |
| Hispanic or Latino | 6 | 1.1% |
| Native / Alaskan | 0 | 0.0% |
| White / Caucasian | 536 | 95.7% |
| Two or more Races | 22 | 3.9% |
| Some other Race | 2 | 0.4% |
| Total | 560 | 100.0% |
Ancestry in Port Vincent
The most populous ancestries reported in Port Vincent are French (174 | 31.1%), German (74 | 13.2%), Irish (57 | 10.2%), English (45 | 8.0%), and American (29 | 5.2%), together accounting for 67.7% of all Port Vincent residents.
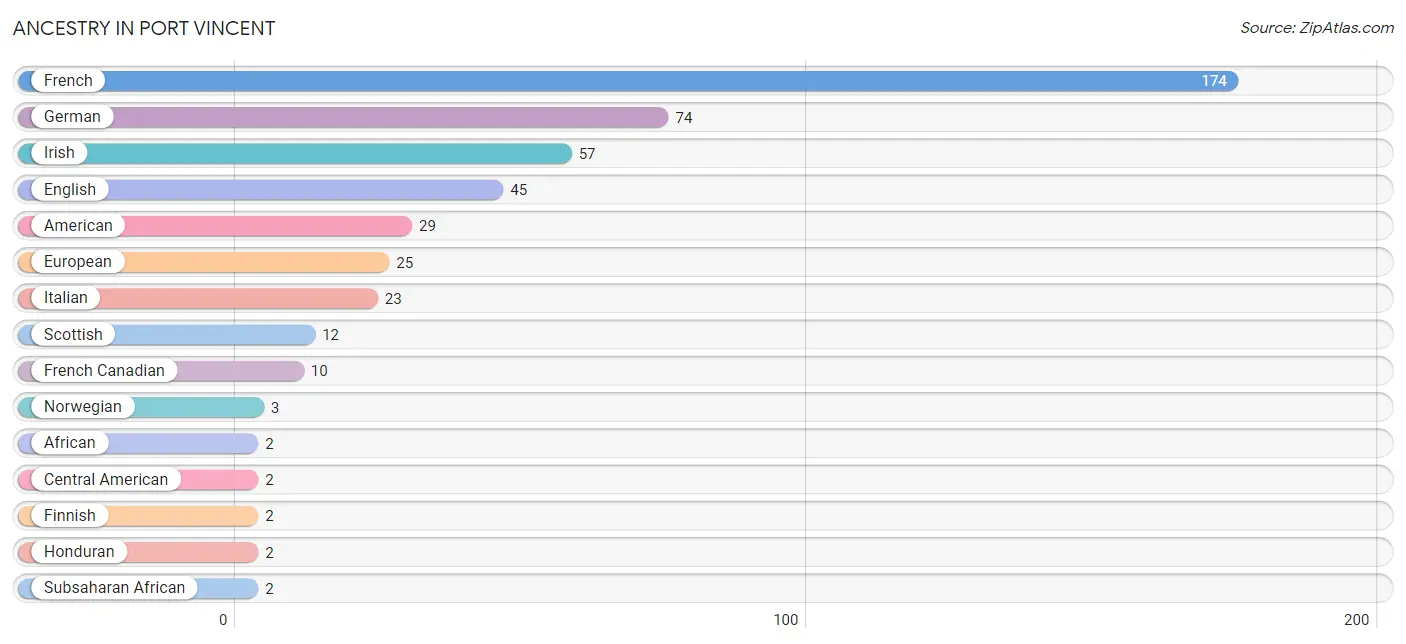
| Ancestry | # Population | % Population |
| African | 2 | 0.4% |
| American | 29 | 5.2% |
| British | 1 | 0.2% |
| Central American | 2 | 0.4% |
| English | 45 | 8.0% |
| European | 25 | 4.5% |
| Finnish | 2 | 0.4% |
| French | 174 | 31.1% |
| French Canadian | 10 | 1.8% |
| German | 74 | 13.2% |
| Honduran | 2 | 0.4% |
| Irish | 57 | 10.2% |
| Italian | 23 | 4.1% |
| Mexican | 1 | 0.2% |
| Norwegian | 3 | 0.5% |
| Scotch-Irish | 1 | 0.2% |
| Scottish | 12 | 2.1% |
| Subsaharan African | 2 | 0.4% | View All 18 Rows |
Immigrants in Port Vincent
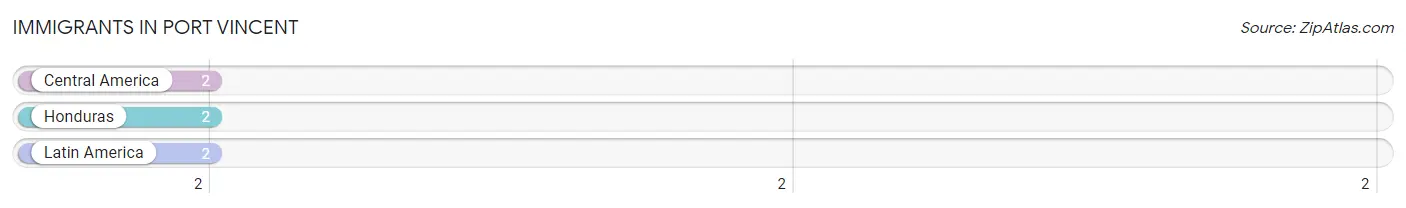
The most numerous immigrant groups reported in Port Vincent came from Central America (2 | 0.4%), Honduras (2 | 0.4%), and Latin America (2 | 0.4%), together accounting for 1.1% of all Port Vincent residents.
| Immigration Origin | # Population | % Population |
| Central America | 2 | 0.4% |
| Honduras | 2 | 0.4% |
| Latin America | 2 | 0.4% | View All 3 Rows |
Sex and Age in Port Vincent
Sex and Age in Port Vincent
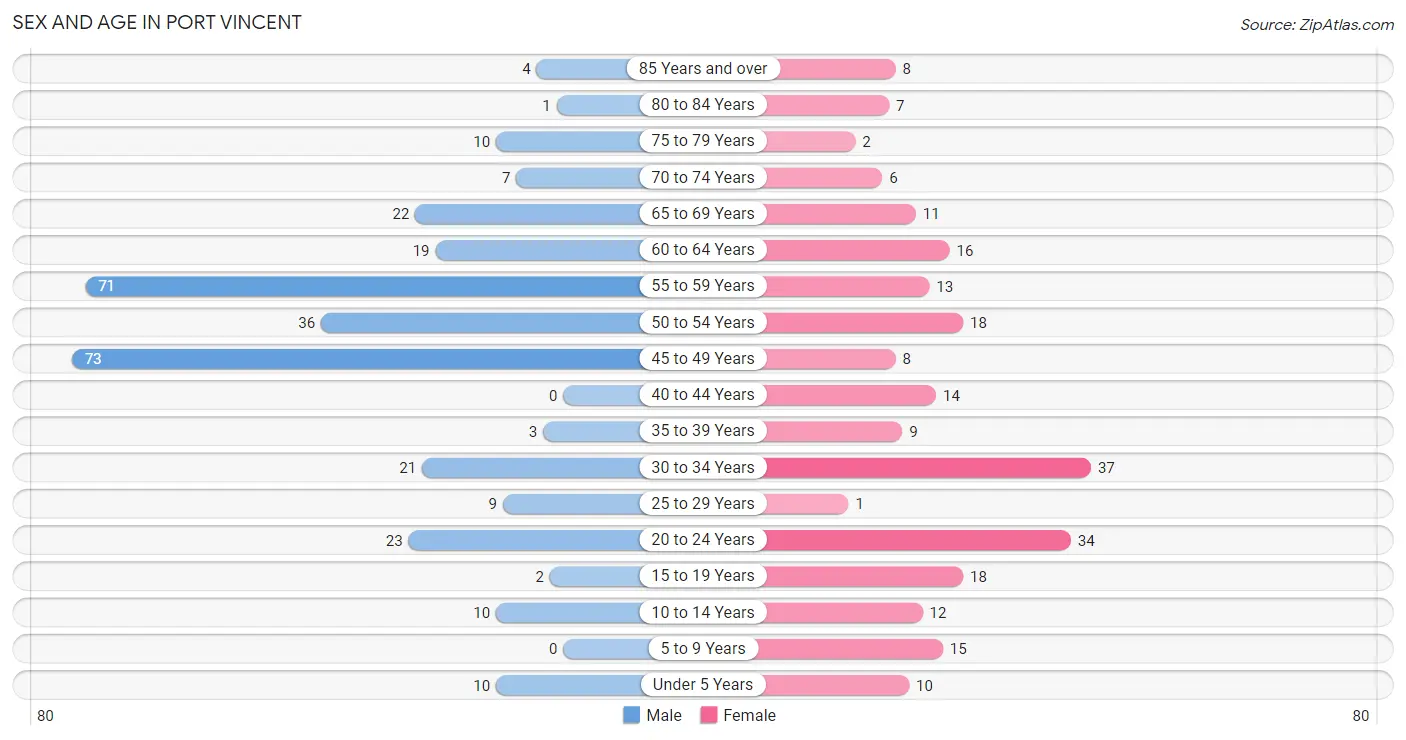
The most populous age groups in Port Vincent are 45 to 49 Years (73 | 22.7%) for men and 30 to 34 Years (37 | 15.5%) for women.
| Age Bracket | Male | Female |
| Under 5 Years | 10 (3.1%) | 10 (4.2%) |
| 5 to 9 Years | 0 (0.0%) | 15 (6.3%) |
| 10 to 14 Years | 10 (3.1%) | 12 (5.0%) |
| 15 to 19 Years | 2 (0.6%) | 18 (7.5%) |
| 20 to 24 Years | 23 (7.2%) | 34 (14.2%) |
| 25 to 29 Years | 9 (2.8%) | 1 (0.4%) |
| 30 to 34 Years | 21 (6.5%) | 37 (15.5%) |
| 35 to 39 Years | 3 (0.9%) | 9 (3.8%) |
| 40 to 44 Years | 0 (0.0%) | 14 (5.9%) |
| 45 to 49 Years | 73 (22.7%) | 8 (3.4%) |
| 50 to 54 Years | 36 (11.2%) | 18 (7.5%) |
| 55 to 59 Years | 71 (22.1%) | 13 (5.4%) |
| 60 to 64 Years | 19 (5.9%) | 16 (6.7%) |
| 65 to 69 Years | 22 (6.9%) | 11 (4.6%) |
| 70 to 74 Years | 7 (2.2%) | 6 (2.5%) |
| 75 to 79 Years | 10 (3.1%) | 2 (0.8%) |
| 80 to 84 Years | 1 (0.3%) | 7 (2.9%) |
| 85 Years and over | 4 (1.3%) | 8 (3.4%) |
| Total | 321 (100.0%) | 239 (100.0%) |
Families and Households in Port Vincent
Median Family Size in Port Vincent
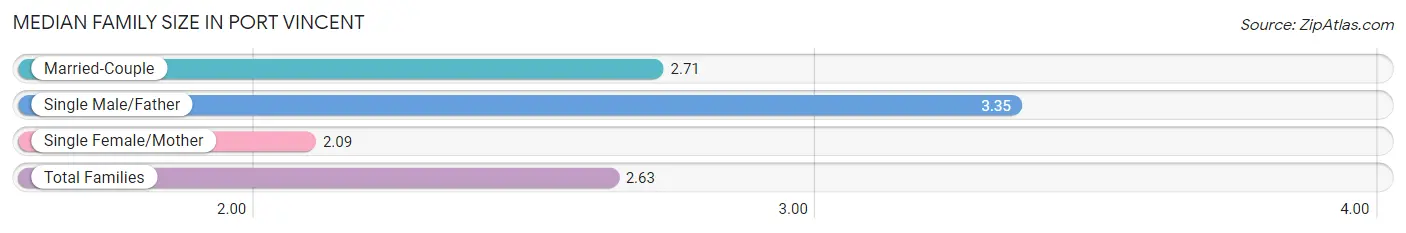
The median family size in Port Vincent is 2.63 persons per family, with single male/father families (17 | 12.9%) accounting for the largest median family size of 3.35 persons per family. On the other hand, single female/mother families (35 | 26.5%) represent the smallest median family size with 2.09 persons per family.
| Family Type | # Families | Family Size |
| Married-Couple | 80 (60.6%) | 2.71 |
| Single Male/Father | 17 (12.9%) | 3.35 |
| Single Female/Mother | 35 (26.5%) | 2.09 |
| Total Families | 132 (100.0%) | 2.63 |
Median Household Size in Port Vincent
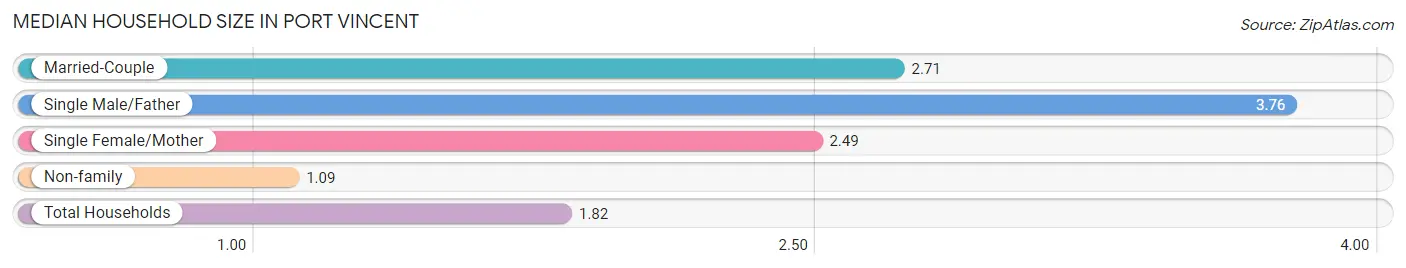
The median household size in Port Vincent is 1.82 persons per household, with single male/father households (17 | 5.5%) accounting for the largest median household size of 3.76 persons per household. non-family households (176 | 57.1%) represent the smallest median household size with 1.09 persons per household.
| Household Type | # Households | Household Size |
| Married-Couple | 80 (26.0%) | 2.71 |
| Single Male/Father | 17 (5.5%) | 3.76 |
| Single Female/Mother | 35 (11.4%) | 2.49 |
| Non-family | 176 (57.1%) | 1.09 |
| Total Households | 308 (100.0%) | 1.82 |
Household Size by Marriage Status in Port Vincent
Out of a total of 308 households in Port Vincent, 132 (42.9%) are family households, while 176 (57.1%) are nonfamily households. The most numerous type of family households are 2-person households, comprising 63, and the most common type of nonfamily households are 1-person households, comprising 165.
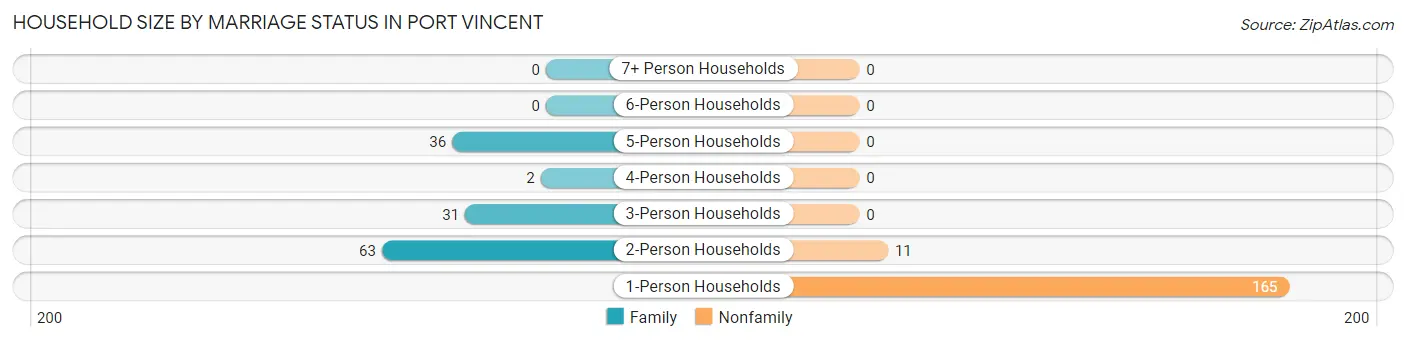
| Household Size | Family Households | Nonfamily Households |
| 1-Person Households | - | 165 (53.6%) |
| 2-Person Households | 63 (20.4%) | 11 (3.6%) |
| 3-Person Households | 31 (10.1%) | 0 (0.0%) |
| 4-Person Households | 2 (0.6%) | 0 (0.0%) |
| 5-Person Households | 36 (11.7%) | 0 (0.0%) |
| 6-Person Households | 0 (0.0%) | 0 (0.0%) |
| 7+ Person Households | 0 (0.0%) | 0 (0.0%) |
| Total | 132 (42.9%) | 176 (57.1%) |
Female Fertility in Port Vincent
Fertility by Age in Port Vincent
Average fertility rate in Port Vincent is 29.0 births per 1,000 women. Women in the age bracket of 20 to 34 years have the highest fertility rate with 56.0 births per 1,000 women. Women in the age bracket of 20 to 34 years acount for 100.0% of all women with births.
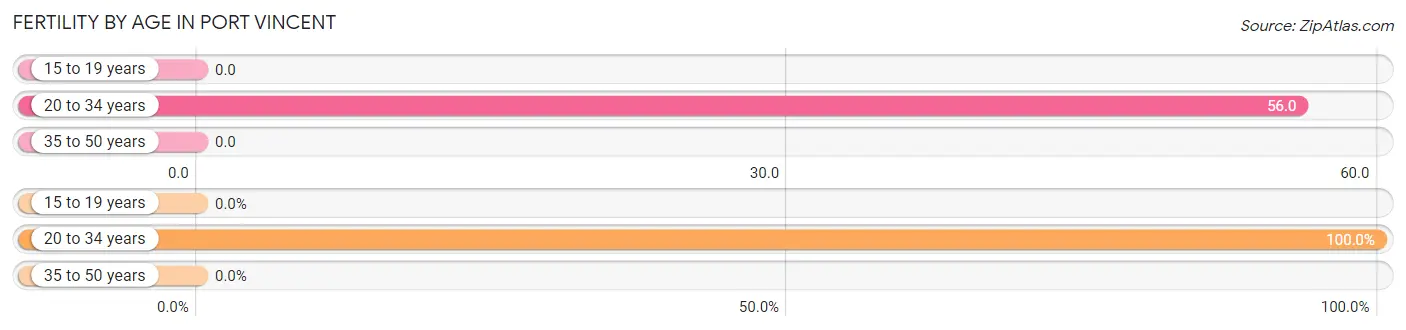
| Age Bracket | Women with Births | Births / 1,000 Women |
| 15 to 19 years | 0 (0.0%) | 0.0 |
| 20 to 34 years | 4 (100.0%) | 56.0 |
| 35 to 50 years | 0 (0.0%) | 0.0 |
| Total | 4 (100.0%) | 29.0 |
Fertility by Age by Marriage Status in Port Vincent
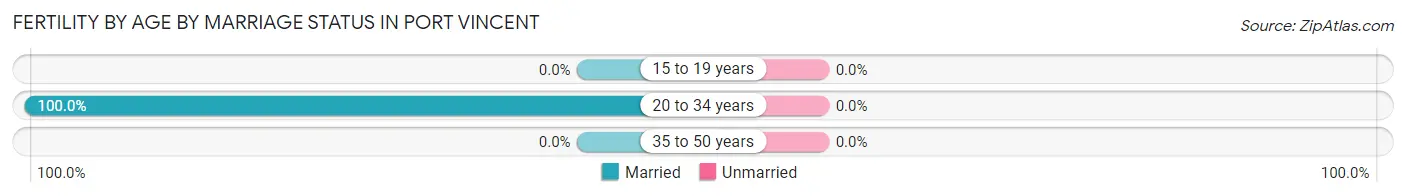
| Age Bracket | Married | Unmarried |
| 15 to 19 years | 0 (0.0%) | 0 (0.0%) |
| 20 to 34 years | 4 (100.0%) | 0 (0.0%) |
| 35 to 50 years | 0 (0.0%) | 0 (0.0%) |
| Total | 4 (100.0%) | 0 (0.0%) |
Fertility by Education in Port Vincent
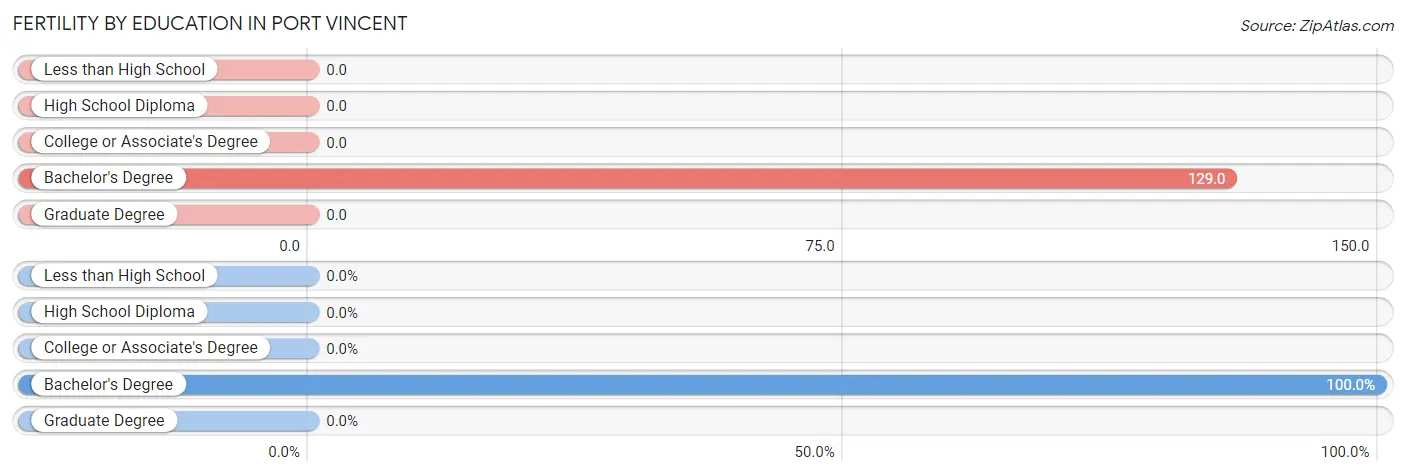
| Educational Attainment | Women with Births | Births / 1,000 Women |
| Less than High School | 0 (0.0%) | 0.0 |
| High School Diploma | 0 (0.0%) | 0.0 |
| College or Associate's Degree | 0 (0.0%) | 0.0 |
| Bachelor's Degree | 4 (100.0%) | 129.0 |
| Graduate Degree | 0 (0.0%) | 0.0 |
| Total | 4 (100.0%) | 29.0 |
Fertility by Education by Marriage Status in Port Vincent
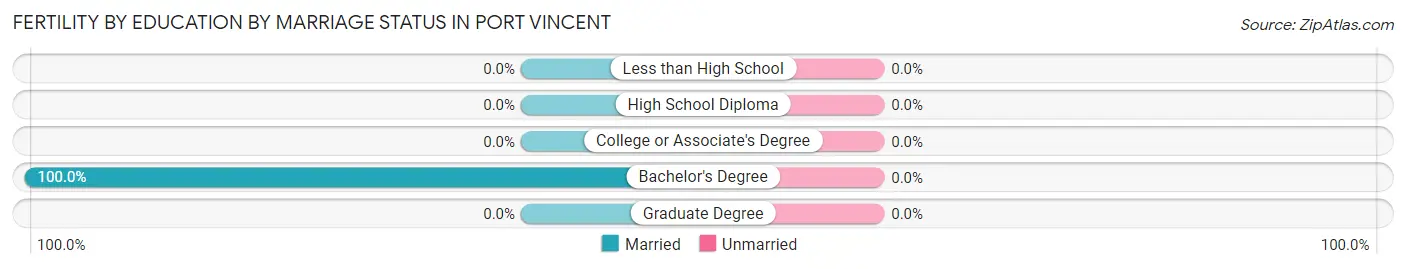
| Educational Attainment | Married | Unmarried |
| Less than High School | 0 (0.0%) | 0 (0.0%) |
| High School Diploma | 0 (0.0%) | 0 (0.0%) |
| College or Associate's Degree | 0 (0.0%) | 0 (0.0%) |
| Bachelor's Degree | 4 (100.0%) | 0 (0.0%) |
| Graduate Degree | 0 (0.0%) | 0 (0.0%) |
| Total | 4 (100.0%) | 0 (0.0%) |
Employment Characteristics in Port Vincent
Employment by Class of Employer in Port Vincent
Among the 333 employed individuals in Port Vincent, private company employees (208 | 62.5%), self-employed (not incorporated) (72 | 21.6%), and local government employees (20 | 6.0%) make up the most common classes of employment.
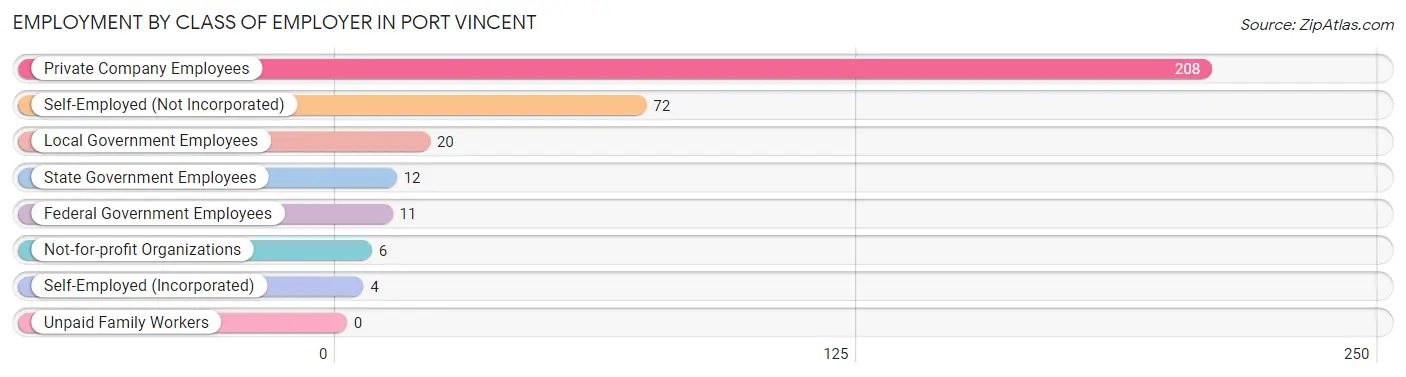
| Employer Class | # Employees | % Employees |
| Private Company Employees | 208 | 62.5% |
| Self-Employed (Incorporated) | 4 | 1.2% |
| Self-Employed (Not Incorporated) | 72 | 21.6% |
| Not-for-profit Organizations | 6 | 1.8% |
| Local Government Employees | 20 | 6.0% |
| State Government Employees | 12 | 3.6% |
| Federal Government Employees | 11 | 3.3% |
| Unpaid Family Workers | 0 | 0.0% |
| Total | 333 | 100.0% |
Employment Status by Age in Port Vincent
According to the labor force statistics for Port Vincent, out of the total population over 16 years of age (503), 66.6% or 335 individuals are in the labor force, with 0.6% or 2 of them unemployed. The age group with the highest labor force participation rate is 25 to 29 years, with 100.0% or 10 individuals in the labor force. Within the labor force, the 45 to 54 years age range has the highest percentage of unemployed individuals, with 1.8% or 2 of them being unemployed.
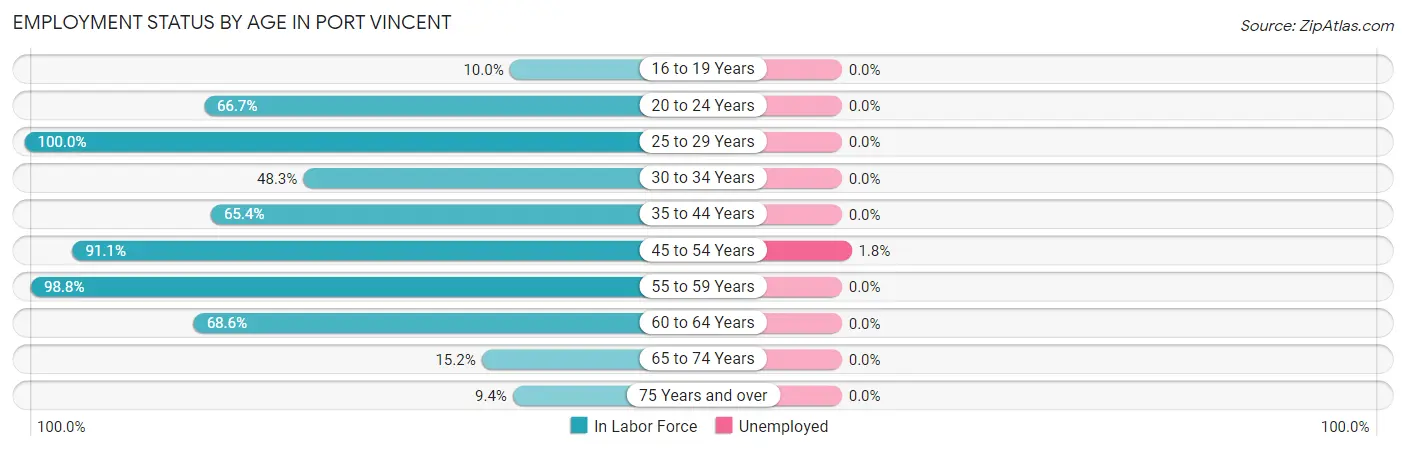
| Age Bracket | In Labor Force | Unemployed |
| 16 to 19 Years | 2 (10.0%) | 0 (0.0%) |
| 20 to 24 Years | 38 (66.7%) | 0 (0.0%) |
| 25 to 29 Years | 10 (100.0%) | 0 (0.0%) |
| 30 to 34 Years | 28 (48.3%) | 0 (0.0%) |
| 35 to 44 Years | 17 (65.4%) | 0 (0.0%) |
| 45 to 54 Years | 123 (91.1%) | 2 (1.8%) |
| 55 to 59 Years | 83 (98.8%) | 0 (0.0%) |
| 60 to 64 Years | 24 (68.6%) | 0 (0.0%) |
| 65 to 74 Years | 7 (15.2%) | 0 (0.0%) |
| 75 Years and over | 3 (9.4%) | 0 (0.0%) |
| Total | 335 (66.6%) | 2 (0.6%) |
Employment Status by Educational Attainment in Port Vincent
According to labor force statistics for Port Vincent, 81.9% of individuals (285) out of the total population between 25 and 64 years of age (348) are in the labor force, with 0.7% or 2 of them being unemployed. The group with the highest labor force participation rate are those with the educational attainment of high school diploma, with 95.4% or 185 individuals in the labor force. Within the labor force, individuals with high school diploma education have the highest percentage of unemployment, with 1.1% or 2 of them being unemployed.
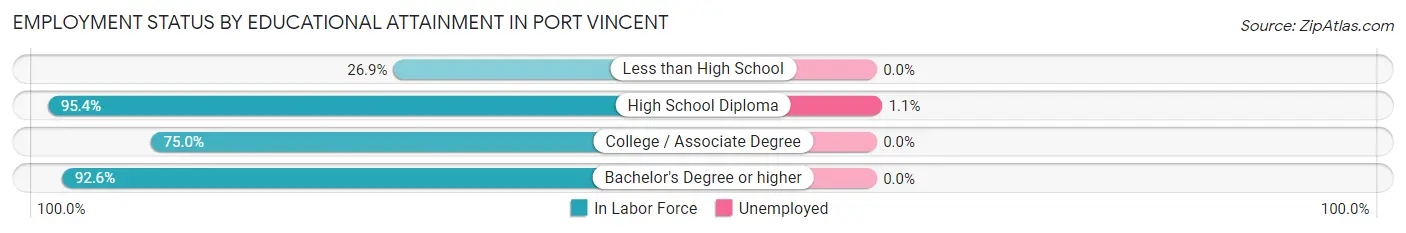
| Educational Attainment | In Labor Force | Unemployed |
| Less than High School | 14 (26.9%) | 0 (0.0%) |
| High School Diploma | 185 (95.4%) | 2 (1.1%) |
| College / Associate Degree | 36 (75.0%) | 0 (0.0%) |
| Bachelor's Degree or higher | 50 (92.6%) | 0 (0.0%) |
| Total | 285 (81.9%) | 2 (0.7%) |
Employment Occupations by Sex in Port Vincent
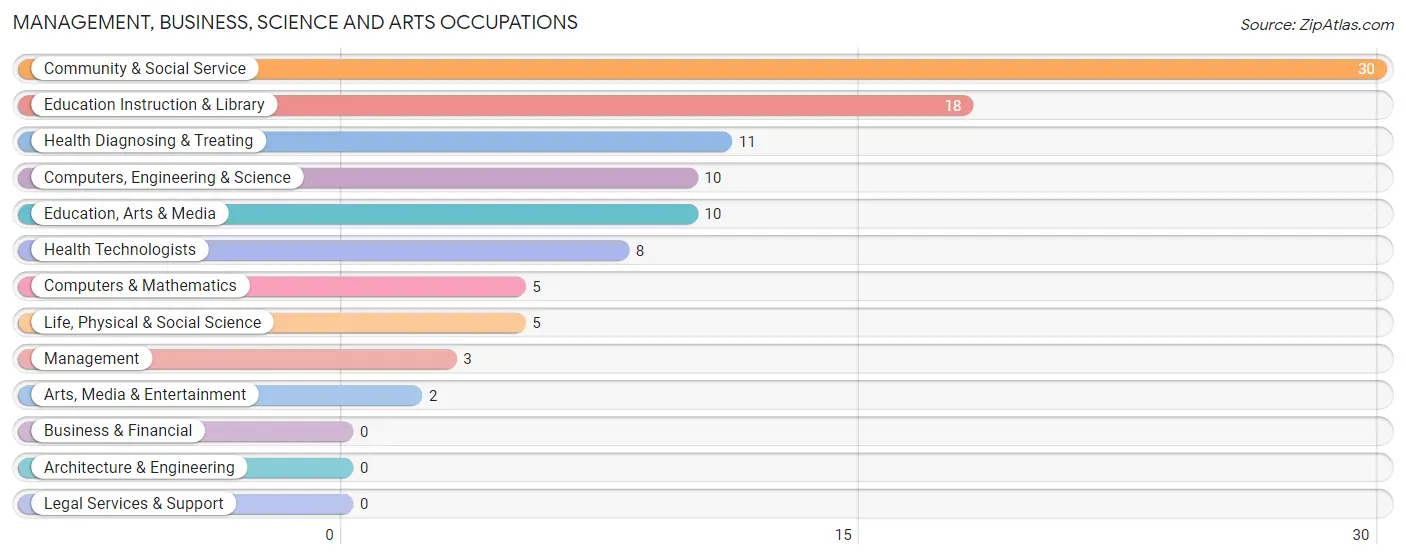
Management, Business, Science and Arts Occupations
The most common Management, Business, Science and Arts occupations in Port Vincent are Community & Social Service (30 | 9.3%), Education Instruction & Library (18 | 5.6%), Health Diagnosing & Treating (11 | 3.4%), Computers, Engineering & Science (10 | 3.1%), and Education, Arts & Media (10 | 3.1%).
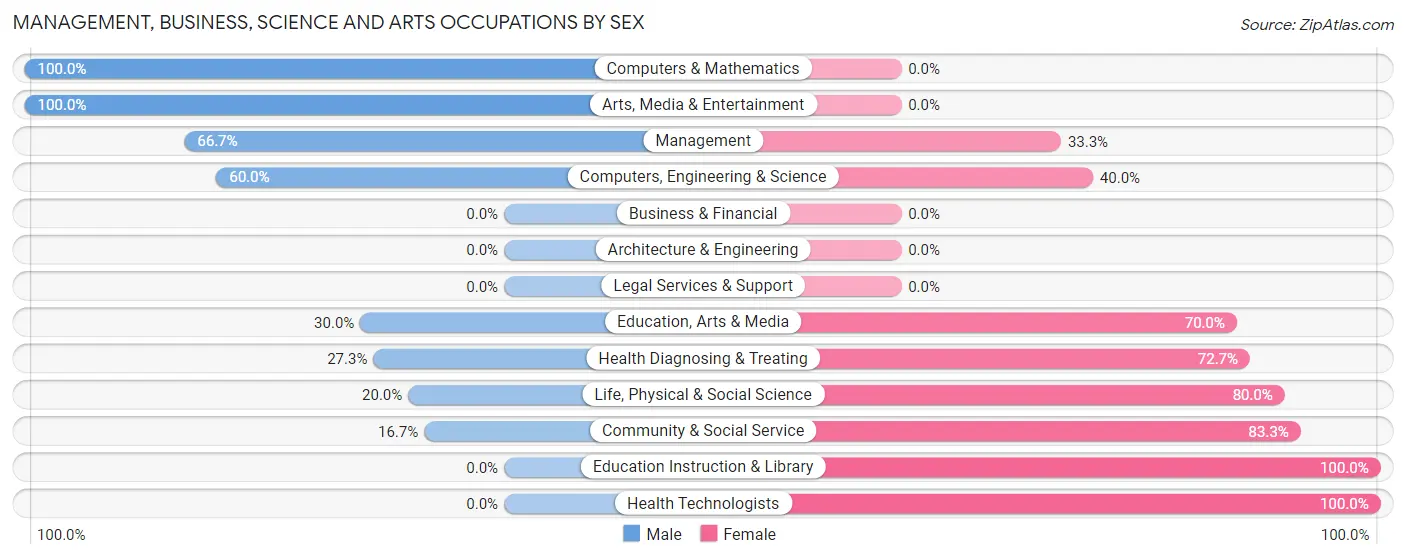
Management, Business, Science and Arts Occupations by Sex
Within the Management, Business, Science and Arts occupations in Port Vincent, the most male-oriented occupations are Computers & Mathematics (100.0%), Arts, Media & Entertainment (100.0%), and Management (66.7%), while the most female-oriented occupations are Education Instruction & Library (100.0%), Health Technologists (100.0%), and Community & Social Service (83.3%).
| Occupation | Male | Female |
| Management | 2 (66.7%) | 1 (33.3%) |
| Business & Financial | 0 (0.0%) | 0 (0.0%) |
| Computers, Engineering & Science | 6 (60.0%) | 4 (40.0%) |
| Computers & Mathematics | 5 (100.0%) | 0 (0.0%) |
| Architecture & Engineering | 0 (0.0%) | 0 (0.0%) |
| Life, Physical & Social Science | 1 (20.0%) | 4 (80.0%) |
| Community & Social Service | 5 (16.7%) | 25 (83.3%) |
| Education, Arts & Media | 3 (30.0%) | 7 (70.0%) |
| Legal Services & Support | 0 (0.0%) | 0 (0.0%) |
| Education Instruction & Library | 0 (0.0%) | 18 (100.0%) |
| Arts, Media & Entertainment | 2 (100.0%) | 0 (0.0%) |
| Health Diagnosing & Treating | 3 (27.3%) | 8 (72.7%) |
| Health Technologists | 0 (0.0%) | 8 (100.0%) |
| Total (Category) | 16 (29.6%) | 38 (70.4%) |
| Total (Overall) | 225 (69.7%) | 98 (30.3%) |
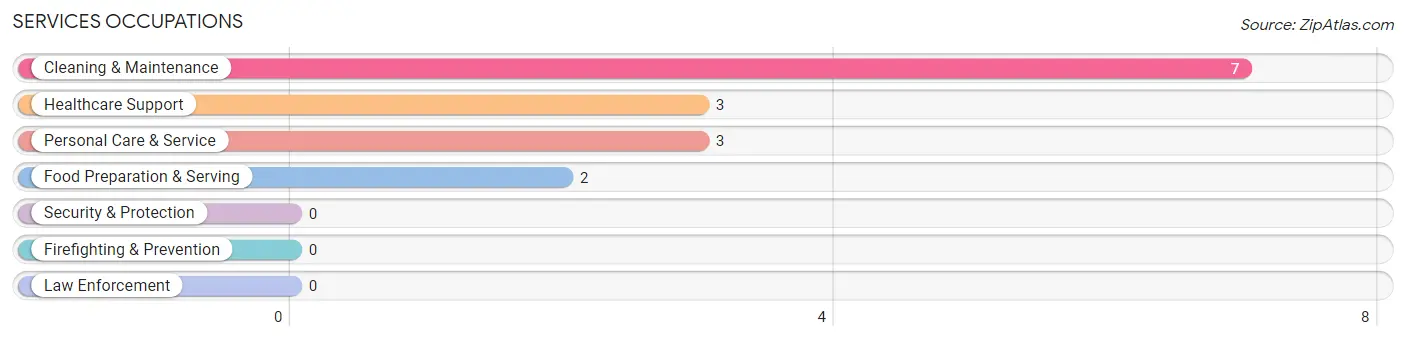
Services Occupations
The most common Services occupations in Port Vincent are Cleaning & Maintenance (7 | 2.2%), Healthcare Support (3 | 0.9%), Personal Care & Service (3 | 0.9%), and Food Preparation & Serving (2 | 0.6%).
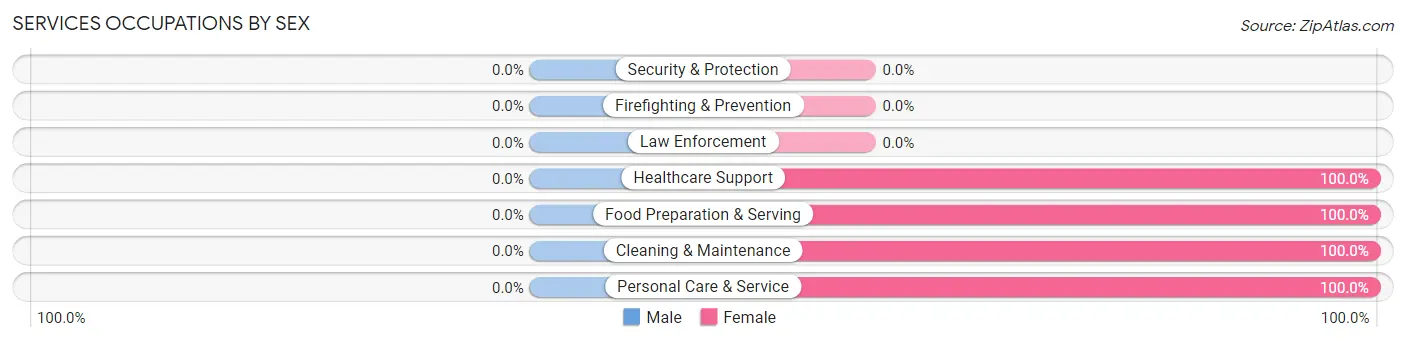
Services Occupations by Sex
| Occupation | Male | Female |
| Healthcare Support | 0 (0.0%) | 3 (100.0%) |
| Security & Protection | 0 (0.0%) | 0 (0.0%) |
| Firefighting & Prevention | 0 (0.0%) | 0 (0.0%) |
| Law Enforcement | 0 (0.0%) | 0 (0.0%) |
| Food Preparation & Serving | 0 (0.0%) | 2 (100.0%) |
| Cleaning & Maintenance | 0 (0.0%) | 7 (100.0%) |
| Personal Care & Service | 0 (0.0%) | 3 (100.0%) |
| Total (Category) | 0 (0.0%) | 15 (100.0%) |
| Total (Overall) | 225 (69.7%) | 98 (30.3%) |
Sales and Office Occupations
The most common Sales and Office occupations in Port Vincent are Sales & Related (92 | 28.5%), and Office & Administration (24 | 7.4%).
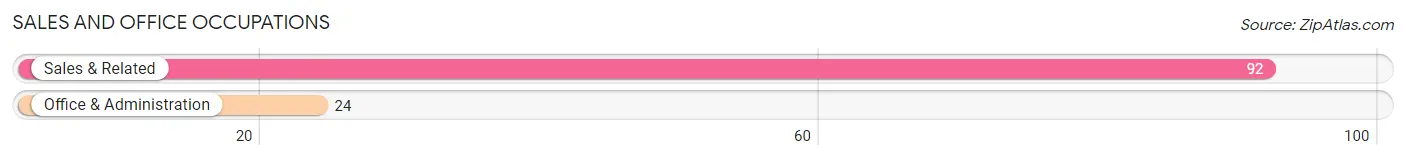
Sales and Office Occupations by Sex
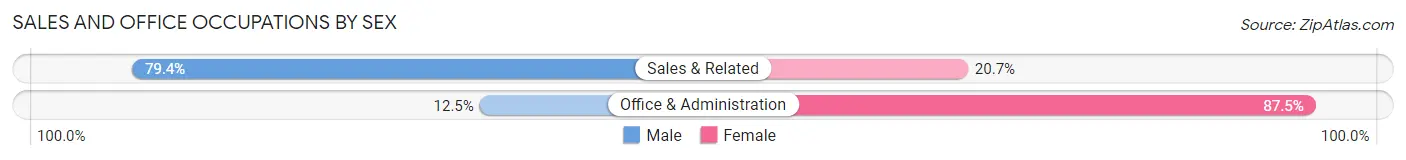
| Occupation | Male | Female |
| Sales & Related | 73 (79.3%) | 19 (20.6%) |
| Office & Administration | 3 (12.5%) | 21 (87.5%) |
| Total (Category) | 76 (65.5%) | 40 (34.5%) |
| Total (Overall) | 225 (69.7%) | 98 (30.3%) |
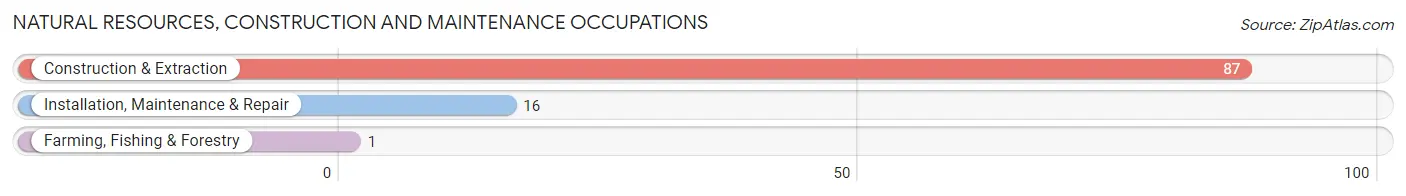
Natural Resources, Construction and Maintenance Occupations
The most common Natural Resources, Construction and Maintenance occupations in Port Vincent are Construction & Extraction (87 | 26.9%), Installation, Maintenance & Repair (16 | 5.0%), and Farming, Fishing & Forestry (1 | 0.3%).
Natural Resources, Construction and Maintenance Occupations by Sex
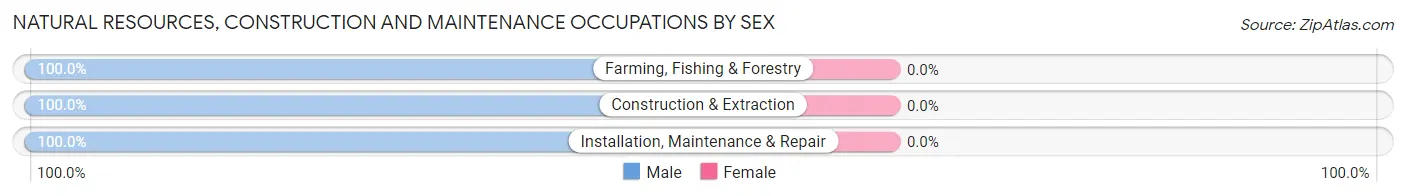
| Occupation | Male | Female |
| Farming, Fishing & Forestry | 1 (100.0%) | 0 (0.0%) |
| Construction & Extraction | 87 (100.0%) | 0 (0.0%) |
| Installation, Maintenance & Repair | 16 (100.0%) | 0 (0.0%) |
| Total (Category) | 104 (100.0%) | 0 (0.0%) |
| Total (Overall) | 225 (69.7%) | 98 (30.3%) |
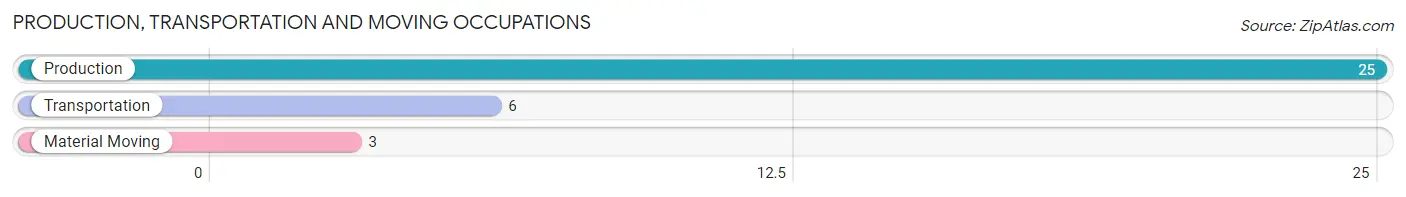
Production, Transportation and Moving Occupations
The most common Production, Transportation and Moving occupations in Port Vincent are Production (25 | 7.7%), Transportation (6 | 1.9%), and Material Moving (3 | 0.9%).
Production, Transportation and Moving Occupations by Sex
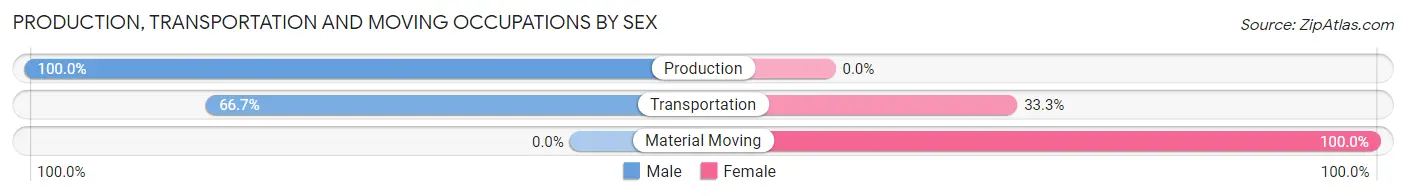
| Occupation | Male | Female |
| Production | 25 (100.0%) | 0 (0.0%) |
| Transportation | 4 (66.7%) | 2 (33.3%) |
| Material Moving | 0 (0.0%) | 3 (100.0%) |
| Total (Category) | 29 (85.3%) | 5 (14.7%) |
| Total (Overall) | 225 (69.7%) | 98 (30.3%) |
Employment Industries by Sex in Port Vincent
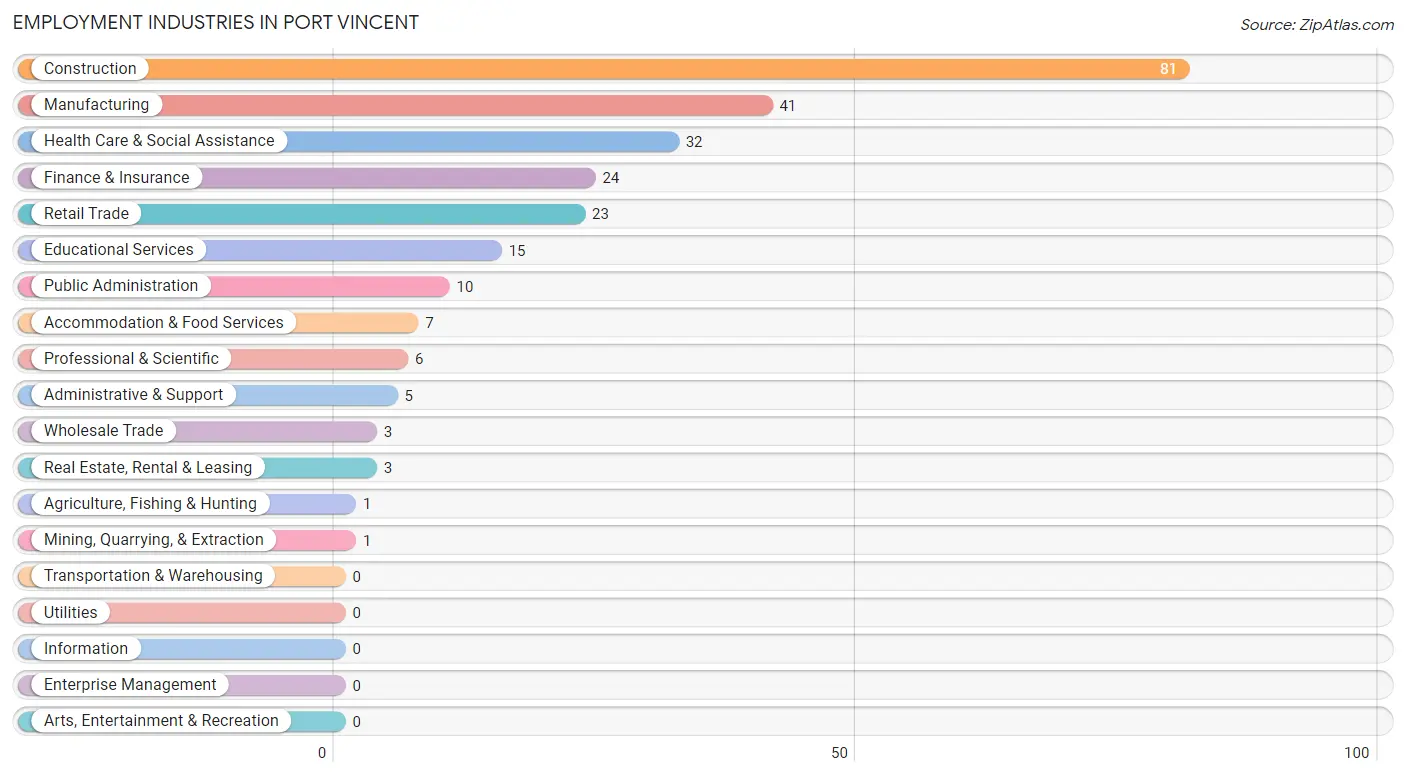
Employment Industries in Port Vincent
The major employment industries in Port Vincent include Construction (81 | 25.1%), Manufacturing (41 | 12.7%), Health Care & Social Assistance (32 | 9.9%), Finance & Insurance (24 | 7.4%), and Retail Trade (23 | 7.1%).
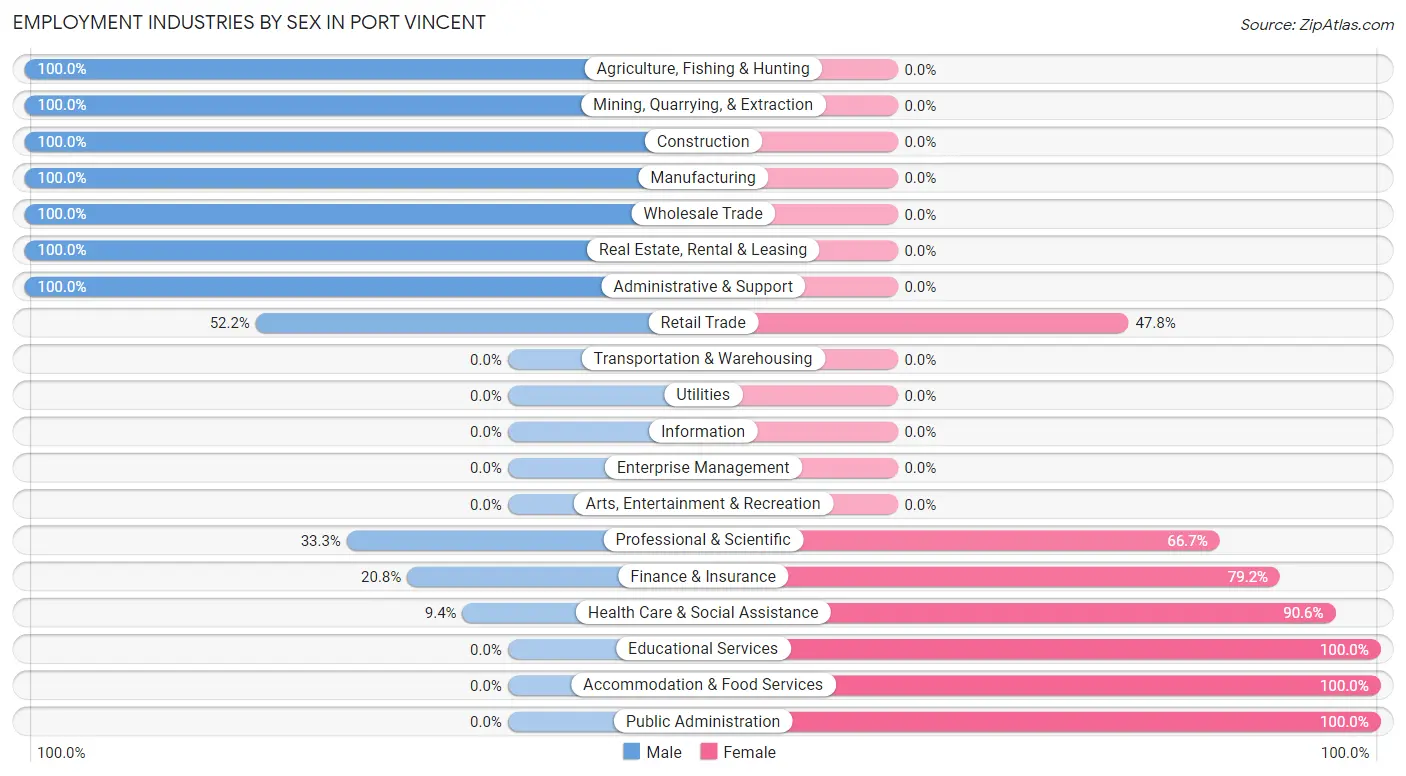
Employment Industries by Sex in Port Vincent
The Port Vincent industries that see more men than women are Agriculture, Fishing & Hunting (100.0%), Mining, Quarrying, & Extraction (100.0%), and Construction (100.0%), whereas the industries that tend to have a higher number of women are Educational Services (100.0%), Accommodation & Food Services (100.0%), and Public Administration (100.0%).
| Industry | Male | Female |
| Agriculture, Fishing & Hunting | 1 (100.0%) | 0 (0.0%) |
| Mining, Quarrying, & Extraction | 1 (100.0%) | 0 (0.0%) |
| Construction | 81 (100.0%) | 0 (0.0%) |
| Manufacturing | 41 (100.0%) | 0 (0.0%) |
| Wholesale Trade | 3 (100.0%) | 0 (0.0%) |
| Retail Trade | 12 (52.2%) | 11 (47.8%) |
| Transportation & Warehousing | 0 (0.0%) | 0 (0.0%) |
| Utilities | 0 (0.0%) | 0 (0.0%) |
| Information | 0 (0.0%) | 0 (0.0%) |
| Finance & Insurance | 5 (20.8%) | 19 (79.2%) |
| Real Estate, Rental & Leasing | 3 (100.0%) | 0 (0.0%) |
| Professional & Scientific | 2 (33.3%) | 4 (66.7%) |
| Enterprise Management | 0 (0.0%) | 0 (0.0%) |
| Administrative & Support | 5 (100.0%) | 0 (0.0%) |
| Educational Services | 0 (0.0%) | 15 (100.0%) |
| Health Care & Social Assistance | 3 (9.4%) | 29 (90.6%) |
| Arts, Entertainment & Recreation | 0 (0.0%) | 0 (0.0%) |
| Accommodation & Food Services | 0 (0.0%) | 7 (100.0%) |
| Public Administration | 0 (0.0%) | 10 (100.0%) |
| Total | 225 (69.7%) | 98 (30.3%) |
Education in Port Vincent
School Enrollment in Port Vincent
The most common levels of schooling among the 72 students in Port Vincent are elementary school (19 | 26.4%), high school (18 | 25.0%), and middle school (16 | 22.2%).
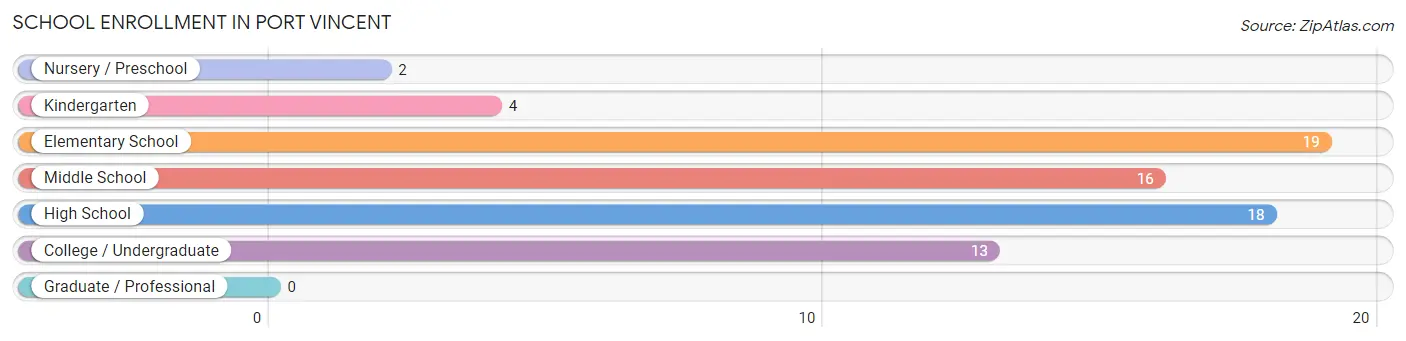
| School Level | # Students | % Students |
| Nursery / Preschool | 2 | 2.8% |
| Kindergarten | 4 | 5.6% |
| Elementary School | 19 | 26.4% |
| Middle School | 16 | 22.2% |
| High School | 18 | 25.0% |
| College / Undergraduate | 13 | 18.1% |
| Graduate / Professional | 0 | 0.0% |
| Total | 72 | 100.0% |
School Enrollment by Age by Funding Source in Port Vincent
Out of a total of 72 students who are enrolled in schools in Port Vincent, 8 (11.1%) attend a private institution, while the remaining 64 (88.9%) are enrolled in public schools. The age group of 10 to 14 year olds has the highest likelihood of being enrolled in private schools, with 8 (36.4% in the age bracket) enrolled. Conversely, the age group of 3 to 4 year olds has the lowest likelihood of being enrolled in a private school, with 4 (100.0% in the age bracket) attending a public institution.
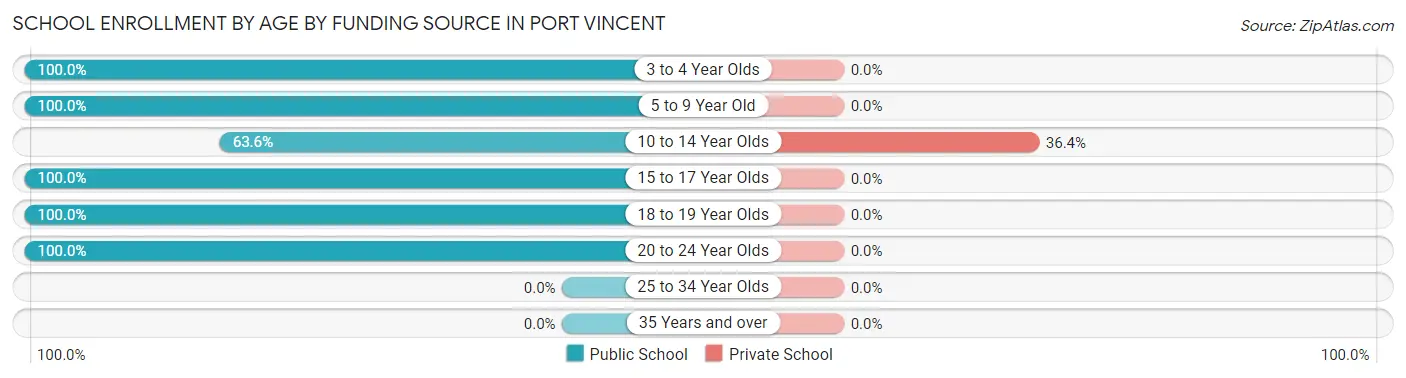
| Age Bracket | Public School | Private School |
| 3 to 4 Year Olds | 4 (100.0%) | 0 (0.0%) |
| 5 to 9 Year Old | 15 (100.0%) | 0 (0.0%) |
| 10 to 14 Year Olds | 14 (63.6%) | 8 (36.4%) |
| 15 to 17 Year Olds | 10 (100.0%) | 0 (0.0%) |
| 18 to 19 Year Olds | 9 (100.0%) | 0 (0.0%) |
| 20 to 24 Year Olds | 12 (100.0%) | 0 (0.0%) |
| 25 to 34 Year Olds | 0 (0.0%) | 0 (0.0%) |
| 35 Years and over | 0 (0.0%) | 0 (0.0%) |
| Total | 64 (88.9%) | 8 (11.1%) |
Educational Attainment by Field of Study in Port Vincent
Engineering (13 | 21.0%), bio, nature & agricultural (12 | 19.4%), psychology (12 | 19.4%), business (7 | 11.3%), and education (7 | 11.3%) are the most common fields of study among 62 individuals in Port Vincent who have obtained a bachelor's degree or higher.
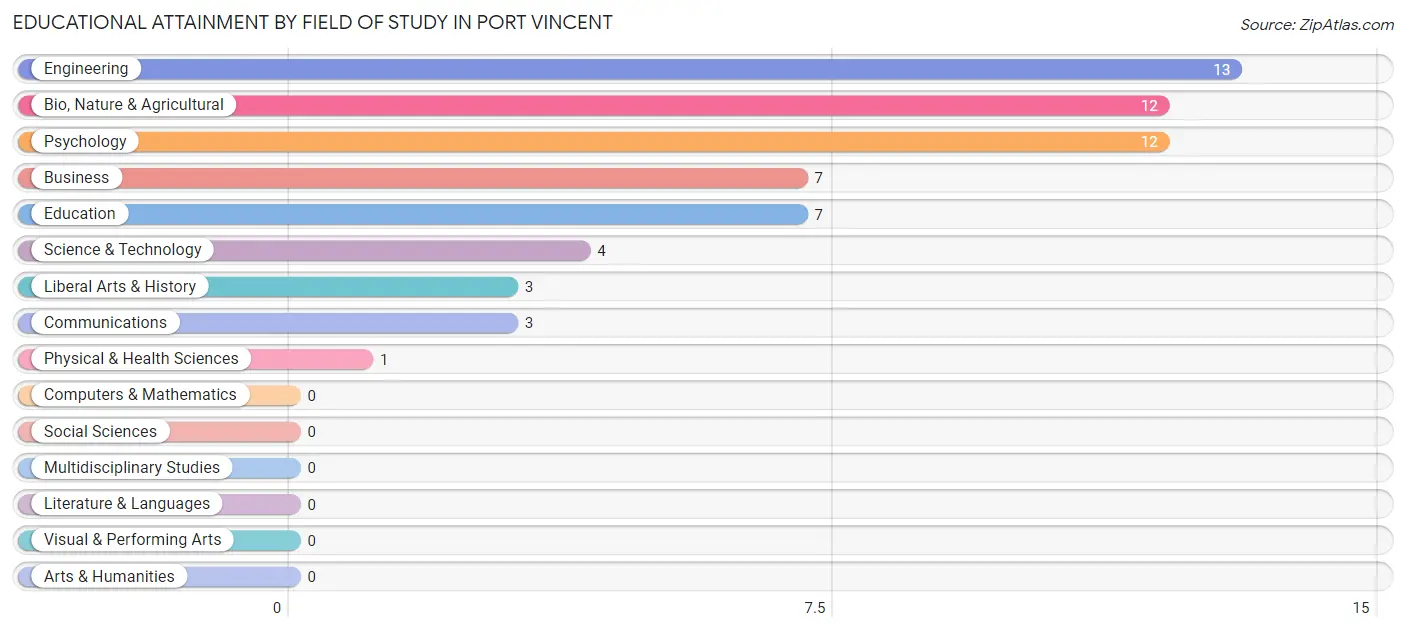
| Field of Study | # Graduates | % Graduates |
| Computers & Mathematics | 0 | 0.0% |
| Bio, Nature & Agricultural | 12 | 19.4% |
| Physical & Health Sciences | 1 | 1.6% |
| Psychology | 12 | 19.4% |
| Social Sciences | 0 | 0.0% |
| Engineering | 13 | 21.0% |
| Multidisciplinary Studies | 0 | 0.0% |
| Science & Technology | 4 | 6.5% |
| Business | 7 | 11.3% |
| Education | 7 | 11.3% |
| Literature & Languages | 0 | 0.0% |
| Liberal Arts & History | 3 | 4.8% |
| Visual & Performing Arts | 0 | 0.0% |
| Communications | 3 | 4.8% |
| Arts & Humanities | 0 | 0.0% |
| Total | 62 | 100.0% |
Transportation & Commute in Port Vincent
Vehicle Availability by Sex in Port Vincent
The most prevalent vehicle ownership categories in Port Vincent are males with 1 vehicle (140, accounting for 59.6%) and females with 1 vehicle (27, making up 142.9%).
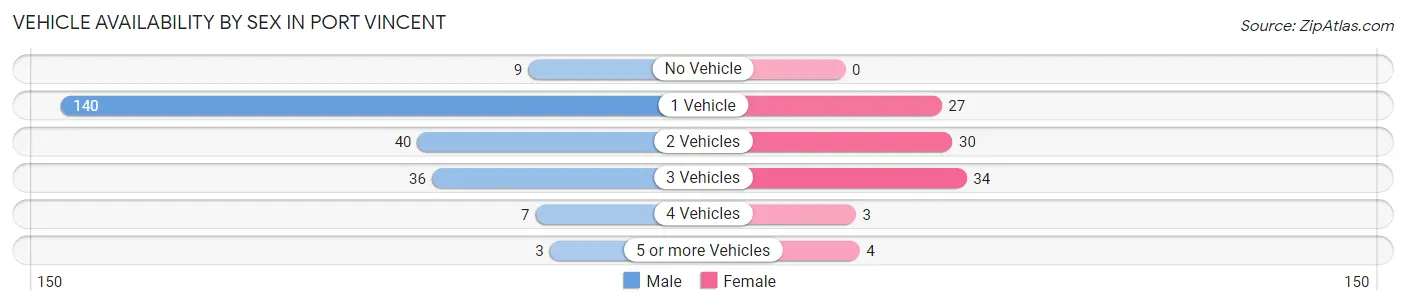
| Vehicles Available | Male | Female |
| No Vehicle | 9 (3.8%) | 0 (0.0%) |
| 1 Vehicle | 140 (59.6%) | 27 (27.6%) |
| 2 Vehicles | 40 (17.0%) | 30 (30.6%) |
| 3 Vehicles | 36 (15.3%) | 34 (34.7%) |
| 4 Vehicles | 7 (3.0%) | 3 (3.1%) |
| 5 or more Vehicles | 3 (1.3%) | 4 (4.1%) |
| Total | 235 (100.0%) | 98 (100.0%) |
Commute Time in Port Vincent
The most frequently occuring commute durations in Port Vincent are 20 to 24 minutes (77 commuters, 25.7%), 15 to 19 minutes (65 commuters, 21.7%), and 30 to 34 minutes (49 commuters, 16.3%).
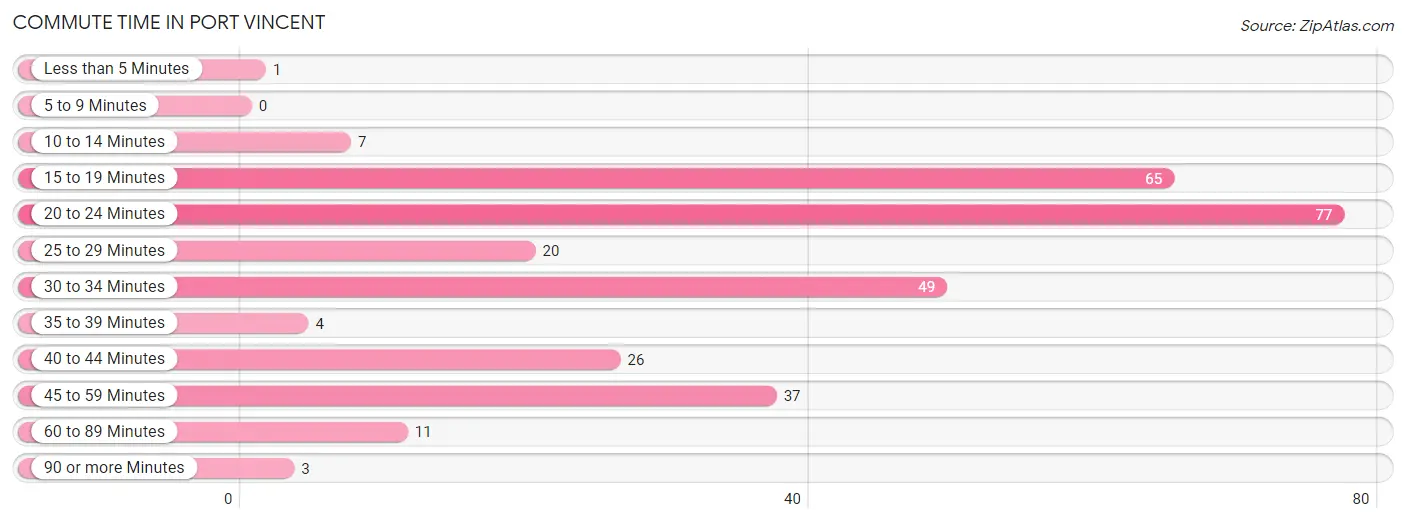
| Commute Time | # Commuters | % Commuters |
| Less than 5 Minutes | 1 | 0.3% |
| 5 to 9 Minutes | 0 | 0.0% |
| 10 to 14 Minutes | 7 | 2.3% |
| 15 to 19 Minutes | 65 | 21.7% |
| 20 to 24 Minutes | 77 | 25.7% |
| 25 to 29 Minutes | 20 | 6.7% |
| 30 to 34 Minutes | 49 | 16.3% |
| 35 to 39 Minutes | 4 | 1.3% |
| 40 to 44 Minutes | 26 | 8.7% |
| 45 to 59 Minutes | 37 | 12.3% |
| 60 to 89 Minutes | 11 | 3.7% |
| 90 or more Minutes | 3 | 1.0% |
Commute Time by Sex in Port Vincent
The most common commute times in Port Vincent are 20 to 24 minutes (68 commuters, 30.5%) for males and 30 to 34 minutes (26 commuters, 33.8%) for females.
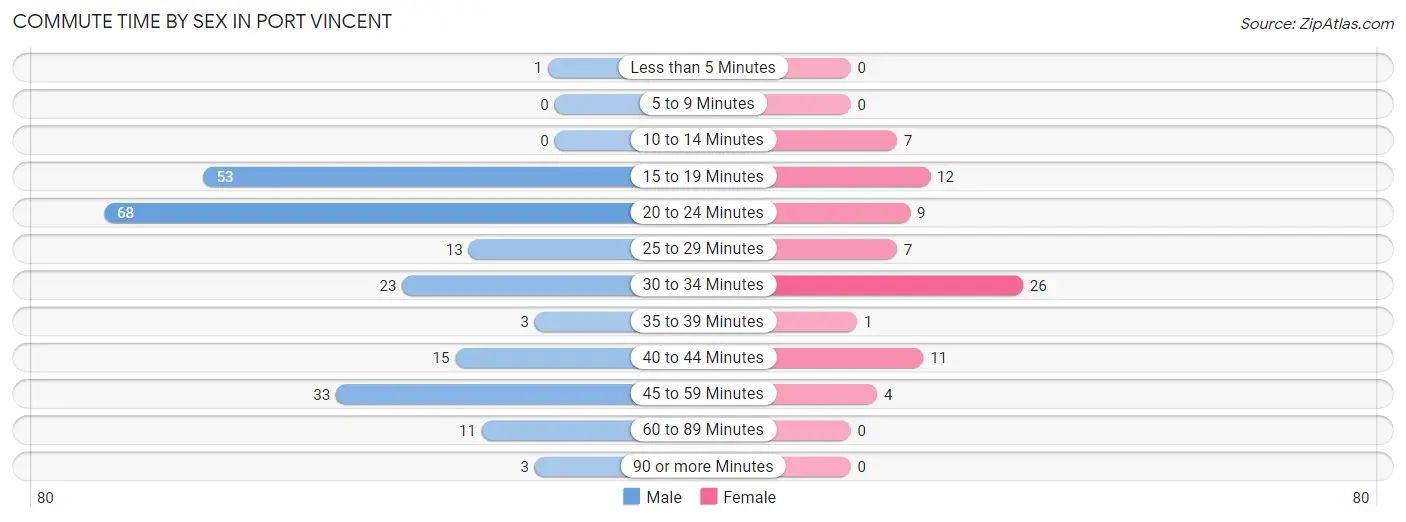
| Commute Time | Male | Female |
| Less than 5 Minutes | 1 (0.4%) | 0 (0.0%) |
| 5 to 9 Minutes | 0 (0.0%) | 0 (0.0%) |
| 10 to 14 Minutes | 0 (0.0%) | 7 (9.1%) |
| 15 to 19 Minutes | 53 (23.8%) | 12 (15.6%) |
| 20 to 24 Minutes | 68 (30.5%) | 9 (11.7%) |
| 25 to 29 Minutes | 13 (5.8%) | 7 (9.1%) |
| 30 to 34 Minutes | 23 (10.3%) | 26 (33.8%) |
| 35 to 39 Minutes | 3 (1.3%) | 1 (1.3%) |
| 40 to 44 Minutes | 15 (6.7%) | 11 (14.3%) |
| 45 to 59 Minutes | 33 (14.8%) | 4 (5.2%) |
| 60 to 89 Minutes | 11 (4.9%) | 0 (0.0%) |
| 90 or more Minutes | 3 (1.3%) | 0 (0.0%) |
Time of Departure to Work by Sex in Port Vincent
The most frequent times of departure to work in Port Vincent are 6:00 AM to 6:29 AM (70, 31.4%) for males and 7:30 AM to 7:59 AM (18, 23.4%) for females.
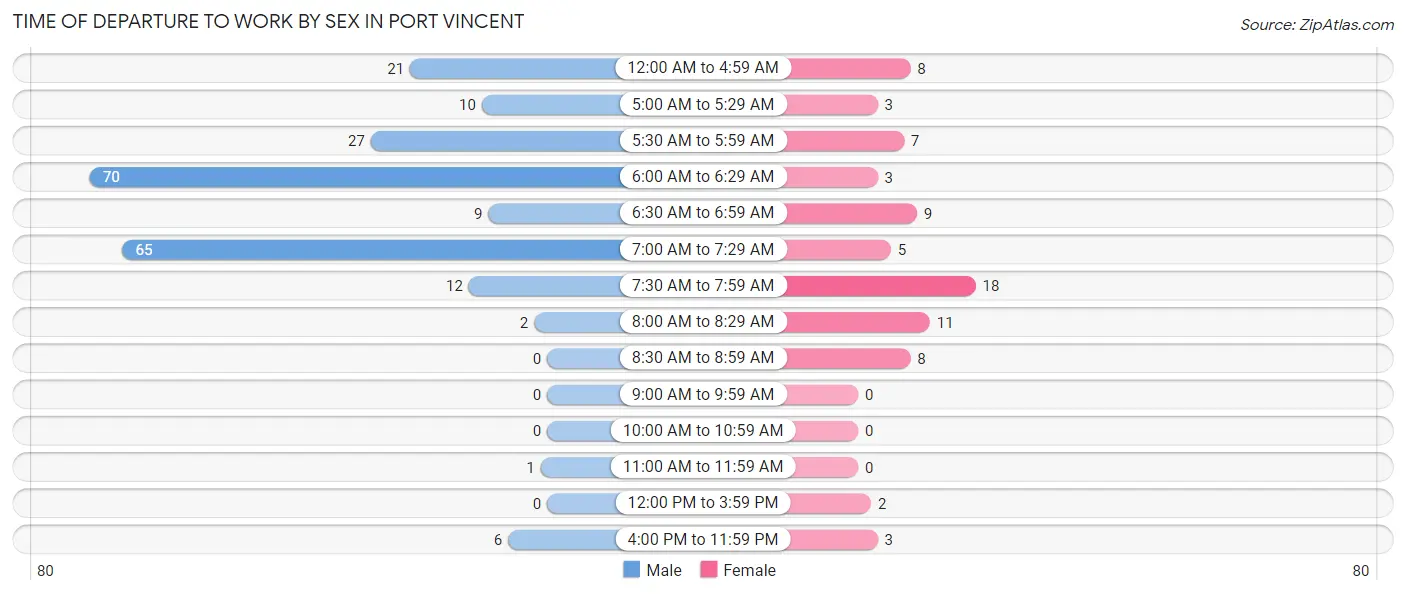
| Time of Departure | Male | Female |
| 12:00 AM to 4:59 AM | 21 (9.4%) | 8 (10.4%) |
| 5:00 AM to 5:29 AM | 10 (4.5%) | 3 (3.9%) |
| 5:30 AM to 5:59 AM | 27 (12.1%) | 7 (9.1%) |
| 6:00 AM to 6:29 AM | 70 (31.4%) | 3 (3.9%) |
| 6:30 AM to 6:59 AM | 9 (4.0%) | 9 (11.7%) |
| 7:00 AM to 7:29 AM | 65 (29.1%) | 5 (6.5%) |
| 7:30 AM to 7:59 AM | 12 (5.4%) | 18 (23.4%) |
| 8:00 AM to 8:29 AM | 2 (0.9%) | 11 (14.3%) |
| 8:30 AM to 8:59 AM | 0 (0.0%) | 8 (10.4%) |
| 9:00 AM to 9:59 AM | 0 (0.0%) | 0 (0.0%) |
| 10:00 AM to 10:59 AM | 0 (0.0%) | 0 (0.0%) |
| 11:00 AM to 11:59 AM | 1 (0.4%) | 0 (0.0%) |
| 12:00 PM to 3:59 PM | 0 (0.0%) | 2 (2.6%) |
| 4:00 PM to 11:59 PM | 6 (2.7%) | 3 (3.9%) |
| Total | 223 (100.0%) | 77 (100.0%) |
Housing Occupancy in Port Vincent
Occupancy by Ownership in Port Vincent
Of the total 308 dwellings in Port Vincent, owner-occupied units account for 260 (84.4%), while renter-occupied units make up 48 (15.6%).
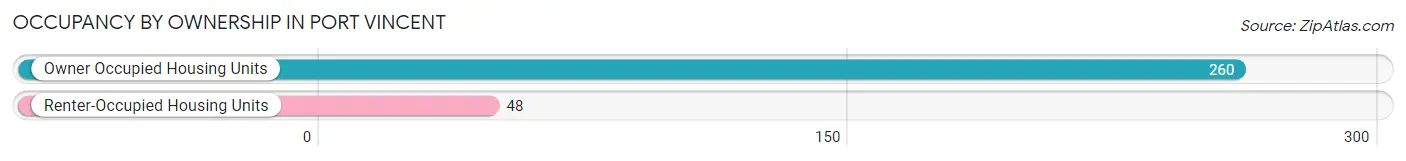
| Occupancy | # Housing Units | % Housing Units |
| Owner Occupied Housing Units | 260 | 84.4% |
| Renter-Occupied Housing Units | 48 | 15.6% |
| Total Occupied Housing Units | 308 | 100.0% |
Occupancy by Household Size in Port Vincent
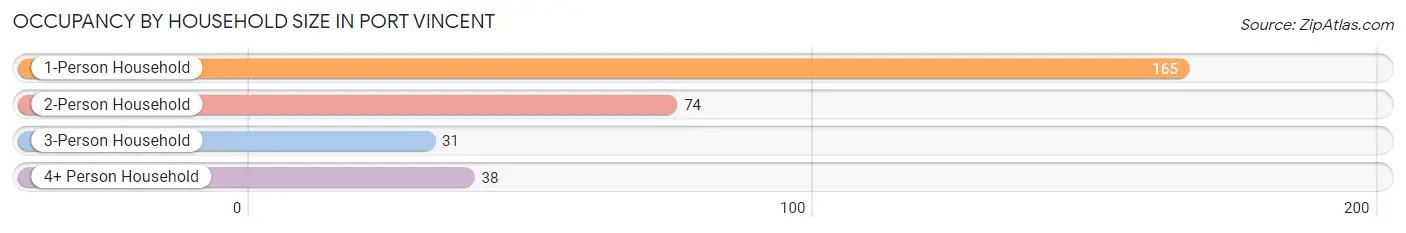
| Household Size | # Housing Units | % Housing Units |
| 1-Person Household | 165 | 53.6% |
| 2-Person Household | 74 | 24.0% |
| 3-Person Household | 31 | 10.1% |
| 4+ Person Household | 38 | 12.3% |
| Total Housing Units | 308 | 100.0% |
Occupancy by Ownership by Household Size in Port Vincent
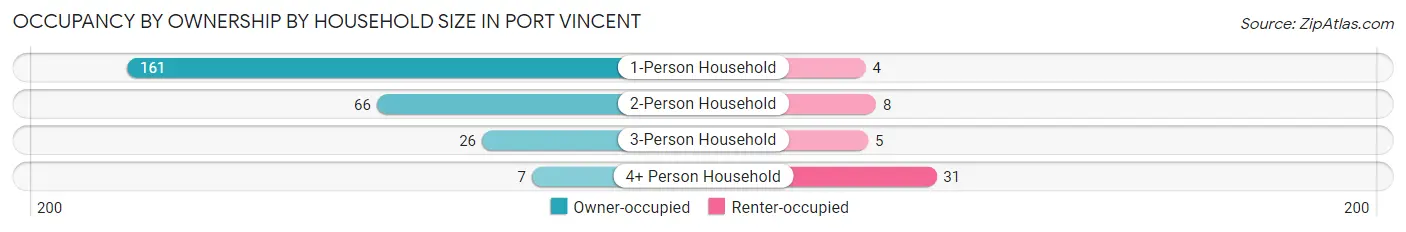
| Household Size | Owner-occupied | Renter-occupied |
| 1-Person Household | 161 (97.6%) | 4 (2.4%) |
| 2-Person Household | 66 (89.2%) | 8 (10.8%) |
| 3-Person Household | 26 (83.9%) | 5 (16.1%) |
| 4+ Person Household | 7 (18.4%) | 31 (81.6%) |
| Total Housing Units | 260 (84.4%) | 48 (15.6%) |
Occupancy by Educational Attainment in Port Vincent
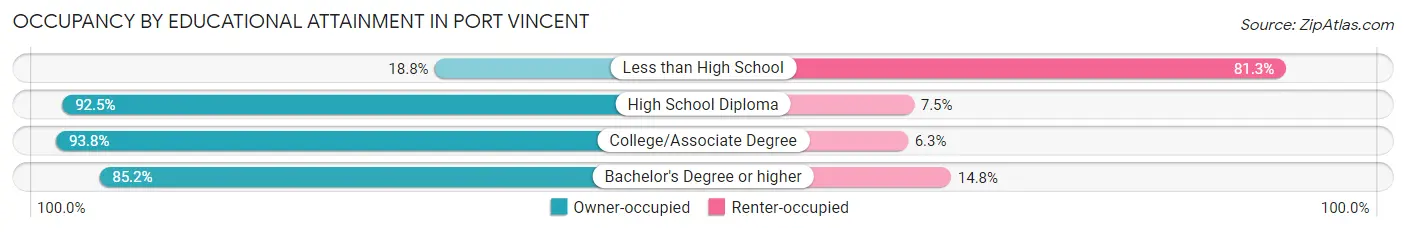
| Household Size | Owner-occupied | Renter-occupied |
| Less than High School | 6 (18.8%) | 26 (81.2%) |
| High School Diploma | 186 (92.5%) | 15 (7.5%) |
| College/Associate Degree | 45 (93.8%) | 3 (6.2%) |
| Bachelor's Degree or higher | 23 (85.2%) | 4 (14.8%) |
Occupancy by Age of Householder in Port Vincent
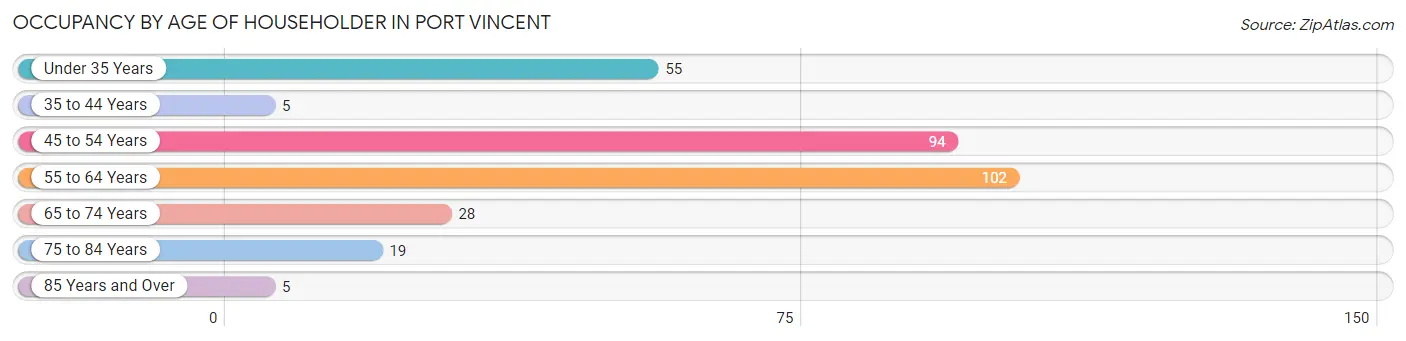
| Age Bracket | # Households | % Households |
| Under 35 Years | 55 | 17.9% |
| 35 to 44 Years | 5 | 1.6% |
| 45 to 54 Years | 94 | 30.5% |
| 55 to 64 Years | 102 | 33.1% |
| 65 to 74 Years | 28 | 9.1% |
| 75 to 84 Years | 19 | 6.2% |
| 85 Years and Over | 5 | 1.6% |
| Total | 308 | 100.0% |
Housing Finances in Port Vincent
Median Income by Occupancy in Port Vincent
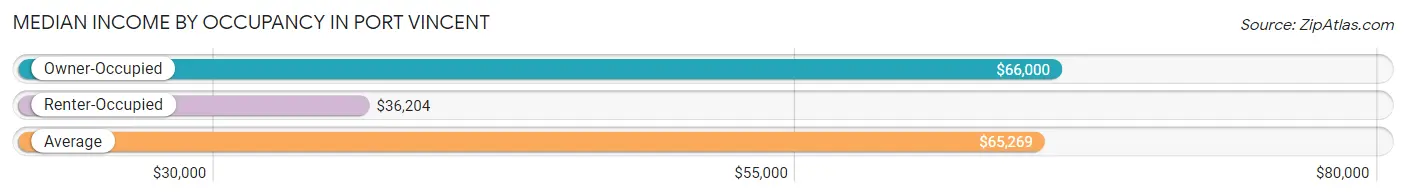
| Occupancy Type | # Households | Median Income |
| Owner-Occupied | 260 (84.4%) | $66,000 |
| Renter-Occupied | 48 (15.6%) | $36,204 |
| Average | 308 (100.0%) | $65,269 |
Occupancy by Householder Income Bracket in Port Vincent
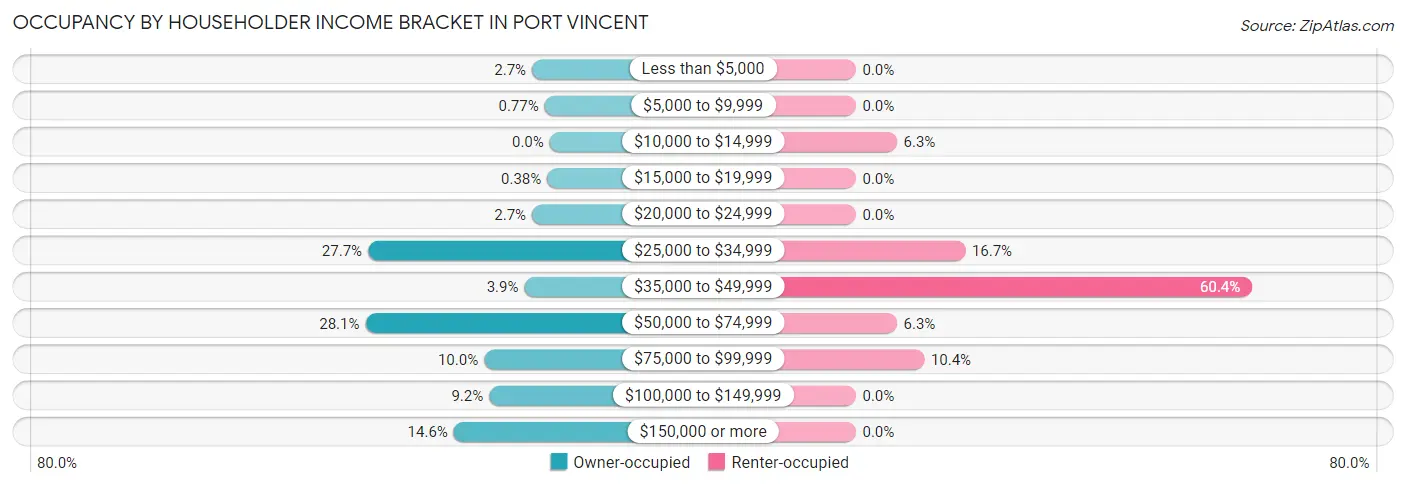
| Income Bracket | Owner-occupied | Renter-occupied |
| Less than $5,000 | 7 (2.7%) | 0 (0.0%) |
| $5,000 to $9,999 | 2 (0.8%) | 0 (0.0%) |
| $10,000 to $14,999 | 0 (0.0%) | 3 (6.2%) |
| $15,000 to $19,999 | 1 (0.4%) | 0 (0.0%) |
| $20,000 to $24,999 | 7 (2.7%) | 0 (0.0%) |
| $25,000 to $34,999 | 72 (27.7%) | 8 (16.7%) |
| $35,000 to $49,999 | 10 (3.8%) | 29 (60.4%) |
| $50,000 to $74,999 | 73 (28.1%) | 3 (6.2%) |
| $75,000 to $99,999 | 26 (10.0%) | 5 (10.4%) |
| $100,000 to $149,999 | 24 (9.2%) | 0 (0.0%) |
| $150,000 or more | 38 (14.6%) | 0 (0.0%) |
| Total | 260 (100.0%) | 48 (100.0%) |
Monthly Housing Cost Tiers in Port Vincent
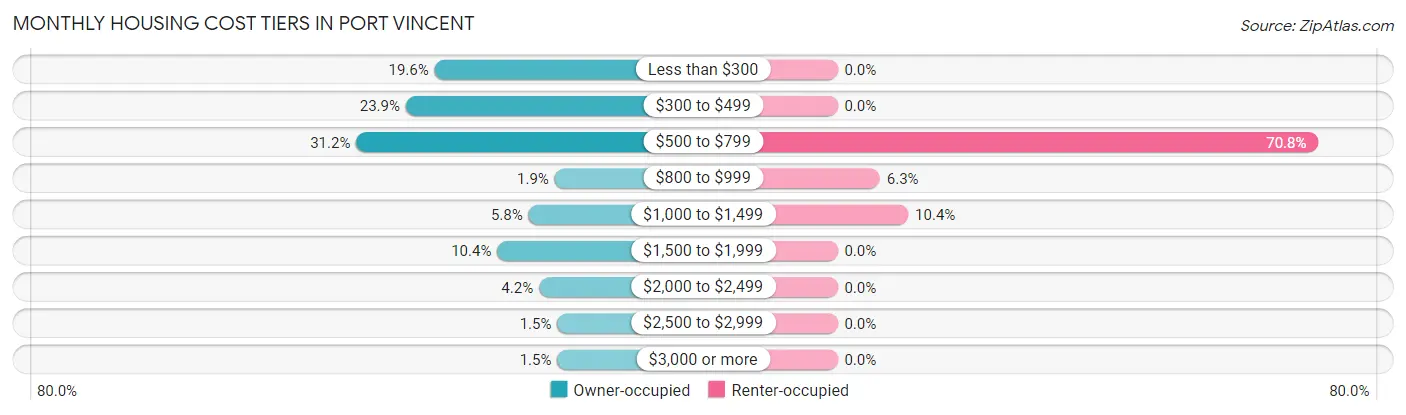
| Monthly Cost | Owner-occupied | Renter-occupied |
| Less than $300 | 51 (19.6%) | 0 (0.0%) |
| $300 to $499 | 62 (23.8%) | 0 (0.0%) |
| $500 to $799 | 81 (31.1%) | 34 (70.8%) |
| $800 to $999 | 5 (1.9%) | 3 (6.2%) |
| $1,000 to $1,499 | 15 (5.8%) | 5 (10.4%) |
| $1,500 to $1,999 | 27 (10.4%) | 0 (0.0%) |
| $2,000 to $2,499 | 11 (4.2%) | 0 (0.0%) |
| $2,500 to $2,999 | 4 (1.5%) | 0 (0.0%) |
| $3,000 or more | 4 (1.5%) | 0 (0.0%) |
| Total | 260 (100.0%) | 48 (100.0%) |
Physical Housing Characteristics in Port Vincent
Housing Structures in Port Vincent
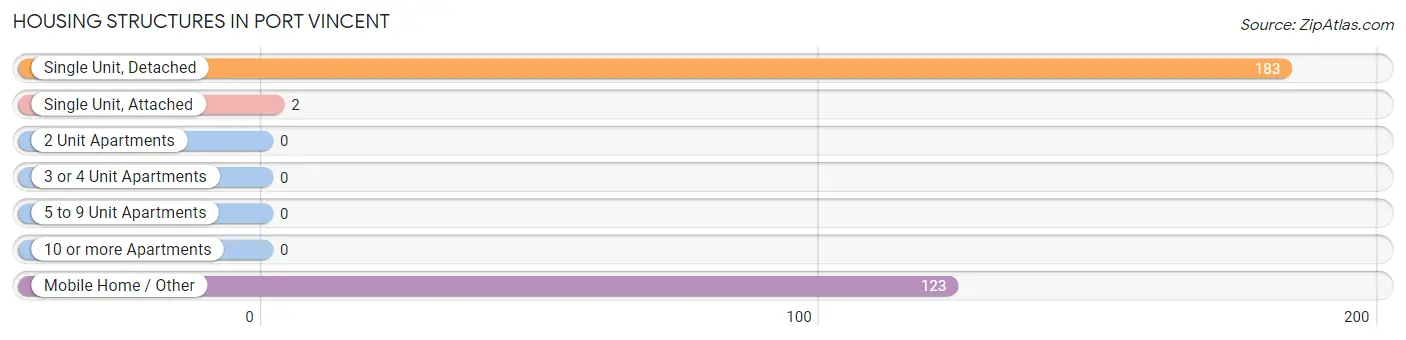
| Structure Type | # Housing Units | % Housing Units |
| Single Unit, Detached | 183 | 59.4% |
| Single Unit, Attached | 2 | 0.6% |
| 2 Unit Apartments | 0 | 0.0% |
| 3 or 4 Unit Apartments | 0 | 0.0% |
| 5 to 9 Unit Apartments | 0 | 0.0% |
| 10 or more Apartments | 0 | 0.0% |
| Mobile Home / Other | 123 | 39.9% |
| Total | 308 | 100.0% |
Housing Structures by Occupancy in Port Vincent
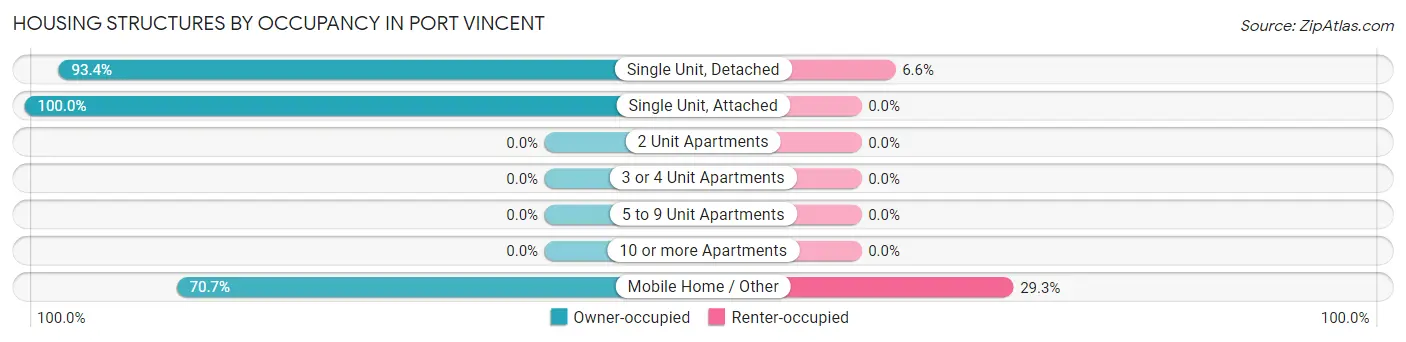
| Structure Type | Owner-occupied | Renter-occupied |
| Single Unit, Detached | 171 (93.4%) | 12 (6.6%) |
| Single Unit, Attached | 2 (100.0%) | 0 (0.0%) |
| 2 Unit Apartments | 0 (0.0%) | 0 (0.0%) |
| 3 or 4 Unit Apartments | 0 (0.0%) | 0 (0.0%) |
| 5 to 9 Unit Apartments | 0 (0.0%) | 0 (0.0%) |
| 10 or more Apartments | 0 (0.0%) | 0 (0.0%) |
| Mobile Home / Other | 87 (70.7%) | 36 (29.3%) |
| Total | 260 (84.4%) | 48 (15.6%) |
Housing Structures by Number of Rooms in Port Vincent
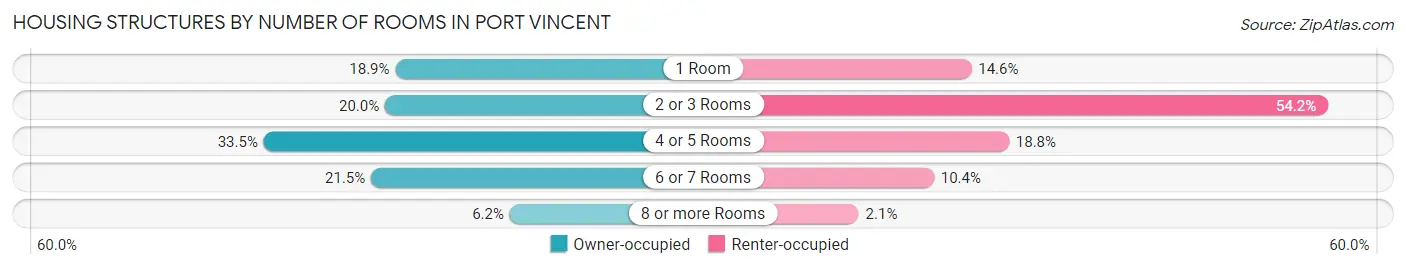
| Number of Rooms | Owner-occupied | Renter-occupied |
| 1 Room | 49 (18.9%) | 7 (14.6%) |
| 2 or 3 Rooms | 52 (20.0%) | 26 (54.2%) |
| 4 or 5 Rooms | 87 (33.5%) | 9 (18.8%) |
| 6 or 7 Rooms | 56 (21.5%) | 5 (10.4%) |
| 8 or more Rooms | 16 (6.1%) | 1 (2.1%) |
| Total | 260 (100.0%) | 48 (100.0%) |
Housing Structure by Heating Type in Port Vincent
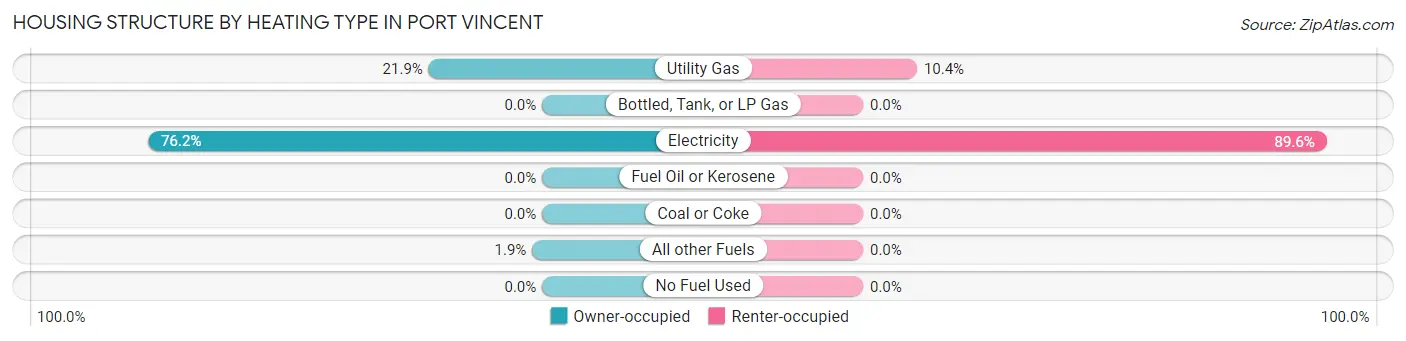
| Heating Type | Owner-occupied | Renter-occupied |
| Utility Gas | 57 (21.9%) | 5 (10.4%) |
| Bottled, Tank, or LP Gas | 0 (0.0%) | 0 (0.0%) |
| Electricity | 198 (76.1%) | 43 (89.6%) |
| Fuel Oil or Kerosene | 0 (0.0%) | 0 (0.0%) |
| Coal or Coke | 0 (0.0%) | 0 (0.0%) |
| All other Fuels | 5 (1.9%) | 0 (0.0%) |
| No Fuel Used | 0 (0.0%) | 0 (0.0%) |
| Total | 260 (100.0%) | 48 (100.0%) |
Household Vehicle Usage in Port Vincent
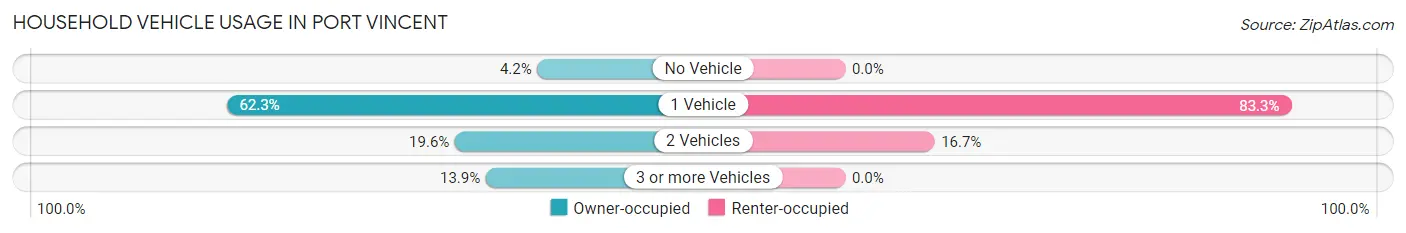
| Vehicles per Household | Owner-occupied | Renter-occupied |
| No Vehicle | 11 (4.2%) | 0 (0.0%) |
| 1 Vehicle | 162 (62.3%) | 40 (83.3%) |
| 2 Vehicles | 51 (19.6%) | 8 (16.7%) |
| 3 or more Vehicles | 36 (13.9%) | 0 (0.0%) |
| Total | 260 (100.0%) | 48 (100.0%) |
Real Estate & Mortgages in Port Vincent
Real Estate and Mortgage Overview in Port Vincent
| Characteristic | Without Mortgage | With Mortgage |
| Housing Units | 146 | 114 |
| Median Property Value | $265,400 | $0 |
| Median Household Income | $66,462 | $34 |
| Monthly Housing Costs | $513 | $4 |
| Real Estate Taxes | - | - |
Property Value by Mortgage Status in Port Vincent
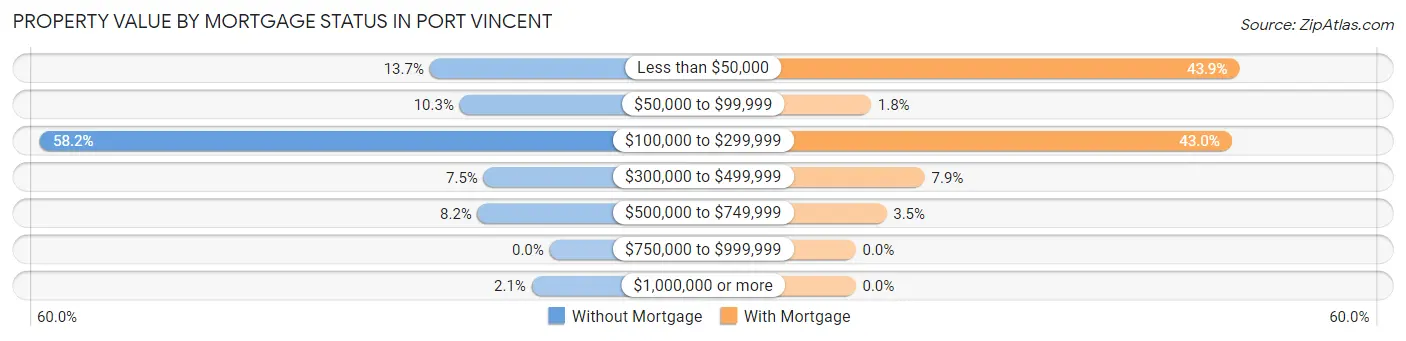
| Property Value | Without Mortgage | With Mortgage |
| Less than $50,000 | 20 (13.7%) | 50 (43.9%) |
| $50,000 to $99,999 | 15 (10.3%) | 2 (1.8%) |
| $100,000 to $299,999 | 85 (58.2%) | 49 (43.0%) |
| $300,000 to $499,999 | 11 (7.5%) | 9 (7.9%) |
| $500,000 to $749,999 | 12 (8.2%) | 4 (3.5%) |
| $750,000 to $999,999 | 0 (0.0%) | 0 (0.0%) |
| $1,000,000 or more | 3 (2.1%) | 0 (0.0%) |
| Total | 146 (100.0%) | 114 (100.0%) |
Household Income by Mortgage Status in Port Vincent
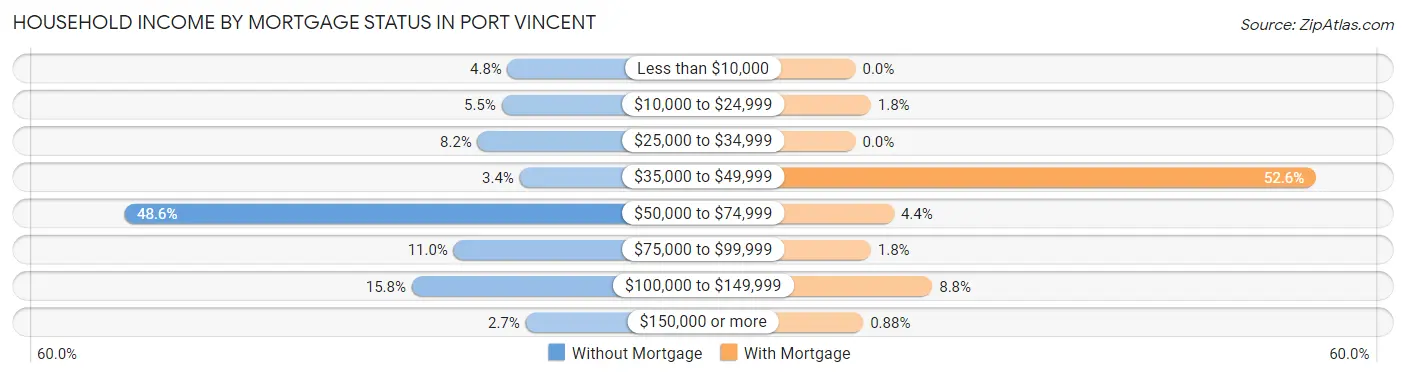
| Household Income | Without Mortgage | With Mortgage |
| Less than $10,000 | 7 (4.8%) | 0 (0.0%) |
| $10,000 to $24,999 | 8 (5.5%) | 2 (1.8%) |
| $25,000 to $34,999 | 12 (8.2%) | 0 (0.0%) |
| $35,000 to $49,999 | 5 (3.4%) | 60 (52.6%) |
| $50,000 to $74,999 | 71 (48.6%) | 5 (4.4%) |
| $75,000 to $99,999 | 16 (11.0%) | 2 (1.8%) |
| $100,000 to $149,999 | 23 (15.8%) | 10 (8.8%) |
| $150,000 or more | 4 (2.7%) | 1 (0.9%) |
| Total | 146 (100.0%) | 114 (100.0%) |
Property Value to Household Income Ratio in Port Vincent
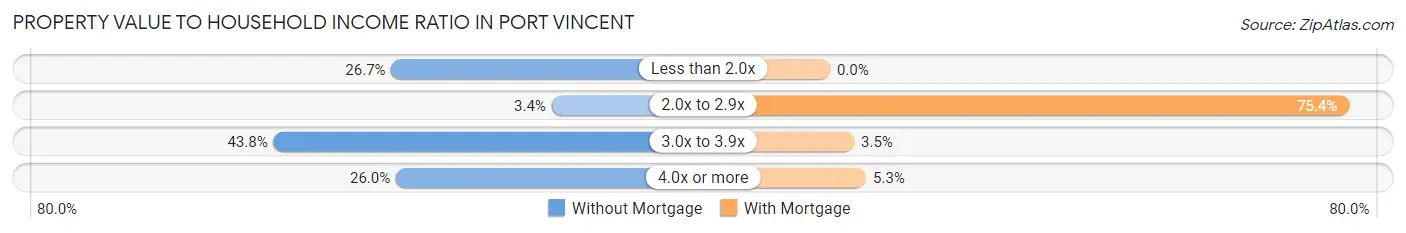
| Value-to-Income Ratio | Without Mortgage | With Mortgage |
| Less than 2.0x | 39 (26.7%) | 0 (0.0%) |
| 2.0x to 2.9x | 5 (3.4%) | 86 (75.4%) |
| 3.0x to 3.9x | 64 (43.8%) | 4 (3.5%) |
| 4.0x or more | 38 (26.0%) | 6 (5.3%) |
| Total | 146 (100.0%) | 114 (100.0%) |
Real Estate Taxes by Mortgage Status in Port Vincent
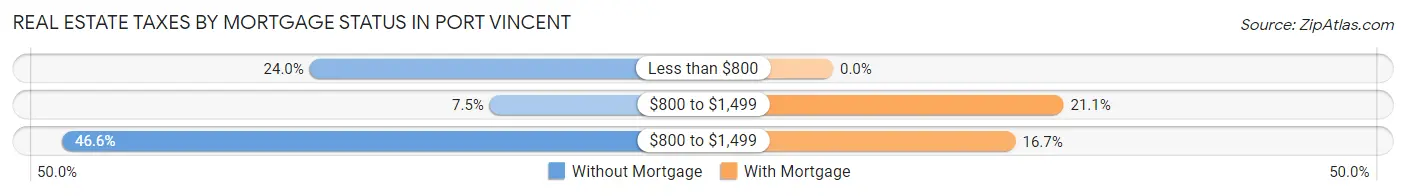
| Property Taxes | Without Mortgage | With Mortgage |
| Less than $800 | 35 (24.0%) | 0 (0.0%) |
| $800 to $1,499 | 11 (7.5%) | 24 (21.0%) |
| $800 to $1,499 | 68 (46.6%) | 19 (16.7%) |
| Total | 146 (100.0%) | 114 (100.0%) |
Health & Disability in Port Vincent
Health Insurance Coverage by Age in Port Vincent
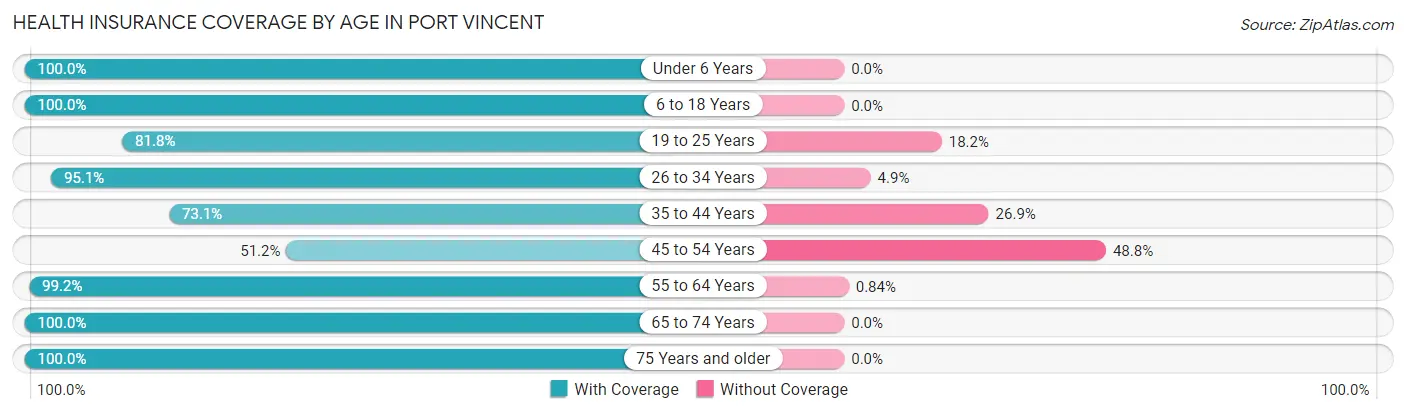
| Age Bracket | With Coverage | Without Coverage |
| Under 6 Years | 22 (100.0%) | 0 (0.0%) |
| 6 to 18 Years | 53 (100.0%) | 0 (0.0%) |
| 19 to 25 Years | 54 (81.8%) | 12 (18.2%) |
| 26 to 34 Years | 58 (95.1%) | 3 (4.9%) |
| 35 to 44 Years | 19 (73.1%) | 7 (26.9%) |
| 45 to 54 Years | 64 (51.2%) | 61 (48.8%) |
| 55 to 64 Years | 118 (99.2%) | 1 (0.8%) |
| 65 to 74 Years | 46 (100.0%) | 0 (0.0%) |
| 75 Years and older | 32 (100.0%) | 0 (0.0%) |
| Total | 466 (84.7%) | 84 (15.3%) |
Health Insurance Coverage by Citizenship Status in Port Vincent
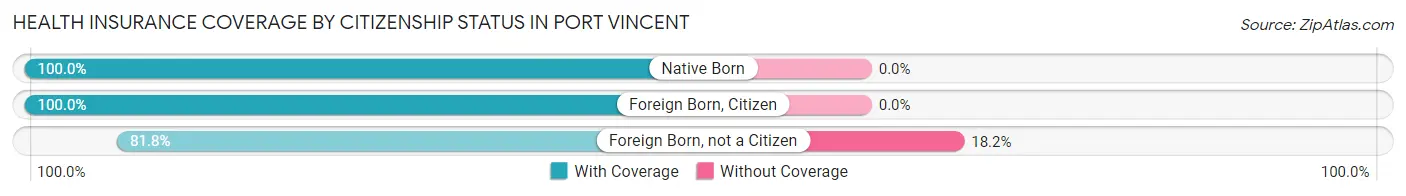
| Citizenship Status | With Coverage | Without Coverage |
| Native Born | 22 (100.0%) | 0 (0.0%) |
| Foreign Born, Citizen | 53 (100.0%) | 0 (0.0%) |
| Foreign Born, not a Citizen | 54 (81.8%) | 12 (18.2%) |
Health Insurance Coverage by Household Income in Port Vincent
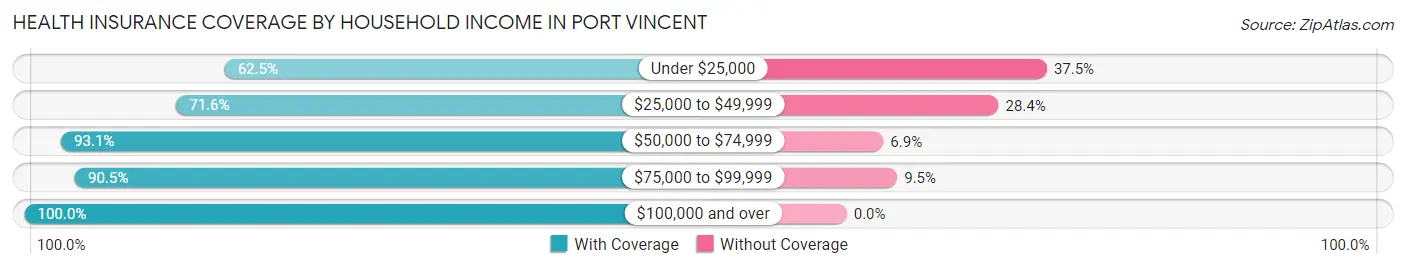
| Household Income | With Coverage | Without Coverage |
| Under $25,000 | 20 (62.5%) | 12 (37.5%) |
| $25,000 to $49,999 | 146 (71.6%) | 58 (28.4%) |
| $50,000 to $74,999 | 95 (93.1%) | 7 (6.9%) |
| $75,000 to $99,999 | 67 (90.5%) | 7 (9.5%) |
| $100,000 and over | 138 (100.0%) | 0 (0.0%) |
Public vs Private Health Insurance Coverage by Age in Port Vincent
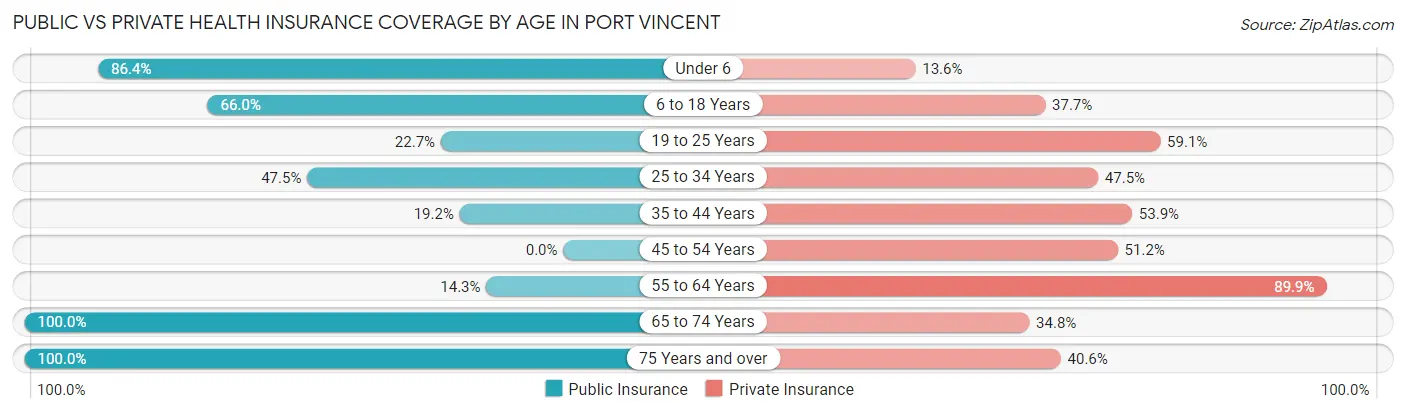
| Age Bracket | Public Insurance | Private Insurance |
| Under 6 | 19 (86.4%) | 3 (13.6%) |
| 6 to 18 Years | 35 (66.0%) | 20 (37.7%) |
| 19 to 25 Years | 15 (22.7%) | 39 (59.1%) |
| 25 to 34 Years | 29 (47.5%) | 29 (47.5%) |
| 35 to 44 Years | 5 (19.2%) | 14 (53.8%) |
| 45 to 54 Years | 0 (0.0%) | 64 (51.2%) |
| 55 to 64 Years | 17 (14.3%) | 107 (89.9%) |
| 65 to 74 Years | 46 (100.0%) | 16 (34.8%) |
| 75 Years and over | 32 (100.0%) | 13 (40.6%) |
| Total | 198 (36.0%) | 305 (55.4%) |
Disability Status by Sex by Age in Port Vincent
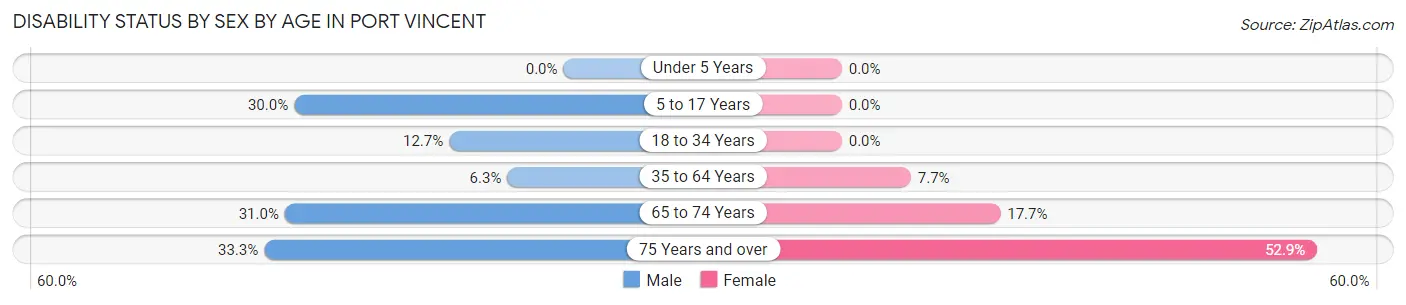
| Age Bracket | Male | Female |
| Under 5 Years | 0 (0.0%) | 0 (0.0%) |
| 5 to 17 Years | 3 (30.0%) | 0 (0.0%) |
| 18 to 34 Years | 7 (12.7%) | 0 (0.0%) |
| 35 to 64 Years | 12 (6.2%) | 6 (7.7%) |
| 65 to 74 Years | 9 (31.0%) | 3 (17.6%) |
| 75 Years and over | 5 (33.3%) | 9 (52.9%) |
Disability Class by Sex by Age in Port Vincent
Disability Class: Hearing Difficulty
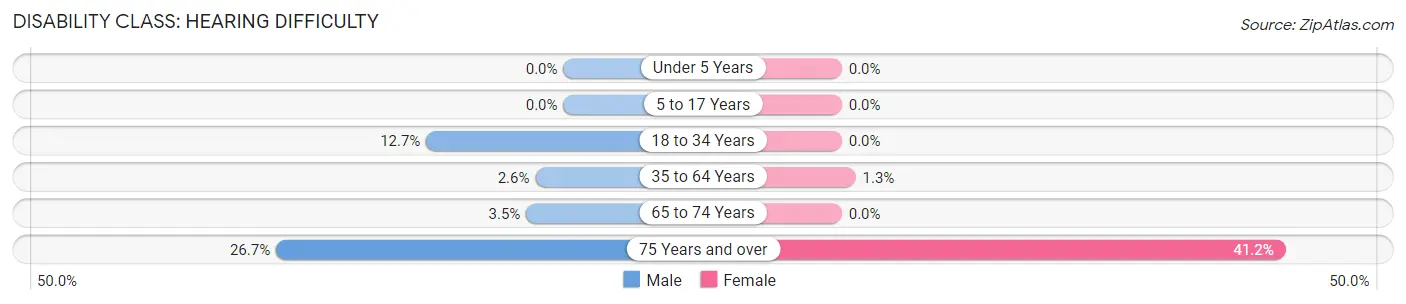
| Age Bracket | Male | Female |
| Under 5 Years | 0 (0.0%) | 0 (0.0%) |
| 5 to 17 Years | 0 (0.0%) | 0 (0.0%) |
| 18 to 34 Years | 7 (12.7%) | 0 (0.0%) |
| 35 to 64 Years | 5 (2.6%) | 1 (1.3%) |
| 65 to 74 Years | 1 (3.5%) | 0 (0.0%) |
| 75 Years and over | 4 (26.7%) | 7 (41.2%) |
Disability Class: Vision Difficulty
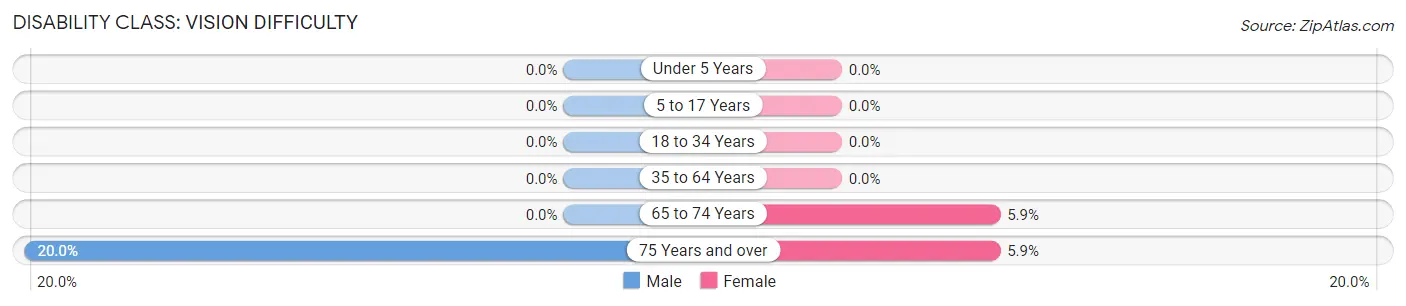
| Age Bracket | Male | Female |
| Under 5 Years | 0 (0.0%) | 0 (0.0%) |
| 5 to 17 Years | 0 (0.0%) | 0 (0.0%) |
| 18 to 34 Years | 0 (0.0%) | 0 (0.0%) |
| 35 to 64 Years | 0 (0.0%) | 0 (0.0%) |
| 65 to 74 Years | 0 (0.0%) | 1 (5.9%) |
| 75 Years and over | 3 (20.0%) | 1 (5.9%) |
Disability Class: Cognitive Difficulty
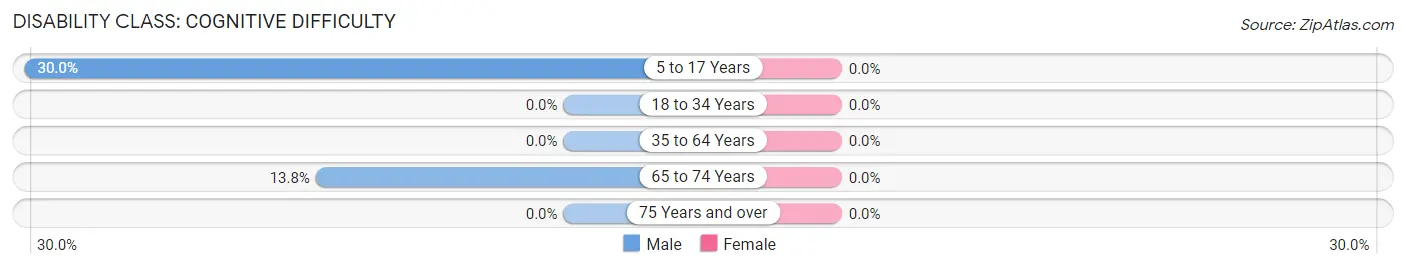
| Age Bracket | Male | Female |
| 5 to 17 Years | 3 (30.0%) | 0 (0.0%) |
| 18 to 34 Years | 0 (0.0%) | 0 (0.0%) |
| 35 to 64 Years | 0 (0.0%) | 0 (0.0%) |
| 65 to 74 Years | 4 (13.8%) | 0 (0.0%) |
| 75 Years and over | 0 (0.0%) | 0 (0.0%) |
Disability Class: Ambulatory Difficulty
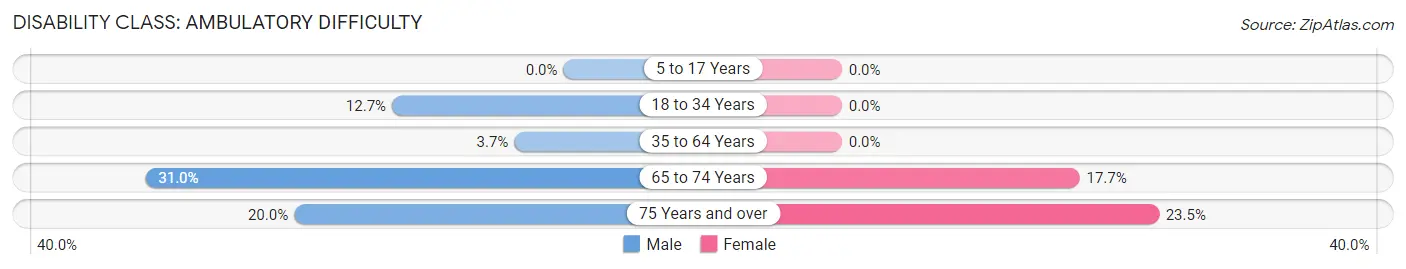
| Age Bracket | Male | Female |
| 5 to 17 Years | 0 (0.0%) | 0 (0.0%) |
| 18 to 34 Years | 7 (12.7%) | 0 (0.0%) |
| 35 to 64 Years | 7 (3.6%) | 0 (0.0%) |
| 65 to 74 Years | 9 (31.0%) | 3 (17.6%) |
| 75 Years and over | 3 (20.0%) | 4 (23.5%) |
Disability Class: Self-Care Difficulty
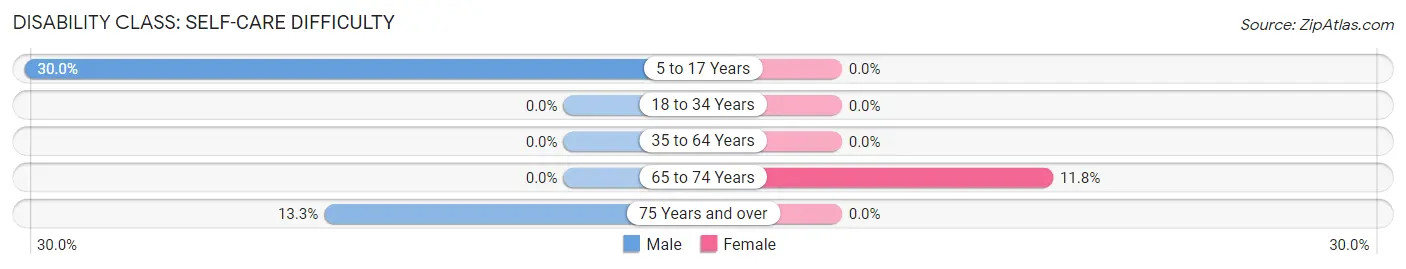
| Age Bracket | Male | Female |
| 5 to 17 Years | 3 (30.0%) | 0 (0.0%) |
| 18 to 34 Years | 0 (0.0%) | 0 (0.0%) |
| 35 to 64 Years | 0 (0.0%) | 0 (0.0%) |
| 65 to 74 Years | 0 (0.0%) | 2 (11.8%) |
| 75 Years and over | 2 (13.3%) | 0 (0.0%) |
Technology Access in Port Vincent
Computing Device Access in Port Vincent
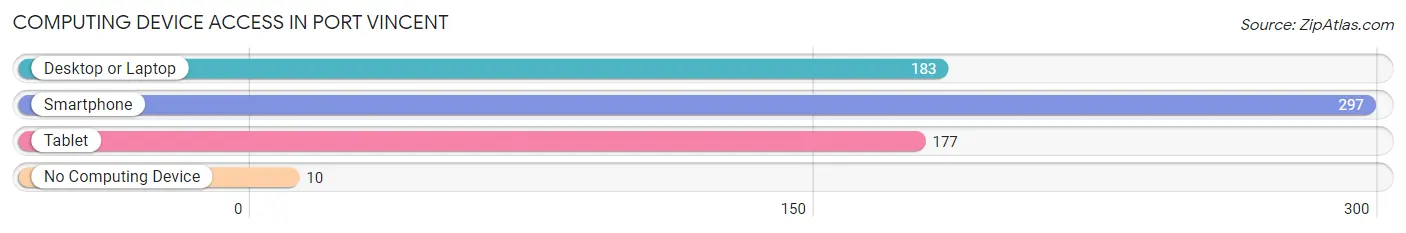
| Device Type | # Households | % Households |
| Desktop or Laptop | 183 | 59.4% |
| Smartphone | 297 | 96.4% |
| Tablet | 177 | 57.5% |
| No Computing Device | 10 | 3.3% |
| Total | 308 | 100.0% |
Internet Access in Port Vincent
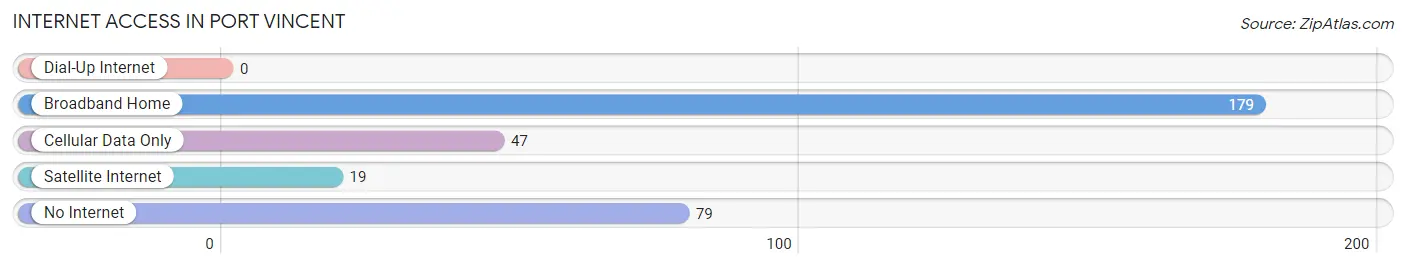
| Internet Type | # Households | % Households |
| Dial-Up Internet | 0 | 0.0% |
| Broadband Home | 179 | 58.1% |
| Cellular Data Only | 47 | 15.3% |
| Satellite Internet | 19 | 6.2% |
| No Internet | 79 | 25.7% |
| Total | 308 | 100.0% |
Port Vincent Summary
Vincent, Louisiana is a small town located in Iberia Parish, Louisiana. It is situated on the banks of the Bayou Teche, and is home to approximately 1,000 people. The town was founded in 1820 by French settlers, and was named after Vincent de Paul, a French priest and philanthropist.
History
The area that is now Port Vincent was originally inhabited by the Chitimacha Indians. The first European settlers arrived in the area in the early 1800s, and the town was officially founded in 1820. The town was named after Vincent de Paul, a French priest and philanthropist.
In the early days, the town was a bustling port town, with ships coming and going from the Bayou Teche. The town was also a major center for the sugar cane industry, with many plantations located in the area.
In the late 1800s, the town began to decline as the sugar cane industry moved away from the area. The town was also hit hard by the Great Depression, and many of the businesses in the area closed.
In the 1950s, the town began to experience a resurgence, as the oil and gas industry moved into the area. This brought new jobs and economic growth to the area, and the town began to experience a period of growth and prosperity.
Geography
Port Vincent is located in Iberia Parish, Louisiana. It is situated on the banks of the Bayou Teche, and is approximately 30 miles south of Lafayette. The town is located in a rural area, and is surrounded by farmland and small towns.
The climate in Port Vincent is humid subtropical, with hot, humid summers and mild winters. The average temperature in the summer is around 90 degrees Fahrenheit, and the average temperature in the winter is around 50 degrees Fahrenheit.
Economy
The economy of Port Vincent is largely based on the oil and gas industry. The town is home to several oil and gas companies, and many of the residents work in the industry.
The town is also home to several small businesses, including restaurants, retail stores, and other services. The town is also home to a few small manufacturing companies.
Demographics
As of the 2010 census, the population of Port Vincent was 1,000. The racial makeup of the town was 94.2% White, 3.2% African American, 0.2% Native American, 0.2% Asian, and 2.2% from other races.
The median household income in Port Vincent was $37,500, and the median family income was $45,000. The per capita income in the town was $18,000.
Conclusion
Port Vincent, Louisiana is a small town located in Iberia Parish, Louisiana. It was founded in 1820 by French settlers, and was named after Vincent de Paul, a French priest and philanthropist. The town is situated on the banks of the Bayou Teche, and is home to approximately 1,000 people. The economy of the town is largely based on the oil and gas industry, and the town is also home to several small businesses. The population of Port Vincent is largely white, with a small percentage of African Americans, Native Americans, and other races. The median household income in the town is $37,500, and the per capita income is $18,000.
Common Questions
What is Per Capita Income in Port Vincent?
Per Capita income in Port Vincent is $44,903.
What is the Median Family Income in Port Vincent?
Median Family Income in Port Vincent is $61,250.
What is the Median Household income in Port Vincent?
Median Household Income in Port Vincent is $65,269.
What is Income or Wage Gap in Port Vincent?
Income or Wage Gap in Port Vincent is 56.3%.
Women in Port Vincent earn 43.7 cents for every dollar earned by a man.
What is Inequality or Gini Index in Port Vincent?
Inequality or Gini Index in Port Vincent is 0.43.
What is the Total Population of Port Vincent?
Total Population of Port Vincent is 560.
What is the Total Male Population of Port Vincent?
Total Male Population of Port Vincent is 321.
What is the Total Female Population of Port Vincent?
Total Female Population of Port Vincent is 239.
What is the Ratio of Males per 100 Females in Port Vincent?
There are 134.31 Males per 100 Females in Port Vincent.
What is the Ratio of Females per 100 Males in Port Vincent?
There are 74.45 Females per 100 Males in Port Vincent.
What is the Median Population Age in Port Vincent?
Median Population Age in Port Vincent is 47.5 Years.
What is the Average Family Size in Port Vincent
Average Family Size in Port Vincent is 2.6 People.
What is the Average Household Size in Port Vincent
Average Household Size in Port Vincent is 1.8 People.
How Large is the Labor Force in Port Vincent?
There are 335 People in the Labor Forcein in Port Vincent.
What is the Percentage of People in the Labor Force in Port Vincent?
66.6% of People are in the Labor Force in Port Vincent.
What is the Unemployment Rate in Port Vincent?
Unemployment Rate in Port Vincent is 0.6%.