Stanley, LA Map & Demographics
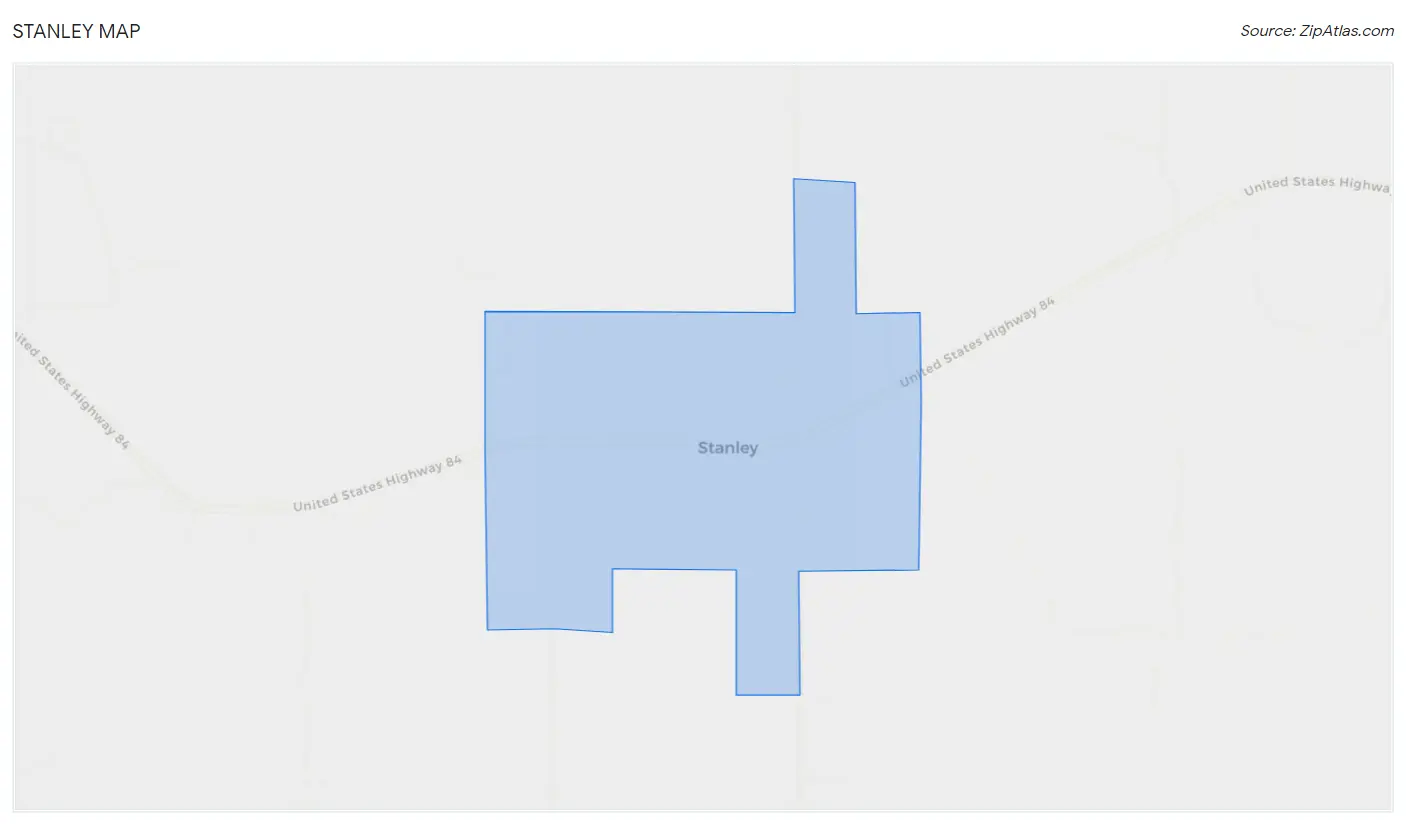
Stanley Map
Stanley Overview
$33,759
PER CAPITA INCOME
0.54
INEQUALITY / GINI INDEX
110
TOTAL POPULATION
47
MALE POPULATION
63
FEMALE POPULATION
74.60
MALES / 100 FEMALES
134.04
FEMALES / 100 MALES
40.3
MEDIAN AGE
3.1
AVG FAMILY SIZE
2.8
AVG HOUSEHOLD SIZE
46
LABOR FORCE [ PEOPLE ]
51.1%
PERCENT IN LABOR FORCE
Stanley Area Codes
Income in Stanley
Income Overview in Stanley
| Characteristic | Number | Measure |
| Per Capita Income | 110 | $33,759 |
| Median Family Income | 26 | $0 |
| Mean Family Income | 26 | $95,804 |
| Median Household Income | 40 | $0 |
| Mean Household Income | 40 | $89,320 |
| Income Deficit | 26 | $0 |
| Wage / Income Gap (%) | 110 | 0.00% |
| Wage / Income Gap ($) | 110 | 100.00¢ per $1 |
| Gini / Inequality Index | 110 | 0.54 |
Earnings by Sex in Stanley
| Sex | Number | Average Earnings |
| Male | 19 (40.4%) | $0 |
| Female | 28 (59.6%) | $0 |
| Total | 47 (100.0%) | $0 |
Earnings by Sex by Income Bracket in Stanley
The most common earnings brackets in Stanley are $7,500 to $9,999 for men (9 | 47.4%) and $45,000 to $49,999 for women (6 | 21.4%).
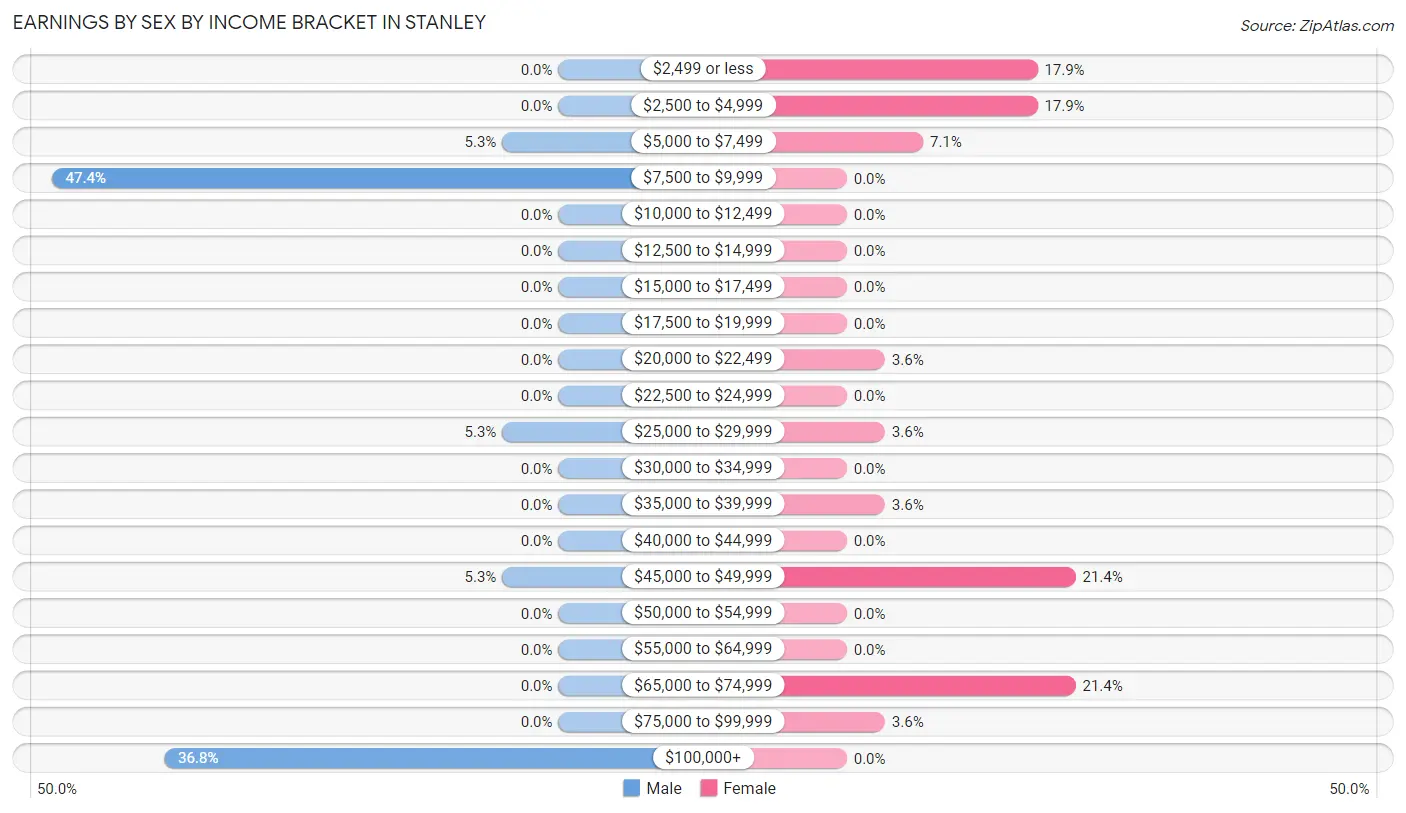
| Income | Male | Female |
| $2,499 or less | 0 (0.0%) | 5 (17.9%) |
| $2,500 to $4,999 | 0 (0.0%) | 5 (17.9%) |
| $5,000 to $7,499 | 1 (5.3%) | 2 (7.1%) |
| $7,500 to $9,999 | 9 (47.4%) | 0 (0.0%) |
| $10,000 to $12,499 | 0 (0.0%) | 0 (0.0%) |
| $12,500 to $14,999 | 0 (0.0%) | 0 (0.0%) |
| $15,000 to $17,499 | 0 (0.0%) | 0 (0.0%) |
| $17,500 to $19,999 | 0 (0.0%) | 0 (0.0%) |
| $20,000 to $22,499 | 0 (0.0%) | 1 (3.6%) |
| $22,500 to $24,999 | 0 (0.0%) | 0 (0.0%) |
| $25,000 to $29,999 | 1 (5.3%) | 1 (3.6%) |
| $30,000 to $34,999 | 0 (0.0%) | 0 (0.0%) |
| $35,000 to $39,999 | 0 (0.0%) | 1 (3.6%) |
| $40,000 to $44,999 | 0 (0.0%) | 0 (0.0%) |
| $45,000 to $49,999 | 1 (5.3%) | 6 (21.4%) |
| $50,000 to $54,999 | 0 (0.0%) | 0 (0.0%) |
| $55,000 to $64,999 | 0 (0.0%) | 0 (0.0%) |
| $65,000 to $74,999 | 0 (0.0%) | 6 (21.4%) |
| $75,000 to $99,999 | 0 (0.0%) | 1 (3.6%) |
| $100,000+ | 7 (36.8%) | 0 (0.0%) |
| Total | 19 (100.0%) | 28 (100.0%) |
Earnings by Sex by Educational Attainment in Stanley
| Educational Attainment | Male Income | Female Income |
| Less than High School | - | - |
| High School Diploma | - | - |
| College or Associate's Degree | - | - |
| Bachelor's Degree | - | - |
| Graduate Degree | - | - |
| Total | - | - |
Family Income in Stanley
Family Income Brackets in Stanley
According to the Stanley family income data, there are 9 families falling into the $15,000 to $24,999 income range, which is the most common income bracket and makes up 34.6% of all families.
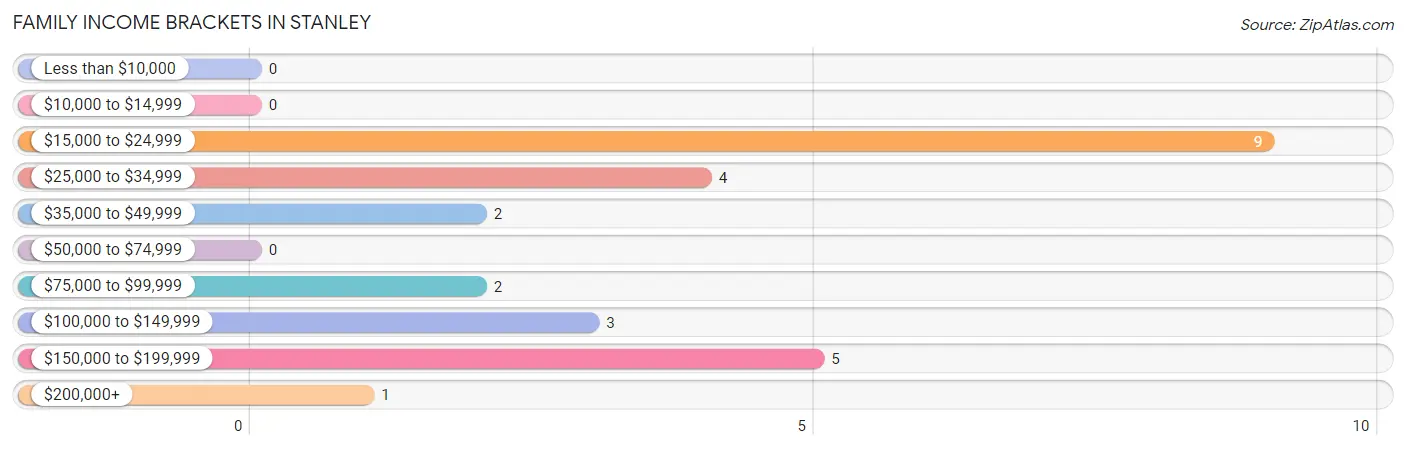
| Income Bracket | # Families | % Families |
| Less than $10,000 | 0 | 0.0% |
| $10,000 to $14,999 | 0 | 0.0% |
| $15,000 to $24,999 | 9 | 34.6% |
| $25,000 to $34,999 | 4 | 15.4% |
| $35,000 to $49,999 | 2 | 7.7% |
| $50,000 to $74,999 | 0 | 0.0% |
| $75,000 to $99,999 | 2 | 7.7% |
| $100,000 to $149,999 | 3 | 11.5% |
| $150,000 to $199,999 | 5 | 19.2% |
| $200,000+ | 1 | 3.8% |
Family Income by Famaliy Size in Stanley
| Income Bracket | # Families | Median Income |
| 2-Person Families | 13 (50.0%) | $0 |
| 3-Person Families | 6 (23.1%) | $0 |
| 4-Person Families | 3 (11.5%) | $0 |
| 5-Person Families | 0 (0.0%) | $0 |
| 6-Person Families | 4 (15.4%) | $0 |
| 7+ Person Families | 0 (0.0%) | $0 |
| Total | 26 (100.0%) | $0 |
Family Income by Number of Earners in Stanley
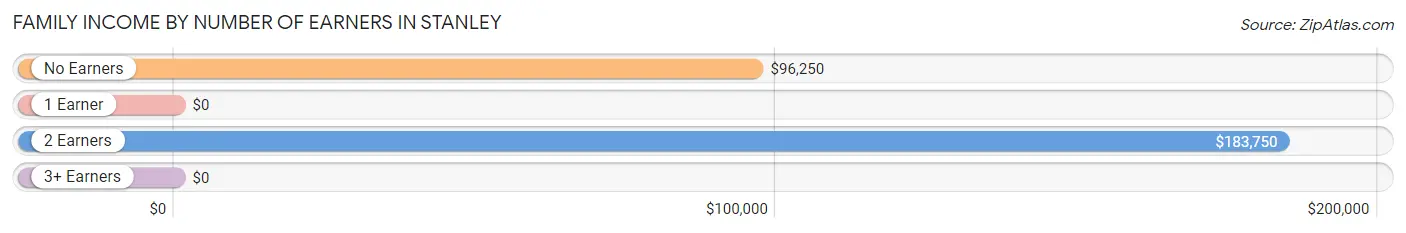
| Number of Earners | # Families | Median Income |
| No Earners | 4 (15.4%) | $96,250 |
| 1 Earner | 15 (57.7%) | $0 |
| 2 Earners | 7 (26.9%) | $183,750 |
| 3+ Earners | 0 (0.0%) | $0 |
| Total | 26 (100.0%) | $0 |
Household Income in Stanley
Household Income Brackets in Stanley
With 10 households falling in the category, the $15,000 to $24,999 income range is the most frequent in Stanley, accounting for 25.0% of all households.
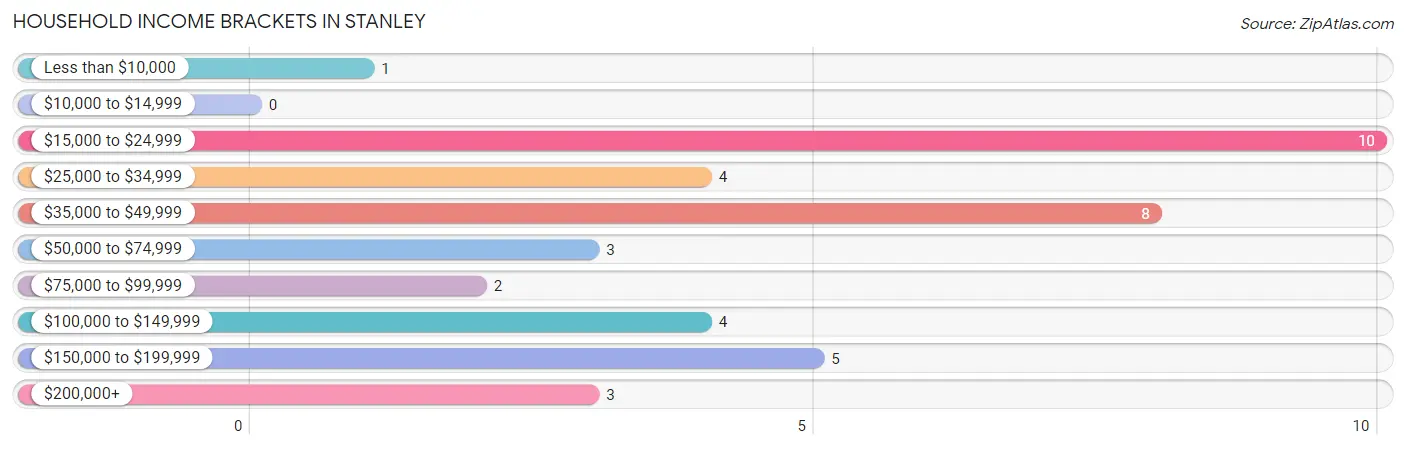
| Income Bracket | # Households | % Households |
| Less than $10,000 | 1 | 2.5% |
| $10,000 to $14,999 | 0 | 0.0% |
| $15,000 to $24,999 | 10 | 25.0% |
| $25,000 to $34,999 | 4 | 10.0% |
| $35,000 to $49,999 | 8 | 20.0% |
| $50,000 to $74,999 | 3 | 7.5% |
| $75,000 to $99,999 | 2 | 5.0% |
| $100,000 to $149,999 | 4 | 10.0% |
| $150,000 to $199,999 | 5 | 12.5% |
| $200,000+ | 3 | 7.5% |
Household Income by Householder Age in Stanley
The median household income in Stanley is $0, with the highest median household income of $45,625 found in the 65+ years age bracket for the primary householder. A total of 13 households (32.5%) fall into this category.
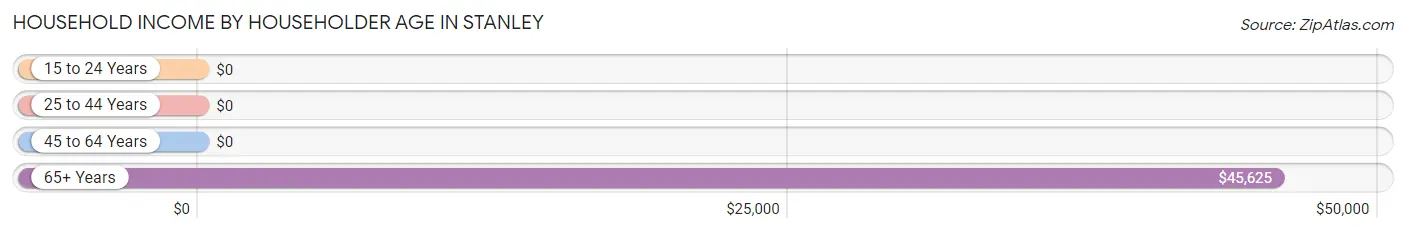
| Income Bracket | # Households | Median Income |
| 15 to 24 Years | 0 (0.0%) | $0 |
| 25 to 44 Years | 8 (20.0%) | $0 |
| 45 to 64 Years | 19 (47.5%) | $0 |
| 65+ Years | 13 (32.5%) | $45,625 |
| Total | 40 (100.0%) | $0 |
Poverty in Stanley
Income Below Poverty by Sex and Age in Stanley
With 46.8% poverty level for males and 31.8% for females among the residents of Stanley, under 5 year old males and 6 to 11 year old females are the most vulnerable to poverty, with 8 males (100.0%) and 4 females (100.0%) in their respective age groups living below the poverty level.
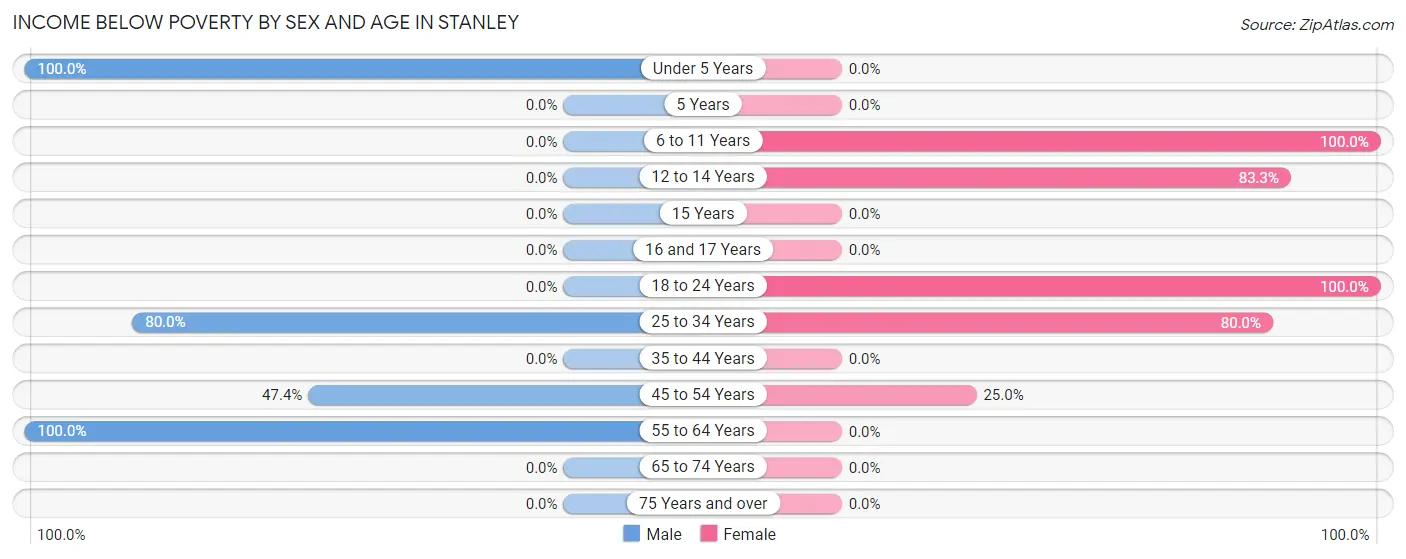
| Age Bracket | Male | Female |
| Under 5 Years | 8 (100.0%) | 0 (0.0%) |
| 5 Years | 0 (0.0%) | 0 (0.0%) |
| 6 to 11 Years | 0 (0.0%) | 4 (100.0%) |
| 12 to 14 Years | 0 (0.0%) | 5 (83.3%) |
| 15 Years | 0 (0.0%) | 0 (0.0%) |
| 16 and 17 Years | 0 (0.0%) | 0 (0.0%) |
| 18 to 24 Years | 0 (0.0%) | 1 (100.0%) |
| 25 to 34 Years | 4 (80.0%) | 8 (80.0%) |
| 35 to 44 Years | 0 (0.0%) | 0 (0.0%) |
| 45 to 54 Years | 9 (47.4%) | 2 (25.0%) |
| 55 to 64 Years | 1 (100.0%) | 0 (0.0%) |
| 65 to 74 Years | 0 (0.0%) | 0 (0.0%) |
| 75 Years and over | 0 (0.0%) | 0 (0.0%) |
| Total | 22 (46.8%) | 20 (31.8%) |
Income Above Poverty by Sex and Age in Stanley
According to the poverty statistics in Stanley, males aged 6 to 11 years and females aged 16 and 17 years are the age groups that are most secure financially, with 100.0% of males and 100.0% of females in these age groups living above the poverty line.
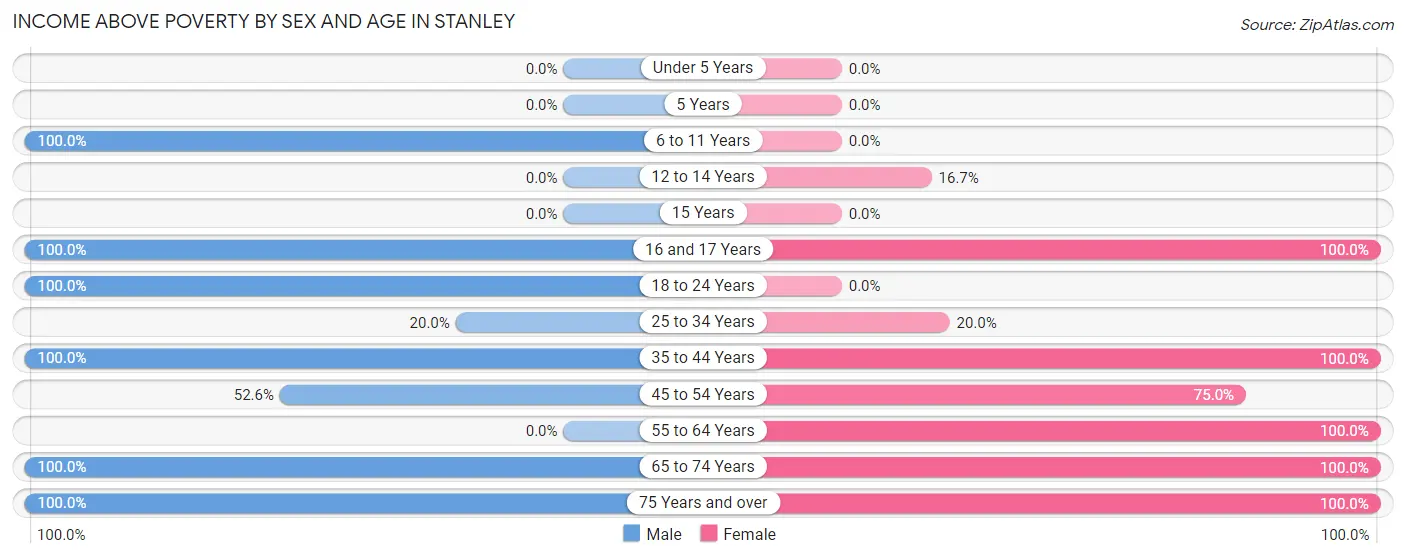
| Age Bracket | Male | Female |
| Under 5 Years | 0 (0.0%) | 0 (0.0%) |
| 5 Years | 0 (0.0%) | 0 (0.0%) |
| 6 to 11 Years | 2 (100.0%) | 0 (0.0%) |
| 12 to 14 Years | 0 (0.0%) | 1 (16.7%) |
| 15 Years | 0 (0.0%) | 0 (0.0%) |
| 16 and 17 Years | 1 (100.0%) | 9 (100.0%) |
| 18 to 24 Years | 3 (100.0%) | 0 (0.0%) |
| 25 to 34 Years | 1 (20.0%) | 2 (20.0%) |
| 35 to 44 Years | 3 (100.0%) | 9 (100.0%) |
| 45 to 54 Years | 10 (52.6%) | 6 (75.0%) |
| 55 to 64 Years | 0 (0.0%) | 3 (100.0%) |
| 65 to 74 Years | 2 (100.0%) | 5 (100.0%) |
| 75 Years and over | 3 (100.0%) | 8 (100.0%) |
| Total | 25 (53.2%) | 43 (68.2%) |
Income Below Poverty Among Married-Couple Families in Stanley
The poverty statistics for married-couple families in Stanley show that 25.0% or 4 of the total 16 families live below the poverty line. Families with 3 or 4 children have the highest poverty rate of 100.0%, comprising of 4 families. On the other hand, families with no children have the lowest poverty rate of 0.0%, which includes 0 families.
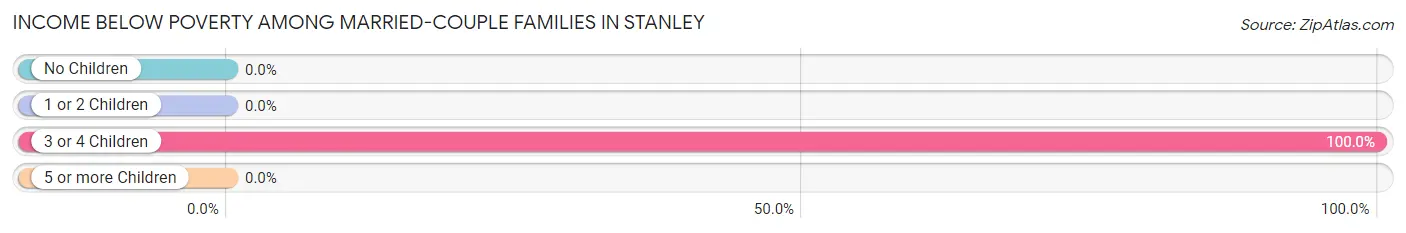
| Children | Above Poverty | Below Poverty |
| No Children | 5 (100.0%) | 0 (0.0%) |
| 1 or 2 Children | 7 (100.0%) | 0 (0.0%) |
| 3 or 4 Children | 0 (0.0%) | 4 (100.0%) |
| 5 or more Children | 0 (0.0%) | 0 (0.0%) |
| Total | 12 (75.0%) | 4 (25.0%) |
Income Below Poverty Among Single-Parent Households in Stanley
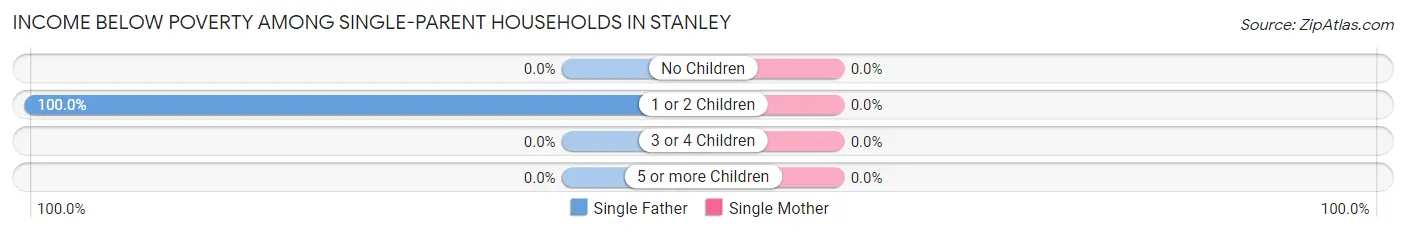
| Children | Single Father | Single Mother |
| No Children | 0 (0.0%) | 0 (0.0%) |
| 1 or 2 Children | 9 (100.0%) | 0 (0.0%) |
| 3 or 4 Children | 0 (0.0%) | 0 (0.0%) |
| 5 or more Children | 0 (0.0%) | 0 (0.0%) |
| Total | 9 (100.0%) | 0 (0.0%) |
Income Below Poverty Among Married-Couple vs Single-Parent Households in Stanley
The poverty data for Stanley shows that 4 of the married-couple family households (25.0%) and 9 of the single-parent households (90.0%) are living below the poverty level. Within the married-couple family households, those with 3 or 4 children have the highest poverty rate, with 4 households (100.0%) falling below the poverty line. Among the single-parent households, those with 1 or 2 children have the highest poverty rate, with 9 household (90.0%) living below poverty.
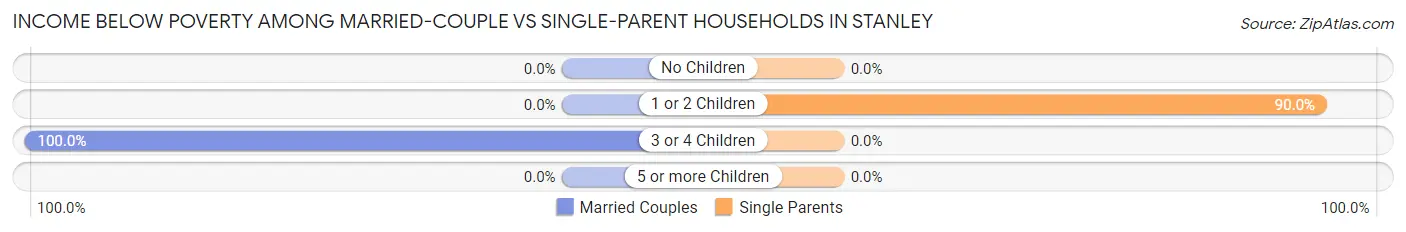
| Children | Married-Couple Families | Single-Parent Households |
| No Children | 0 (0.0%) | 0 (0.0%) |
| 1 or 2 Children | 0 (0.0%) | 9 (90.0%) |
| 3 or 4 Children | 4 (100.0%) | 0 (0.0%) |
| 5 or more Children | 0 (0.0%) | 0 (0.0%) |
| Total | 4 (25.0%) | 9 (90.0%) |
Race in Stanley
The most populous races in Stanley are White / Caucasian (101 | 91.8%), Hispanic or Latino (18 | 16.4%), and Two or more Races (9 | 8.2%).
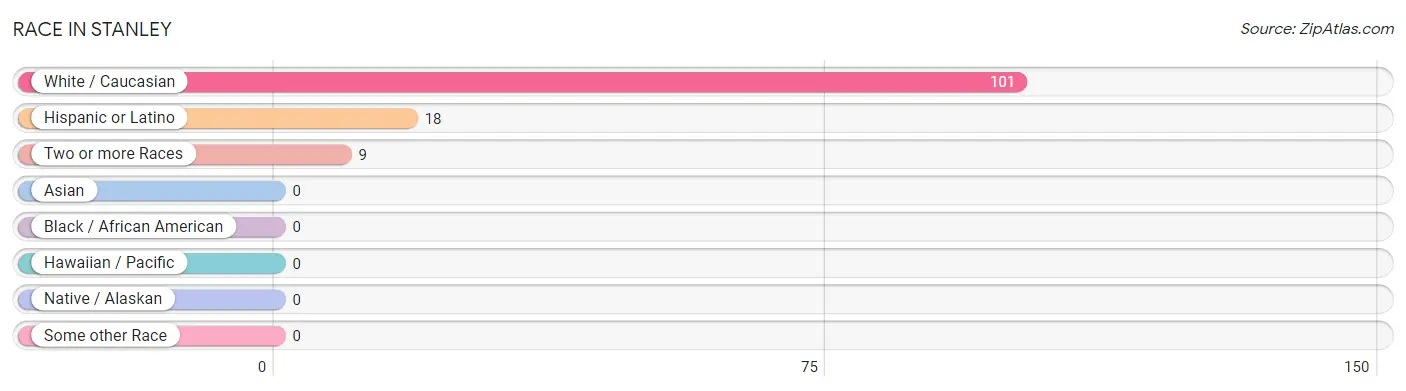
| Race | # Population | % Population |
| Asian | 0 | 0.0% |
| Black / African American | 0 | 0.0% |
| Hawaiian / Pacific | 0 | 0.0% |
| Hispanic or Latino | 18 | 16.4% |
| Native / Alaskan | 0 | 0.0% |
| White / Caucasian | 101 | 91.8% |
| Two or more Races | 9 | 8.2% |
| Some other Race | 0 | 0.0% |
| Total | 110 | 100.0% |
Ancestry in Stanley
The most populous ancestries reported in Stanley are Irish (35 | 31.8%), English (16 | 14.5%), Spanish (12 | 10.9%), Dutch (7 | 6.4%), and Mexican (6 | 5.4%), together accounting for 69.1% of all Stanley residents.
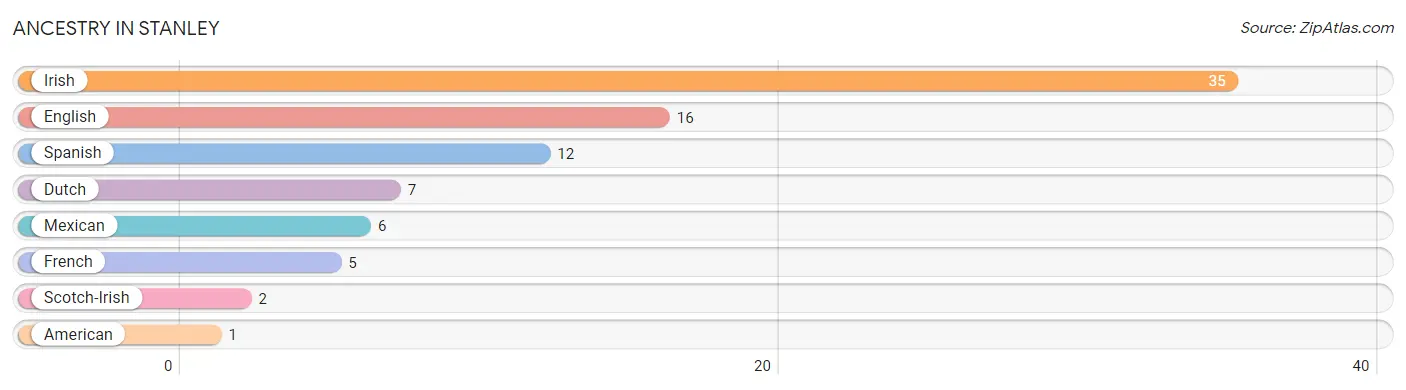
| Ancestry | # Population | % Population |
| American | 1 | 0.9% |
| Dutch | 7 | 6.4% |
| English | 16 | 14.5% |
| French | 5 | 4.5% |
| Irish | 35 | 31.8% |
| Mexican | 6 | 5.4% |
| Scotch-Irish | 2 | 1.8% |
| Spanish | 12 | 10.9% | View All 8 Rows |
Immigrants in Stanley

| Immigration Origin | # Population | % Population | View All 0 Rows |
Sex and Age in Stanley
Sex and Age in Stanley
The most populous age groups in Stanley are 50 to 54 Years (10 | 21.3%) for men and 30 to 34 Years (10 | 15.9%) for women.
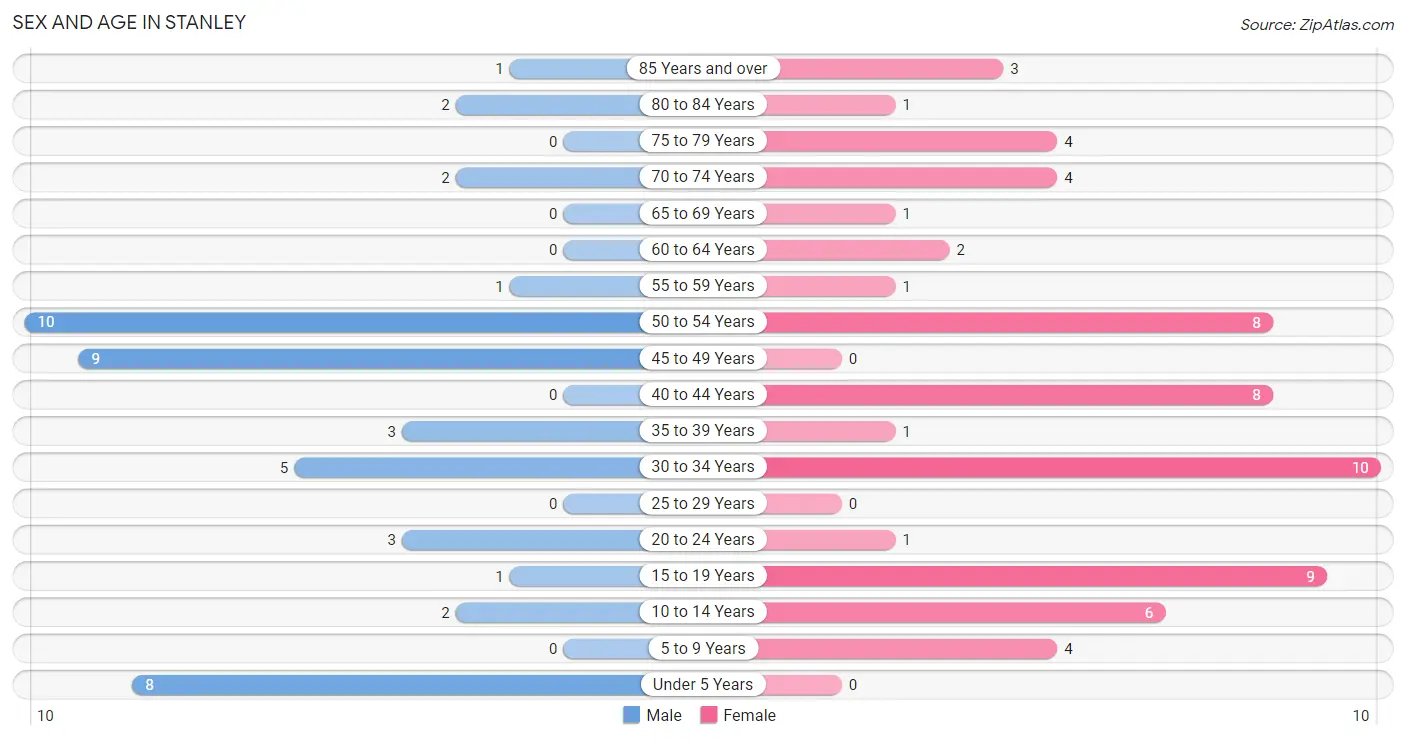
| Age Bracket | Male | Female |
| Under 5 Years | 8 (17.0%) | 0 (0.0%) |
| 5 to 9 Years | 0 (0.0%) | 4 (6.4%) |
| 10 to 14 Years | 2 (4.3%) | 6 (9.5%) |
| 15 to 19 Years | 1 (2.1%) | 9 (14.3%) |
| 20 to 24 Years | 3 (6.4%) | 1 (1.6%) |
| 25 to 29 Years | 0 (0.0%) | 0 (0.0%) |
| 30 to 34 Years | 5 (10.6%) | 10 (15.9%) |
| 35 to 39 Years | 3 (6.4%) | 1 (1.6%) |
| 40 to 44 Years | 0 (0.0%) | 8 (12.7%) |
| 45 to 49 Years | 9 (19.2%) | 0 (0.0%) |
| 50 to 54 Years | 10 (21.3%) | 8 (12.7%) |
| 55 to 59 Years | 1 (2.1%) | 1 (1.6%) |
| 60 to 64 Years | 0 (0.0%) | 2 (3.2%) |
| 65 to 69 Years | 0 (0.0%) | 1 (1.6%) |
| 70 to 74 Years | 2 (4.3%) | 4 (6.4%) |
| 75 to 79 Years | 0 (0.0%) | 4 (6.4%) |
| 80 to 84 Years | 2 (4.3%) | 1 (1.6%) |
| 85 Years and over | 1 (2.1%) | 3 (4.8%) |
| Total | 47 (100.0%) | 63 (100.0%) |
Families and Households in Stanley
Median Family Size in Stanley
The median family size in Stanley is 3.12 persons per family, with single female/mother families (1 | 3.8%) accounting for the largest median family size of 4 persons per family. On the other hand, single male/father families (9 | 34.6%) represent the smallest median family size with 1.56 persons per family.
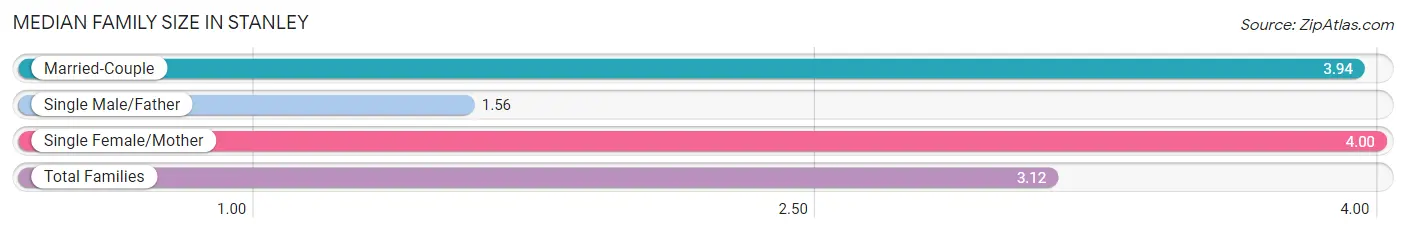
| Family Type | # Families | Family Size |
| Married-Couple | 16 (61.5%) | 3.94 |
| Single Male/Father | 9 (34.6%) | 1.56 |
| Single Female/Mother | 1 (3.8%) | 4.00 |
| Total Families | 26 (100.0%) | 3.12 |
Median Household Size in Stanley
The median household size in Stanley is 2.75 persons per household, with single female/mother households (1 | 2.5%) accounting for the largest median household size of 5 persons per household. non-family households (14 | 35.0%) represent the smallest median household size with 1.64 persons per household.
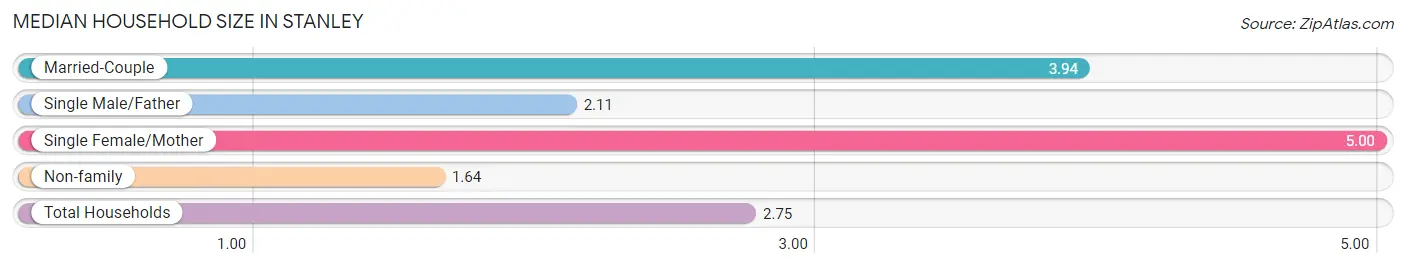
| Household Type | # Households | Household Size |
| Married-Couple | 16 (40.0%) | 3.94 |
| Single Male/Father | 9 (22.5%) | 2.11 |
| Single Female/Mother | 1 (2.5%) | 5.00 |
| Non-family | 14 (35.0%) | 1.64 |
| Total Households | 40 (100.0%) | 2.75 |
Household Size by Marriage Status in Stanley
Out of a total of 40 households in Stanley, 26 (65.0%) are family households, while 14 (35.0%) are nonfamily households. The most numerous type of family households are 3-person households, comprising 15, and the most common type of nonfamily households are 1-person households, comprising 10.
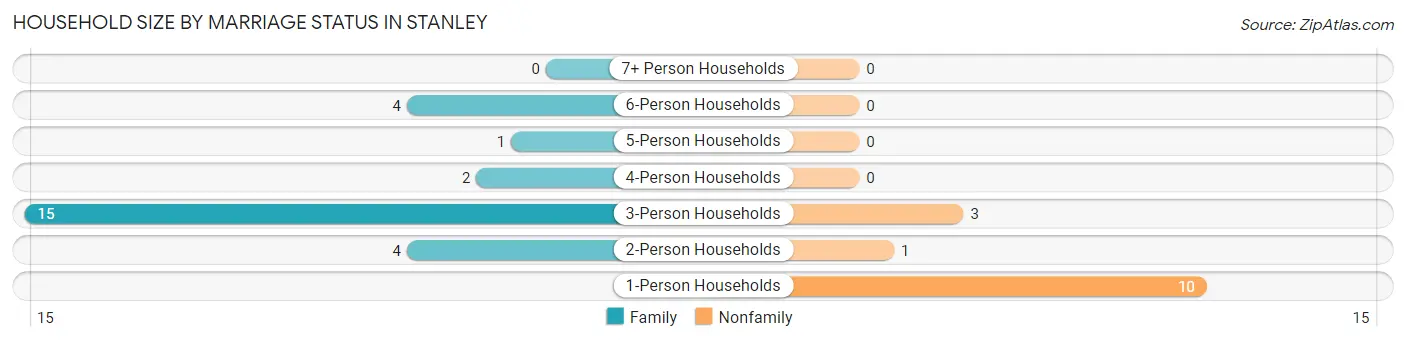
| Household Size | Family Households | Nonfamily Households |
| 1-Person Households | - | 10 (25.0%) |
| 2-Person Households | 4 (10.0%) | 1 (2.5%) |
| 3-Person Households | 15 (37.5%) | 3 (7.5%) |
| 4-Person Households | 2 (5.0%) | 0 (0.0%) |
| 5-Person Households | 1 (2.5%) | 0 (0.0%) |
| 6-Person Households | 4 (10.0%) | 0 (0.0%) |
| 7+ Person Households | 0 (0.0%) | 0 (0.0%) |
| Total | 26 (65.0%) | 14 (35.0%) |
Female Fertility in Stanley
Fertility by Age in Stanley
Average fertility rate in Stanley is 34.0 births per 1,000 women. Women in the age bracket of 20 to 34 years have the highest fertility rate with 91.0 births per 1,000 women. Women in the age bracket of 20 to 34 years acount for 100.0% of all women with births.
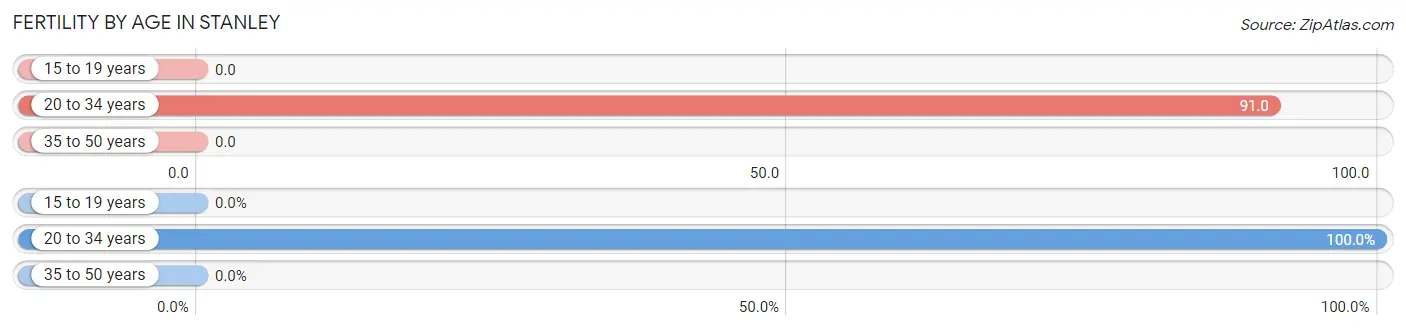
| Age Bracket | Women with Births | Births / 1,000 Women |
| 15 to 19 years | 0 (0.0%) | 0.0 |
| 20 to 34 years | 1 (100.0%) | 91.0 |
| 35 to 50 years | 0 (0.0%) | 0.0 |
| Total | 1 (100.0%) | 34.0 |
Fertility by Age by Marriage Status in Stanley
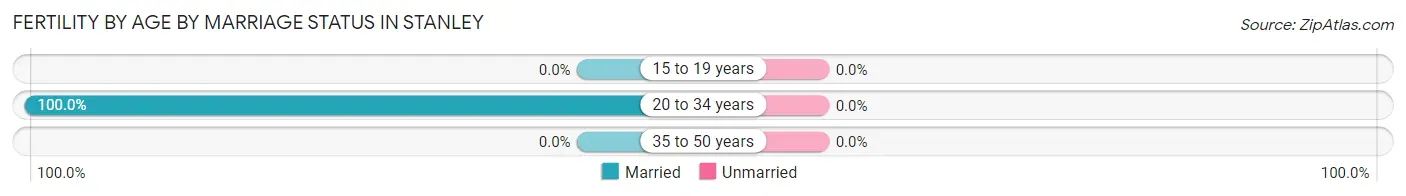
| Age Bracket | Married | Unmarried |
| 15 to 19 years | 0 (0.0%) | 0 (0.0%) |
| 20 to 34 years | 1 (100.0%) | 0 (0.0%) |
| 35 to 50 years | 0 (0.0%) | 0 (0.0%) |
| Total | 1 (100.0%) | 0 (0.0%) |
Fertility by Education in Stanley
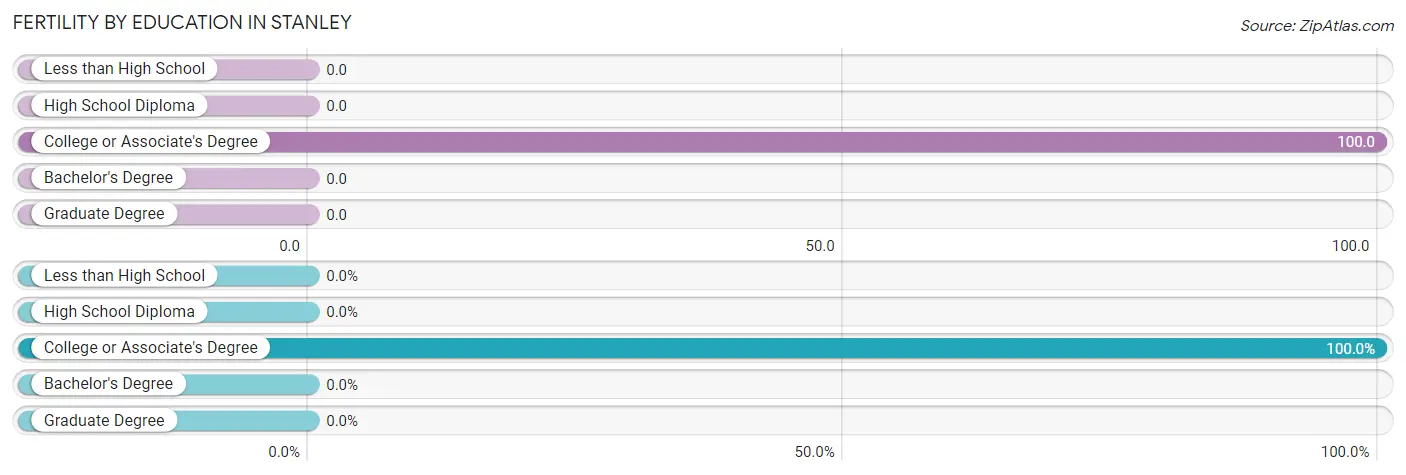
| Educational Attainment | Women with Births | Births / 1,000 Women |
| Less than High School | 0 (0.0%) | 0.0 |
| High School Diploma | 0 (0.0%) | 0.0 |
| College or Associate's Degree | 1 (100.0%) | 100.0 |
| Bachelor's Degree | 0 (0.0%) | 0.0 |
| Graduate Degree | 0 (0.0%) | 0.0 |
| Total | 1 (100.0%) | 34.0 |
Fertility by Education by Marriage Status in Stanley
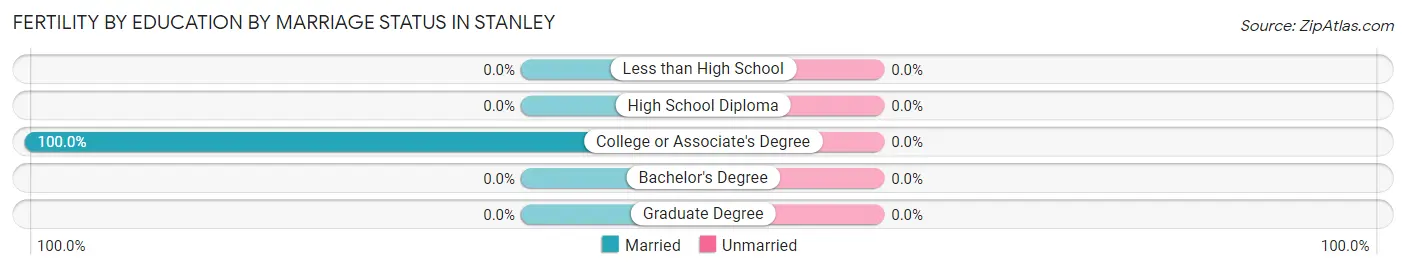
| Educational Attainment | Married | Unmarried |
| Less than High School | 0 (0.0%) | 0 (0.0%) |
| High School Diploma | 0 (0.0%) | 0 (0.0%) |
| College or Associate's Degree | 1 (100.0%) | 0 (0.0%) |
| Bachelor's Degree | 0 (0.0%) | 0 (0.0%) |
| Graduate Degree | 0 (0.0%) | 0 (0.0%) |
| Total | 1 (100.0%) | 0 (0.0%) |
Employment Characteristics in Stanley
Employment by Class of Employer in Stanley
Among the 46 employed individuals in Stanley, private company employees (30 | 65.2%), not-for-profit organizations (7 | 15.2%), and federal government employees (6 | 13.0%) make up the most common classes of employment.
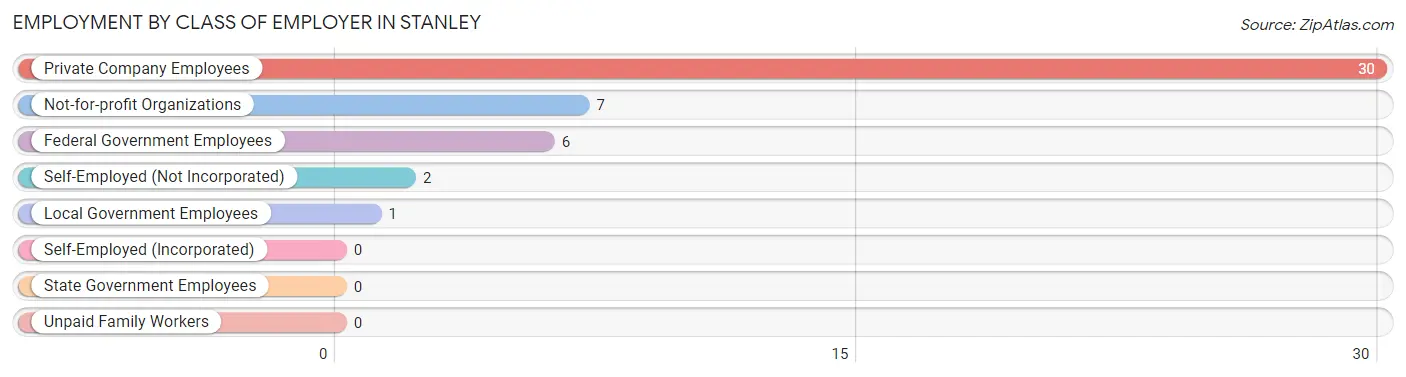
| Employer Class | # Employees | % Employees |
| Private Company Employees | 30 | 65.2% |
| Self-Employed (Incorporated) | 0 | 0.0% |
| Self-Employed (Not Incorporated) | 2 | 4.3% |
| Not-for-profit Organizations | 7 | 15.2% |
| Local Government Employees | 1 | 2.2% |
| State Government Employees | 0 | 0.0% |
| Federal Government Employees | 6 | 13.0% |
| Unpaid Family Workers | 0 | 0.0% |
| Total | 46 | 100.0% |
Employment Status by Age in Stanley
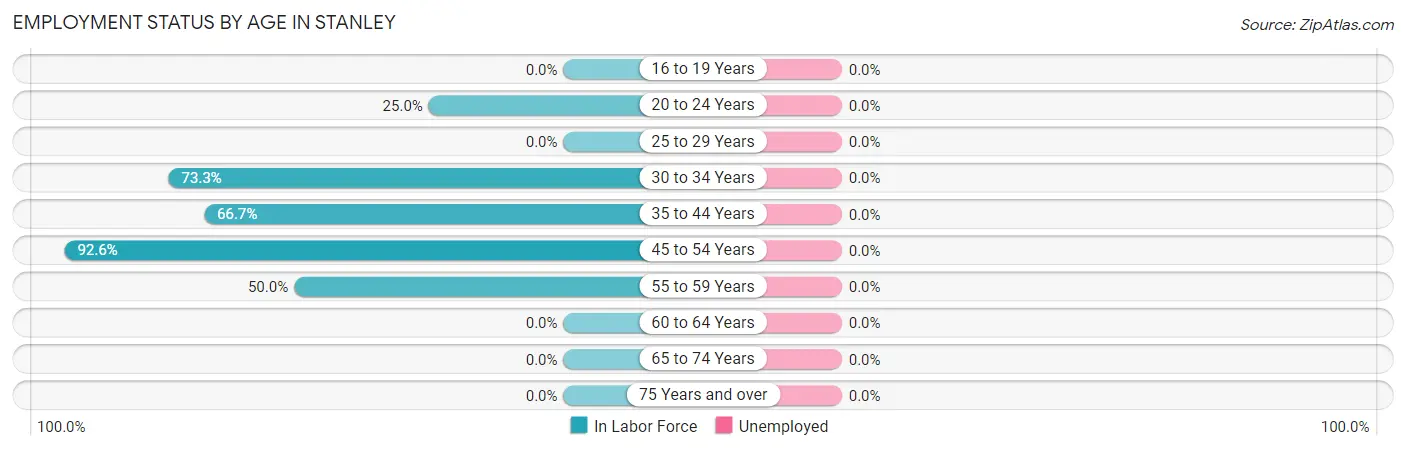
| Age Bracket | In Labor Force | Unemployed |
| 16 to 19 Years | 0 (0.0%) | 0 (0.0%) |
| 20 to 24 Years | 1 (25.0%) | 0 (0.0%) |
| 25 to 29 Years | 0 (0.0%) | 0 (0.0%) |
| 30 to 34 Years | 11 (73.3%) | 0 (0.0%) |
| 35 to 44 Years | 8 (66.7%) | 0 (0.0%) |
| 45 to 54 Years | 25 (92.6%) | 0 (0.0%) |
| 55 to 59 Years | 1 (50.0%) | 0 (0.0%) |
| 60 to 64 Years | 0 (0.0%) | 0 (0.0%) |
| 65 to 74 Years | 0 (0.0%) | 0 (0.0%) |
| 75 Years and over | 0 (0.0%) | 0 (0.0%) |
| Total | 46 (51.1%) | 0 (0.0%) |
Employment Status by Educational Attainment in Stanley
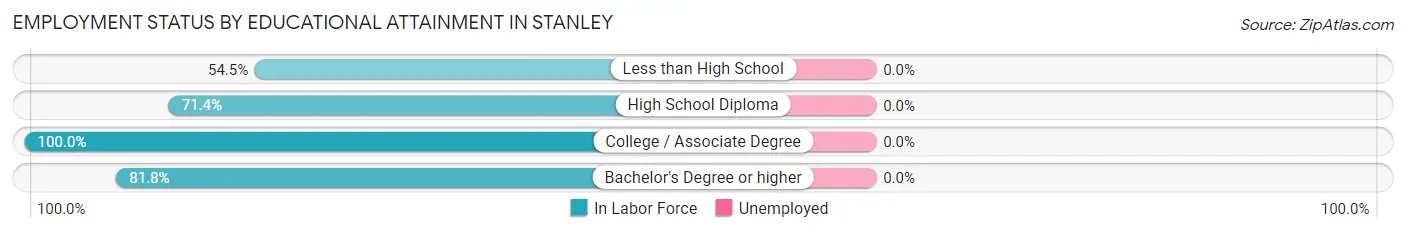
| Educational Attainment | In Labor Force | Unemployed |
| Less than High School | 6 (54.5%) | 0 (0.0%) |
| High School Diploma | 15 (71.4%) | 0 (0.0%) |
| College / Associate Degree | 15 (100.0%) | 0 (0.0%) |
| Bachelor's Degree or higher | 9 (81.8%) | 0 (0.0%) |
| Total | 45 (77.6%) | 0 (0.0%) |
Employment Occupations by Sex in Stanley
Management, Business, Science and Arts Occupations
The most common Management, Business, Science and Arts occupations in Stanley are Community & Social Service (9 | 19.6%), Education Instruction & Library (7 | 15.2%), Health Diagnosing & Treating (7 | 15.2%), Computers, Engineering & Science (6 | 13.0%), and Life, Physical & Social Science (6 | 13.0%).
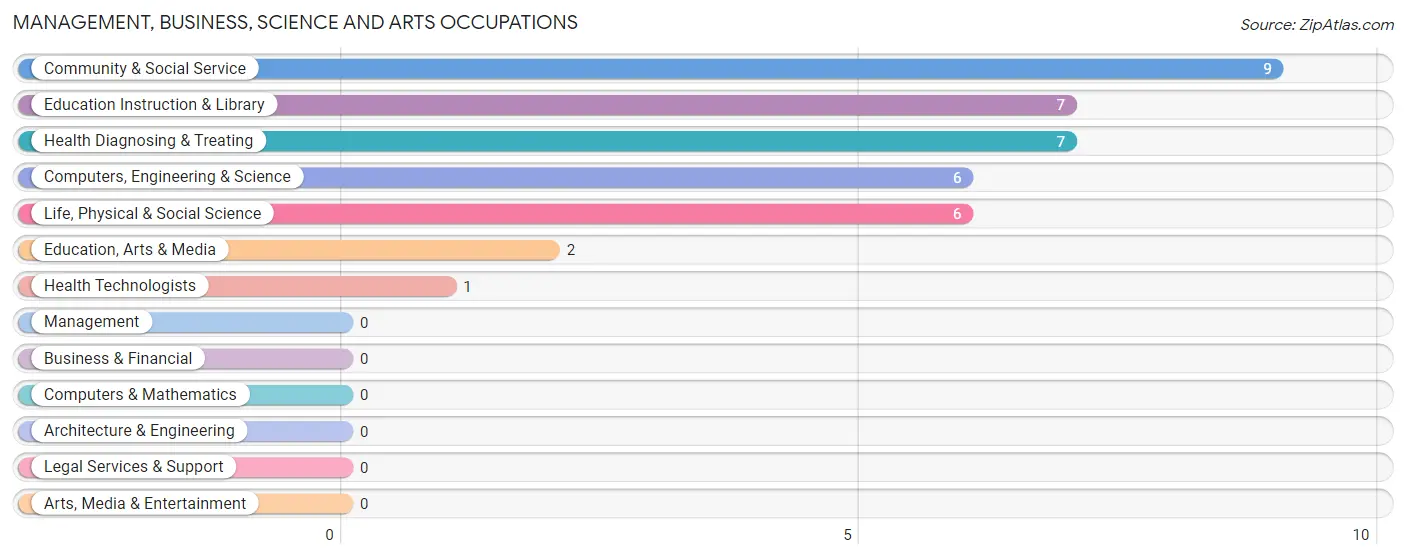
Management, Business, Science and Arts Occupations by Sex
Within the Management, Business, Science and Arts occupations in Stanley, the most male-oriented occupations are Health Technologists (100.0%), Computers, Engineering & Science (83.3%), and Life, Physical & Social Science (83.3%), while the most female-oriented occupations are Community & Social Service (100.0%), Education, Arts & Media (100.0%), and Education Instruction & Library (100.0%).
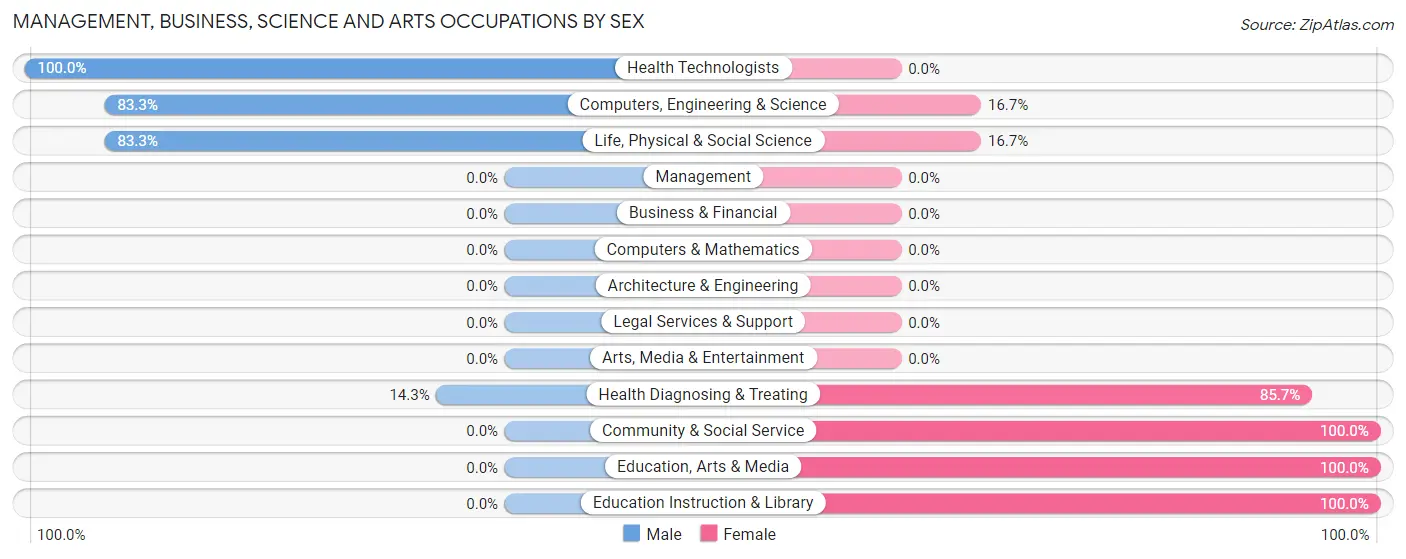
| Occupation | Male | Female |
| Management | 0 (0.0%) | 0 (0.0%) |
| Business & Financial | 0 (0.0%) | 0 (0.0%) |
| Computers, Engineering & Science | 5 (83.3%) | 1 (16.7%) |
| Computers & Mathematics | 0 (0.0%) | 0 (0.0%) |
| Architecture & Engineering | 0 (0.0%) | 0 (0.0%) |
| Life, Physical & Social Science | 5 (83.3%) | 1 (16.7%) |
| Community & Social Service | 0 (0.0%) | 9 (100.0%) |
| Education, Arts & Media | 0 (0.0%) | 2 (100.0%) |
| Legal Services & Support | 0 (0.0%) | 0 (0.0%) |
| Education Instruction & Library | 0 (0.0%) | 7 (100.0%) |
| Arts, Media & Entertainment | 0 (0.0%) | 0 (0.0%) |
| Health Diagnosing & Treating | 1 (14.3%) | 6 (85.7%) |
| Health Technologists | 1 (100.0%) | 0 (0.0%) |
| Total (Category) | 6 (27.3%) | 16 (72.7%) |
| Total (Overall) | 18 (39.1%) | 28 (60.9%) |
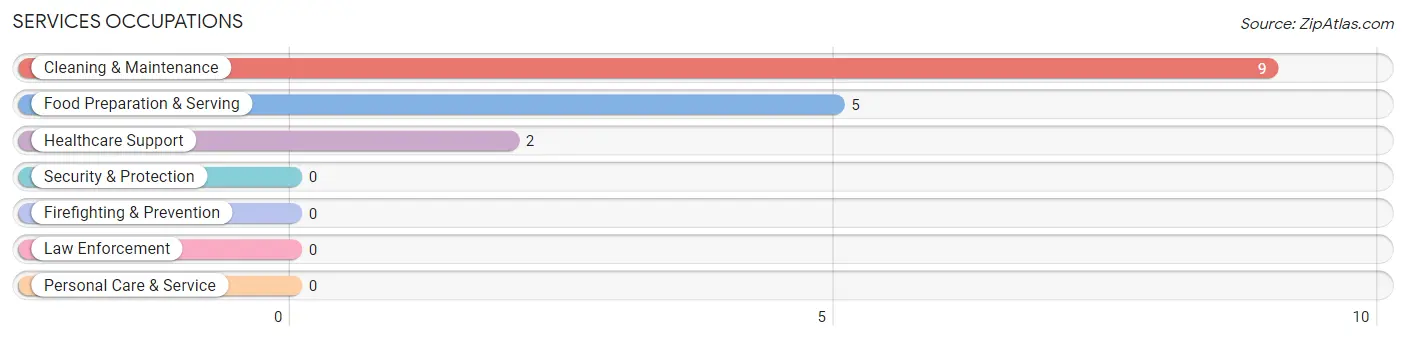
Services Occupations
The most common Services occupations in Stanley are Cleaning & Maintenance (9 | 19.6%), Food Preparation & Serving (5 | 10.9%), and Healthcare Support (2 | 4.3%).
Services Occupations by Sex
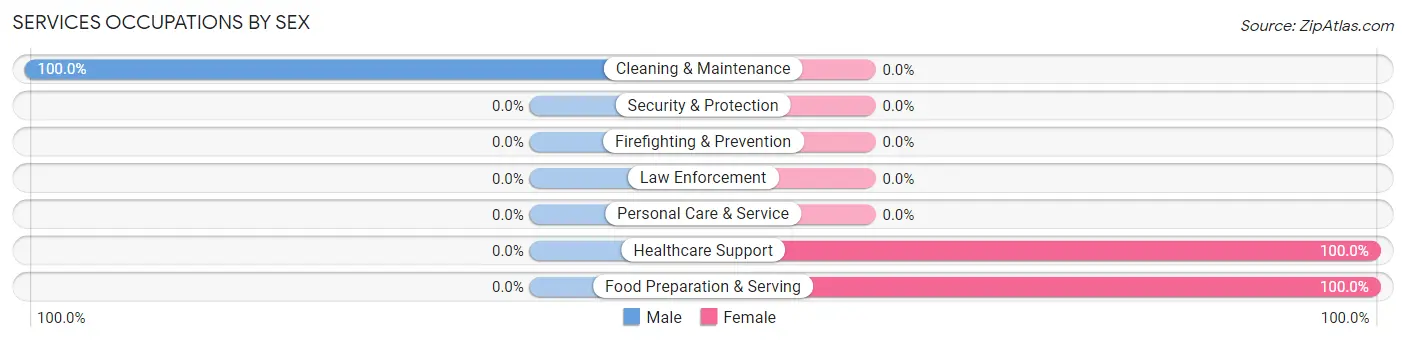
| Occupation | Male | Female |
| Healthcare Support | 0 (0.0%) | 2 (100.0%) |
| Security & Protection | 0 (0.0%) | 0 (0.0%) |
| Firefighting & Prevention | 0 (0.0%) | 0 (0.0%) |
| Law Enforcement | 0 (0.0%) | 0 (0.0%) |
| Food Preparation & Serving | 0 (0.0%) | 5 (100.0%) |
| Cleaning & Maintenance | 9 (100.0%) | 0 (0.0%) |
| Personal Care & Service | 0 (0.0%) | 0 (0.0%) |
| Total (Category) | 9 (56.2%) | 7 (43.8%) |
| Total (Overall) | 18 (39.1%) | 28 (60.9%) |
Sales and Office Occupations
The most common Sales and Office occupations in Stanley are Sales & Related (1 | 2.2%), and Office & Administration (1 | 2.2%).
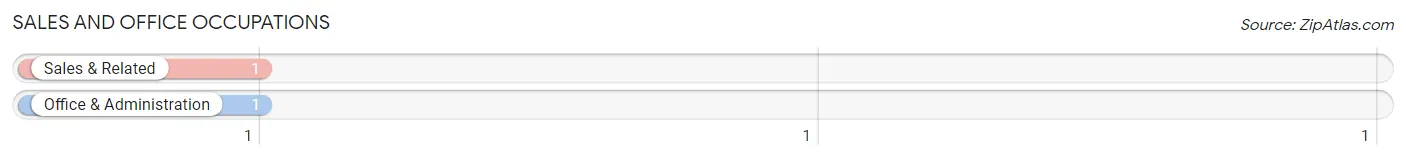
Sales and Office Occupations by Sex
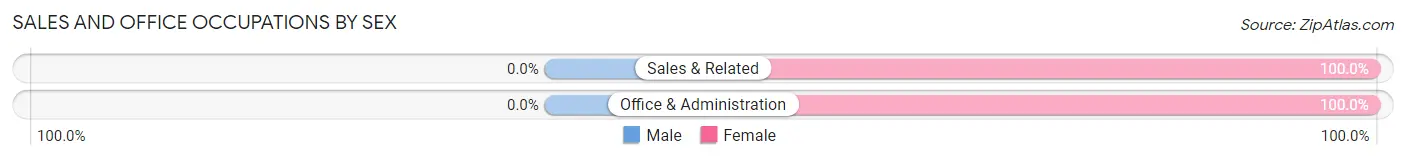
| Occupation | Male | Female |
| Sales & Related | 0 (0.0%) | 1 (100.0%) |
| Office & Administration | 0 (0.0%) | 1 (100.0%) |
| Total (Category) | 0 (0.0%) | 2 (100.0%) |
| Total (Overall) | 18 (39.1%) | 28 (60.9%) |
Natural Resources, Construction and Maintenance Occupations
The most common Natural Resources, Construction and Maintenance occupations in Stanley are Construction & Extraction (2 | 4.3%), and Installation, Maintenance & Repair (1 | 2.2%).
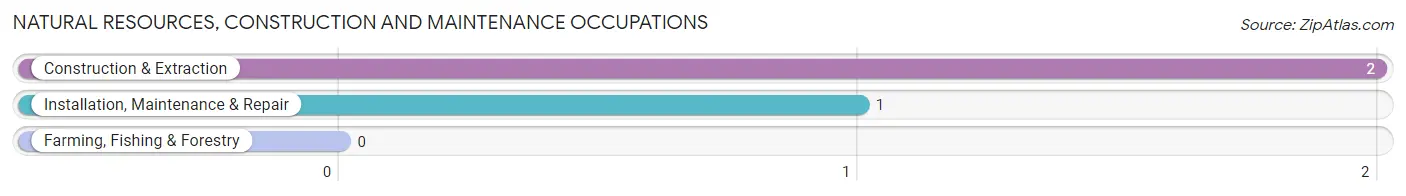
Natural Resources, Construction and Maintenance Occupations by Sex
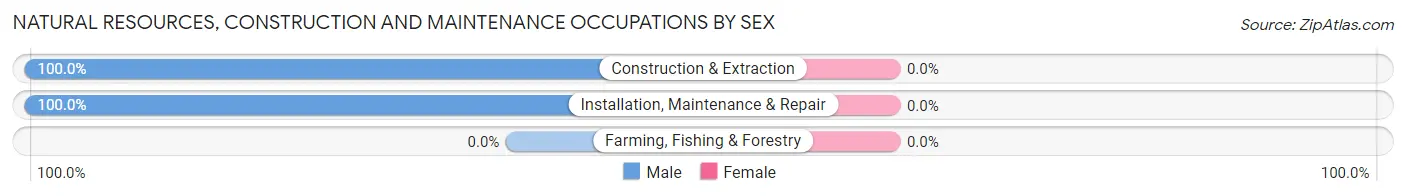
| Occupation | Male | Female |
| Farming, Fishing & Forestry | 0 (0.0%) | 0 (0.0%) |
| Construction & Extraction | 2 (100.0%) | 0 (0.0%) |
| Installation, Maintenance & Repair | 1 (100.0%) | 0 (0.0%) |
| Total (Category) | 3 (100.0%) | 0 (0.0%) |
| Total (Overall) | 18 (39.1%) | 28 (60.9%) |
Production, Transportation and Moving Occupations
The most common Production, Transportation and Moving occupations in Stanley are , and Transportation (3 | 6.5%).
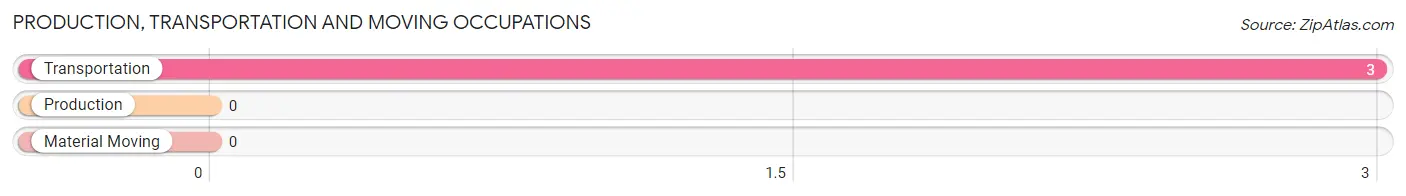
Production, Transportation and Moving Occupations by Sex
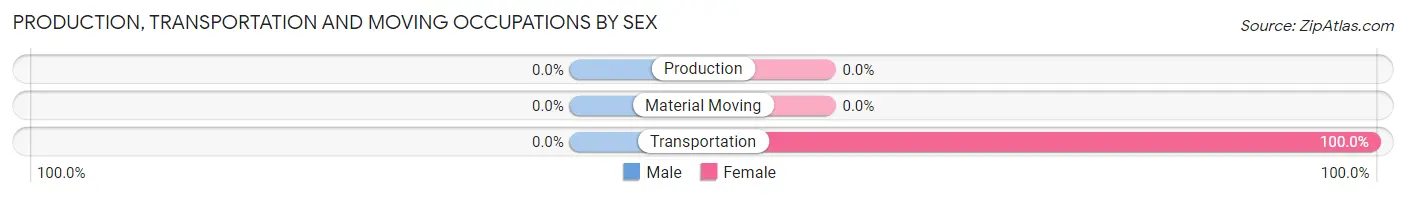
| Occupation | Male | Female |
| Production | 0 (0.0%) | 0 (0.0%) |
| Transportation | 0 (0.0%) | 3 (100.0%) |
| Material Moving | 0 (0.0%) | 0 (0.0%) |
| Total (Category) | 0 (0.0%) | 3 (100.0%) |
| Total (Overall) | 18 (39.1%) | 28 (60.9%) |
Employment Industries by Sex in Stanley
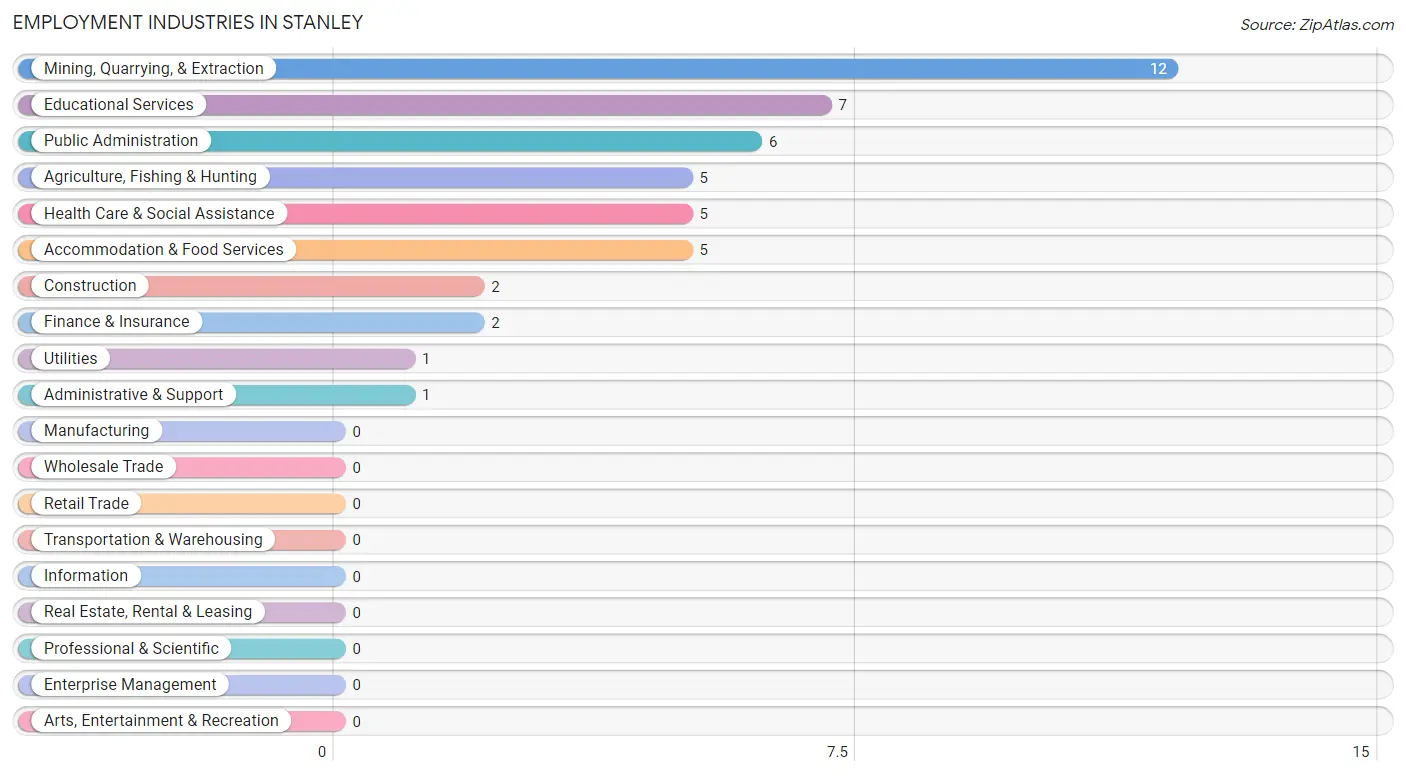
Employment Industries in Stanley
The major employment industries in Stanley include Mining, Quarrying, & Extraction (12 | 26.1%), Educational Services (7 | 15.2%), Public Administration (6 | 13.0%), Agriculture, Fishing & Hunting (5 | 10.9%), and Health Care & Social Assistance (5 | 10.9%).
Employment Industries by Sex in Stanley
The Stanley industries that see more men than women are Agriculture, Fishing & Hunting (100.0%), Construction (100.0%), and Utilities (100.0%), whereas the industries that tend to have a higher number of women are Finance & Insurance (100.0%), Administrative & Support (100.0%), and Educational Services (100.0%).
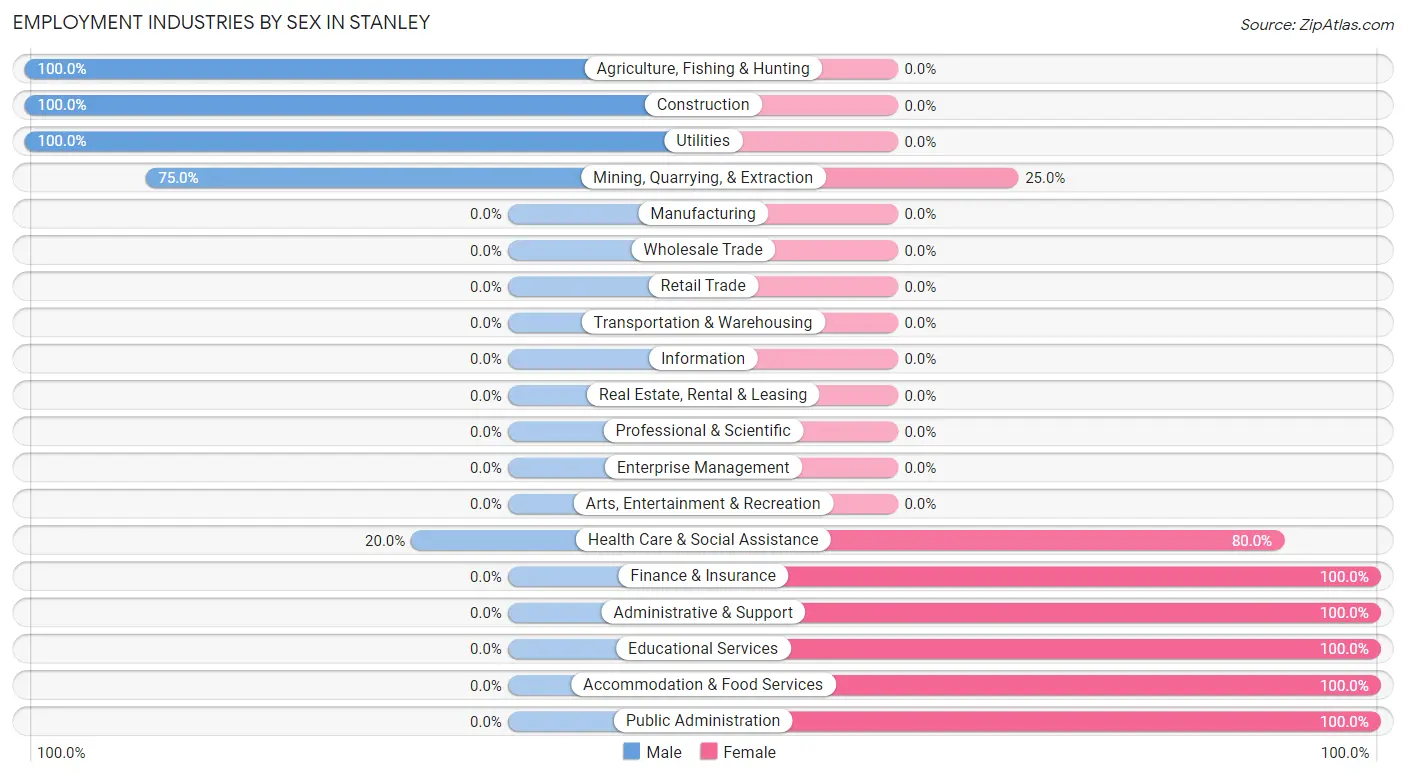
| Industry | Male | Female |
| Agriculture, Fishing & Hunting | 5 (100.0%) | 0 (0.0%) |
| Mining, Quarrying, & Extraction | 9 (75.0%) | 3 (25.0%) |
| Construction | 2 (100.0%) | 0 (0.0%) |
| Manufacturing | 0 (0.0%) | 0 (0.0%) |
| Wholesale Trade | 0 (0.0%) | 0 (0.0%) |
| Retail Trade | 0 (0.0%) | 0 (0.0%) |
| Transportation & Warehousing | 0 (0.0%) | 0 (0.0%) |
| Utilities | 1 (100.0%) | 0 (0.0%) |
| Information | 0 (0.0%) | 0 (0.0%) |
| Finance & Insurance | 0 (0.0%) | 2 (100.0%) |
| Real Estate, Rental & Leasing | 0 (0.0%) | 0 (0.0%) |
| Professional & Scientific | 0 (0.0%) | 0 (0.0%) |
| Enterprise Management | 0 (0.0%) | 0 (0.0%) |
| Administrative & Support | 0 (0.0%) | 1 (100.0%) |
| Educational Services | 0 (0.0%) | 7 (100.0%) |
| Health Care & Social Assistance | 1 (20.0%) | 4 (80.0%) |
| Arts, Entertainment & Recreation | 0 (0.0%) | 0 (0.0%) |
| Accommodation & Food Services | 0 (0.0%) | 5 (100.0%) |
| Public Administration | 0 (0.0%) | 6 (100.0%) |
| Total | 18 (39.1%) | 28 (60.9%) |
Education in Stanley
School Enrollment in Stanley
The most common levels of schooling among the 23 students in Stanley are high school (10 | 43.5%), middle school (8 | 34.8%), and elementary school (4 | 17.4%).
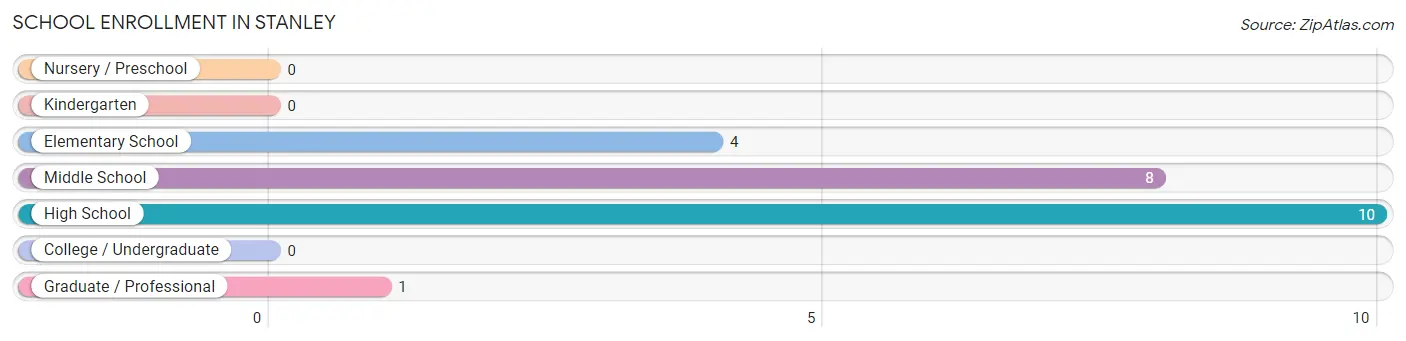
| School Level | # Students | % Students |
| Nursery / Preschool | 0 | 0.0% |
| Kindergarten | 0 | 0.0% |
| Elementary School | 4 | 17.4% |
| Middle School | 8 | 34.8% |
| High School | 10 | 43.5% |
| College / Undergraduate | 0 | 0.0% |
| Graduate / Professional | 1 | 4.3% |
| Total | 23 | 100.0% |
School Enrollment by Age by Funding Source in Stanley
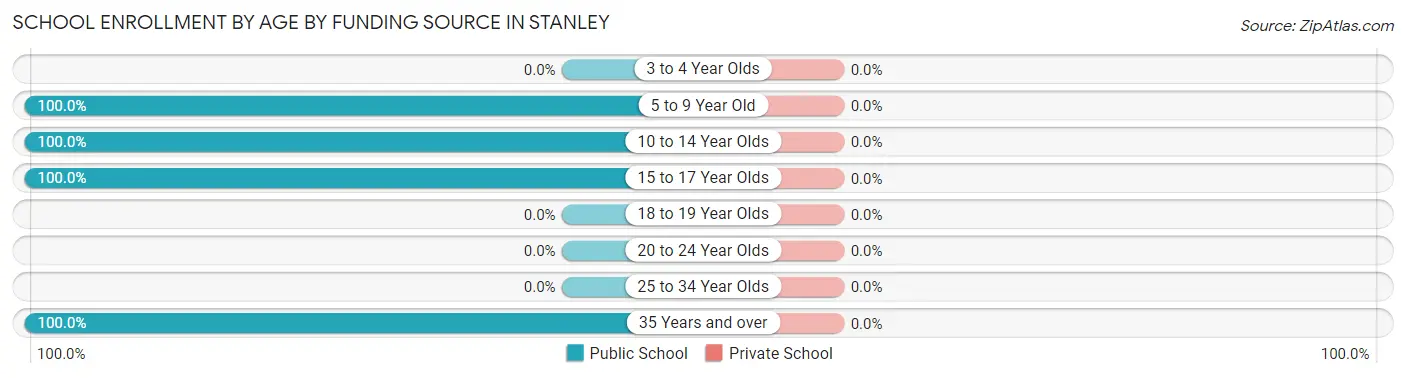
| Age Bracket | Public School | Private School |
| 3 to 4 Year Olds | 0 (0.0%) | 0 (0.0%) |
| 5 to 9 Year Old | 4 (100.0%) | 0 (0.0%) |
| 10 to 14 Year Olds | 8 (100.0%) | 0 (0.0%) |
| 15 to 17 Year Olds | 10 (100.0%) | 0 (0.0%) |
| 18 to 19 Year Olds | 0 (0.0%) | 0 (0.0%) |
| 20 to 24 Year Olds | 0 (0.0%) | 0 (0.0%) |
| 25 to 34 Year Olds | 0 (0.0%) | 0 (0.0%) |
| 35 Years and over | 1 (100.0%) | 0 (0.0%) |
| Total | 23 (100.0%) | 0 (0.0%) |
Educational Attainment by Field of Study in Stanley
Education (12 | 80.0%), liberal arts & history (2 | 13.3%), and communications (1 | 6.7%) are the most common fields of study among 15 individuals in Stanley who have obtained a bachelor's degree or higher.
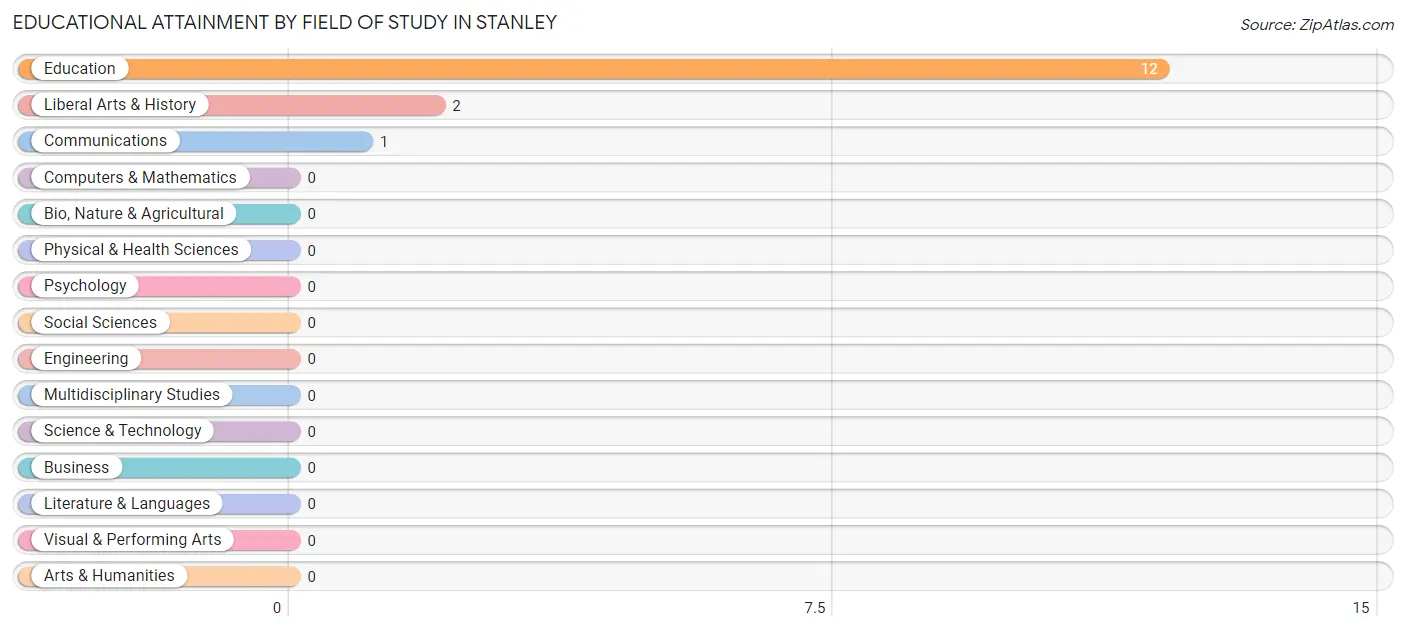
| Field of Study | # Graduates | % Graduates |
| Computers & Mathematics | 0 | 0.0% |
| Bio, Nature & Agricultural | 0 | 0.0% |
| Physical & Health Sciences | 0 | 0.0% |
| Psychology | 0 | 0.0% |
| Social Sciences | 0 | 0.0% |
| Engineering | 0 | 0.0% |
| Multidisciplinary Studies | 0 | 0.0% |
| Science & Technology | 0 | 0.0% |
| Business | 0 | 0.0% |
| Education | 12 | 80.0% |
| Literature & Languages | 0 | 0.0% |
| Liberal Arts & History | 2 | 13.3% |
| Visual & Performing Arts | 0 | 0.0% |
| Communications | 1 | 6.7% |
| Arts & Humanities | 0 | 0.0% |
| Total | 15 | 100.0% |
Transportation & Commute in Stanley
Vehicle Availability by Sex in Stanley
The most prevalent vehicle ownership categories in Stanley are males with 2 vehicles (9, accounting for 50.0%) and females with 2 vehicles (6, making up 32.1%).
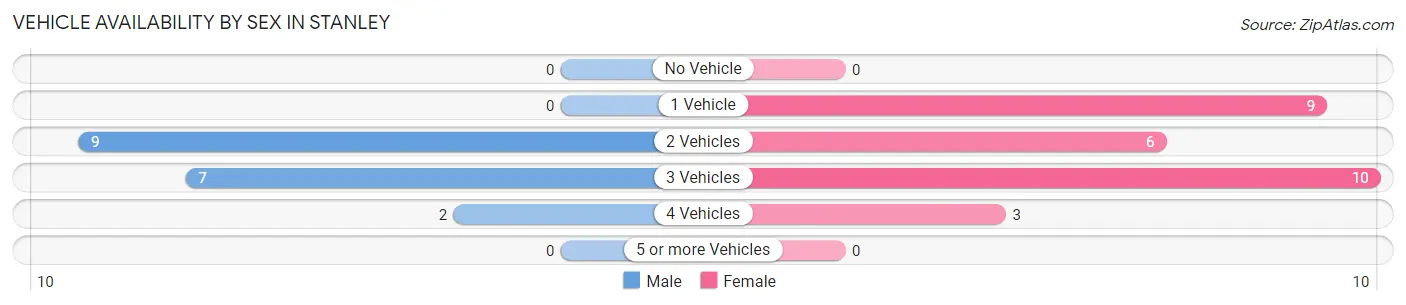
| Vehicles Available | Male | Female |
| No Vehicle | 0 (0.0%) | 0 (0.0%) |
| 1 Vehicle | 0 (0.0%) | 9 (32.1%) |
| 2 Vehicles | 9 (50.0%) | 6 (21.4%) |
| 3 Vehicles | 7 (38.9%) | 10 (35.7%) |
| 4 Vehicles | 2 (11.1%) | 3 (10.7%) |
| 5 or more Vehicles | 0 (0.0%) | 0 (0.0%) |
| Total | 18 (100.0%) | 28 (100.0%) |
Commute Time in Stanley
The most frequently occuring commute durations in Stanley are 5 to 9 minutes (15 commuters, 32.6%), 10 to 14 minutes (8 commuters, 17.4%), and 30 to 34 minutes (6 commuters, 13.0%).
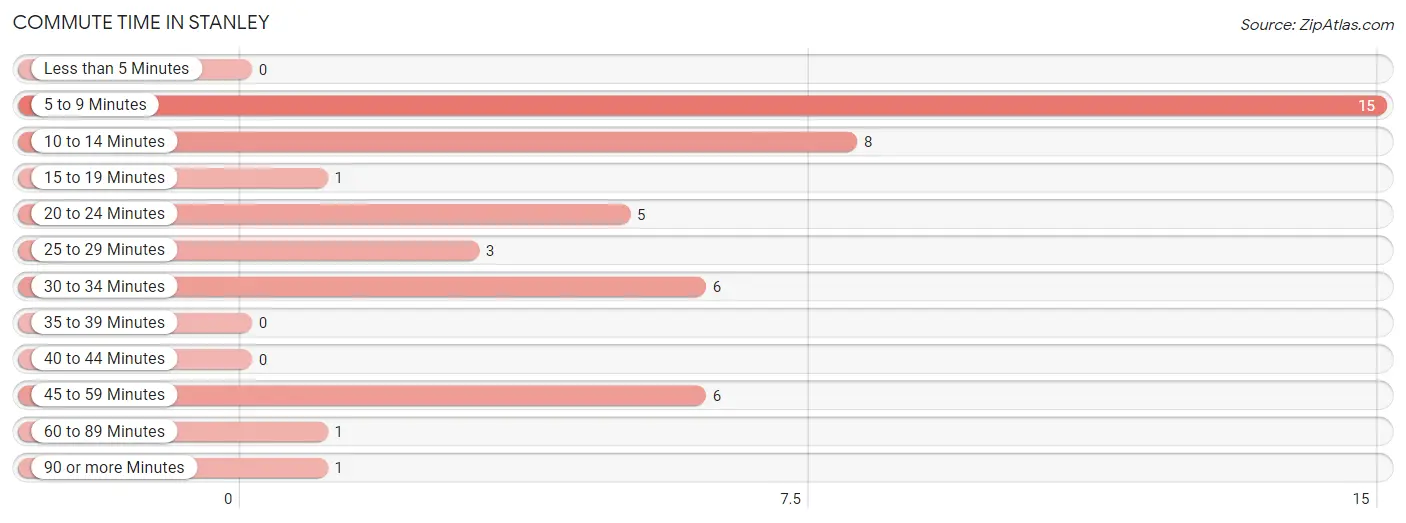
| Commute Time | # Commuters | % Commuters |
| Less than 5 Minutes | 0 | 0.0% |
| 5 to 9 Minutes | 15 | 32.6% |
| 10 to 14 Minutes | 8 | 17.4% |
| 15 to 19 Minutes | 1 | 2.2% |
| 20 to 24 Minutes | 5 | 10.9% |
| 25 to 29 Minutes | 3 | 6.5% |
| 30 to 34 Minutes | 6 | 13.0% |
| 35 to 39 Minutes | 0 | 0.0% |
| 40 to 44 Minutes | 0 | 0.0% |
| 45 to 59 Minutes | 6 | 13.0% |
| 60 to 89 Minutes | 1 | 2.2% |
| 90 or more Minutes | 1 | 2.2% |
Commute Time by Sex in Stanley
The most common commute times in Stanley are 5 to 9 minutes (9 commuters, 50.0%) for males and 10 to 14 minutes (8 commuters, 28.6%) for females.
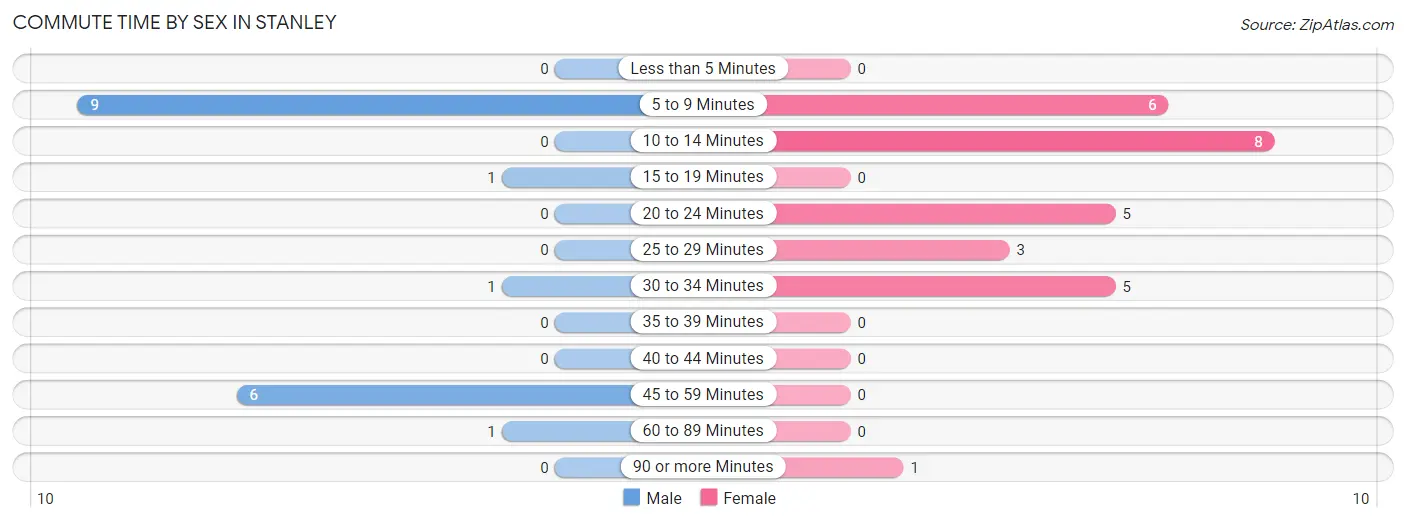
| Commute Time | Male | Female |
| Less than 5 Minutes | 0 (0.0%) | 0 (0.0%) |
| 5 to 9 Minutes | 9 (50.0%) | 6 (21.4%) |
| 10 to 14 Minutes | 0 (0.0%) | 8 (28.6%) |
| 15 to 19 Minutes | 1 (5.6%) | 0 (0.0%) |
| 20 to 24 Minutes | 0 (0.0%) | 5 (17.9%) |
| 25 to 29 Minutes | 0 (0.0%) | 3 (10.7%) |
| 30 to 34 Minutes | 1 (5.6%) | 5 (17.9%) |
| 35 to 39 Minutes | 0 (0.0%) | 0 (0.0%) |
| 40 to 44 Minutes | 0 (0.0%) | 0 (0.0%) |
| 45 to 59 Minutes | 6 (33.3%) | 0 (0.0%) |
| 60 to 89 Minutes | 1 (5.6%) | 0 (0.0%) |
| 90 or more Minutes | 0 (0.0%) | 1 (3.6%) |
Time of Departure to Work by Sex in Stanley
The most frequent times of departure to work in Stanley are 12:00 AM to 4:59 AM (10, 55.6%) for males and 7:00 AM to 7:29 AM (13, 46.4%) for females.
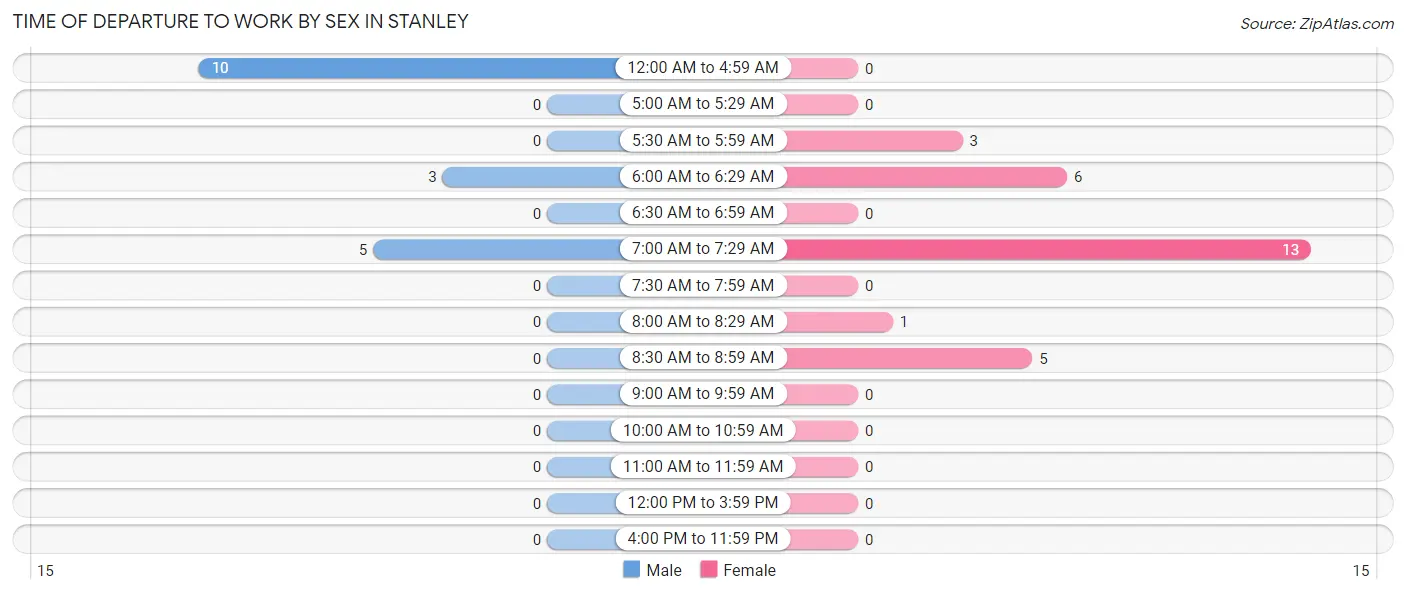
| Time of Departure | Male | Female |
| 12:00 AM to 4:59 AM | 10 (55.6%) | 0 (0.0%) |
| 5:00 AM to 5:29 AM | 0 (0.0%) | 0 (0.0%) |
| 5:30 AM to 5:59 AM | 0 (0.0%) | 3 (10.7%) |
| 6:00 AM to 6:29 AM | 3 (16.7%) | 6 (21.4%) |
| 6:30 AM to 6:59 AM | 0 (0.0%) | 0 (0.0%) |
| 7:00 AM to 7:29 AM | 5 (27.8%) | 13 (46.4%) |
| 7:30 AM to 7:59 AM | 0 (0.0%) | 0 (0.0%) |
| 8:00 AM to 8:29 AM | 0 (0.0%) | 1 (3.6%) |
| 8:30 AM to 8:59 AM | 0 (0.0%) | 5 (17.9%) |
| 9:00 AM to 9:59 AM | 0 (0.0%) | 0 (0.0%) |
| 10:00 AM to 10:59 AM | 0 (0.0%) | 0 (0.0%) |
| 11:00 AM to 11:59 AM | 0 (0.0%) | 0 (0.0%) |
| 12:00 PM to 3:59 PM | 0 (0.0%) | 0 (0.0%) |
| 4:00 PM to 11:59 PM | 0 (0.0%) | 0 (0.0%) |
| Total | 18 (100.0%) | 28 (100.0%) |
Housing Occupancy in Stanley
Occupancy by Ownership in Stanley
Of the total 40 dwellings in Stanley, owner-occupied units account for 28 (70.0%), while renter-occupied units make up 12 (30.0%).
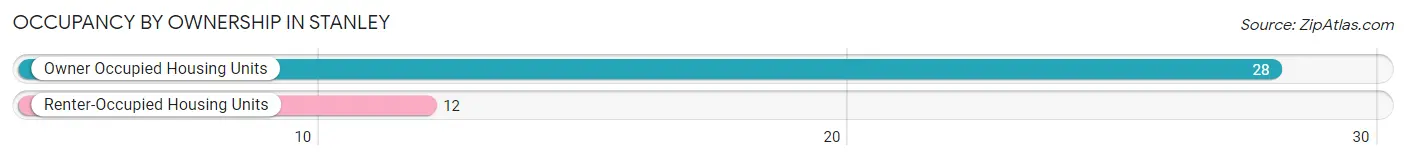
| Occupancy | # Housing Units | % Housing Units |
| Owner Occupied Housing Units | 28 | 70.0% |
| Renter-Occupied Housing Units | 12 | 30.0% |
| Total Occupied Housing Units | 40 | 100.0% |
Occupancy by Household Size in Stanley
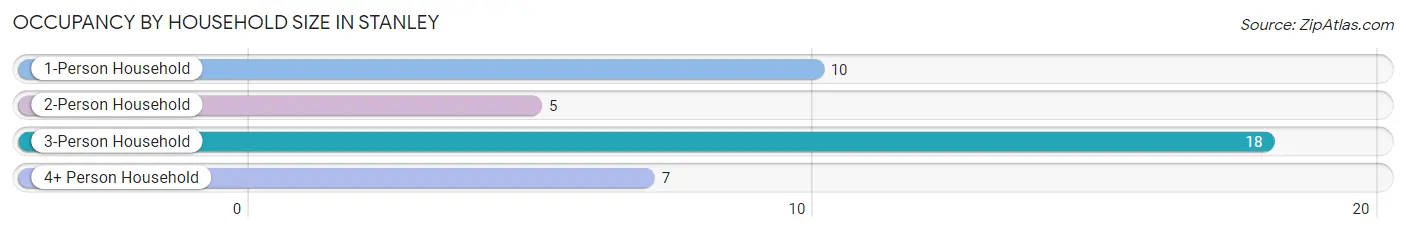
| Household Size | # Housing Units | % Housing Units |
| 1-Person Household | 10 | 25.0% |
| 2-Person Household | 5 | 12.5% |
| 3-Person Household | 18 | 45.0% |
| 4+ Person Household | 7 | 17.5% |
| Total Housing Units | 40 | 100.0% |
Occupancy by Ownership by Household Size in Stanley
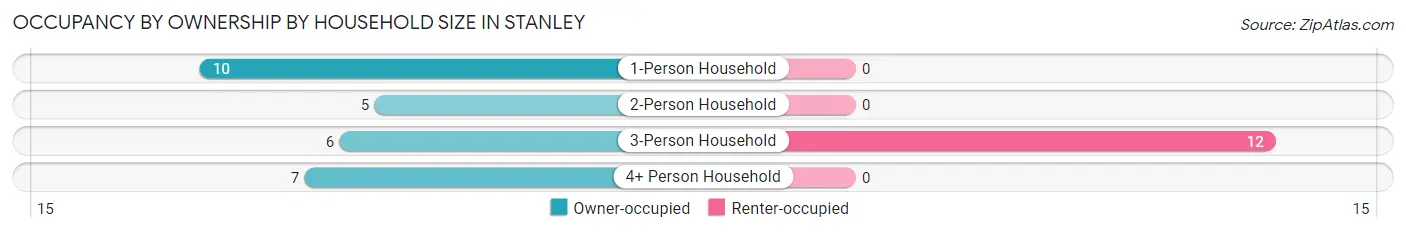
| Household Size | Owner-occupied | Renter-occupied |
| 1-Person Household | 10 (100.0%) | 0 (0.0%) |
| 2-Person Household | 5 (100.0%) | 0 (0.0%) |
| 3-Person Household | 6 (33.3%) | 12 (66.7%) |
| 4+ Person Household | 7 (100.0%) | 0 (0.0%) |
| Total Housing Units | 28 (70.0%) | 12 (30.0%) |
Occupancy by Educational Attainment in Stanley
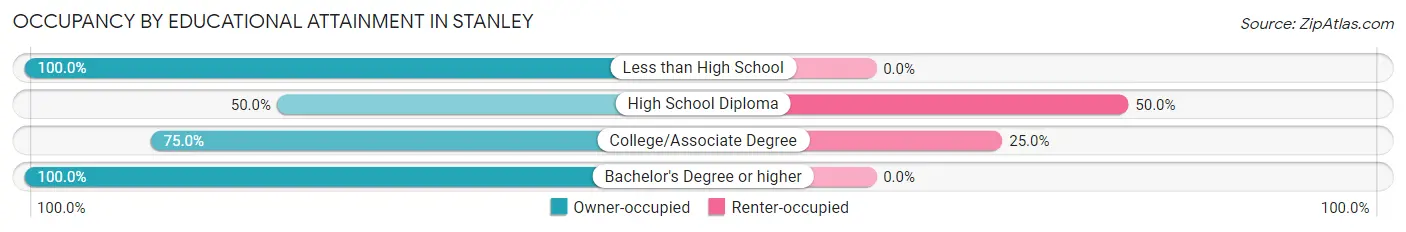
| Household Size | Owner-occupied | Renter-occupied |
| Less than High School | 5 (100.0%) | 0 (0.0%) |
| High School Diploma | 9 (50.0%) | 9 (50.0%) |
| College/Associate Degree | 9 (75.0%) | 3 (25.0%) |
| Bachelor's Degree or higher | 5 (100.0%) | 0 (0.0%) |
Occupancy by Age of Householder in Stanley
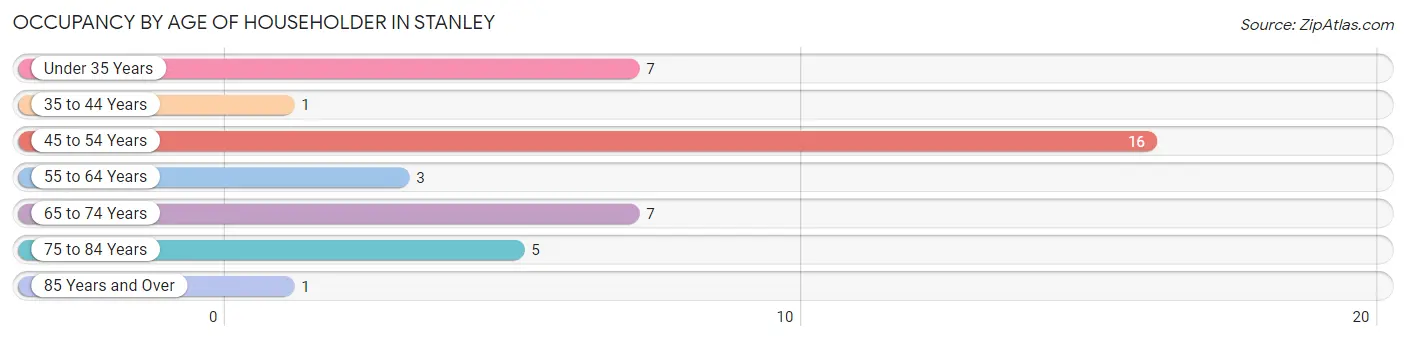
| Age Bracket | # Households | % Households |
| Under 35 Years | 7 | 17.5% |
| 35 to 44 Years | 1 | 2.5% |
| 45 to 54 Years | 16 | 40.0% |
| 55 to 64 Years | 3 | 7.5% |
| 65 to 74 Years | 7 | 17.5% |
| 75 to 84 Years | 5 | 12.5% |
| 85 Years and Over | 1 | 2.5% |
| Total | 40 | 100.0% |
Housing Finances in Stanley
Median Income by Occupancy in Stanley
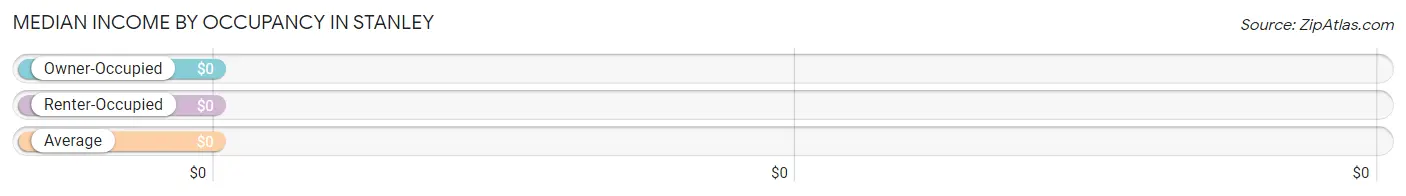
| Occupancy Type | # Households | Median Income |
| Owner-Occupied | 28 (70.0%) | $0 |
| Renter-Occupied | 12 (30.0%) | $0 |
| Average | 40 (100.0%) | $0 |
Occupancy by Householder Income Bracket in Stanley
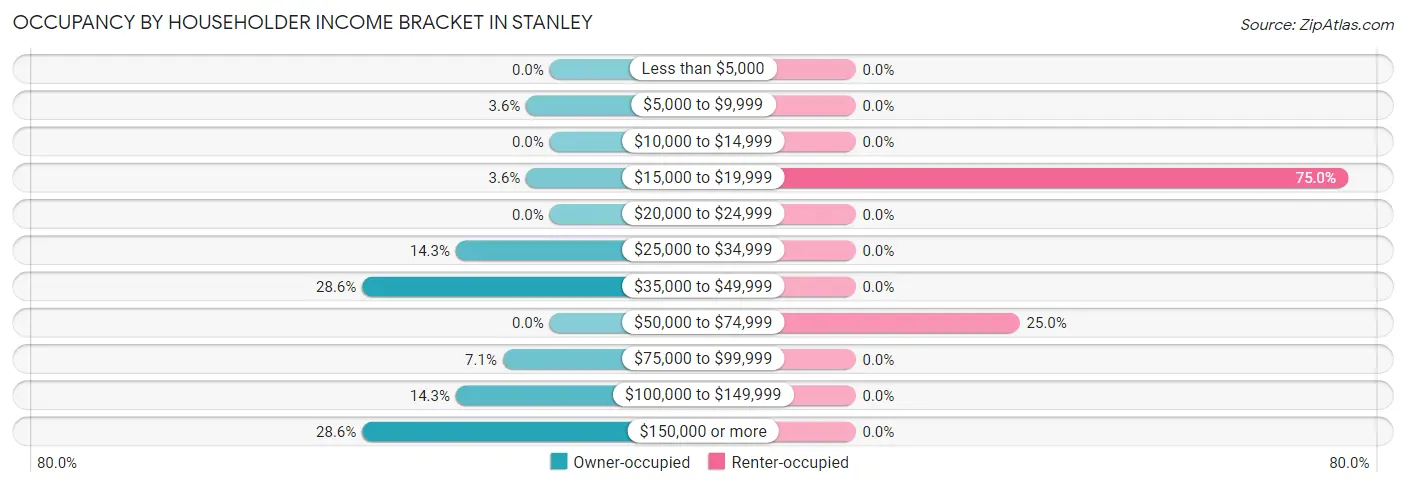
| Income Bracket | Owner-occupied | Renter-occupied |
| Less than $5,000 | 0 (0.0%) | 0 (0.0%) |
| $5,000 to $9,999 | 1 (3.6%) | 0 (0.0%) |
| $10,000 to $14,999 | 0 (0.0%) | 0 (0.0%) |
| $15,000 to $19,999 | 1 (3.6%) | 9 (75.0%) |
| $20,000 to $24,999 | 0 (0.0%) | 0 (0.0%) |
| $25,000 to $34,999 | 4 (14.3%) | 0 (0.0%) |
| $35,000 to $49,999 | 8 (28.6%) | 0 (0.0%) |
| $50,000 to $74,999 | 0 (0.0%) | 3 (25.0%) |
| $75,000 to $99,999 | 2 (7.1%) | 0 (0.0%) |
| $100,000 to $149,999 | 4 (14.3%) | 0 (0.0%) |
| $150,000 or more | 8 (28.6%) | 0 (0.0%) |
| Total | 28 (100.0%) | 12 (100.0%) |
Monthly Housing Cost Tiers in Stanley
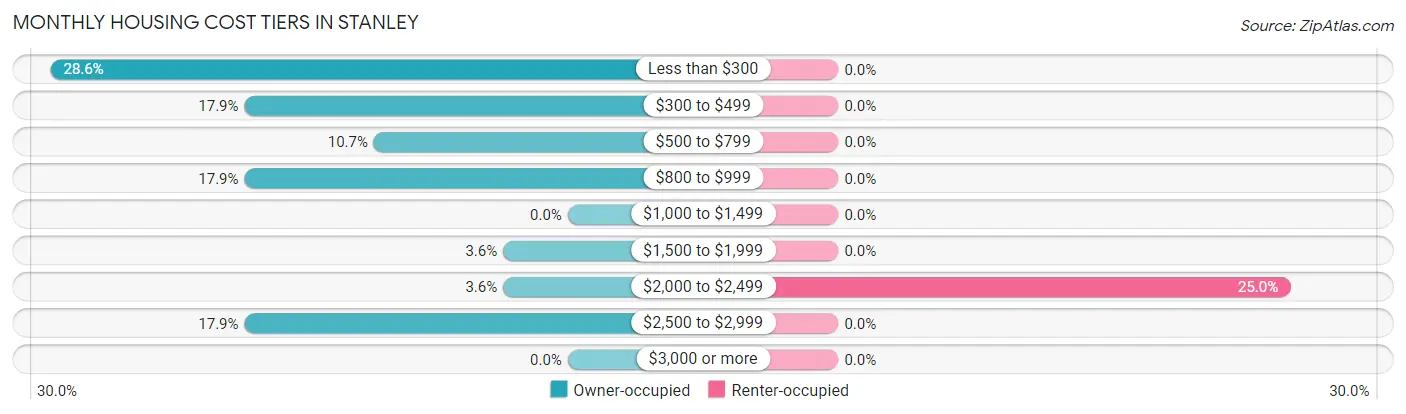
| Monthly Cost | Owner-occupied | Renter-occupied |
| Less than $300 | 8 (28.6%) | 0 (0.0%) |
| $300 to $499 | 5 (17.9%) | 0 (0.0%) |
| $500 to $799 | 3 (10.7%) | 0 (0.0%) |
| $800 to $999 | 5 (17.9%) | 0 (0.0%) |
| $1,000 to $1,499 | 0 (0.0%) | 0 (0.0%) |
| $1,500 to $1,999 | 1 (3.6%) | 0 (0.0%) |
| $2,000 to $2,499 | 1 (3.6%) | 3 (25.0%) |
| $2,500 to $2,999 | 5 (17.9%) | 0 (0.0%) |
| $3,000 or more | 0 (0.0%) | 0 (0.0%) |
| Total | 28 (100.0%) | 12 (100.0%) |
Physical Housing Characteristics in Stanley
Housing Structures in Stanley
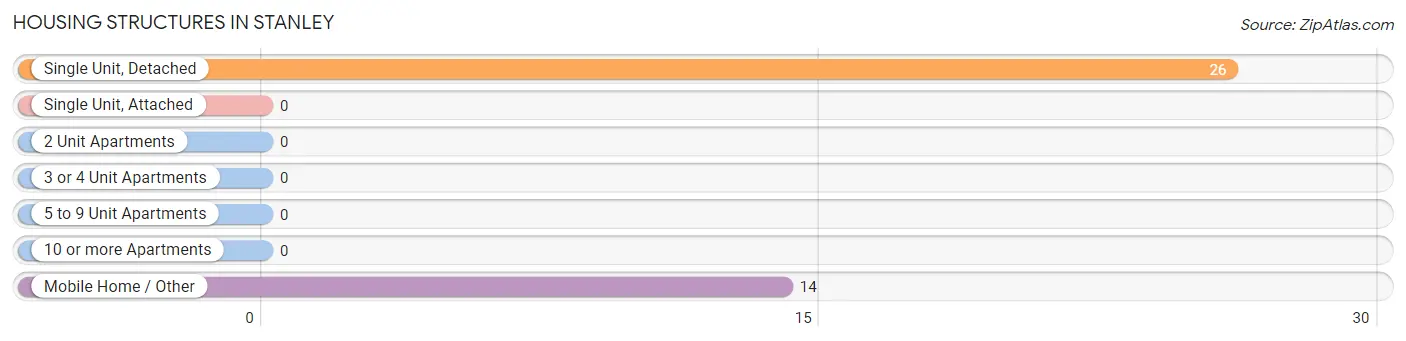
| Structure Type | # Housing Units | % Housing Units |
| Single Unit, Detached | 26 | 65.0% |
| Single Unit, Attached | 0 | 0.0% |
| 2 Unit Apartments | 0 | 0.0% |
| 3 or 4 Unit Apartments | 0 | 0.0% |
| 5 to 9 Unit Apartments | 0 | 0.0% |
| 10 or more Apartments | 0 | 0.0% |
| Mobile Home / Other | 14 | 35.0% |
| Total | 40 | 100.0% |
Housing Structures by Occupancy in Stanley
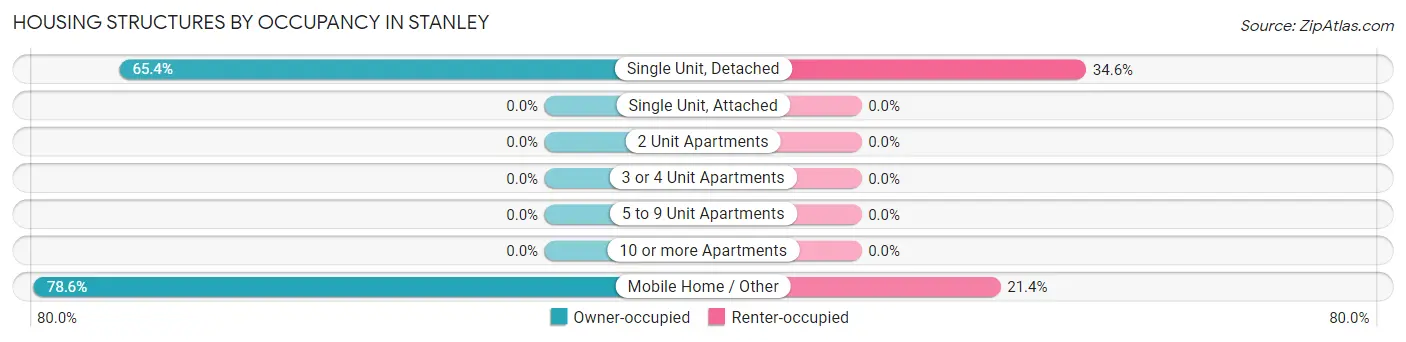
| Structure Type | Owner-occupied | Renter-occupied |
| Single Unit, Detached | 17 (65.4%) | 9 (34.6%) |
| Single Unit, Attached | 0 (0.0%) | 0 (0.0%) |
| 2 Unit Apartments | 0 (0.0%) | 0 (0.0%) |
| 3 or 4 Unit Apartments | 0 (0.0%) | 0 (0.0%) |
| 5 to 9 Unit Apartments | 0 (0.0%) | 0 (0.0%) |
| 10 or more Apartments | 0 (0.0%) | 0 (0.0%) |
| Mobile Home / Other | 11 (78.6%) | 3 (21.4%) |
| Total | 28 (70.0%) | 12 (30.0%) |
Housing Structures by Number of Rooms in Stanley
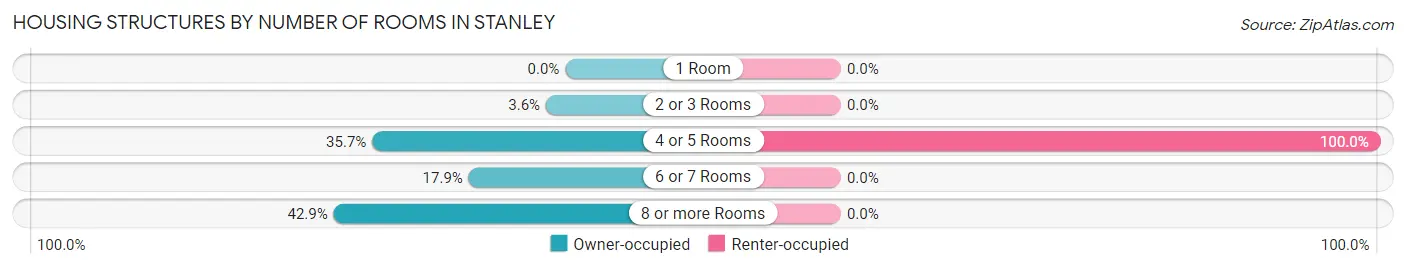
| Number of Rooms | Owner-occupied | Renter-occupied |
| 1 Room | 0 (0.0%) | 0 (0.0%) |
| 2 or 3 Rooms | 1 (3.6%) | 0 (0.0%) |
| 4 or 5 Rooms | 10 (35.7%) | 12 (100.0%) |
| 6 or 7 Rooms | 5 (17.9%) | 0 (0.0%) |
| 8 or more Rooms | 12 (42.9%) | 0 (0.0%) |
| Total | 28 (100.0%) | 12 (100.0%) |
Housing Structure by Heating Type in Stanley
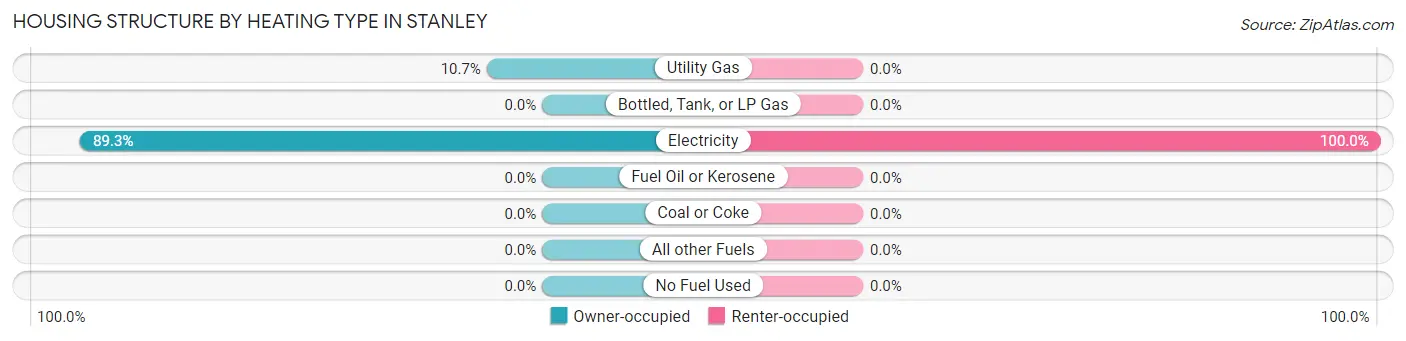
| Heating Type | Owner-occupied | Renter-occupied |
| Utility Gas | 3 (10.7%) | 0 (0.0%) |
| Bottled, Tank, or LP Gas | 0 (0.0%) | 0 (0.0%) |
| Electricity | 25 (89.3%) | 12 (100.0%) |
| Fuel Oil or Kerosene | 0 (0.0%) | 0 (0.0%) |
| Coal or Coke | 0 (0.0%) | 0 (0.0%) |
| All other Fuels | 0 (0.0%) | 0 (0.0%) |
| No Fuel Used | 0 (0.0%) | 0 (0.0%) |
| Total | 28 (100.0%) | 12 (100.0%) |
Household Vehicle Usage in Stanley
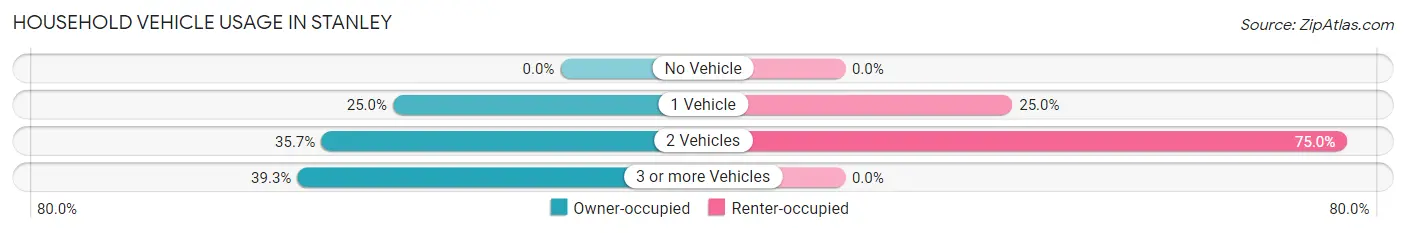
| Vehicles per Household | Owner-occupied | Renter-occupied |
| No Vehicle | 0 (0.0%) | 0 (0.0%) |
| 1 Vehicle | 7 (25.0%) | 3 (25.0%) |
| 2 Vehicles | 10 (35.7%) | 9 (75.0%) |
| 3 or more Vehicles | 11 (39.3%) | 0 (0.0%) |
| Total | 28 (100.0%) | 12 (100.0%) |
Real Estate & Mortgages in Stanley
Real Estate and Mortgage Overview in Stanley
| Characteristic | Without Mortgage | With Mortgage |
| Housing Units | 15 | 13 |
| Median Property Value | $83,800 | $308,300 |
| Median Household Income | - | - |
| Monthly Housing Costs | $296 | $0 |
| Real Estate Taxes | - | - |
Property Value by Mortgage Status in Stanley
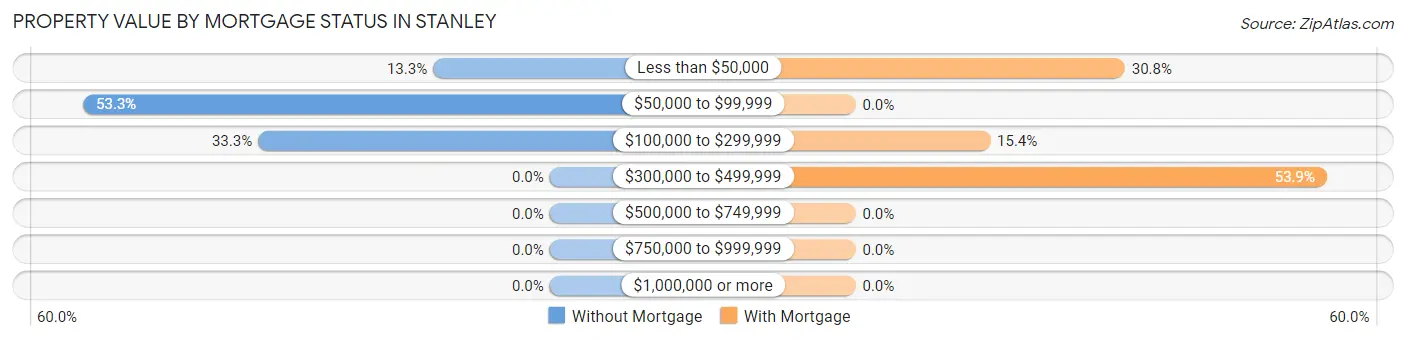
| Property Value | Without Mortgage | With Mortgage |
| Less than $50,000 | 2 (13.3%) | 4 (30.8%) |
| $50,000 to $99,999 | 8 (53.3%) | 0 (0.0%) |
| $100,000 to $299,999 | 5 (33.3%) | 2 (15.4%) |
| $300,000 to $499,999 | 0 (0.0%) | 7 (53.8%) |
| $500,000 to $749,999 | 0 (0.0%) | 0 (0.0%) |
| $750,000 to $999,999 | 0 (0.0%) | 0 (0.0%) |
| $1,000,000 or more | 0 (0.0%) | 0 (0.0%) |
| Total | 15 (100.0%) | 13 (100.0%) |
Household Income by Mortgage Status in Stanley
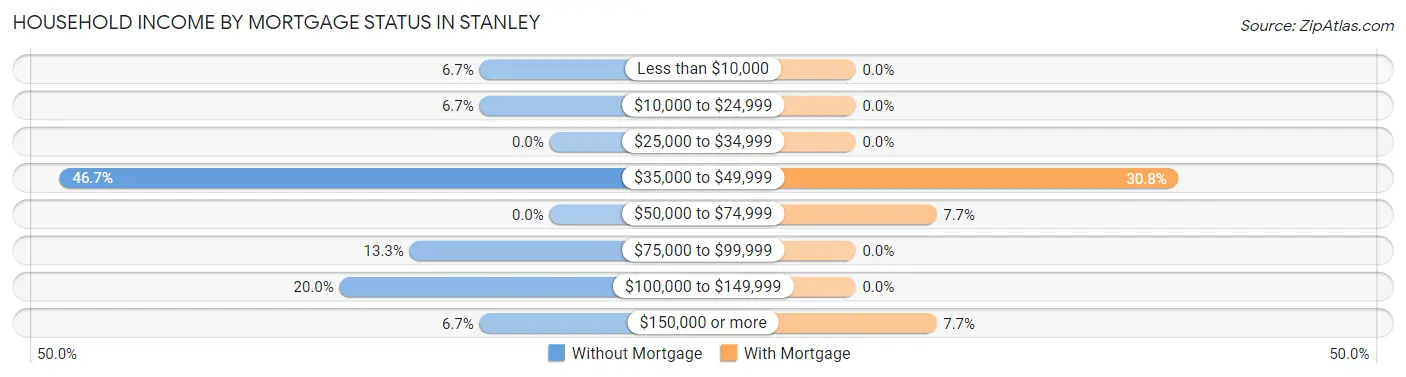
| Household Income | Without Mortgage | With Mortgage |
| Less than $10,000 | 1 (6.7%) | 0 (0.0%) |
| $10,000 to $24,999 | 1 (6.7%) | 0 (0.0%) |
| $25,000 to $34,999 | 0 (0.0%) | 0 (0.0%) |
| $35,000 to $49,999 | 7 (46.7%) | 4 (30.8%) |
| $50,000 to $74,999 | 0 (0.0%) | 1 (7.7%) |
| $75,000 to $99,999 | 2 (13.3%) | 0 (0.0%) |
| $100,000 to $149,999 | 3 (20.0%) | 0 (0.0%) |
| $150,000 or more | 1 (6.7%) | 1 (7.7%) |
| Total | 15 (100.0%) | 13 (100.0%) |
Property Value to Household Income Ratio in Stanley
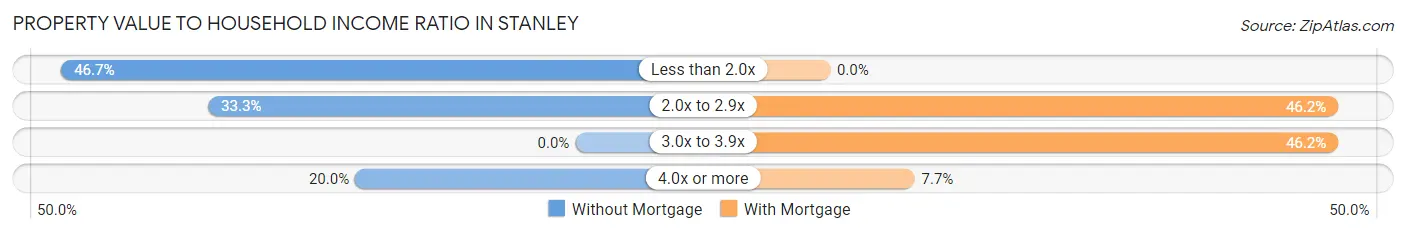
| Value-to-Income Ratio | Without Mortgage | With Mortgage |
| Less than 2.0x | 7 (46.7%) | 0 (0.0%) |
| 2.0x to 2.9x | 5 (33.3%) | 6 (46.2%) |
| 3.0x to 3.9x | 0 (0.0%) | 6 (46.2%) |
| 4.0x or more | 3 (20.0%) | 1 (7.7%) |
| Total | 15 (100.0%) | 13 (100.0%) |
Real Estate Taxes by Mortgage Status in Stanley
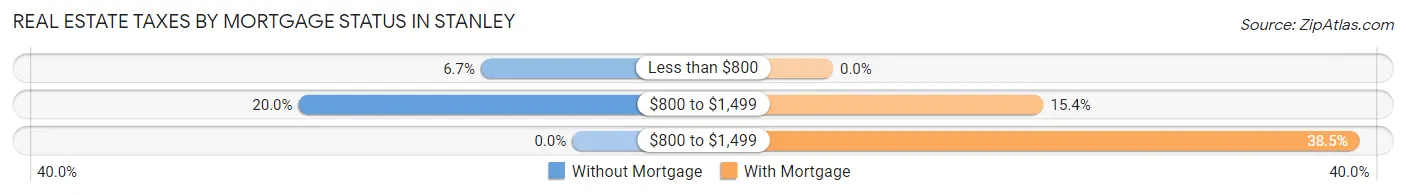
| Property Taxes | Without Mortgage | With Mortgage |
| Less than $800 | 1 (6.7%) | 0 (0.0%) |
| $800 to $1,499 | 3 (20.0%) | 2 (15.4%) |
| $800 to $1,499 | 0 (0.0%) | 5 (38.5%) |
| Total | 15 (100.0%) | 13 (100.0%) |
Health & Disability in Stanley
Health Insurance Coverage by Age in Stanley
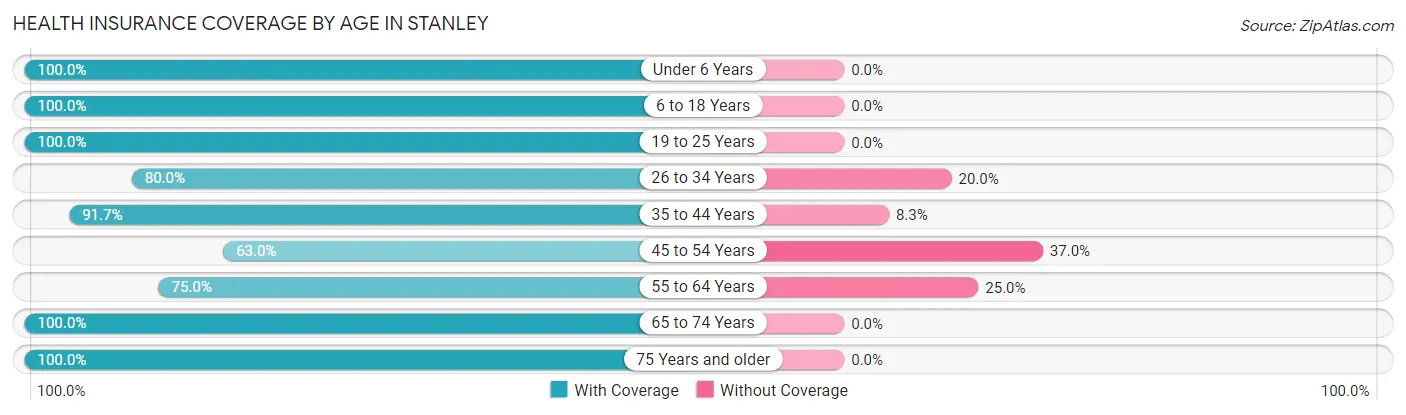
| Age Bracket | With Coverage | Without Coverage |
| Under 6 Years | 8 (100.0%) | 0 (0.0%) |
| 6 to 18 Years | 22 (100.0%) | 0 (0.0%) |
| 19 to 25 Years | 4 (100.0%) | 0 (0.0%) |
| 26 to 34 Years | 12 (80.0%) | 3 (20.0%) |
| 35 to 44 Years | 11 (91.7%) | 1 (8.3%) |
| 45 to 54 Years | 17 (63.0%) | 10 (37.0%) |
| 55 to 64 Years | 3 (75.0%) | 1 (25.0%) |
| 65 to 74 Years | 7 (100.0%) | 0 (0.0%) |
| 75 Years and older | 11 (100.0%) | 0 (0.0%) |
| Total | 95 (86.4%) | 15 (13.6%) |
Health Insurance Coverage by Citizenship Status in Stanley
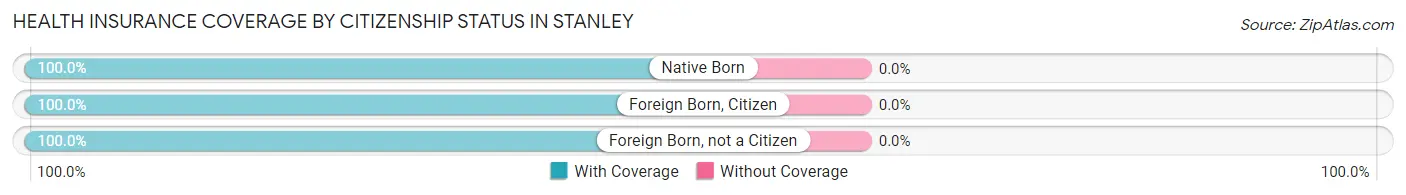
| Citizenship Status | With Coverage | Without Coverage |
| Native Born | 8 (100.0%) | 0 (0.0%) |
| Foreign Born, Citizen | 22 (100.0%) | 0 (0.0%) |
| Foreign Born, not a Citizen | 4 (100.0%) | 0 (0.0%) |
Health Insurance Coverage by Household Income in Stanley
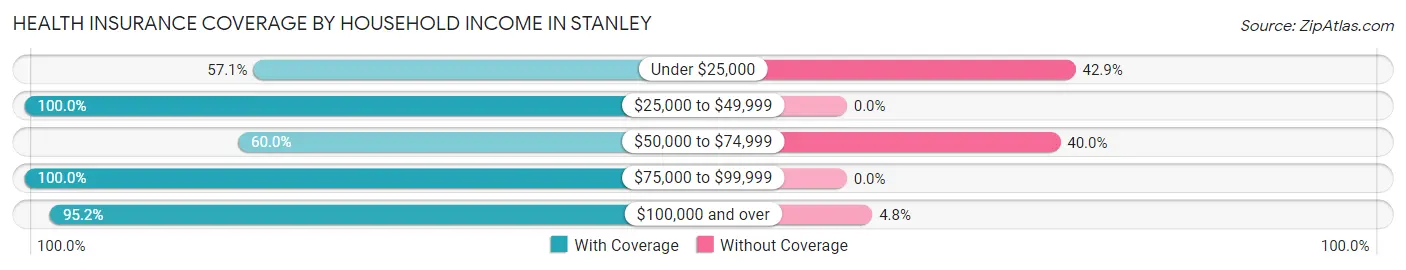
| Household Income | With Coverage | Without Coverage |
| Under $25,000 | 12 (57.1%) | 9 (42.9%) |
| $25,000 to $49,999 | 33 (100.0%) | 0 (0.0%) |
| $50,000 to $74,999 | 6 (60.0%) | 4 (40.0%) |
| $75,000 to $99,999 | 4 (100.0%) | 0 (0.0%) |
| $100,000 and over | 40 (95.2%) | 2 (4.8%) |
Public vs Private Health Insurance Coverage by Age in Stanley
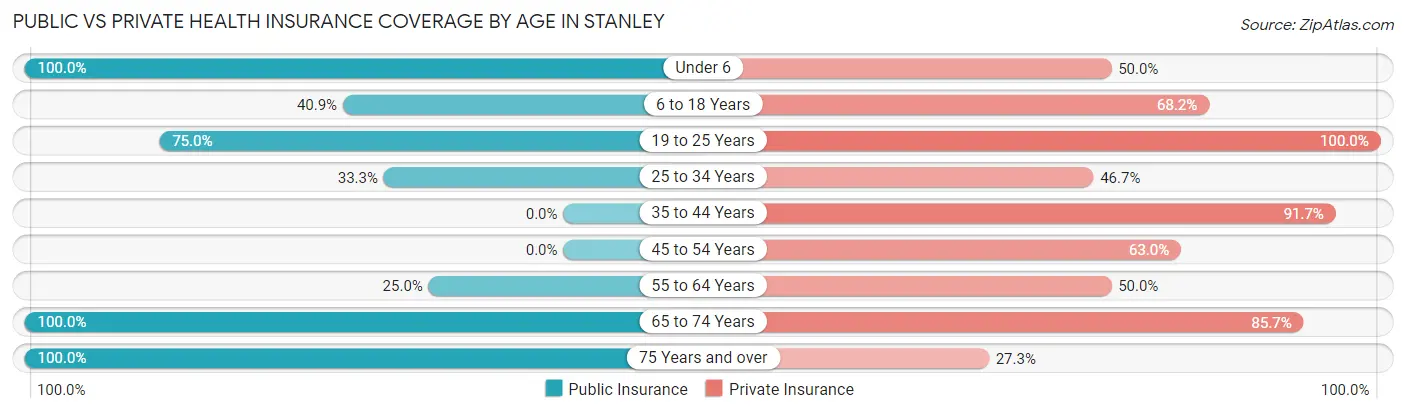
| Age Bracket | Public Insurance | Private Insurance |
| Under 6 | 8 (100.0%) | 4 (50.0%) |
| 6 to 18 Years | 9 (40.9%) | 15 (68.2%) |
| 19 to 25 Years | 3 (75.0%) | 4 (100.0%) |
| 25 to 34 Years | 5 (33.3%) | 7 (46.7%) |
| 35 to 44 Years | 0 (0.0%) | 11 (91.7%) |
| 45 to 54 Years | 0 (0.0%) | 17 (63.0%) |
| 55 to 64 Years | 1 (25.0%) | 2 (50.0%) |
| 65 to 74 Years | 7 (100.0%) | 6 (85.7%) |
| 75 Years and over | 11 (100.0%) | 3 (27.3%) |
| Total | 44 (40.0%) | 69 (62.7%) |
Disability Status by Sex by Age in Stanley
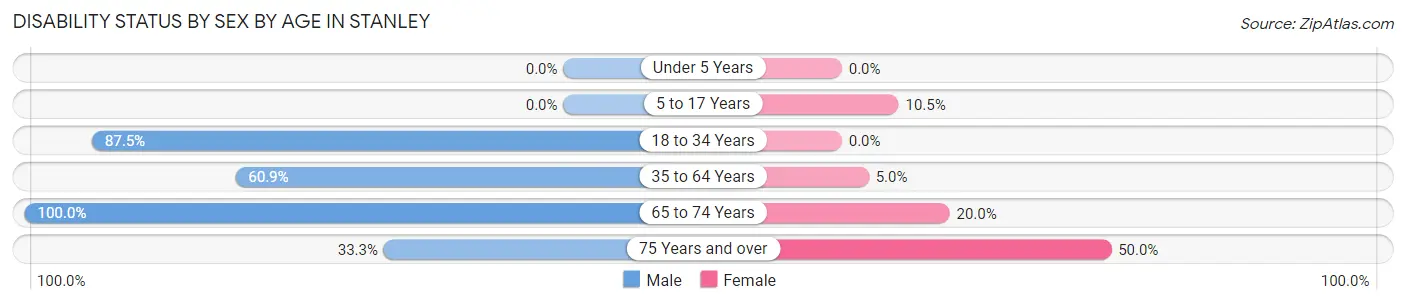
| Age Bracket | Male | Female |
| Under 5 Years | 0 (0.0%) | 0 (0.0%) |
| 5 to 17 Years | 0 (0.0%) | 2 (10.5%) |
| 18 to 34 Years | 7 (87.5%) | 0 (0.0%) |
| 35 to 64 Years | 14 (60.9%) | 1 (5.0%) |
| 65 to 74 Years | 2 (100.0%) | 1 (20.0%) |
| 75 Years and over | 1 (33.3%) | 4 (50.0%) |
Disability Class by Sex by Age in Stanley
Disability Class: Hearing Difficulty
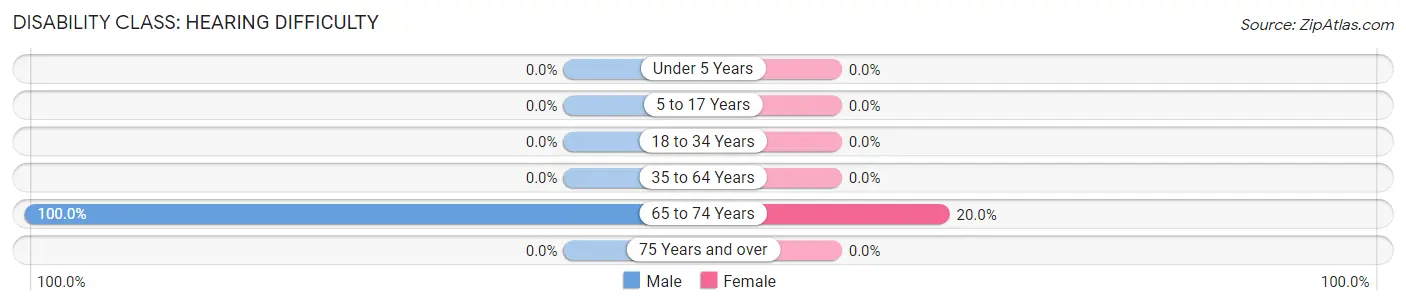
| Age Bracket | Male | Female |
| Under 5 Years | 0 (0.0%) | 0 (0.0%) |
| 5 to 17 Years | 0 (0.0%) | 0 (0.0%) |
| 18 to 34 Years | 0 (0.0%) | 0 (0.0%) |
| 35 to 64 Years | 0 (0.0%) | 0 (0.0%) |
| 65 to 74 Years | 2 (100.0%) | 1 (20.0%) |
| 75 Years and over | 0 (0.0%) | 0 (0.0%) |
Disability Class: Vision Difficulty
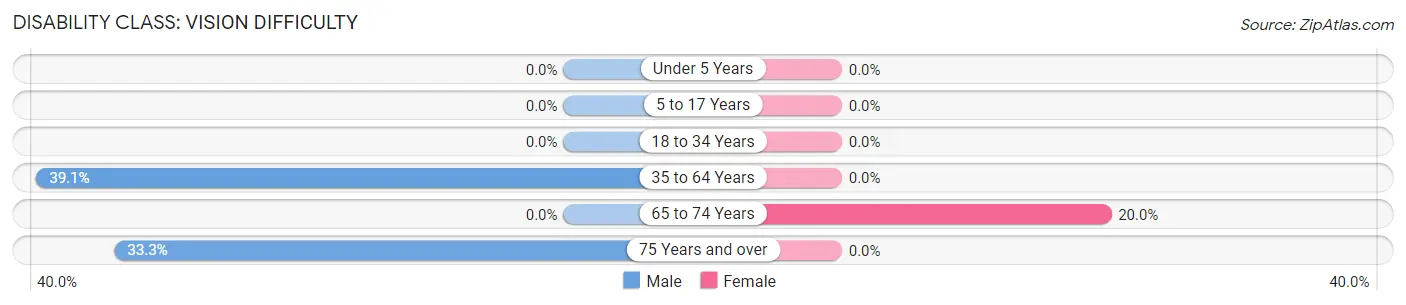
| Age Bracket | Male | Female |
| Under 5 Years | 0 (0.0%) | 0 (0.0%) |
| 5 to 17 Years | 0 (0.0%) | 0 (0.0%) |
| 18 to 34 Years | 0 (0.0%) | 0 (0.0%) |
| 35 to 64 Years | 9 (39.1%) | 0 (0.0%) |
| 65 to 74 Years | 0 (0.0%) | 1 (20.0%) |
| 75 Years and over | 1 (33.3%) | 0 (0.0%) |
Disability Class: Cognitive Difficulty
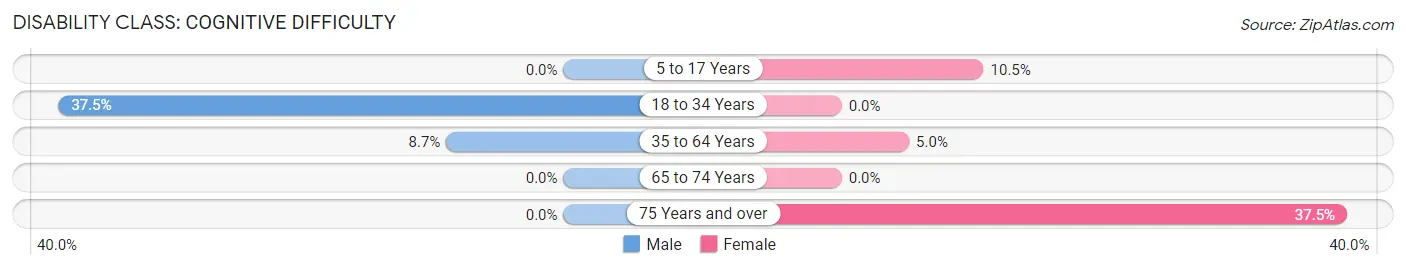
| Age Bracket | Male | Female |
| 5 to 17 Years | 0 (0.0%) | 2 (10.5%) |
| 18 to 34 Years | 3 (37.5%) | 0 (0.0%) |
| 35 to 64 Years | 2 (8.7%) | 1 (5.0%) |
| 65 to 74 Years | 0 (0.0%) | 0 (0.0%) |
| 75 Years and over | 0 (0.0%) | 3 (37.5%) |
Disability Class: Ambulatory Difficulty
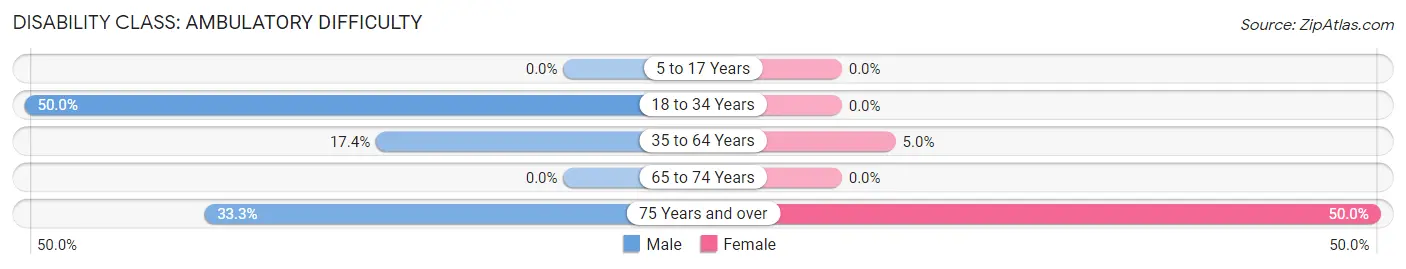
| Age Bracket | Male | Female |
| 5 to 17 Years | 0 (0.0%) | 0 (0.0%) |
| 18 to 34 Years | 4 (50.0%) | 0 (0.0%) |
| 35 to 64 Years | 4 (17.4%) | 1 (5.0%) |
| 65 to 74 Years | 0 (0.0%) | 0 (0.0%) |
| 75 Years and over | 1 (33.3%) | 4 (50.0%) |
Disability Class: Self-Care Difficulty
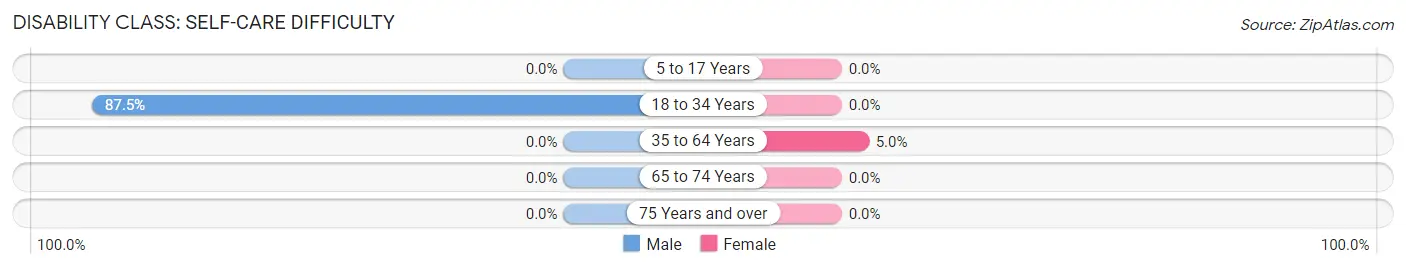
| Age Bracket | Male | Female |
| 5 to 17 Years | 0 (0.0%) | 0 (0.0%) |
| 18 to 34 Years | 7 (87.5%) | 0 (0.0%) |
| 35 to 64 Years | 0 (0.0%) | 1 (5.0%) |
| 65 to 74 Years | 0 (0.0%) | 0 (0.0%) |
| 75 Years and over | 0 (0.0%) | 0 (0.0%) |
Technology Access in Stanley
Computing Device Access in Stanley
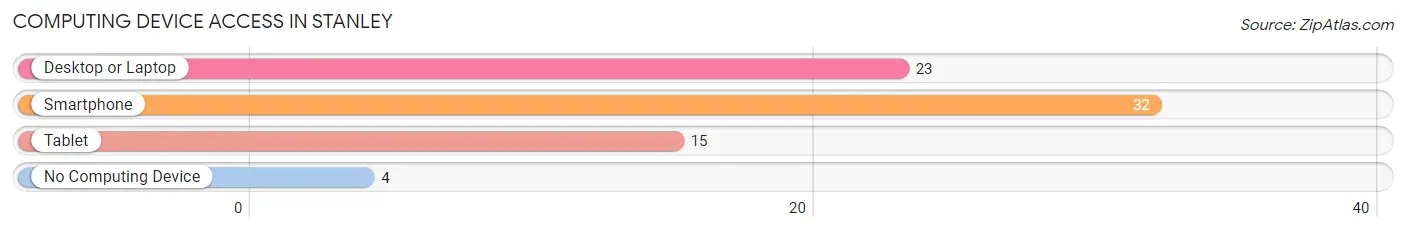
| Device Type | # Households | % Households |
| Desktop or Laptop | 23 | 57.5% |
| Smartphone | 32 | 80.0% |
| Tablet | 15 | 37.5% |
| No Computing Device | 4 | 10.0% |
| Total | 40 | 100.0% |
Internet Access in Stanley
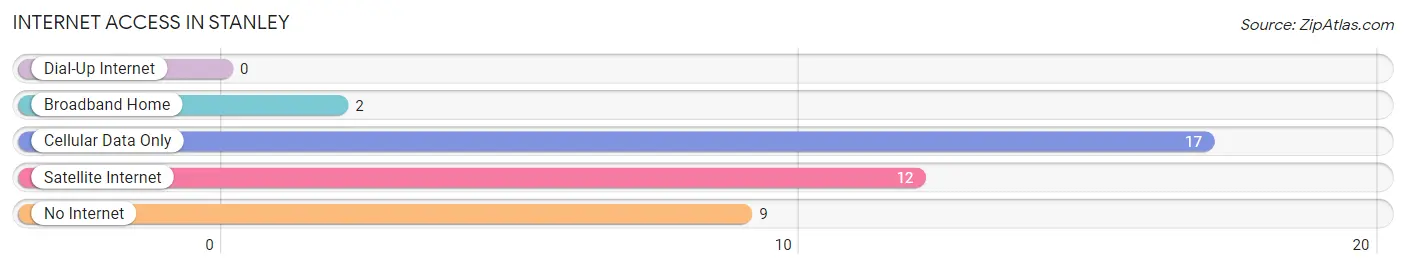
| Internet Type | # Households | % Households |
| Dial-Up Internet | 0 | 0.0% |
| Broadband Home | 2 | 5.0% |
| Cellular Data Only | 17 | 42.5% |
| Satellite Internet | 12 | 30.0% |
| No Internet | 9 | 22.5% |
| Total | 40 | 100.0% |
Stanley Summary
Stanley, Louisiana is a small town located in the northern part of the state, in the parish of Lincoln. It is situated on the banks of the Ouachita River, and is part of the Ruston-Grambling Metropolitan Statistical Area. The town has a population of just over 1,000 people, and is known for its rural charm and friendly atmosphere.
History
The area that is now Stanley was first settled in the early 1800s by a group of French-Canadian immigrants. The town was originally known as “La Petite Prairie”, and was later renamed Stanley in honor of the first postmaster, William Stanley. The town was officially incorporated in 1883, and has remained a small, rural community ever since.
Geography
Stanley is located in the northern part of Louisiana, in the parish of Lincoln. It is situated on the banks of the Ouachita River, and is part of the Ruston-Grambling Metropolitan Statistical Area. The town has a total area of 1.2 square miles, all of which is land. The terrain is mostly flat, with some rolling hills in the surrounding area.
Economy
The economy of Stanley is largely based on agriculture and forestry. The town is home to several small farms, as well as a sawmill and a lumber yard. The town also has a few small businesses, including a grocery store, a hardware store, and a few restaurants.
Demographics
As of the 2010 census, the population of Stanley was 1,072. The racial makeup of the town was 79.3% White, 17.2% African American, 0.7% Native American, 0.3% Asian, 0.1% Pacific Islander, and 2.4% from other races. The median household income was $30,938, and the median family income was $37,500. The per capita income was $15,945.
Conclusion
Stanley, Louisiana is a small, rural town located in the northern part of the state. It has a population of just over 1,000 people, and is known for its rural charm and friendly atmosphere. The economy of Stanley is largely based on agriculture and forestry, and the town is home to several small businesses. The population of Stanley is mostly White, with a small percentage of African Americans and other races. The median household income is slightly below the national average, but the town is still a great place to live and work.
Common Questions
What is Per Capita Income in Stanley?
Per Capita income in Stanley is $33,759.
What is Inequality or Gini Index in Stanley?
Inequality or Gini Index in Stanley is 0.54.
What is the Total Population of Stanley?
Total Population of Stanley is 110.
What is the Total Male Population of Stanley?
Total Male Population of Stanley is 47.
What is the Total Female Population of Stanley?
Total Female Population of Stanley is 63.
What is the Ratio of Males per 100 Females in Stanley?
There are 74.60 Males per 100 Females in Stanley.
What is the Ratio of Females per 100 Males in Stanley?
There are 134.04 Females per 100 Males in Stanley.
What is the Median Population Age in Stanley?
Median Population Age in Stanley is 40.3 Years.
What is the Average Family Size in Stanley
Average Family Size in Stanley is 3.1 People.
What is the Average Household Size in Stanley
Average Household Size in Stanley is 2.8 People.
How Large is the Labor Force in Stanley?
There are 46 People in the Labor Forcein in Stanley.
What is the Percentage of People in the Labor Force in Stanley?
51.1% of People are in the Labor Force in Stanley.