Grosse Tete, LA Map & Demographics
Grosse Tete Map
Grosse Tete Overview
$31,931
PER CAPITA INCOME
$75,735
AVG FAMILY INCOME
$59,038
AVG HOUSEHOLD INCOME
0.40
INEQUALITY / GINI INDEX
389
TOTAL POPULATION
195
MALE POPULATION
194
FEMALE POPULATION
100.52
MALES / 100 FEMALES
99.49
FEMALES / 100 MALES
35.8
MEDIAN AGE
3.0
AVG FAMILY SIZE
2.4
AVG HOUSEHOLD SIZE
184
LABOR FORCE [ PEOPLE ]
62.2%
PERCENT IN LABOR FORCE
Grosse Tete Zip Codes
Grosse Tete Area Codes
Income in Grosse Tete
Income Overview in Grosse Tete
Per Capita Income in Grosse Tete is $31,931, while median incomes of families and households are $75,735 and $59,038 respectively.
| Characteristic | Number | Measure |
| Per Capita Income | 389 | $31,931 |
| Median Family Income | 102 | $75,735 |
| Mean Family Income | 102 | $93,365 |
| Median Household Income | 160 | $59,038 |
| Mean Household Income | 160 | $76,653 |
| Income Deficit | 102 | $0 |
| Wage / Income Gap (%) | 389 | 0.00% |
| Wage / Income Gap ($) | 389 | 100.00¢ per $1 |
| Gini / Inequality Index | 389 | 0.40 |
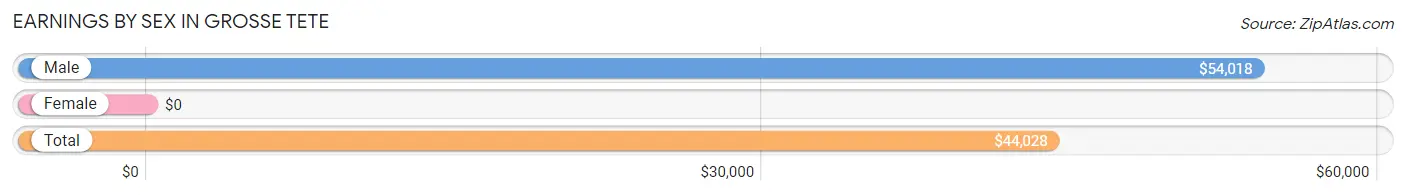
Earnings by Sex in Grosse Tete
| Sex | Number | Average Earnings |
| Male | 111 (54.9%) | $54,018 |
| Female | 91 (45.1%) | $0 |
| Total | 202 (100.0%) | $44,028 |
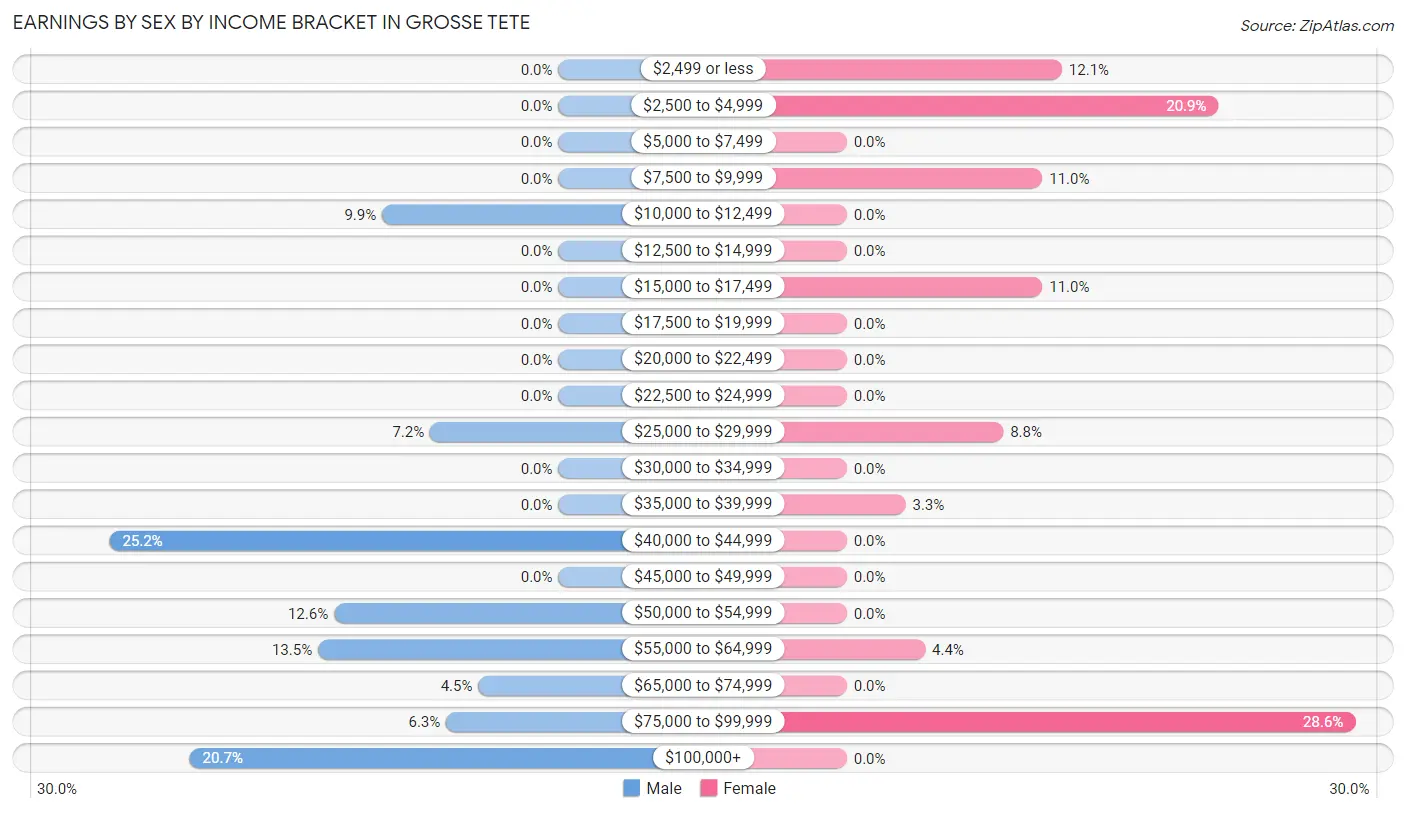
Earnings by Sex by Income Bracket in Grosse Tete
The most common earnings brackets in Grosse Tete are $40,000 to $44,999 for men (28 | 25.2%) and $75,000 to $99,999 for women (26 | 28.6%).
| Income | Male | Female |
| $2,499 or less | 0 (0.0%) | 11 (12.1%) |
| $2,500 to $4,999 | 0 (0.0%) | 19 (20.9%) |
| $5,000 to $7,499 | 0 (0.0%) | 0 (0.0%) |
| $7,500 to $9,999 | 0 (0.0%) | 10 (11.0%) |
| $10,000 to $12,499 | 11 (9.9%) | 0 (0.0%) |
| $12,500 to $14,999 | 0 (0.0%) | 0 (0.0%) |
| $15,000 to $17,499 | 0 (0.0%) | 10 (11.0%) |
| $17,500 to $19,999 | 0 (0.0%) | 0 (0.0%) |
| $20,000 to $22,499 | 0 (0.0%) | 0 (0.0%) |
| $22,500 to $24,999 | 0 (0.0%) | 0 (0.0%) |
| $25,000 to $29,999 | 8 (7.2%) | 8 (8.8%) |
| $30,000 to $34,999 | 0 (0.0%) | 0 (0.0%) |
| $35,000 to $39,999 | 0 (0.0%) | 3 (3.3%) |
| $40,000 to $44,999 | 28 (25.2%) | 0 (0.0%) |
| $45,000 to $49,999 | 0 (0.0%) | 0 (0.0%) |
| $50,000 to $54,999 | 14 (12.6%) | 0 (0.0%) |
| $55,000 to $64,999 | 15 (13.5%) | 4 (4.4%) |
| $65,000 to $74,999 | 5 (4.5%) | 0 (0.0%) |
| $75,000 to $99,999 | 7 (6.3%) | 26 (28.6%) |
| $100,000+ | 23 (20.7%) | 0 (0.0%) |
| Total | 111 (100.0%) | 91 (100.0%) |
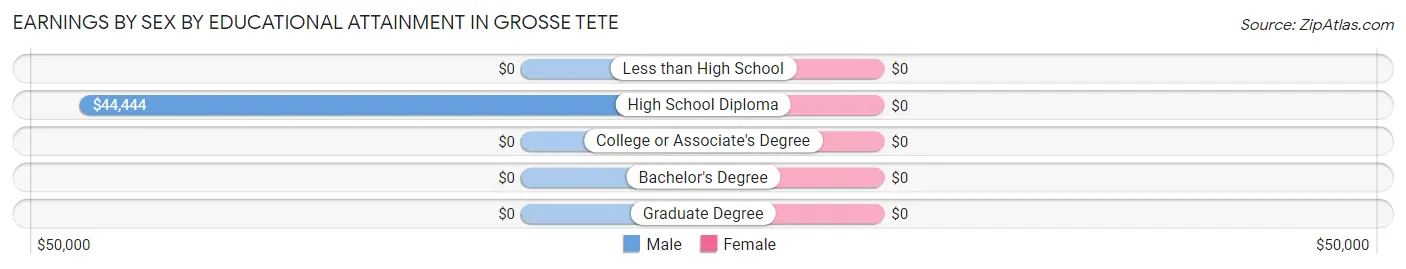
Earnings by Sex by Educational Attainment in Grosse Tete
| Educational Attainment | Male Income | Female Income |
| Less than High School | - | - |
| High School Diploma | $44,444 | $0 |
| College or Associate's Degree | - | - |
| Bachelor's Degree | - | - |
| Graduate Degree | - | - |
| Total | $54,018 | $0 |
Family Income in Grosse Tete
Family Income Brackets in Grosse Tete
According to the Grosse Tete family income data, there are 26 families falling into the $75,000 to $99,999 income range, which is the most common income bracket and makes up 25.5% of all families.
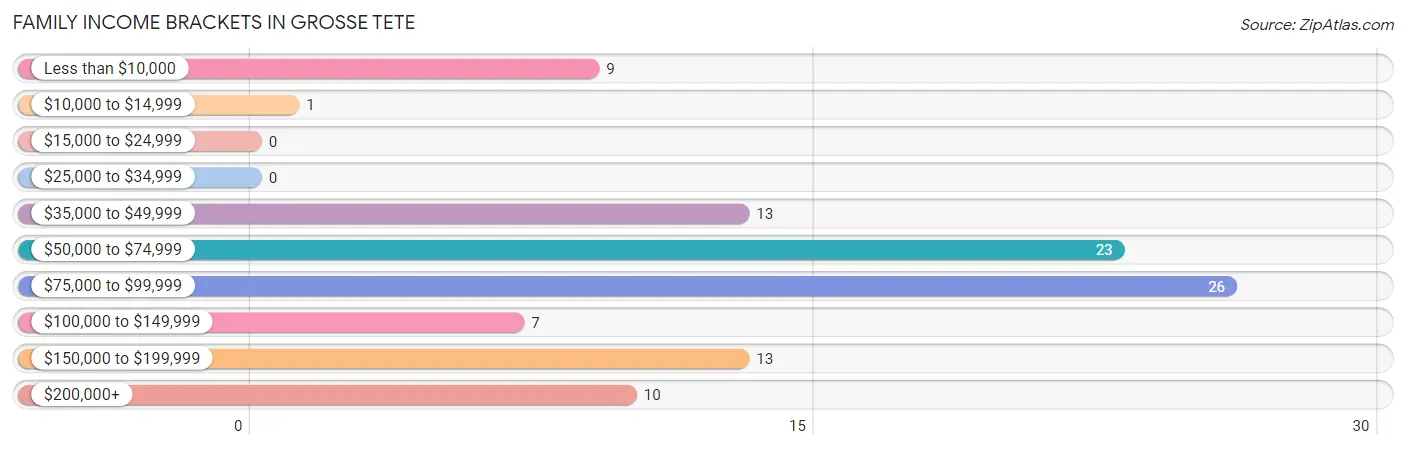
| Income Bracket | # Families | % Families |
| Less than $10,000 | 9 | 8.8% |
| $10,000 to $14,999 | 1 | 1.0% |
| $15,000 to $24,999 | 0 | 0.0% |
| $25,000 to $34,999 | 0 | 0.0% |
| $35,000 to $49,999 | 13 | 12.7% |
| $50,000 to $74,999 | 23 | 22.5% |
| $75,000 to $99,999 | 26 | 25.5% |
| $100,000 to $149,999 | 7 | 6.9% |
| $150,000 to $199,999 | 13 | 12.7% |
| $200,000+ | 10 | 9.8% |
Family Income by Famaliy Size in Grosse Tete
2-person families (57 | 55.9%) account for the highest median family income in Grosse Tete with $76,250 per family, while 2-person families (57 | 55.9%) have the highest median income of $38,125 per family member.
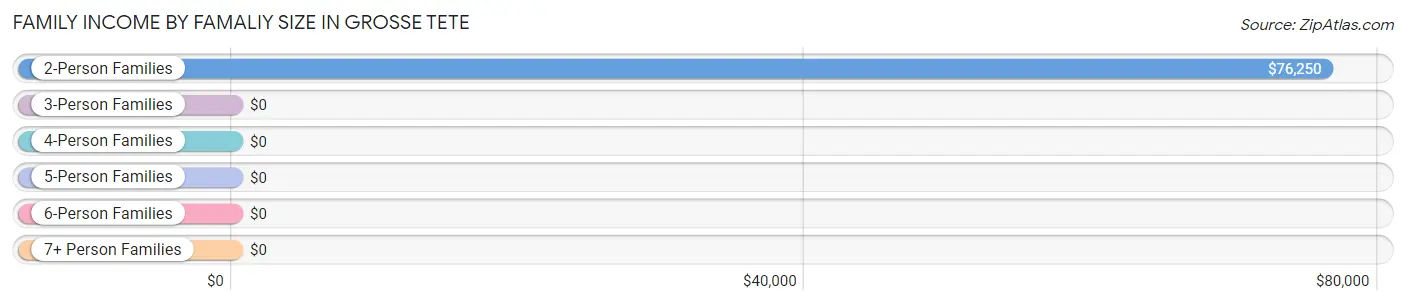
| Income Bracket | # Families | Median Income |
| 2-Person Families | 57 (55.9%) | $76,250 |
| 3-Person Families | 9 (8.8%) | $0 |
| 4-Person Families | 9 (8.8%) | $0 |
| 5-Person Families | 27 (26.5%) | $0 |
| 6-Person Families | 0 (0.0%) | $0 |
| 7+ Person Families | 0 (0.0%) | $0 |
| Total | 102 (100.0%) | $75,735 |
Family Income by Number of Earners in Grosse Tete
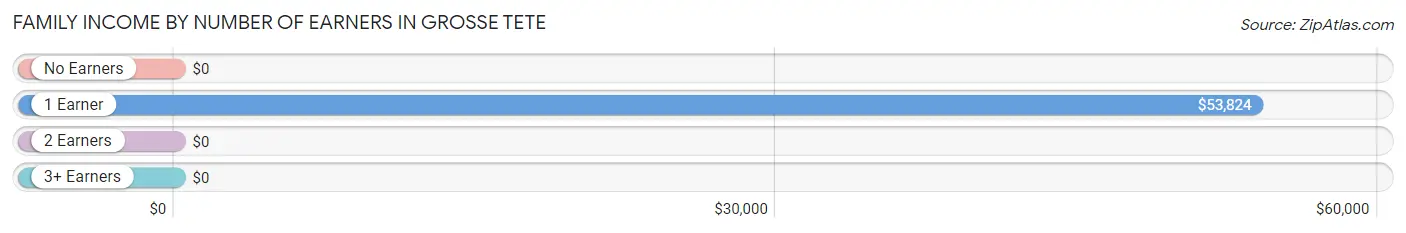
| Number of Earners | # Families | Median Income |
| No Earners | 5 (4.9%) | $0 |
| 1 Earner | 42 (41.2%) | $53,824 |
| 2 Earners | 55 (53.9%) | $0 |
| 3+ Earners | 0 (0.0%) | $0 |
| Total | 102 (100.0%) | $75,735 |
Household Income in Grosse Tete
Household Income Brackets in Grosse Tete
With 48 households falling in the category, the $50,000 to $74,999 income range is the most frequent in Grosse Tete, accounting for 30.0% of all households.
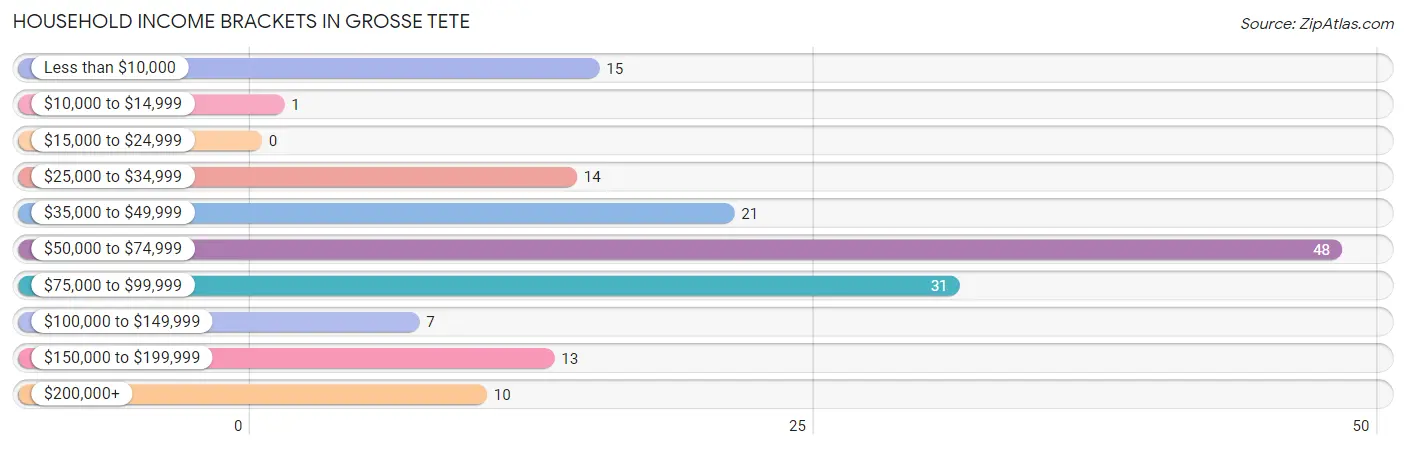
| Income Bracket | # Households | % Households |
| Less than $10,000 | 15 | 9.4% |
| $10,000 to $14,999 | 1 | 0.6% |
| $15,000 to $24,999 | 0 | 0.0% |
| $25,000 to $34,999 | 14 | 8.8% |
| $35,000 to $49,999 | 21 | 13.1% |
| $50,000 to $74,999 | 48 | 30.0% |
| $75,000 to $99,999 | 31 | 19.4% |
| $100,000 to $149,999 | 7 | 4.4% |
| $150,000 to $199,999 | 13 | 8.1% |
| $200,000+ | 10 | 6.3% |
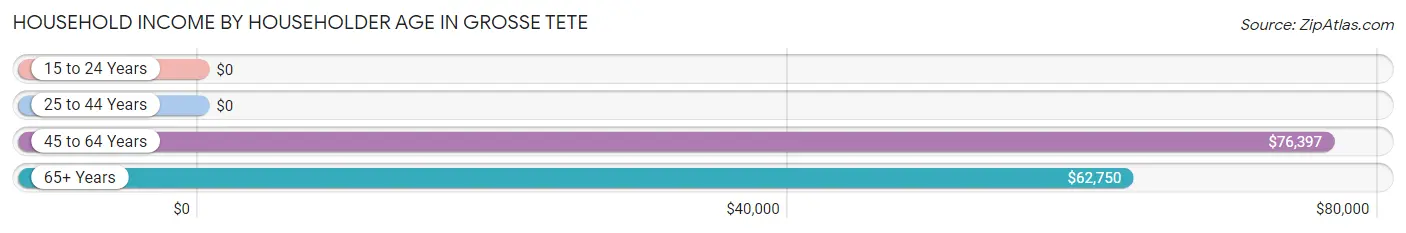
Household Income by Householder Age in Grosse Tete
The median household income in Grosse Tete is $59,038, with the highest median household income of $76,397 found in the 45 to 64 years age bracket for the primary householder. A total of 69 households (43.1%) fall into this category. Meanwhile, the 15 to 24 years age bracket for the primary householder has the lowest median household income of $0, with 11 households (6.9%) in this group.
| Income Bracket | # Households | Median Income |
| 15 to 24 Years | 11 (6.9%) | $0 |
| 25 to 44 Years | 48 (30.0%) | $0 |
| 45 to 64 Years | 69 (43.1%) | $76,397 |
| 65+ Years | 32 (20.0%) | $62,750 |
| Total | 160 (100.0%) | $59,038 |
Poverty in Grosse Tete
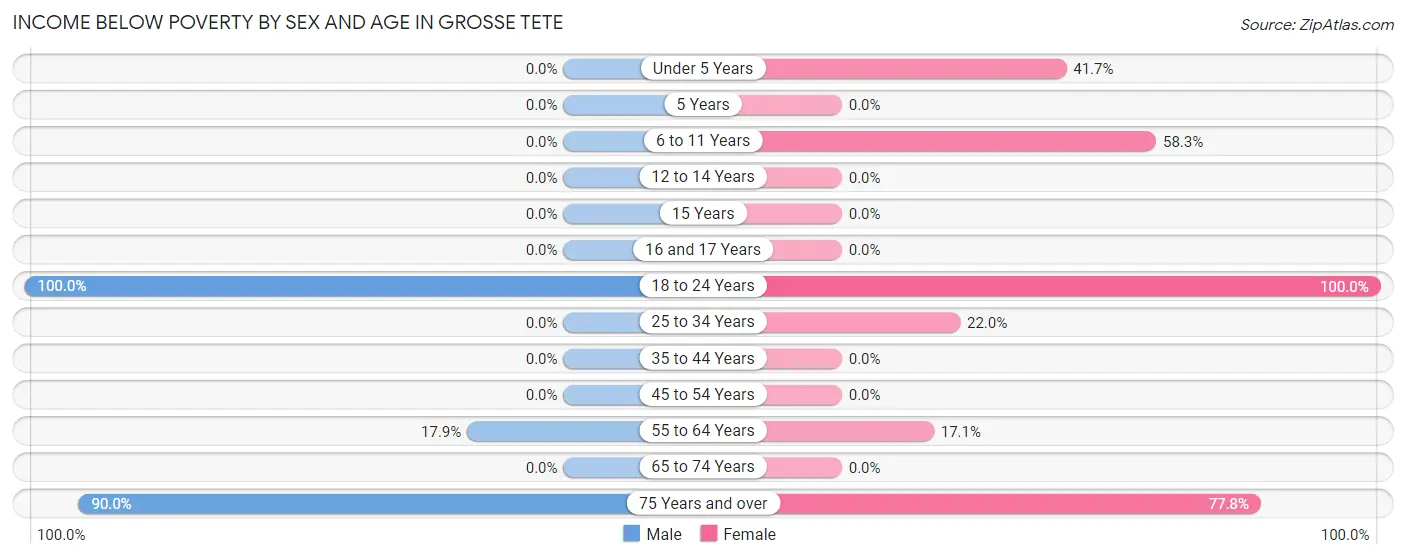
Income Below Poverty by Sex and Age in Grosse Tete
With 16.4% poverty level for males and 26.3% for females among the residents of Grosse Tete, 18 to 24 year old males and 18 to 24 year old females are the most vulnerable to poverty, with 9 males (100.0%) and 11 females (100.0%) in their respective age groups living below the poverty level.
| Age Bracket | Male | Female |
| Under 5 Years | 0 (0.0%) | 10 (41.7%) |
| 5 Years | 0 (0.0%) | 0 (0.0%) |
| 6 to 11 Years | 0 (0.0%) | 7 (58.3%) |
| 12 to 14 Years | 0 (0.0%) | 0 (0.0%) |
| 15 Years | 0 (0.0%) | 0 (0.0%) |
| 16 and 17 Years | 0 (0.0%) | 0 (0.0%) |
| 18 to 24 Years | 9 (100.0%) | 11 (100.0%) |
| 25 to 34 Years | 0 (0.0%) | 9 (22.0%) |
| 35 to 44 Years | 0 (0.0%) | 0 (0.0%) |
| 45 to 54 Years | 0 (0.0%) | 0 (0.0%) |
| 55 to 64 Years | 5 (17.9%) | 7 (17.1%) |
| 65 to 74 Years | 0 (0.0%) | 0 (0.0%) |
| 75 Years and over | 18 (90.0%) | 7 (77.8%) |
| Total | 32 (16.4%) | 51 (26.3%) |
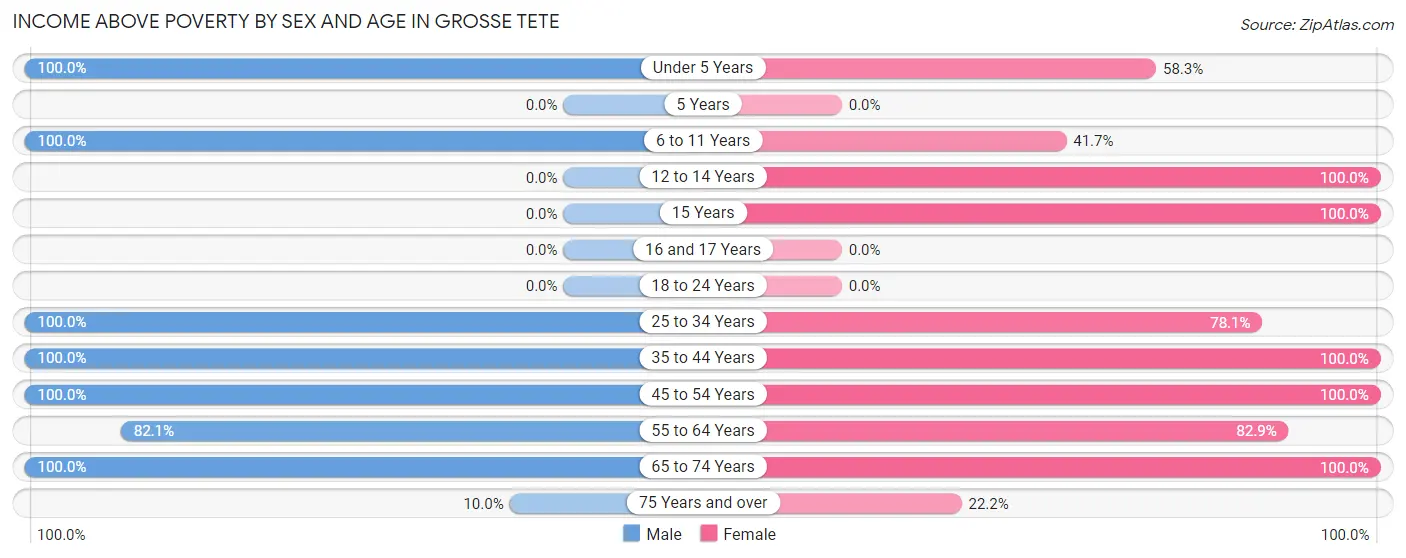
Income Above Poverty by Sex and Age in Grosse Tete
According to the poverty statistics in Grosse Tete, males aged under 5 years and females aged 12 to 14 years are the age groups that are most secure financially, with 100.0% of males and 100.0% of females in these age groups living above the poverty line.
| Age Bracket | Male | Female |
| Under 5 Years | 9 (100.0%) | 14 (58.3%) |
| 5 Years | 0 (0.0%) | 0 (0.0%) |
| 6 to 11 Years | 26 (100.0%) | 5 (41.7%) |
| 12 to 14 Years | 0 (0.0%) | 11 (100.0%) |
| 15 Years | 0 (0.0%) | 11 (100.0%) |
| 16 and 17 Years | 0 (0.0%) | 0 (0.0%) |
| 18 to 24 Years | 0 (0.0%) | 0 (0.0%) |
| 25 to 34 Years | 33 (100.0%) | 32 (78.0%) |
| 35 to 44 Years | 10 (100.0%) | 4 (100.0%) |
| 45 to 54 Years | 38 (100.0%) | 14 (100.0%) |
| 55 to 64 Years | 23 (82.1%) | 34 (82.9%) |
| 65 to 74 Years | 22 (100.0%) | 16 (100.0%) |
| 75 Years and over | 2 (10.0%) | 2 (22.2%) |
| Total | 163 (83.6%) | 143 (73.7%) |
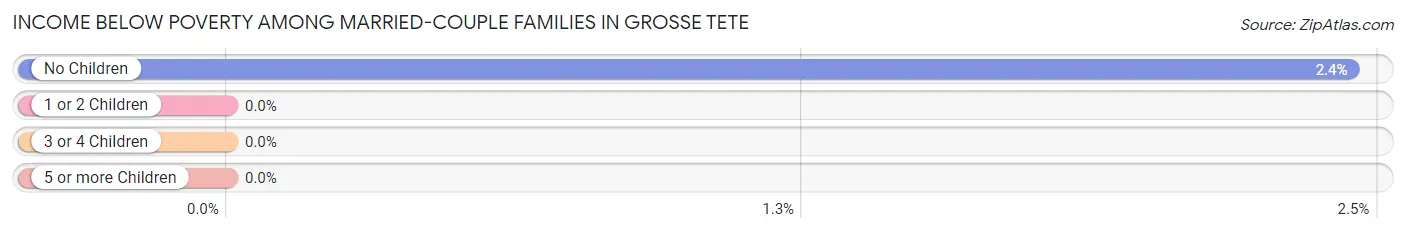
Income Below Poverty Among Married-Couple Families in Grosse Tete
The poverty statistics for married-couple families in Grosse Tete show that 1.3% or 1 of the total 77 families live below the poverty line. Families with no children have the highest poverty rate of 2.4%, comprising of 1 families. On the other hand, families with 1 or 2 children have the lowest poverty rate of 0.0%, which includes 0 families.
| Children | Above Poverty | Below Poverty |
| No Children | 40 (97.6%) | 1 (2.4%) |
| 1 or 2 Children | 9 (100.0%) | 0 (0.0%) |
| 3 or 4 Children | 27 (100.0%) | 0 (0.0%) |
| 5 or more Children | 0 (0.0%) | 0 (0.0%) |
| Total | 76 (98.7%) | 1 (1.3%) |
Income Below Poverty Among Single-Parent Households in Grosse Tete
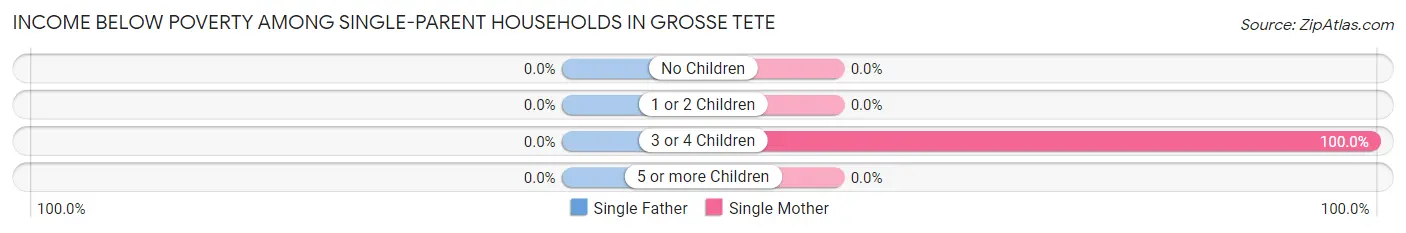
| Children | Single Father | Single Mother |
| No Children | 0 (0.0%) | 0 (0.0%) |
| 1 or 2 Children | 0 (0.0%) | 0 (0.0%) |
| 3 or 4 Children | 0 (0.0%) | 9 (100.0%) |
| 5 or more Children | 0 (0.0%) | 0 (0.0%) |
| Total | 0 (0.0%) | 9 (75.0%) |
Income Below Poverty Among Married-Couple vs Single-Parent Households in Grosse Tete
The poverty data for Grosse Tete shows that 1 of the married-couple family households (1.3%) and 9 of the single-parent households (36.0%) are living below the poverty level. Within the married-couple family households, those with no children have the highest poverty rate, with 1 households (2.4%) falling below the poverty line. Among the single-parent households, those with 3 or 4 children have the highest poverty rate, with 9 household (100.0%) living below poverty.
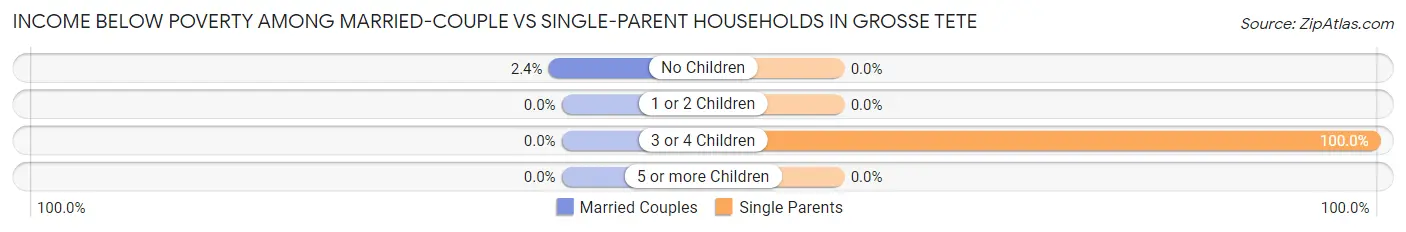
| Children | Married-Couple Families | Single-Parent Households |
| No Children | 1 (2.4%) | 0 (0.0%) |
| 1 or 2 Children | 0 (0.0%) | 0 (0.0%) |
| 3 or 4 Children | 0 (0.0%) | 9 (100.0%) |
| 5 or more Children | 0 (0.0%) | 0 (0.0%) |
| Total | 1 (1.3%) | 9 (36.0%) |
Race in Grosse Tete
The most populous races in Grosse Tete are White / Caucasian (307 | 78.9%), Black / African American (78 | 20.1%), and Two or more Races (4 | 1.0%).
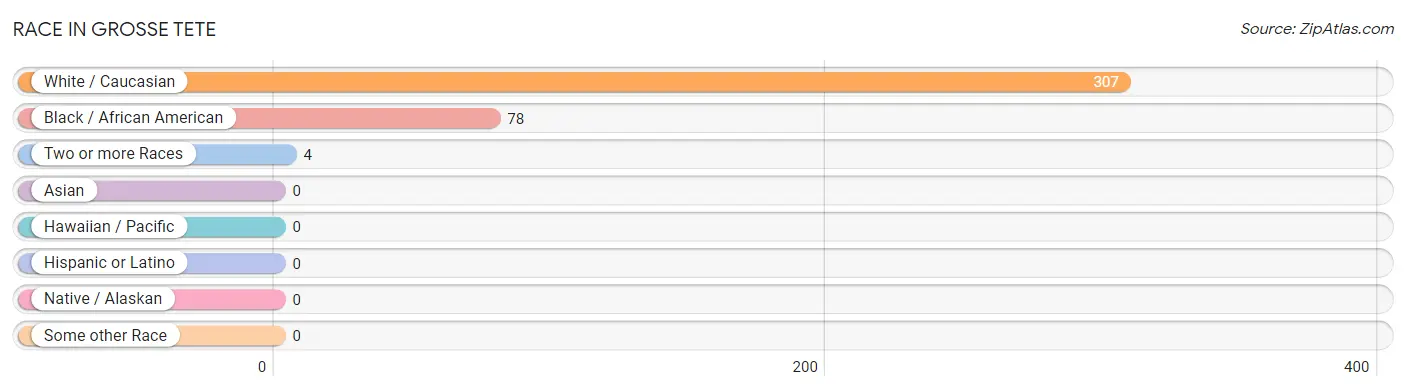
| Race | # Population | % Population |
| Asian | 0 | 0.0% |
| Black / African American | 78 | 20.1% |
| Hawaiian / Pacific | 0 | 0.0% |
| Hispanic or Latino | 0 | 0.0% |
| Native / Alaskan | 0 | 0.0% |
| White / Caucasian | 307 | 78.9% |
| Two or more Races | 4 | 1.0% |
| Some other Race | 0 | 0.0% |
| Total | 389 | 100.0% |
Ancestry in Grosse Tete
The most populous ancestries reported in Grosse Tete are American (141 | 36.2%), French (110 | 28.3%), German (51 | 13.1%), Irish (28 | 7.2%), and Italian (19 | 4.9%), together accounting for 89.7% of all Grosse Tete residents.
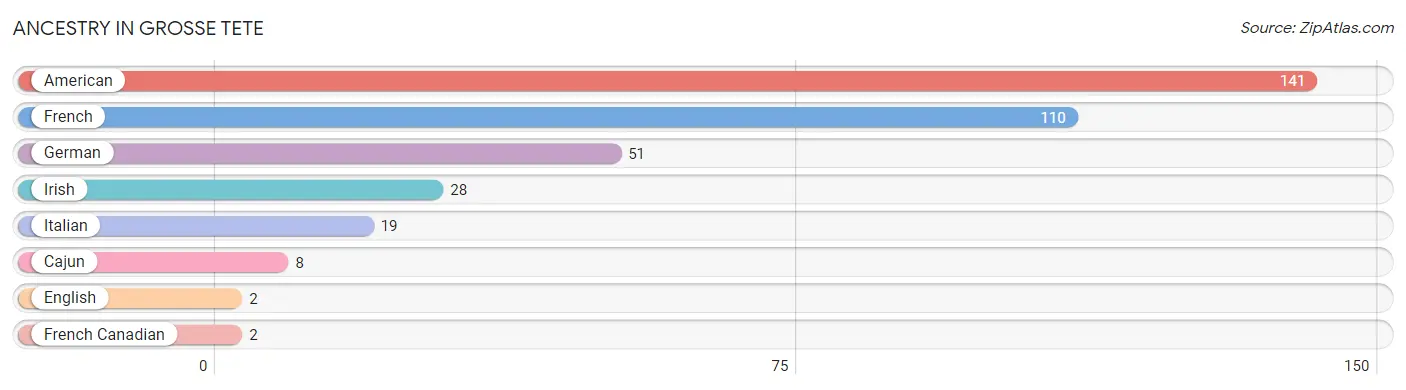
| Ancestry | # Population | % Population |
| American | 141 | 36.2% |
| Cajun | 8 | 2.1% |
| English | 2 | 0.5% |
| French | 110 | 28.3% |
| French Canadian | 2 | 0.5% |
| German | 51 | 13.1% |
| Irish | 28 | 7.2% |
| Italian | 19 | 4.9% | View All 8 Rows |
Immigrants in Grosse Tete

| Immigration Origin | # Population | % Population | View All 0 Rows |
Sex and Age in Grosse Tete
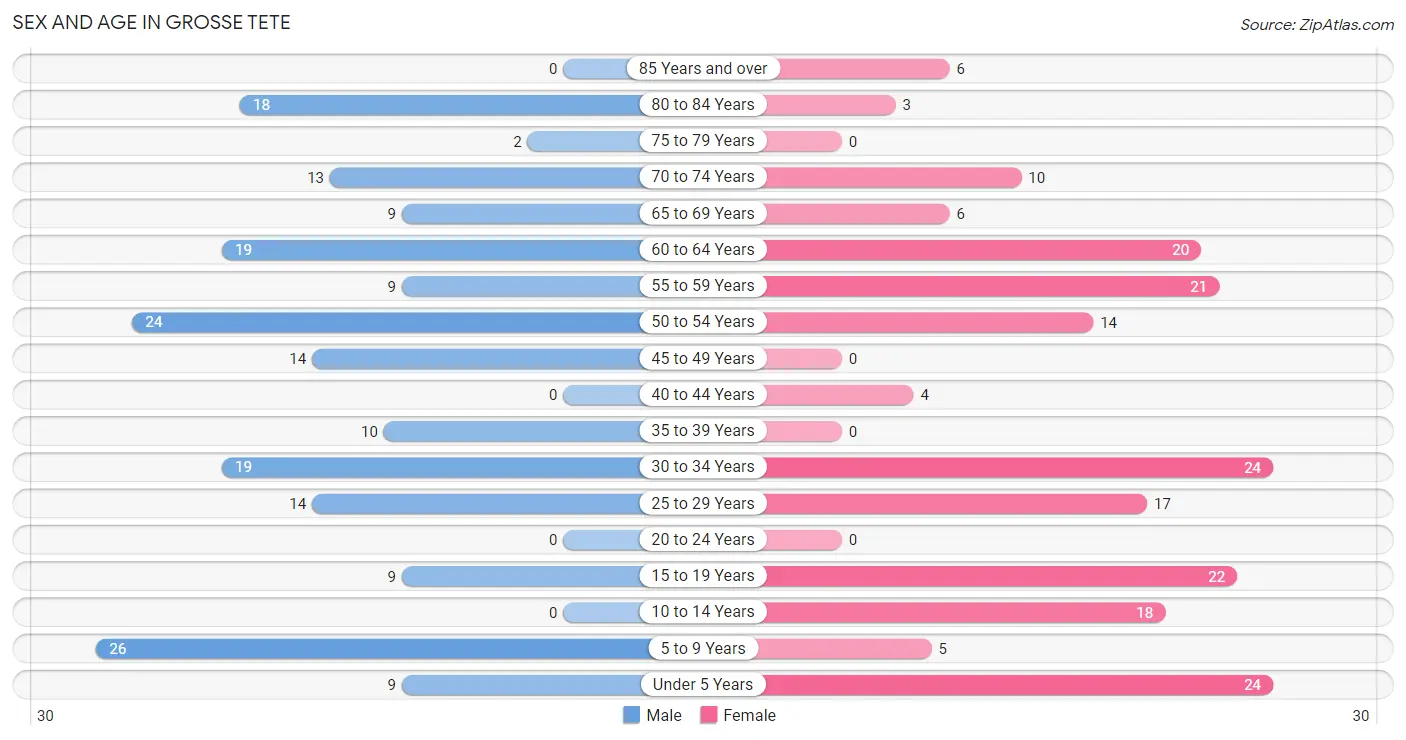
Sex and Age in Grosse Tete
The most populous age groups in Grosse Tete are 5 to 9 Years (26 | 13.3%) for men and Under 5 Years (24 | 12.4%) for women.
| Age Bracket | Male | Female |
| Under 5 Years | 9 (4.6%) | 24 (12.4%) |
| 5 to 9 Years | 26 (13.3%) | 5 (2.6%) |
| 10 to 14 Years | 0 (0.0%) | 18 (9.3%) |
| 15 to 19 Years | 9 (4.6%) | 22 (11.3%) |
| 20 to 24 Years | 0 (0.0%) | 0 (0.0%) |
| 25 to 29 Years | 14 (7.2%) | 17 (8.8%) |
| 30 to 34 Years | 19 (9.7%) | 24 (12.4%) |
| 35 to 39 Years | 10 (5.1%) | 0 (0.0%) |
| 40 to 44 Years | 0 (0.0%) | 4 (2.1%) |
| 45 to 49 Years | 14 (7.2%) | 0 (0.0%) |
| 50 to 54 Years | 24 (12.3%) | 14 (7.2%) |
| 55 to 59 Years | 9 (4.6%) | 21 (10.8%) |
| 60 to 64 Years | 19 (9.7%) | 20 (10.3%) |
| 65 to 69 Years | 9 (4.6%) | 6 (3.1%) |
| 70 to 74 Years | 13 (6.7%) | 10 (5.1%) |
| 75 to 79 Years | 2 (1.0%) | 0 (0.0%) |
| 80 to 84 Years | 18 (9.2%) | 3 (1.5%) |
| 85 Years and over | 0 (0.0%) | 6 (3.1%) |
| Total | 195 (100.0%) | 194 (100.0%) |
Families and Households in Grosse Tete
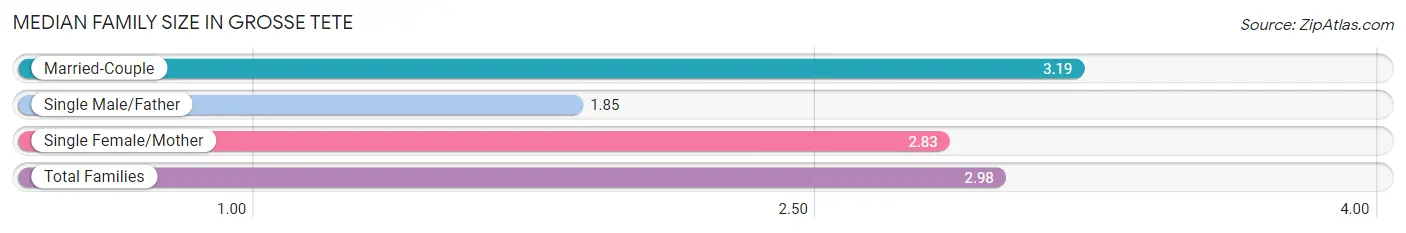
Median Family Size in Grosse Tete
The median family size in Grosse Tete is 2.98 persons per family, with married-couple families (77 | 75.5%) accounting for the largest median family size of 3.19 persons per family. On the other hand, single male/father families (13 | 12.8%) represent the smallest median family size with 1.85 persons per family.
| Family Type | # Families | Family Size |
| Married-Couple | 77 (75.5%) | 3.19 |
| Single Male/Father | 13 (12.8%) | 1.85 |
| Single Female/Mother | 12 (11.8%) | 2.83 |
| Total Families | 102 (100.0%) | 2.98 |
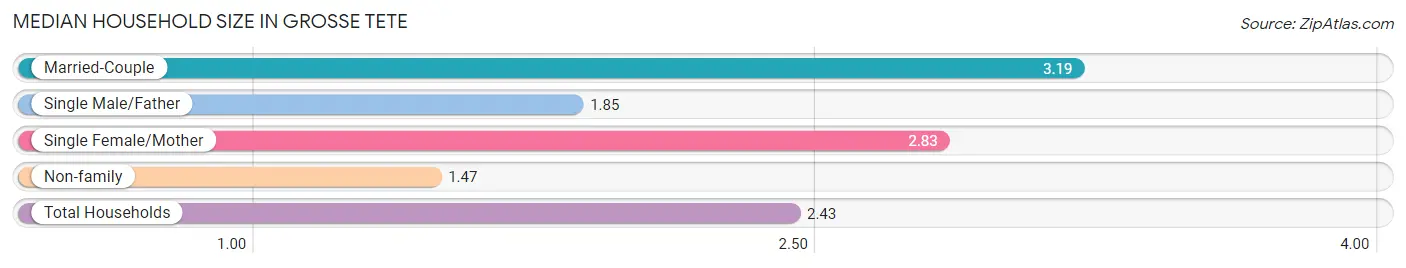
Median Household Size in Grosse Tete
The median household size in Grosse Tete is 2.43 persons per household, with married-couple households (77 | 48.1%) accounting for the largest median household size of 3.19 persons per household. non-family households (58 | 36.2%) represent the smallest median household size with 1.47 persons per household.
| Household Type | # Households | Household Size |
| Married-Couple | 77 (48.1%) | 3.19 |
| Single Male/Father | 13 (8.1%) | 1.85 |
| Single Female/Mother | 12 (7.5%) | 2.83 |
| Non-family | 58 (36.2%) | 1.47 |
| Total Households | 160 (100.0%) | 2.43 |
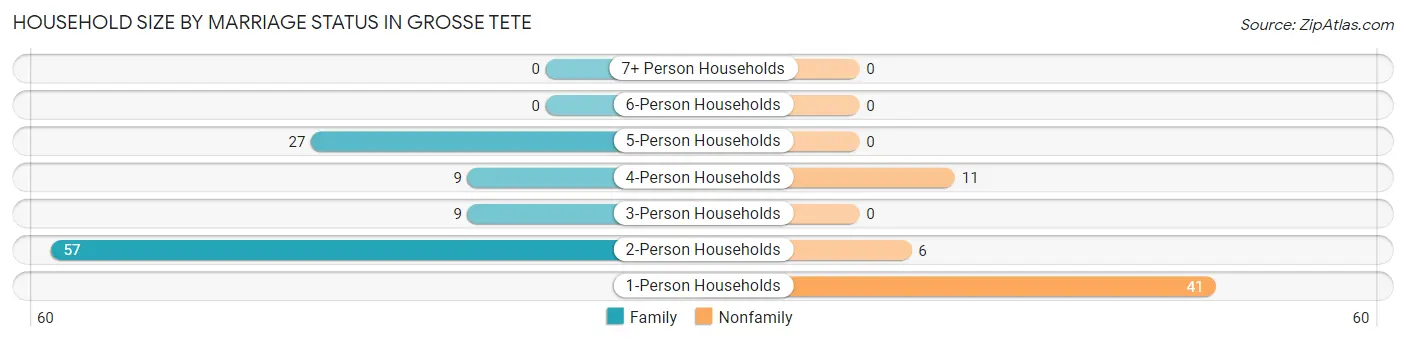
Household Size by Marriage Status in Grosse Tete
Out of a total of 160 households in Grosse Tete, 102 (63.7%) are family households, while 58 (36.2%) are nonfamily households. The most numerous type of family households are 2-person households, comprising 57, and the most common type of nonfamily households are 1-person households, comprising 41.
| Household Size | Family Households | Nonfamily Households |
| 1-Person Households | - | 41 (25.6%) |
| 2-Person Households | 57 (35.6%) | 6 (3.7%) |
| 3-Person Households | 9 (5.6%) | 0 (0.0%) |
| 4-Person Households | 9 (5.6%) | 11 (6.9%) |
| 5-Person Households | 27 (16.9%) | 0 (0.0%) |
| 6-Person Households | 0 (0.0%) | 0 (0.0%) |
| 7+ Person Households | 0 (0.0%) | 0 (0.0%) |
| Total | 102 (63.7%) | 58 (36.2%) |
Female Fertility in Grosse Tete
Fertility by Age in Grosse Tete
Average fertility rate in Grosse Tete is 243.0 births per 1,000 women. Women in the age bracket of 20 to 34 years have the highest fertility rate with 415.0 births per 1,000 women. Women in the age bracket of 20 to 34 years acount for 100.0% of all women with births.
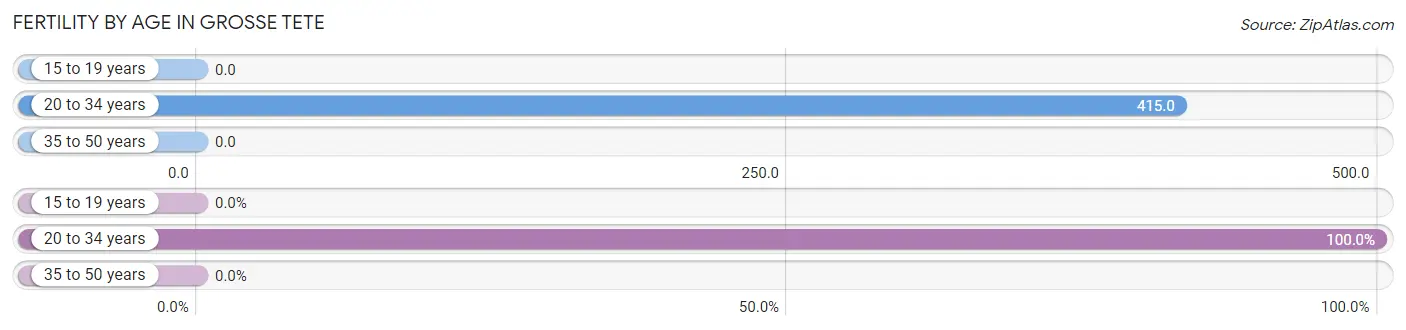
| Age Bracket | Women with Births | Births / 1,000 Women |
| 15 to 19 years | 0 (0.0%) | 0.0 |
| 20 to 34 years | 17 (100.0%) | 415.0 |
| 35 to 50 years | 0 (0.0%) | 0.0 |
| Total | 17 (100.0%) | 243.0 |
Fertility by Age by Marriage Status in Grosse Tete
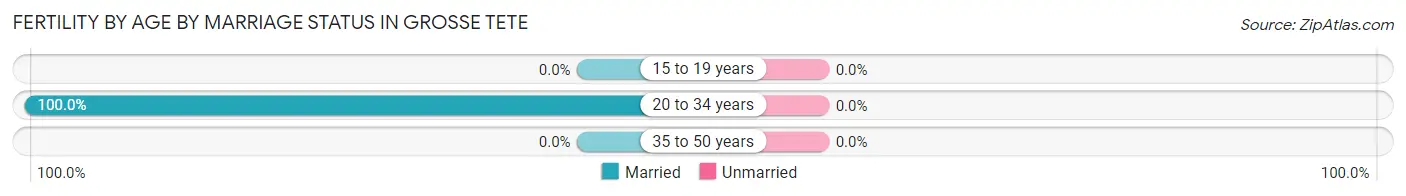
| Age Bracket | Married | Unmarried |
| 15 to 19 years | 0 (0.0%) | 0 (0.0%) |
| 20 to 34 years | 17 (100.0%) | 0 (0.0%) |
| 35 to 50 years | 0 (0.0%) | 0 (0.0%) |
| Total | 17 (100.0%) | 0 (0.0%) |
Fertility by Education in Grosse Tete
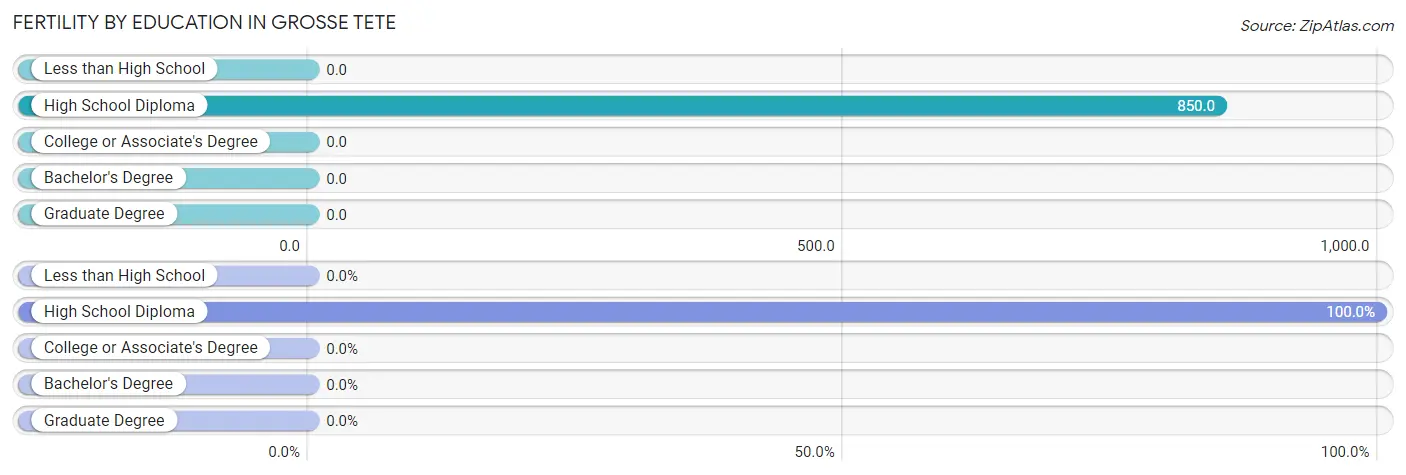
| Educational Attainment | Women with Births | Births / 1,000 Women |
| Less than High School | 0 (0.0%) | 0.0 |
| High School Diploma | 17 (100.0%) | 850.0 |
| College or Associate's Degree | 0 (0.0%) | 0.0 |
| Bachelor's Degree | 0 (0.0%) | 0.0 |
| Graduate Degree | 0 (0.0%) | 0.0 |
| Total | 17 (100.0%) | 243.0 |
Fertility by Education by Marriage Status in Grosse Tete
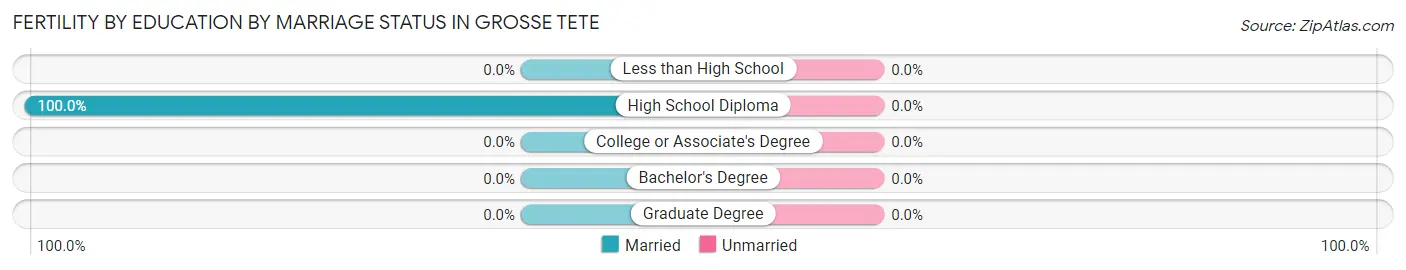
| Educational Attainment | Married | Unmarried |
| Less than High School | 0 (0.0%) | 0 (0.0%) |
| High School Diploma | 17 (100.0%) | 0 (0.0%) |
| College or Associate's Degree | 0 (0.0%) | 0 (0.0%) |
| Bachelor's Degree | 0 (0.0%) | 0 (0.0%) |
| Graduate Degree | 0 (0.0%) | 0 (0.0%) |
| Total | 17 (100.0%) | 0 (0.0%) |
Employment Characteristics in Grosse Tete
Employment by Class of Employer in Grosse Tete
Among the 161 employed individuals in Grosse Tete, private company employees (136 | 84.5%), state government employees (16 | 9.9%), and local government employees (5 | 3.1%) make up the most common classes of employment.
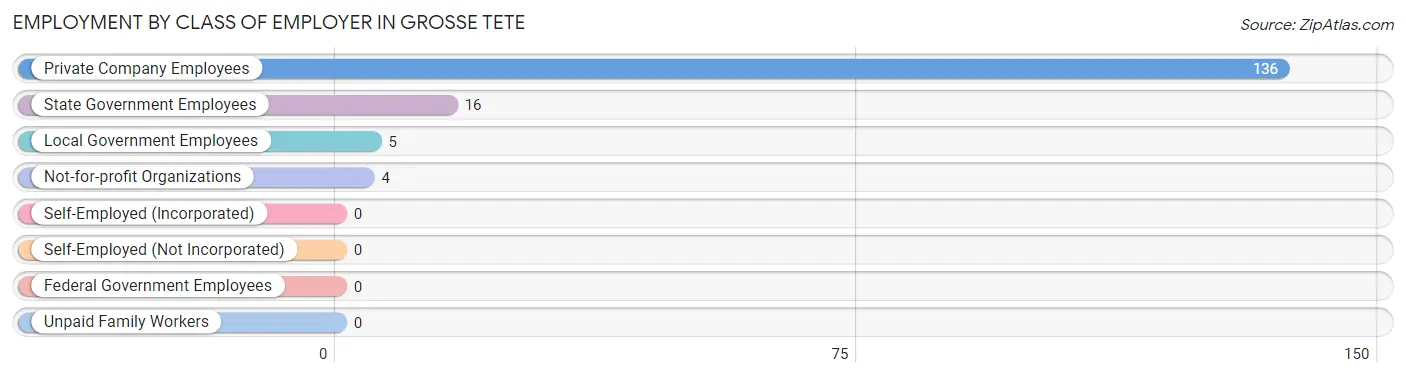
| Employer Class | # Employees | % Employees |
| Private Company Employees | 136 | 84.5% |
| Self-Employed (Incorporated) | 0 | 0.0% |
| Self-Employed (Not Incorporated) | 0 | 0.0% |
| Not-for-profit Organizations | 4 | 2.5% |
| Local Government Employees | 5 | 3.1% |
| State Government Employees | 16 | 9.9% |
| Federal Government Employees | 0 | 0.0% |
| Unpaid Family Workers | 0 | 0.0% |
| Total | 161 | 100.0% |
Employment Status by Age in Grosse Tete
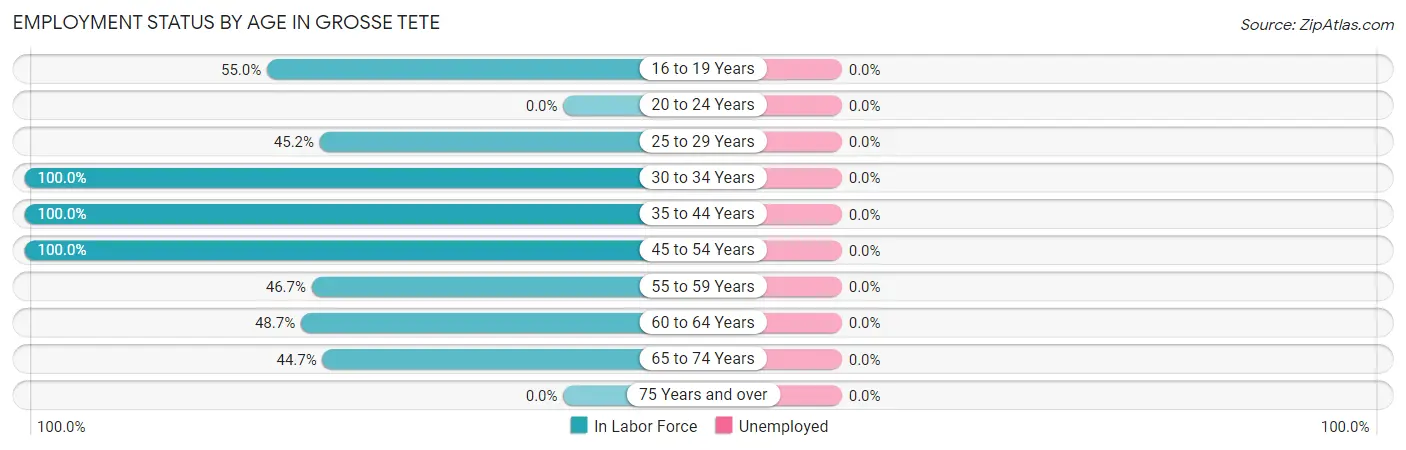
| Age Bracket | In Labor Force | Unemployed |
| 16 to 19 Years | 11 (55.0%) | 0 (0.0%) |
| 20 to 24 Years | 0 (0.0%) | 0 (0.0%) |
| 25 to 29 Years | 14 (45.2%) | 0 (0.0%) |
| 30 to 34 Years | 43 (100.0%) | 0 (0.0%) |
| 35 to 44 Years | 14 (100.0%) | 0 (0.0%) |
| 45 to 54 Years | 52 (100.0%) | 0 (0.0%) |
| 55 to 59 Years | 14 (46.7%) | 0 (0.0%) |
| 60 to 64 Years | 19 (48.7%) | 0 (0.0%) |
| 65 to 74 Years | 17 (44.7%) | 0 (0.0%) |
| 75 Years and over | 0 (0.0%) | 0 (0.0%) |
| Total | 184 (62.2%) | 0 (0.0%) |
Employment Status by Educational Attainment in Grosse Tete
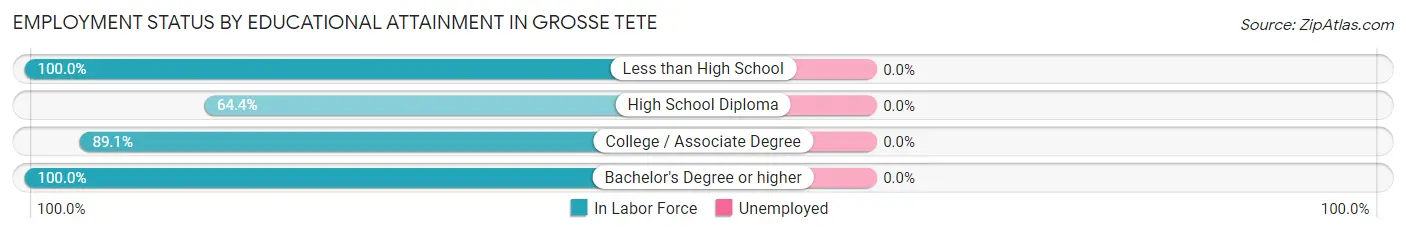
| Educational Attainment | In Labor Force | Unemployed |
| Less than High School | 9 (100.0%) | 0 (0.0%) |
| High School Diploma | 87 (64.4%) | 0 (0.0%) |
| College / Associate Degree | 41 (89.1%) | 0 (0.0%) |
| Bachelor's Degree or higher | 19 (100.0%) | 0 (0.0%) |
| Total | 156 (74.6%) | 0 (0.0%) |
Employment Occupations by Sex in Grosse Tete
Management, Business, Science and Arts Occupations
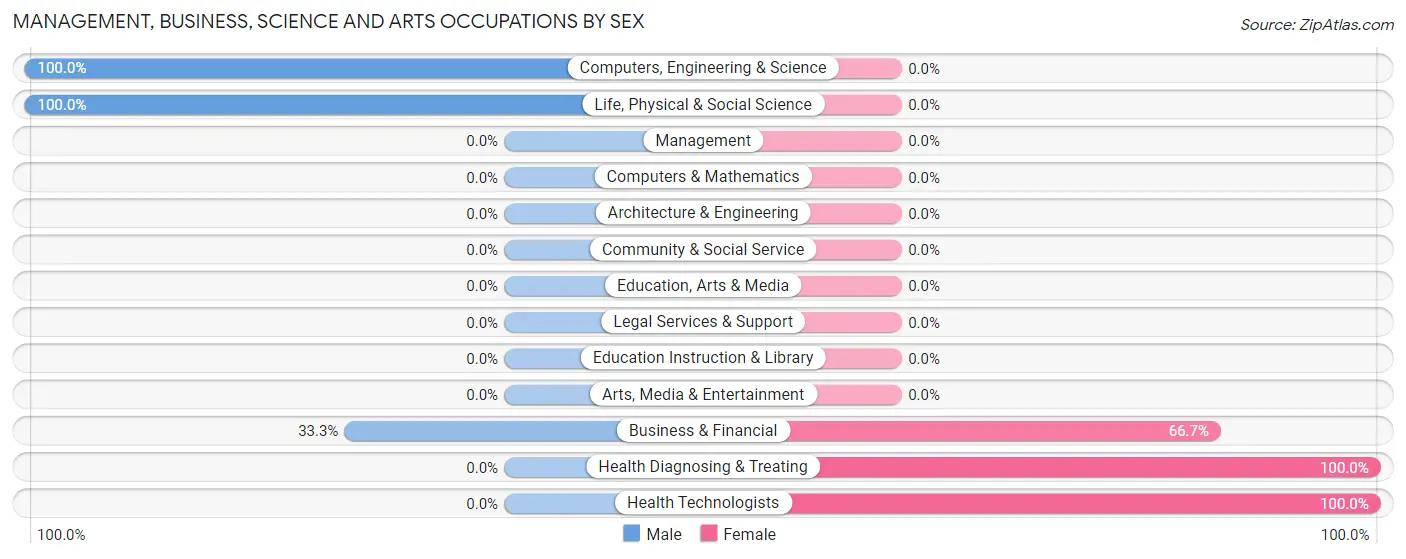
The most common Management, Business, Science and Arts occupations in Grosse Tete are Computers, Engineering & Science (17 | 9.2%), Life, Physical & Social Science (17 | 9.2%), Health Diagnosing & Treating (15 | 8.2%), Health Technologists (15 | 8.2%), and Business & Financial (6 | 3.3%).
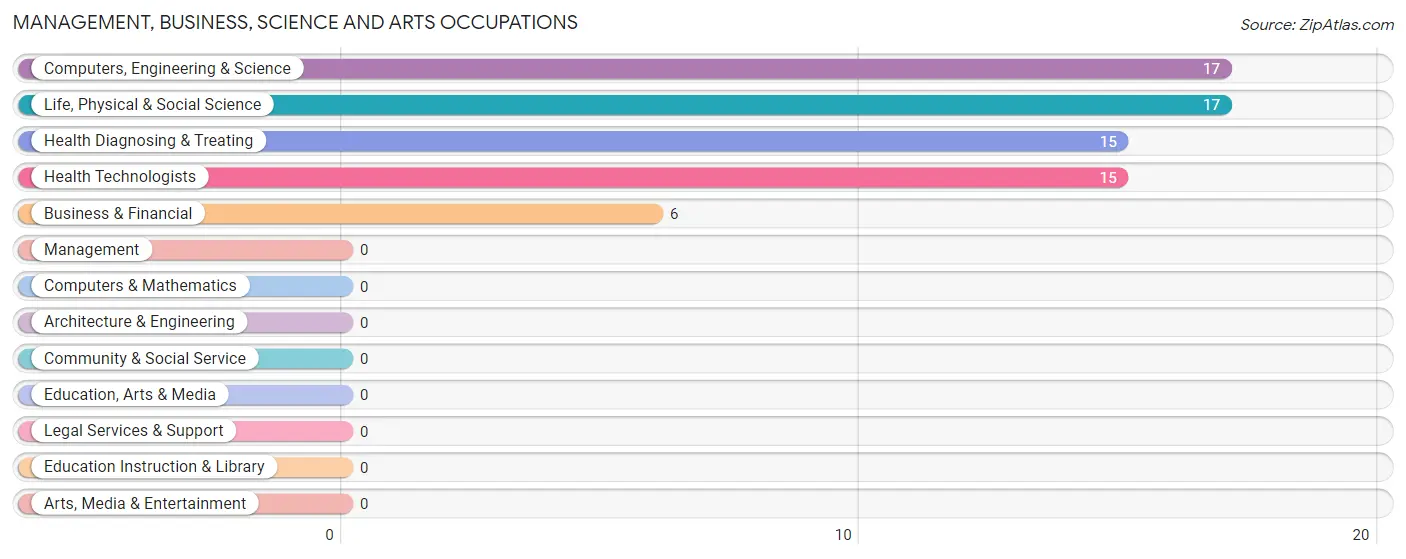
Management, Business, Science and Arts Occupations by Sex
Within the Management, Business, Science and Arts occupations in Grosse Tete, the most male-oriented occupations are Computers, Engineering & Science (100.0%), Life, Physical & Social Science (100.0%), and Business & Financial (33.3%), while the most female-oriented occupations are Health Diagnosing & Treating (100.0%), Health Technologists (100.0%), and Business & Financial (66.7%).
| Occupation | Male | Female |
| Management | 0 (0.0%) | 0 (0.0%) |
| Business & Financial | 2 (33.3%) | 4 (66.7%) |
| Computers, Engineering & Science | 17 (100.0%) | 0 (0.0%) |
| Computers & Mathematics | 0 (0.0%) | 0 (0.0%) |
| Architecture & Engineering | 0 (0.0%) | 0 (0.0%) |
| Life, Physical & Social Science | 17 (100.0%) | 0 (0.0%) |
| Community & Social Service | 0 (0.0%) | 0 (0.0%) |
| Education, Arts & Media | 0 (0.0%) | 0 (0.0%) |
| Legal Services & Support | 0 (0.0%) | 0 (0.0%) |
| Education Instruction & Library | 0 (0.0%) | 0 (0.0%) |
| Arts, Media & Entertainment | 0 (0.0%) | 0 (0.0%) |
| Health Diagnosing & Treating | 0 (0.0%) | 15 (100.0%) |
| Health Technologists | 0 (0.0%) | 15 (100.0%) |
| Total (Category) | 19 (50.0%) | 19 (50.0%) |
| Total (Overall) | 101 (54.9%) | 83 (45.1%) |
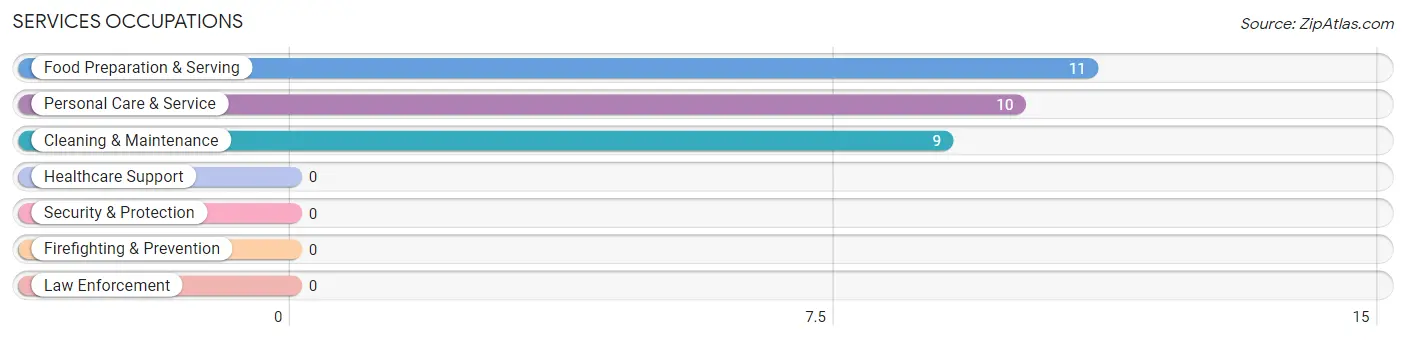
Services Occupations
The most common Services occupations in Grosse Tete are Food Preparation & Serving (11 | 6.0%), Personal Care & Service (10 | 5.4%), and Cleaning & Maintenance (9 | 4.9%).
Services Occupations by Sex
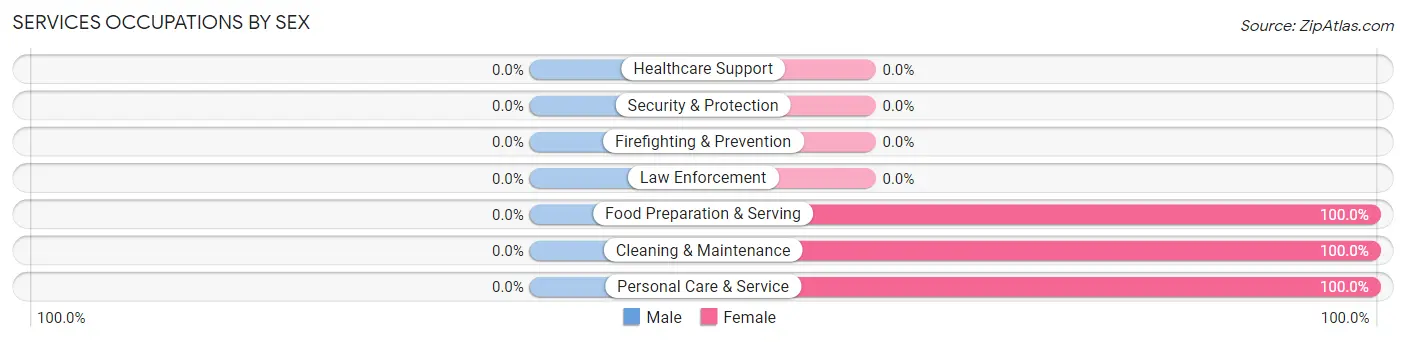
| Occupation | Male | Female |
| Healthcare Support | 0 (0.0%) | 0 (0.0%) |
| Security & Protection | 0 (0.0%) | 0 (0.0%) |
| Firefighting & Prevention | 0 (0.0%) | 0 (0.0%) |
| Law Enforcement | 0 (0.0%) | 0 (0.0%) |
| Food Preparation & Serving | 0 (0.0%) | 11 (100.0%) |
| Cleaning & Maintenance | 0 (0.0%) | 9 (100.0%) |
| Personal Care & Service | 0 (0.0%) | 10 (100.0%) |
| Total (Category) | 0 (0.0%) | 30 (100.0%) |
| Total (Overall) | 101 (54.9%) | 83 (45.1%) |
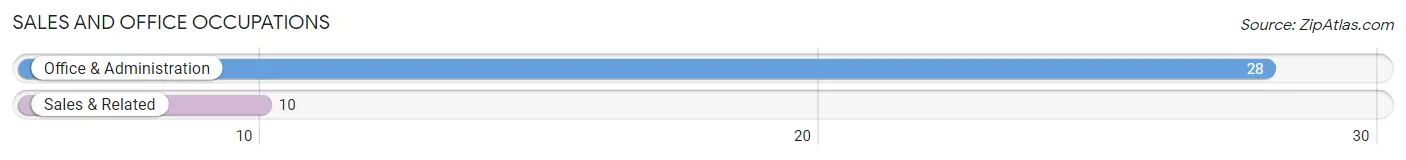
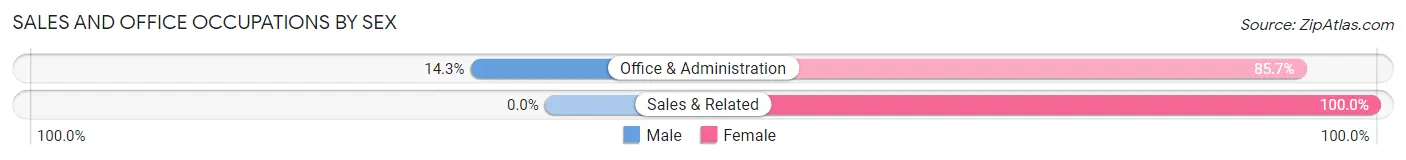
Sales and Office Occupations
The most common Sales and Office occupations in Grosse Tete are Office & Administration (28 | 15.2%), and Sales & Related (10 | 5.4%).
Sales and Office Occupations by Sex
| Occupation | Male | Female |
| Sales & Related | 0 (0.0%) | 10 (100.0%) |
| Office & Administration | 4 (14.3%) | 24 (85.7%) |
| Total (Category) | 4 (10.5%) | 34 (89.5%) |
| Total (Overall) | 101 (54.9%) | 83 (45.1%) |
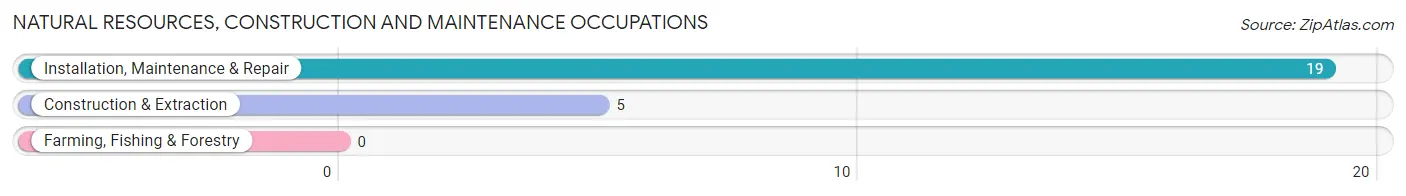
Natural Resources, Construction and Maintenance Occupations
The most common Natural Resources, Construction and Maintenance occupations in Grosse Tete are Installation, Maintenance & Repair (19 | 10.3%), and Construction & Extraction (5 | 2.7%).
Natural Resources, Construction and Maintenance Occupations by Sex
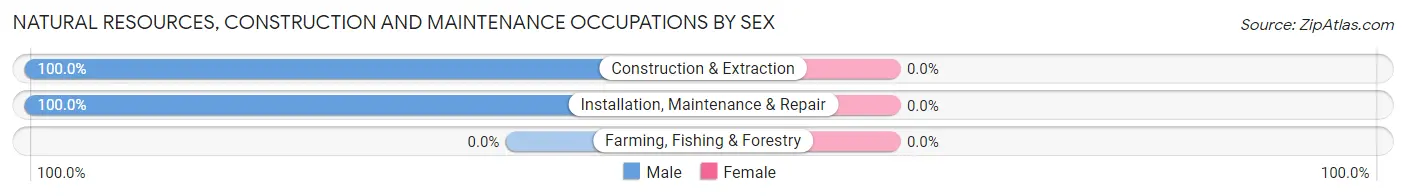
| Occupation | Male | Female |
| Farming, Fishing & Forestry | 0 (0.0%) | 0 (0.0%) |
| Construction & Extraction | 5 (100.0%) | 0 (0.0%) |
| Installation, Maintenance & Repair | 19 (100.0%) | 0 (0.0%) |
| Total (Category) | 24 (100.0%) | 0 (0.0%) |
| Total (Overall) | 101 (54.9%) | 83 (45.1%) |
Production, Transportation and Moving Occupations
The most common Production, Transportation and Moving occupations in Grosse Tete are Production (24 | 13.0%), Transportation (19 | 10.3%), and Material Moving (11 | 6.0%).
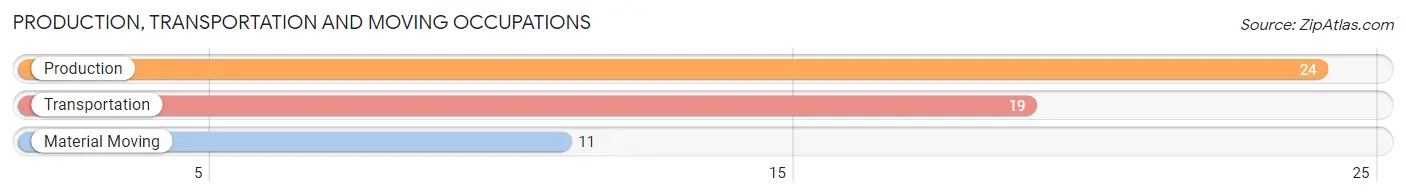
Production, Transportation and Moving Occupations by Sex
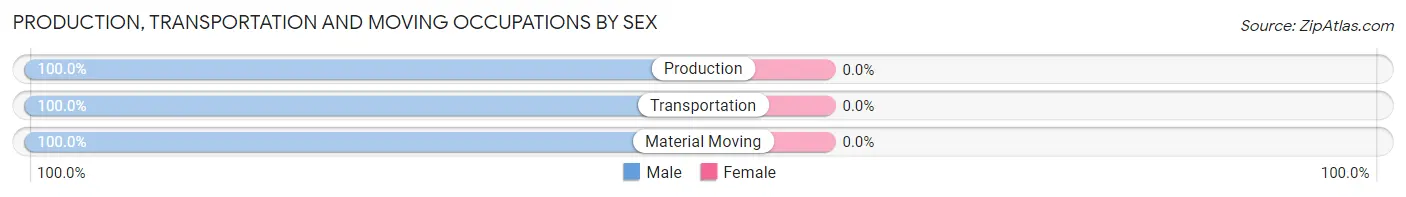
| Occupation | Male | Female |
| Production | 24 (100.0%) | 0 (0.0%) |
| Transportation | 19 (100.0%) | 0 (0.0%) |
| Material Moving | 11 (100.0%) | 0 (0.0%) |
| Total (Category) | 54 (100.0%) | 0 (0.0%) |
| Total (Overall) | 101 (54.9%) | 83 (45.1%) |
Employment Industries by Sex in Grosse Tete
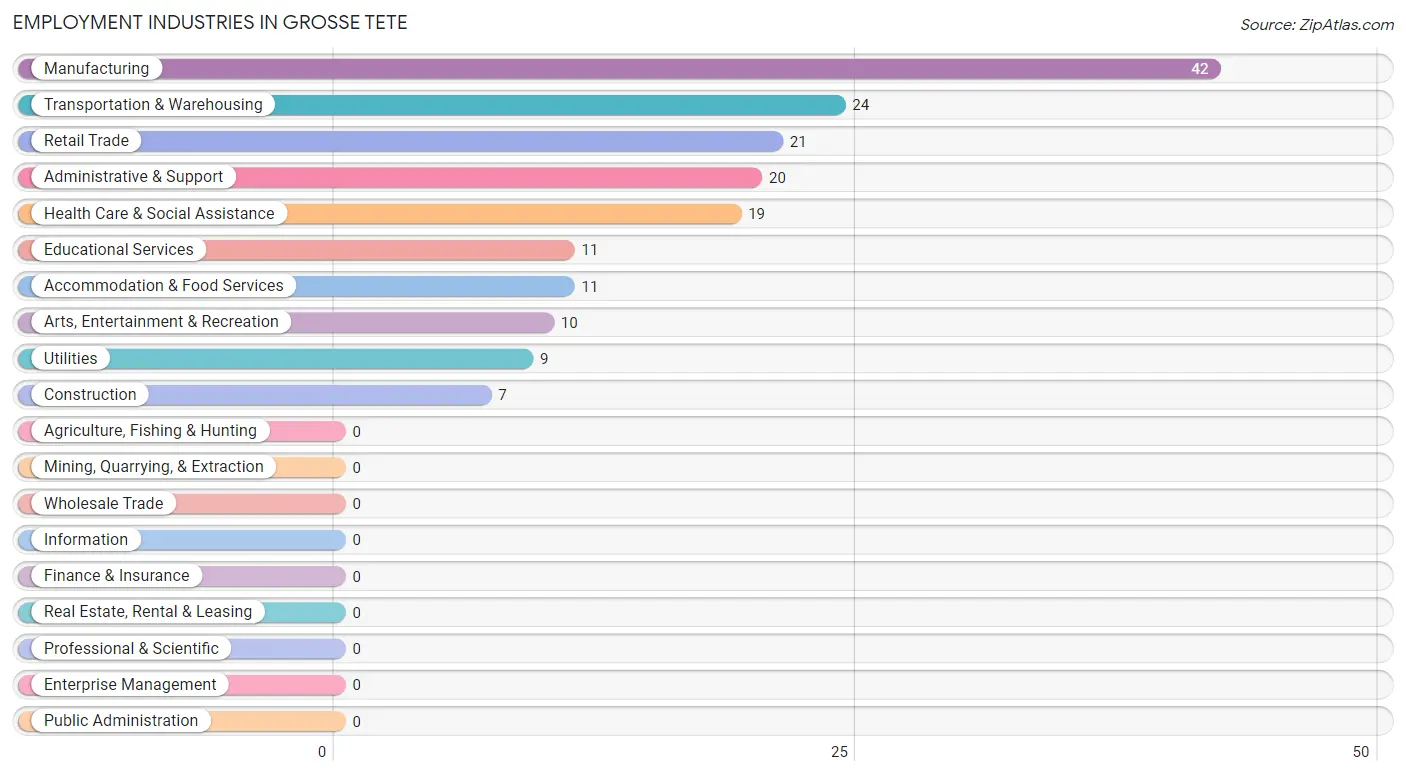
Employment Industries in Grosse Tete
The major employment industries in Grosse Tete include Manufacturing (42 | 22.8%), Transportation & Warehousing (24 | 13.0%), Retail Trade (21 | 11.4%), Administrative & Support (20 | 10.9%), and Health Care & Social Assistance (19 | 10.3%).
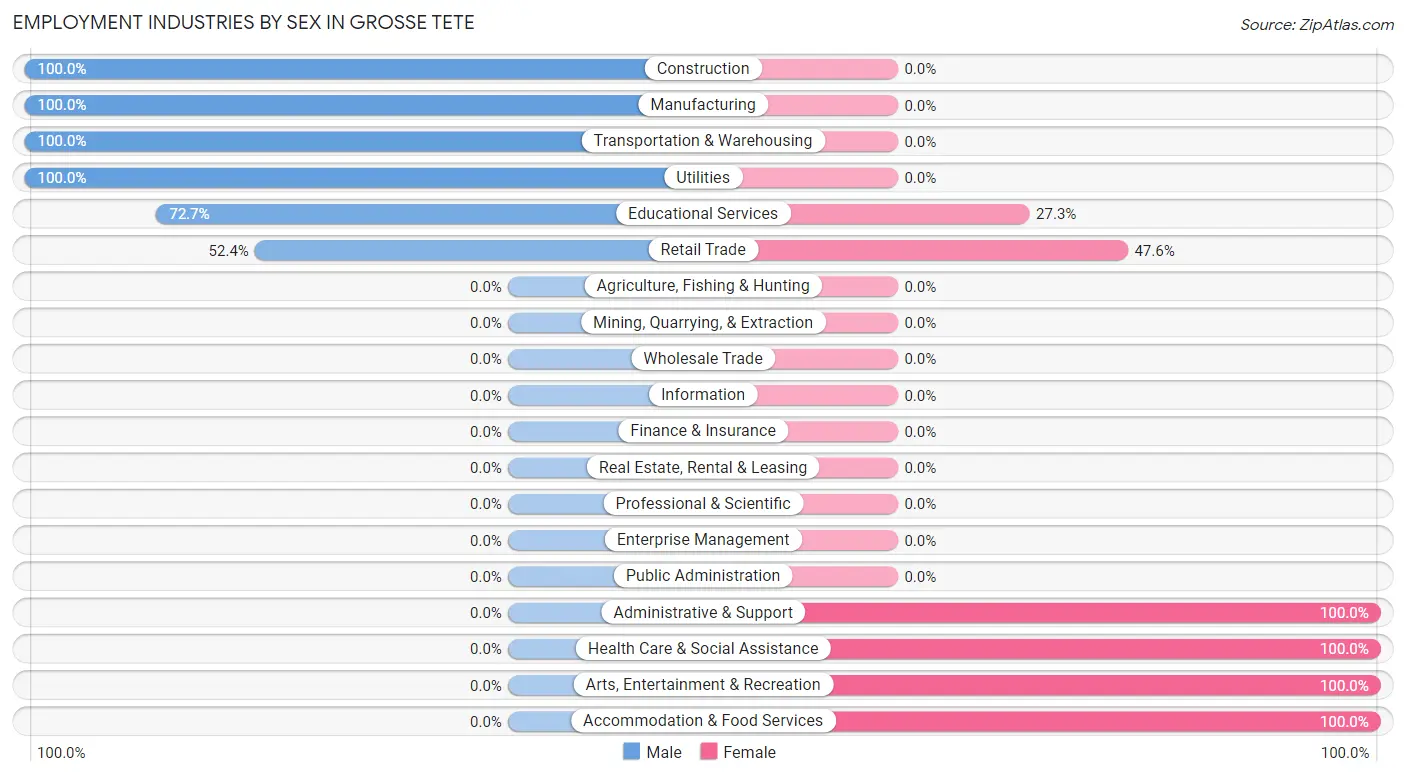
Employment Industries by Sex in Grosse Tete
The Grosse Tete industries that see more men than women are Construction (100.0%), Manufacturing (100.0%), and Transportation & Warehousing (100.0%), whereas the industries that tend to have a higher number of women are Administrative & Support (100.0%), Health Care & Social Assistance (100.0%), and Arts, Entertainment & Recreation (100.0%).
| Industry | Male | Female |
| Agriculture, Fishing & Hunting | 0 (0.0%) | 0 (0.0%) |
| Mining, Quarrying, & Extraction | 0 (0.0%) | 0 (0.0%) |
| Construction | 7 (100.0%) | 0 (0.0%) |
| Manufacturing | 42 (100.0%) | 0 (0.0%) |
| Wholesale Trade | 0 (0.0%) | 0 (0.0%) |
| Retail Trade | 11 (52.4%) | 10 (47.6%) |
| Transportation & Warehousing | 24 (100.0%) | 0 (0.0%) |
| Utilities | 9 (100.0%) | 0 (0.0%) |
| Information | 0 (0.0%) | 0 (0.0%) |
| Finance & Insurance | 0 (0.0%) | 0 (0.0%) |
| Real Estate, Rental & Leasing | 0 (0.0%) | 0 (0.0%) |
| Professional & Scientific | 0 (0.0%) | 0 (0.0%) |
| Enterprise Management | 0 (0.0%) | 0 (0.0%) |
| Administrative & Support | 0 (0.0%) | 20 (100.0%) |
| Educational Services | 8 (72.7%) | 3 (27.3%) |
| Health Care & Social Assistance | 0 (0.0%) | 19 (100.0%) |
| Arts, Entertainment & Recreation | 0 (0.0%) | 10 (100.0%) |
| Accommodation & Food Services | 0 (0.0%) | 11 (100.0%) |
| Public Administration | 0 (0.0%) | 0 (0.0%) |
| Total | 101 (54.9%) | 83 (45.1%) |
Education in Grosse Tete
School Enrollment in Grosse Tete
The most common levels of schooling among the 78 students in Grosse Tete are middle school (31 | 39.7%), high school (22 | 28.2%), and elementary school (18 | 23.1%).
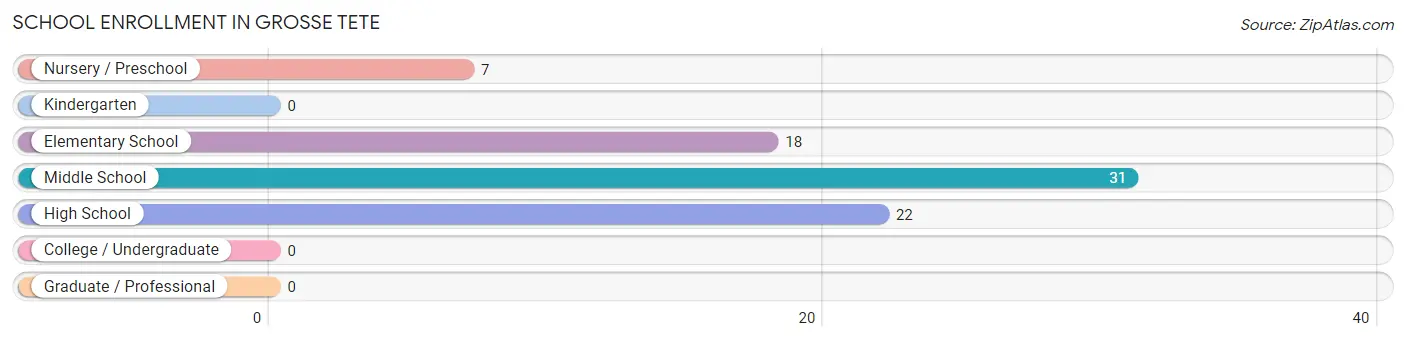
| School Level | # Students | % Students |
| Nursery / Preschool | 7 | 9.0% |
| Kindergarten | 0 | 0.0% |
| Elementary School | 18 | 23.1% |
| Middle School | 31 | 39.7% |
| High School | 22 | 28.2% |
| College / Undergraduate | 0 | 0.0% |
| Graduate / Professional | 0 | 0.0% |
| Total | 78 | 100.0% |
School Enrollment by Age by Funding Source in Grosse Tete
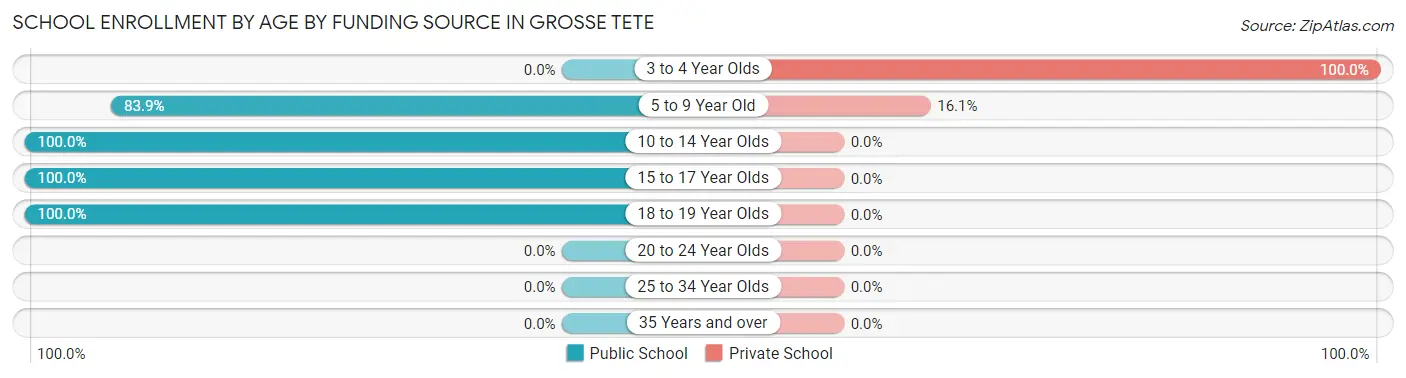
Out of a total of 78 students who are enrolled in schools in Grosse Tete, 12 (15.4%) attend a private institution, while the remaining 66 (84.6%) are enrolled in public schools. The age group of 3 to 4 year olds has the highest likelihood of being enrolled in private schools, with 7 (100.0% in the age bracket) enrolled. Conversely, the age group of 10 to 14 year olds has the lowest likelihood of being enrolled in a private school, with 18 (100.0% in the age bracket) attending a public institution.
| Age Bracket | Public School | Private School |
| 3 to 4 Year Olds | 0 (0.0%) | 7 (100.0%) |
| 5 to 9 Year Old | 26 (83.9%) | 5 (16.1%) |
| 10 to 14 Year Olds | 18 (100.0%) | 0 (0.0%) |
| 15 to 17 Year Olds | 11 (100.0%) | 0 (0.0%) |
| 18 to 19 Year Olds | 11 (100.0%) | 0 (0.0%) |
| 20 to 24 Year Olds | 0 (0.0%) | 0 (0.0%) |
| 25 to 34 Year Olds | 0 (0.0%) | 0 (0.0%) |
| 35 Years and over | 0 (0.0%) | 0 (0.0%) |
| Total | 66 (84.6%) | 12 (15.4%) |
Educational Attainment by Field of Study in Grosse Tete
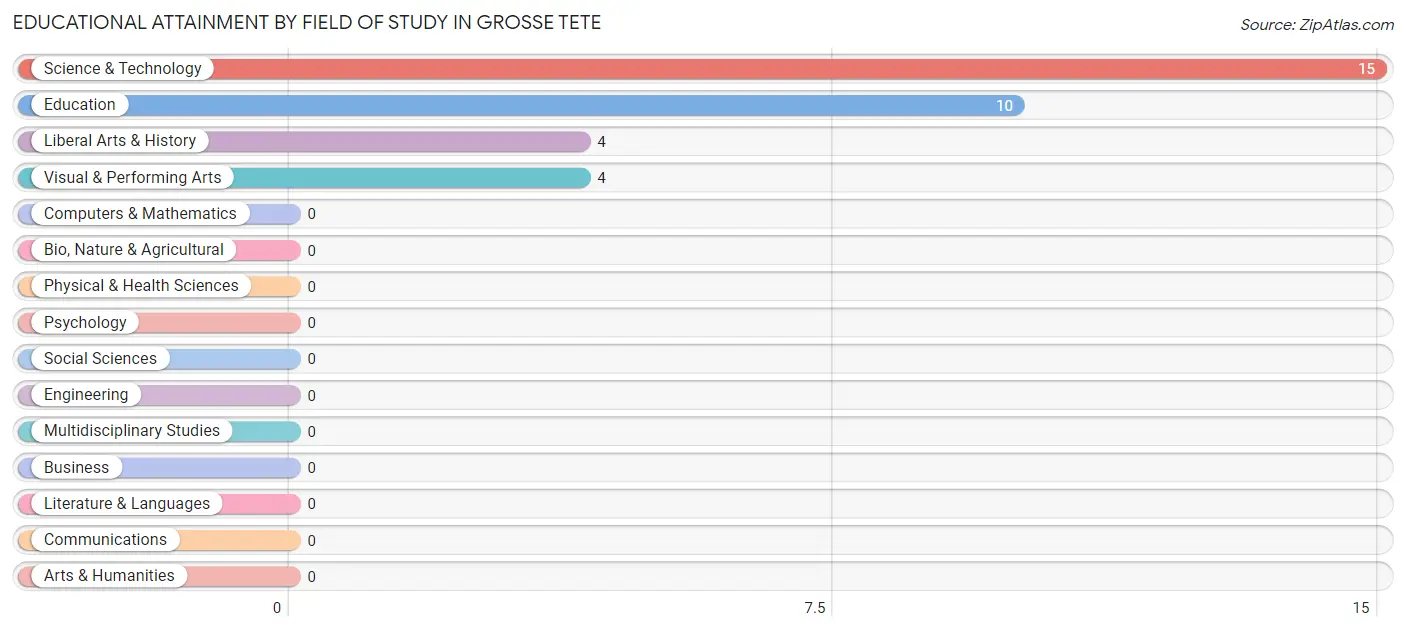
Science & technology (15 | 45.5%), education (10 | 30.3%), liberal arts & history (4 | 12.1%), and visual & performing arts (4 | 12.1%) are the most common fields of study among 33 individuals in Grosse Tete who have obtained a bachelor's degree or higher.
| Field of Study | # Graduates | % Graduates |
| Computers & Mathematics | 0 | 0.0% |
| Bio, Nature & Agricultural | 0 | 0.0% |
| Physical & Health Sciences | 0 | 0.0% |
| Psychology | 0 | 0.0% |
| Social Sciences | 0 | 0.0% |
| Engineering | 0 | 0.0% |
| Multidisciplinary Studies | 0 | 0.0% |
| Science & Technology | 15 | 45.5% |
| Business | 0 | 0.0% |
| Education | 10 | 30.3% |
| Literature & Languages | 0 | 0.0% |
| Liberal Arts & History | 4 | 12.1% |
| Visual & Performing Arts | 4 | 12.1% |
| Communications | 0 | 0.0% |
| Arts & Humanities | 0 | 0.0% |
| Total | 33 | 100.0% |
Transportation & Commute in Grosse Tete
Vehicle Availability by Sex in Grosse Tete
The most prevalent vehicle ownership categories in Grosse Tete are males with 2 vehicles (53, accounting for 60.2%) and females with 2 vehicles (29, making up 72.6%).
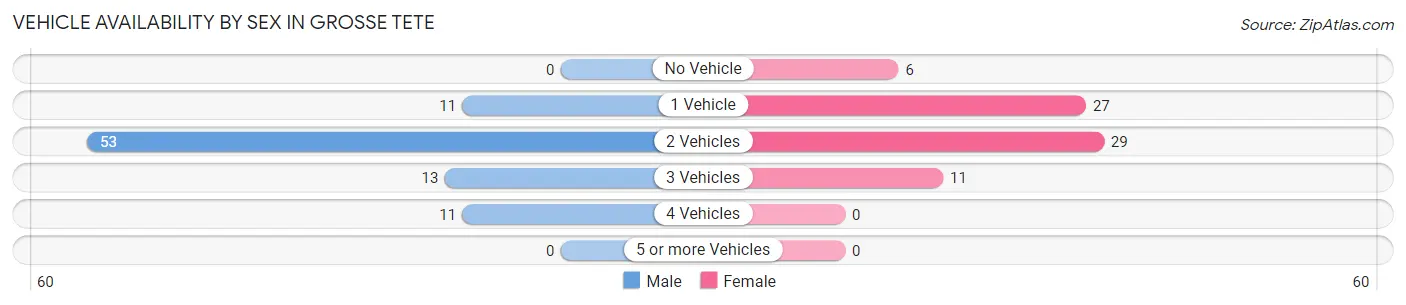
| Vehicles Available | Male | Female |
| No Vehicle | 0 (0.0%) | 6 (8.2%) |
| 1 Vehicle | 11 (12.5%) | 27 (37.0%) |
| 2 Vehicles | 53 (60.2%) | 29 (39.7%) |
| 3 Vehicles | 13 (14.8%) | 11 (15.1%) |
| 4 Vehicles | 11 (12.5%) | 0 (0.0%) |
| 5 or more Vehicles | 0 (0.0%) | 0 (0.0%) |
| Total | 88 (100.0%) | 73 (100.0%) |
Commute Time in Grosse Tete
The most frequently occuring commute durations in Grosse Tete are 45 to 59 minutes (40 commuters, 24.8%), 30 to 34 minutes (35 commuters, 21.7%), and 25 to 29 minutes (22 commuters, 13.7%).
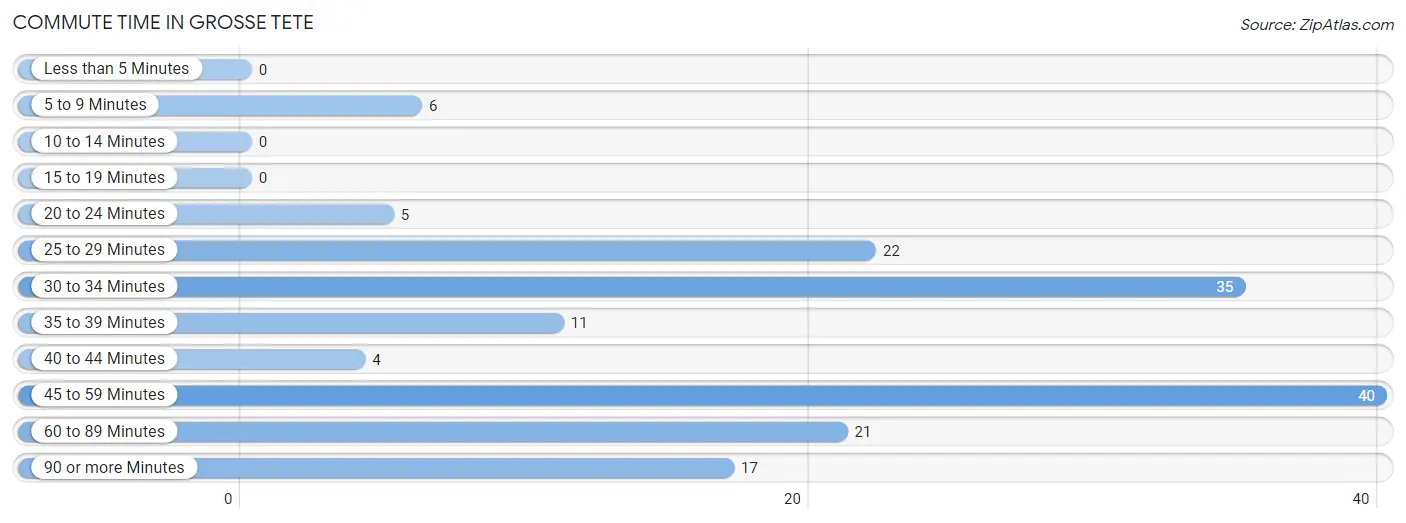
| Commute Time | # Commuters | % Commuters |
| Less than 5 Minutes | 0 | 0.0% |
| 5 to 9 Minutes | 6 | 3.7% |
| 10 to 14 Minutes | 0 | 0.0% |
| 15 to 19 Minutes | 0 | 0.0% |
| 20 to 24 Minutes | 5 | 3.1% |
| 25 to 29 Minutes | 22 | 13.7% |
| 30 to 34 Minutes | 35 | 21.7% |
| 35 to 39 Minutes | 11 | 6.8% |
| 40 to 44 Minutes | 4 | 2.5% |
| 45 to 59 Minutes | 40 | 24.8% |
| 60 to 89 Minutes | 21 | 13.0% |
| 90 or more Minutes | 17 | 10.6% |
Commute Time by Sex in Grosse Tete
The most common commute times in Grosse Tete are 45 to 59 minutes (31 commuters, 35.2%) for males and 30 to 34 minutes (26 commuters, 35.6%) for females.
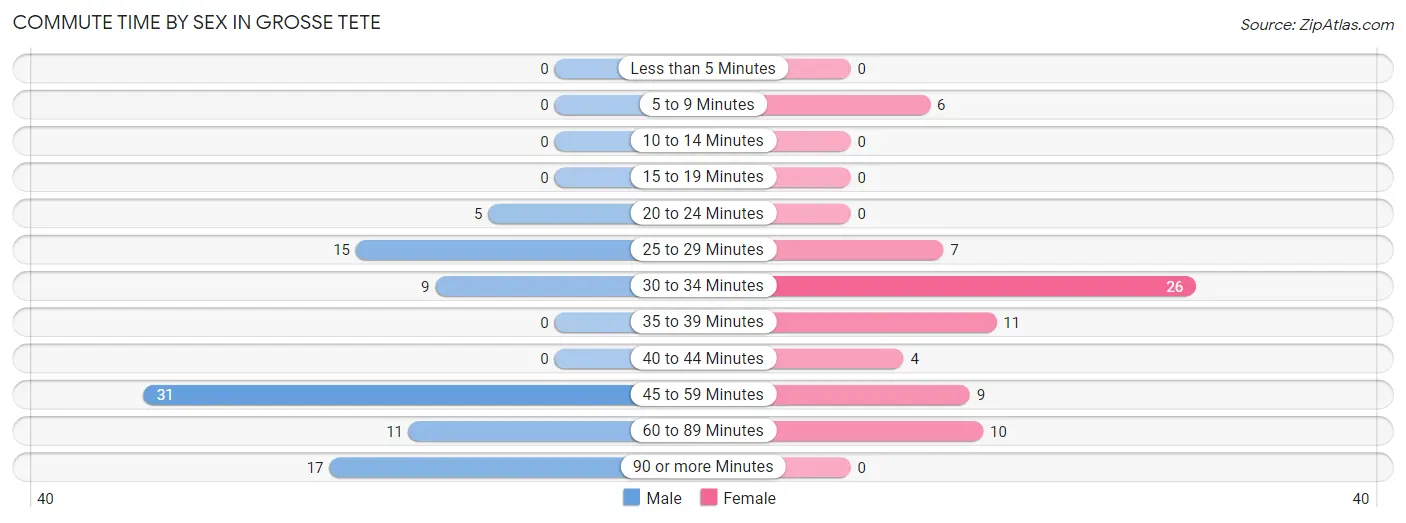
| Commute Time | Male | Female |
| Less than 5 Minutes | 0 (0.0%) | 0 (0.0%) |
| 5 to 9 Minutes | 0 (0.0%) | 6 (8.2%) |
| 10 to 14 Minutes | 0 (0.0%) | 0 (0.0%) |
| 15 to 19 Minutes | 0 (0.0%) | 0 (0.0%) |
| 20 to 24 Minutes | 5 (5.7%) | 0 (0.0%) |
| 25 to 29 Minutes | 15 (17.1%) | 7 (9.6%) |
| 30 to 34 Minutes | 9 (10.2%) | 26 (35.6%) |
| 35 to 39 Minutes | 0 (0.0%) | 11 (15.1%) |
| 40 to 44 Minutes | 0 (0.0%) | 4 (5.5%) |
| 45 to 59 Minutes | 31 (35.2%) | 9 (12.3%) |
| 60 to 89 Minutes | 11 (12.5%) | 10 (13.7%) |
| 90 or more Minutes | 17 (19.3%) | 0 (0.0%) |
Time of Departure to Work by Sex in Grosse Tete
The most frequent times of departure to work in Grosse Tete are 12:00 AM to 4:59 AM (44, 50.0%) for males and 7:00 AM to 7:29 AM (24, 32.9%) for females.
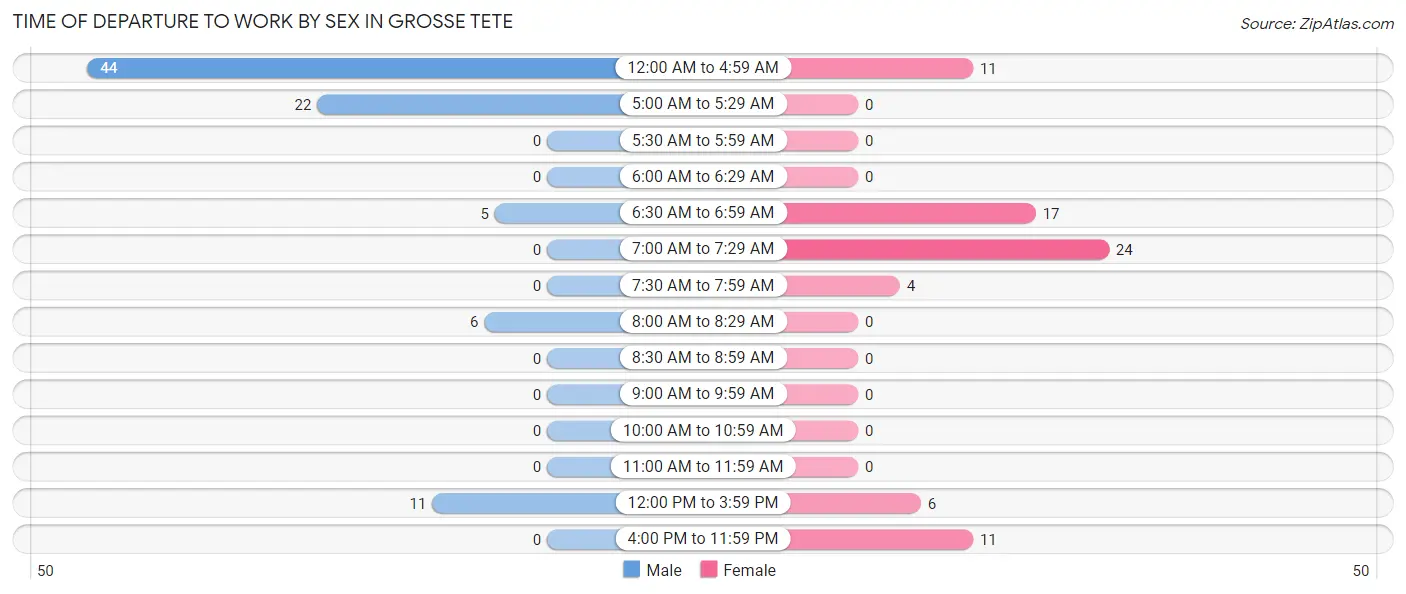
| Time of Departure | Male | Female |
| 12:00 AM to 4:59 AM | 44 (50.0%) | 11 (15.1%) |
| 5:00 AM to 5:29 AM | 22 (25.0%) | 0 (0.0%) |
| 5:30 AM to 5:59 AM | 0 (0.0%) | 0 (0.0%) |
| 6:00 AM to 6:29 AM | 0 (0.0%) | 0 (0.0%) |
| 6:30 AM to 6:59 AM | 5 (5.7%) | 17 (23.3%) |
| 7:00 AM to 7:29 AM | 0 (0.0%) | 24 (32.9%) |
| 7:30 AM to 7:59 AM | 0 (0.0%) | 4 (5.5%) |
| 8:00 AM to 8:29 AM | 6 (6.8%) | 0 (0.0%) |
| 8:30 AM to 8:59 AM | 0 (0.0%) | 0 (0.0%) |
| 9:00 AM to 9:59 AM | 0 (0.0%) | 0 (0.0%) |
| 10:00 AM to 10:59 AM | 0 (0.0%) | 0 (0.0%) |
| 11:00 AM to 11:59 AM | 0 (0.0%) | 0 (0.0%) |
| 12:00 PM to 3:59 PM | 11 (12.5%) | 6 (8.2%) |
| 4:00 PM to 11:59 PM | 0 (0.0%) | 11 (15.1%) |
| Total | 88 (100.0%) | 73 (100.0%) |
Housing Occupancy in Grosse Tete
Occupancy by Ownership in Grosse Tete
Of the total 160 dwellings in Grosse Tete, owner-occupied units account for 122 (76.2%), while renter-occupied units make up 38 (23.7%).
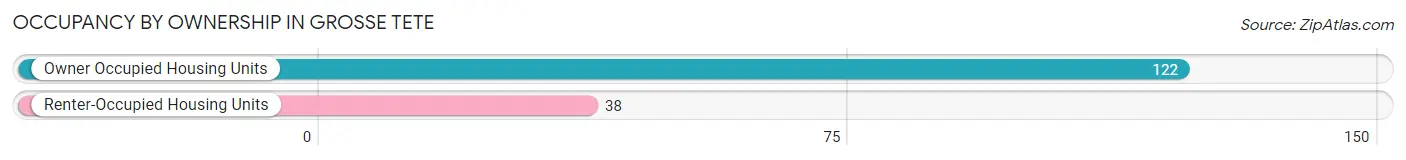
| Occupancy | # Housing Units | % Housing Units |
| Owner Occupied Housing Units | 122 | 76.2% |
| Renter-Occupied Housing Units | 38 | 23.7% |
| Total Occupied Housing Units | 160 | 100.0% |
Occupancy by Household Size in Grosse Tete
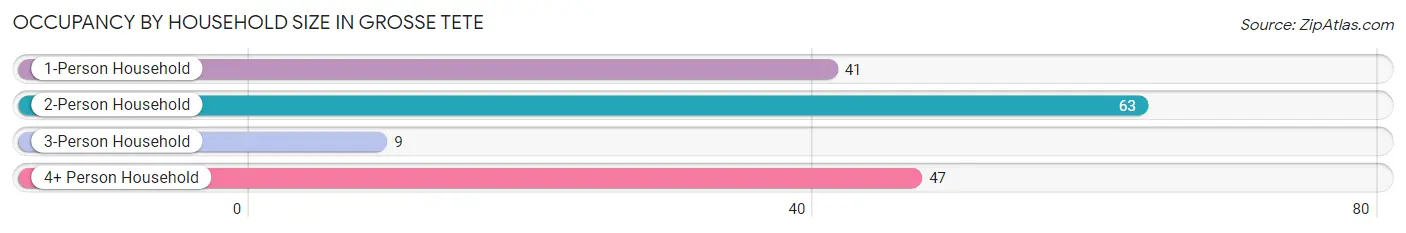
| Household Size | # Housing Units | % Housing Units |
| 1-Person Household | 41 | 25.6% |
| 2-Person Household | 63 | 39.4% |
| 3-Person Household | 9 | 5.6% |
| 4+ Person Household | 47 | 29.4% |
| Total Housing Units | 160 | 100.0% |
Occupancy by Ownership by Household Size in Grosse Tete
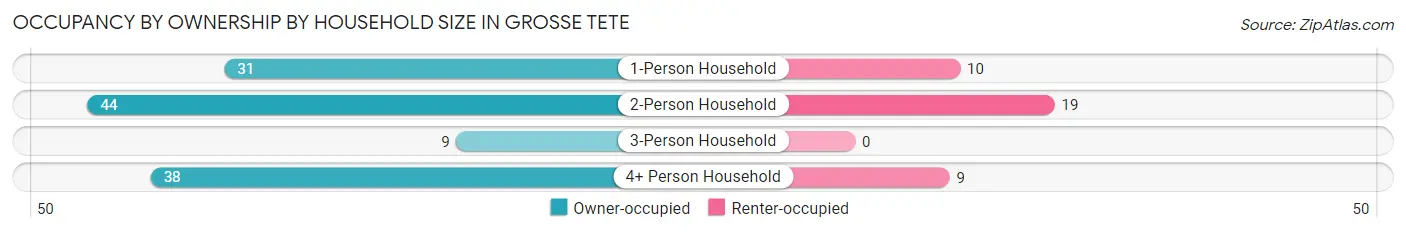
| Household Size | Owner-occupied | Renter-occupied |
| 1-Person Household | 31 (75.6%) | 10 (24.4%) |
| 2-Person Household | 44 (69.8%) | 19 (30.2%) |
| 3-Person Household | 9 (100.0%) | 0 (0.0%) |
| 4+ Person Household | 38 (80.8%) | 9 (19.2%) |
| Total Housing Units | 122 (76.2%) | 38 (23.7%) |
Occupancy by Educational Attainment in Grosse Tete
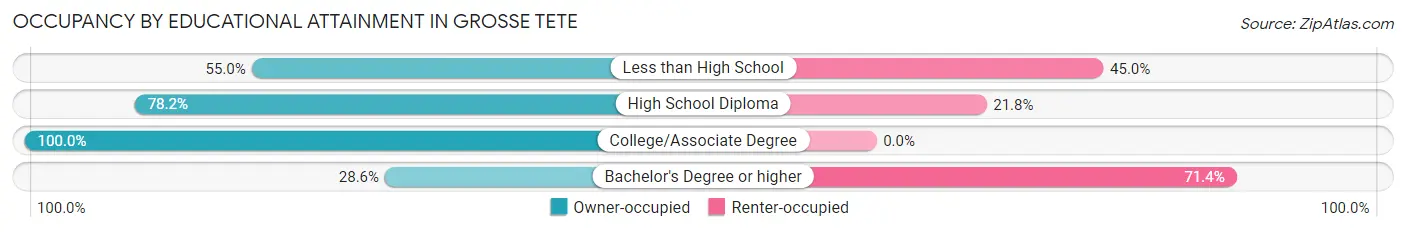
| Household Size | Owner-occupied | Renter-occupied |
| Less than High School | 11 (55.0%) | 9 (45.0%) |
| High School Diploma | 68 (78.2%) | 19 (21.8%) |
| College/Associate Degree | 39 (100.0%) | 0 (0.0%) |
| Bachelor's Degree or higher | 4 (28.6%) | 10 (71.4%) |
Occupancy by Age of Householder in Grosse Tete
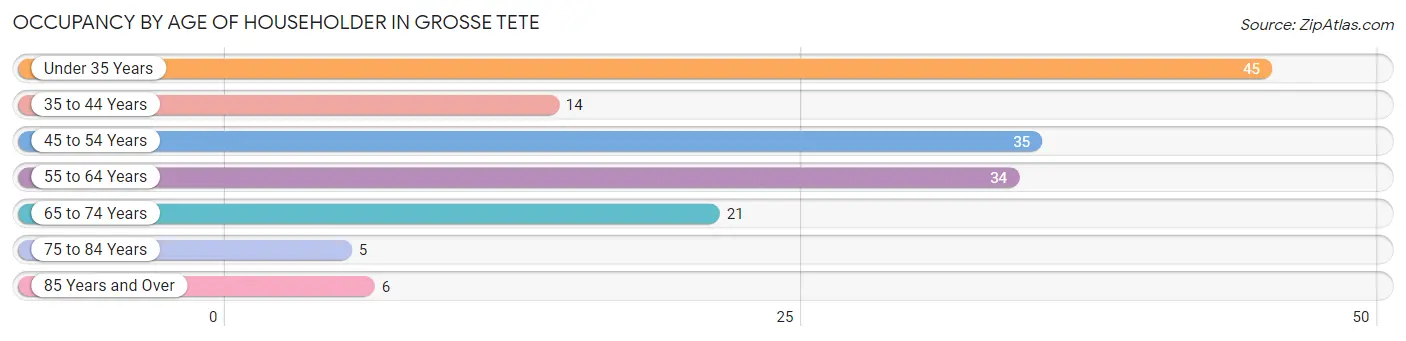
| Age Bracket | # Households | % Households |
| Under 35 Years | 45 | 28.1% |
| 35 to 44 Years | 14 | 8.7% |
| 45 to 54 Years | 35 | 21.9% |
| 55 to 64 Years | 34 | 21.2% |
| 65 to 74 Years | 21 | 13.1% |
| 75 to 84 Years | 5 | 3.1% |
| 85 Years and Over | 6 | 3.7% |
| Total | 160 | 100.0% |
Housing Finances in Grosse Tete
Median Income by Occupancy in Grosse Tete
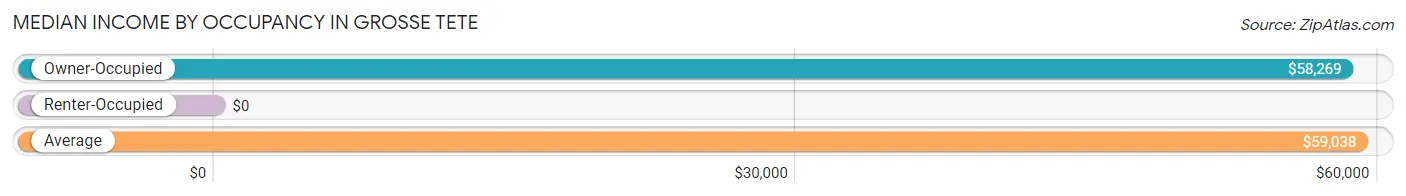
| Occupancy Type | # Households | Median Income |
| Owner-Occupied | 122 (76.2%) | $58,269 |
| Renter-Occupied | 38 (23.7%) | $0 |
| Average | 160 (100.0%) | $59,038 |
Occupancy by Householder Income Bracket in Grosse Tete
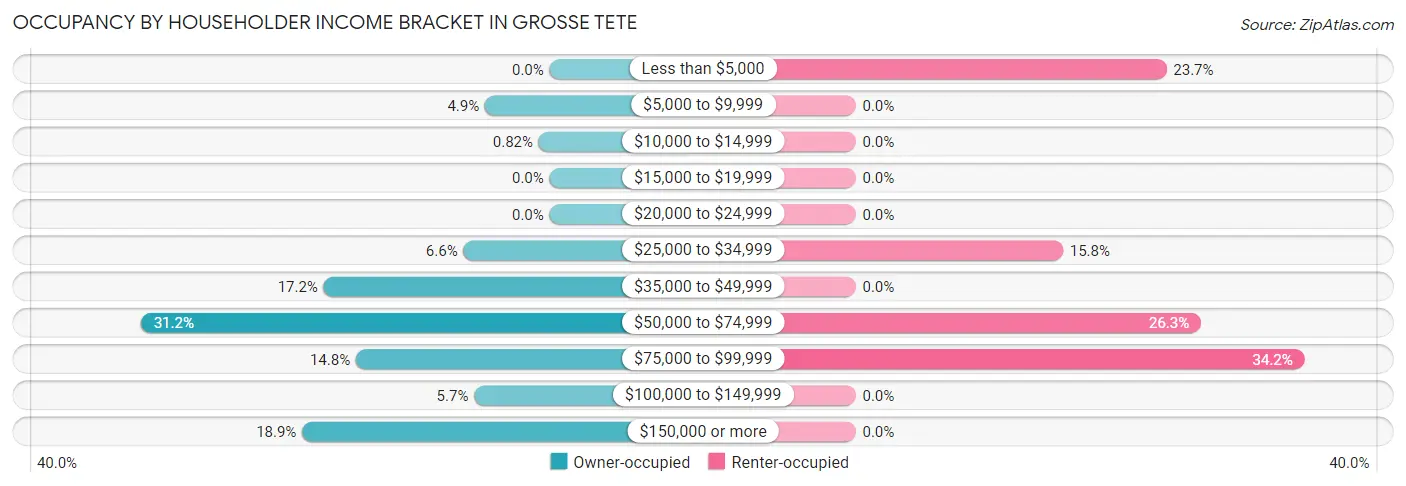
| Income Bracket | Owner-occupied | Renter-occupied |
| Less than $5,000 | 0 (0.0%) | 9 (23.7%) |
| $5,000 to $9,999 | 6 (4.9%) | 0 (0.0%) |
| $10,000 to $14,999 | 1 (0.8%) | 0 (0.0%) |
| $15,000 to $19,999 | 0 (0.0%) | 0 (0.0%) |
| $20,000 to $24,999 | 0 (0.0%) | 0 (0.0%) |
| $25,000 to $34,999 | 8 (6.6%) | 6 (15.8%) |
| $35,000 to $49,999 | 21 (17.2%) | 0 (0.0%) |
| $50,000 to $74,999 | 38 (31.1%) | 10 (26.3%) |
| $75,000 to $99,999 | 18 (14.7%) | 13 (34.2%) |
| $100,000 to $149,999 | 7 (5.7%) | 0 (0.0%) |
| $150,000 or more | 23 (18.9%) | 0 (0.0%) |
| Total | 122 (100.0%) | 38 (100.0%) |
Monthly Housing Cost Tiers in Grosse Tete
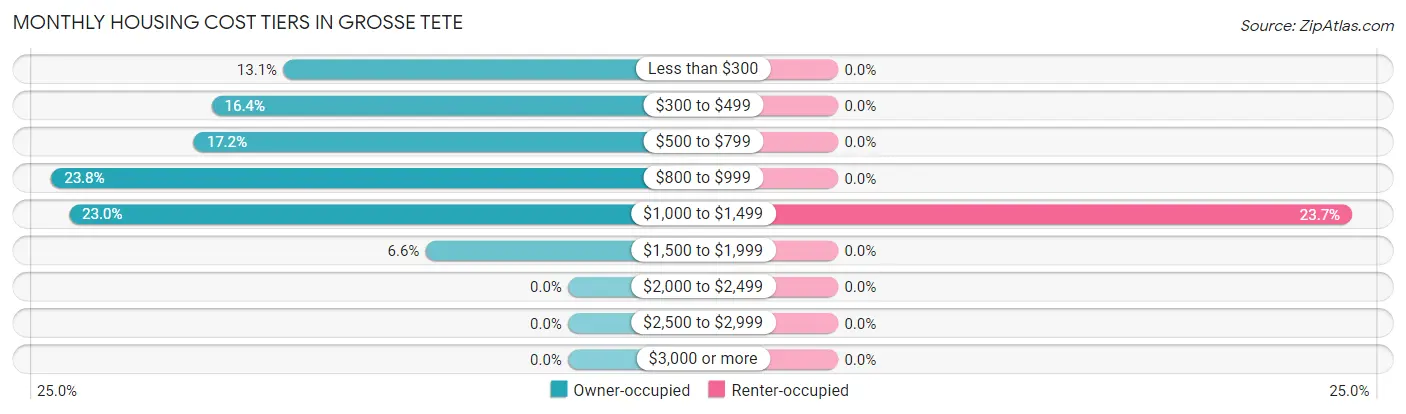
| Monthly Cost | Owner-occupied | Renter-occupied |
| Less than $300 | 16 (13.1%) | 0 (0.0%) |
| $300 to $499 | 20 (16.4%) | 0 (0.0%) |
| $500 to $799 | 21 (17.2%) | 0 (0.0%) |
| $800 to $999 | 29 (23.8%) | 0 (0.0%) |
| $1,000 to $1,499 | 28 (23.0%) | 9 (23.7%) |
| $1,500 to $1,999 | 8 (6.6%) | 0 (0.0%) |
| $2,000 to $2,499 | 0 (0.0%) | 0 (0.0%) |
| $2,500 to $2,999 | 0 (0.0%) | 0 (0.0%) |
| $3,000 or more | 0 (0.0%) | 0 (0.0%) |
| Total | 122 (100.0%) | 38 (100.0%) |
Physical Housing Characteristics in Grosse Tete
Housing Structures in Grosse Tete
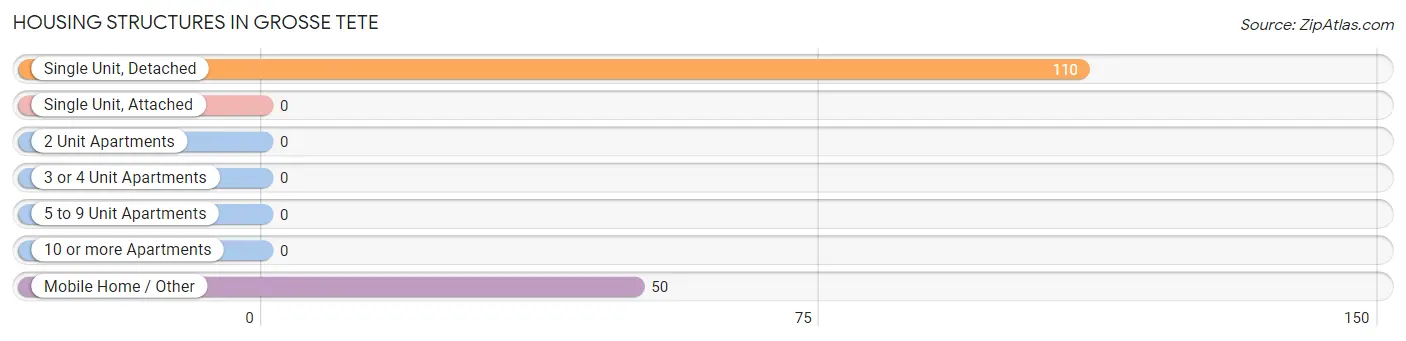
| Structure Type | # Housing Units | % Housing Units |
| Single Unit, Detached | 110 | 68.8% |
| Single Unit, Attached | 0 | 0.0% |
| 2 Unit Apartments | 0 | 0.0% |
| 3 or 4 Unit Apartments | 0 | 0.0% |
| 5 to 9 Unit Apartments | 0 | 0.0% |
| 10 or more Apartments | 0 | 0.0% |
| Mobile Home / Other | 50 | 31.2% |
| Total | 160 | 100.0% |
Housing Structures by Occupancy in Grosse Tete
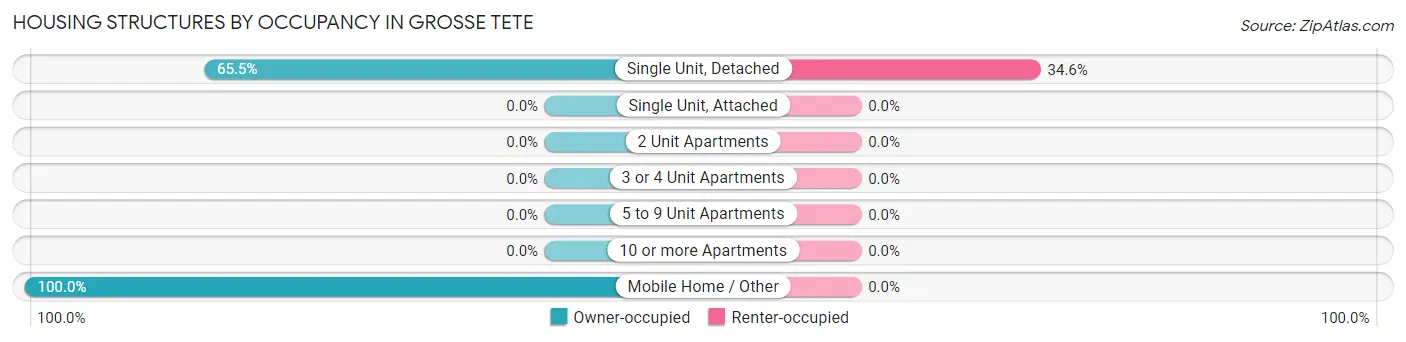
| Structure Type | Owner-occupied | Renter-occupied |
| Single Unit, Detached | 72 (65.4%) | 38 (34.5%) |
| Single Unit, Attached | 0 (0.0%) | 0 (0.0%) |
| 2 Unit Apartments | 0 (0.0%) | 0 (0.0%) |
| 3 or 4 Unit Apartments | 0 (0.0%) | 0 (0.0%) |
| 5 to 9 Unit Apartments | 0 (0.0%) | 0 (0.0%) |
| 10 or more Apartments | 0 (0.0%) | 0 (0.0%) |
| Mobile Home / Other | 50 (100.0%) | 0 (0.0%) |
| Total | 122 (76.2%) | 38 (23.7%) |
Housing Structures by Number of Rooms in Grosse Tete
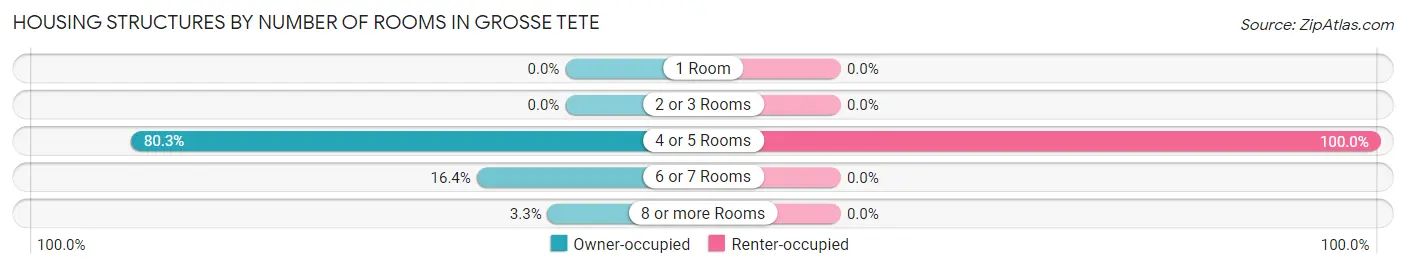
| Number of Rooms | Owner-occupied | Renter-occupied |
| 1 Room | 0 (0.0%) | 0 (0.0%) |
| 2 or 3 Rooms | 0 (0.0%) | 0 (0.0%) |
| 4 or 5 Rooms | 98 (80.3%) | 38 (100.0%) |
| 6 or 7 Rooms | 20 (16.4%) | 0 (0.0%) |
| 8 or more Rooms | 4 (3.3%) | 0 (0.0%) |
| Total | 122 (100.0%) | 38 (100.0%) |
Housing Structure by Heating Type in Grosse Tete
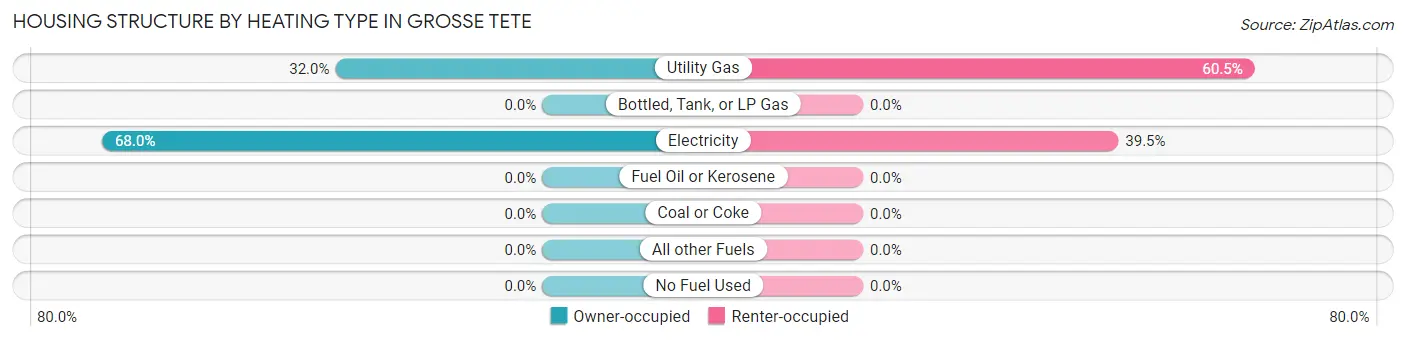
| Heating Type | Owner-occupied | Renter-occupied |
| Utility Gas | 39 (32.0%) | 23 (60.5%) |
| Bottled, Tank, or LP Gas | 0 (0.0%) | 0 (0.0%) |
| Electricity | 83 (68.0%) | 15 (39.5%) |
| Fuel Oil or Kerosene | 0 (0.0%) | 0 (0.0%) |
| Coal or Coke | 0 (0.0%) | 0 (0.0%) |
| All other Fuels | 0 (0.0%) | 0 (0.0%) |
| No Fuel Used | 0 (0.0%) | 0 (0.0%) |
| Total | 122 (100.0%) | 38 (100.0%) |
Household Vehicle Usage in Grosse Tete
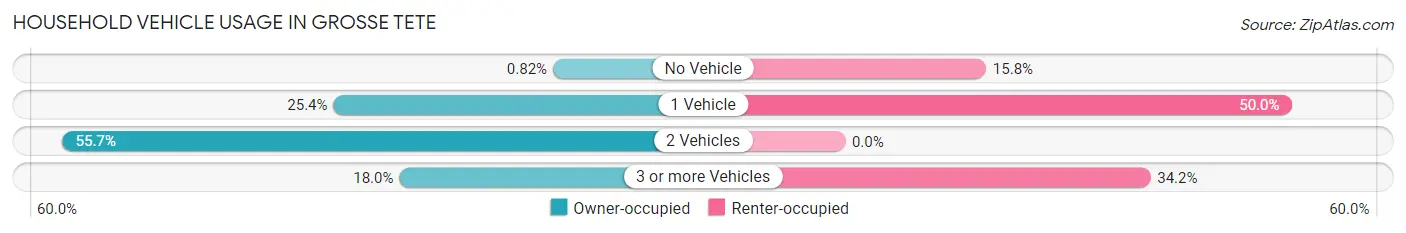
| Vehicles per Household | Owner-occupied | Renter-occupied |
| No Vehicle | 1 (0.8%) | 6 (15.8%) |
| 1 Vehicle | 31 (25.4%) | 19 (50.0%) |
| 2 Vehicles | 68 (55.7%) | 0 (0.0%) |
| 3 or more Vehicles | 22 (18.0%) | 13 (34.2%) |
| Total | 122 (100.0%) | 38 (100.0%) |
Real Estate & Mortgages in Grosse Tete
Real Estate and Mortgage Overview in Grosse Tete
| Characteristic | Without Mortgage | With Mortgage |
| Housing Units | 42 | 80 |
| Median Property Value | $72,300 | $154,000 |
| Median Household Income | $60,000 | $10 |
| Monthly Housing Costs | $317 | $0 |
| Real Estate Taxes | - | - |
Property Value by Mortgage Status in Grosse Tete
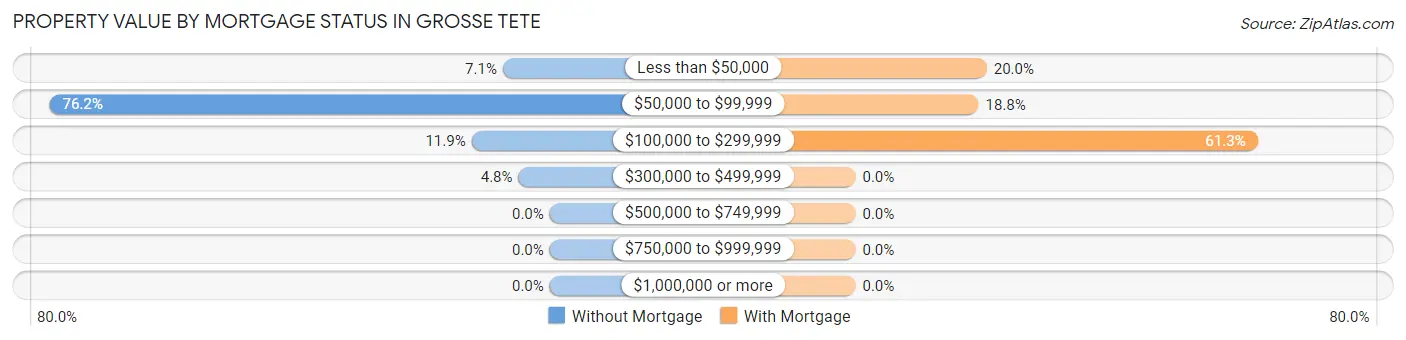
| Property Value | Without Mortgage | With Mortgage |
| Less than $50,000 | 3 (7.1%) | 16 (20.0%) |
| $50,000 to $99,999 | 32 (76.2%) | 15 (18.8%) |
| $100,000 to $299,999 | 5 (11.9%) | 49 (61.3%) |
| $300,000 to $499,999 | 2 (4.8%) | 0 (0.0%) |
| $500,000 to $749,999 | 0 (0.0%) | 0 (0.0%) |
| $750,000 to $999,999 | 0 (0.0%) | 0 (0.0%) |
| $1,000,000 or more | 0 (0.0%) | 0 (0.0%) |
| Total | 42 (100.0%) | 80 (100.0%) |
Household Income by Mortgage Status in Grosse Tete
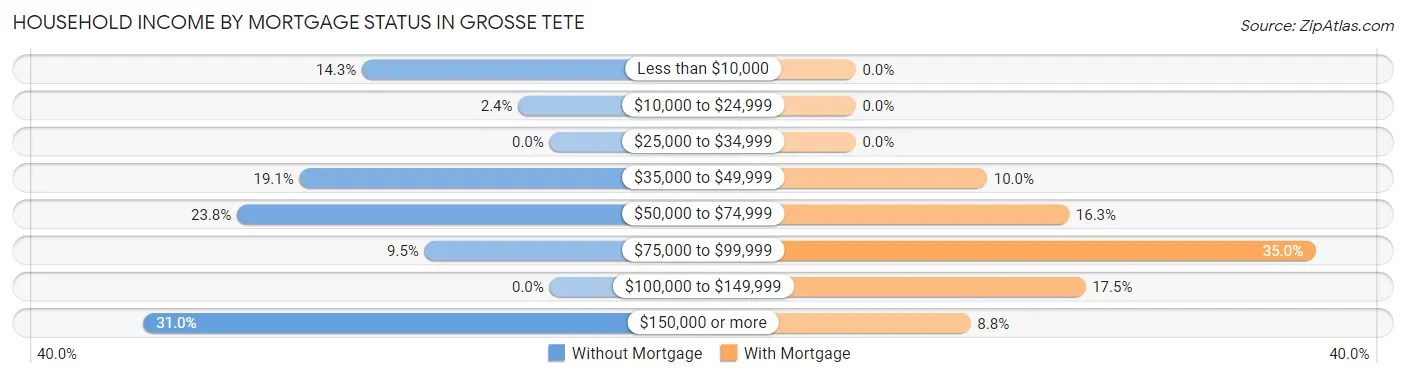
| Household Income | Without Mortgage | With Mortgage |
| Less than $10,000 | 6 (14.3%) | 0 (0.0%) |
| $10,000 to $24,999 | 1 (2.4%) | 0 (0.0%) |
| $25,000 to $34,999 | 0 (0.0%) | 0 (0.0%) |
| $35,000 to $49,999 | 8 (19.1%) | 8 (10.0%) |
| $50,000 to $74,999 | 10 (23.8%) | 13 (16.3%) |
| $75,000 to $99,999 | 4 (9.5%) | 28 (35.0%) |
| $100,000 to $149,999 | 0 (0.0%) | 14 (17.5%) |
| $150,000 or more | 13 (30.9%) | 7 (8.7%) |
| Total | 42 (100.0%) | 80 (100.0%) |
Property Value to Household Income Ratio in Grosse Tete
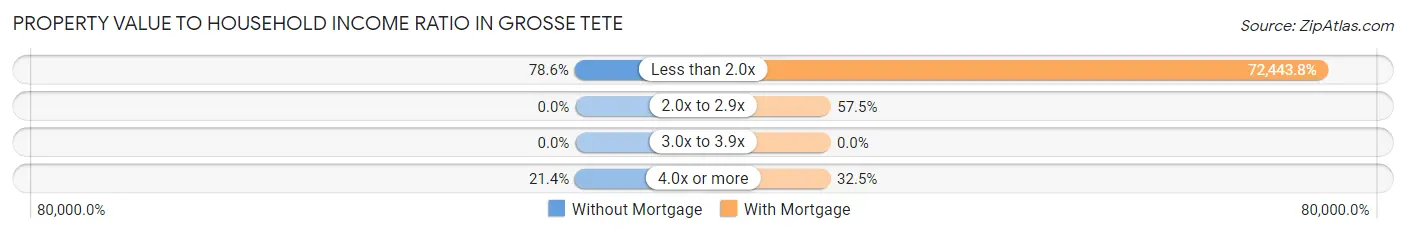
| Value-to-Income Ratio | Without Mortgage | With Mortgage |
| Less than 2.0x | 33 (78.6%) | 57,955 (72,443.8%) |
| 2.0x to 2.9x | 0 (0.0%) | 46 (57.5%) |
| 3.0x to 3.9x | 0 (0.0%) | 0 (0.0%) |
| 4.0x or more | 9 (21.4%) | 26 (32.5%) |
| Total | 42 (100.0%) | 80 (100.0%) |
Real Estate Taxes by Mortgage Status in Grosse Tete
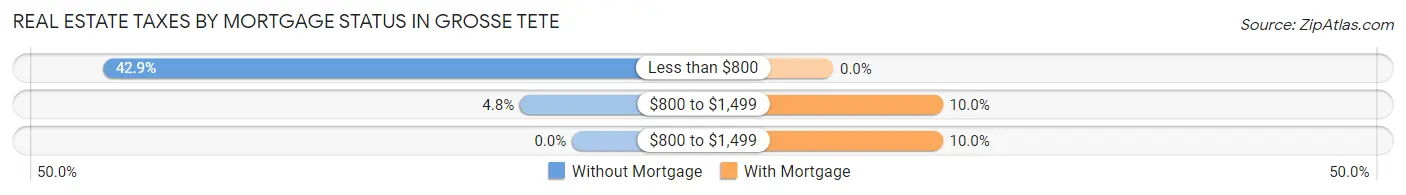
| Property Taxes | Without Mortgage | With Mortgage |
| Less than $800 | 18 (42.9%) | 0 (0.0%) |
| $800 to $1,499 | 2 (4.8%) | 8 (10.0%) |
| $800 to $1,499 | 0 (0.0%) | 8 (10.0%) |
| Total | 42 (100.0%) | 80 (100.0%) |
Health & Disability in Grosse Tete
Health Insurance Coverage by Age in Grosse Tete
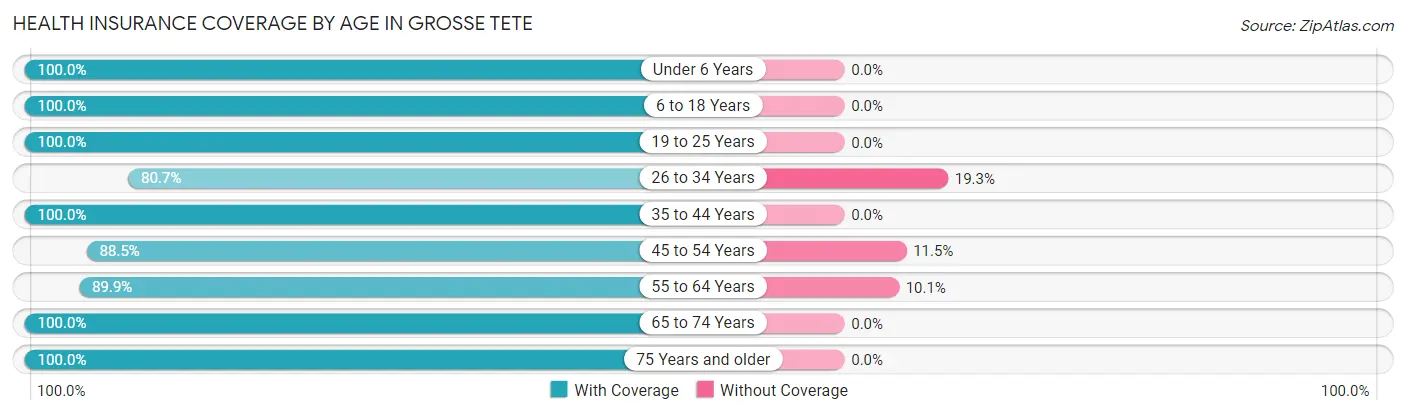
| Age Bracket | With Coverage | Without Coverage |
| Under 6 Years | 33 (100.0%) | 0 (0.0%) |
| 6 to 18 Years | 60 (100.0%) | 0 (0.0%) |
| 19 to 25 Years | 37 (100.0%) | 0 (0.0%) |
| 26 to 34 Years | 46 (80.7%) | 11 (19.3%) |
| 35 to 44 Years | 14 (100.0%) | 0 (0.0%) |
| 45 to 54 Years | 46 (88.5%) | 6 (11.5%) |
| 55 to 64 Years | 62 (89.9%) | 7 (10.1%) |
| 65 to 74 Years | 38 (100.0%) | 0 (0.0%) |
| 75 Years and older | 29 (100.0%) | 0 (0.0%) |
| Total | 365 (93.8%) | 24 (6.2%) |
Health Insurance Coverage by Citizenship Status in Grosse Tete
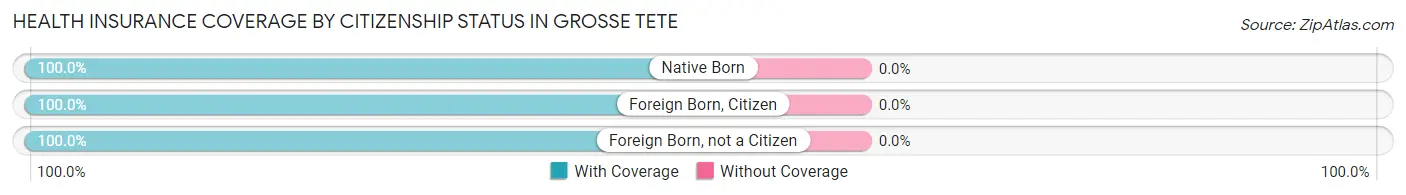
| Citizenship Status | With Coverage | Without Coverage |
| Native Born | 33 (100.0%) | 0 (0.0%) |
| Foreign Born, Citizen | 60 (100.0%) | 0 (0.0%) |
| Foreign Born, not a Citizen | 37 (100.0%) | 0 (0.0%) |
Health Insurance Coverage by Household Income in Grosse Tete
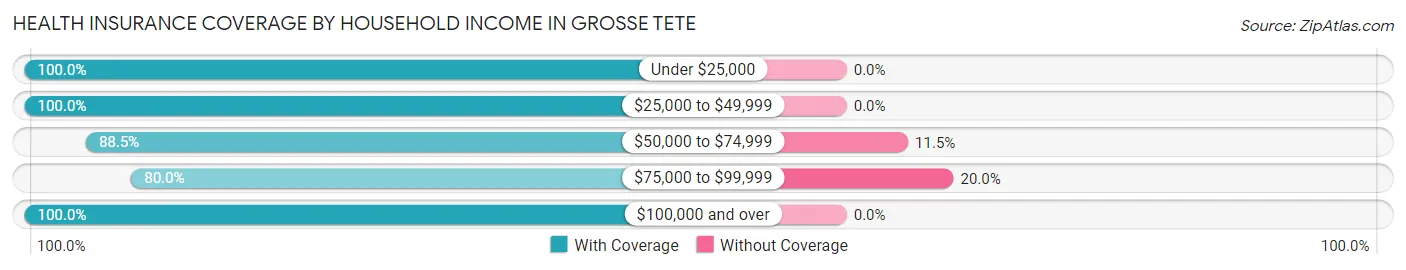
| Household Income | With Coverage | Without Coverage |
| Under $25,000 | 51 (100.0%) | 0 (0.0%) |
| $25,000 to $49,999 | 55 (100.0%) | 0 (0.0%) |
| $50,000 to $74,999 | 100 (88.5%) | 13 (11.5%) |
| $75,000 to $99,999 | 44 (80.0%) | 11 (20.0%) |
| $100,000 and over | 115 (100.0%) | 0 (0.0%) |
Public vs Private Health Insurance Coverage by Age in Grosse Tete
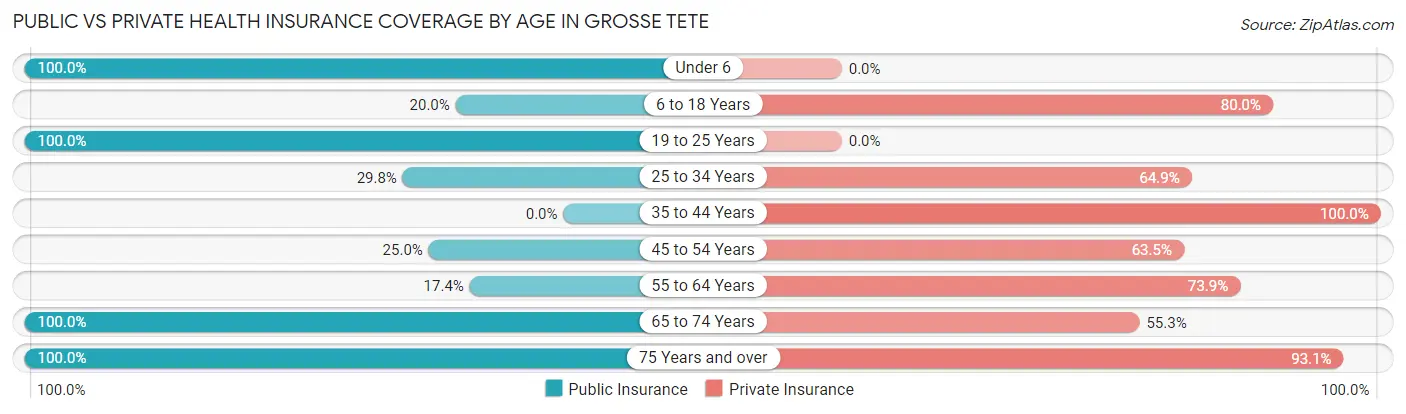
| Age Bracket | Public Insurance | Private Insurance |
| Under 6 | 33 (100.0%) | 0 (0.0%) |
| 6 to 18 Years | 12 (20.0%) | 48 (80.0%) |
| 19 to 25 Years | 37 (100.0%) | 0 (0.0%) |
| 25 to 34 Years | 17 (29.8%) | 37 (64.9%) |
| 35 to 44 Years | 0 (0.0%) | 14 (100.0%) |
| 45 to 54 Years | 13 (25.0%) | 33 (63.5%) |
| 55 to 64 Years | 12 (17.4%) | 51 (73.9%) |
| 65 to 74 Years | 38 (100.0%) | 21 (55.3%) |
| 75 Years and over | 29 (100.0%) | 27 (93.1%) |
| Total | 191 (49.1%) | 231 (59.4%) |
Disability Status by Sex by Age in Grosse Tete
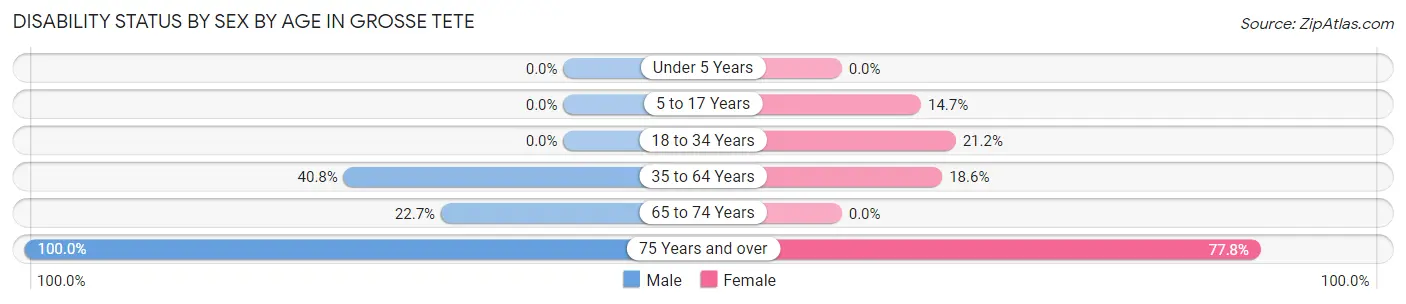
| Age Bracket | Male | Female |
| Under 5 Years | 0 (0.0%) | 0 (0.0%) |
| 5 to 17 Years | 0 (0.0%) | 5 (14.7%) |
| 18 to 34 Years | 0 (0.0%) | 11 (21.1%) |
| 35 to 64 Years | 31 (40.8%) | 11 (18.6%) |
| 65 to 74 Years | 5 (22.7%) | 0 (0.0%) |
| 75 Years and over | 20 (100.0%) | 7 (77.8%) |
Disability Class by Sex by Age in Grosse Tete
Disability Class: Hearing Difficulty
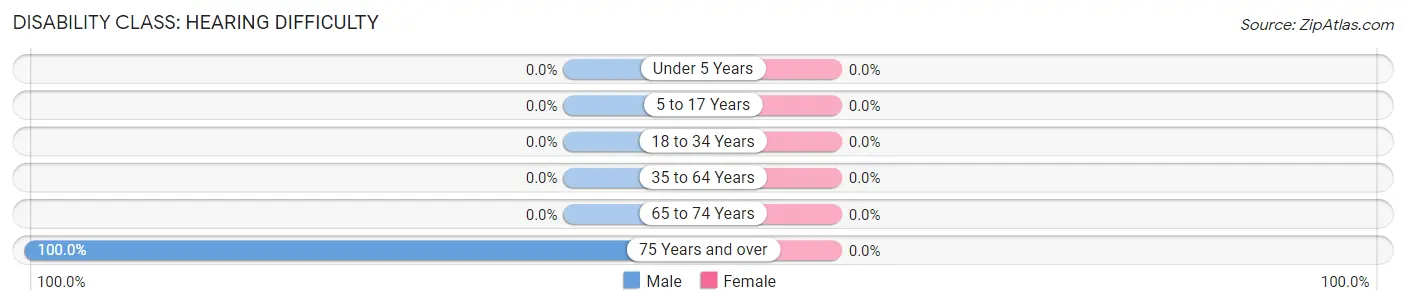
| Age Bracket | Male | Female |
| Under 5 Years | 0 (0.0%) | 0 (0.0%) |
| 5 to 17 Years | 0 (0.0%) | 0 (0.0%) |
| 18 to 34 Years | 0 (0.0%) | 0 (0.0%) |
| 35 to 64 Years | 0 (0.0%) | 0 (0.0%) |
| 65 to 74 Years | 0 (0.0%) | 0 (0.0%) |
| 75 Years and over | 20 (100.0%) | 0 (0.0%) |
Disability Class: Vision Difficulty
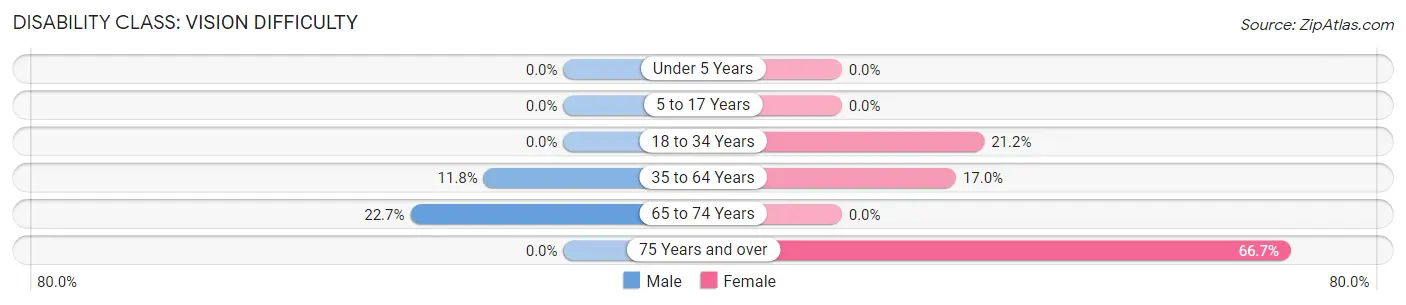
| Age Bracket | Male | Female |
| Under 5 Years | 0 (0.0%) | 0 (0.0%) |
| 5 to 17 Years | 0 (0.0%) | 0 (0.0%) |
| 18 to 34 Years | 0 (0.0%) | 11 (21.1%) |
| 35 to 64 Years | 9 (11.8%) | 10 (17.0%) |
| 65 to 74 Years | 5 (22.7%) | 0 (0.0%) |
| 75 Years and over | 0 (0.0%) | 6 (66.7%) |
Disability Class: Cognitive Difficulty
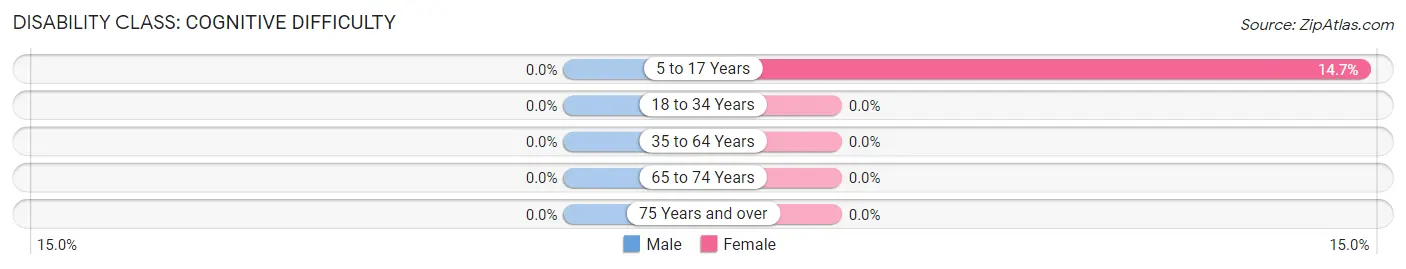
| Age Bracket | Male | Female |
| 5 to 17 Years | 0 (0.0%) | 5 (14.7%) |
| 18 to 34 Years | 0 (0.0%) | 0 (0.0%) |
| 35 to 64 Years | 0 (0.0%) | 0 (0.0%) |
| 65 to 74 Years | 0 (0.0%) | 0 (0.0%) |
| 75 Years and over | 0 (0.0%) | 0 (0.0%) |
Disability Class: Ambulatory Difficulty
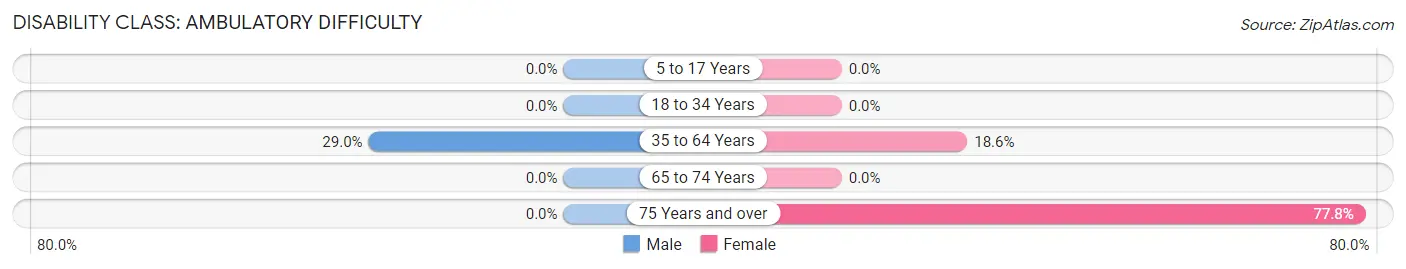
| Age Bracket | Male | Female |
| 5 to 17 Years | 0 (0.0%) | 0 (0.0%) |
| 18 to 34 Years | 0 (0.0%) | 0 (0.0%) |
| 35 to 64 Years | 22 (28.9%) | 11 (18.6%) |
| 65 to 74 Years | 0 (0.0%) | 0 (0.0%) |
| 75 Years and over | 0 (0.0%) | 7 (77.8%) |
Disability Class: Self-Care Difficulty
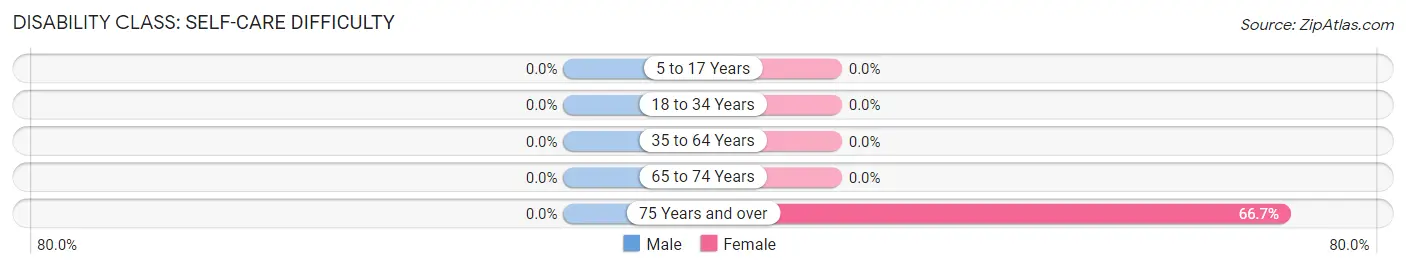
| Age Bracket | Male | Female |
| 5 to 17 Years | 0 (0.0%) | 0 (0.0%) |
| 18 to 34 Years | 0 (0.0%) | 0 (0.0%) |
| 35 to 64 Years | 0 (0.0%) | 0 (0.0%) |
| 65 to 74 Years | 0 (0.0%) | 0 (0.0%) |
| 75 Years and over | 0 (0.0%) | 6 (66.7%) |
Technology Access in Grosse Tete
Computing Device Access in Grosse Tete
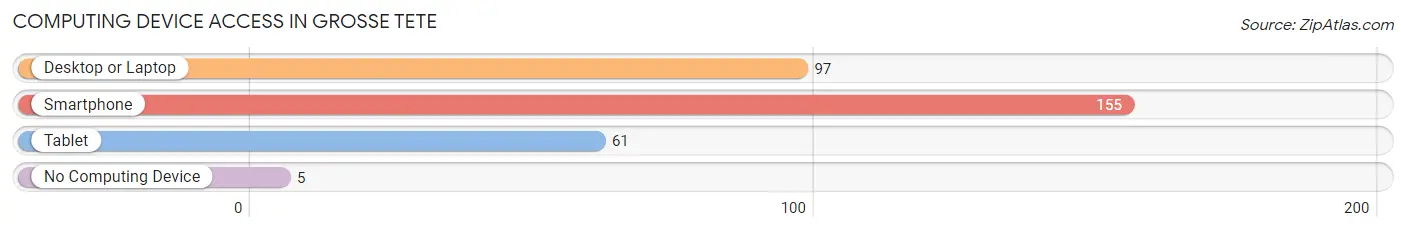
| Device Type | # Households | % Households |
| Desktop or Laptop | 97 | 60.6% |
| Smartphone | 155 | 96.9% |
| Tablet | 61 | 38.1% |
| No Computing Device | 5 | 3.1% |
| Total | 160 | 100.0% |
Internet Access in Grosse Tete
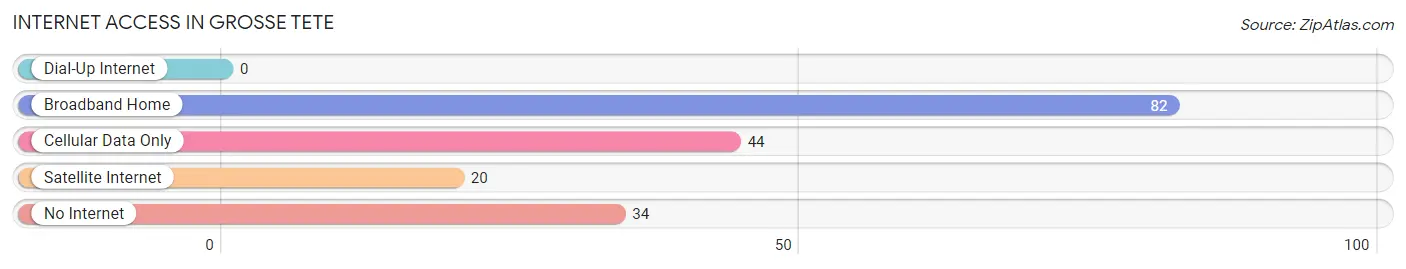
| Internet Type | # Households | % Households |
| Dial-Up Internet | 0 | 0.0% |
| Broadband Home | 82 | 51.2% |
| Cellular Data Only | 44 | 27.5% |
| Satellite Internet | 20 | 12.5% |
| No Internet | 34 | 21.2% |
| Total | 160 | 100.0% |
Grosse Tete Summary
Grosse Tete is a small unincorporated community located in Iberville Parish, Louisiana. It is situated along the banks of the Mississippi River, approximately 25 miles northwest of Baton Rouge. The population of Grosse Tete was estimated to be 1,845 in 2019.
History
Grosse Tete was first settled in the early 1800s by French-speaking Acadians who had been exiled from Nova Scotia. The name Grosse Tete is derived from the French phrase for “big head”, which was likely a reference to the large number of Acadians who settled in the area.
In 1821, Grosse Tete was officially established as a town. The town was initially a small farming community, but it soon became a popular stop for steamboats traveling up and down the Mississippi River. The town was also home to a number of businesses, including a general store, a blacksmith shop, and a cotton gin.
In the late 1800s, Grosse Tete became a popular destination for hunters and fishermen. The town was also home to a number of saloons and gambling halls, which attracted visitors from all over the region.
In the early 1900s, Grosse Tete began to experience a period of decline. The steamboat industry had declined, and the town’s businesses had closed. In the 1950s, the town was revitalized when the Louisiana State Penitentiary opened nearby. The prison brought new jobs and economic opportunities to the area.
Geography
Grosse Tete is located in Iberville Parish, Louisiana. It is situated along the banks of the Mississippi River, approximately 25 miles northwest of Baton Rouge. The town is located in a rural area, and is surrounded by farmland and woodlands.
The climate in Grosse Tete is humid subtropical, with hot, humid summers and mild winters. The average annual temperature is 68°F, and the average annual precipitation is 56 inches.
Economy
Grosse Tete’s economy is largely based on agriculture and tourism. The town is home to a number of farms, which produce a variety of crops, including corn, soybeans, and cotton. The town is also home to a number of tourist attractions, including the Louisiana State Penitentiary, which is a popular destination for visitors.
In addition to agriculture and tourism, Grosse Tete is home to a number of small businesses, including restaurants, convenience stores, and gas stations. The town is also home to a number of manufacturing companies, which produce a variety of products, including furniture, clothing, and electronics.
Demographics
Grosse Tete is a predominantly white community, with a population that is approximately 95% white. The remaining 5% of the population is composed of African Americans, Hispanics, and other ethnic groups. The median household income in Grosse Tete is $45,000, and the median home value is $150,000.
Conclusion
Grosse Tete is a small unincorporated community located in Iberville Parish, Louisiana. It is situated along the banks of the Mississippi River, approximately 25 miles northwest of Baton Rouge. The population of Grosse Tete was estimated to be 1,845 in 2019. The town’s economy is largely based on agriculture and tourism, and it is home to a number of small businesses. Grosse Tete is a predominantly white community, with a population that is approximately 95% white.
Common Questions
What is Per Capita Income in Grosse Tete?
Per Capita income in Grosse Tete is $31,931.
What is the Median Family Income in Grosse Tete?
Median Family Income in Grosse Tete is $75,735.
What is the Median Household income in Grosse Tete?
Median Household Income in Grosse Tete is $59,038.
What is Inequality or Gini Index in Grosse Tete?
Inequality or Gini Index in Grosse Tete is 0.40.
What is the Total Population of Grosse Tete?
Total Population of Grosse Tete is 389.
What is the Total Male Population of Grosse Tete?
Total Male Population of Grosse Tete is 195.
What is the Total Female Population of Grosse Tete?
Total Female Population of Grosse Tete is 194.
What is the Ratio of Males per 100 Females in Grosse Tete?
There are 100.52 Males per 100 Females in Grosse Tete.
What is the Ratio of Females per 100 Males in Grosse Tete?
There are 99.49 Females per 100 Males in Grosse Tete.
What is the Median Population Age in Grosse Tete?
Median Population Age in Grosse Tete is 35.8 Years.
What is the Average Family Size in Grosse Tete
Average Family Size in Grosse Tete is 3.0 People.
What is the Average Household Size in Grosse Tete
Average Household Size in Grosse Tete is 2.4 People.
How Large is the Labor Force in Grosse Tete?
There are 184 People in the Labor Forcein in Grosse Tete.
What is the Percentage of People in the Labor Force in Grosse Tete?
62.2% of People are in the Labor Force in Grosse Tete.