Oak Hills Place, LA Map & Demographics
Oak Hills Place Map
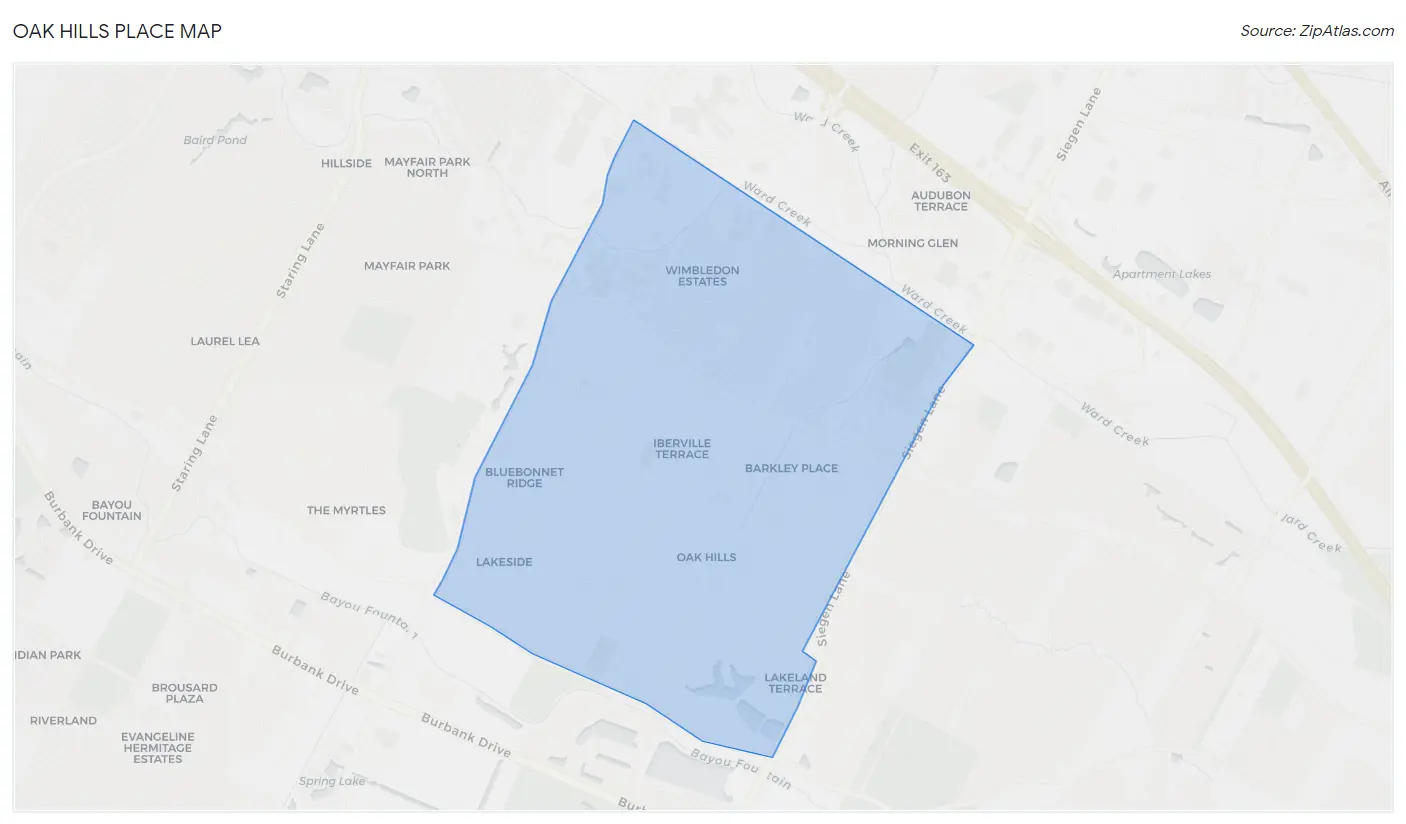
Oak Hills Place Overview
$56,794
PER CAPITA INCOME
$126,594
AVG FAMILY INCOME
$91,523
AVG HOUSEHOLD INCOME
16.5%
WAGE / INCOME GAP [ % ]
83.5¢/ $1
WAGE / INCOME GAP [ $ ]
0.48
INEQUALITY / GINI INDEX
8,813
TOTAL POPULATION
3,934
MALE POPULATION
4,879
FEMALE POPULATION
80.63
MALES / 100 FEMALES
124.02
FEMALES / 100 MALES
42.1
MEDIAN AGE
2.9
AVG FAMILY SIZE
2.3
AVG HOUSEHOLD SIZE
3,976
LABOR FORCE [ PEOPLE ]
56.2%
PERCENT IN LABOR FORCE
1.8%
UNEMPLOYMENT RATE
Income in Oak Hills Place
Income Overview in Oak Hills Place
Per Capita Income in Oak Hills Place is $56,794, while median incomes of families and households are $126,594 and $91,523 respectively.
| Characteristic | Number | Measure |
| Per Capita Income | 8,813 | $56,794 |
| Median Family Income | 2,578 | $126,594 |
| Mean Family Income | 2,578 | $166,501 |
| Median Household Income | 3,784 | $91,523 |
| Mean Household Income | 3,784 | $132,542 |
| Income Deficit | 2,578 | $0 |
| Wage / Income Gap (%) | 8,813 | 16.51% |
| Wage / Income Gap ($) | 8,813 | 83.49¢ per $1 |
| Gini / Inequality Index | 8,813 | 0.48 |
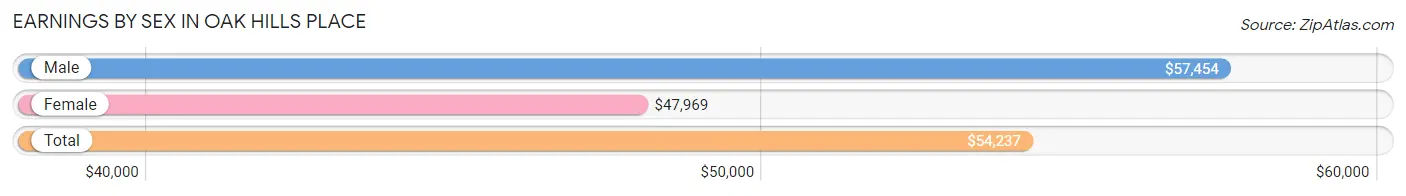
Earnings by Sex in Oak Hills Place
Average Earnings in Oak Hills Place are $54,237, $57,454 for men and $47,969 for women, a difference of 16.5%.
| Sex | Number | Average Earnings |
| Male | 2,578 (58.2%) | $57,454 |
| Female | 1,849 (41.8%) | $47,969 |
| Total | 4,427 (100.0%) | $54,237 |
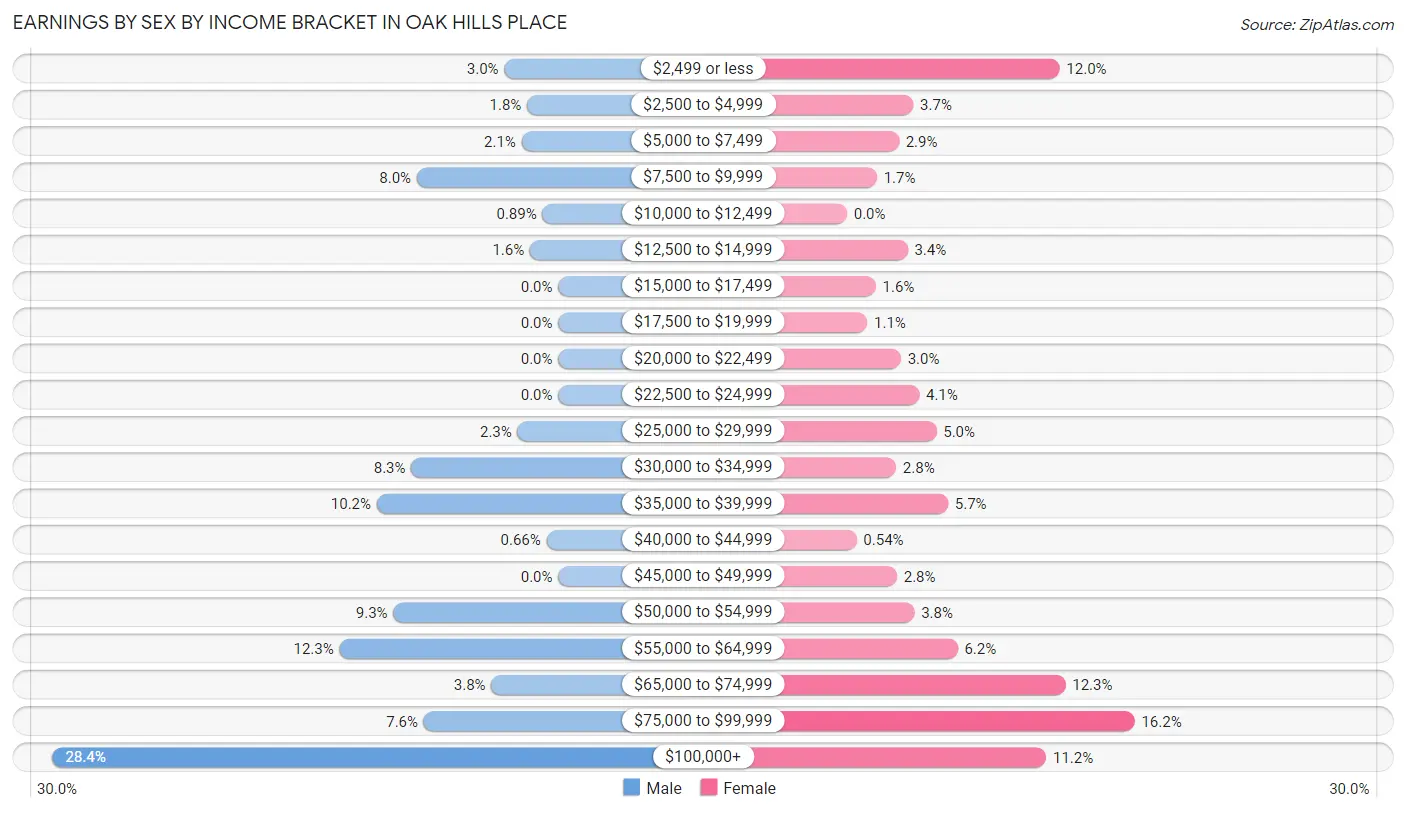
Earnings by Sex by Income Bracket in Oak Hills Place
The most common earnings brackets in Oak Hills Place are $100,000+ for men (733 | 28.4%) and $75,000 to $99,999 for women (299 | 16.2%).
| Income | Male | Female |
| $2,499 or less | 78 (3.0%) | 221 (11.9%) |
| $2,500 to $4,999 | 45 (1.8%) | 69 (3.7%) |
| $5,000 to $7,499 | 53 (2.1%) | 54 (2.9%) |
| $7,500 to $9,999 | 205 (8.0%) | 31 (1.7%) |
| $10,000 to $12,499 | 23 (0.9%) | 0 (0.0%) |
| $12,500 to $14,999 | 41 (1.6%) | 63 (3.4%) |
| $15,000 to $17,499 | 0 (0.0%) | 30 (1.6%) |
| $17,500 to $19,999 | 0 (0.0%) | 21 (1.1%) |
| $20,000 to $22,499 | 0 (0.0%) | 56 (3.0%) |
| $22,500 to $24,999 | 0 (0.0%) | 75 (4.1%) |
| $25,000 to $29,999 | 59 (2.3%) | 93 (5.0%) |
| $30,000 to $34,999 | 213 (8.3%) | 51 (2.8%) |
| $35,000 to $39,999 | 263 (10.2%) | 105 (5.7%) |
| $40,000 to $44,999 | 17 (0.7%) | 10 (0.5%) |
| $45,000 to $49,999 | 0 (0.0%) | 52 (2.8%) |
| $50,000 to $54,999 | 239 (9.3%) | 70 (3.8%) |
| $55,000 to $64,999 | 317 (12.3%) | 115 (6.2%) |
| $65,000 to $74,999 | 97 (3.8%) | 227 (12.3%) |
| $75,000 to $99,999 | 195 (7.6%) | 299 (16.2%) |
| $100,000+ | 733 (28.4%) | 207 (11.2%) |
| Total | 2,578 (100.0%) | 1,849 (100.0%) |
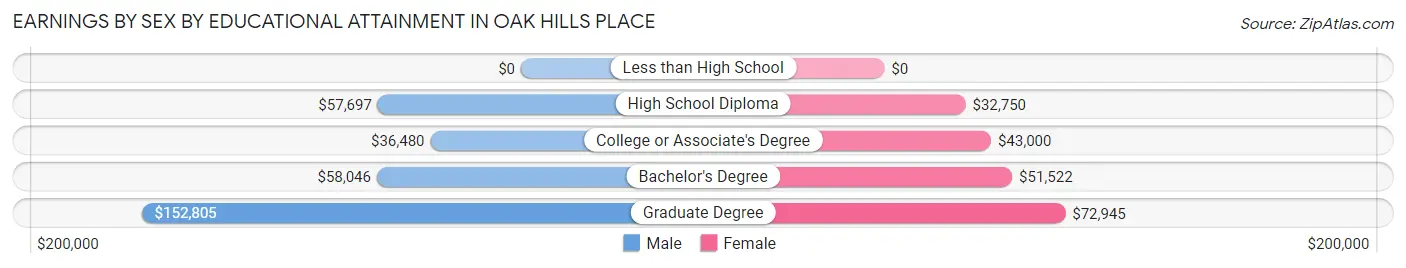
Earnings by Sex by Educational Attainment in Oak Hills Place
Average earnings in Oak Hills Place are $59,158 for men and $58,500 for women, a difference of 1.1%. Men with an educational attainment of graduate degree enjoy the highest average annual earnings of $152,805, while those with college or associate's degree education earn the least with $36,480. Women with an educational attainment of graduate degree earn the most with the average annual earnings of $72,945, while those with high school diploma education have the smallest earnings of $32,750.
| Educational Attainment | Male Income | Female Income |
| Less than High School | - | - |
| High School Diploma | $57,697 | $32,750 |
| College or Associate's Degree | $36,480 | $43,000 |
| Bachelor's Degree | $58,046 | $51,522 |
| Graduate Degree | $152,805 | $72,945 |
| Total | $59,158 | $58,500 |
Family Income in Oak Hills Place
Family Income Brackets in Oak Hills Place
According to the Oak Hills Place family income data, there are 616 families falling into the $200,000+ income range, which is the most common income bracket and makes up 23.9% of all families.
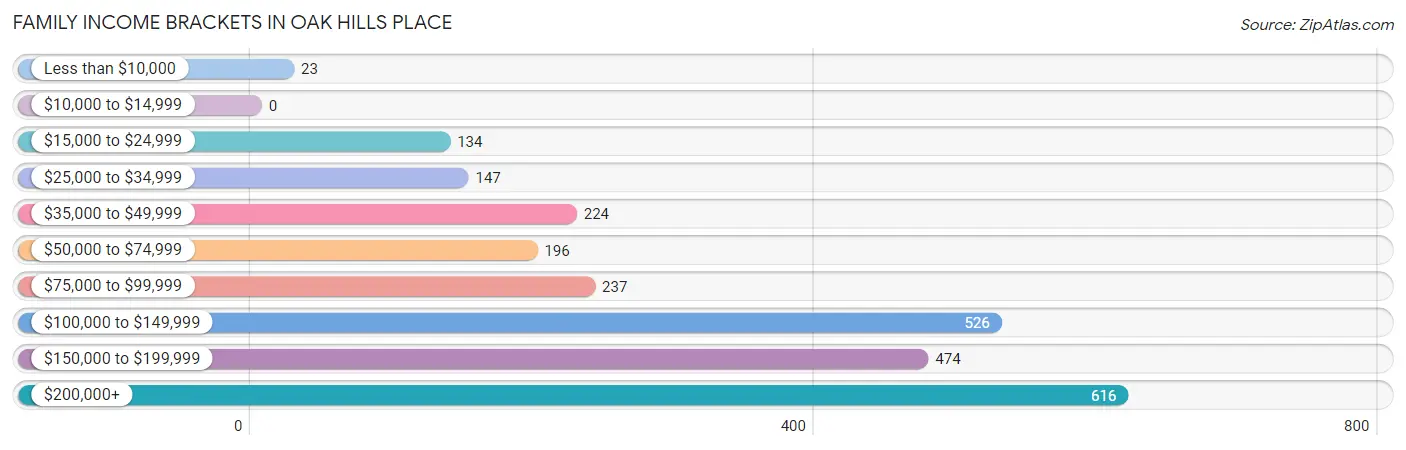
| Income Bracket | # Families | % Families |
| Less than $10,000 | 23 | 0.9% |
| $10,000 to $14,999 | 0 | 0.0% |
| $15,000 to $24,999 | 134 | 5.2% |
| $25,000 to $34,999 | 147 | 5.7% |
| $35,000 to $49,999 | 224 | 8.7% |
| $50,000 to $74,999 | 196 | 7.6% |
| $75,000 to $99,999 | 237 | 9.2% |
| $100,000 to $149,999 | 526 | 20.4% |
| $150,000 to $199,999 | 474 | 18.4% |
| $200,000+ | 616 | 23.9% |
Family Income by Famaliy Size in Oak Hills Place
5-person families (126 | 4.9%) account for the highest median family income in Oak Hills Place with $245,500 per family, while 2-person families (1,516 | 58.8%) have the highest median income of $54,246 per family member.
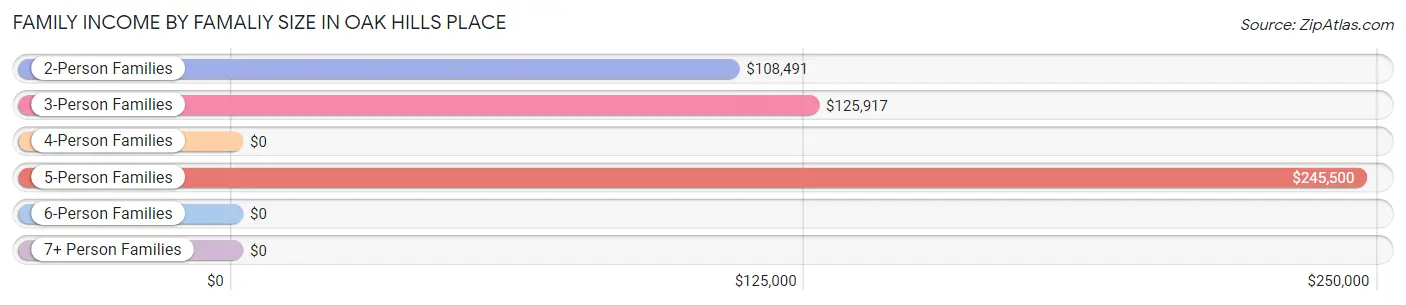
| Income Bracket | # Families | Median Income |
| 2-Person Families | 1,516 (58.8%) | $108,491 |
| 3-Person Families | 420 (16.3%) | $125,917 |
| 4-Person Families | 317 (12.3%) | $0 |
| 5-Person Families | 126 (4.9%) | $245,500 |
| 6-Person Families | 85 (3.3%) | $0 |
| 7+ Person Families | 114 (4.4%) | $0 |
| Total | 2,578 (100.0%) | $126,594 |
Family Income by Number of Earners in Oak Hills Place
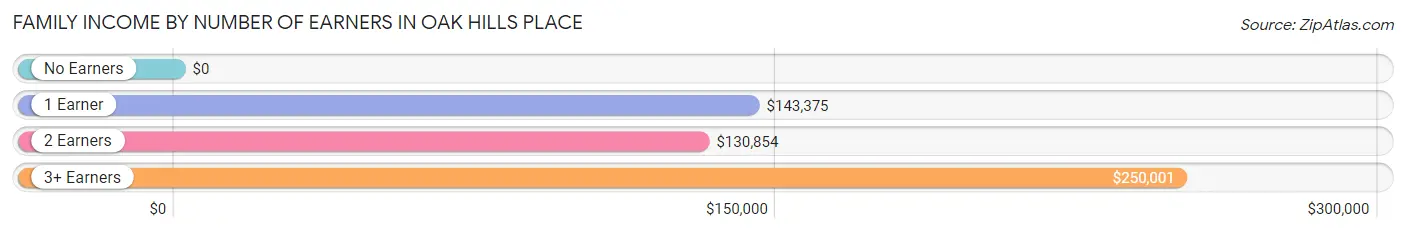
| Number of Earners | # Families | Median Income |
| No Earners | 521 (20.2%) | $0 |
| 1 Earner | 711 (27.6%) | $143,375 |
| 2 Earners | 1,190 (46.2%) | $130,854 |
| 3+ Earners | 156 (6.0%) | $250,001 |
| Total | 2,578 (100.0%) | $126,594 |
Household Income in Oak Hills Place
Household Income Brackets in Oak Hills Place
With 617 households falling in the category, the $200,000+ income range is the most frequent in Oak Hills Place, accounting for 16.3% of all households. In contrast, only 49 households (1.3%) fall into the $10,000 to $14,999 income bracket, making it the least populous group.
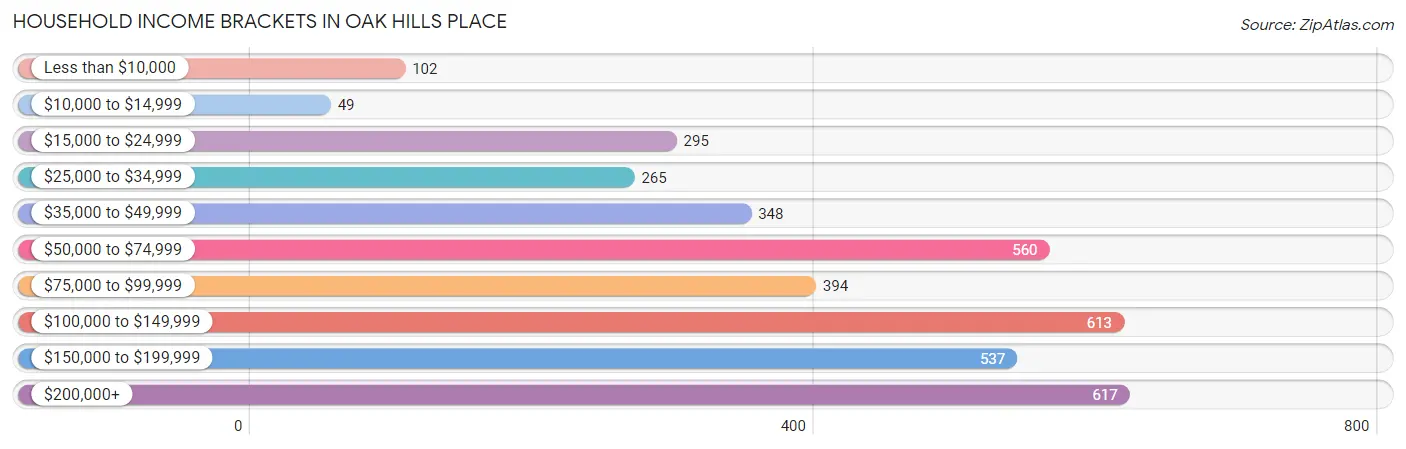
| Income Bracket | # Households | % Households |
| Less than $10,000 | 102 | 2.7% |
| $10,000 to $14,999 | 49 | 1.3% |
| $15,000 to $24,999 | 295 | 7.8% |
| $25,000 to $34,999 | 265 | 7.0% |
| $35,000 to $49,999 | 348 | 9.2% |
| $50,000 to $74,999 | 560 | 14.8% |
| $75,000 to $99,999 | 394 | 10.4% |
| $100,000 to $149,999 | 613 | 16.2% |
| $150,000 to $199,999 | 537 | 14.2% |
| $200,000+ | 617 | 16.3% |
Household Income by Householder Age in Oak Hills Place
The median household income in Oak Hills Place is $91,523, with the highest median household income of $111,875 found in the 45 to 64 years age bracket for the primary householder. A total of 1,120 households (29.6%) fall into this category. Meanwhile, the 15 to 24 years age bracket for the primary householder has the lowest median household income of $0, with 104 households (2.8%) in this group.
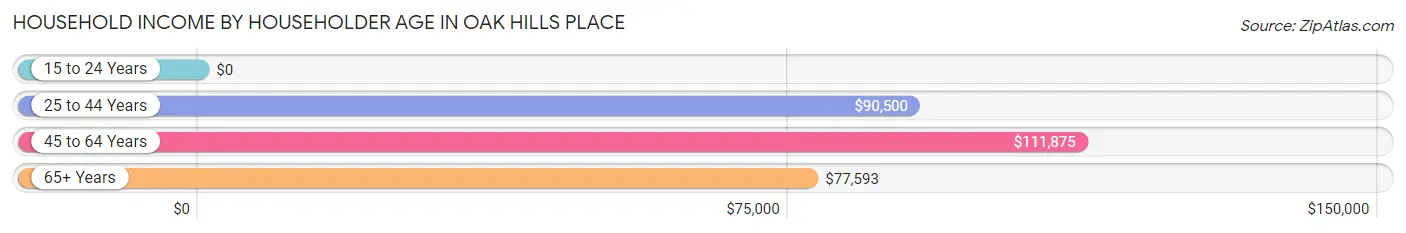
| Income Bracket | # Households | Median Income |
| 15 to 24 Years | 104 (2.8%) | $0 |
| 25 to 44 Years | 1,218 (32.2%) | $90,500 |
| 45 to 64 Years | 1,120 (29.6%) | $111,875 |
| 65+ Years | 1,342 (35.5%) | $77,593 |
| Total | 3,784 (100.0%) | $91,523 |
Poverty in Oak Hills Place
Income Below Poverty by Sex and Age in Oak Hills Place
With 4.5% poverty level for males and 7.0% for females among the residents of Oak Hills Place, 16 and 17 year old males and 18 to 24 year old females are the most vulnerable to poverty, with 98 males (71.0%) and 141 females (51.8%) in their respective age groups living below the poverty level.
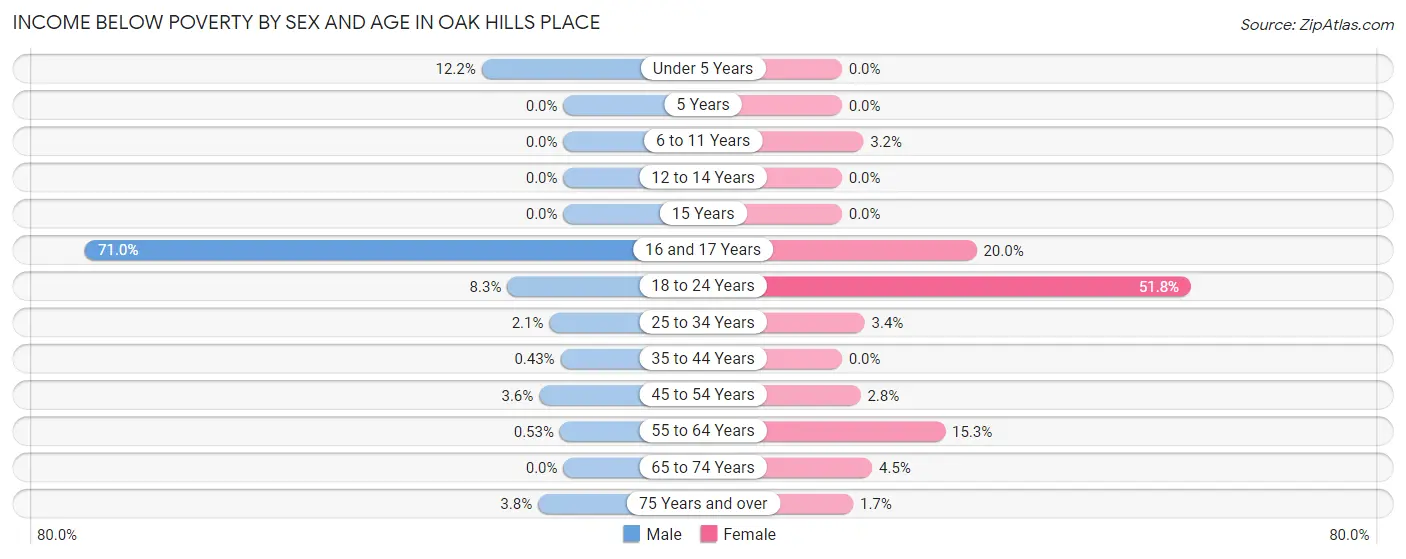
| Age Bracket | Male | Female |
| Under 5 Years | 13 (12.1%) | 0 (0.0%) |
| 5 Years | 0 (0.0%) | 0 (0.0%) |
| 6 to 11 Years | 0 (0.0%) | 11 (3.2%) |
| 12 to 14 Years | 0 (0.0%) | 0 (0.0%) |
| 15 Years | 0 (0.0%) | 0 (0.0%) |
| 16 and 17 Years | 98 (71.0%) | 11 (20.0%) |
| 18 to 24 Years | 18 (8.3%) | 141 (51.8%) |
| 25 to 34 Years | 17 (2.1%) | 15 (3.4%) |
| 35 to 44 Years | 2 (0.4%) | 0 (0.0%) |
| 45 to 54 Years | 15 (3.6%) | 12 (2.8%) |
| 55 to 64 Years | 2 (0.5%) | 105 (15.3%) |
| 65 to 74 Years | 0 (0.0%) | 35 (4.5%) |
| 75 Years and over | 11 (3.8%) | 10 (1.7%) |
| Total | 176 (4.5%) | 340 (7.0%) |
Income Above Poverty by Sex and Age in Oak Hills Place
According to the poverty statistics in Oak Hills Place, males aged 6 to 11 years and females aged under 5 years are the age groups that are most secure financially, with 100.0% of males and 100.0% of females in these age groups living above the poverty line.
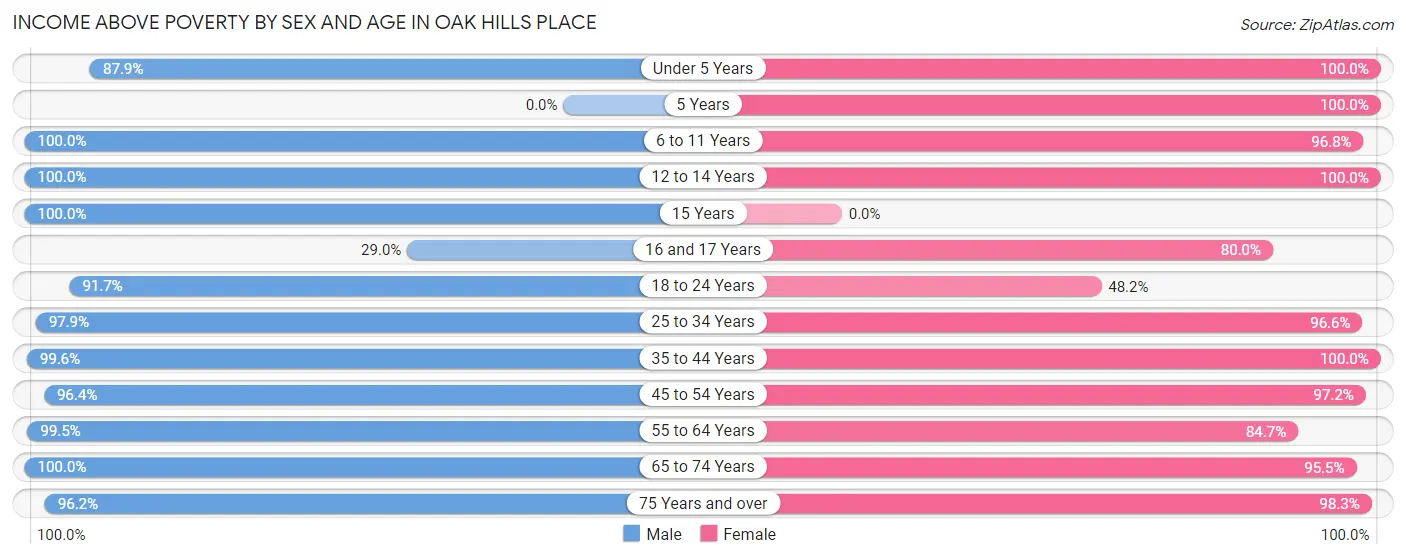
| Age Bracket | Male | Female |
| Under 5 Years | 94 (87.8%) | 470 (100.0%) |
| 5 Years | 0 (0.0%) | 92 (100.0%) |
| 6 to 11 Years | 350 (100.0%) | 334 (96.8%) |
| 12 to 14 Years | 48 (100.0%) | 244 (100.0%) |
| 15 Years | 71 (100.0%) | 0 (0.0%) |
| 16 and 17 Years | 40 (29.0%) | 44 (80.0%) |
| 18 to 24 Years | 198 (91.7%) | 131 (48.2%) |
| 25 to 34 Years | 797 (97.9%) | 427 (96.6%) |
| 35 to 44 Years | 465 (99.6%) | 454 (100.0%) |
| 45 to 54 Years | 402 (96.4%) | 421 (97.2%) |
| 55 to 64 Years | 372 (99.5%) | 580 (84.7%) |
| 65 to 74 Years | 640 (100.0%) | 742 (95.5%) |
| 75 Years and over | 281 (96.2%) | 589 (98.3%) |
| Total | 3,758 (95.5%) | 4,528 (93.0%) |
Income Below Poverty Among Married-Couple Families in Oak Hills Place
The poverty statistics for married-couple families in Oak Hills Place show that 1.1% or 23 of the total 2,191 families live below the poverty line. Families with 1 or 2 children have the highest poverty rate of 2.3%, comprising of 12 families. On the other hand, families with 3 or 4 children have the lowest poverty rate of 0.0%, which includes 0 families.
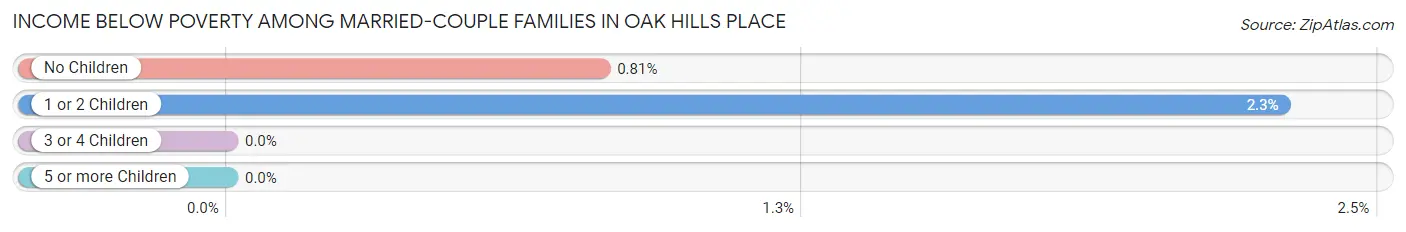
| Children | Above Poverty | Below Poverty |
| No Children | 1,344 (99.2%) | 11 (0.8%) |
| 1 or 2 Children | 511 (97.7%) | 12 (2.3%) |
| 3 or 4 Children | 199 (100.0%) | 0 (0.0%) |
| 5 or more Children | 114 (100.0%) | 0 (0.0%) |
| Total | 2,168 (99.0%) | 23 (1.1%) |
Income Below Poverty Among Single-Parent Households in Oak Hills Place
According to the poverty data in Oak Hills Place, 6.4% or 13 single-father households and 57.1% or 105 single-mother households are living below the poverty line. Among single-father households, those with 1 or 2 children have the highest poverty rate, with 13 households (14.6%) experiencing poverty. Likewise, among single-mother households, those with 1 or 2 children have the highest poverty rate, with 105 households (82.0%) falling below the poverty line.
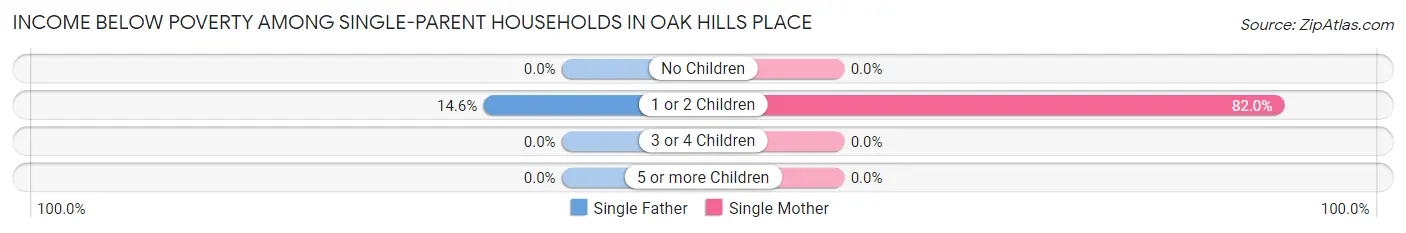
| Children | Single Father | Single Mother |
| No Children | 0 (0.0%) | 0 (0.0%) |
| 1 or 2 Children | 13 (14.6%) | 105 (82.0%) |
| 3 or 4 Children | 0 (0.0%) | 0 (0.0%) |
| 5 or more Children | 0 (0.0%) | 0 (0.0%) |
| Total | 13 (6.4%) | 105 (57.1%) |
Income Below Poverty Among Married-Couple vs Single-Parent Households in Oak Hills Place
The poverty data for Oak Hills Place shows that 23 of the married-couple family households (1.1%) and 118 of the single-parent households (30.5%) are living below the poverty level. Within the married-couple family households, those with 1 or 2 children have the highest poverty rate, with 12 households (2.3%) falling below the poverty line. Among the single-parent households, those with 1 or 2 children have the highest poverty rate, with 118 household (54.4%) living below poverty.
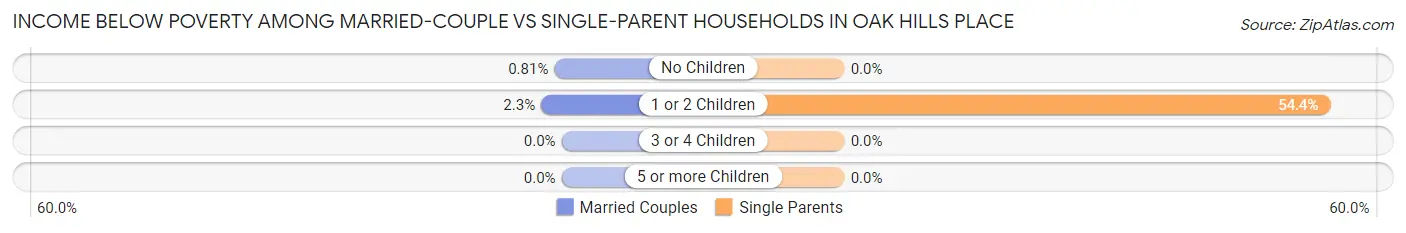
| Children | Married-Couple Families | Single-Parent Households |
| No Children | 11 (0.8%) | 0 (0.0%) |
| 1 or 2 Children | 12 (2.3%) | 118 (54.4%) |
| 3 or 4 Children | 0 (0.0%) | 0 (0.0%) |
| 5 or more Children | 0 (0.0%) | 0 (0.0%) |
| Total | 23 (1.1%) | 118 (30.5%) |
Race in Oak Hills Place
The most populous races in Oak Hills Place are White / Caucasian (6,743 | 76.5%), Black / African American (1,107 | 12.6%), and Two or more Races (578 | 6.6%).
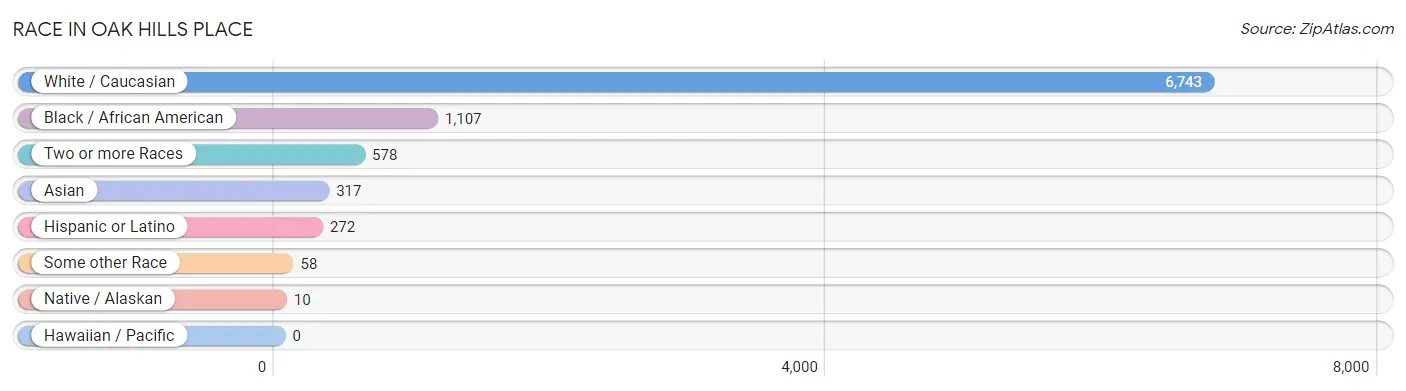
| Race | # Population | % Population |
| Asian | 317 | 3.6% |
| Black / African American | 1,107 | 12.6% |
| Hawaiian / Pacific | 0 | 0.0% |
| Hispanic or Latino | 272 | 3.1% |
| Native / Alaskan | 10 | 0.1% |
| White / Caucasian | 6,743 | 76.5% |
| Two or more Races | 578 | 6.6% |
| Some other Race | 58 | 0.7% |
| Total | 8,813 | 100.0% |
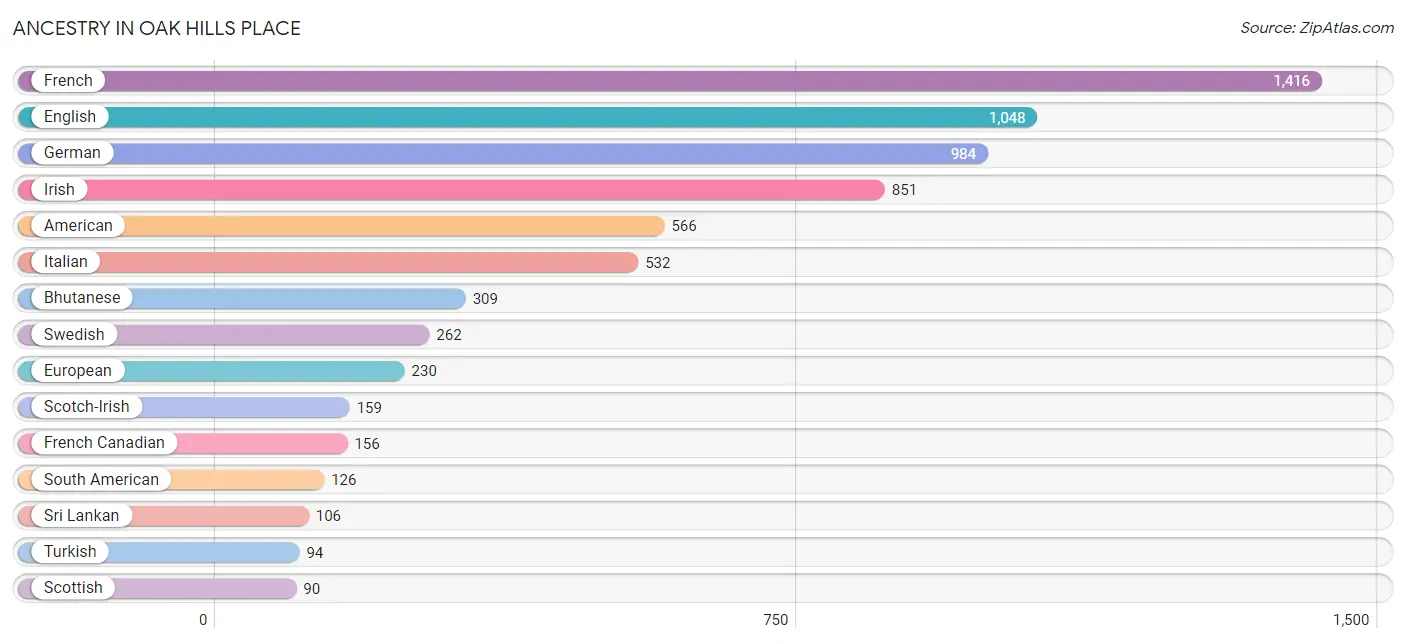
Ancestry in Oak Hills Place
The most populous ancestries reported in Oak Hills Place are French (1,416 | 16.1%), English (1,048 | 11.9%), German (984 | 11.2%), Irish (851 | 9.7%), and American (566 | 6.4%), together accounting for 55.2% of all Oak Hills Place residents.
| Ancestry | # Population | % Population |
| African | 75 | 0.9% |
| American | 566 | 6.4% |
| Arab | 32 | 0.4% |
| Argentinean | 18 | 0.2% |
| Belgian | 19 | 0.2% |
| Bhutanese | 309 | 3.5% |
| British | 15 | 0.2% |
| Cajun | 55 | 0.6% |
| Central American | 12 | 0.1% |
| Chickasaw | 46 | 0.5% |
| Choctaw | 10 | 0.1% |
| Colombian | 50 | 0.6% |
| Croatian | 13 | 0.2% |
| Cuban | 12 | 0.1% |
| Eastern European | 31 | 0.4% |
| Ecuadorian | 58 | 0.7% |
| English | 1,048 | 11.9% |
| European | 230 | 2.6% |
| Finnish | 46 | 0.5% |
| French | 1,416 | 16.1% |
| French Canadian | 156 | 1.8% |
| German | 984 | 11.2% |
| Greek | 30 | 0.3% |
| Honduran | 12 | 0.1% |
| Hungarian | 10 | 0.1% |
| Irish | 851 | 9.7% |
| Italian | 532 | 6.0% |
| Korean | 36 | 0.4% |
| Lebanese | 11 | 0.1% |
| Mexican | 45 | 0.5% |
| Northern European | 23 | 0.3% |
| Norwegian | 9 | 0.1% |
| Polish | 11 | 0.1% |
| Portuguese | 18 | 0.2% |
| Russian | 24 | 0.3% |
| Scotch-Irish | 159 | 1.8% |
| Scottish | 90 | 1.0% |
| Slovak | 23 | 0.3% |
| South American | 126 | 1.4% |
| Spaniard | 33 | 0.4% |
| Spanish | 39 | 0.4% |
| Sri Lankan | 106 | 1.2% |
| Subsaharan African | 75 | 0.9% |
| Swedish | 262 | 3.0% |
| Syrian | 21 | 0.2% |
| Thai | 5 | 0.1% |
| Turkish | 94 | 1.1% |
| Ukrainian | 11 | 0.1% |
| Welsh | 24 | 0.3% | View All 49 Rows |
Immigrants in Oak Hills Place
The most numerous immigrant groups reported in Oak Hills Place came from Asia (292 | 3.3%), Latin America (264 | 3.0%), South America (190 | 2.2%), Eastern Asia (115 | 1.3%), and Japan (115 | 1.3%), together accounting for 11.1% of all Oak Hills Place residents.
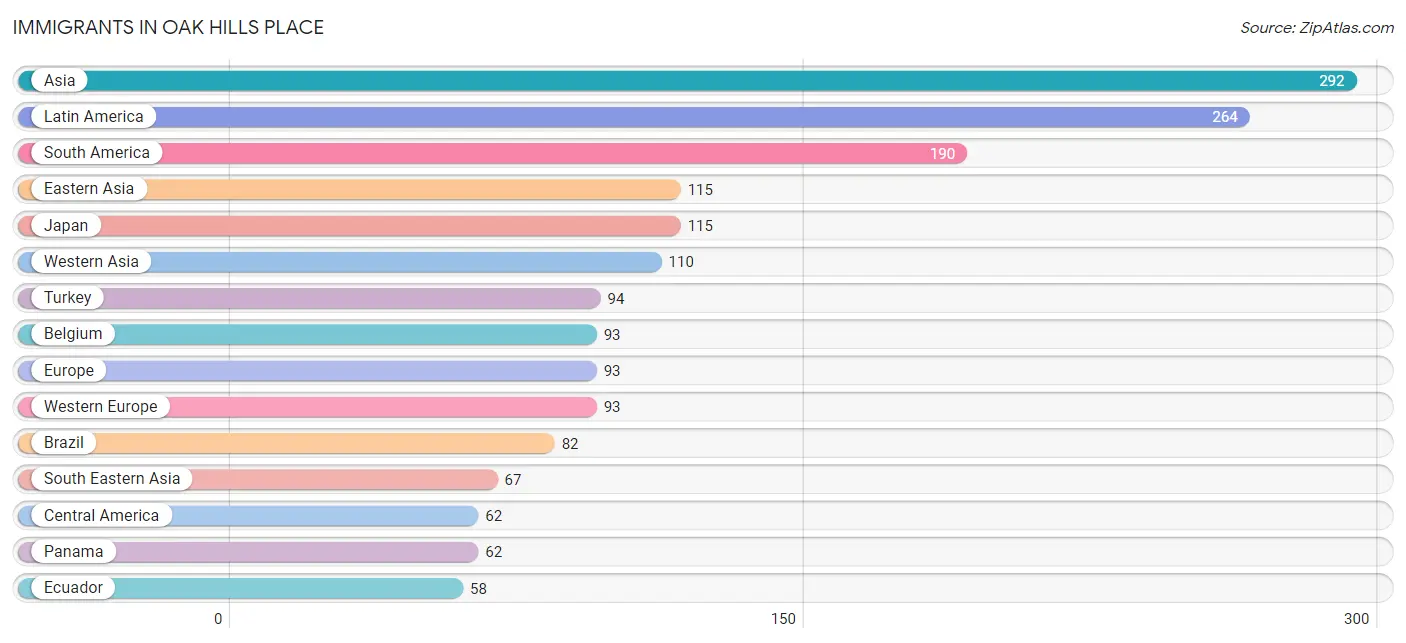
| Immigration Origin | # Population | % Population |
| Asia | 292 | 3.3% |
| Belgium | 93 | 1.1% |
| Brazil | 82 | 0.9% |
| Caribbean | 12 | 0.1% |
| Central America | 62 | 0.7% |
| Colombia | 50 | 0.6% |
| Cuba | 12 | 0.1% |
| Eastern Asia | 115 | 1.3% |
| Ecuador | 58 | 0.7% |
| Europe | 93 | 1.1% |
| Japan | 115 | 1.3% |
| Latin America | 264 | 3.0% |
| Lebanon | 11 | 0.1% |
| Panama | 62 | 0.7% |
| Philippines | 15 | 0.2% |
| South America | 190 | 2.2% |
| South Eastern Asia | 67 | 0.8% |
| Turkey | 94 | 1.1% |
| Vietnam | 52 | 0.6% |
| Western Asia | 110 | 1.3% |
| Western Europe | 93 | 1.1% | View All 21 Rows |
Sex and Age in Oak Hills Place
Sex and Age in Oak Hills Place
The most populous age groups in Oak Hills Place are 30 to 34 Years (480 | 12.2%) for men and Under 5 Years (481 | 9.9%) for women.
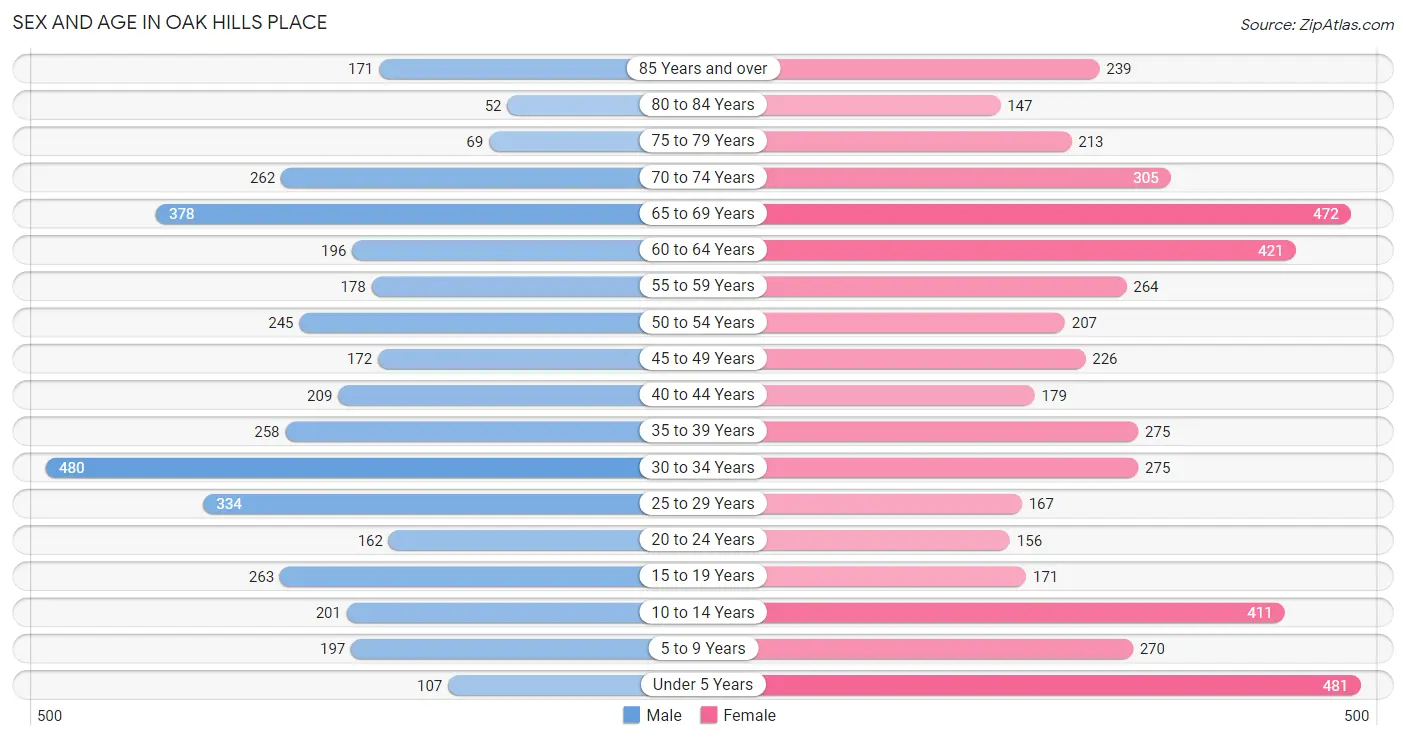
| Age Bracket | Male | Female |
| Under 5 Years | 107 (2.7%) | 481 (9.9%) |
| 5 to 9 Years | 197 (5.0%) | 270 (5.5%) |
| 10 to 14 Years | 201 (5.1%) | 411 (8.4%) |
| 15 to 19 Years | 263 (6.7%) | 171 (3.5%) |
| 20 to 24 Years | 162 (4.1%) | 156 (3.2%) |
| 25 to 29 Years | 334 (8.5%) | 167 (3.4%) |
| 30 to 34 Years | 480 (12.2%) | 275 (5.6%) |
| 35 to 39 Years | 258 (6.6%) | 275 (5.6%) |
| 40 to 44 Years | 209 (5.3%) | 179 (3.7%) |
| 45 to 49 Years | 172 (4.4%) | 226 (4.6%) |
| 50 to 54 Years | 245 (6.2%) | 207 (4.2%) |
| 55 to 59 Years | 178 (4.5%) | 264 (5.4%) |
| 60 to 64 Years | 196 (5.0%) | 421 (8.6%) |
| 65 to 69 Years | 378 (9.6%) | 472 (9.7%) |
| 70 to 74 Years | 262 (6.7%) | 305 (6.2%) |
| 75 to 79 Years | 69 (1.8%) | 213 (4.4%) |
| 80 to 84 Years | 52 (1.3%) | 147 (3.0%) |
| 85 Years and over | 171 (4.3%) | 239 (4.9%) |
| Total | 3,934 (100.0%) | 4,879 (100.0%) |
Families and Households in Oak Hills Place
Median Family Size in Oak Hills Place
The median family size in Oak Hills Place is 2.91 persons per family, with married-couple families (2,191 | 85.0%) accounting for the largest median family size of 3.08 persons per family. On the other hand, single male/father families (203 | 7.9%) represent the smallest median family size with 1.65 persons per family.
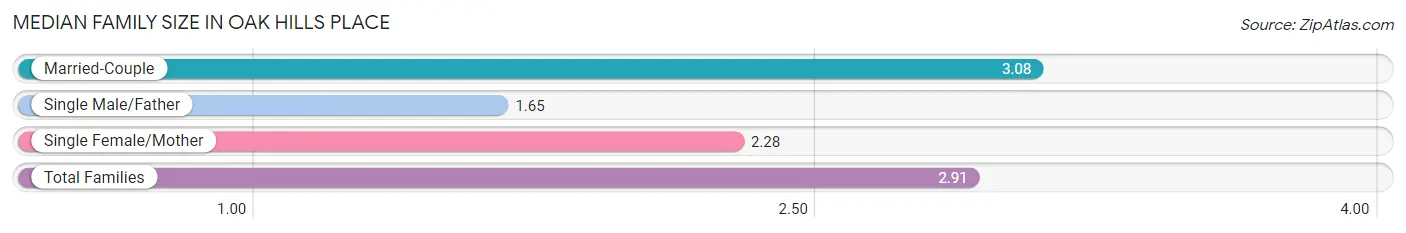
| Family Type | # Families | Family Size |
| Married-Couple | 2,191 (85.0%) | 3.08 |
| Single Male/Father | 203 (7.9%) | 1.65 |
| Single Female/Mother | 184 (7.1%) | 2.28 |
| Total Families | 2,578 (100.0%) | 2.91 |
Median Household Size in Oak Hills Place
The median household size in Oak Hills Place is 2.33 persons per household, with married-couple households (2,191 | 57.9%) accounting for the largest median household size of 3.08 persons per household. non-family households (1,206 | 31.9%) represent the smallest median household size with 1.04 persons per household.
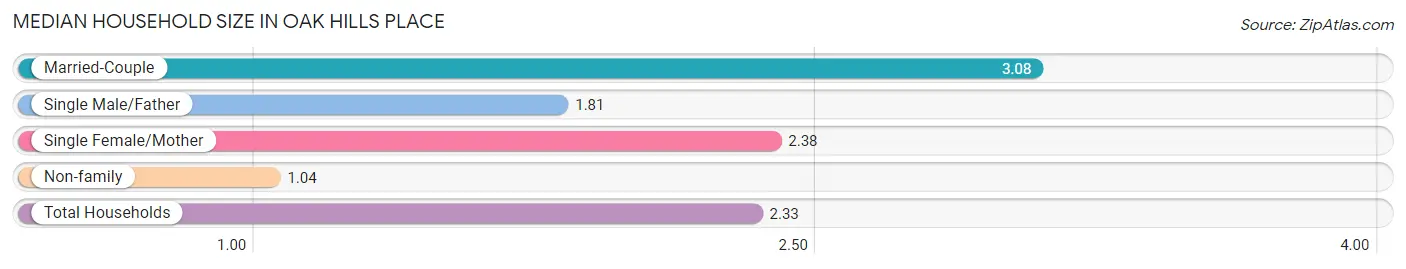
| Household Type | # Households | Household Size |
| Married-Couple | 2,191 (57.9%) | 3.08 |
| Single Male/Father | 203 (5.4%) | 1.81 |
| Single Female/Mother | 184 (4.9%) | 2.38 |
| Non-family | 1,206 (31.9%) | 1.04 |
| Total Households | 3,784 (100.0%) | 2.33 |
Household Size by Marriage Status in Oak Hills Place
Out of a total of 3,784 households in Oak Hills Place, 2,578 (68.1%) are family households, while 1,206 (31.9%) are nonfamily households. The most numerous type of family households are 2-person households, comprising 1,462, and the most common type of nonfamily households are 1-person households, comprising 1,166.
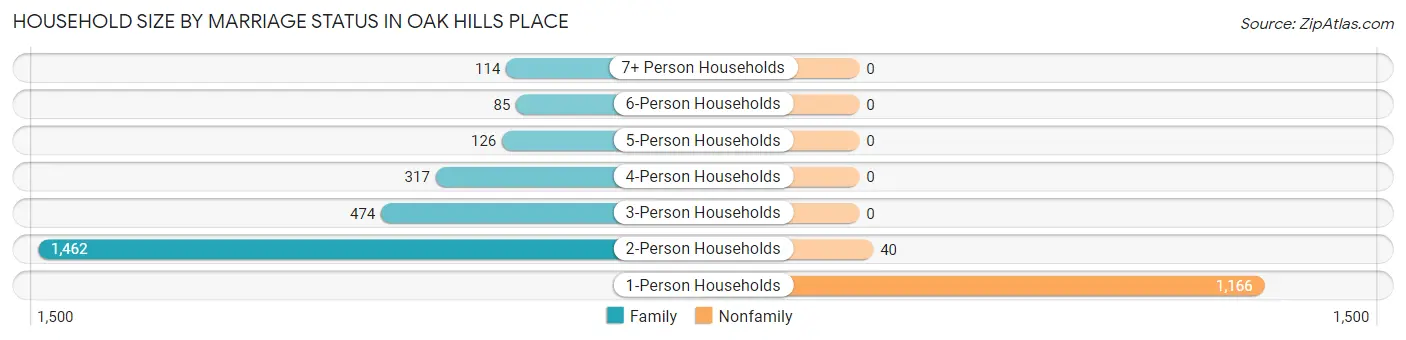
| Household Size | Family Households | Nonfamily Households |
| 1-Person Households | - | 1,166 (30.8%) |
| 2-Person Households | 1,462 (38.6%) | 40 (1.1%) |
| 3-Person Households | 474 (12.5%) | 0 (0.0%) |
| 4-Person Households | 317 (8.4%) | 0 (0.0%) |
| 5-Person Households | 126 (3.3%) | 0 (0.0%) |
| 6-Person Households | 85 (2.2%) | 0 (0.0%) |
| 7+ Person Households | 114 (3.0%) | 0 (0.0%) |
| Total | 2,578 (68.1%) | 1,206 (31.9%) |
Female Fertility in Oak Hills Place
Fertility by Age in Oak Hills Place
Average fertility rate in Oak Hills Place is 168.0 births per 1,000 women. Women in the age bracket of 20 to 34 years have the highest fertility rate with 256.0 births per 1,000 women. Women in the age bracket of 20 to 34 years acount for 61.5% of all women with births.
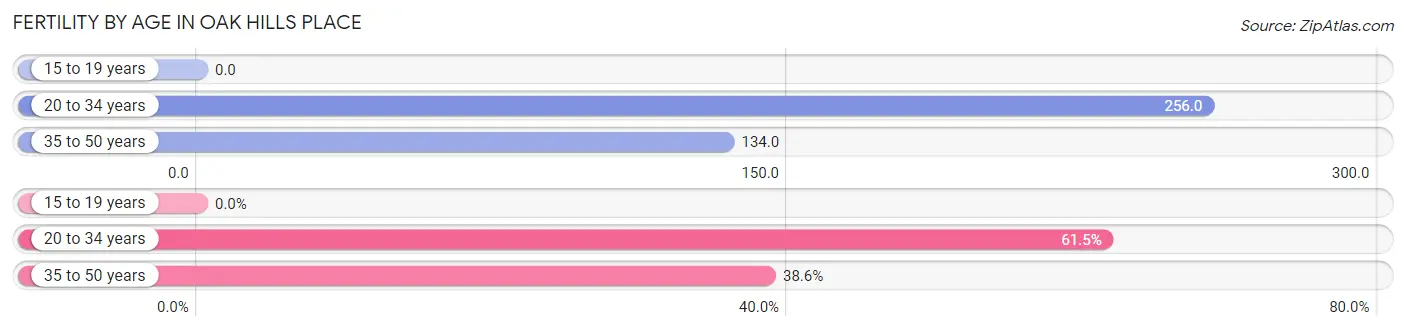
| Age Bracket | Women with Births | Births / 1,000 Women |
| 15 to 19 years | 0 (0.0%) | 0.0 |
| 20 to 34 years | 153 (61.5%) | 256.0 |
| 35 to 50 years | 96 (38.6%) | 134.0 |
| Total | 249 (100.0%) | 168.0 |
Fertility by Age by Marriage Status in Oak Hills Place
71.1% of women with births (249) in Oak Hills Place are married. The highest percentage of unmarried women with births falls into 20 to 34 years age bracket with 47.1% of them unmarried at the time of birth, while the lowest percentage of unmarried women with births belong to 35 to 50 years age bracket with 0.0% of them unmarried.
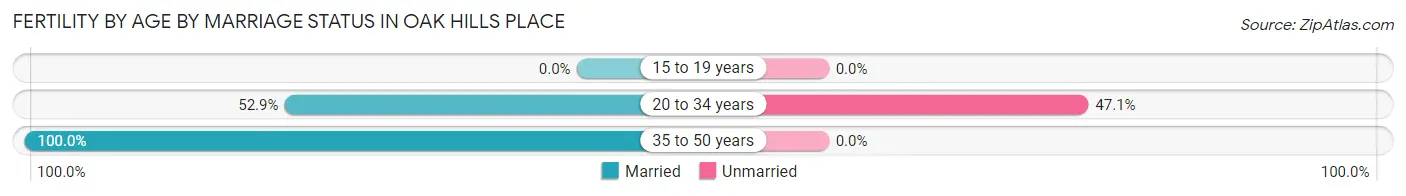
| Age Bracket | Married | Unmarried |
| 15 to 19 years | 0 (0.0%) | 0 (0.0%) |
| 20 to 34 years | 81 (52.9%) | 72 (47.1%) |
| 35 to 50 years | 96 (100.0%) | 0 (0.0%) |
| Total | 177 (71.1%) | 72 (28.9%) |
Fertility by Education in Oak Hills Place
Average fertility rate in Oak Hills Place is 168.0 births per 1,000 women. Women with the education attainment of less than high school have the highest fertility rate of 401.0 births per 1,000 women, while women with the education attainment of bachelor's degree have the lowest fertility at 40.0 births per 1,000 women. Women with the education attainment of college or associate's degree represent 31.7% of all women with births.
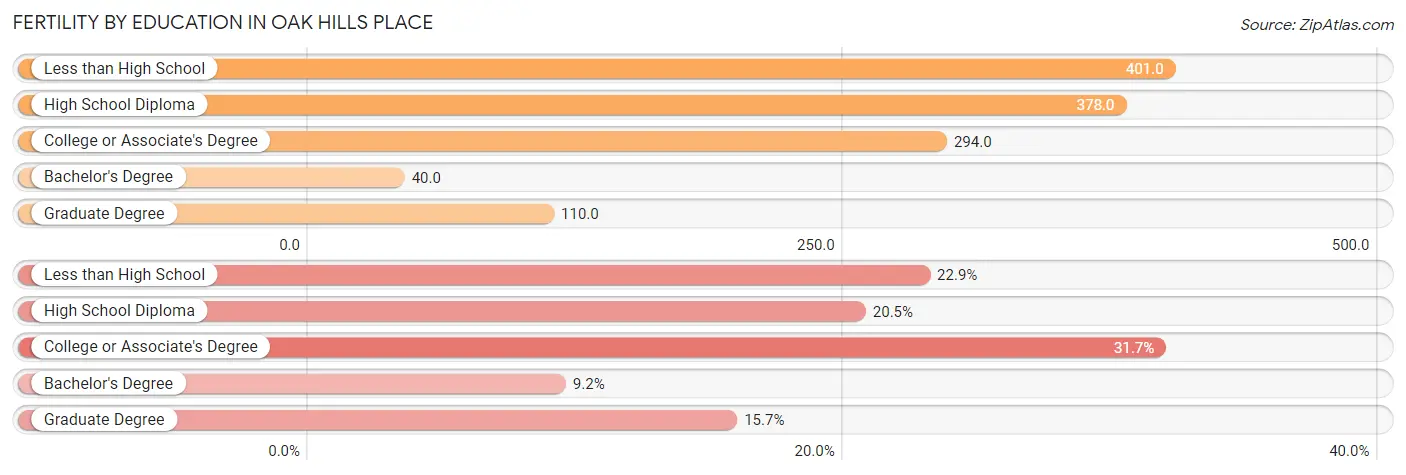
| Educational Attainment | Women with Births | Births / 1,000 Women |
| Less than High School | 57 (22.9%) | 401.0 |
| High School Diploma | 51 (20.5%) | 378.0 |
| College or Associate's Degree | 79 (31.7%) | 294.0 |
| Bachelor's Degree | 23 (9.2%) | 40.0 |
| Graduate Degree | 39 (15.7%) | 110.0 |
| Total | 249 (100.0%) | 168.0 |
Fertility by Education by Marriage Status in Oak Hills Place
28.9% of women with births in Oak Hills Place are unmarried. Women with the educational attainment of less than high school are most likely to be married with 100.0% of them married at childbirth, while women with the educational attainment of high school diploma are least likely to be married with 100.0% of them unmarried at childbirth.
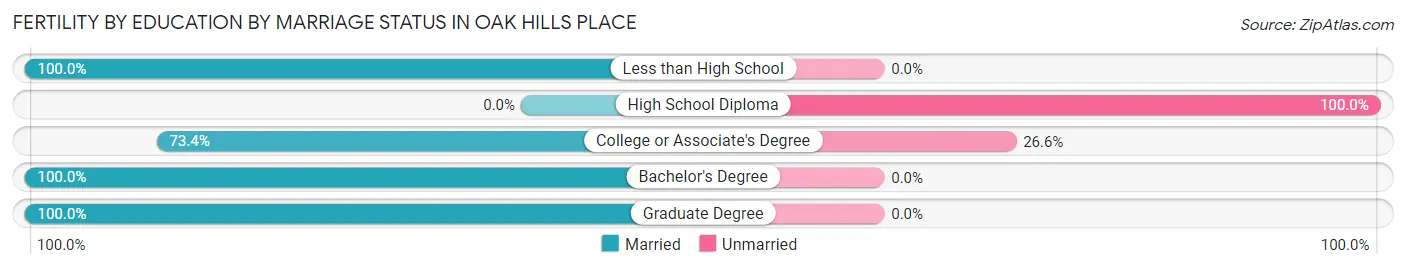
| Educational Attainment | Married | Unmarried |
| Less than High School | 57 (100.0%) | 0 (0.0%) |
| High School Diploma | 0 (0.0%) | 51 (100.0%) |
| College or Associate's Degree | 58 (73.4%) | 21 (26.6%) |
| Bachelor's Degree | 23 (100.0%) | 0 (0.0%) |
| Graduate Degree | 39 (100.0%) | 0 (0.0%) |
| Total | 177 (71.1%) | 72 (28.9%) |
Employment Characteristics in Oak Hills Place
Employment by Class of Employer in Oak Hills Place
Among the 3,817 employed individuals in Oak Hills Place, private company employees (2,266 | 59.4%), state government employees (422 | 11.1%), and not-for-profit organizations (356 | 9.3%) make up the most common classes of employment.
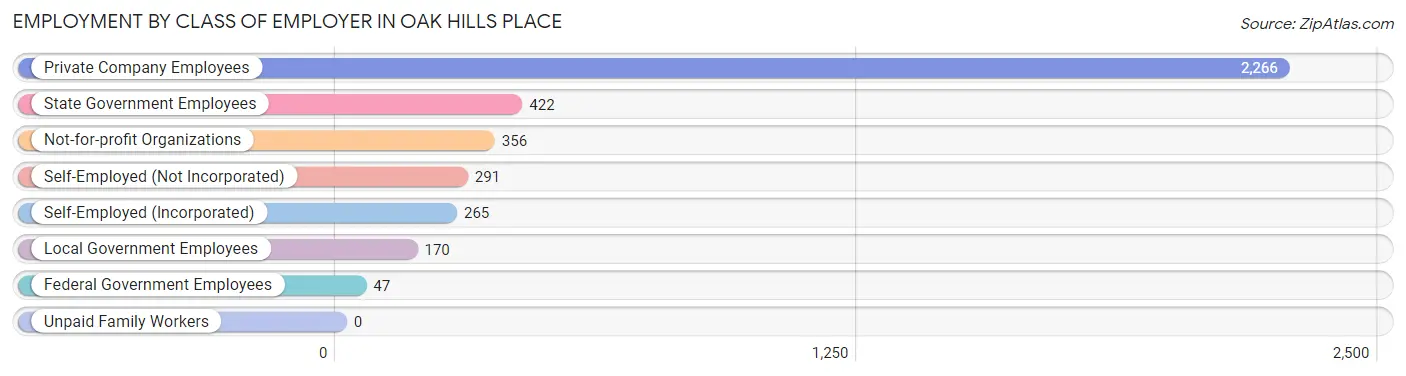
| Employer Class | # Employees | % Employees |
| Private Company Employees | 2,266 | 59.4% |
| Self-Employed (Incorporated) | 265 | 6.9% |
| Self-Employed (Not Incorporated) | 291 | 7.6% |
| Not-for-profit Organizations | 356 | 9.3% |
| Local Government Employees | 170 | 4.4% |
| State Government Employees | 422 | 11.1% |
| Federal Government Employees | 47 | 1.2% |
| Unpaid Family Workers | 0 | 0.0% |
| Total | 3,817 | 100.0% |
Employment Status by Age in Oak Hills Place
According to the labor force statistics for Oak Hills Place, out of the total population over 16 years of age (7,075), 56.2% or 3,976 individuals are in the labor force, with 1.8% or 72 of them unemployed. The age group with the highest labor force participation rate is 35 to 44 years, with 90.8% or 836 individuals in the labor force. Within the labor force, the 75 years and over age range has the highest percentage of unemployed individuals, with 21.3% or 26 of them being unemployed.
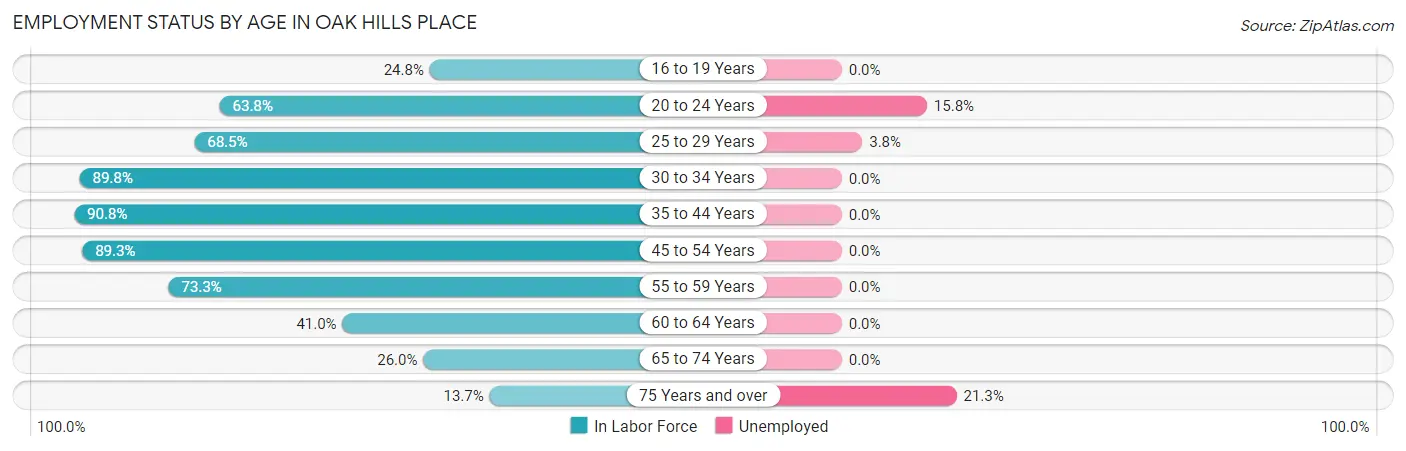
| Age Bracket | In Labor Force | Unemployed |
| 16 to 19 Years | 90 (24.8%) | 0 (0.0%) |
| 20 to 24 Years | 203 (63.8%) | 32 (15.8%) |
| 25 to 29 Years | 343 (68.5%) | 13 (3.8%) |
| 30 to 34 Years | 678 (89.8%) | 0 (0.0%) |
| 35 to 44 Years | 836 (90.8%) | 0 (0.0%) |
| 45 to 54 Years | 759 (89.3%) | 0 (0.0%) |
| 55 to 59 Years | 324 (73.3%) | 0 (0.0%) |
| 60 to 64 Years | 253 (41.0%) | 0 (0.0%) |
| 65 to 74 Years | 368 (26.0%) | 0 (0.0%) |
| 75 Years and over | 122 (13.7%) | 26 (21.3%) |
| Total | 3,976 (56.2%) | 72 (1.8%) |
Employment Status by Educational Attainment in Oak Hills Place
According to labor force statistics for Oak Hills Place, 78.1% of individuals (3,191) out of the total population between 25 and 64 years of age (4,086) are in the labor force, with 0.4% or 13 of them being unemployed. The group with the highest labor force participation rate are those with the educational attainment of bachelor's degree or higher, with 82.8% or 2,190 individuals in the labor force. Within the labor force, individuals with bachelor's degree or higher education have the highest percentage of unemployment, with 0.6% or 13 of them being unemployed.
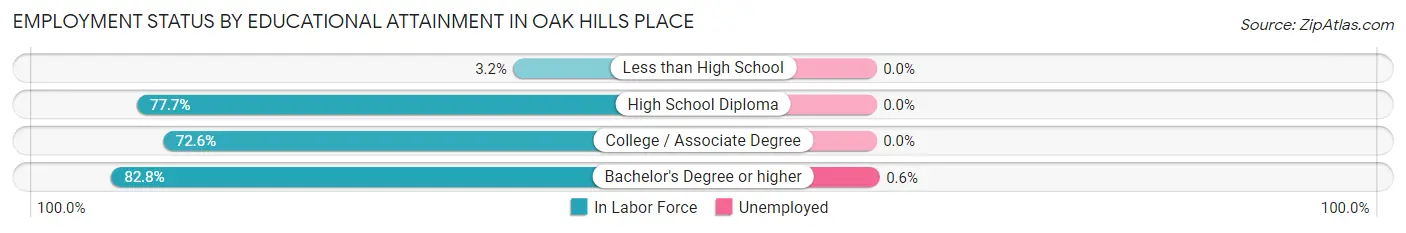
| Educational Attainment | In Labor Force | Unemployed |
| Less than High School | 3 (3.2%) | 0 (0.0%) |
| High School Diploma | 321 (77.7%) | 0 (0.0%) |
| College / Associate Degree | 678 (72.6%) | 0 (0.0%) |
| Bachelor's Degree or higher | 2,190 (82.8%) | 16 (0.6%) |
| Total | 3,191 (78.1%) | 16 (0.4%) |
Employment Occupations by Sex in Oak Hills Place
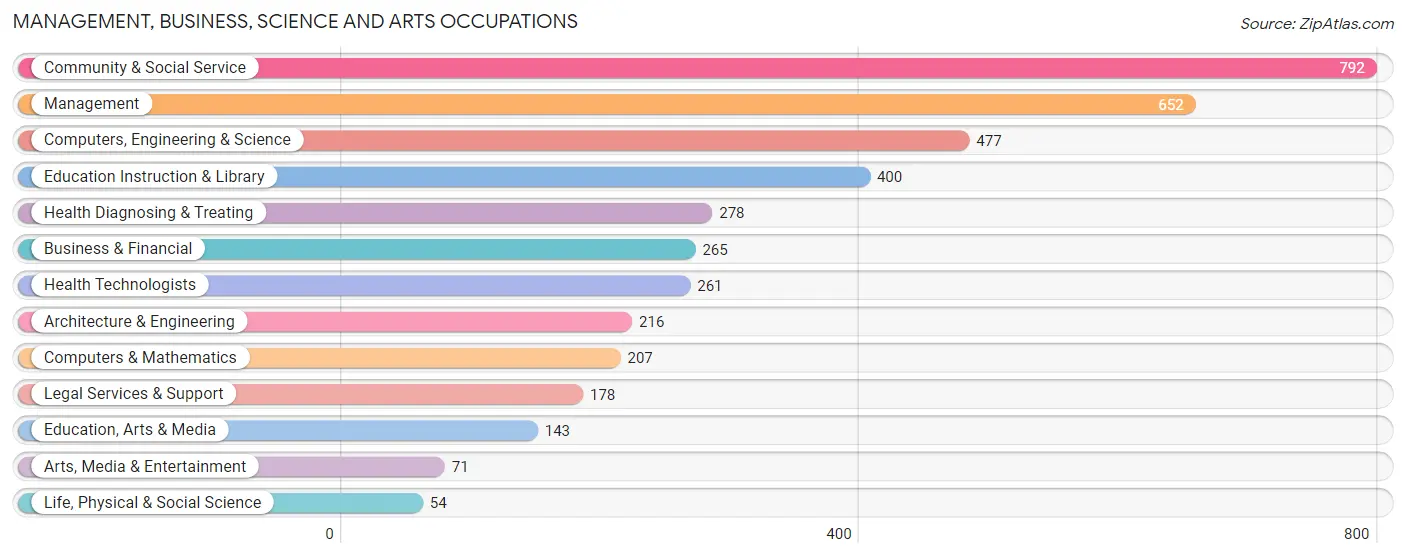
Management, Business, Science and Arts Occupations
The most common Management, Business, Science and Arts occupations in Oak Hills Place are Community & Social Service (792 | 20.4%), Management (652 | 16.8%), Computers, Engineering & Science (477 | 12.3%), Education Instruction & Library (400 | 10.3%), and Health Diagnosing & Treating (278 | 7.2%).
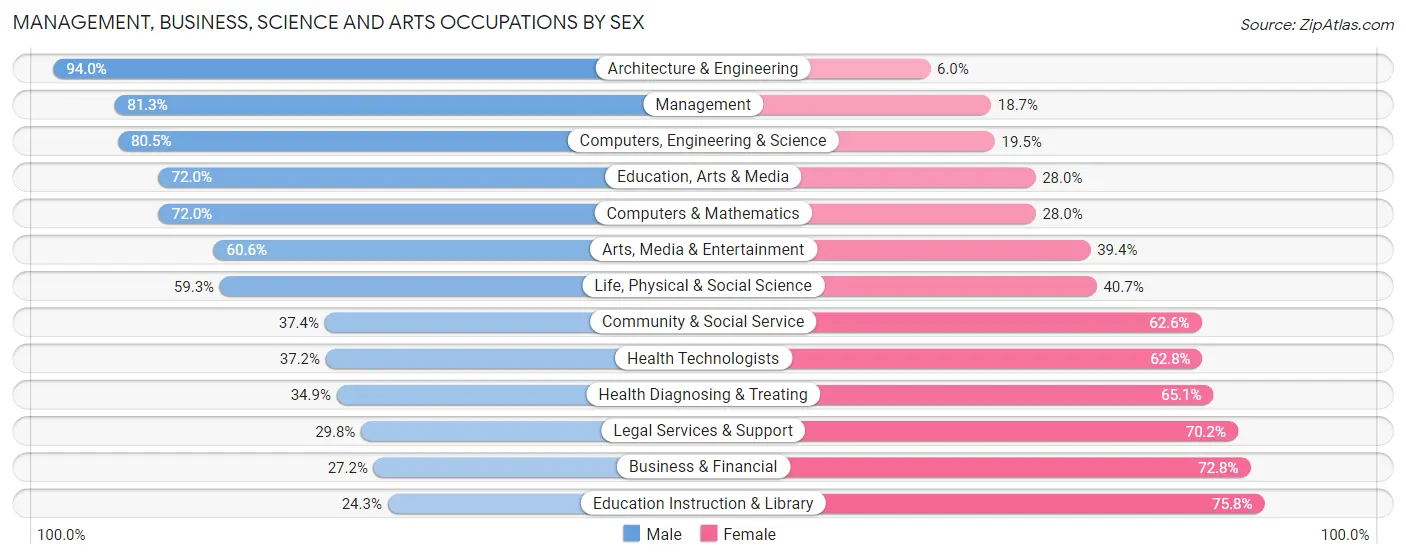
Management, Business, Science and Arts Occupations by Sex
Within the Management, Business, Science and Arts occupations in Oak Hills Place, the most male-oriented occupations are Architecture & Engineering (94.0%), Management (81.3%), and Computers, Engineering & Science (80.5%), while the most female-oriented occupations are Education Instruction & Library (75.7%), Business & Financial (72.8%), and Legal Services & Support (70.2%).
| Occupation | Male | Female |
| Management | 530 (81.3%) | 122 (18.7%) |
| Business & Financial | 72 (27.2%) | 193 (72.8%) |
| Computers, Engineering & Science | 384 (80.5%) | 93 (19.5%) |
| Computers & Mathematics | 149 (72.0%) | 58 (28.0%) |
| Architecture & Engineering | 203 (94.0%) | 13 (6.0%) |
| Life, Physical & Social Science | 32 (59.3%) | 22 (40.7%) |
| Community & Social Service | 296 (37.4%) | 496 (62.6%) |
| Education, Arts & Media | 103 (72.0%) | 40 (28.0%) |
| Legal Services & Support | 53 (29.8%) | 125 (70.2%) |
| Education Instruction & Library | 97 (24.2%) | 303 (75.7%) |
| Arts, Media & Entertainment | 43 (60.6%) | 28 (39.4%) |
| Health Diagnosing & Treating | 97 (34.9%) | 181 (65.1%) |
| Health Technologists | 97 (37.2%) | 164 (62.8%) |
| Total (Category) | 1,379 (56.0%) | 1,085 (44.0%) |
| Total (Overall) | 2,268 (58.5%) | 1,612 (41.5%) |
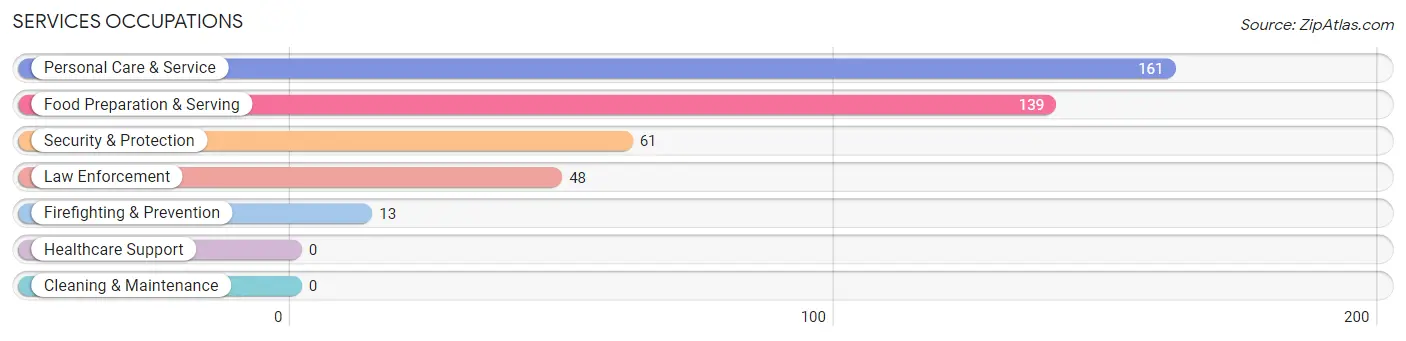
Services Occupations
The most common Services occupations in Oak Hills Place are Personal Care & Service (161 | 4.2%), Food Preparation & Serving (139 | 3.6%), Security & Protection (61 | 1.6%), Law Enforcement (48 | 1.2%), and Firefighting & Prevention (13 | 0.3%).
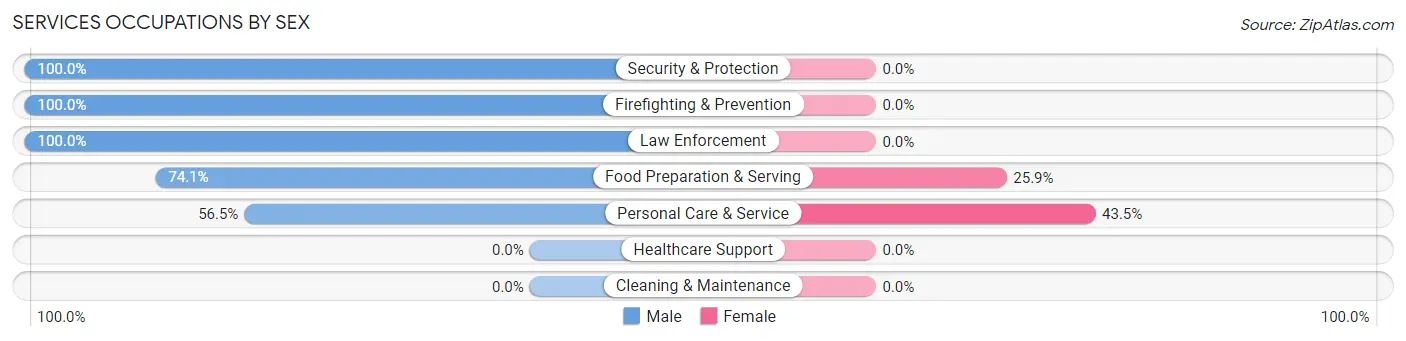
Services Occupations by Sex
Within the Services occupations in Oak Hills Place, the most male-oriented occupations are Security & Protection (100.0%), Firefighting & Prevention (100.0%), and Law Enforcement (100.0%), while the most female-oriented occupations are Personal Care & Service (43.5%), and Food Preparation & Serving (25.9%).
| Occupation | Male | Female |
| Healthcare Support | 0 (0.0%) | 0 (0.0%) |
| Security & Protection | 61 (100.0%) | 0 (0.0%) |
| Firefighting & Prevention | 13 (100.0%) | 0 (0.0%) |
| Law Enforcement | 48 (100.0%) | 0 (0.0%) |
| Food Preparation & Serving | 103 (74.1%) | 36 (25.9%) |
| Cleaning & Maintenance | 0 (0.0%) | 0 (0.0%) |
| Personal Care & Service | 91 (56.5%) | 70 (43.5%) |
| Total (Category) | 255 (70.6%) | 106 (29.4%) |
| Total (Overall) | 2,268 (58.5%) | 1,612 (41.5%) |
Sales and Office Occupations
The most common Sales and Office occupations in Oak Hills Place are Sales & Related (352 | 9.1%), and Office & Administration (267 | 6.9%).
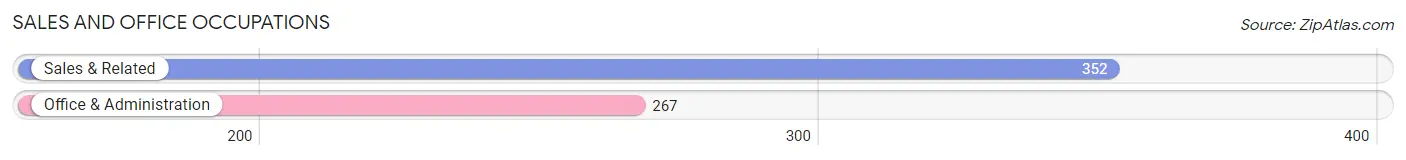
Sales and Office Occupations by Sex
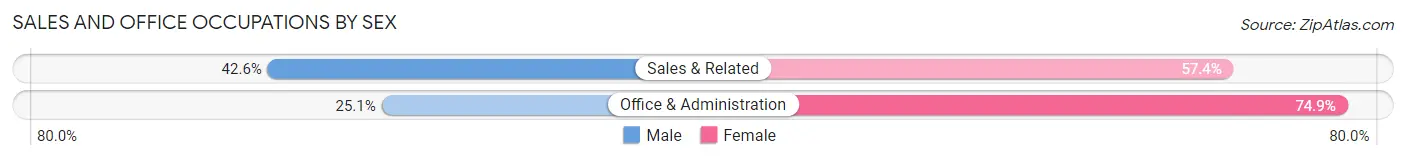
| Occupation | Male | Female |
| Sales & Related | 150 (42.6%) | 202 (57.4%) |
| Office & Administration | 67 (25.1%) | 200 (74.9%) |
| Total (Category) | 217 (35.1%) | 402 (64.9%) |
| Total (Overall) | 2,268 (58.5%) | 1,612 (41.5%) |
Natural Resources, Construction and Maintenance Occupations
The most common Natural Resources, Construction and Maintenance occupations in Oak Hills Place are Construction & Extraction (283 | 7.3%), and Installation, Maintenance & Repair (30 | 0.8%).
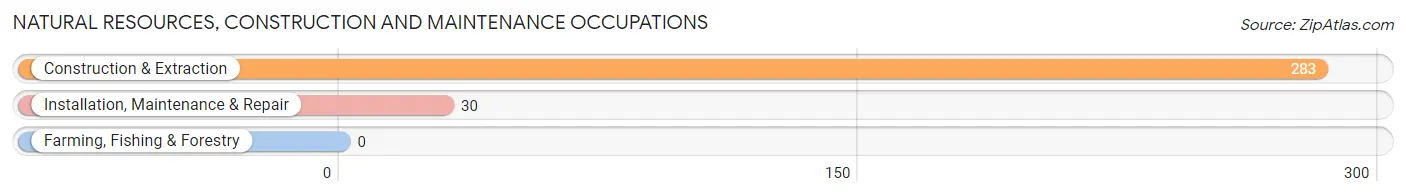
Natural Resources, Construction and Maintenance Occupations by Sex
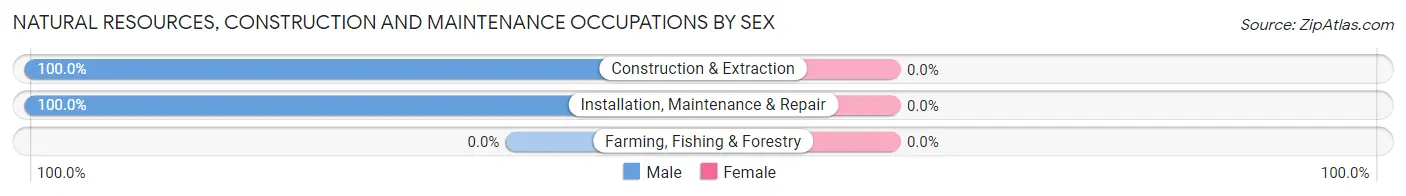
| Occupation | Male | Female |
| Farming, Fishing & Forestry | 0 (0.0%) | 0 (0.0%) |
| Construction & Extraction | 283 (100.0%) | 0 (0.0%) |
| Installation, Maintenance & Repair | 30 (100.0%) | 0 (0.0%) |
| Total (Category) | 313 (100.0%) | 0 (0.0%) |
| Total (Overall) | 2,268 (58.5%) | 1,612 (41.5%) |
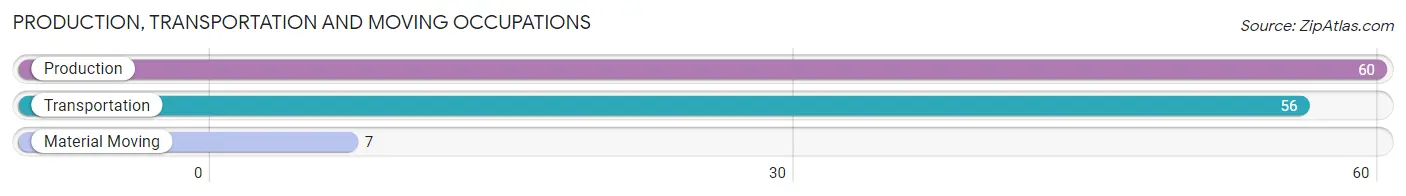
Production, Transportation and Moving Occupations
The most common Production, Transportation and Moving occupations in Oak Hills Place are Production (60 | 1.5%), Transportation (56 | 1.4%), and Material Moving (7 | 0.2%).
Production, Transportation and Moving Occupations by Sex
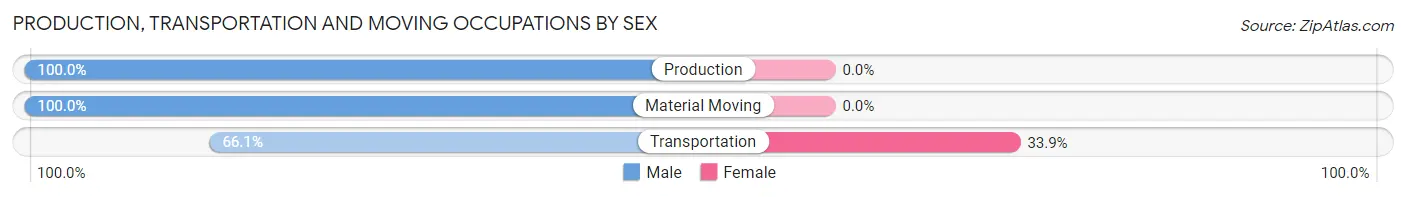
| Occupation | Male | Female |
| Production | 60 (100.0%) | 0 (0.0%) |
| Transportation | 37 (66.1%) | 19 (33.9%) |
| Material Moving | 7 (100.0%) | 0 (0.0%) |
| Total (Category) | 104 (84.6%) | 19 (15.4%) |
| Total (Overall) | 2,268 (58.5%) | 1,612 (41.5%) |
Employment Industries by Sex in Oak Hills Place
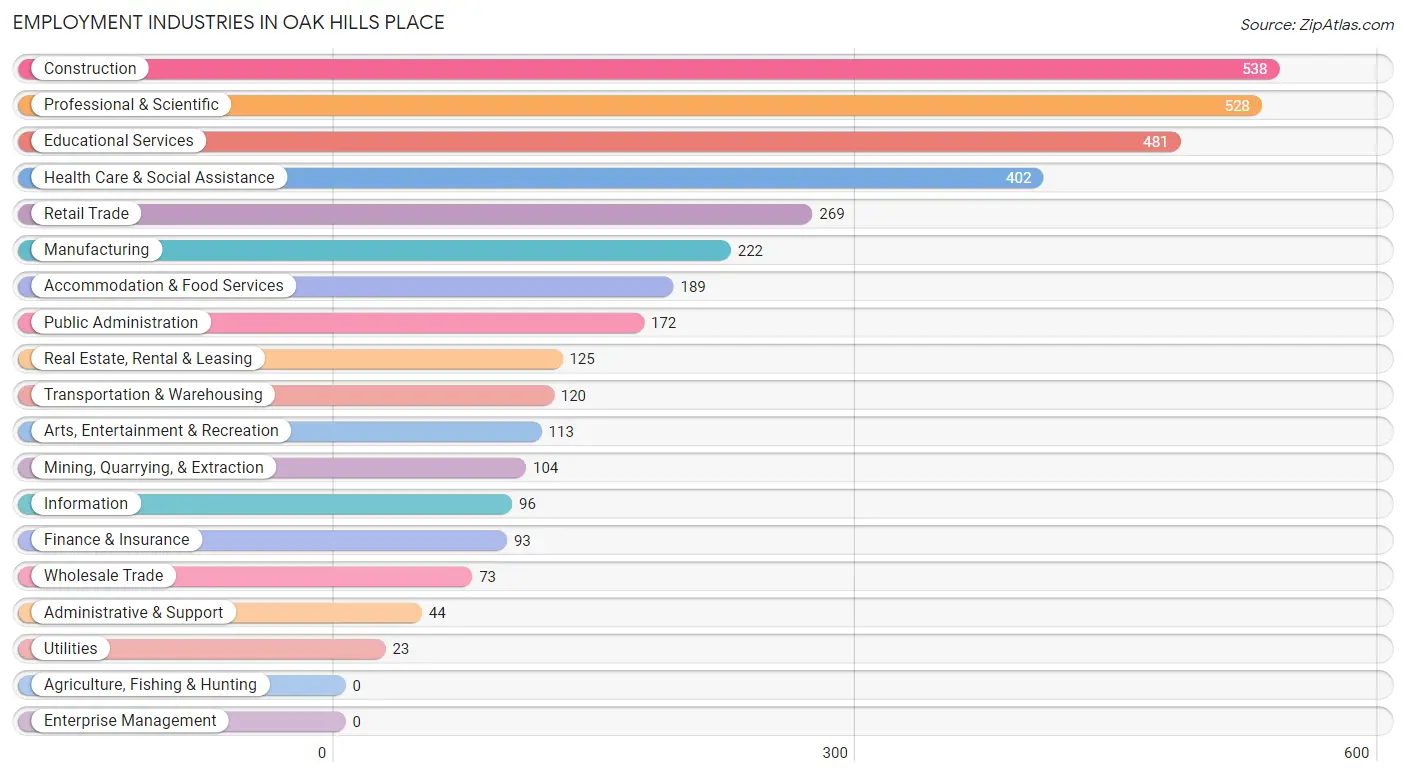
Employment Industries in Oak Hills Place
The major employment industries in Oak Hills Place include Construction (538 | 13.9%), Professional & Scientific (528 | 13.6%), Educational Services (481 | 12.4%), Health Care & Social Assistance (402 | 10.4%), and Retail Trade (269 | 6.9%).
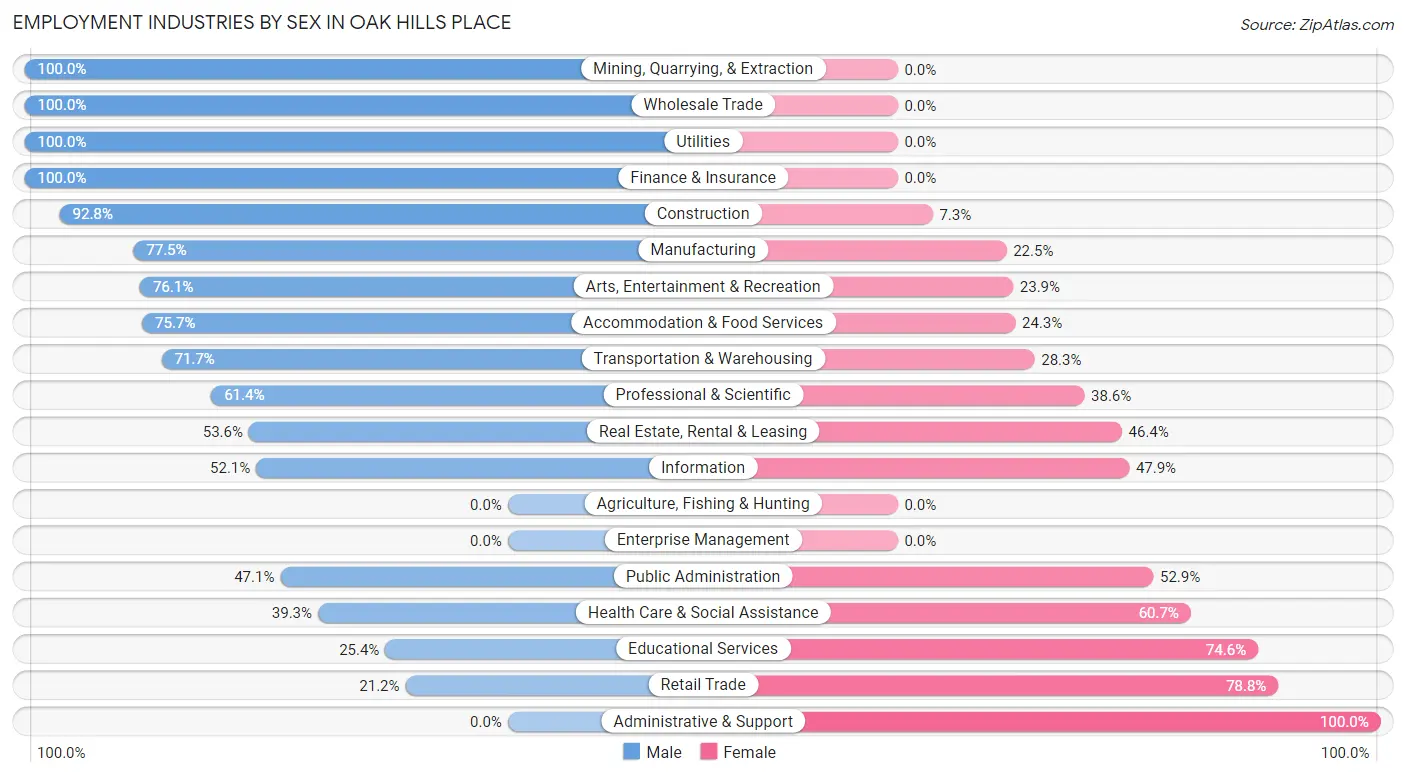
Employment Industries by Sex in Oak Hills Place
The Oak Hills Place industries that see more men than women are Mining, Quarrying, & Extraction (100.0%), Wholesale Trade (100.0%), and Utilities (100.0%), whereas the industries that tend to have a higher number of women are Administrative & Support (100.0%), Retail Trade (78.8%), and Educational Services (74.6%).
| Industry | Male | Female |
| Agriculture, Fishing & Hunting | 0 (0.0%) | 0 (0.0%) |
| Mining, Quarrying, & Extraction | 104 (100.0%) | 0 (0.0%) |
| Construction | 499 (92.7%) | 39 (7.2%) |
| Manufacturing | 172 (77.5%) | 50 (22.5%) |
| Wholesale Trade | 73 (100.0%) | 0 (0.0%) |
| Retail Trade | 57 (21.2%) | 212 (78.8%) |
| Transportation & Warehousing | 86 (71.7%) | 34 (28.3%) |
| Utilities | 23 (100.0%) | 0 (0.0%) |
| Information | 50 (52.1%) | 46 (47.9%) |
| Finance & Insurance | 93 (100.0%) | 0 (0.0%) |
| Real Estate, Rental & Leasing | 67 (53.6%) | 58 (46.4%) |
| Professional & Scientific | 324 (61.4%) | 204 (38.6%) |
| Enterprise Management | 0 (0.0%) | 0 (0.0%) |
| Administrative & Support | 0 (0.0%) | 44 (100.0%) |
| Educational Services | 122 (25.4%) | 359 (74.6%) |
| Health Care & Social Assistance | 158 (39.3%) | 244 (60.7%) |
| Arts, Entertainment & Recreation | 86 (76.1%) | 27 (23.9%) |
| Accommodation & Food Services | 143 (75.7%) | 46 (24.3%) |
| Public Administration | 81 (47.1%) | 91 (52.9%) |
| Total | 2,268 (58.5%) | 1,612 (41.5%) |
Education in Oak Hills Place
School Enrollment in Oak Hills Place
The most common levels of schooling among the 2,071 students in Oak Hills Place are middle school (501 | 24.2%), college / undergraduate (460 | 22.2%), and elementary school (364 | 17.6%).
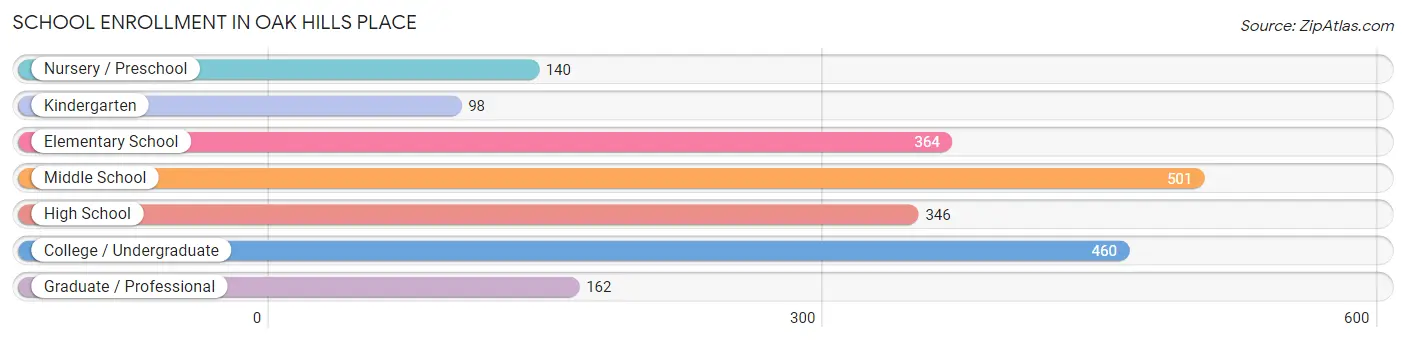
| School Level | # Students | % Students |
| Nursery / Preschool | 140 | 6.8% |
| Kindergarten | 98 | 4.7% |
| Elementary School | 364 | 17.6% |
| Middle School | 501 | 24.2% |
| High School | 346 | 16.7% |
| College / Undergraduate | 460 | 22.2% |
| Graduate / Professional | 162 | 7.8% |
| Total | 2,071 | 100.0% |
School Enrollment by Age by Funding Source in Oak Hills Place
Out of a total of 2,071 students who are enrolled in schools in Oak Hills Place, 1,365 (65.9%) attend a private institution, while the remaining 706 (34.1%) are enrolled in public schools. The age group of 3 to 4 year olds has the highest likelihood of being enrolled in private schools, with 99 (100.0% in the age bracket) enrolled. Conversely, the age group of 25 to 34 year olds has the lowest likelihood of being enrolled in a private school, with 210 (100.0% in the age bracket) attending a public institution.
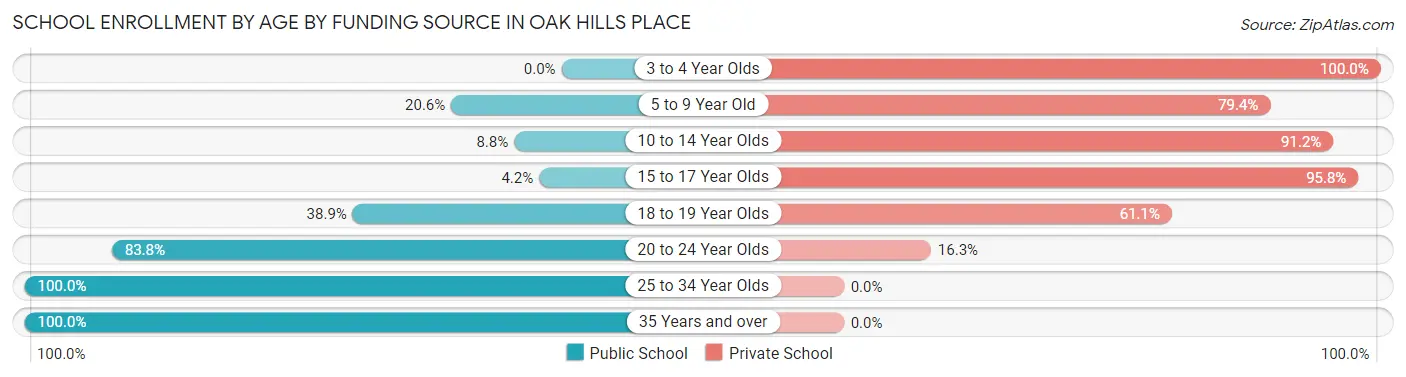
| Age Bracket | Public School | Private School |
| 3 to 4 Year Olds | 0 (0.0%) | 99 (100.0%) |
| 5 to 9 Year Old | 96 (20.6%) | 371 (79.4%) |
| 10 to 14 Year Olds | 53 (8.8%) | 547 (91.2%) |
| 15 to 17 Year Olds | 11 (4.2%) | 253 (95.8%) |
| 18 to 19 Year Olds | 35 (38.9%) | 55 (61.1%) |
| 20 to 24 Year Olds | 201 (83.8%) | 39 (16.3%) |
| 25 to 34 Year Olds | 210 (100.0%) | 0 (0.0%) |
| 35 Years and over | 101 (100.0%) | 0 (0.0%) |
| Total | 706 (34.1%) | 1,365 (65.9%) |
Educational Attainment by Field of Study in Oak Hills Place
Business (1,354 | 30.1%), education (554 | 12.3%), science & technology (504 | 11.2%), engineering (441 | 9.8%), and communications (247 | 5.5%) are the most common fields of study among 4,501 individuals in Oak Hills Place who have obtained a bachelor's degree or higher.
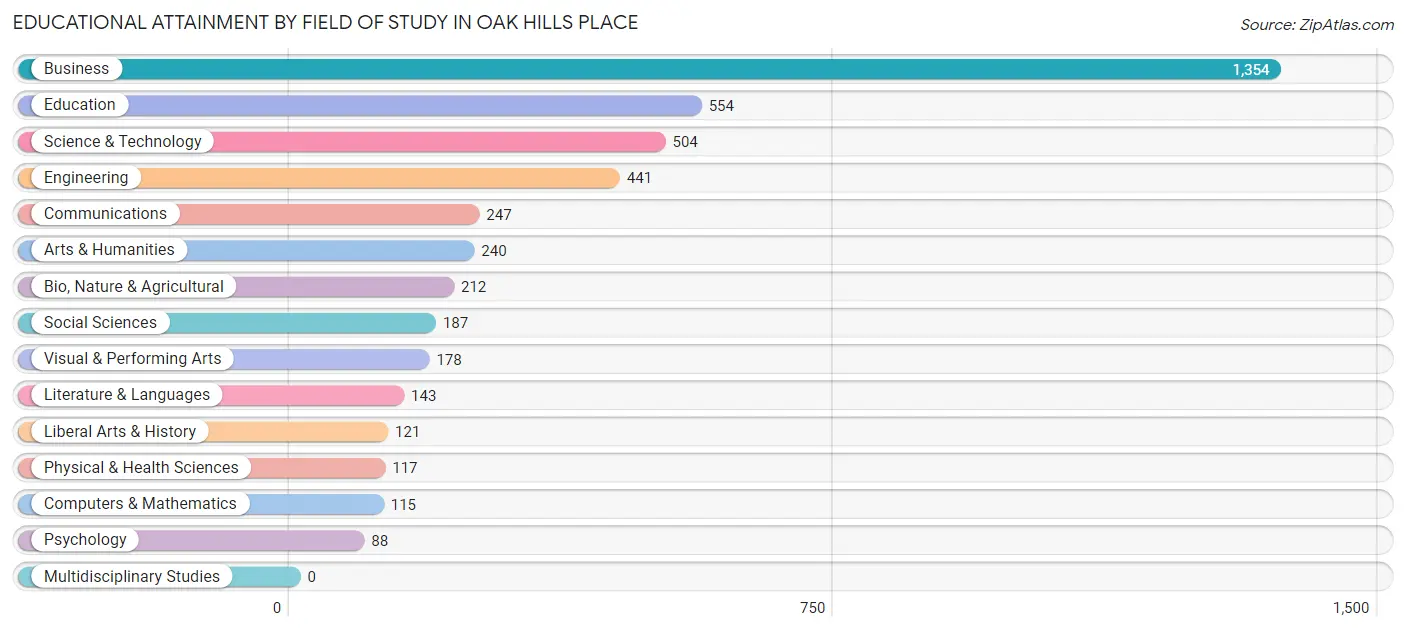
| Field of Study | # Graduates | % Graduates |
| Computers & Mathematics | 115 | 2.5% |
| Bio, Nature & Agricultural | 212 | 4.7% |
| Physical & Health Sciences | 117 | 2.6% |
| Psychology | 88 | 2.0% |
| Social Sciences | 187 | 4.2% |
| Engineering | 441 | 9.8% |
| Multidisciplinary Studies | 0 | 0.0% |
| Science & Technology | 504 | 11.2% |
| Business | 1,354 | 30.1% |
| Education | 554 | 12.3% |
| Literature & Languages | 143 | 3.2% |
| Liberal Arts & History | 121 | 2.7% |
| Visual & Performing Arts | 178 | 4.0% |
| Communications | 247 | 5.5% |
| Arts & Humanities | 240 | 5.3% |
| Total | 4,501 | 100.0% |
Transportation & Commute in Oak Hills Place
Vehicle Availability by Sex in Oak Hills Place
The most prevalent vehicle ownership categories in Oak Hills Place are males with 2 vehicles (1,297, accounting for 58.7%) and females with 2 vehicles (1,083, making up 80.9%).
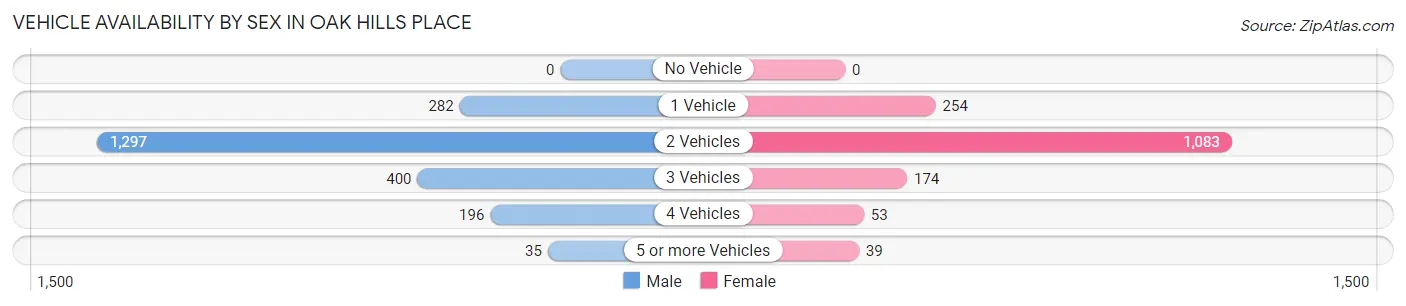
| Vehicles Available | Male | Female |
| No Vehicle | 0 (0.0%) | 0 (0.0%) |
| 1 Vehicle | 282 (12.8%) | 254 (15.9%) |
| 2 Vehicles | 1,297 (58.7%) | 1,083 (67.6%) |
| 3 Vehicles | 400 (18.1%) | 174 (10.8%) |
| 4 Vehicles | 196 (8.9%) | 53 (3.3%) |
| 5 or more Vehicles | 35 (1.6%) | 39 (2.4%) |
| Total | 2,210 (100.0%) | 1,603 (100.0%) |
Commute Time in Oak Hills Place
The most frequently occuring commute durations in Oak Hills Place are 15 to 19 minutes (967 commuters, 26.7%), 30 to 34 minutes (655 commuters, 18.1%), and 20 to 24 minutes (590 commuters, 16.3%).
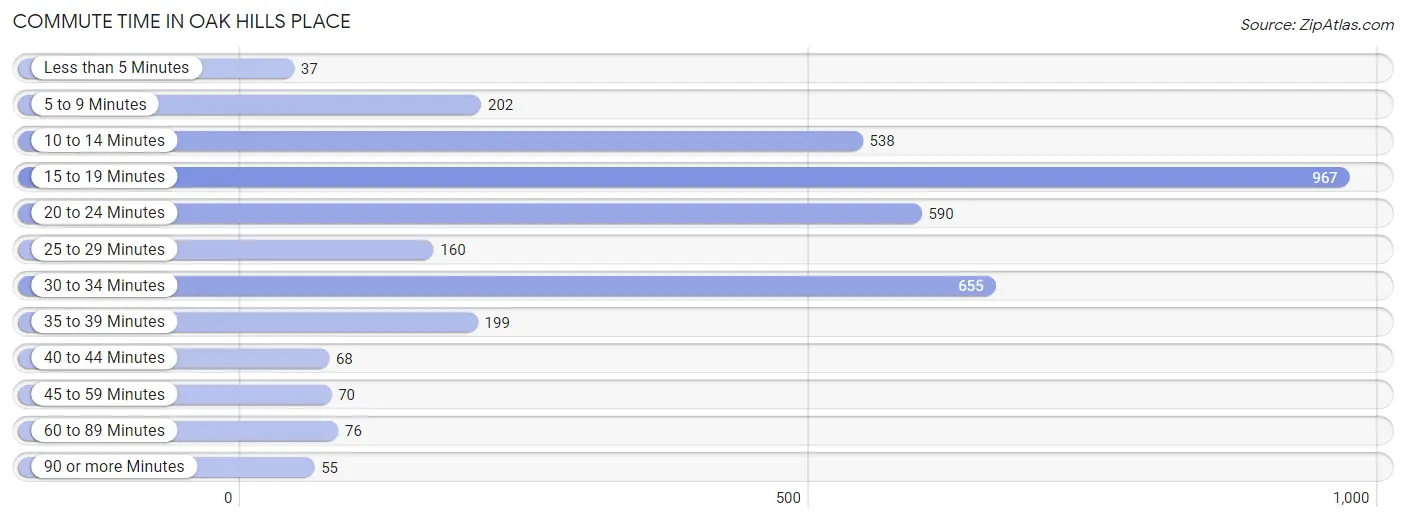
| Commute Time | # Commuters | % Commuters |
| Less than 5 Minutes | 37 | 1.0% |
| 5 to 9 Minutes | 202 | 5.6% |
| 10 to 14 Minutes | 538 | 14.9% |
| 15 to 19 Minutes | 967 | 26.7% |
| 20 to 24 Minutes | 590 | 16.3% |
| 25 to 29 Minutes | 160 | 4.4% |
| 30 to 34 Minutes | 655 | 18.1% |
| 35 to 39 Minutes | 199 | 5.5% |
| 40 to 44 Minutes | 68 | 1.9% |
| 45 to 59 Minutes | 70 | 1.9% |
| 60 to 89 Minutes | 76 | 2.1% |
| 90 or more Minutes | 55 | 1.5% |
Commute Time by Sex in Oak Hills Place
The most common commute times in Oak Hills Place are 15 to 19 minutes (667 commuters, 30.5%) for males and 20 to 24 minutes (363 commuters, 25.4%) for females.
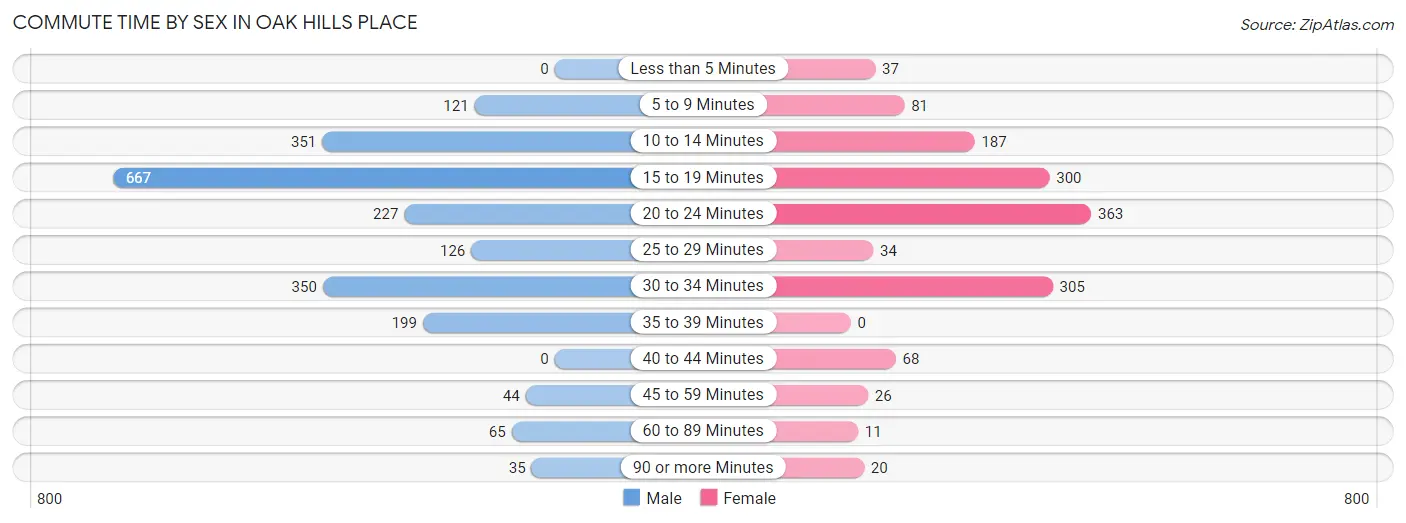
| Commute Time | Male | Female |
| Less than 5 Minutes | 0 (0.0%) | 37 (2.6%) |
| 5 to 9 Minutes | 121 (5.5%) | 81 (5.7%) |
| 10 to 14 Minutes | 351 (16.1%) | 187 (13.1%) |
| 15 to 19 Minutes | 667 (30.5%) | 300 (20.9%) |
| 20 to 24 Minutes | 227 (10.4%) | 363 (25.4%) |
| 25 to 29 Minutes | 126 (5.8%) | 34 (2.4%) |
| 30 to 34 Minutes | 350 (16.0%) | 305 (21.3%) |
| 35 to 39 Minutes | 199 (9.1%) | 0 (0.0%) |
| 40 to 44 Minutes | 0 (0.0%) | 68 (4.8%) |
| 45 to 59 Minutes | 44 (2.0%) | 26 (1.8%) |
| 60 to 89 Minutes | 65 (3.0%) | 11 (0.8%) |
| 90 or more Minutes | 35 (1.6%) | 20 (1.4%) |
Time of Departure to Work by Sex in Oak Hills Place
The most frequent times of departure to work in Oak Hills Place are 7:30 AM to 7:59 AM (768, 35.1%) for males and 6:30 AM to 6:59 AM (372, 26.0%) for females.
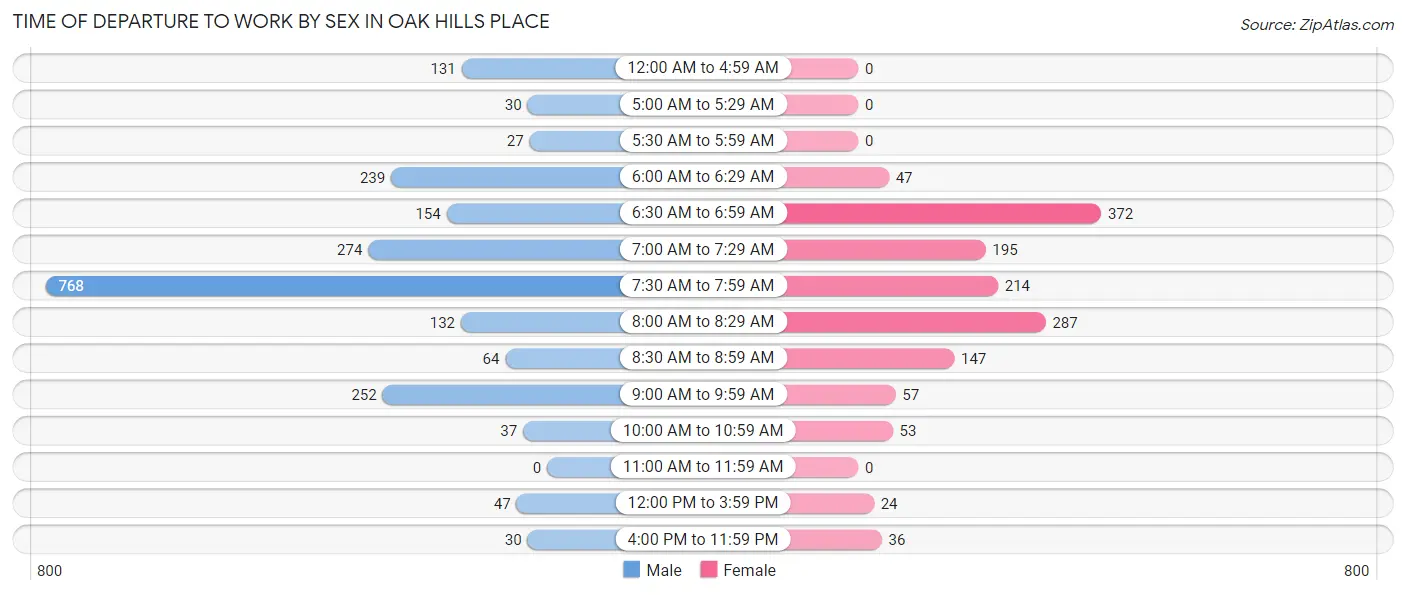
| Time of Departure | Male | Female |
| 12:00 AM to 4:59 AM | 131 (6.0%) | 0 (0.0%) |
| 5:00 AM to 5:29 AM | 30 (1.4%) | 0 (0.0%) |
| 5:30 AM to 5:59 AM | 27 (1.2%) | 0 (0.0%) |
| 6:00 AM to 6:29 AM | 239 (10.9%) | 47 (3.3%) |
| 6:30 AM to 6:59 AM | 154 (7.0%) | 372 (26.0%) |
| 7:00 AM to 7:29 AM | 274 (12.5%) | 195 (13.6%) |
| 7:30 AM to 7:59 AM | 768 (35.1%) | 214 (14.9%) |
| 8:00 AM to 8:29 AM | 132 (6.0%) | 287 (20.0%) |
| 8:30 AM to 8:59 AM | 64 (2.9%) | 147 (10.3%) |
| 9:00 AM to 9:59 AM | 252 (11.5%) | 57 (4.0%) |
| 10:00 AM to 10:59 AM | 37 (1.7%) | 53 (3.7%) |
| 11:00 AM to 11:59 AM | 0 (0.0%) | 0 (0.0%) |
| 12:00 PM to 3:59 PM | 47 (2.1%) | 24 (1.7%) |
| 4:00 PM to 11:59 PM | 30 (1.4%) | 36 (2.5%) |
| Total | 2,185 (100.0%) | 1,432 (100.0%) |
Housing Occupancy in Oak Hills Place
Occupancy by Ownership in Oak Hills Place
Of the total 3,784 dwellings in Oak Hills Place, owner-occupied units account for 2,650 (70.0%), while renter-occupied units make up 1,134 (30.0%).
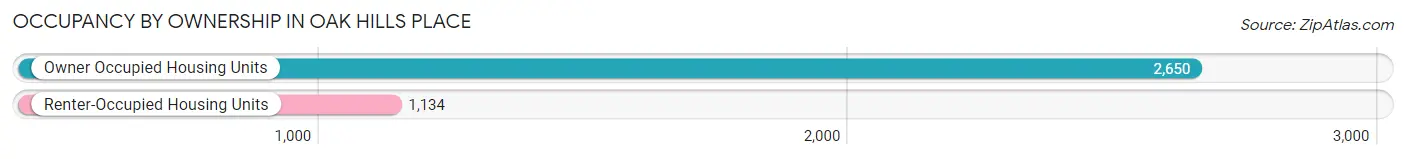
| Occupancy | # Housing Units | % Housing Units |
| Owner Occupied Housing Units | 2,650 | 70.0% |
| Renter-Occupied Housing Units | 1,134 | 30.0% |
| Total Occupied Housing Units | 3,784 | 100.0% |
Occupancy by Household Size in Oak Hills Place
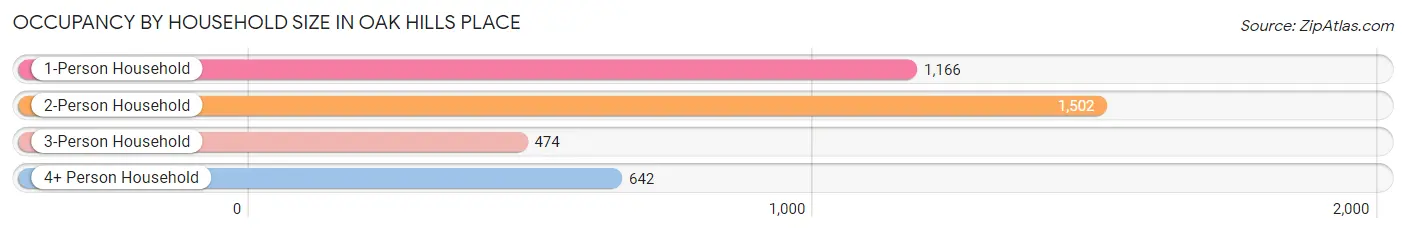
| Household Size | # Housing Units | % Housing Units |
| 1-Person Household | 1,166 | 30.8% |
| 2-Person Household | 1,502 | 39.7% |
| 3-Person Household | 474 | 12.5% |
| 4+ Person Household | 642 | 17.0% |
| Total Housing Units | 3,784 | 100.0% |
Occupancy by Ownership by Household Size in Oak Hills Place
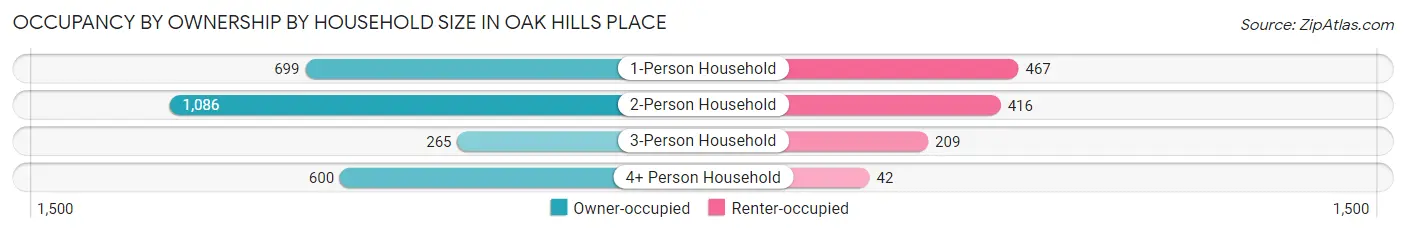
| Household Size | Owner-occupied | Renter-occupied |
| 1-Person Household | 699 (60.0%) | 467 (40.1%) |
| 2-Person Household | 1,086 (72.3%) | 416 (27.7%) |
| 3-Person Household | 265 (55.9%) | 209 (44.1%) |
| 4+ Person Household | 600 (93.5%) | 42 (6.5%) |
| Total Housing Units | 2,650 (70.0%) | 1,134 (30.0%) |
Occupancy by Educational Attainment in Oak Hills Place
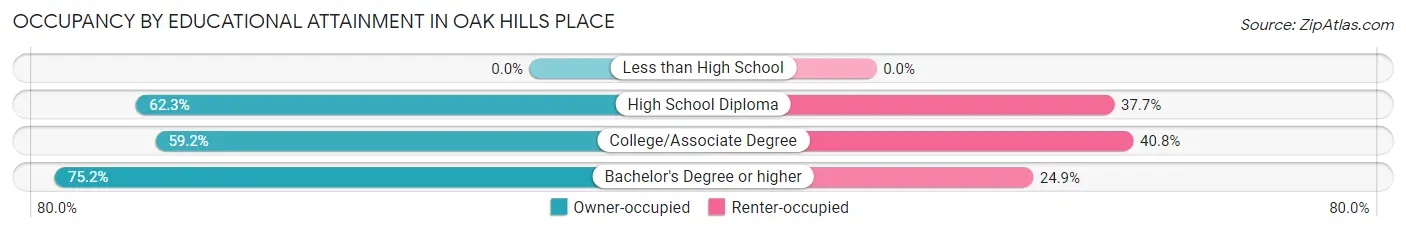
| Household Size | Owner-occupied | Renter-occupied |
| Less than High School | 0 (0.0%) | 0 (0.0%) |
| High School Diploma | 170 (62.3%) | 103 (37.7%) |
| College/Associate Degree | 590 (59.2%) | 406 (40.8%) |
| Bachelor's Degree or higher | 1,890 (75.1%) | 625 (24.8%) |
Occupancy by Age of Householder in Oak Hills Place
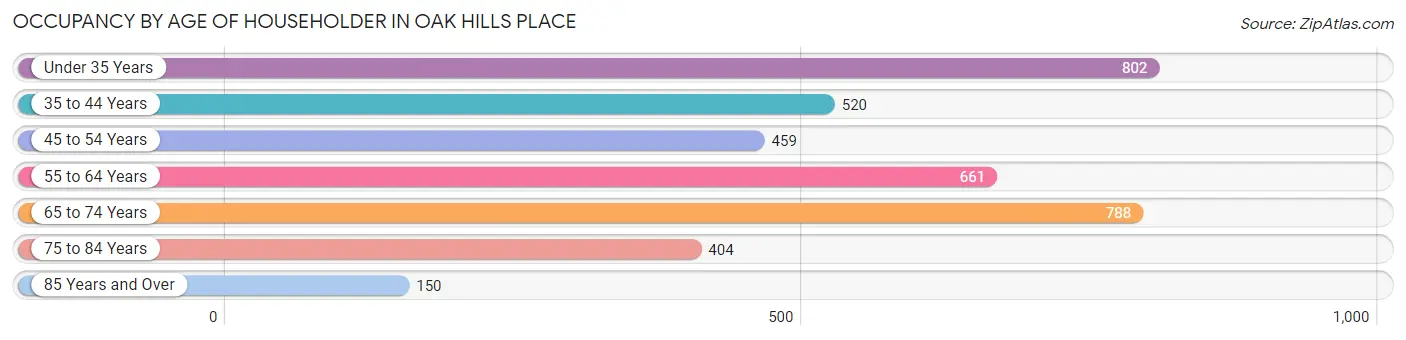
| Age Bracket | # Households | % Households |
| Under 35 Years | 802 | 21.2% |
| 35 to 44 Years | 520 | 13.7% |
| 45 to 54 Years | 459 | 12.1% |
| 55 to 64 Years | 661 | 17.5% |
| 65 to 74 Years | 788 | 20.8% |
| 75 to 84 Years | 404 | 10.7% |
| 85 Years and Over | 150 | 4.0% |
| Total | 3,784 | 100.0% |
Housing Finances in Oak Hills Place
Median Income by Occupancy in Oak Hills Place
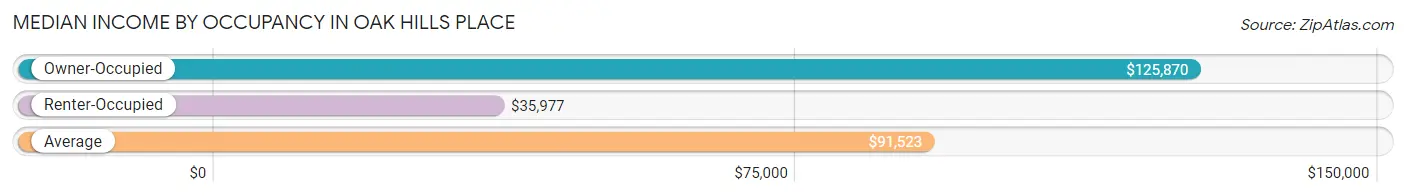
| Occupancy Type | # Households | Median Income |
| Owner-Occupied | 2,650 (70.0%) | $125,870 |
| Renter-Occupied | 1,134 (30.0%) | $35,977 |
| Average | 3,784 (100.0%) | $91,523 |
Occupancy by Householder Income Bracket in Oak Hills Place
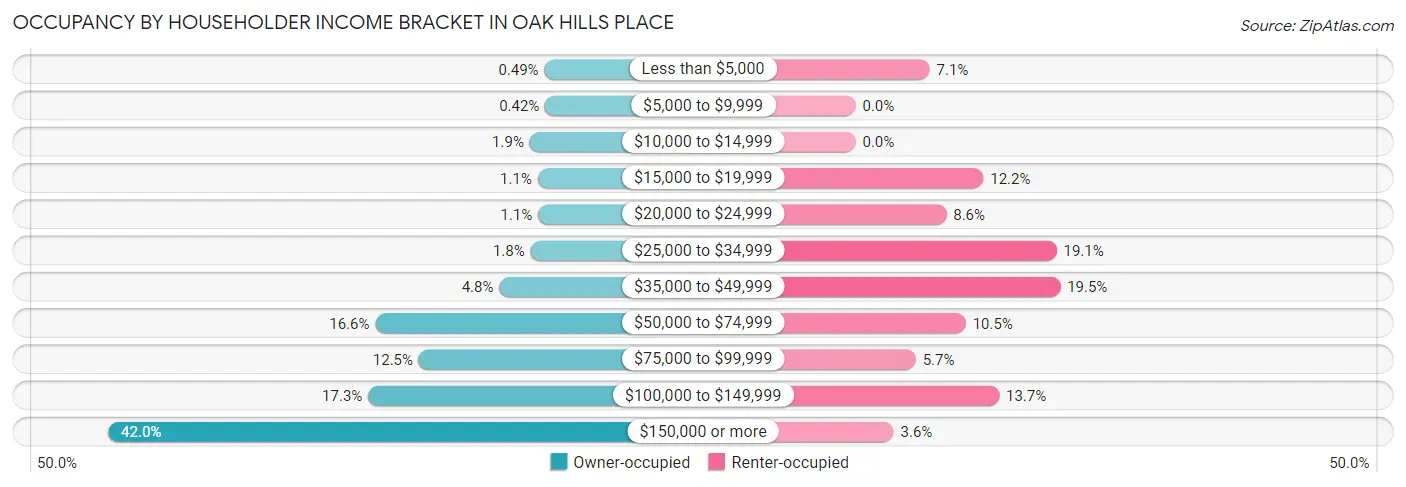
| Income Bracket | Owner-occupied | Renter-occupied |
| Less than $5,000 | 13 (0.5%) | 80 (7.0%) |
| $5,000 to $9,999 | 11 (0.4%) | 0 (0.0%) |
| $10,000 to $14,999 | 50 (1.9%) | 0 (0.0%) |
| $15,000 to $19,999 | 30 (1.1%) | 138 (12.2%) |
| $20,000 to $24,999 | 29 (1.1%) | 98 (8.6%) |
| $25,000 to $34,999 | 48 (1.8%) | 217 (19.1%) |
| $35,000 to $49,999 | 127 (4.8%) | 221 (19.5%) |
| $50,000 to $74,999 | 440 (16.6%) | 119 (10.5%) |
| $75,000 to $99,999 | 330 (12.4%) | 65 (5.7%) |
| $100,000 to $149,999 | 458 (17.3%) | 155 (13.7%) |
| $150,000 or more | 1,114 (42.0%) | 41 (3.6%) |
| Total | 2,650 (100.0%) | 1,134 (100.0%) |
Monthly Housing Cost Tiers in Oak Hills Place
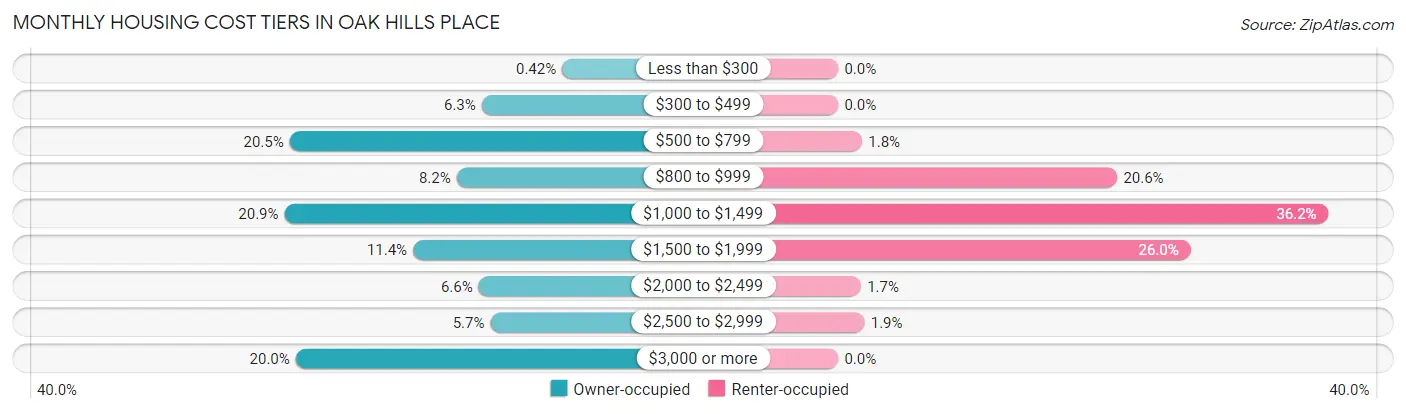
| Monthly Cost | Owner-occupied | Renter-occupied |
| Less than $300 | 11 (0.4%) | 0 (0.0%) |
| $300 to $499 | 168 (6.3%) | 0 (0.0%) |
| $500 to $799 | 543 (20.5%) | 20 (1.8%) |
| $800 to $999 | 217 (8.2%) | 233 (20.5%) |
| $1,000 to $1,499 | 553 (20.9%) | 410 (36.2%) |
| $1,500 to $1,999 | 302 (11.4%) | 295 (26.0%) |
| $2,000 to $2,499 | 174 (6.6%) | 19 (1.7%) |
| $2,500 to $2,999 | 151 (5.7%) | 22 (1.9%) |
| $3,000 or more | 531 (20.0%) | 0 (0.0%) |
| Total | 2,650 (100.0%) | 1,134 (100.0%) |
Physical Housing Characteristics in Oak Hills Place
Housing Structures in Oak Hills Place
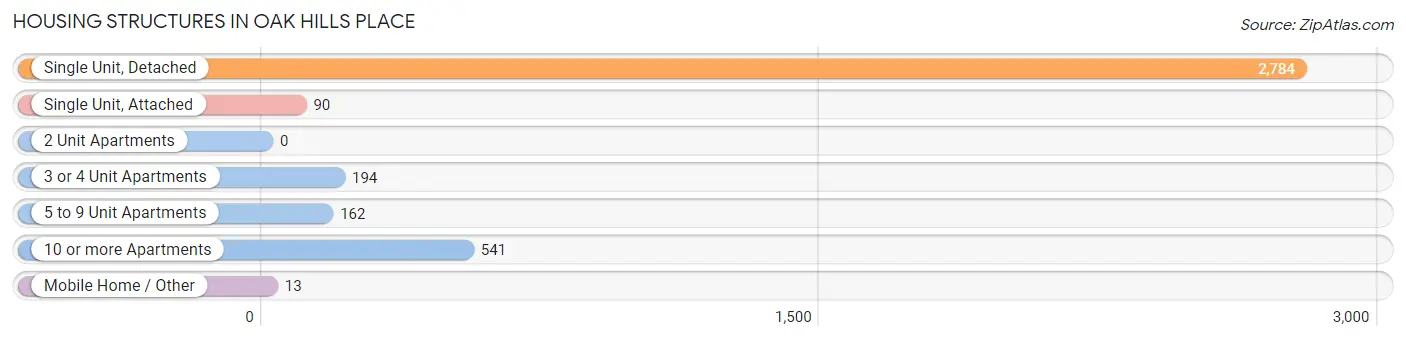
| Structure Type | # Housing Units | % Housing Units |
| Single Unit, Detached | 2,784 | 73.6% |
| Single Unit, Attached | 90 | 2.4% |
| 2 Unit Apartments | 0 | 0.0% |
| 3 or 4 Unit Apartments | 194 | 5.1% |
| 5 to 9 Unit Apartments | 162 | 4.3% |
| 10 or more Apartments | 541 | 14.3% |
| Mobile Home / Other | 13 | 0.3% |
| Total | 3,784 | 100.0% |
Housing Structures by Occupancy in Oak Hills Place
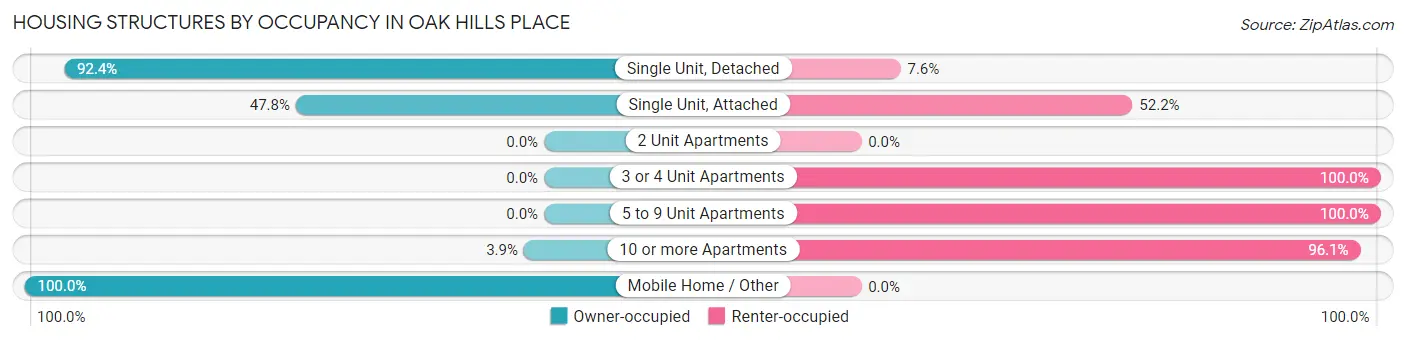
| Structure Type | Owner-occupied | Renter-occupied |
| Single Unit, Detached | 2,573 (92.4%) | 211 (7.6%) |
| Single Unit, Attached | 43 (47.8%) | 47 (52.2%) |
| 2 Unit Apartments | 0 (0.0%) | 0 (0.0%) |
| 3 or 4 Unit Apartments | 0 (0.0%) | 194 (100.0%) |
| 5 to 9 Unit Apartments | 0 (0.0%) | 162 (100.0%) |
| 10 or more Apartments | 21 (3.9%) | 520 (96.1%) |
| Mobile Home / Other | 13 (100.0%) | 0 (0.0%) |
| Total | 2,650 (70.0%) | 1,134 (30.0%) |
Housing Structures by Number of Rooms in Oak Hills Place
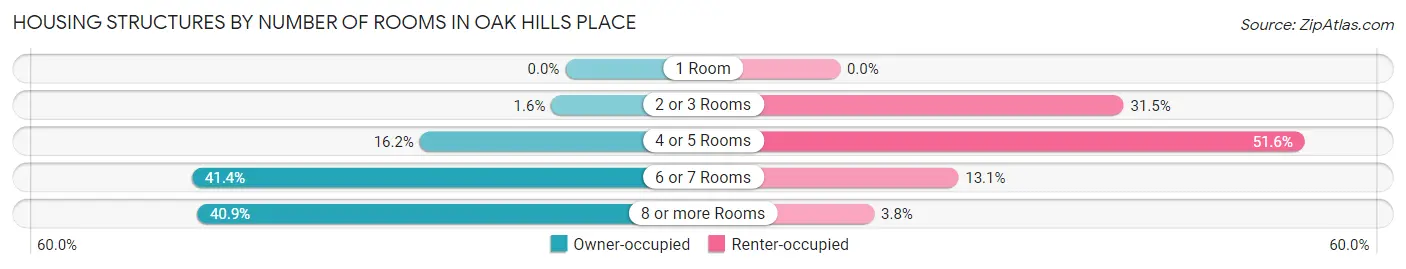
| Number of Rooms | Owner-occupied | Renter-occupied |
| 1 Room | 0 (0.0%) | 0 (0.0%) |
| 2 or 3 Rooms | 41 (1.5%) | 357 (31.5%) |
| 4 or 5 Rooms | 428 (16.2%) | 585 (51.6%) |
| 6 or 7 Rooms | 1,098 (41.4%) | 149 (13.1%) |
| 8 or more Rooms | 1,083 (40.9%) | 43 (3.8%) |
| Total | 2,650 (100.0%) | 1,134 (100.0%) |
Housing Structure by Heating Type in Oak Hills Place
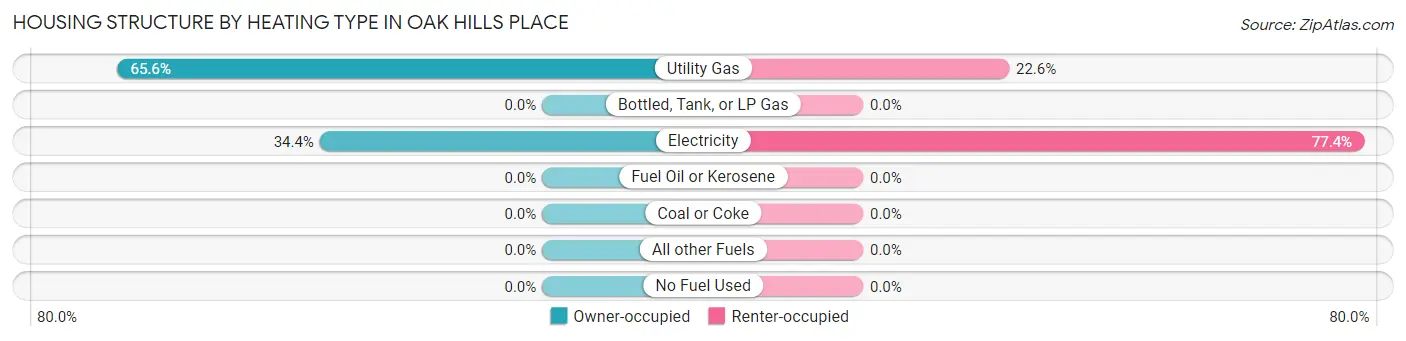
| Heating Type | Owner-occupied | Renter-occupied |
| Utility Gas | 1,739 (65.6%) | 256 (22.6%) |
| Bottled, Tank, or LP Gas | 0 (0.0%) | 0 (0.0%) |
| Electricity | 911 (34.4%) | 878 (77.4%) |
| Fuel Oil or Kerosene | 0 (0.0%) | 0 (0.0%) |
| Coal or Coke | 0 (0.0%) | 0 (0.0%) |
| All other Fuels | 0 (0.0%) | 0 (0.0%) |
| No Fuel Used | 0 (0.0%) | 0 (0.0%) |
| Total | 2,650 (100.0%) | 1,134 (100.0%) |
Household Vehicle Usage in Oak Hills Place
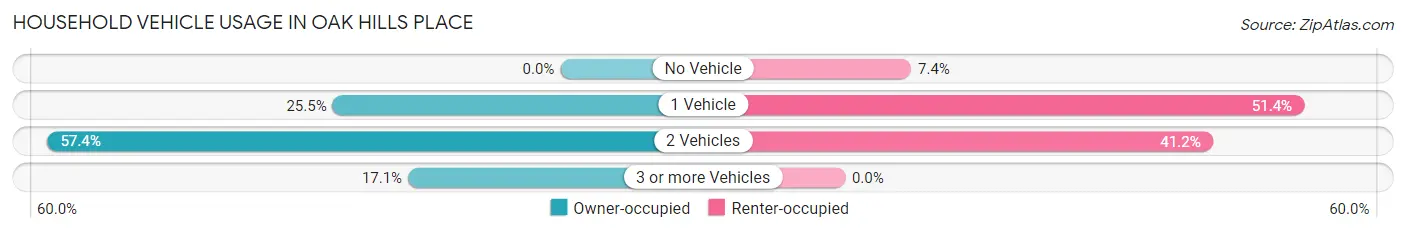
| Vehicles per Household | Owner-occupied | Renter-occupied |
| No Vehicle | 0 (0.0%) | 84 (7.4%) |
| 1 Vehicle | 676 (25.5%) | 583 (51.4%) |
| 2 Vehicles | 1,522 (57.4%) | 467 (41.2%) |
| 3 or more Vehicles | 452 (17.1%) | 0 (0.0%) |
| Total | 2,650 (100.0%) | 1,134 (100.0%) |
Real Estate & Mortgages in Oak Hills Place
Real Estate and Mortgage Overview in Oak Hills Place
| Characteristic | Without Mortgage | With Mortgage |
| Housing Units | 1,048 | 1,602 |
| Median Property Value | $420,100 | $390,000 |
| Median Household Income | $106,250 | $740 |
| Monthly Housing Costs | $726 | $531 |
| Real Estate Taxes | $3,157 | $15 |
Property Value by Mortgage Status in Oak Hills Place
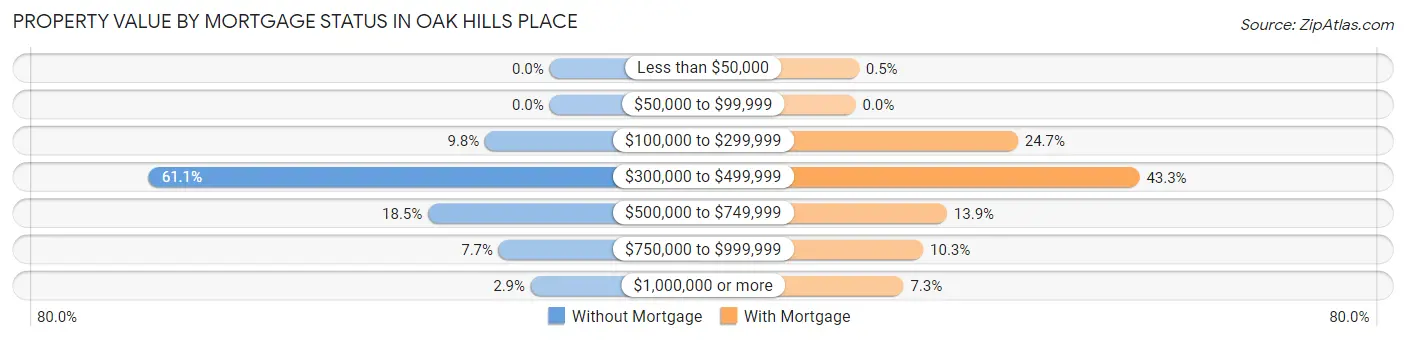
| Property Value | Without Mortgage | With Mortgage |
| Less than $50,000 | 0 (0.0%) | 8 (0.5%) |
| $50,000 to $99,999 | 0 (0.0%) | 0 (0.0%) |
| $100,000 to $299,999 | 103 (9.8%) | 396 (24.7%) |
| $300,000 to $499,999 | 640 (61.1%) | 693 (43.3%) |
| $500,000 to $749,999 | 194 (18.5%) | 223 (13.9%) |
| $750,000 to $999,999 | 81 (7.7%) | 165 (10.3%) |
| $1,000,000 or more | 30 (2.9%) | 117 (7.3%) |
| Total | 1,048 (100.0%) | 1,602 (100.0%) |
Household Income by Mortgage Status in Oak Hills Place
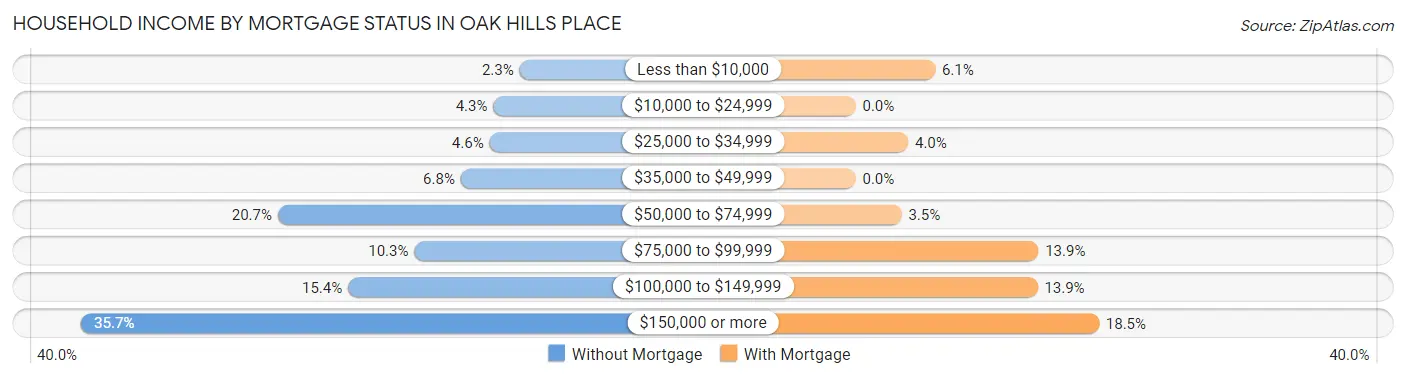
| Household Income | Without Mortgage | With Mortgage |
| Less than $10,000 | 24 (2.3%) | 97 (6.0%) |
| $10,000 to $24,999 | 45 (4.3%) | 0 (0.0%) |
| $25,000 to $34,999 | 48 (4.6%) | 64 (4.0%) |
| $35,000 to $49,999 | 71 (6.8%) | 0 (0.0%) |
| $50,000 to $74,999 | 217 (20.7%) | 56 (3.5%) |
| $75,000 to $99,999 | 108 (10.3%) | 223 (13.9%) |
| $100,000 to $149,999 | 161 (15.4%) | 222 (13.9%) |
| $150,000 or more | 374 (35.7%) | 297 (18.5%) |
| Total | 1,048 (100.0%) | 1,602 (100.0%) |
Property Value to Household Income Ratio in Oak Hills Place
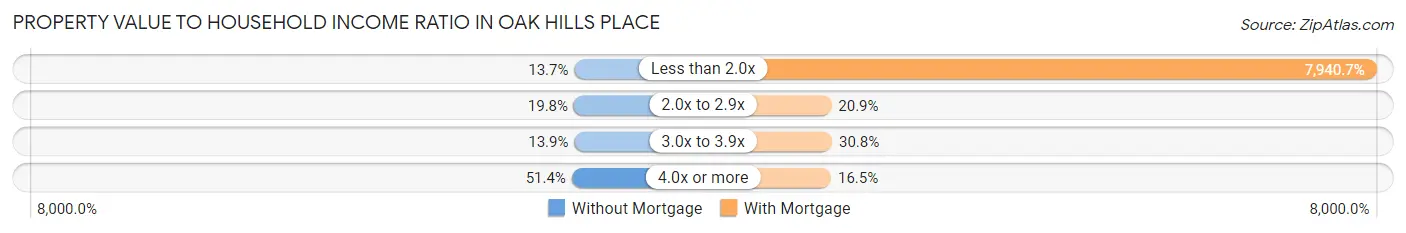
| Value-to-Income Ratio | Without Mortgage | With Mortgage |
| Less than 2.0x | 143 (13.7%) | 127,210 (7,940.7%) |
| 2.0x to 2.9x | 207 (19.8%) | 334 (20.8%) |
| 3.0x to 3.9x | 146 (13.9%) | 493 (30.8%) |
| 4.0x or more | 539 (51.4%) | 264 (16.5%) |
| Total | 1,048 (100.0%) | 1,602 (100.0%) |
Real Estate Taxes by Mortgage Status in Oak Hills Place
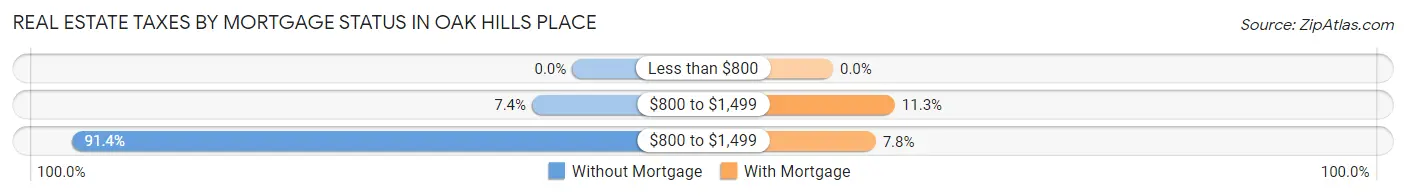
| Property Taxes | Without Mortgage | With Mortgage |
| Less than $800 | 0 (0.0%) | 0 (0.0%) |
| $800 to $1,499 | 77 (7.3%) | 181 (11.3%) |
| $800 to $1,499 | 958 (91.4%) | 125 (7.8%) |
| Total | 1,048 (100.0%) | 1,602 (100.0%) |
Health & Disability in Oak Hills Place
Health Insurance Coverage by Age in Oak Hills Place
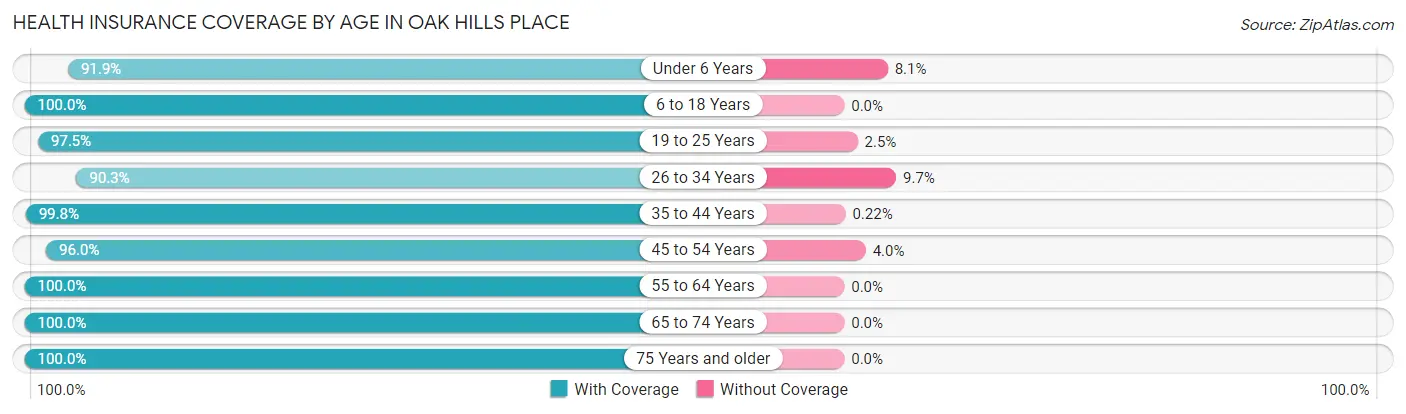
| Age Bracket | With Coverage | Without Coverage |
| Under 6 Years | 625 (91.9%) | 55 (8.1%) |
| 6 to 18 Years | 1,322 (100.0%) | 0 (0.0%) |
| 19 to 25 Years | 551 (97.5%) | 14 (2.5%) |
| 26 to 34 Years | 1,001 (90.3%) | 107 (9.7%) |
| 35 to 44 Years | 894 (99.8%) | 2 (0.2%) |
| 45 to 54 Years | 816 (96.0%) | 34 (4.0%) |
| 55 to 64 Years | 1,059 (100.0%) | 0 (0.0%) |
| 65 to 74 Years | 1,417 (100.0%) | 0 (0.0%) |
| 75 Years and older | 891 (100.0%) | 0 (0.0%) |
| Total | 8,576 (97.6%) | 212 (2.4%) |
Health Insurance Coverage by Citizenship Status in Oak Hills Place
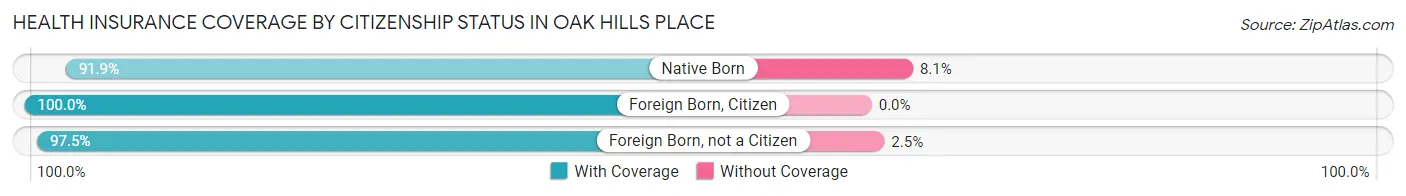
| Citizenship Status | With Coverage | Without Coverage |
| Native Born | 625 (91.9%) | 55 (8.1%) |
| Foreign Born, Citizen | 1,322 (100.0%) | 0 (0.0%) |
| Foreign Born, not a Citizen | 551 (97.5%) | 14 (2.5%) |
Health Insurance Coverage by Household Income in Oak Hills Place
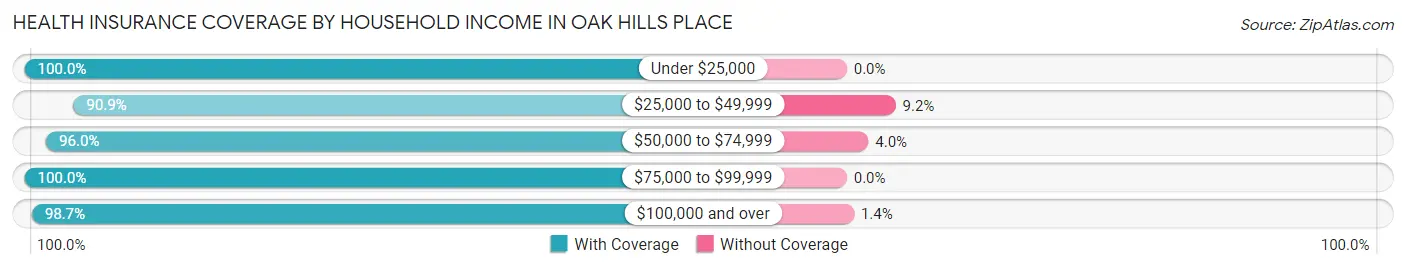
| Household Income | With Coverage | Without Coverage |
| Under $25,000 | 666 (100.0%) | 0 (0.0%) |
| $25,000 to $49,999 | 933 (90.8%) | 94 (9.1%) |
| $50,000 to $74,999 | 998 (96.0%) | 42 (4.0%) |
| $75,000 to $99,999 | 714 (100.0%) | 0 (0.0%) |
| $100,000 and over | 5,256 (98.7%) | 72 (1.3%) |
Public vs Private Health Insurance Coverage by Age in Oak Hills Place
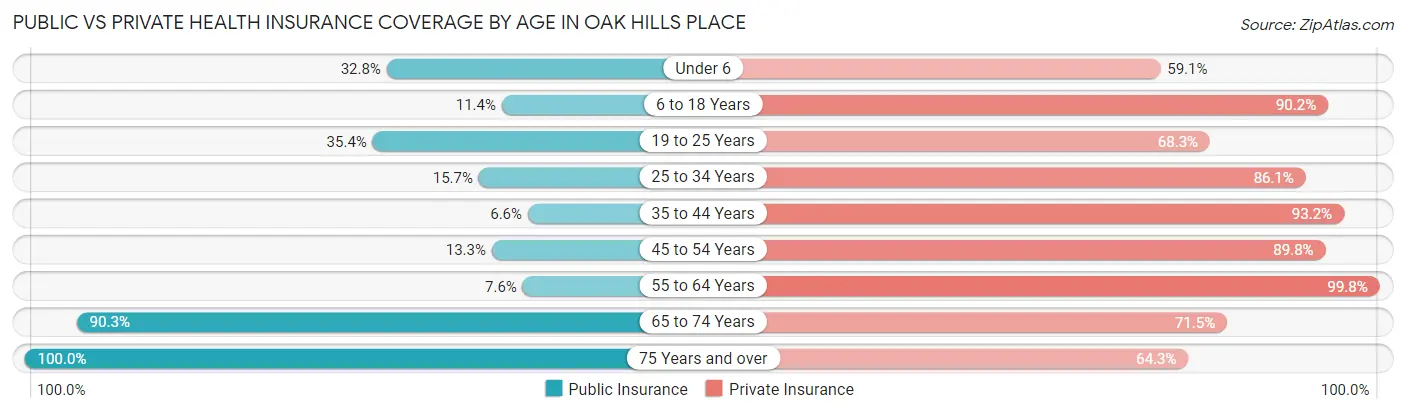
| Age Bracket | Public Insurance | Private Insurance |
| Under 6 | 223 (32.8%) | 402 (59.1%) |
| 6 to 18 Years | 151 (11.4%) | 1,193 (90.2%) |
| 19 to 25 Years | 200 (35.4%) | 386 (68.3%) |
| 25 to 34 Years | 174 (15.7%) | 954 (86.1%) |
| 35 to 44 Years | 59 (6.6%) | 835 (93.2%) |
| 45 to 54 Years | 113 (13.3%) | 763 (89.8%) |
| 55 to 64 Years | 80 (7.5%) | 1,057 (99.8%) |
| 65 to 74 Years | 1,280 (90.3%) | 1,013 (71.5%) |
| 75 Years and over | 891 (100.0%) | 573 (64.3%) |
| Total | 3,171 (36.1%) | 7,176 (81.7%) |
Disability Status by Sex by Age in Oak Hills Place
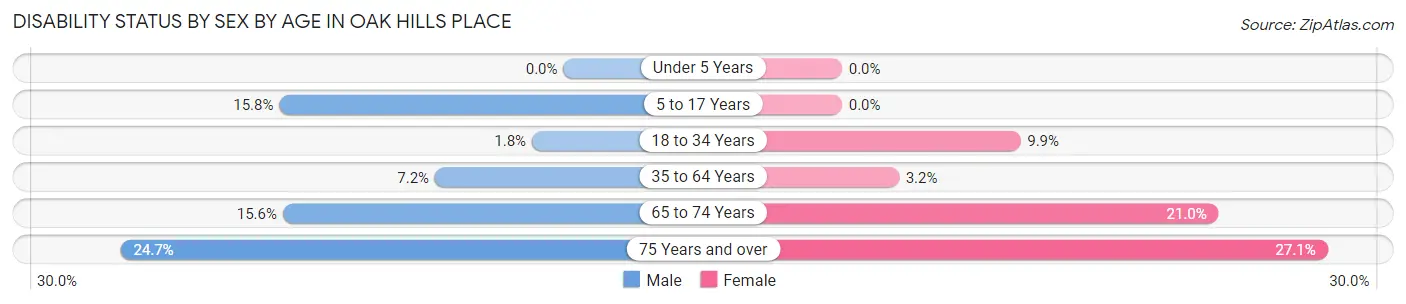
| Age Bracket | Male | Female |
| Under 5 Years | 0 (0.0%) | 0 (0.0%) |
| 5 to 17 Years | 96 (15.8%) | 0 (0.0%) |
| 18 to 34 Years | 18 (1.8%) | 71 (9.9%) |
| 35 to 64 Years | 90 (7.1%) | 49 (3.2%) |
| 65 to 74 Years | 100 (15.6%) | 163 (21.0%) |
| 75 Years and over | 72 (24.7%) | 162 (27.1%) |
Disability Class by Sex by Age in Oak Hills Place
Disability Class: Hearing Difficulty
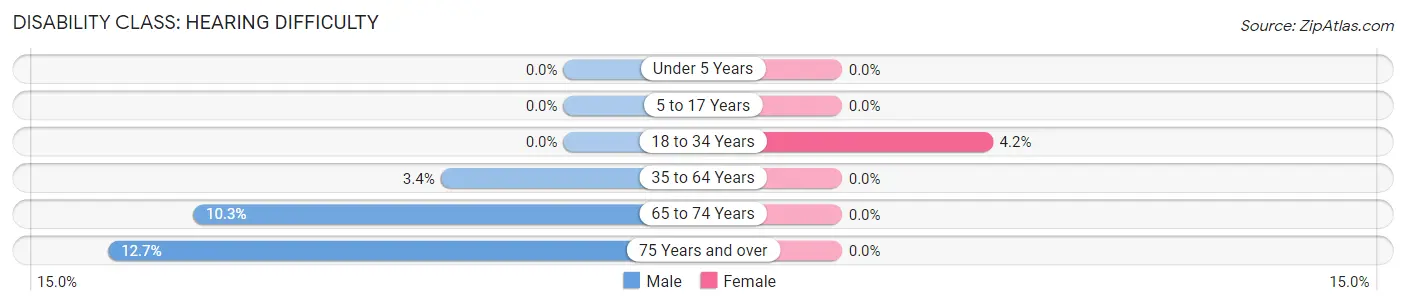
| Age Bracket | Male | Female |
| Under 5 Years | 0 (0.0%) | 0 (0.0%) |
| 5 to 17 Years | 0 (0.0%) | 0 (0.0%) |
| 18 to 34 Years | 0 (0.0%) | 30 (4.2%) |
| 35 to 64 Years | 43 (3.4%) | 0 (0.0%) |
| 65 to 74 Years | 66 (10.3%) | 0 (0.0%) |
| 75 Years and over | 37 (12.7%) | 0 (0.0%) |
Disability Class: Vision Difficulty
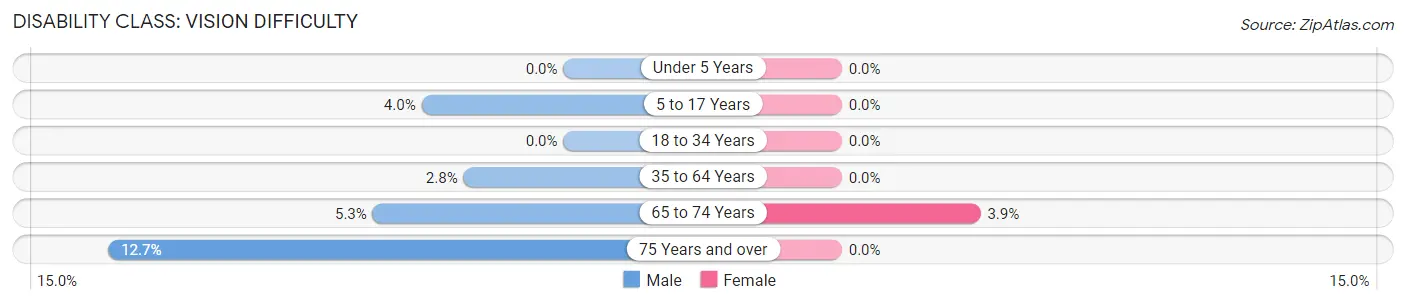
| Age Bracket | Male | Female |
| Under 5 Years | 0 (0.0%) | 0 (0.0%) |
| 5 to 17 Years | 24 (4.0%) | 0 (0.0%) |
| 18 to 34 Years | 0 (0.0%) | 0 (0.0%) |
| 35 to 64 Years | 35 (2.8%) | 0 (0.0%) |
| 65 to 74 Years | 34 (5.3%) | 30 (3.9%) |
| 75 Years and over | 37 (12.7%) | 0 (0.0%) |
Disability Class: Cognitive Difficulty
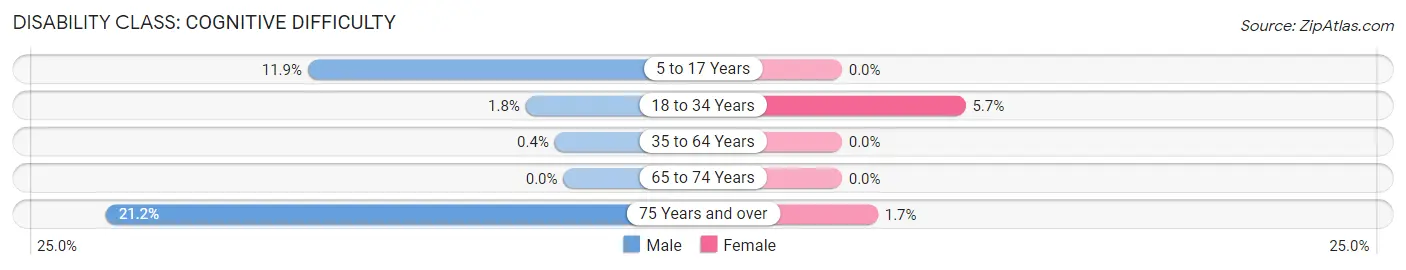
| Age Bracket | Male | Female |
| 5 to 17 Years | 72 (11.9%) | 0 (0.0%) |
| 18 to 34 Years | 18 (1.8%) | 41 (5.7%) |
| 35 to 64 Years | 5 (0.4%) | 0 (0.0%) |
| 65 to 74 Years | 0 (0.0%) | 0 (0.0%) |
| 75 Years and over | 62 (21.2%) | 10 (1.7%) |
Disability Class: Ambulatory Difficulty
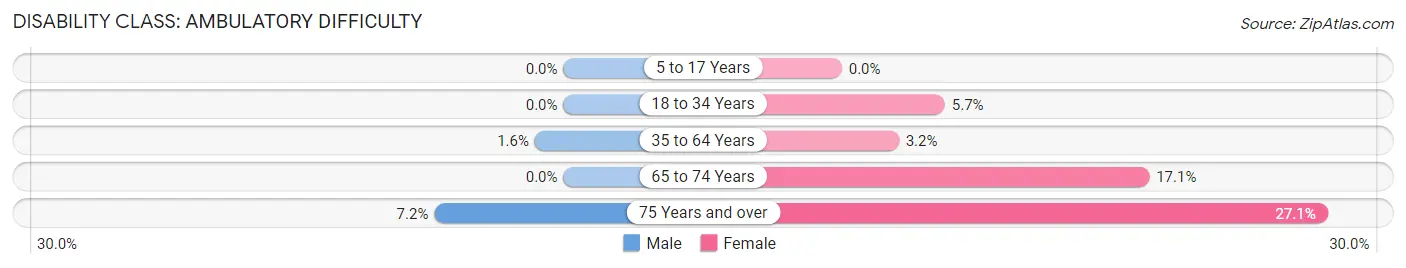
| Age Bracket | Male | Female |
| 5 to 17 Years | 0 (0.0%) | 0 (0.0%) |
| 18 to 34 Years | 0 (0.0%) | 41 (5.7%) |
| 35 to 64 Years | 20 (1.6%) | 49 (3.2%) |
| 65 to 74 Years | 0 (0.0%) | 133 (17.1%) |
| 75 Years and over | 21 (7.2%) | 162 (27.1%) |
Disability Class: Self-Care Difficulty
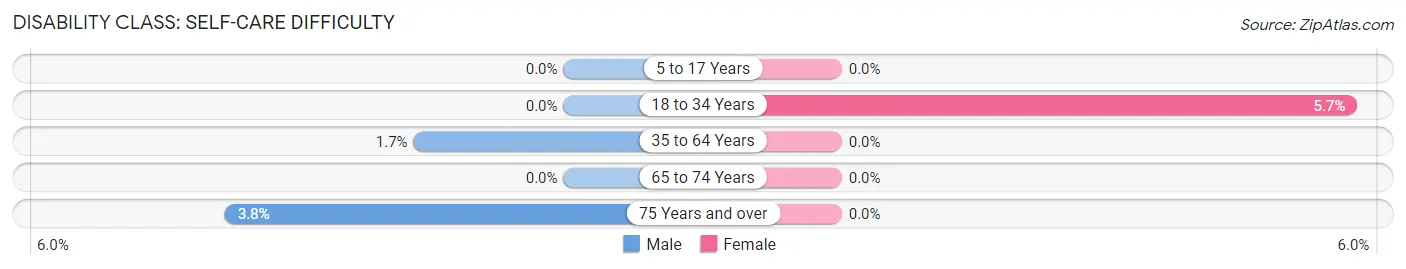
| Age Bracket | Male | Female |
| 5 to 17 Years | 0 (0.0%) | 0 (0.0%) |
| 18 to 34 Years | 0 (0.0%) | 41 (5.7%) |
| 35 to 64 Years | 21 (1.7%) | 0 (0.0%) |
| 65 to 74 Years | 0 (0.0%) | 0 (0.0%) |
| 75 Years and over | 11 (3.8%) | 0 (0.0%) |
Technology Access in Oak Hills Place
Computing Device Access in Oak Hills Place
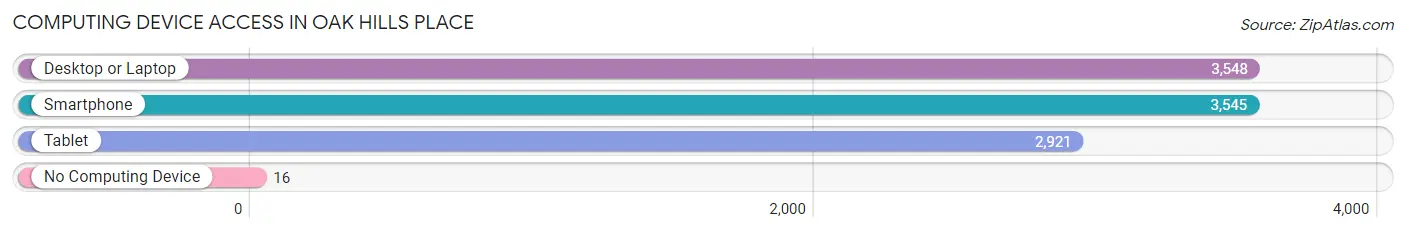
| Device Type | # Households | % Households |
| Desktop or Laptop | 3,548 | 93.8% |
| Smartphone | 3,545 | 93.7% |
| Tablet | 2,921 | 77.2% |
| No Computing Device | 16 | 0.4% |
| Total | 3,784 | 100.0% |
Internet Access in Oak Hills Place
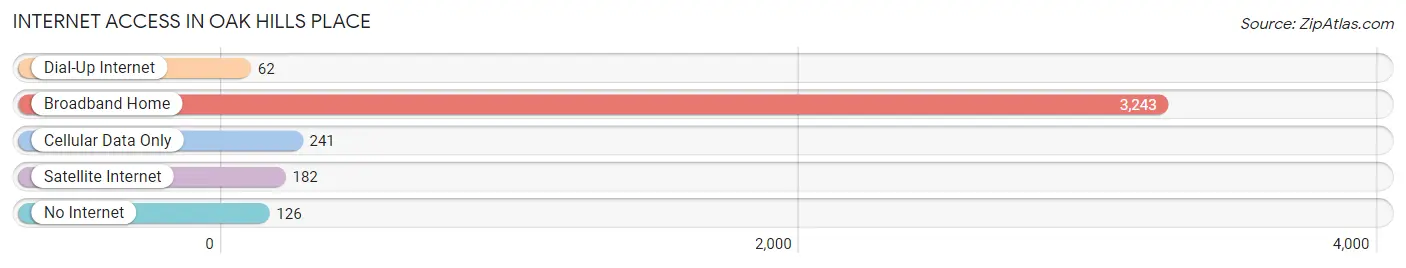
| Internet Type | # Households | % Households |
| Dial-Up Internet | 62 | 1.6% |
| Broadband Home | 3,243 | 85.7% |
| Cellular Data Only | 241 | 6.4% |
| Satellite Internet | 182 | 4.8% |
| No Internet | 126 | 3.3% |
| Total | 3,784 | 100.0% |
Oak Hills Place Summary
Hills Place is a small unincorporated community located in the parish of East Baton Rouge, Louisiana. It is situated in the northern part of the parish, just south of the city of Baton Rouge. The community is bordered by the cities of Baker and Zachary to the north, and by the city of Central to the south. The population of Oak Hills Place was estimated to be 2,845 in the year 2000.
Geography
Oak Hills Place is located in the northern part of East Baton Rouge Parish, just south of the city of Baton Rouge. The community is bordered by the cities of Baker and Zachary to the north, and by the city of Central to the south. The terrain of the area is mostly flat, with some rolling hills. The area is drained by the Amite River, which flows through the parish from the north to the south.
Climate
Oak Hills Place has a humid subtropical climate, with hot, humid summers and mild winters. The average annual temperature is around 70°F (21°C), with average highs in the summer months reaching into the mid-90s (32-35°C). Average lows in the winter months are in the mid-50s (10-13°C). The area receives an average of 56 inches (142 cm) of precipitation per year, with most of it falling in the summer months.
Demographics
As of the 2000 census, the population of Oak Hills Place was 2,845. The racial makeup of the community was 79.3% White, 17.2% African American, 0.7% Native American, 0.7% Asian, 0.2% Pacific Islander, 0.7% from other races, and 1.2% from two or more races. Hispanic or Latino of any race were 2.2% of the population.
Economy
Oak Hills Place is primarily a residential community, with most of its residents commuting to nearby cities for work. The area is home to several small businesses, including a few restaurants, convenience stores, and a few small retail stores. The community is also home to a few small industrial and manufacturing businesses.
Education
Oak Hills Place is served by the East Baton Rouge Parish School System. The area is home to two elementary schools, Oak Hills Place Elementary School and Oak Hills Place Middle School. The community is also served by nearby Central High School.
Conclusion
Oak Hills Place is a small unincorporated community located in the northern part of East Baton Rouge Parish, just south of the city of Baton Rouge. The population of the community was estimated to be 2,845 in the year 2000. The area is primarily residential, with most of its residents commuting to nearby cities for work. The community is served by the East Baton Rouge Parish School System, and is home to several small businesses. Oak Hills Place has a humid subtropical climate, with hot, humid summers and mild winters.
Common Questions
What is Per Capita Income in Oak Hills Place?
Per Capita income in Oak Hills Place is $56,794.
What is the Median Family Income in Oak Hills Place?
Median Family Income in Oak Hills Place is $126,594.
What is the Median Household income in Oak Hills Place?
Median Household Income in Oak Hills Place is $91,523.
What is Income or Wage Gap in Oak Hills Place?
Income or Wage Gap in Oak Hills Place is 16.5%.
Women in Oak Hills Place earn 83.5 cents for every dollar earned by a man.
What is Inequality or Gini Index in Oak Hills Place?
Inequality or Gini Index in Oak Hills Place is 0.48.
What is the Total Population of Oak Hills Place?
Total Population of Oak Hills Place is 8,813.
What is the Total Male Population of Oak Hills Place?
Total Male Population of Oak Hills Place is 3,934.
What is the Total Female Population of Oak Hills Place?
Total Female Population of Oak Hills Place is 4,879.
What is the Ratio of Males per 100 Females in Oak Hills Place?
There are 80.63 Males per 100 Females in Oak Hills Place.
What is the Ratio of Females per 100 Males in Oak Hills Place?
There are 124.02 Females per 100 Males in Oak Hills Place.
What is the Median Population Age in Oak Hills Place?
Median Population Age in Oak Hills Place is 42.1 Years.
What is the Average Family Size in Oak Hills Place
Average Family Size in Oak Hills Place is 2.9 People.
What is the Average Household Size in Oak Hills Place
Average Household Size in Oak Hills Place is 2.3 People.
How Large is the Labor Force in Oak Hills Place?
There are 3,976 People in the Labor Forcein in Oak Hills Place.
What is the Percentage of People in the Labor Force in Oak Hills Place?
56.2% of People are in the Labor Force in Oak Hills Place.
What is the Unemployment Rate in Oak Hills Place?
Unemployment Rate in Oak Hills Place is 1.8%.