Zip Codes with the Highest Percentage of Population Employed in Life, Physical & Social Science in Gretna, LA
RELATED REPORTS & OPTIONS
Life, Physical & Social Science
Gretna
Compare Zip Codes
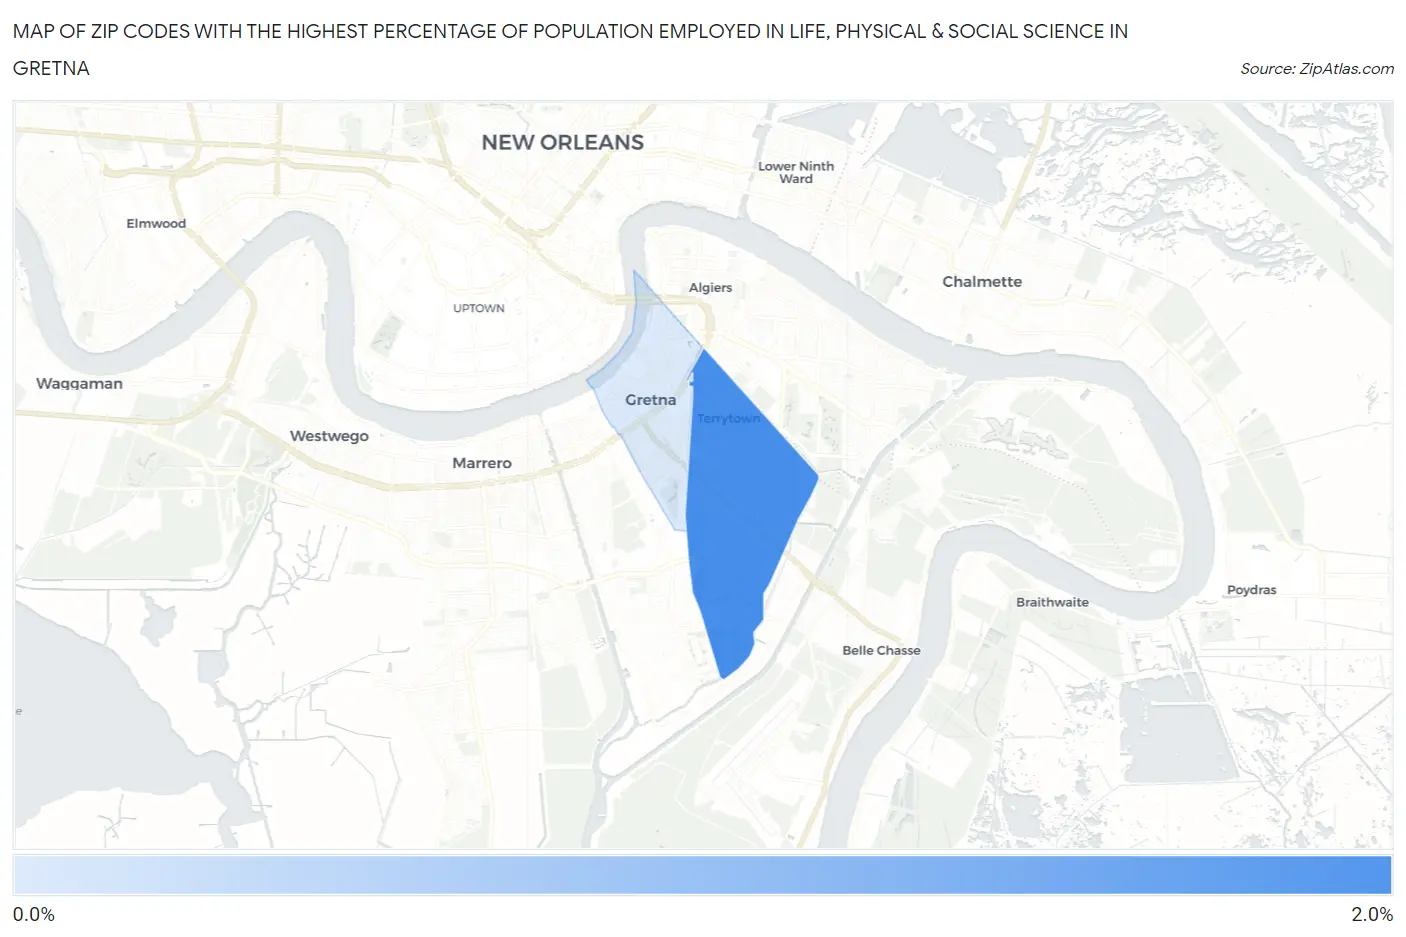
Map of Zip Codes with the Highest Percentage of Population Employed in Life, Physical & Social Science in Gretna
0.94%
1.6%
Zip Codes with the Highest Percentage of Population Employed in Life, Physical & Social Science in Gretna, LA
| Zip Code | % Employed | vs State | vs National | |
| 1. | 70056 | 1.6% | 0.98%(+0.576)#67 | 1.1%(+0.463)#5,362 |
| 2. | 70053 | 0.94% | 0.98%(-0.042)#130 | 1.1%(-0.155)#9,605 |
1
Common Questions
What are the Top Zip Codes with the Highest Percentage of Population Employed in Life, Physical & Social Science in Gretna, LA?
Top Zip Codes with the Highest Percentage of Population Employed in Life, Physical & Social Science in Gretna, LA are:
What zip code has the Highest Percentage of Population Employed in Life, Physical & Social Science in Gretna, LA?
70056 has the Highest Percentage of Population Employed in Life, Physical & Social Science in Gretna, LA with 1.6%.
What is the Percentage of Population Employed in Life, Physical & Social Science in Gretna, LA?
Percentage of Population Employed in Life, Physical & Social Science in Gretna is 1.1%.
What is the Percentage of Population Employed in Life, Physical & Social Science in Louisiana?
Percentage of Population Employed in Life, Physical & Social Science in Louisiana is 0.98%.
What is the Percentage of Population Employed in Life, Physical & Social Science in the United States?
Percentage of Population Employed in Life, Physical & Social Science in the United States is 1.1%.