Start, LA Map & Demographics
Start Map
Start Overview
$40,795
PER CAPITA INCOME
$66,667
AVG FAMILY INCOME
33.7%
WAGE / INCOME GAP [ % ]
66.3¢/ $1
WAGE / INCOME GAP [ $ ]
0.54
INEQUALITY / GINI INDEX
924
TOTAL POPULATION
462
MALE POPULATION
462
FEMALE POPULATION
100.00
MALES / 100 FEMALES
100.00
FEMALES / 100 MALES
47.5
MEDIAN AGE
2.0
AVG FAMILY SIZE
1.7
AVG HOUSEHOLD SIZE
407
LABOR FORCE [ PEOPLE ]
47.8%
PERCENT IN LABOR FORCE
2.2%
UNEMPLOYMENT RATE
Start Zip Codes
Start Area Codes
Income in Start
Income Overview in Start
| Characteristic | Number | Measure |
| Per Capita Income | 924 | $40,795 |
| Median Family Income | 282 | $66,667 |
| Mean Family Income | 282 | $111,017 |
| Median Household Income | 555 | $0 |
| Mean Household Income | 555 | $71,343 |
| Income Deficit | 282 | $0 |
| Wage / Income Gap (%) | 924 | 33.73% |
| Wage / Income Gap ($) | 924 | 66.27¢ per $1 |
| Gini / Inequality Index | 924 | 0.54 |
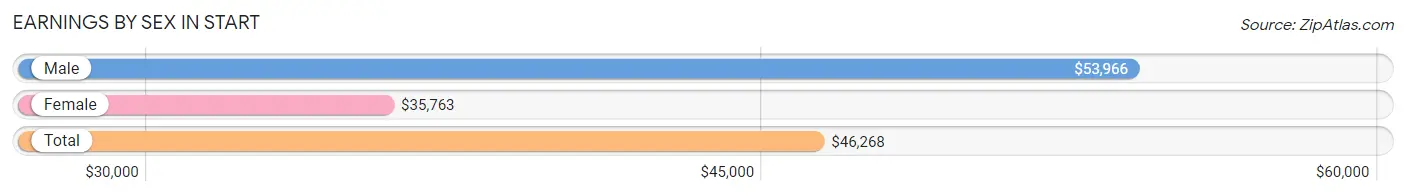
Earnings by Sex in Start
Average Earnings in Start are $46,268, $53,966 for men and $35,763 for women, a difference of 33.7%.
| Sex | Number | Average Earnings |
| Male | 165 (37.8%) | $53,966 |
| Female | 272 (62.2%) | $35,763 |
| Total | 437 (100.0%) | $46,268 |
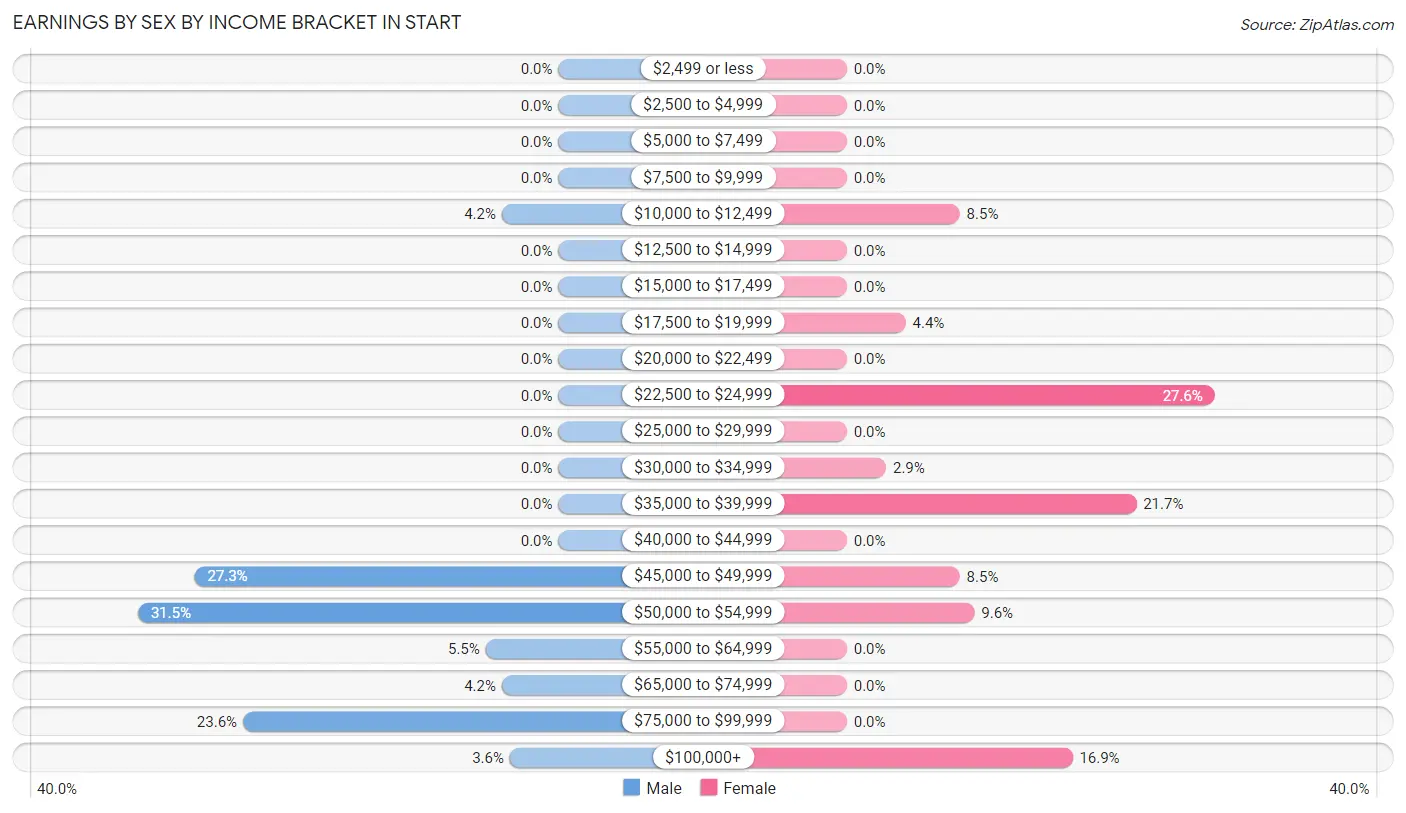
Earnings by Sex by Income Bracket in Start
The most common earnings brackets in Start are $50,000 to $54,999 for men (52 | 31.5%) and $22,500 to $24,999 for women (75 | 27.6%).
| Income | Male | Female |
| $2,499 or less | 0 (0.0%) | 0 (0.0%) |
| $2,500 to $4,999 | 0 (0.0%) | 0 (0.0%) |
| $5,000 to $7,499 | 0 (0.0%) | 0 (0.0%) |
| $7,500 to $9,999 | 0 (0.0%) | 0 (0.0%) |
| $10,000 to $12,499 | 7 (4.2%) | 23 (8.5%) |
| $12,500 to $14,999 | 0 (0.0%) | 0 (0.0%) |
| $15,000 to $17,499 | 0 (0.0%) | 0 (0.0%) |
| $17,500 to $19,999 | 0 (0.0%) | 12 (4.4%) |
| $20,000 to $22,499 | 0 (0.0%) | 0 (0.0%) |
| $22,500 to $24,999 | 0 (0.0%) | 75 (27.6%) |
| $25,000 to $29,999 | 0 (0.0%) | 0 (0.0%) |
| $30,000 to $34,999 | 0 (0.0%) | 8 (2.9%) |
| $35,000 to $39,999 | 0 (0.0%) | 59 (21.7%) |
| $40,000 to $44,999 | 0 (0.0%) | 0 (0.0%) |
| $45,000 to $49,999 | 45 (27.3%) | 23 (8.5%) |
| $50,000 to $54,999 | 52 (31.5%) | 26 (9.6%) |
| $55,000 to $64,999 | 9 (5.4%) | 0 (0.0%) |
| $65,000 to $74,999 | 7 (4.2%) | 0 (0.0%) |
| $75,000 to $99,999 | 39 (23.6%) | 0 (0.0%) |
| $100,000+ | 6 (3.6%) | 46 (16.9%) |
| Total | 165 (100.0%) | 272 (100.0%) |
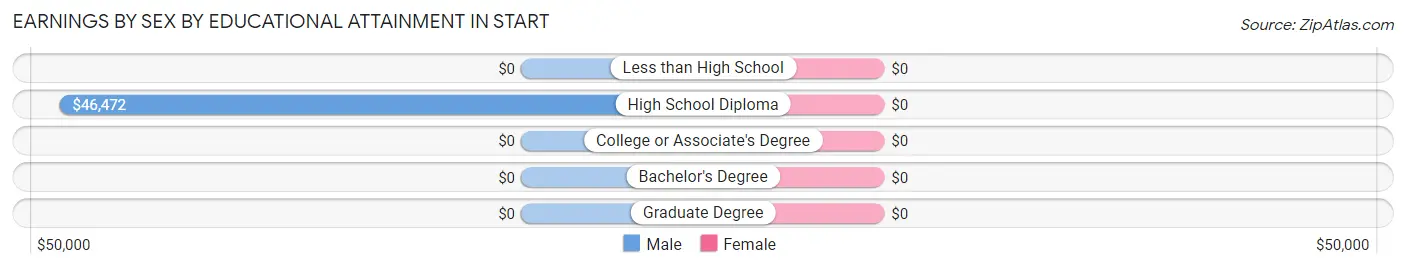
Earnings by Sex by Educational Attainment in Start
| Educational Attainment | Male Income | Female Income |
| Less than High School | - | - |
| High School Diploma | $46,472 | $0 |
| College or Associate's Degree | - | - |
| Bachelor's Degree | - | - |
| Graduate Degree | - | - |
| Total | $54,138 | $36,843 |
Family Income in Start
Family Income Brackets in Start
According to the Start family income data, there are 80 families falling into the $50,000 to $74,999 income range, which is the most common income bracket and makes up 28.4% of all families.
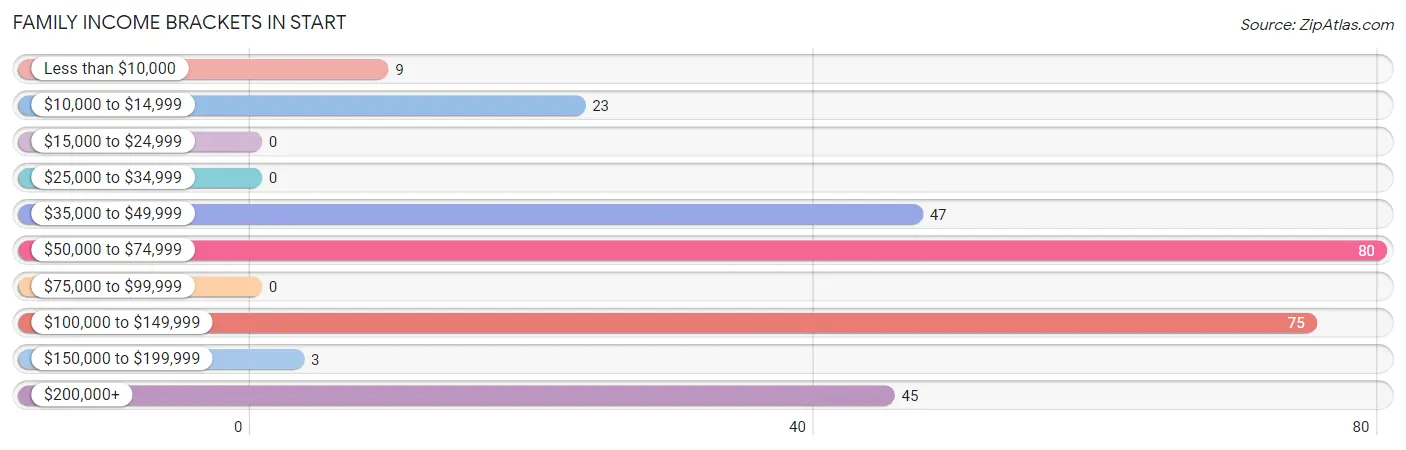
| Income Bracket | # Families | % Families |
| Less than $10,000 | 9 | 3.2% |
| $10,000 to $14,999 | 23 | 8.2% |
| $15,000 to $24,999 | 0 | 0.0% |
| $25,000 to $34,999 | 0 | 0.0% |
| $35,000 to $49,999 | 47 | 16.7% |
| $50,000 to $74,999 | 80 | 28.4% |
| $75,000 to $99,999 | 0 | 0.0% |
| $100,000 to $149,999 | 75 | 26.6% |
| $150,000 to $199,999 | 3 | 1.1% |
| $200,000+ | 45 | 16.0% |
Family Income by Famaliy Size in Start
2-person families (279 | 98.9%) account for the highest median family income in Start with $66,597 per family, while 2-person families (279 | 98.9%) have the highest median income of $33,298 per family member.
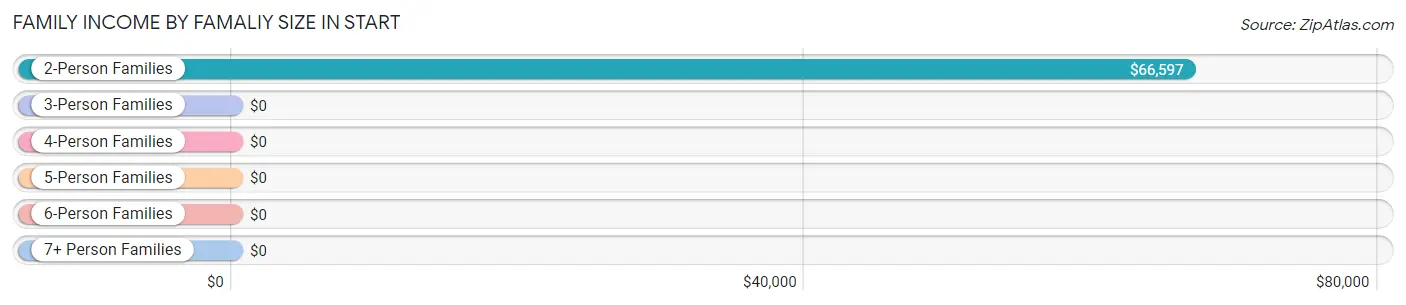
| Income Bracket | # Families | Median Income |
| 2-Person Families | 279 (98.9%) | $66,597 |
| 3-Person Families | 0 (0.0%) | $0 |
| 4-Person Families | 3 (1.1%) | $0 |
| 5-Person Families | 0 (0.0%) | $0 |
| 6-Person Families | 0 (0.0%) | $0 |
| 7+ Person Families | 0 (0.0%) | $0 |
| Total | 282 (100.0%) | $66,667 |
Family Income by Number of Earners in Start
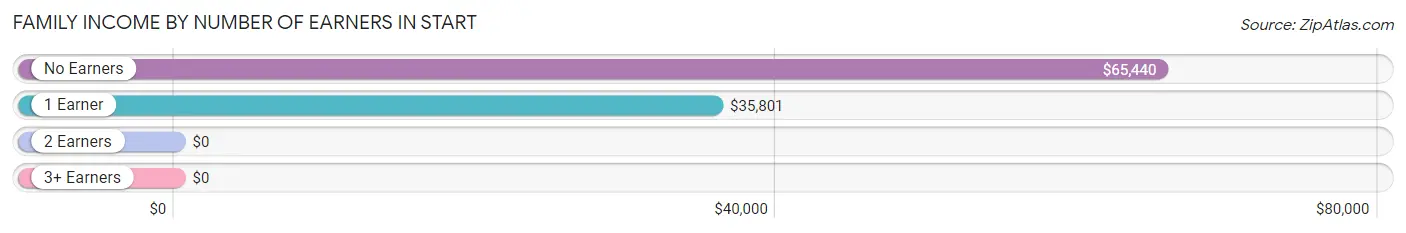
| Number of Earners | # Families | Median Income |
| No Earners | 105 (37.2%) | $65,440 |
| 1 Earner | 71 (25.2%) | $35,801 |
| 2 Earners | 106 (37.6%) | $0 |
| 3+ Earners | 0 (0.0%) | $0 |
| Total | 282 (100.0%) | $66,667 |
Household Income in Start
Household Income Brackets in Start
With 172 households falling in the category, the $15,000 to $24,999 income range is the most frequent in Start, accounting for 31.0% of all households.
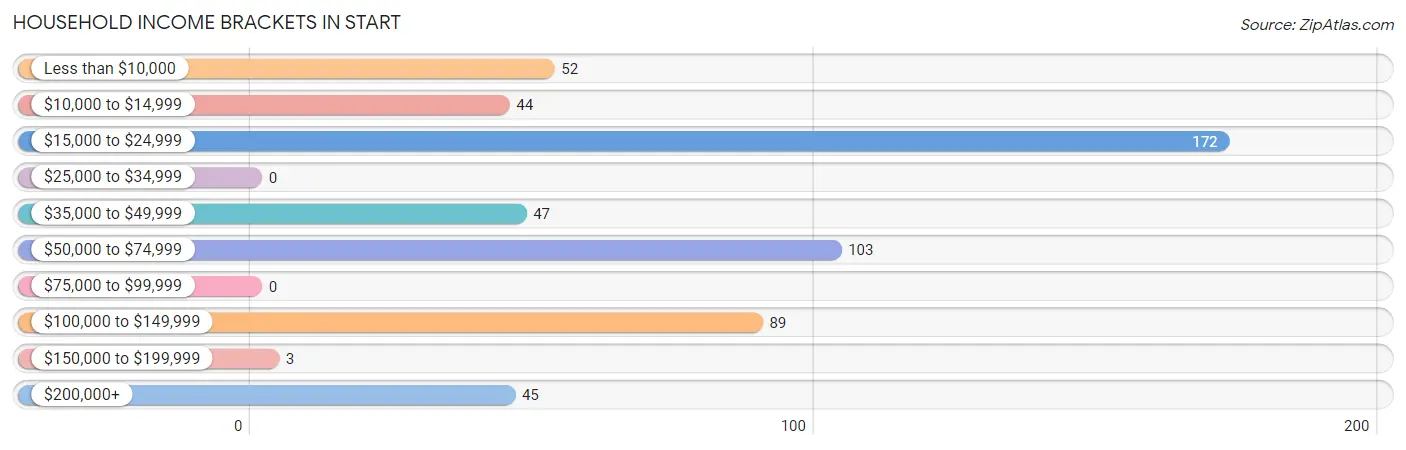
| Income Bracket | # Households | % Households |
| Less than $10,000 | 52 | 9.4% |
| $10,000 to $14,999 | 44 | 7.9% |
| $15,000 to $24,999 | 172 | 31.0% |
| $25,000 to $34,999 | 0 | 0.0% |
| $35,000 to $49,999 | 47 | 8.5% |
| $50,000 to $74,999 | 103 | 18.6% |
| $75,000 to $99,999 | 0 | 0.0% |
| $100,000 to $149,999 | 89 | 16.0% |
| $150,000 to $199,999 | 3 | 0.5% |
| $200,000+ | 45 | 8.1% |
Household Income by Householder Age in Start
The median household income in Start is $0, with the highest median household income of $23,879 found in the 15 to 24 years age bracket for the primary householder. A total of 168 households (30.3%) fall into this category. Meanwhile, the 25 to 44 years age bracket for the primary householder has the lowest median household income of $0, with 61 households (11.0%) in this group.
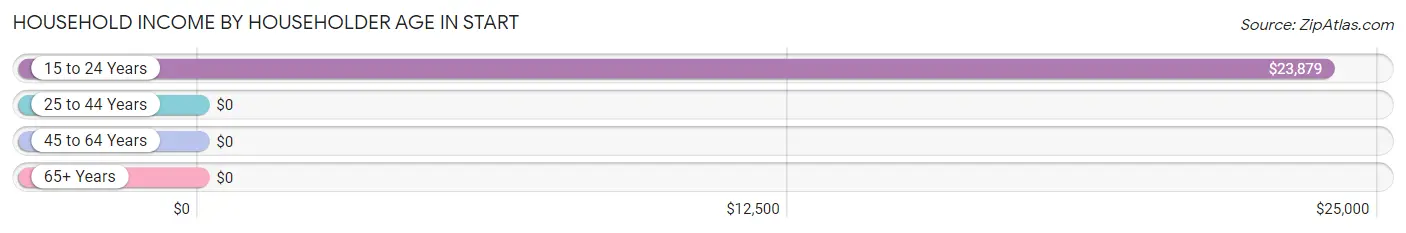
| Income Bracket | # Households | Median Income |
| 15 to 24 Years | 168 (30.3%) | $23,879 |
| 25 to 44 Years | 61 (11.0%) | $0 |
| 45 to 64 Years | 221 (39.8%) | $0 |
| 65+ Years | 105 (18.9%) | $0 |
| Total | 555 (100.0%) | $0 |
Poverty in Start
Income Below Poverty by Sex and Age in Start
With 44.6% poverty level for males and 17.5% for females among the residents of Start, under 5 year old males and 75 year old and over females are the most vulnerable to poverty, with 20 males (100.0%) and 43 females (55.8%) in their respective age groups living below the poverty level.
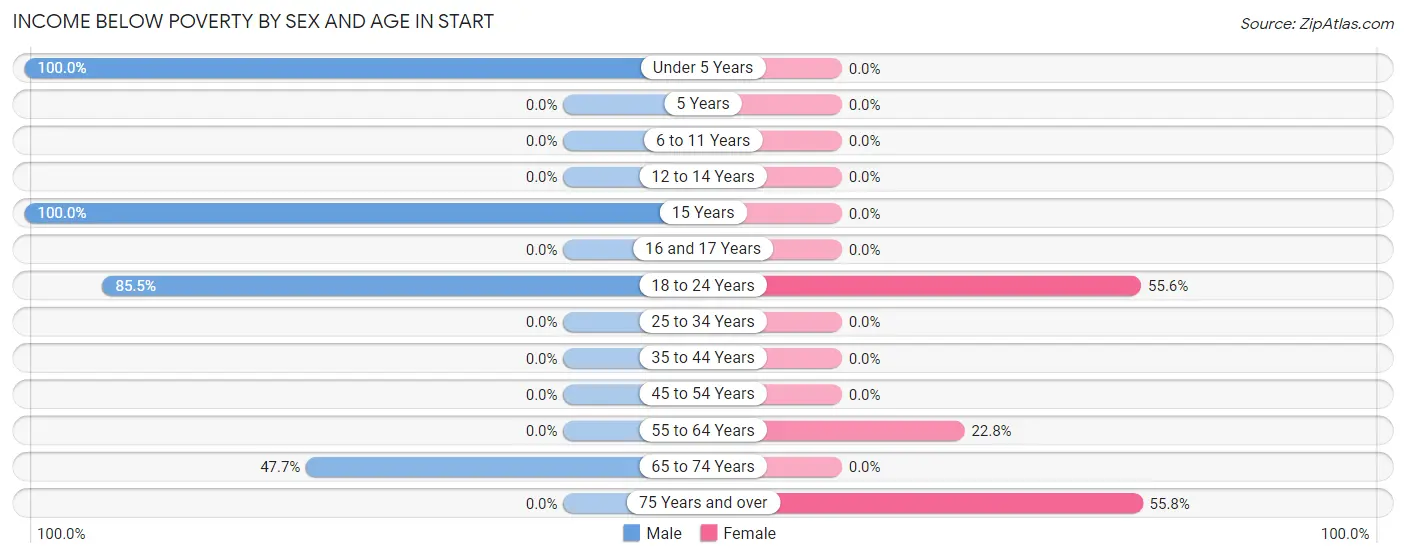
| Age Bracket | Male | Female |
| Under 5 Years | 20 (100.0%) | 0 (0.0%) |
| 5 Years | 0 (0.0%) | 0 (0.0%) |
| 6 to 11 Years | 0 (0.0%) | 0 (0.0%) |
| 12 to 14 Years | 0 (0.0%) | 0 (0.0%) |
| 15 Years | 29 (100.0%) | 0 (0.0%) |
| 16 and 17 Years | 0 (0.0%) | 0 (0.0%) |
| 18 to 24 Years | 136 (85.5%) | 15 (55.6%) |
| 25 to 34 Years | 0 (0.0%) | 0 (0.0%) |
| 35 to 44 Years | 0 (0.0%) | 0 (0.0%) |
| 45 to 54 Years | 0 (0.0%) | 0 (0.0%) |
| 55 to 64 Years | 0 (0.0%) | 23 (22.8%) |
| 65 to 74 Years | 21 (47.7%) | 0 (0.0%) |
| 75 Years and over | 0 (0.0%) | 43 (55.8%) |
| Total | 206 (44.6%) | 81 (17.5%) |
Income Above Poverty by Sex and Age in Start
According to the poverty statistics in Start, males aged 6 to 11 years and females aged 16 and 17 years are the age groups that are most secure financially, with 100.0% of males and 100.0% of females in these age groups living above the poverty line.
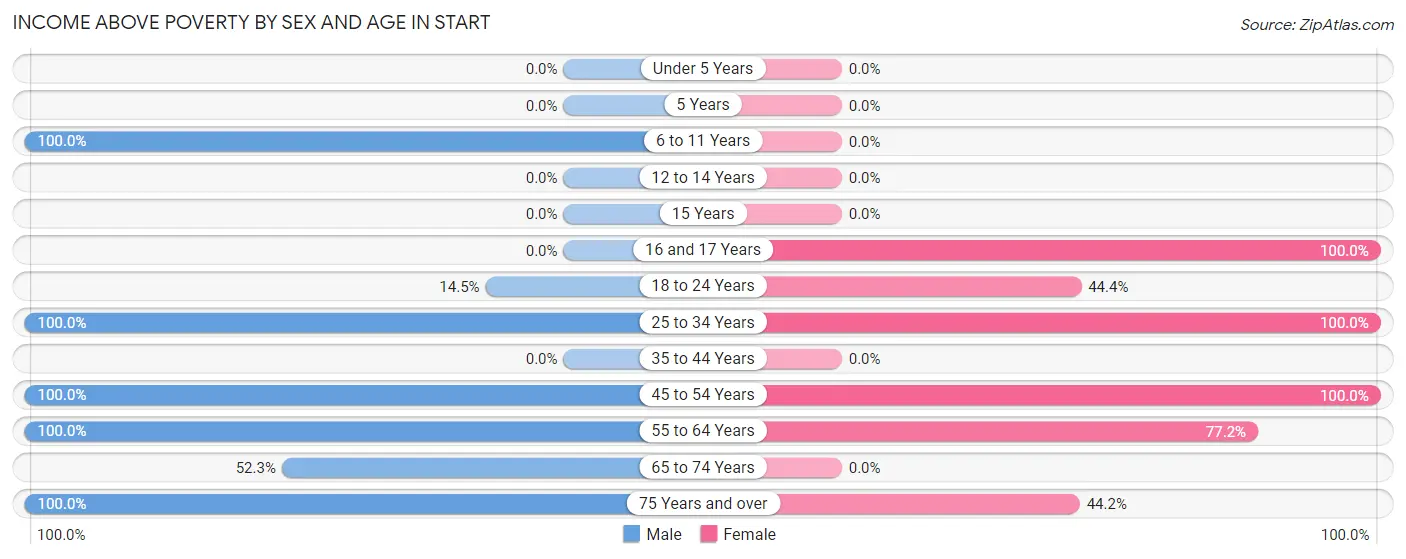
| Age Bracket | Male | Female |
| Under 5 Years | 0 (0.0%) | 0 (0.0%) |
| 5 Years | 0 (0.0%) | 0 (0.0%) |
| 6 to 11 Years | 23 (100.0%) | 0 (0.0%) |
| 12 to 14 Years | 0 (0.0%) | 0 (0.0%) |
| 15 Years | 0 (0.0%) | 0 (0.0%) |
| 16 and 17 Years | 0 (0.0%) | 39 (100.0%) |
| 18 to 24 Years | 23 (14.5%) | 12 (44.4%) |
| 25 to 34 Years | 42 (100.0%) | 59 (100.0%) |
| 35 to 44 Years | 0 (0.0%) | 0 (0.0%) |
| 45 to 54 Years | 65 (100.0%) | 159 (100.0%) |
| 55 to 64 Years | 61 (100.0%) | 78 (77.2%) |
| 65 to 74 Years | 23 (52.3%) | 0 (0.0%) |
| 75 Years and over | 19 (100.0%) | 34 (44.2%) |
| Total | 256 (55.4%) | 381 (82.5%) |
Income Below Poverty Among Married-Couple Families in Start
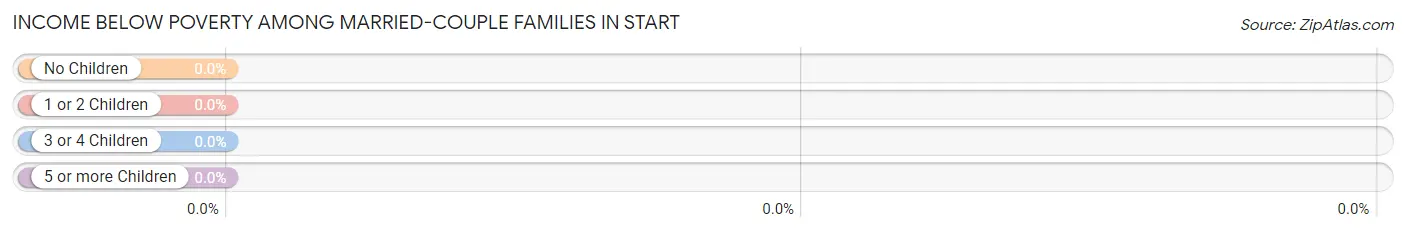
| Children | Above Poverty | Below Poverty |
| No Children | 195 (100.0%) | 0 (0.0%) |
| 1 or 2 Children | 0 (0.0%) | 0 (0.0%) |
| 3 or 4 Children | 0 (0.0%) | 0 (0.0%) |
| 5 or more Children | 0 (0.0%) | 0 (0.0%) |
| Total | 195 (100.0%) | 0 (0.0%) |
Income Below Poverty Among Single-Parent Households in Start
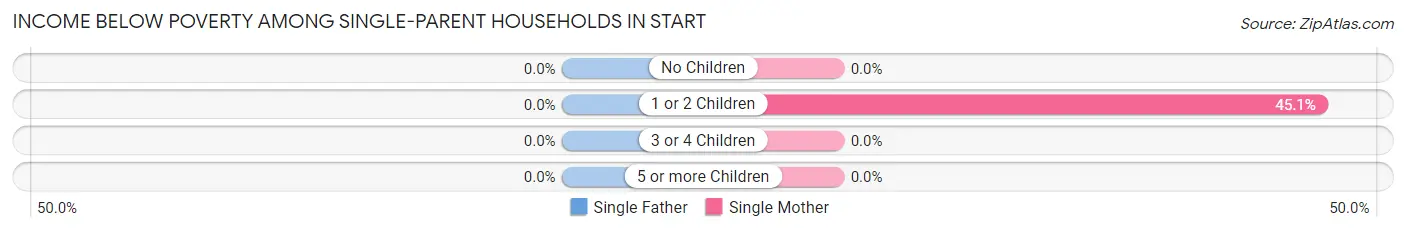
| Children | Single Father | Single Mother |
| No Children | 0 (0.0%) | 0 (0.0%) |
| 1 or 2 Children | 0 (0.0%) | 32 (45.1%) |
| 3 or 4 Children | 0 (0.0%) | 0 (0.0%) |
| 5 or more Children | 0 (0.0%) | 0 (0.0%) |
| Total | 0 (0.0%) | 32 (36.8%) |
Income Below Poverty Among Married-Couple vs Single-Parent Households in Start
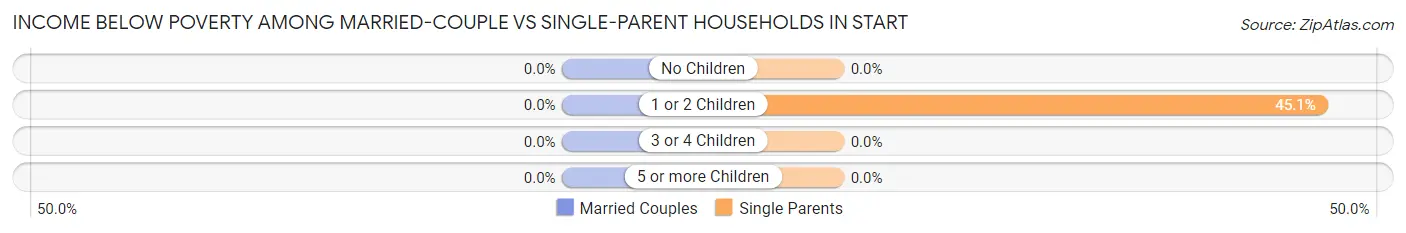
| Children | Married-Couple Families | Single-Parent Households |
| No Children | 0 (0.0%) | 0 (0.0%) |
| 1 or 2 Children | 0 (0.0%) | 32 (45.1%) |
| 3 or 4 Children | 0 (0.0%) | 0 (0.0%) |
| 5 or more Children | 0 (0.0%) | 0 (0.0%) |
| Total | 0 (0.0%) | 32 (36.8%) |
Race in Start
The most populous races in Start are White / Caucasian (852 | 92.2%), Black / African American (52 | 5.6%), and Hispanic or Latino (20 | 2.2%).
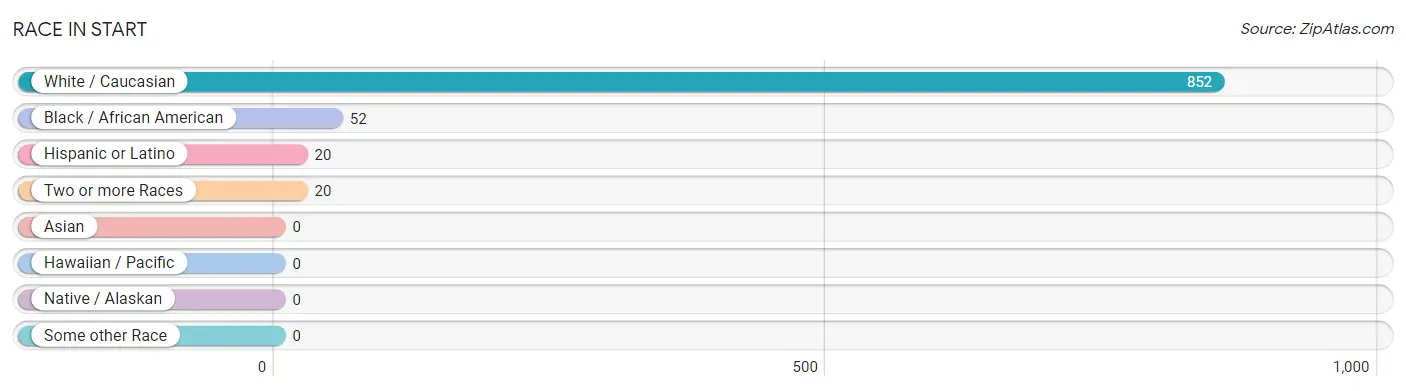
| Race | # Population | % Population |
| Asian | 0 | 0.0% |
| Black / African American | 52 | 5.6% |
| Hawaiian / Pacific | 0 | 0.0% |
| Hispanic or Latino | 20 | 2.2% |
| Native / Alaskan | 0 | 0.0% |
| White / Caucasian | 852 | 92.2% |
| Two or more Races | 20 | 2.2% |
| Some other Race | 0 | 0.0% |
| Total | 924 | 100.0% |
Ancestry in Start
The most populous ancestries reported in Start are American (208 | 22.5%), Irish (104 | 11.3%), English (38 | 4.1%), German (29 | 3.1%), and French (7 | 0.8%), together accounting for 41.8% of all Start residents.
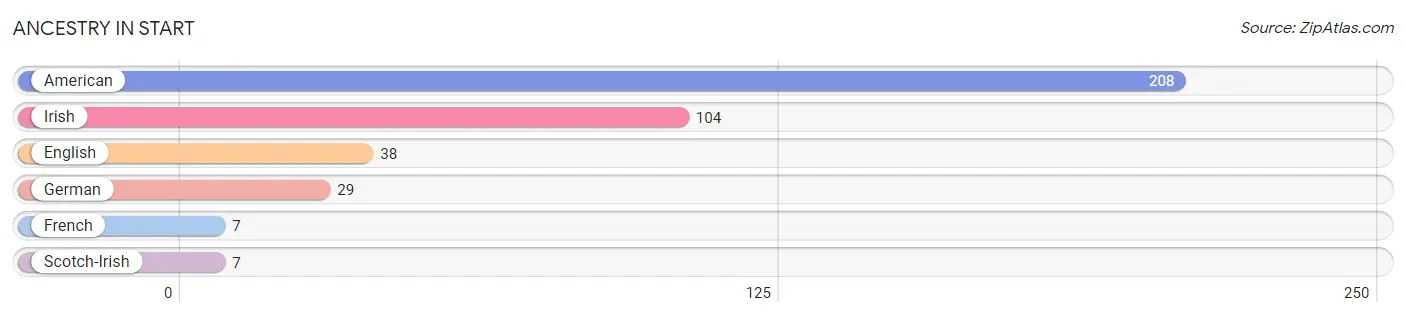
| Ancestry | # Population | % Population |
| American | 208 | 22.5% |
| English | 38 | 4.1% |
| French | 7 | 0.8% |
| German | 29 | 3.1% |
| Irish | 104 | 11.3% |
| Scotch-Irish | 7 | 0.8% | View All 6 Rows |
Immigrants in Start

| Immigration Origin | # Population | % Population | View All 0 Rows |
Sex and Age in Start
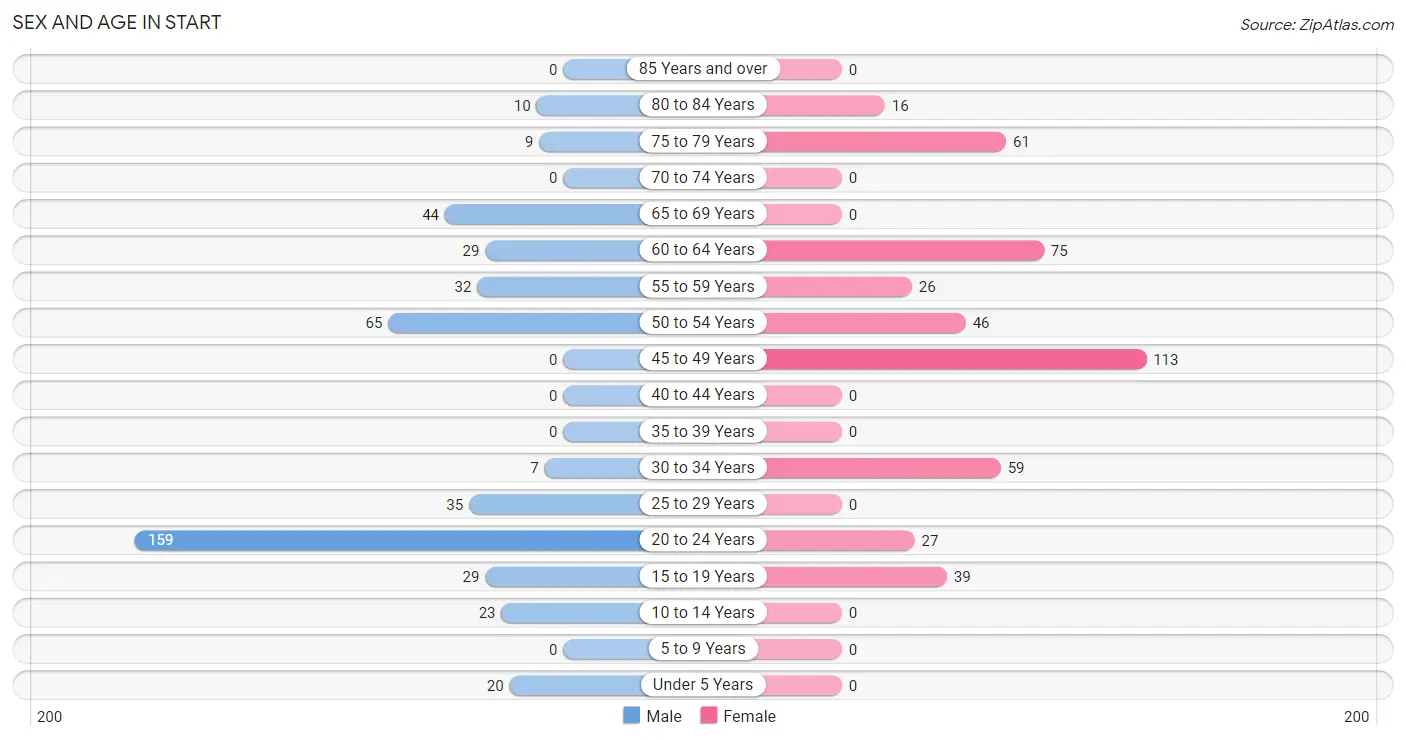
Sex and Age in Start
The most populous age groups in Start are 20 to 24 Years (159 | 34.4%) for men and 45 to 49 Years (113 | 24.5%) for women.
| Age Bracket | Male | Female |
| Under 5 Years | 20 (4.3%) | 0 (0.0%) |
| 5 to 9 Years | 0 (0.0%) | 0 (0.0%) |
| 10 to 14 Years | 23 (5.0%) | 0 (0.0%) |
| 15 to 19 Years | 29 (6.3%) | 39 (8.4%) |
| 20 to 24 Years | 159 (34.4%) | 27 (5.8%) |
| 25 to 29 Years | 35 (7.6%) | 0 (0.0%) |
| 30 to 34 Years | 7 (1.5%) | 59 (12.8%) |
| 35 to 39 Years | 0 (0.0%) | 0 (0.0%) |
| 40 to 44 Years | 0 (0.0%) | 0 (0.0%) |
| 45 to 49 Years | 0 (0.0%) | 113 (24.5%) |
| 50 to 54 Years | 65 (14.1%) | 46 (10.0%) |
| 55 to 59 Years | 32 (6.9%) | 26 (5.6%) |
| 60 to 64 Years | 29 (6.3%) | 75 (16.2%) |
| 65 to 69 Years | 44 (9.5%) | 0 (0.0%) |
| 70 to 74 Years | 0 (0.0%) | 0 (0.0%) |
| 75 to 79 Years | 9 (1.9%) | 61 (13.2%) |
| 80 to 84 Years | 10 (2.2%) | 16 (3.5%) |
| 85 Years and over | 0 (0.0%) | 0 (0.0%) |
| Total | 462 (100.0%) | 462 (100.0%) |
Families and Households in Start
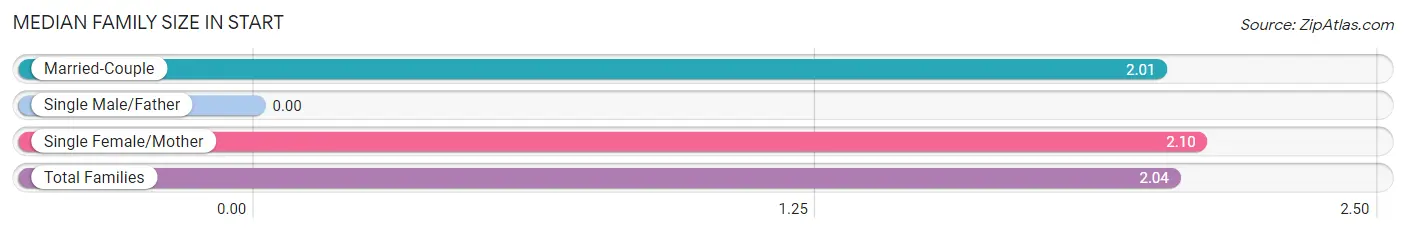
Median Family Size in Start
| Family Type | # Families | Family Size |
| Married-Couple | 195 (69.2%) | 2.01 |
| Single Male/Father | 0 (0.0%) | - |
| Single Female/Mother | 87 (30.8%) | 2.10 |
| Total Families | 282 (100.0%) | 2.04 |
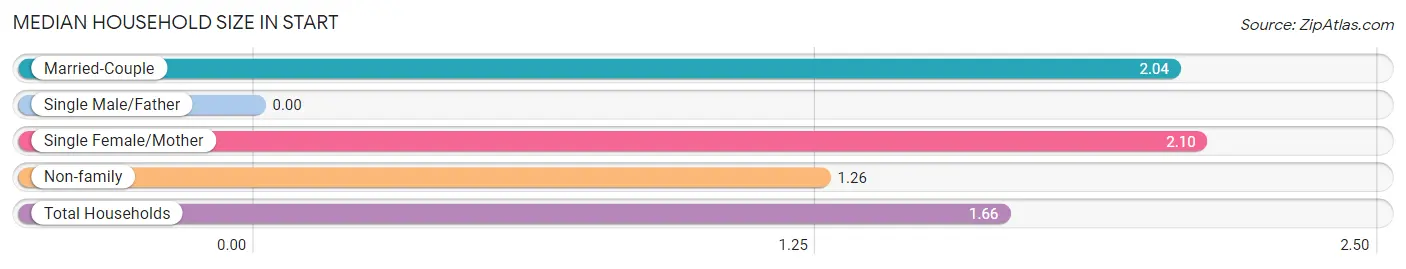
Median Household Size in Start
| Household Type | # Households | Household Size |
| Married-Couple | 195 (35.1%) | 2.04 |
| Single Male/Father | 0 (0.0%) | - |
| Single Female/Mother | 87 (15.7%) | 2.10 |
| Non-family | 273 (49.2%) | 1.26 |
| Total Households | 555 (100.0%) | 1.66 |
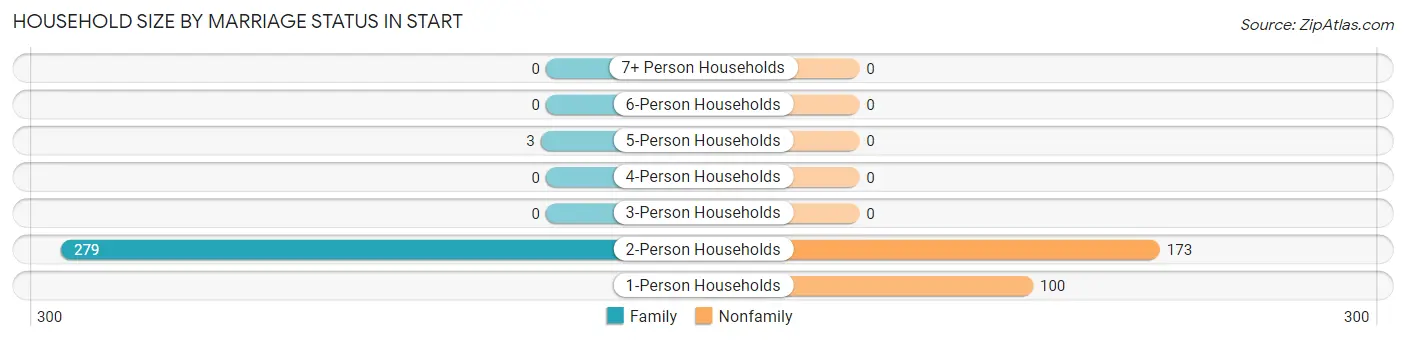
Household Size by Marriage Status in Start
Out of a total of 555 households in Start, 282 (50.8%) are family households, while 273 (49.2%) are nonfamily households. The most numerous type of family households are 2-person households, comprising 279, and the most common type of nonfamily households are 2-person households, comprising 173.
| Household Size | Family Households | Nonfamily Households |
| 1-Person Households | - | 100 (18.0%) |
| 2-Person Households | 279 (50.3%) | 173 (31.2%) |
| 3-Person Households | 0 (0.0%) | 0 (0.0%) |
| 4-Person Households | 0 (0.0%) | 0 (0.0%) |
| 5-Person Households | 3 (0.5%) | 0 (0.0%) |
| 6-Person Households | 0 (0.0%) | 0 (0.0%) |
| 7+ Person Households | 0 (0.0%) | 0 (0.0%) |
| Total | 282 (50.8%) | 273 (49.2%) |
Female Fertility in Start
Fertility by Age in Start
Average fertility rate in Start is 164.0 births per 1,000 women. Women in the age bracket of 15 to 19 years have the highest fertility rate with 1,000.0 births per 1,000 women. Women in the age bracket of 15 to 19 years acount for 100.0% of all women with births.
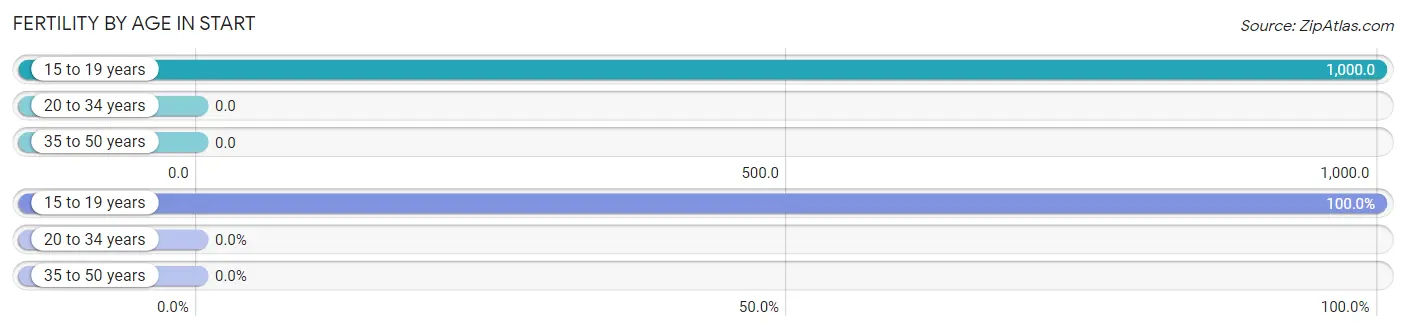
| Age Bracket | Women with Births | Births / 1,000 Women |
| 15 to 19 years | 39 (100.0%) | 1,000.0 |
| 20 to 34 years | 0 (0.0%) | 0.0 |
| 35 to 50 years | 0 (0.0%) | 0.0 |
| Total | 39 (100.0%) | 164.0 |
Fertility by Age by Marriage Status in Start
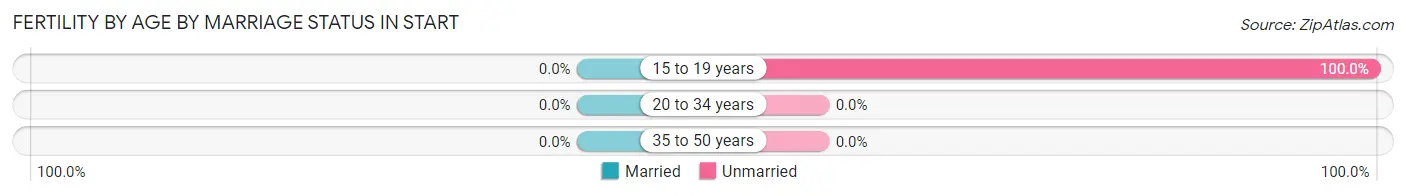
| Age Bracket | Married | Unmarried |
| 15 to 19 years | 0 (0.0%) | 39 (100.0%) |
| 20 to 34 years | 0 (0.0%) | 0 (0.0%) |
| 35 to 50 years | 0 (0.0%) | 0 (0.0%) |
| Total | 0 (0.0%) | 39 (100.0%) |
Fertility by Education in Start
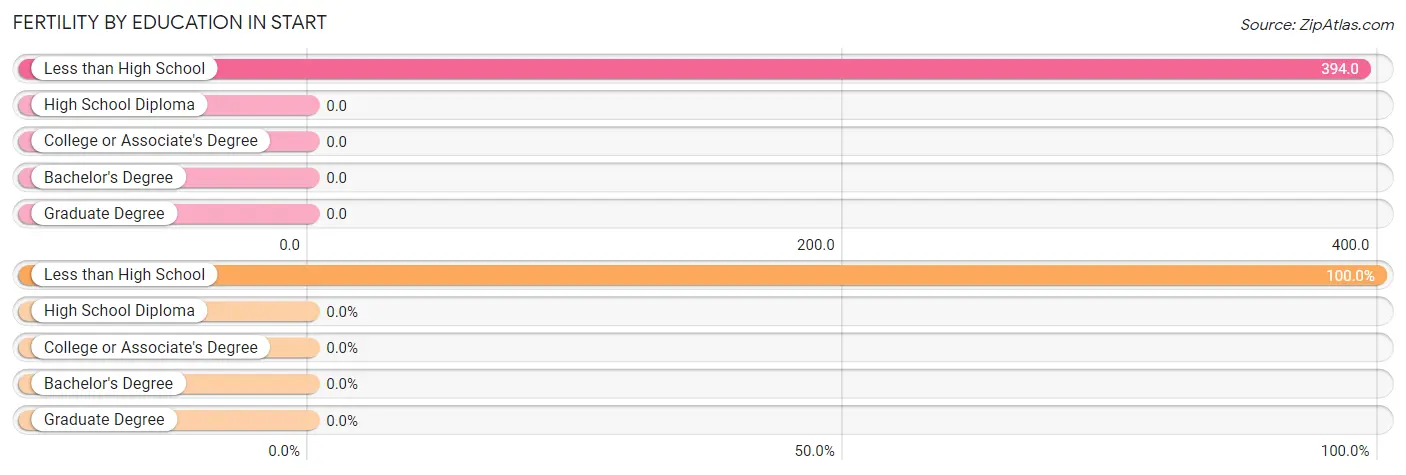
| Educational Attainment | Women with Births | Births / 1,000 Women |
| Less than High School | 39 (100.0%) | 394.0 |
| High School Diploma | 0 (0.0%) | 0.0 |
| College or Associate's Degree | 0 (0.0%) | 0.0 |
| Bachelor's Degree | 0 (0.0%) | 0.0 |
| Graduate Degree | 0 (0.0%) | 0.0 |
| Total | 39 (100.0%) | 164.0 |
Fertility by Education by Marriage Status in Start
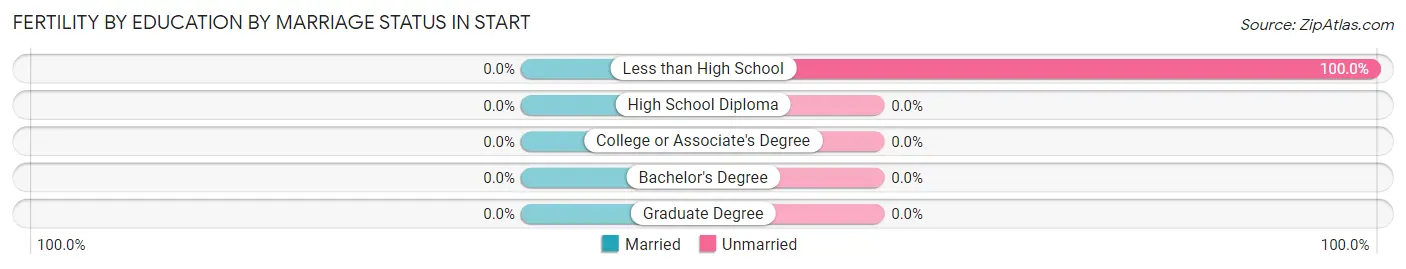
| Educational Attainment | Married | Unmarried |
| Less than High School | 0 (0.0%) | 39 (100.0%) |
| High School Diploma | 0 (0.0%) | 0 (0.0%) |
| College or Associate's Degree | 0 (0.0%) | 0 (0.0%) |
| Bachelor's Degree | 0 (0.0%) | 0 (0.0%) |
| Graduate Degree | 0 (0.0%) | 0 (0.0%) |
| Total | 0 (0.0%) | 39 (100.0%) |
Employment Characteristics in Start
Employment by Class of Employer in Start
Among the 398 employed individuals in Start, private company employees (249 | 62.6%), not-for-profit organizations (55 | 13.8%), and state government employees (45 | 11.3%) make up the most common classes of employment.
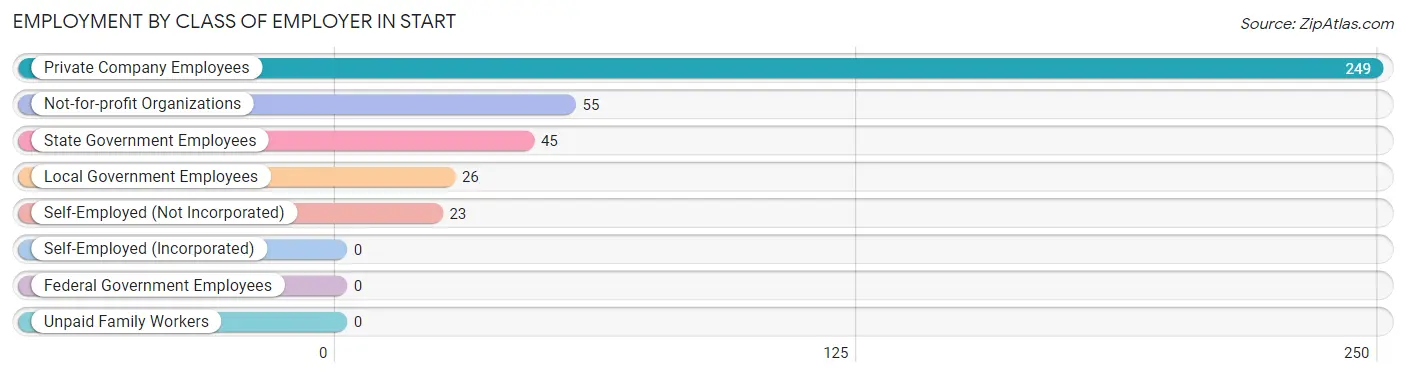
| Employer Class | # Employees | % Employees |
| Private Company Employees | 249 | 62.6% |
| Self-Employed (Incorporated) | 0 | 0.0% |
| Self-Employed (Not Incorporated) | 23 | 5.8% |
| Not-for-profit Organizations | 55 | 13.8% |
| Local Government Employees | 26 | 6.5% |
| State Government Employees | 45 | 11.3% |
| Federal Government Employees | 0 | 0.0% |
| Unpaid Family Workers | 0 | 0.0% |
| Total | 398 | 100.0% |
Employment Status by Age in Start
According to the labor force statistics for Start, out of the total population over 16 years of age (852), 47.8% or 407 individuals are in the labor force, with 2.2% or 9 of them unemployed. The age group with the highest labor force participation rate is 30 to 34 years, with 100.0% or 66 individuals in the labor force. Within the labor force, the 20 to 24 years age range has the highest percentage of unemployed individuals, with 20.5% or 9 of them being unemployed.
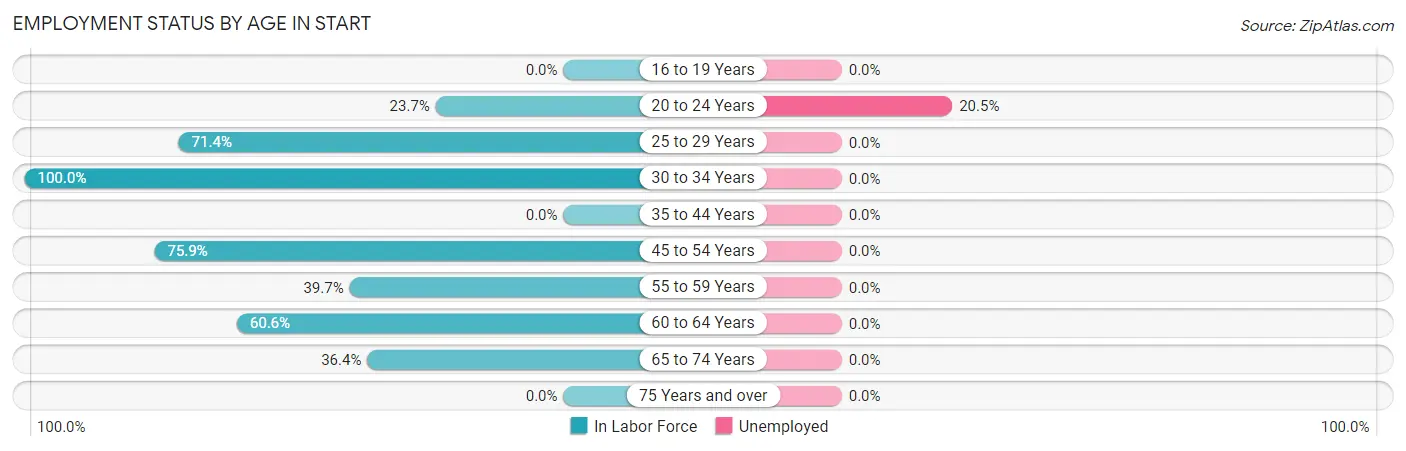
| Age Bracket | In Labor Force | Unemployed |
| 16 to 19 Years | 0 (0.0%) | 0 (0.0%) |
| 20 to 24 Years | 44 (23.7%) | 9 (20.5%) |
| 25 to 29 Years | 25 (71.4%) | 0 (0.0%) |
| 30 to 34 Years | 66 (100.0%) | 0 (0.0%) |
| 35 to 44 Years | 0 (0.0%) | 0 (0.0%) |
| 45 to 54 Years | 170 (75.9%) | 0 (0.0%) |
| 55 to 59 Years | 23 (39.7%) | 0 (0.0%) |
| 60 to 64 Years | 63 (60.6%) | 0 (0.0%) |
| 65 to 74 Years | 16 (36.4%) | 0 (0.0%) |
| 75 Years and over | 0 (0.0%) | 0 (0.0%) |
| Total | 407 (47.8%) | 9 (2.2%) |
Employment Status by Educational Attainment in Start
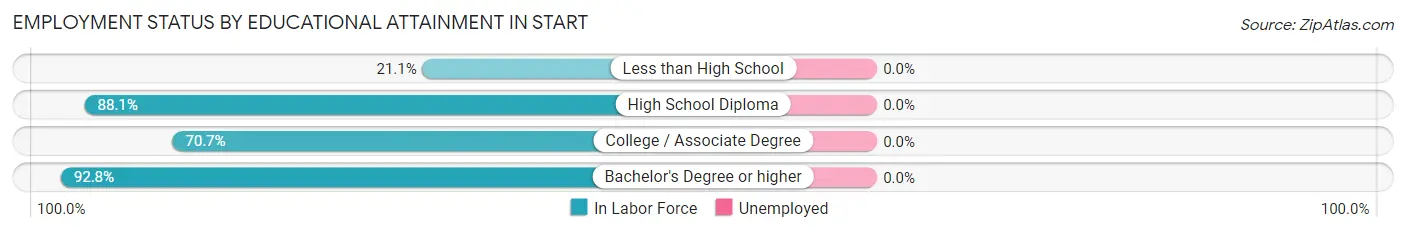
| Educational Attainment | In Labor Force | Unemployed |
| Less than High School | 23 (21.1%) | 0 (0.0%) |
| High School Diploma | 163 (88.1%) | 0 (0.0%) |
| College / Associate Degree | 58 (70.7%) | 0 (0.0%) |
| Bachelor's Degree or higher | 103 (92.8%) | 0 (0.0%) |
| Total | 347 (71.3%) | 0 (0.0%) |
Employment Occupations by Sex in Start
Management, Business, Science and Arts Occupations
The most common Management, Business, Science and Arts occupations in Start are Management (75 | 18.8%), Community & Social Service (49 | 12.3%), Education Instruction & Library (49 | 12.3%), Computers, Engineering & Science (25 | 6.3%), and Life, Physical & Social Science (25 | 6.3%).
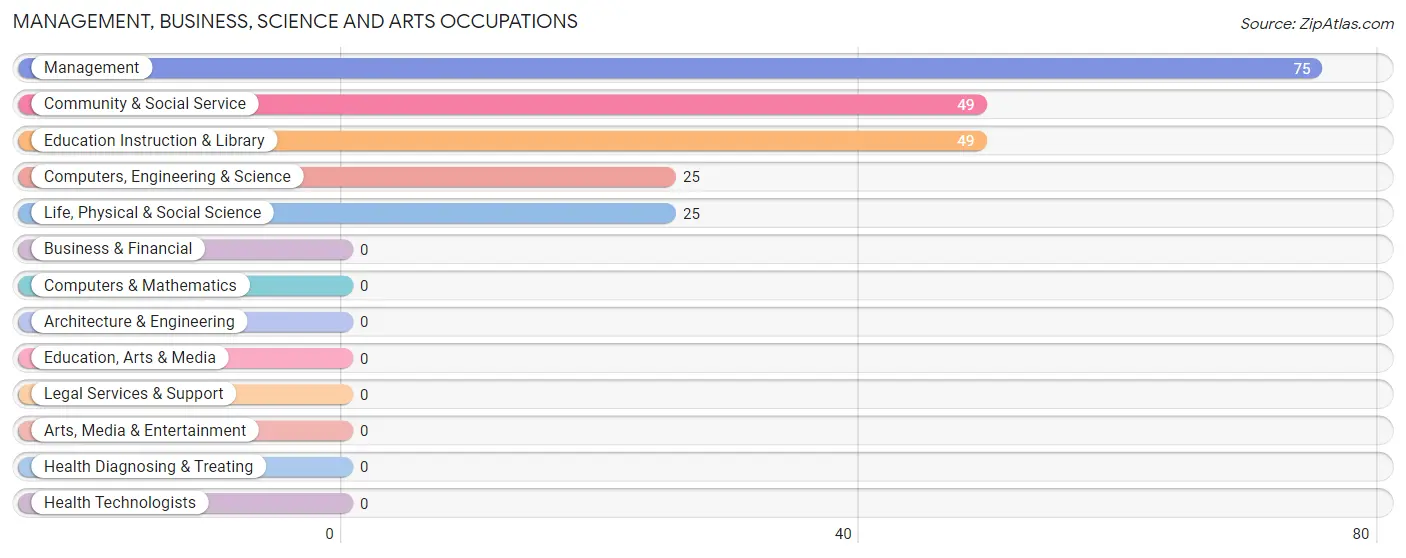
Management, Business, Science and Arts Occupations by Sex
Within the Management, Business, Science and Arts occupations in Start, the most male-oriented occupations are Computers, Engineering & Science (100.0%), Life, Physical & Social Science (100.0%), and Management (48.0%), while the most female-oriented occupations are Community & Social Service (100.0%), Education Instruction & Library (100.0%), and Management (52.0%).
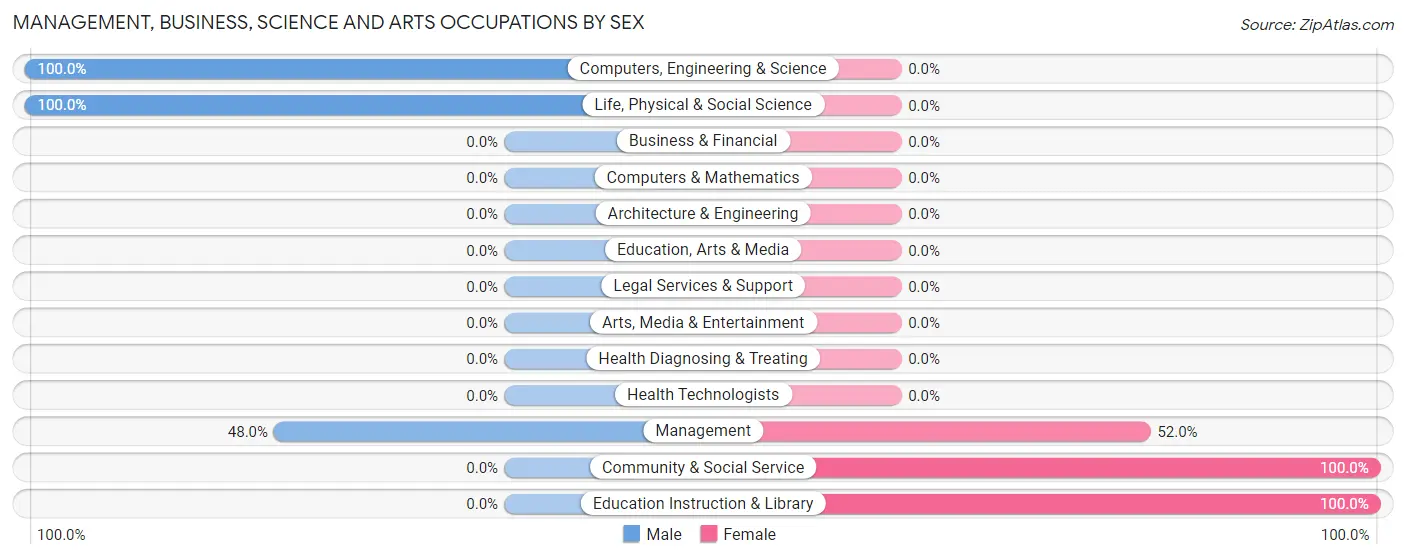
| Occupation | Male | Female |
| Management | 36 (48.0%) | 39 (52.0%) |
| Business & Financial | 0 (0.0%) | 0 (0.0%) |
| Computers, Engineering & Science | 25 (100.0%) | 0 (0.0%) |
| Computers & Mathematics | 0 (0.0%) | 0 (0.0%) |
| Architecture & Engineering | 0 (0.0%) | 0 (0.0%) |
| Life, Physical & Social Science | 25 (100.0%) | 0 (0.0%) |
| Community & Social Service | 0 (0.0%) | 49 (100.0%) |
| Education, Arts & Media | 0 (0.0%) | 0 (0.0%) |
| Legal Services & Support | 0 (0.0%) | 0 (0.0%) |
| Education Instruction & Library | 0 (0.0%) | 49 (100.0%) |
| Arts, Media & Entertainment | 0 (0.0%) | 0 (0.0%) |
| Health Diagnosing & Treating | 0 (0.0%) | 0 (0.0%) |
| Health Technologists | 0 (0.0%) | 0 (0.0%) |
| Total (Category) | 61 (40.9%) | 88 (59.1%) |
| Total (Overall) | 165 (41.5%) | 233 (58.5%) |
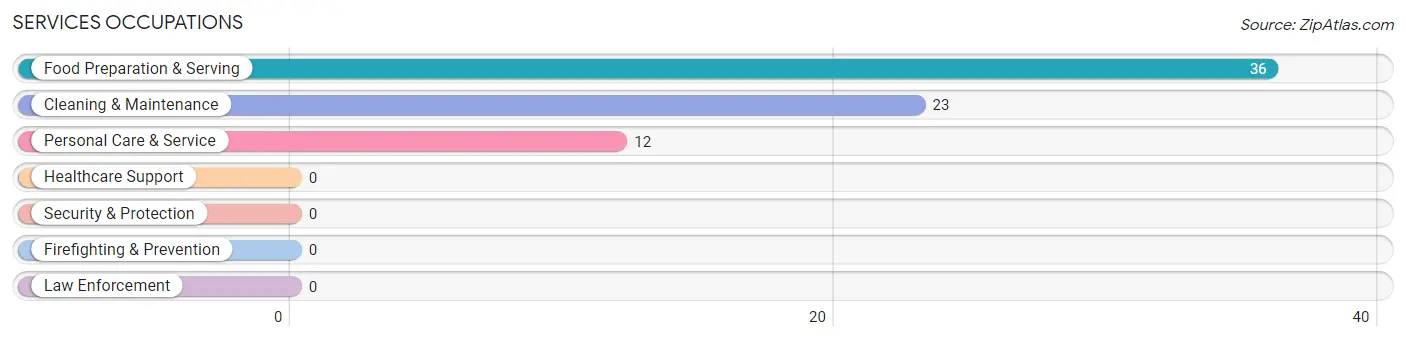
Services Occupations
The most common Services occupations in Start are Food Preparation & Serving (36 | 9.0%), Cleaning & Maintenance (23 | 5.8%), and Personal Care & Service (12 | 3.0%).
Services Occupations by Sex
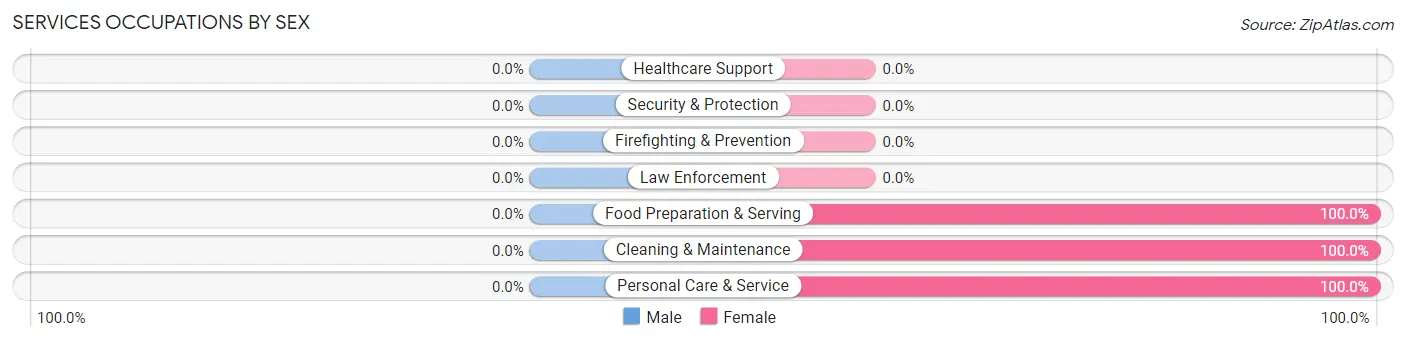
| Occupation | Male | Female |
| Healthcare Support | 0 (0.0%) | 0 (0.0%) |
| Security & Protection | 0 (0.0%) | 0 (0.0%) |
| Firefighting & Prevention | 0 (0.0%) | 0 (0.0%) |
| Law Enforcement | 0 (0.0%) | 0 (0.0%) |
| Food Preparation & Serving | 0 (0.0%) | 36 (100.0%) |
| Cleaning & Maintenance | 0 (0.0%) | 23 (100.0%) |
| Personal Care & Service | 0 (0.0%) | 12 (100.0%) |
| Total (Category) | 0 (0.0%) | 71 (100.0%) |
| Total (Overall) | 165 (41.5%) | 233 (58.5%) |
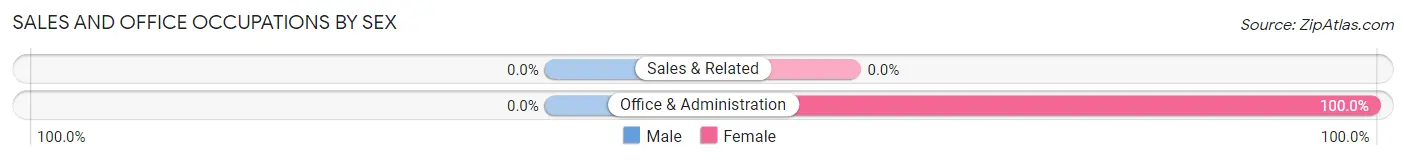
Sales and Office Occupations
The most common Sales and Office occupations in Start are , and Office & Administration (54 | 13.6%).
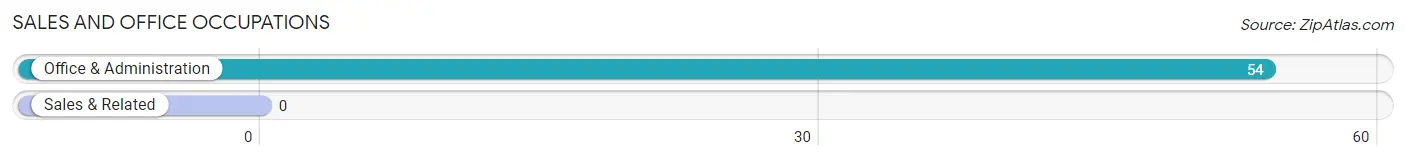
Sales and Office Occupations by Sex
| Occupation | Male | Female |
| Sales & Related | 0 (0.0%) | 0 (0.0%) |
| Office & Administration | 0 (0.0%) | 54 (100.0%) |
| Total (Category) | 0 (0.0%) | 54 (100.0%) |
| Total (Overall) | 165 (41.5%) | 233 (58.5%) |
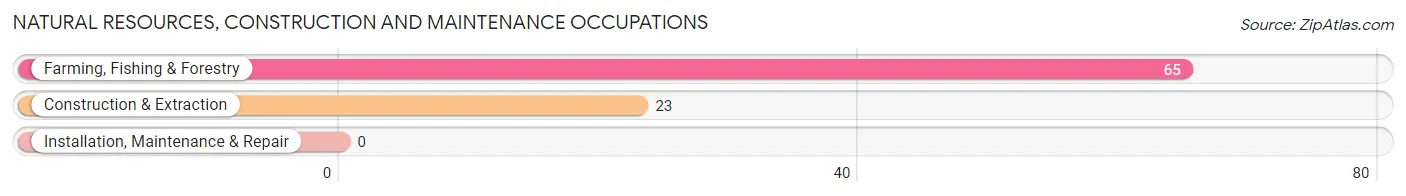
Natural Resources, Construction and Maintenance Occupations
The most common Natural Resources, Construction and Maintenance occupations in Start are Farming, Fishing & Forestry (65 | 16.3%), and Construction & Extraction (23 | 5.8%).
Natural Resources, Construction and Maintenance Occupations by Sex
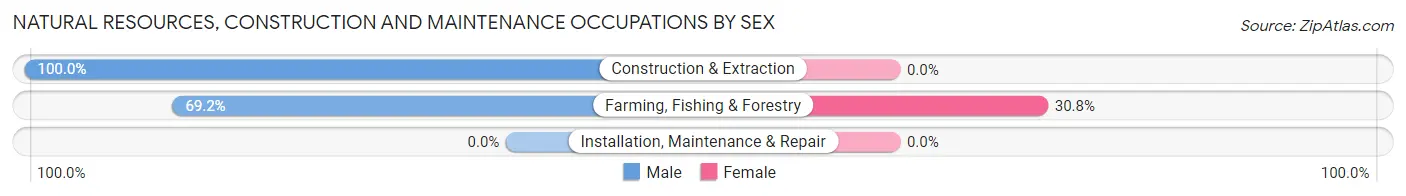
| Occupation | Male | Female |
| Farming, Fishing & Forestry | 45 (69.2%) | 20 (30.8%) |
| Construction & Extraction | 23 (100.0%) | 0 (0.0%) |
| Installation, Maintenance & Repair | 0 (0.0%) | 0 (0.0%) |
| Total (Category) | 68 (77.3%) | 20 (22.7%) |
| Total (Overall) | 165 (41.5%) | 233 (58.5%) |
Production, Transportation and Moving Occupations
The most common Production, Transportation and Moving occupations in Start are Transportation (23 | 5.8%), Material Moving (7 | 1.8%), and Production (6 | 1.5%).
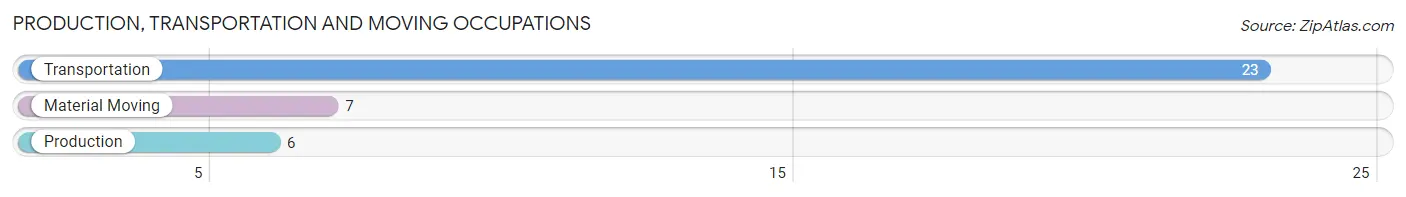
Production, Transportation and Moving Occupations by Sex
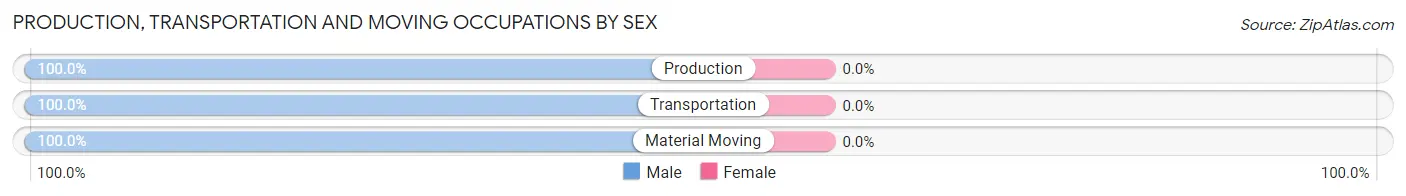
| Occupation | Male | Female |
| Production | 6 (100.0%) | 0 (0.0%) |
| Transportation | 23 (100.0%) | 0 (0.0%) |
| Material Moving | 7 (100.0%) | 0 (0.0%) |
| Total (Category) | 36 (100.0%) | 0 (0.0%) |
| Total (Overall) | 165 (41.5%) | 233 (58.5%) |
Employment Industries by Sex in Start
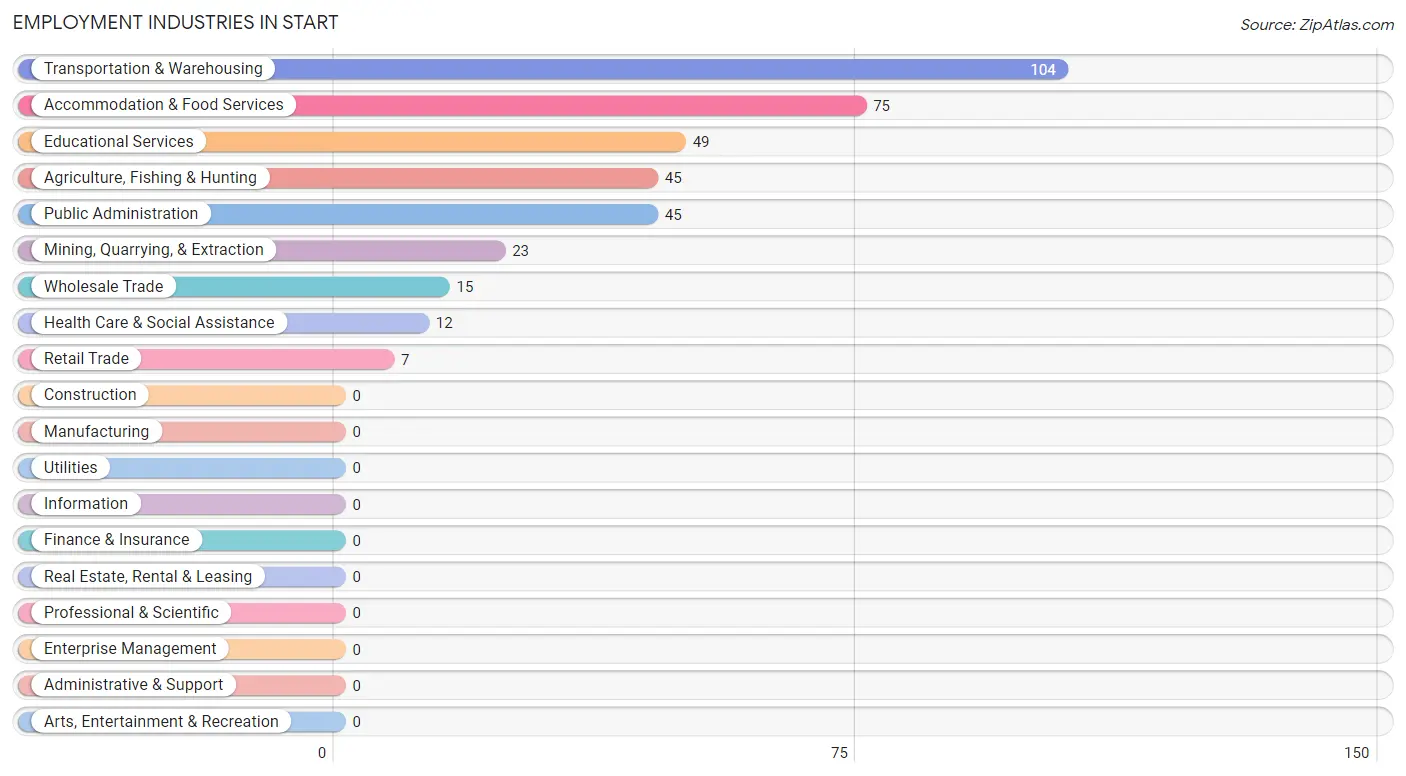
Employment Industries in Start
The major employment industries in Start include Transportation & Warehousing (104 | 26.1%), Accommodation & Food Services (75 | 18.8%), Educational Services (49 | 12.3%), Agriculture, Fishing & Hunting (45 | 11.3%), and Public Administration (45 | 11.3%).
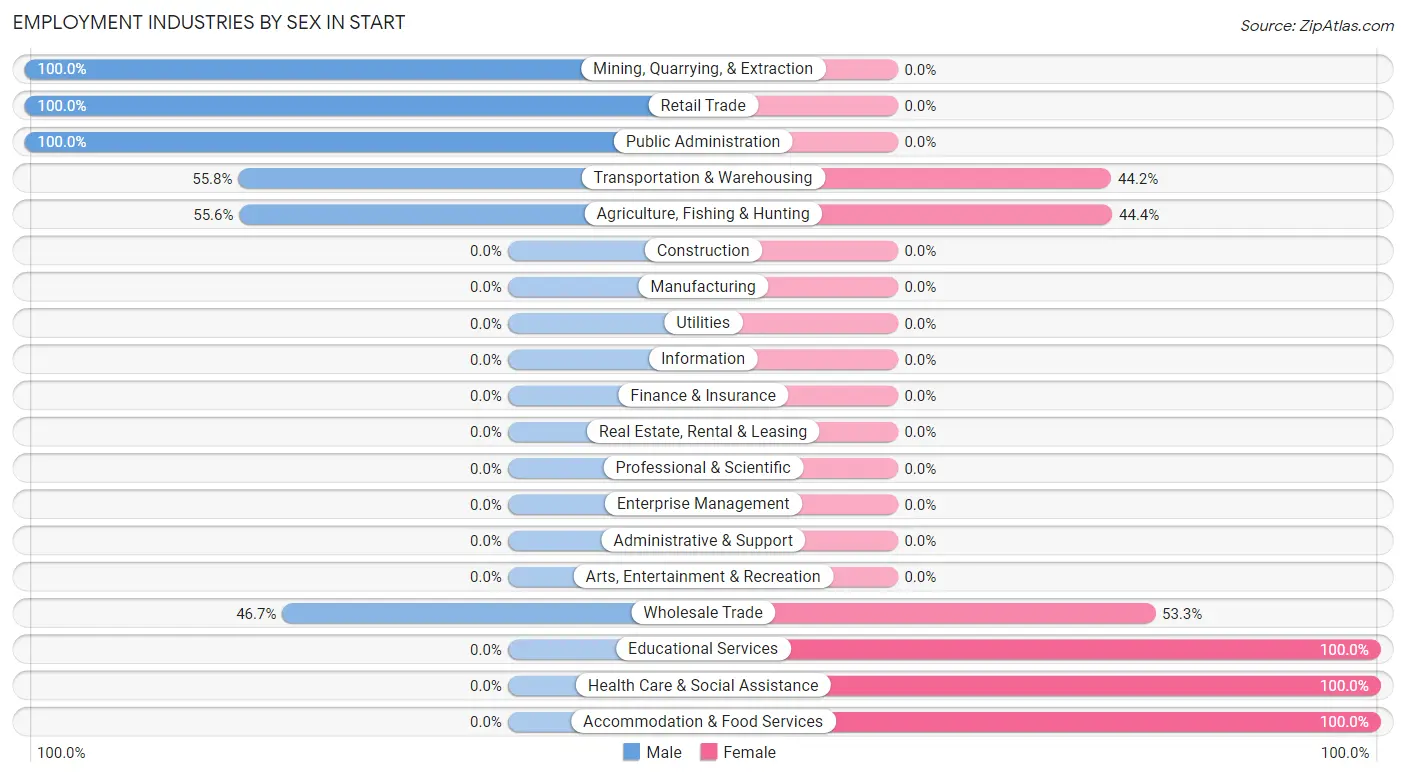
Employment Industries by Sex in Start
The Start industries that see more men than women are Mining, Quarrying, & Extraction (100.0%), Retail Trade (100.0%), and Public Administration (100.0%), whereas the industries that tend to have a higher number of women are Educational Services (100.0%), Health Care & Social Assistance (100.0%), and Accommodation & Food Services (100.0%).
| Industry | Male | Female |
| Agriculture, Fishing & Hunting | 25 (55.6%) | 20 (44.4%) |
| Mining, Quarrying, & Extraction | 23 (100.0%) | 0 (0.0%) |
| Construction | 0 (0.0%) | 0 (0.0%) |
| Manufacturing | 0 (0.0%) | 0 (0.0%) |
| Wholesale Trade | 7 (46.7%) | 8 (53.3%) |
| Retail Trade | 7 (100.0%) | 0 (0.0%) |
| Transportation & Warehousing | 58 (55.8%) | 46 (44.2%) |
| Utilities | 0 (0.0%) | 0 (0.0%) |
| Information | 0 (0.0%) | 0 (0.0%) |
| Finance & Insurance | 0 (0.0%) | 0 (0.0%) |
| Real Estate, Rental & Leasing | 0 (0.0%) | 0 (0.0%) |
| Professional & Scientific | 0 (0.0%) | 0 (0.0%) |
| Enterprise Management | 0 (0.0%) | 0 (0.0%) |
| Administrative & Support | 0 (0.0%) | 0 (0.0%) |
| Educational Services | 0 (0.0%) | 49 (100.0%) |
| Health Care & Social Assistance | 0 (0.0%) | 12 (100.0%) |
| Arts, Entertainment & Recreation | 0 (0.0%) | 0 (0.0%) |
| Accommodation & Food Services | 0 (0.0%) | 75 (100.0%) |
| Public Administration | 45 (100.0%) | 0 (0.0%) |
| Total | 165 (41.5%) | 233 (58.5%) |
Education in Start
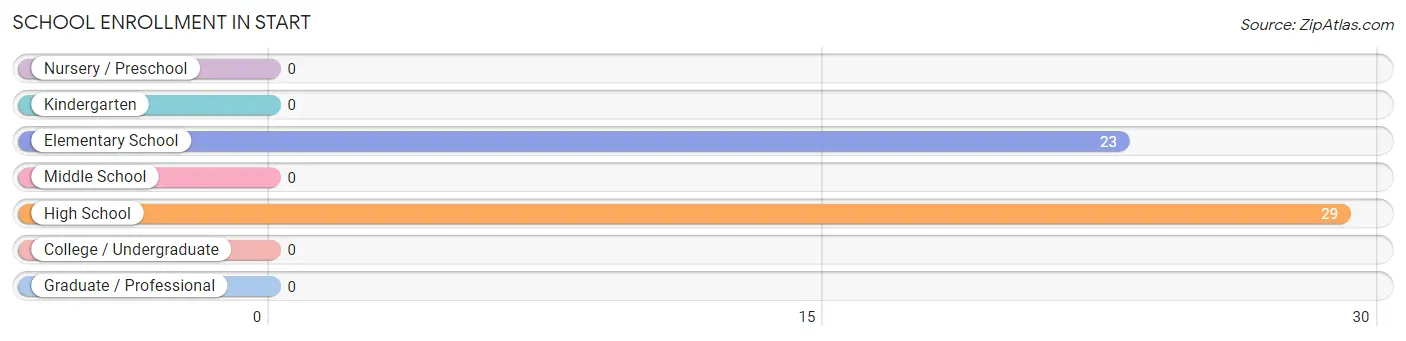
School Enrollment in Start
The most common levels of schooling among the 52 students in Start are high school (29 | 55.8%), and elementary school (23 | 44.2%).
| School Level | # Students | % Students |
| Nursery / Preschool | 0 | 0.0% |
| Kindergarten | 0 | 0.0% |
| Elementary School | 23 | 44.2% |
| Middle School | 0 | 0.0% |
| High School | 29 | 55.8% |
| College / Undergraduate | 0 | 0.0% |
| Graduate / Professional | 0 | 0.0% |
| Total | 52 | 100.0% |
School Enrollment by Age by Funding Source in Start
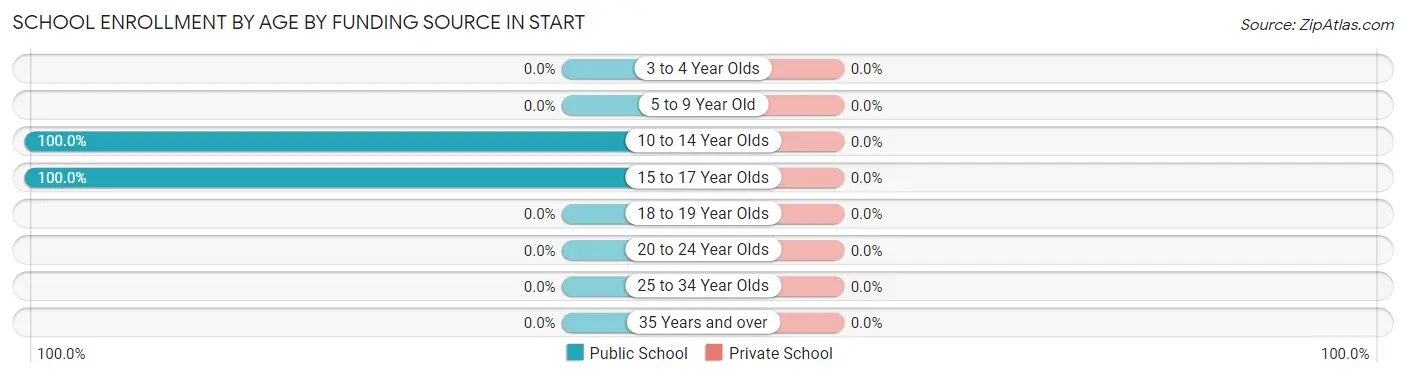
| Age Bracket | Public School | Private School |
| 3 to 4 Year Olds | 0 (0.0%) | 0 (0.0%) |
| 5 to 9 Year Old | 0 (0.0%) | 0 (0.0%) |
| 10 to 14 Year Olds | 23 (100.0%) | 0 (0.0%) |
| 15 to 17 Year Olds | 29 (100.0%) | 0 (0.0%) |
| 18 to 19 Year Olds | 0 (0.0%) | 0 (0.0%) |
| 20 to 24 Year Olds | 0 (0.0%) | 0 (0.0%) |
| 25 to 34 Year Olds | 0 (0.0%) | 0 (0.0%) |
| 35 Years and over | 0 (0.0%) | 0 (0.0%) |
| Total | 52 (100.0%) | 0 (0.0%) |
Educational Attainment by Field of Study in Start
Education (49 | 38.3%), bio, nature & agricultural (40 | 31.2%), business (29 | 22.7%), and liberal arts & history (10 | 7.8%) are the most common fields of study among 128 individuals in Start who have obtained a bachelor's degree or higher.
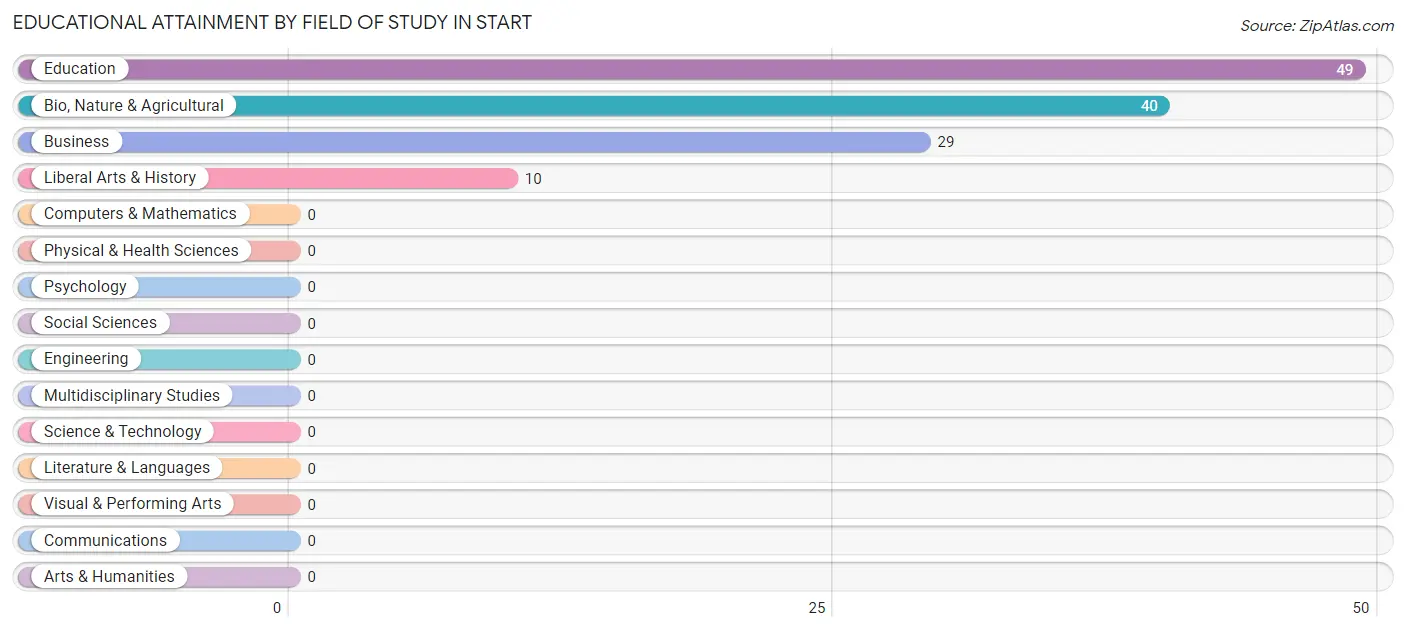
| Field of Study | # Graduates | % Graduates |
| Computers & Mathematics | 0 | 0.0% |
| Bio, Nature & Agricultural | 40 | 31.2% |
| Physical & Health Sciences | 0 | 0.0% |
| Psychology | 0 | 0.0% |
| Social Sciences | 0 | 0.0% |
| Engineering | 0 | 0.0% |
| Multidisciplinary Studies | 0 | 0.0% |
| Science & Technology | 0 | 0.0% |
| Business | 29 | 22.7% |
| Education | 49 | 38.3% |
| Literature & Languages | 0 | 0.0% |
| Liberal Arts & History | 10 | 7.8% |
| Visual & Performing Arts | 0 | 0.0% |
| Communications | 0 | 0.0% |
| Arts & Humanities | 0 | 0.0% |
| Total | 128 | 100.0% |
Transportation & Commute in Start
Vehicle Availability by Sex in Start
The most prevalent vehicle ownership categories in Start are males with 2 vehicles (120, accounting for 72.7%) and females with 2 vehicles (89, making up 51.5%).
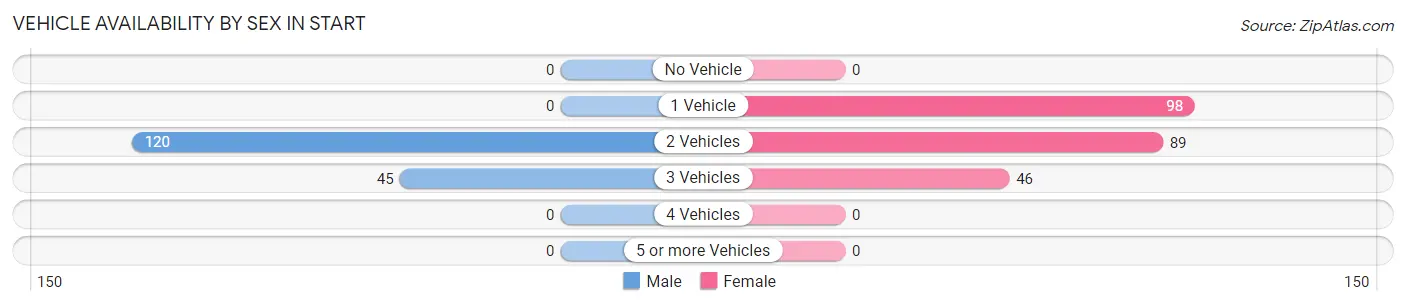
| Vehicles Available | Male | Female |
| No Vehicle | 0 (0.0%) | 0 (0.0%) |
| 1 Vehicle | 0 (0.0%) | 98 (42.1%) |
| 2 Vehicles | 120 (72.7%) | 89 (38.2%) |
| 3 Vehicles | 45 (27.3%) | 46 (19.7%) |
| 4 Vehicles | 0 (0.0%) | 0 (0.0%) |
| 5 or more Vehicles | 0 (0.0%) | 0 (0.0%) |
| Total | 165 (100.0%) | 233 (100.0%) |
Commute Time in Start
The most frequently occuring commute durations in Start are 5 to 9 minutes (69 commuters, 18.5%), 15 to 19 minutes (62 commuters, 16.6%), and 25 to 29 minutes (59 commuters, 15.8%).
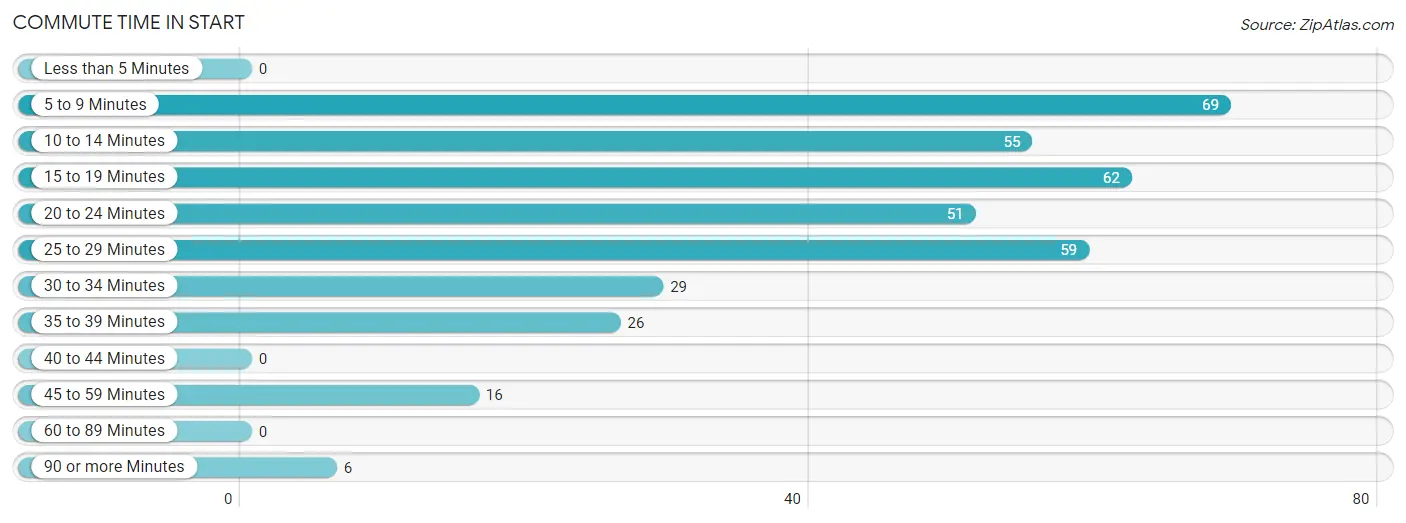
| Commute Time | # Commuters | % Commuters |
| Less than 5 Minutes | 0 | 0.0% |
| 5 to 9 Minutes | 69 | 18.5% |
| 10 to 14 Minutes | 55 | 14.7% |
| 15 to 19 Minutes | 62 | 16.6% |
| 20 to 24 Minutes | 51 | 13.7% |
| 25 to 29 Minutes | 59 | 15.8% |
| 30 to 34 Minutes | 29 | 7.8% |
| 35 to 39 Minutes | 26 | 7.0% |
| 40 to 44 Minutes | 0 | 0.0% |
| 45 to 59 Minutes | 16 | 4.3% |
| 60 to 89 Minutes | 0 | 0.0% |
| 90 or more Minutes | 6 | 1.6% |
Commute Time by Sex in Start
The most common commute times in Start are 25 to 29 minutes (59 commuters, 42.1%) for males and 15 to 19 minutes (62 commuters, 26.6%) for females.
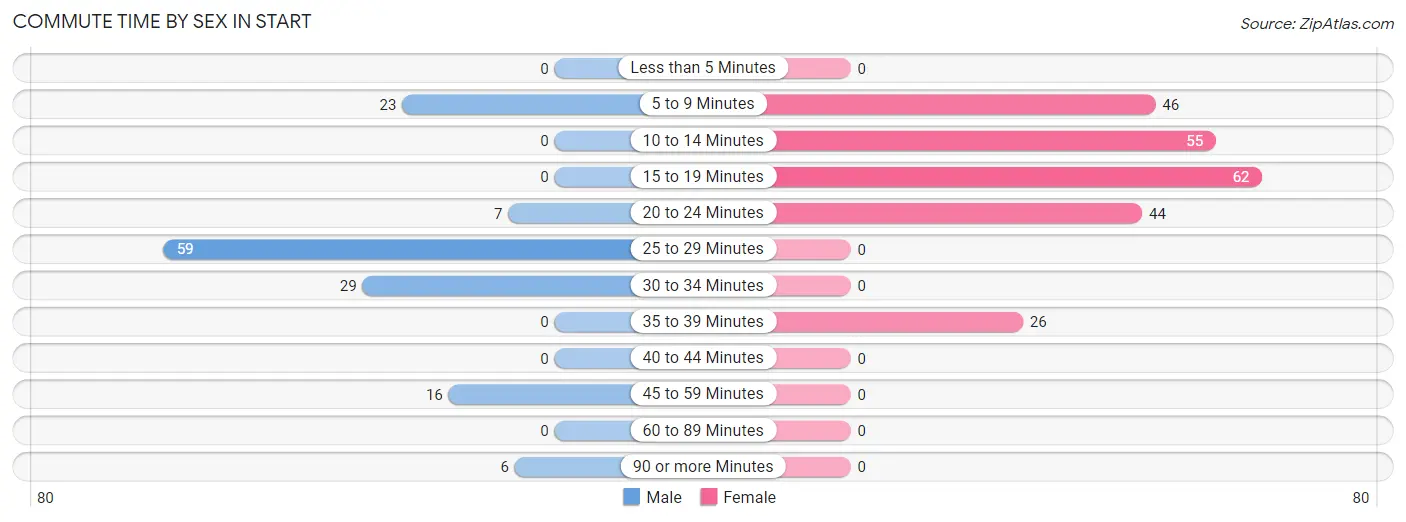
| Commute Time | Male | Female |
| Less than 5 Minutes | 0 (0.0%) | 0 (0.0%) |
| 5 to 9 Minutes | 23 (16.4%) | 46 (19.7%) |
| 10 to 14 Minutes | 0 (0.0%) | 55 (23.6%) |
| 15 to 19 Minutes | 0 (0.0%) | 62 (26.6%) |
| 20 to 24 Minutes | 7 (5.0%) | 44 (18.9%) |
| 25 to 29 Minutes | 59 (42.1%) | 0 (0.0%) |
| 30 to 34 Minutes | 29 (20.7%) | 0 (0.0%) |
| 35 to 39 Minutes | 0 (0.0%) | 26 (11.2%) |
| 40 to 44 Minutes | 0 (0.0%) | 0 (0.0%) |
| 45 to 59 Minutes | 16 (11.4%) | 0 (0.0%) |
| 60 to 89 Minutes | 0 (0.0%) | 0 (0.0%) |
| 90 or more Minutes | 6 (4.3%) | 0 (0.0%) |
Time of Departure to Work by Sex in Start
The most frequent times of departure to work in Start are 8:00 AM to 8:29 AM (45, 32.1%) for males and 12:00 PM to 3:59 PM (48, 20.6%) for females.
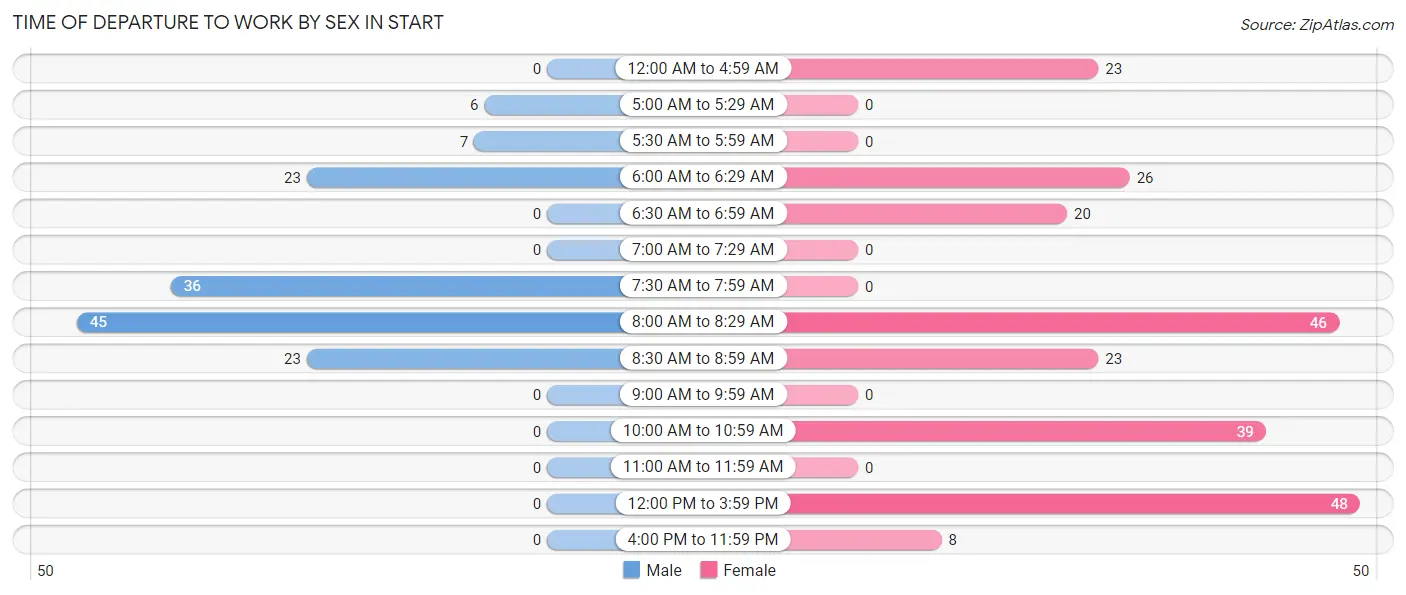
| Time of Departure | Male | Female |
| 12:00 AM to 4:59 AM | 0 (0.0%) | 23 (9.9%) |
| 5:00 AM to 5:29 AM | 6 (4.3%) | 0 (0.0%) |
| 5:30 AM to 5:59 AM | 7 (5.0%) | 0 (0.0%) |
| 6:00 AM to 6:29 AM | 23 (16.4%) | 26 (11.2%) |
| 6:30 AM to 6:59 AM | 0 (0.0%) | 20 (8.6%) |
| 7:00 AM to 7:29 AM | 0 (0.0%) | 0 (0.0%) |
| 7:30 AM to 7:59 AM | 36 (25.7%) | 0 (0.0%) |
| 8:00 AM to 8:29 AM | 45 (32.1%) | 46 (19.7%) |
| 8:30 AM to 8:59 AM | 23 (16.4%) | 23 (9.9%) |
| 9:00 AM to 9:59 AM | 0 (0.0%) | 0 (0.0%) |
| 10:00 AM to 10:59 AM | 0 (0.0%) | 39 (16.7%) |
| 11:00 AM to 11:59 AM | 0 (0.0%) | 0 (0.0%) |
| 12:00 PM to 3:59 PM | 0 (0.0%) | 48 (20.6%) |
| 4:00 PM to 11:59 PM | 0 (0.0%) | 8 (3.4%) |
| Total | 140 (100.0%) | 233 (100.0%) |
Housing Occupancy in Start
Occupancy by Ownership in Start
Of the total 555 dwellings in Start, owner-occupied units account for 265 (47.7%), while renter-occupied units make up 290 (52.2%).
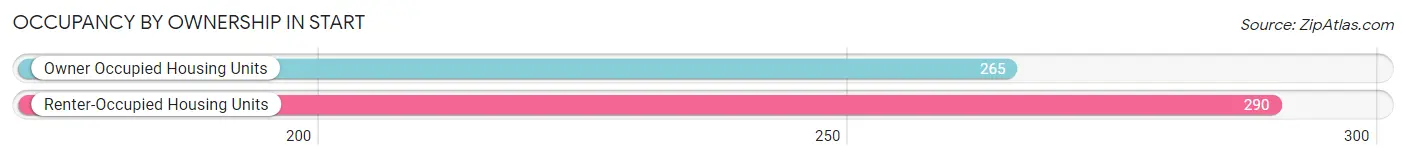
| Occupancy | # Housing Units | % Housing Units |
| Owner Occupied Housing Units | 265 | 47.7% |
| Renter-Occupied Housing Units | 290 | 52.2% |
| Total Occupied Housing Units | 555 | 100.0% |
Occupancy by Household Size in Start
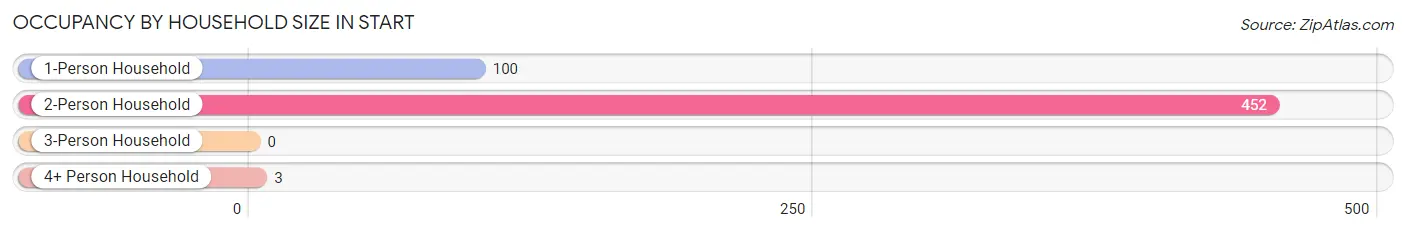
| Household Size | # Housing Units | % Housing Units |
| 1-Person Household | 100 | 18.0% |
| 2-Person Household | 452 | 81.4% |
| 3-Person Household | 0 | 0.0% |
| 4+ Person Household | 3 | 0.5% |
| Total Housing Units | 555 | 100.0% |
Occupancy by Ownership by Household Size in Start
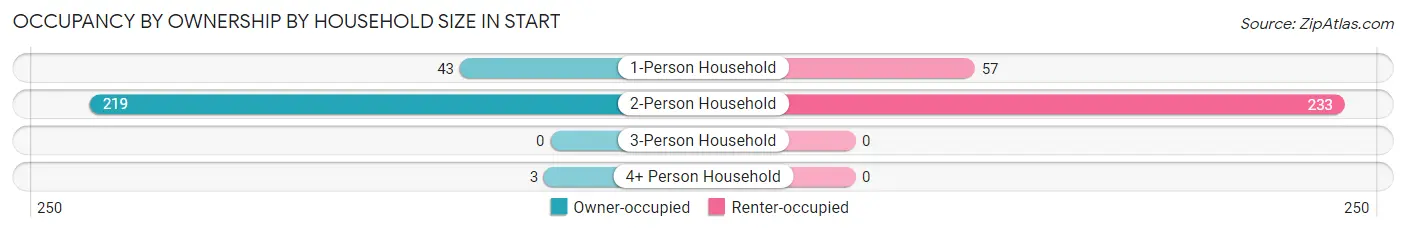
| Household Size | Owner-occupied | Renter-occupied |
| 1-Person Household | 43 (43.0%) | 57 (57.0%) |
| 2-Person Household | 219 (48.4%) | 233 (51.5%) |
| 3-Person Household | 0 (0.0%) | 0 (0.0%) |
| 4+ Person Household | 3 (100.0%) | 0 (0.0%) |
| Total Housing Units | 265 (47.7%) | 290 (52.2%) |
Occupancy by Educational Attainment in Start
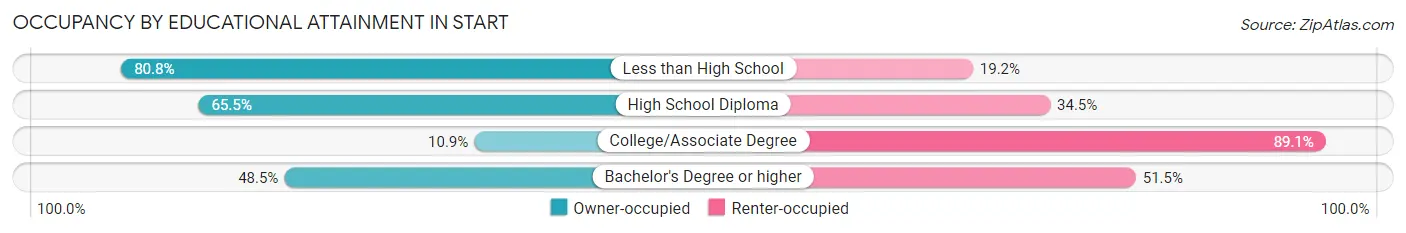
| Household Size | Owner-occupied | Renter-occupied |
| Less than High School | 97 (80.8%) | 23 (19.2%) |
| High School Diploma | 114 (65.5%) | 60 (34.5%) |
| College/Associate Degree | 21 (10.9%) | 172 (89.1%) |
| Bachelor's Degree or higher | 33 (48.5%) | 35 (51.5%) |
Occupancy by Age of Householder in Start
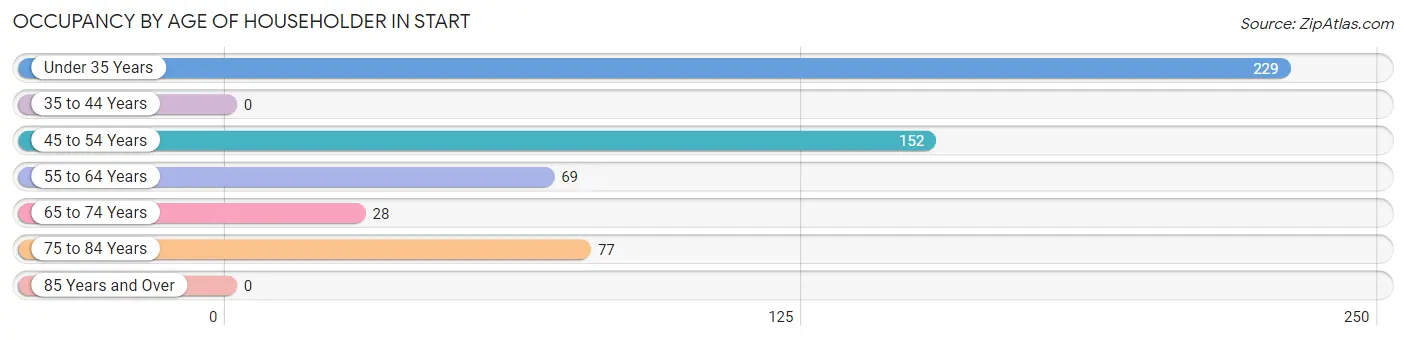
| Age Bracket | # Households | % Households |
| Under 35 Years | 229 | 41.3% |
| 35 to 44 Years | 0 | 0.0% |
| 45 to 54 Years | 152 | 27.4% |
| 55 to 64 Years | 69 | 12.4% |
| 65 to 74 Years | 28 | 5.1% |
| 75 to 84 Years | 77 | 13.9% |
| 85 Years and Over | 0 | 0.0% |
| Total | 555 | 100.0% |
Housing Finances in Start
Median Income by Occupancy in Start
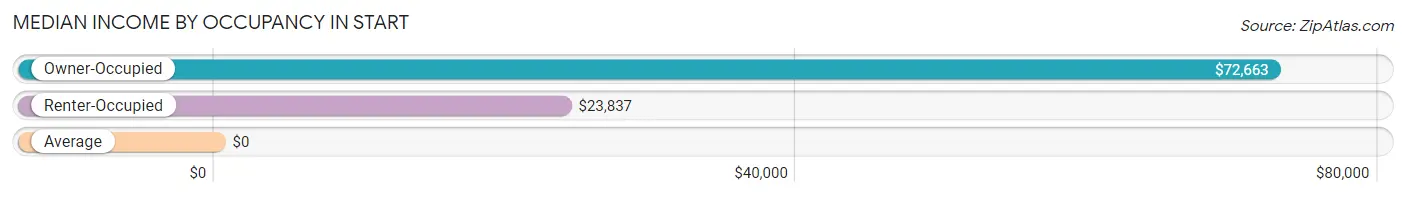
| Occupancy Type | # Households | Median Income |
| Owner-Occupied | 265 (47.7%) | $72,663 |
| Renter-Occupied | 290 (52.2%) | $23,837 |
| Average | 555 (100.0%) | $0 |
Occupancy by Householder Income Bracket in Start
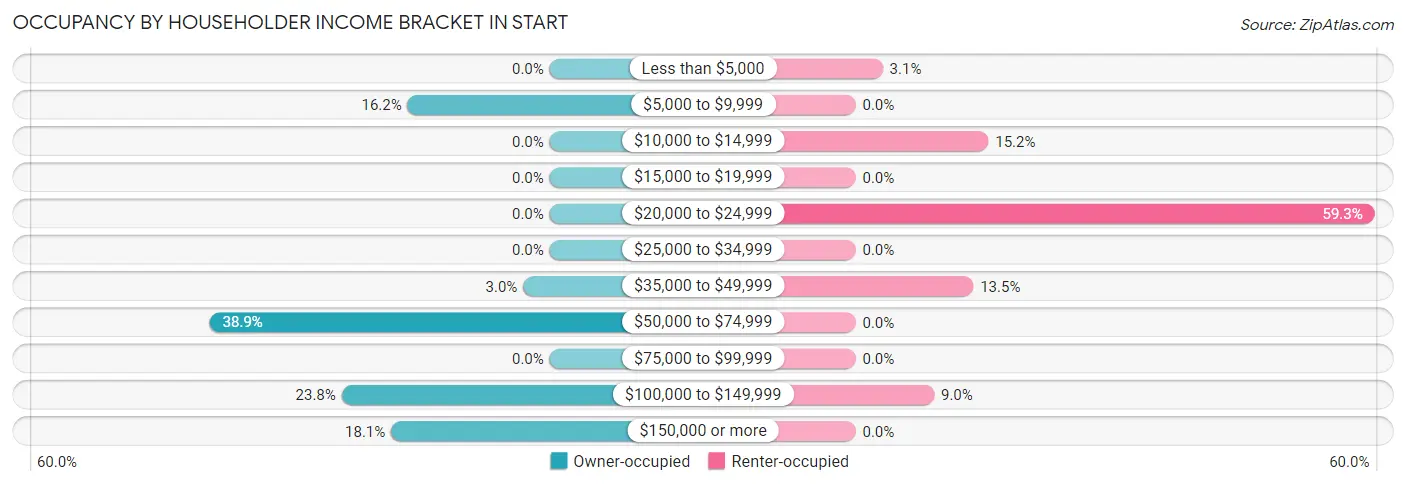
| Income Bracket | Owner-occupied | Renter-occupied |
| Less than $5,000 | 0 (0.0%) | 9 (3.1%) |
| $5,000 to $9,999 | 43 (16.2%) | 0 (0.0%) |
| $10,000 to $14,999 | 0 (0.0%) | 44 (15.2%) |
| $15,000 to $19,999 | 0 (0.0%) | 0 (0.0%) |
| $20,000 to $24,999 | 0 (0.0%) | 172 (59.3%) |
| $25,000 to $34,999 | 0 (0.0%) | 0 (0.0%) |
| $35,000 to $49,999 | 8 (3.0%) | 39 (13.5%) |
| $50,000 to $74,999 | 103 (38.9%) | 0 (0.0%) |
| $75,000 to $99,999 | 0 (0.0%) | 0 (0.0%) |
| $100,000 to $149,999 | 63 (23.8%) | 26 (9.0%) |
| $150,000 or more | 48 (18.1%) | 0 (0.0%) |
| Total | 265 (100.0%) | 290 (100.0%) |
Monthly Housing Cost Tiers in Start
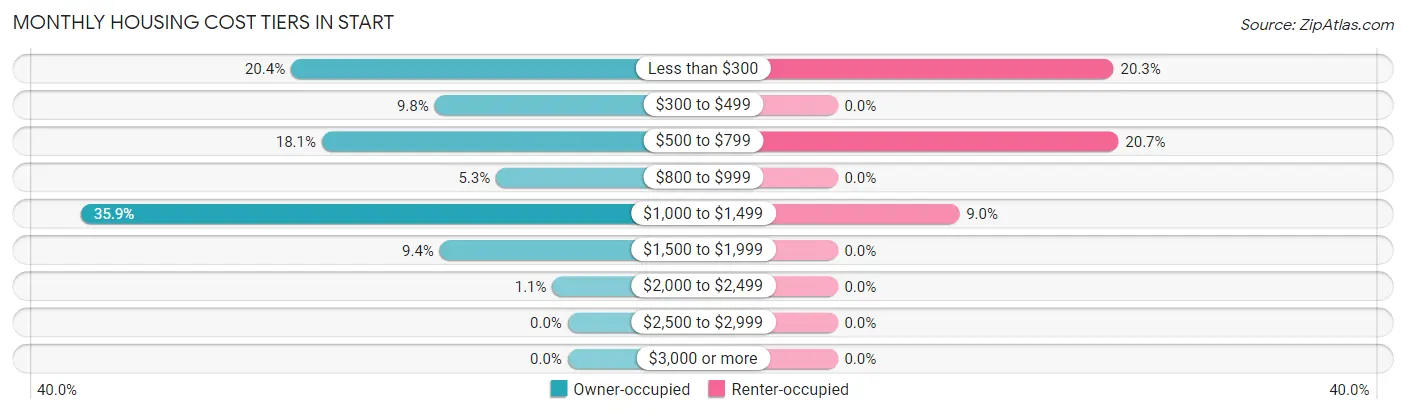
| Monthly Cost | Owner-occupied | Renter-occupied |
| Less than $300 | 54 (20.4%) | 59 (20.3%) |
| $300 to $499 | 26 (9.8%) | 0 (0.0%) |
| $500 to $799 | 48 (18.1%) | 60 (20.7%) |
| $800 to $999 | 14 (5.3%) | 0 (0.0%) |
| $1,000 to $1,499 | 95 (35.8%) | 26 (9.0%) |
| $1,500 to $1,999 | 25 (9.4%) | 0 (0.0%) |
| $2,000 to $2,499 | 3 (1.1%) | 0 (0.0%) |
| $2,500 to $2,999 | 0 (0.0%) | 0 (0.0%) |
| $3,000 or more | 0 (0.0%) | 0 (0.0%) |
| Total | 265 (100.0%) | 290 (100.0%) |
Physical Housing Characteristics in Start
Housing Structures in Start
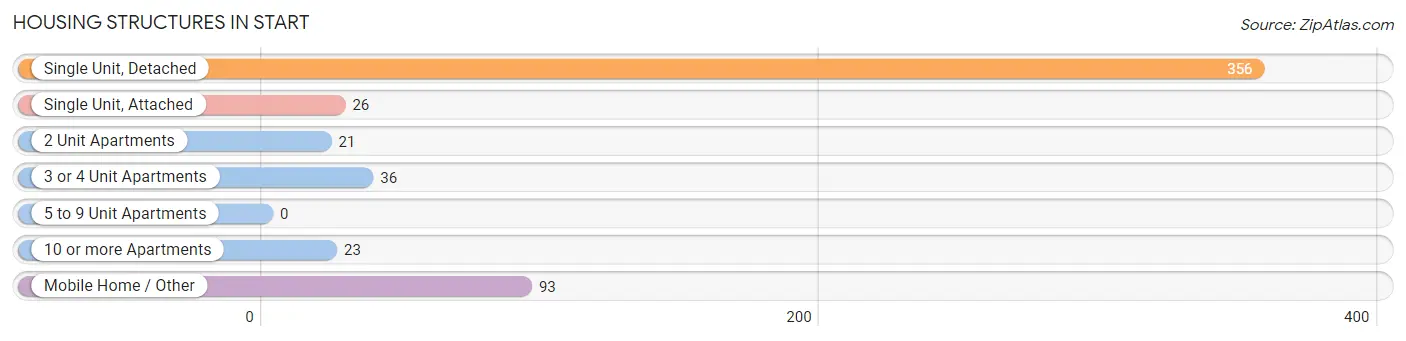
| Structure Type | # Housing Units | % Housing Units |
| Single Unit, Detached | 356 | 64.1% |
| Single Unit, Attached | 26 | 4.7% |
| 2 Unit Apartments | 21 | 3.8% |
| 3 or 4 Unit Apartments | 36 | 6.5% |
| 5 to 9 Unit Apartments | 0 | 0.0% |
| 10 or more Apartments | 23 | 4.1% |
| Mobile Home / Other | 93 | 16.8% |
| Total | 555 | 100.0% |
Housing Structures by Occupancy in Start
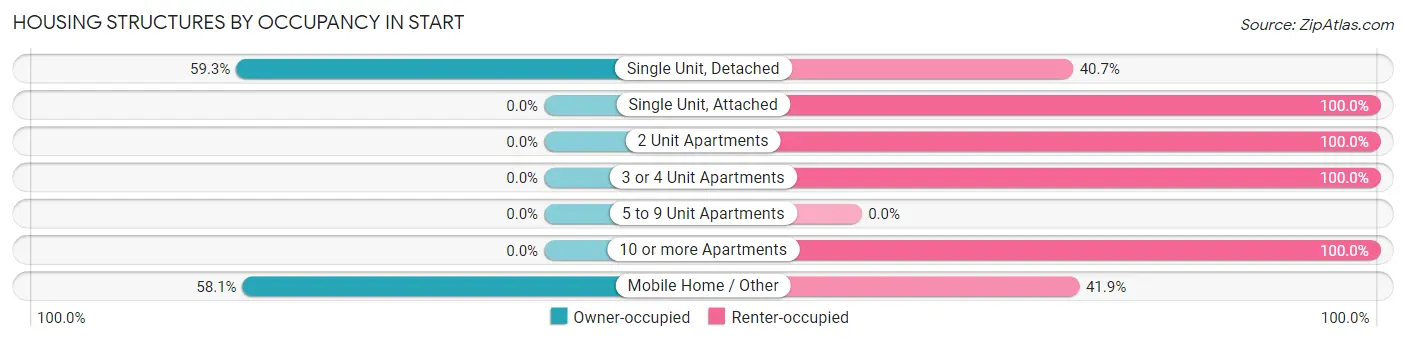
| Structure Type | Owner-occupied | Renter-occupied |
| Single Unit, Detached | 211 (59.3%) | 145 (40.7%) |
| Single Unit, Attached | 0 (0.0%) | 26 (100.0%) |
| 2 Unit Apartments | 0 (0.0%) | 21 (100.0%) |
| 3 or 4 Unit Apartments | 0 (0.0%) | 36 (100.0%) |
| 5 to 9 Unit Apartments | 0 (0.0%) | 0 (0.0%) |
| 10 or more Apartments | 0 (0.0%) | 23 (100.0%) |
| Mobile Home / Other | 54 (58.1%) | 39 (41.9%) |
| Total | 265 (47.7%) | 290 (52.2%) |
Housing Structures by Number of Rooms in Start
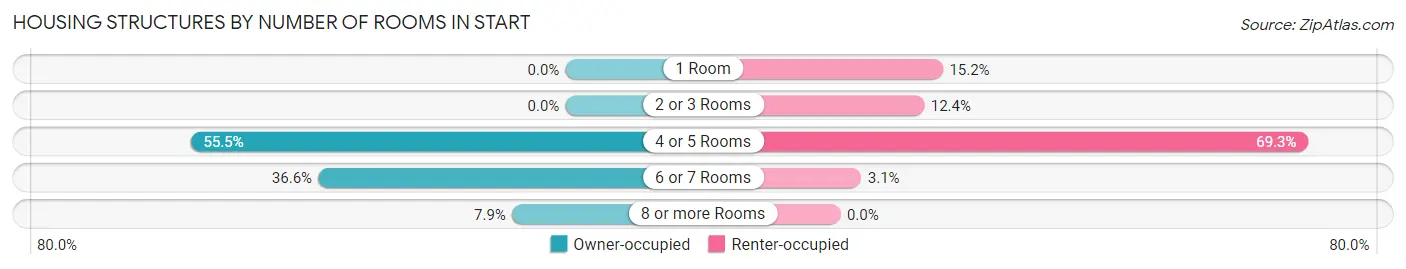
| Number of Rooms | Owner-occupied | Renter-occupied |
| 1 Room | 0 (0.0%) | 44 (15.2%) |
| 2 or 3 Rooms | 0 (0.0%) | 36 (12.4%) |
| 4 or 5 Rooms | 147 (55.5%) | 201 (69.3%) |
| 6 or 7 Rooms | 97 (36.6%) | 9 (3.1%) |
| 8 or more Rooms | 21 (7.9%) | 0 (0.0%) |
| Total | 265 (100.0%) | 290 (100.0%) |
Housing Structure by Heating Type in Start
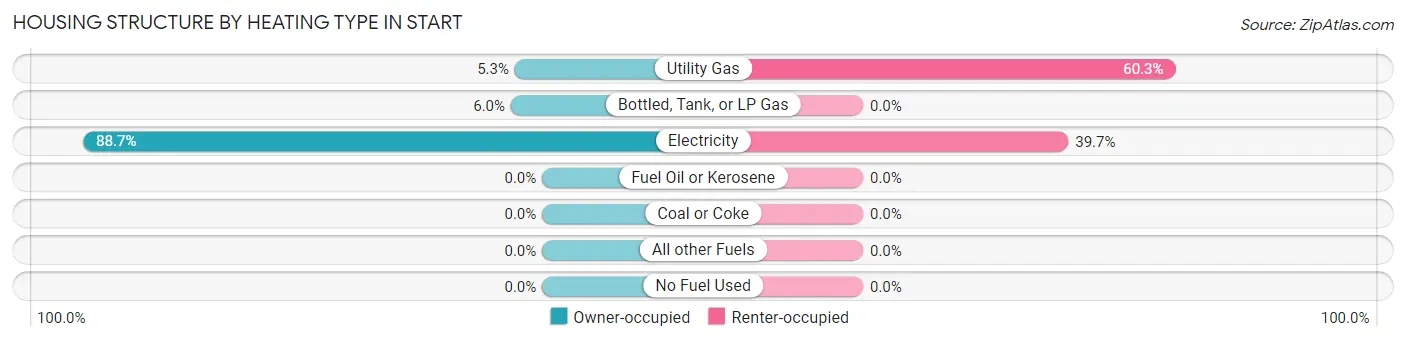
| Heating Type | Owner-occupied | Renter-occupied |
| Utility Gas | 14 (5.3%) | 175 (60.3%) |
| Bottled, Tank, or LP Gas | 16 (6.0%) | 0 (0.0%) |
| Electricity | 235 (88.7%) | 115 (39.7%) |
| Fuel Oil or Kerosene | 0 (0.0%) | 0 (0.0%) |
| Coal or Coke | 0 (0.0%) | 0 (0.0%) |
| All other Fuels | 0 (0.0%) | 0 (0.0%) |
| No Fuel Used | 0 (0.0%) | 0 (0.0%) |
| Total | 265 (100.0%) | 290 (100.0%) |
Household Vehicle Usage in Start
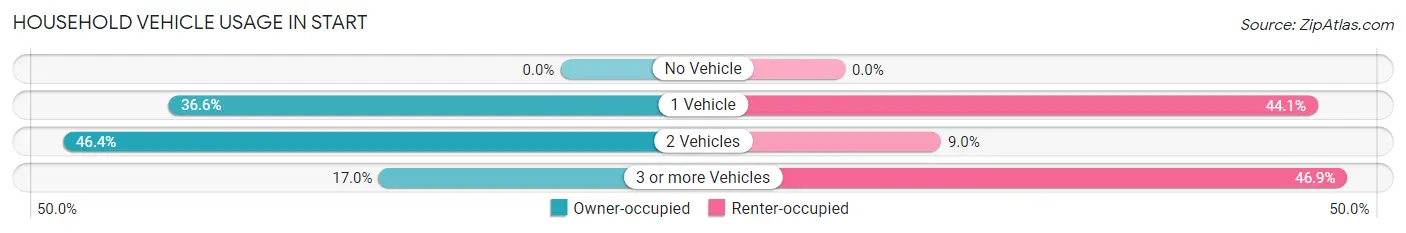
| Vehicles per Household | Owner-occupied | Renter-occupied |
| No Vehicle | 0 (0.0%) | 0 (0.0%) |
| 1 Vehicle | 97 (36.6%) | 128 (44.1%) |
| 2 Vehicles | 123 (46.4%) | 26 (9.0%) |
| 3 or more Vehicles | 45 (17.0%) | 136 (46.9%) |
| Total | 265 (100.0%) | 290 (100.0%) |
Real Estate & Mortgages in Start
Real Estate and Mortgage Overview in Start
| Characteristic | Without Mortgage | With Mortgage |
| Housing Units | 86 | 179 |
| Median Property Value | - | - |
| Median Household Income | $65,880 | $48 |
| Monthly Housing Costs | - | - |
| Real Estate Taxes | - | - |
Property Value by Mortgage Status in Start
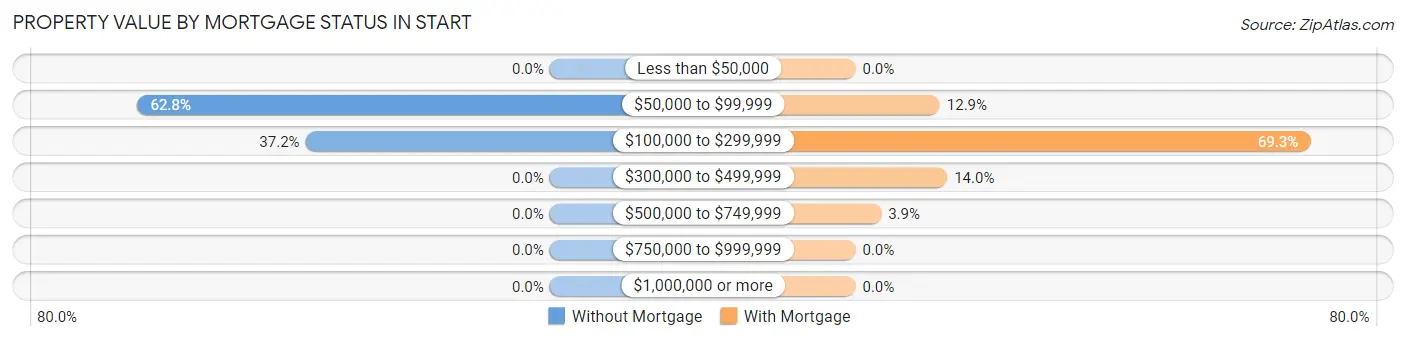
| Property Value | Without Mortgage | With Mortgage |
| Less than $50,000 | 0 (0.0%) | 0 (0.0%) |
| $50,000 to $99,999 | 54 (62.8%) | 23 (12.9%) |
| $100,000 to $299,999 | 32 (37.2%) | 124 (69.3%) |
| $300,000 to $499,999 | 0 (0.0%) | 25 (14.0%) |
| $500,000 to $749,999 | 0 (0.0%) | 7 (3.9%) |
| $750,000 to $999,999 | 0 (0.0%) | 0 (0.0%) |
| $1,000,000 or more | 0 (0.0%) | 0 (0.0%) |
| Total | 86 (100.0%) | 179 (100.0%) |
Household Income by Mortgage Status in Start
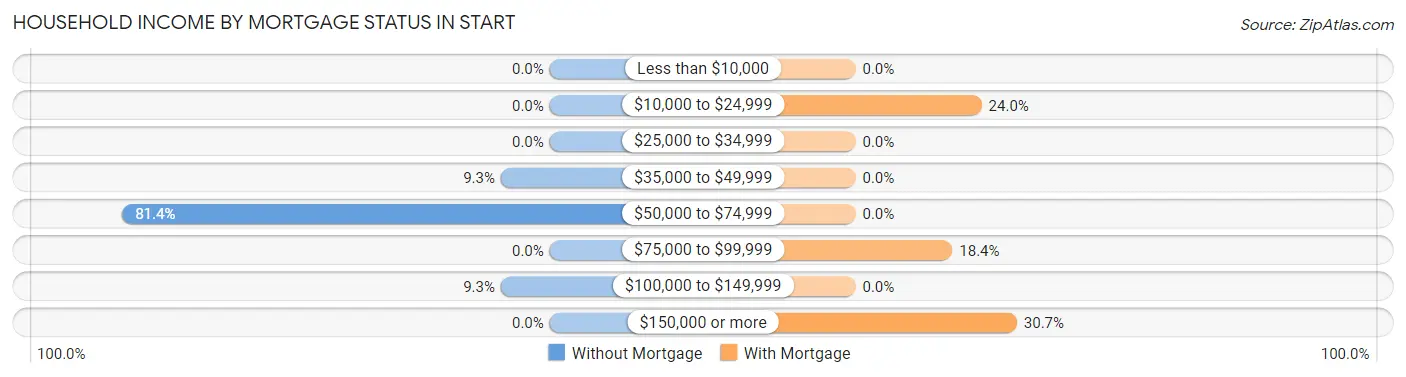
| Household Income | Without Mortgage | With Mortgage |
| Less than $10,000 | 0 (0.0%) | 0 (0.0%) |
| $10,000 to $24,999 | 0 (0.0%) | 43 (24.0%) |
| $25,000 to $34,999 | 0 (0.0%) | 0 (0.0%) |
| $35,000 to $49,999 | 8 (9.3%) | 0 (0.0%) |
| $50,000 to $74,999 | 70 (81.4%) | 0 (0.0%) |
| $75,000 to $99,999 | 0 (0.0%) | 33 (18.4%) |
| $100,000 to $149,999 | 8 (9.3%) | 0 (0.0%) |
| $150,000 or more | 0 (0.0%) | 55 (30.7%) |
| Total | 86 (100.0%) | 179 (100.0%) |
Property Value to Household Income Ratio in Start
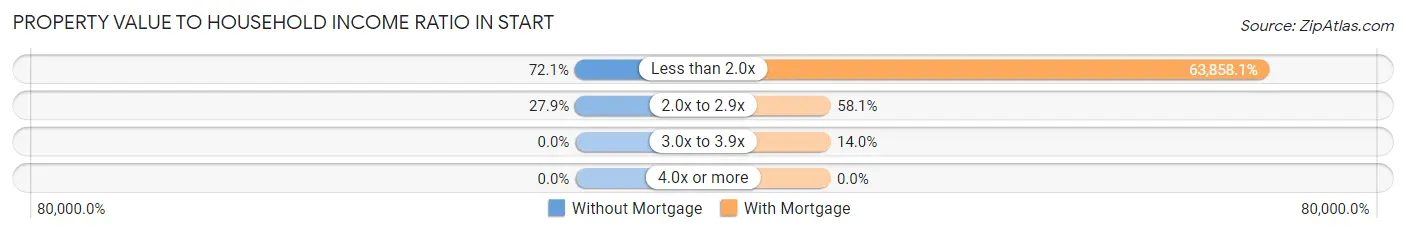
| Value-to-Income Ratio | Without Mortgage | With Mortgage |
| Less than 2.0x | 62 (72.1%) | 114,306 (63,858.1%) |
| 2.0x to 2.9x | 24 (27.9%) | 104 (58.1%) |
| 3.0x to 3.9x | 0 (0.0%) | 25 (14.0%) |
| 4.0x or more | 0 (0.0%) | 0 (0.0%) |
| Total | 86 (100.0%) | 179 (100.0%) |
Real Estate Taxes by Mortgage Status in Start
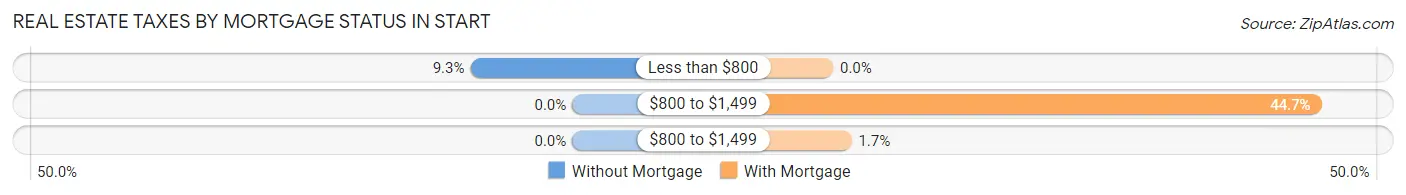
| Property Taxes | Without Mortgage | With Mortgage |
| Less than $800 | 8 (9.3%) | 0 (0.0%) |
| $800 to $1,499 | 0 (0.0%) | 80 (44.7%) |
| $800 to $1,499 | 0 (0.0%) | 3 (1.7%) |
| Total | 86 (100.0%) | 179 (100.0%) |
Health & Disability in Start
Health Insurance Coverage by Age in Start
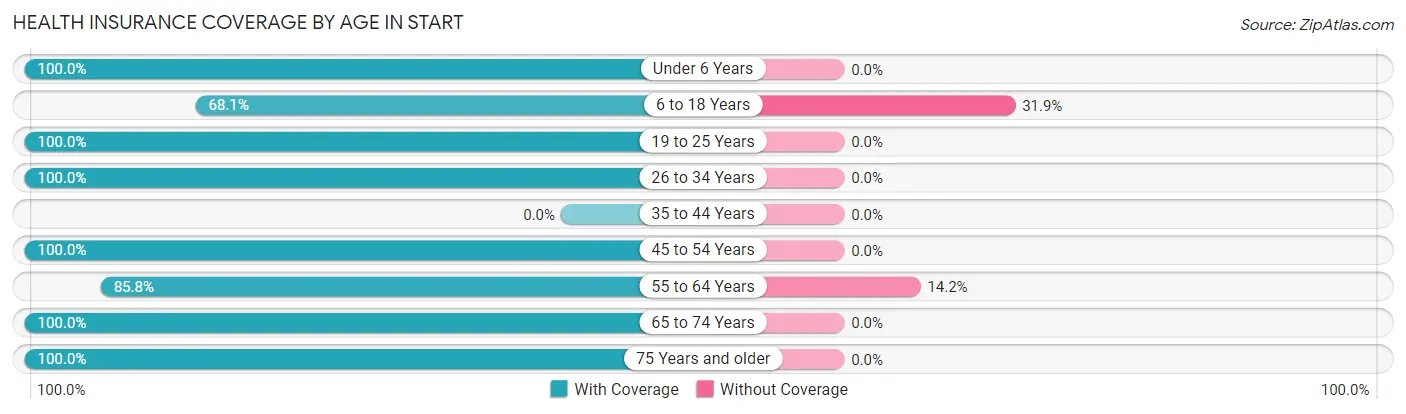
| Age Bracket | With Coverage | Without Coverage |
| Under 6 Years | 20 (100.0%) | 0 (0.0%) |
| 6 to 18 Years | 62 (68.1%) | 29 (31.9%) |
| 19 to 25 Years | 186 (100.0%) | 0 (0.0%) |
| 26 to 34 Years | 101 (100.0%) | 0 (0.0%) |
| 35 to 44 Years | 0 (0.0%) | 0 (0.0%) |
| 45 to 54 Years | 224 (100.0%) | 0 (0.0%) |
| 55 to 64 Years | 139 (85.8%) | 23 (14.2%) |
| 65 to 74 Years | 44 (100.0%) | 0 (0.0%) |
| 75 Years and older | 96 (100.0%) | 0 (0.0%) |
| Total | 872 (94.4%) | 52 (5.6%) |
Health Insurance Coverage by Citizenship Status in Start
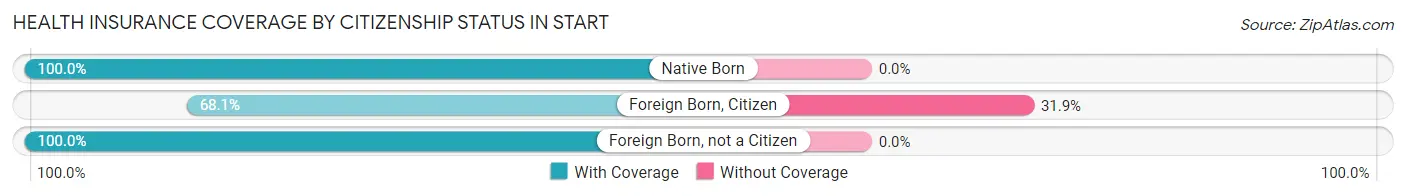
| Citizenship Status | With Coverage | Without Coverage |
| Native Born | 20 (100.0%) | 0 (0.0%) |
| Foreign Born, Citizen | 62 (68.1%) | 29 (31.9%) |
| Foreign Born, not a Citizen | 186 (100.0%) | 0 (0.0%) |
Health Insurance Coverage by Household Income in Start
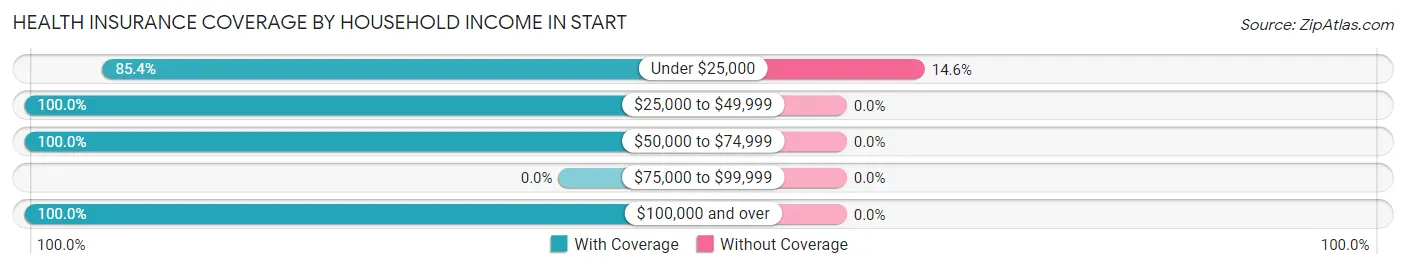
| Household Income | With Coverage | Without Coverage |
| Under $25,000 | 304 (85.4%) | 52 (14.6%) |
| $25,000 to $49,999 | 79 (100.0%) | 0 (0.0%) |
| $50,000 to $74,999 | 181 (100.0%) | 0 (0.0%) |
| $75,000 to $99,999 | 0 (0.0%) | 0 (0.0%) |
| $100,000 and over | 308 (100.0%) | 0 (0.0%) |
Public vs Private Health Insurance Coverage by Age in Start
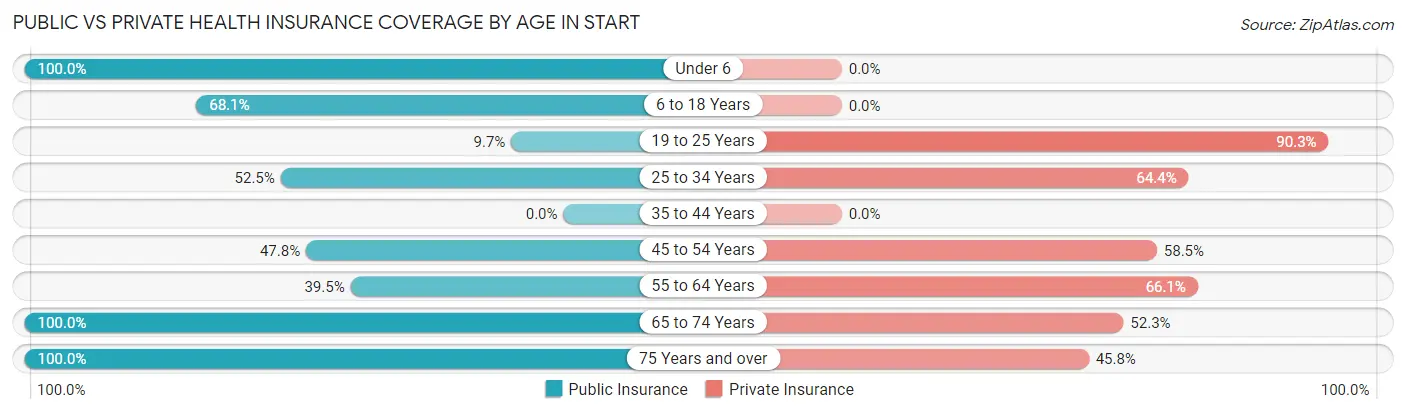
| Age Bracket | Public Insurance | Private Insurance |
| Under 6 | 20 (100.0%) | 0 (0.0%) |
| 6 to 18 Years | 62 (68.1%) | 0 (0.0%) |
| 19 to 25 Years | 18 (9.7%) | 168 (90.3%) |
| 25 to 34 Years | 53 (52.5%) | 65 (64.4%) |
| 35 to 44 Years | 0 (0.0%) | 0 (0.0%) |
| 45 to 54 Years | 107 (47.8%) | 131 (58.5%) |
| 55 to 64 Years | 64 (39.5%) | 107 (66.0%) |
| 65 to 74 Years | 44 (100.0%) | 23 (52.3%) |
| 75 Years and over | 96 (100.0%) | 44 (45.8%) |
| Total | 464 (50.2%) | 538 (58.2%) |
Disability Status by Sex by Age in Start
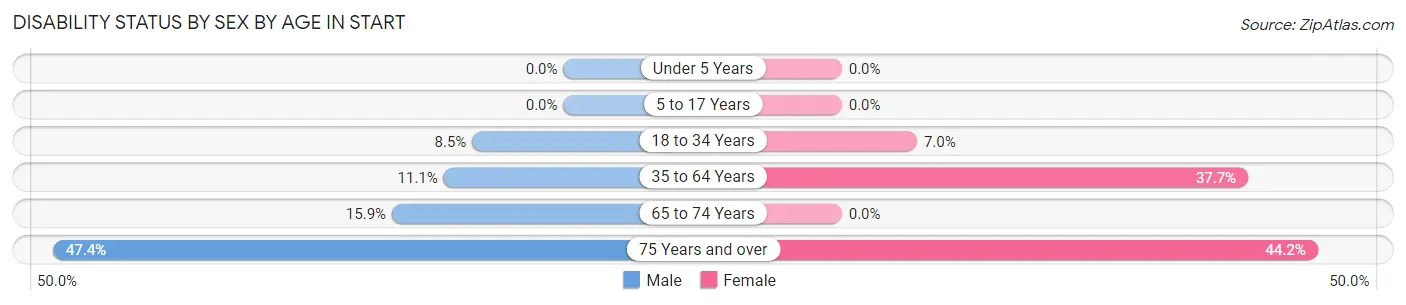
| Age Bracket | Male | Female |
| Under 5 Years | 0 (0.0%) | 0 (0.0%) |
| 5 to 17 Years | 0 (0.0%) | 0 (0.0%) |
| 18 to 34 Years | 17 (8.5%) | 6 (7.0%) |
| 35 to 64 Years | 14 (11.1%) | 98 (37.7%) |
| 65 to 74 Years | 7 (15.9%) | 0 (0.0%) |
| 75 Years and over | 9 (47.4%) | 34 (44.2%) |
Disability Class by Sex by Age in Start
Disability Class: Hearing Difficulty
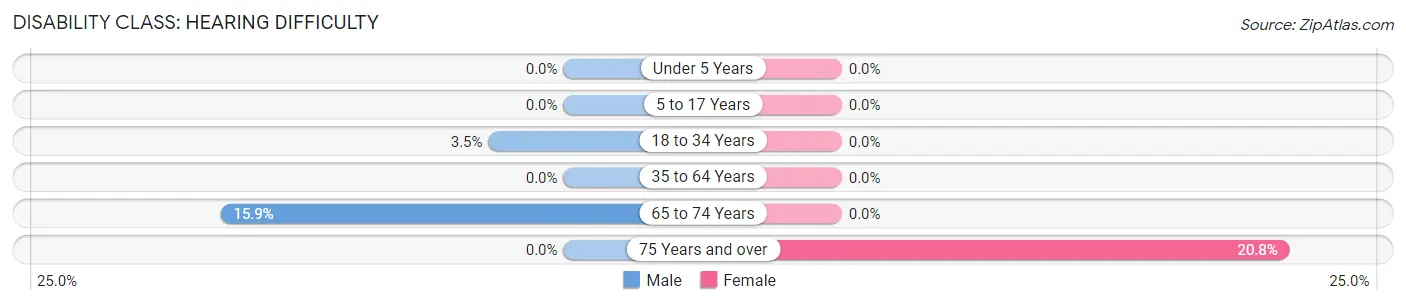
| Age Bracket | Male | Female |
| Under 5 Years | 0 (0.0%) | 0 (0.0%) |
| 5 to 17 Years | 0 (0.0%) | 0 (0.0%) |
| 18 to 34 Years | 7 (3.5%) | 0 (0.0%) |
| 35 to 64 Years | 0 (0.0%) | 0 (0.0%) |
| 65 to 74 Years | 7 (15.9%) | 0 (0.0%) |
| 75 Years and over | 0 (0.0%) | 16 (20.8%) |
Disability Class: Vision Difficulty

| Age Bracket | Male | Female |
| Under 5 Years | 0 (0.0%) | 0 (0.0%) |
| 5 to 17 Years | 0 (0.0%) | 0 (0.0%) |
| 18 to 34 Years | 7 (3.5%) | 0 (0.0%) |
| 35 to 64 Years | 0 (0.0%) | 44 (16.9%) |
| 65 to 74 Years | 0 (0.0%) | 0 (0.0%) |
| 75 Years and over | 0 (0.0%) | 16 (20.8%) |
Disability Class: Cognitive Difficulty
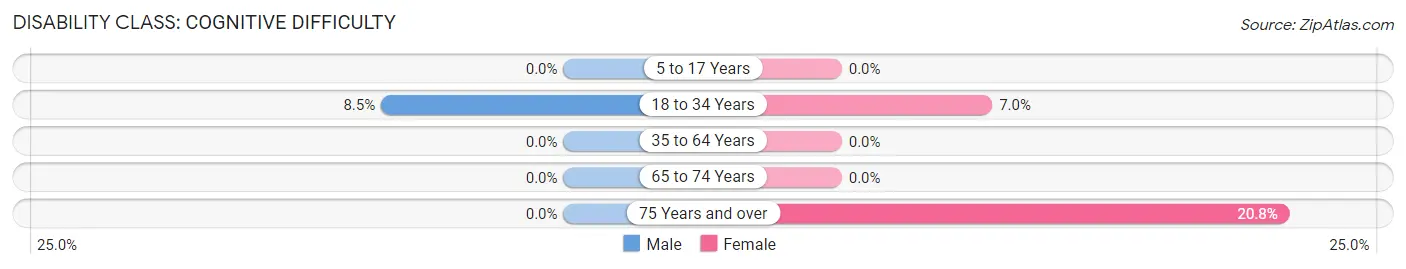
| Age Bracket | Male | Female |
| 5 to 17 Years | 0 (0.0%) | 0 (0.0%) |
| 18 to 34 Years | 17 (8.5%) | 6 (7.0%) |
| 35 to 64 Years | 0 (0.0%) | 0 (0.0%) |
| 65 to 74 Years | 0 (0.0%) | 0 (0.0%) |
| 75 Years and over | 0 (0.0%) | 16 (20.8%) |
Disability Class: Ambulatory Difficulty
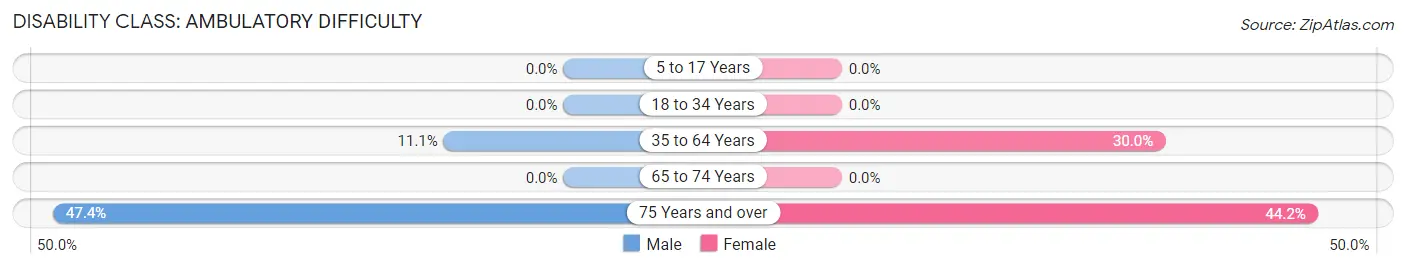
| Age Bracket | Male | Female |
| 5 to 17 Years | 0 (0.0%) | 0 (0.0%) |
| 18 to 34 Years | 0 (0.0%) | 0 (0.0%) |
| 35 to 64 Years | 14 (11.1%) | 78 (30.0%) |
| 65 to 74 Years | 0 (0.0%) | 0 (0.0%) |
| 75 Years and over | 9 (47.4%) | 34 (44.2%) |
Disability Class: Self-Care Difficulty
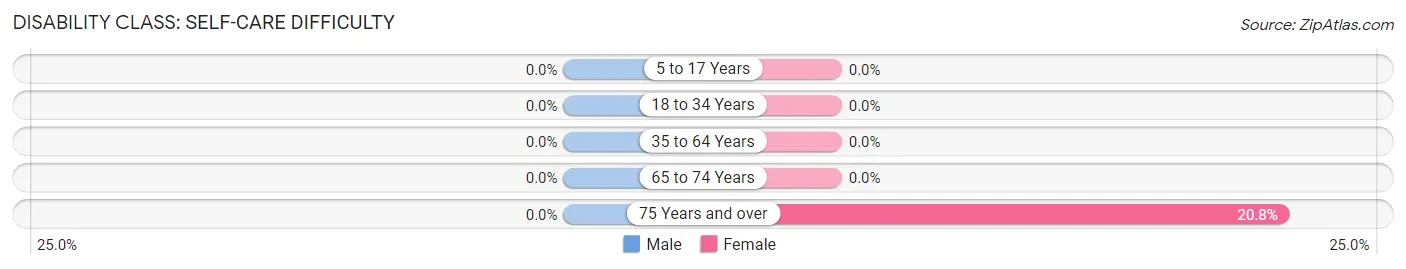
| Age Bracket | Male | Female |
| 5 to 17 Years | 0 (0.0%) | 0 (0.0%) |
| 18 to 34 Years | 0 (0.0%) | 0 (0.0%) |
| 35 to 64 Years | 0 (0.0%) | 0 (0.0%) |
| 65 to 74 Years | 0 (0.0%) | 0 (0.0%) |
| 75 Years and over | 0 (0.0%) | 16 (20.8%) |
Technology Access in Start
Computing Device Access in Start
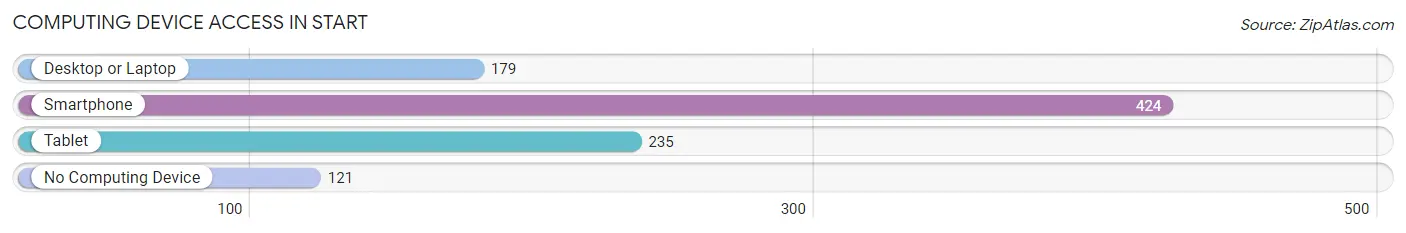
| Device Type | # Households | % Households |
| Desktop or Laptop | 179 | 32.3% |
| Smartphone | 424 | 76.4% |
| Tablet | 235 | 42.3% |
| No Computing Device | 121 | 21.8% |
| Total | 555 | 100.0% |
Internet Access in Start
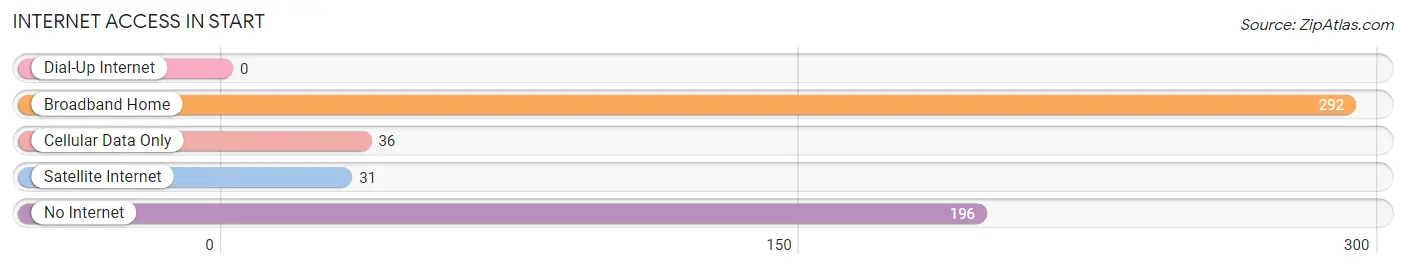
| Internet Type | # Households | % Households |
| Dial-Up Internet | 0 | 0.0% |
| Broadband Home | 292 | 52.6% |
| Cellular Data Only | 36 | 6.5% |
| Satellite Internet | 31 | 5.6% |
| No Internet | 196 | 35.3% |
| Total | 555 | 100.0% |
Start Summary
Los Angeles is the second-largest city in the United States and the largest city in California. It is located in the southern part of the state, along the Pacific Ocean. The city is known for its diverse population, its vibrant culture, and its many attractions.
History
The history of Los Angeles dates back to 1781, when Spanish settlers founded the city. The city was originally called El Pueblo de Nuestra Señora la Reina de los Angeles de Porciuncula, which translates to “The Town of Our Lady the Queen of the Angels of Porciuncula.” The city was founded by 44 settlers, who were led by Governor Felipe de Neve.
The city grew rapidly in the 19th century, becoming a major port and commercial center. In the early 20th century, the city was transformed by the growth of the film industry, which made Los Angeles the center of the movie industry.
Geography
Los Angeles is located in the southern part of California, along the Pacific Ocean. The city is bordered by the San Gabriel Mountains to the north, the Santa Monica Mountains to the west, and the San Fernando Valley to the east. The city covers an area of 469 square miles, making it the second-largest city in the United States.
The city is divided into several distinct neighborhoods, including Downtown, Hollywood, Westwood, and the San Fernando Valley. The city is also home to several beaches, including Venice Beach, Santa Monica Beach, and Malibu Beach.
Economy
Los Angeles is one of the largest economic centers in the United States. The city is home to several major industries, including entertainment, technology, finance, and tourism. The city is also home to several Fortune 500 companies, including The Walt Disney Company, Northrop Grumman, and Occidental Petroleum.
The city’s economy is also supported by its port, which is the busiest in the United States. The port is a major hub for international trade, and it is home to several major shipping companies.
Demographics
Los Angeles is one of the most diverse cities in the United States. The city has a population of over 4 million people, and it is home to people from all over the world. The city is also home to several ethnic and racial groups, including African Americans, Latinos, Asians, and Native Americans.
The city is also home to several religious groups, including Christians, Jews, Muslims, and Buddhists. The city is also home to several LGBT communities.
Conclusion
Los Angeles is a vibrant and diverse city with a rich history and a thriving economy. The city is home to people from all over the world, and it is a major center for entertainment, technology, finance, and tourism. The city is also home to several Fortune 500 companies, and its port is the busiest in the United States. Los Angeles is a city of opportunity, and it is a great place to live and work.
Common Questions
What is Per Capita Income in Start?
Per Capita income in Start is $40,795.
What is the Median Family Income in Start?
Median Family Income in Start is $66,667.
What is Income or Wage Gap in Start?
Income or Wage Gap in Start is 33.7%.
Women in Start earn 66.3 cents for every dollar earned by a man.
What is Inequality or Gini Index in Start?
Inequality or Gini Index in Start is 0.54.
What is the Total Population of Start?
Total Population of Start is 924.
What is the Total Male Population of Start?
Total Male Population of Start is 462.
What is the Total Female Population of Start?
Total Female Population of Start is 462.
What is the Ratio of Males per 100 Females in Start?
There are 100.00 Males per 100 Females in Start.
What is the Ratio of Females per 100 Males in Start?
There are 100.00 Females per 100 Males in Start.
What is the Median Population Age in Start?
Median Population Age in Start is 47.5 Years.
What is the Average Family Size in Start
Average Family Size in Start is 2.0 People.
What is the Average Household Size in Start
Average Household Size in Start is 1.7 People.
How Large is the Labor Force in Start?
There are 407 People in the Labor Forcein in Start.
What is the Percentage of People in the Labor Force in Start?
47.8% of People are in the Labor Force in Start.
What is the Unemployment Rate in Start?
Unemployment Rate in Start is 2.2%.