Delcambre, LA Map & Demographics
Delcambre Map
Delcambre Overview
$23,694
PER CAPITA INCOME
$70,655
AVG FAMILY INCOME
$45,943
AVG HOUSEHOLD INCOME
25.5%
WAGE / INCOME GAP [ % ]
74.5¢/ $1
WAGE / INCOME GAP [ $ ]
0.41
INEQUALITY / GINI INDEX
2,422
TOTAL POPULATION
1,117
MALE POPULATION
1,305
FEMALE POPULATION
85.59
MALES / 100 FEMALES
116.83
FEMALES / 100 MALES
41.1
MEDIAN AGE
3.5
AVG FAMILY SIZE
2.9
AVG HOUSEHOLD SIZE
962
LABOR FORCE [ PEOPLE ]
52.4%
PERCENT IN LABOR FORCE
5.7%
UNEMPLOYMENT RATE
Delcambre Zip Codes
Delcambre Area Codes
Income in Delcambre
Income Overview in Delcambre
Per Capita Income in Delcambre is $23,694, while median incomes of families and households are $70,655 and $45,943 respectively.
| Characteristic | Number | Measure |
| Per Capita Income | 2,422 | $23,694 |
| Median Family Income | 561 | $70,655 |
| Mean Family Income | 561 | $76,824 |
| Median Household Income | 844 | $45,943 |
| Mean Household Income | 844 | $64,142 |
| Income Deficit | 561 | $0 |
| Wage / Income Gap (%) | 2,422 | 25.53% |
| Wage / Income Gap ($) | 2,422 | 74.47¢ per $1 |
| Gini / Inequality Index | 2,422 | 0.41 |
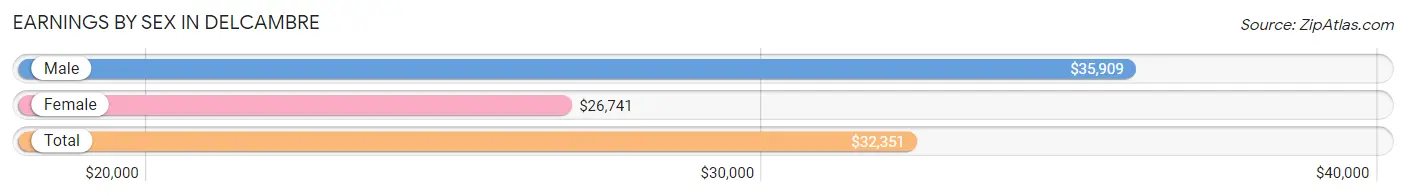
Earnings by Sex in Delcambre
Average Earnings in Delcambre are $32,351, $35,909 for men and $26,741 for women, a difference of 25.5%.
| Sex | Number | Average Earnings |
| Male | 494 (49.6%) | $35,909 |
| Female | 501 (50.3%) | $26,741 |
| Total | 995 (100.0%) | $32,351 |
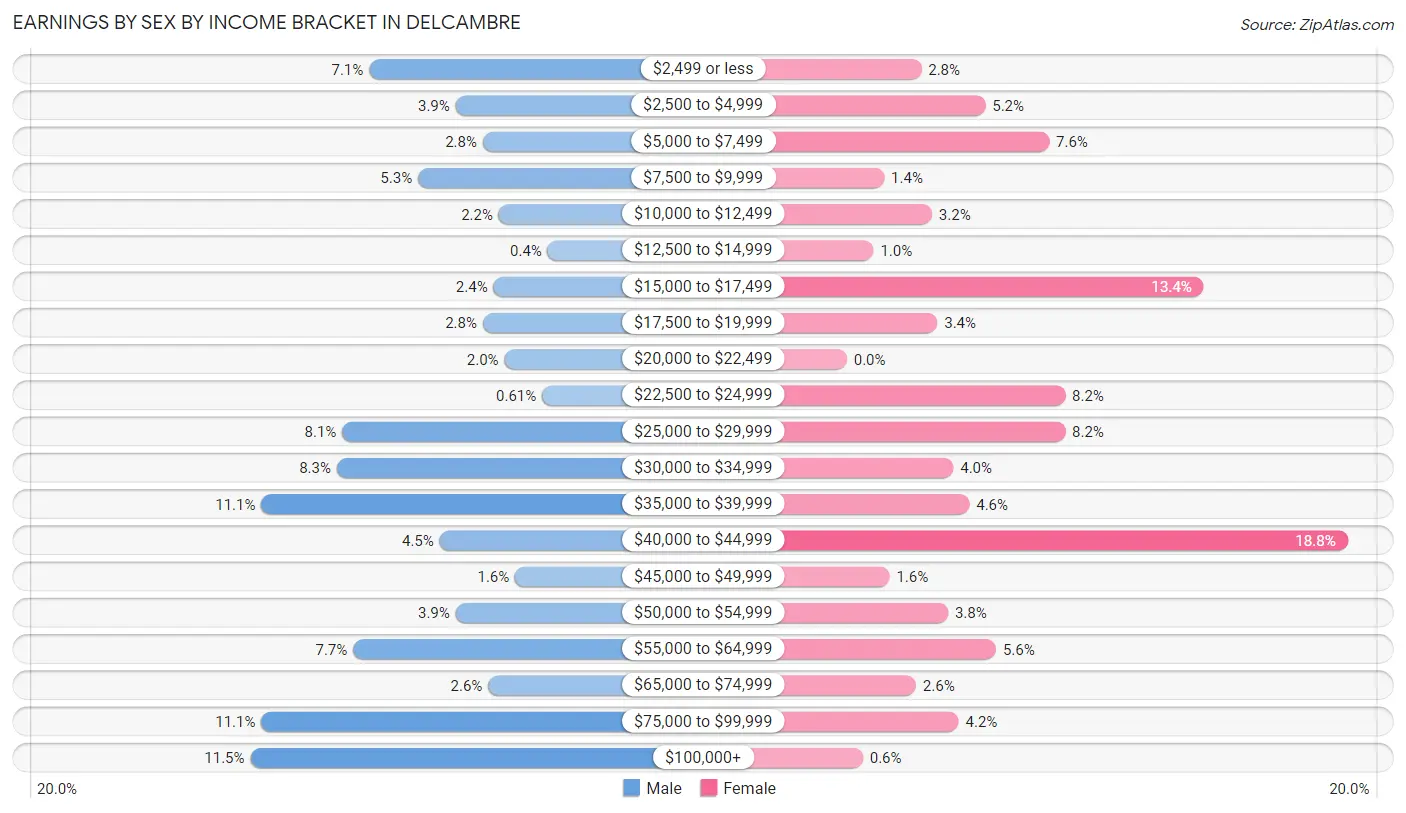
Earnings by Sex by Income Bracket in Delcambre
The most common earnings brackets in Delcambre are $100,000+ for men (57 | 11.5%) and $40,000 to $44,999 for women (94 | 18.8%).
| Income | Male | Female |
| $2,499 or less | 35 (7.1%) | 14 (2.8%) |
| $2,500 to $4,999 | 19 (3.8%) | 26 (5.2%) |
| $5,000 to $7,499 | 14 (2.8%) | 38 (7.6%) |
| $7,500 to $9,999 | 26 (5.3%) | 7 (1.4%) |
| $10,000 to $12,499 | 11 (2.2%) | 16 (3.2%) |
| $12,500 to $14,999 | 2 (0.4%) | 5 (1.0%) |
| $15,000 to $17,499 | 12 (2.4%) | 67 (13.4%) |
| $17,500 to $19,999 | 14 (2.8%) | 17 (3.4%) |
| $20,000 to $22,499 | 10 (2.0%) | 0 (0.0%) |
| $22,500 to $24,999 | 3 (0.6%) | 41 (8.2%) |
| $25,000 to $29,999 | 40 (8.1%) | 41 (8.2%) |
| $30,000 to $34,999 | 41 (8.3%) | 20 (4.0%) |
| $35,000 to $39,999 | 55 (11.1%) | 23 (4.6%) |
| $40,000 to $44,999 | 22 (4.4%) | 94 (18.8%) |
| $45,000 to $49,999 | 8 (1.6%) | 8 (1.6%) |
| $50,000 to $54,999 | 19 (3.8%) | 19 (3.8%) |
| $55,000 to $64,999 | 38 (7.7%) | 28 (5.6%) |
| $65,000 to $74,999 | 13 (2.6%) | 13 (2.6%) |
| $75,000 to $99,999 | 55 (11.1%) | 21 (4.2%) |
| $100,000+ | 57 (11.5%) | 3 (0.6%) |
| Total | 494 (100.0%) | 501 (100.0%) |
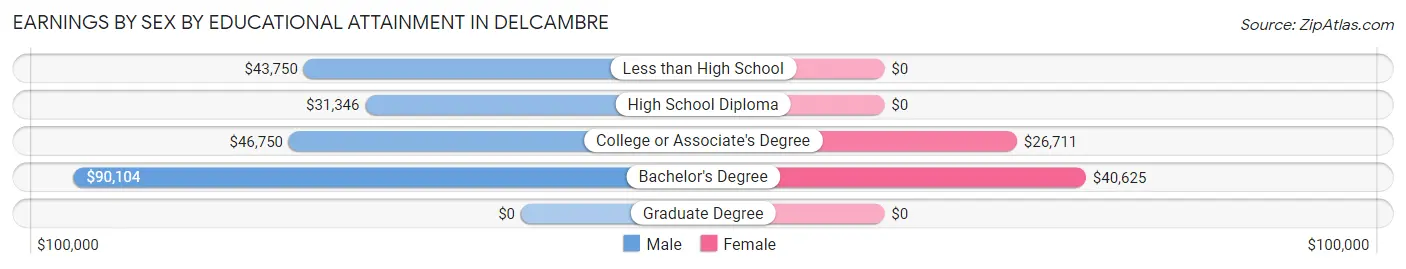
Earnings by Sex by Educational Attainment in Delcambre
Average earnings in Delcambre are $37,016 for men and $31,328 for women, a difference of 15.4%. Men with an educational attainment of bachelor's degree enjoy the highest average annual earnings of $90,104, while those with high school diploma education earn the least with $31,346. Women with an educational attainment of bachelor's degree earn the most with the average annual earnings of $40,625, while those with college or associate's degree education have the smallest earnings of $26,711.
| Educational Attainment | Male Income | Female Income |
| Less than High School | $43,750 | $0 |
| High School Diploma | $31,346 | $0 |
| College or Associate's Degree | $46,750 | $26,711 |
| Bachelor's Degree | $90,104 | $40,625 |
| Graduate Degree | - | - |
| Total | $37,016 | $31,328 |
Family Income in Delcambre
Family Income Brackets in Delcambre
According to the Delcambre family income data, there are 143 families falling into the $100,000 to $149,999 income range, which is the most common income bracket and makes up 25.5% of all families.
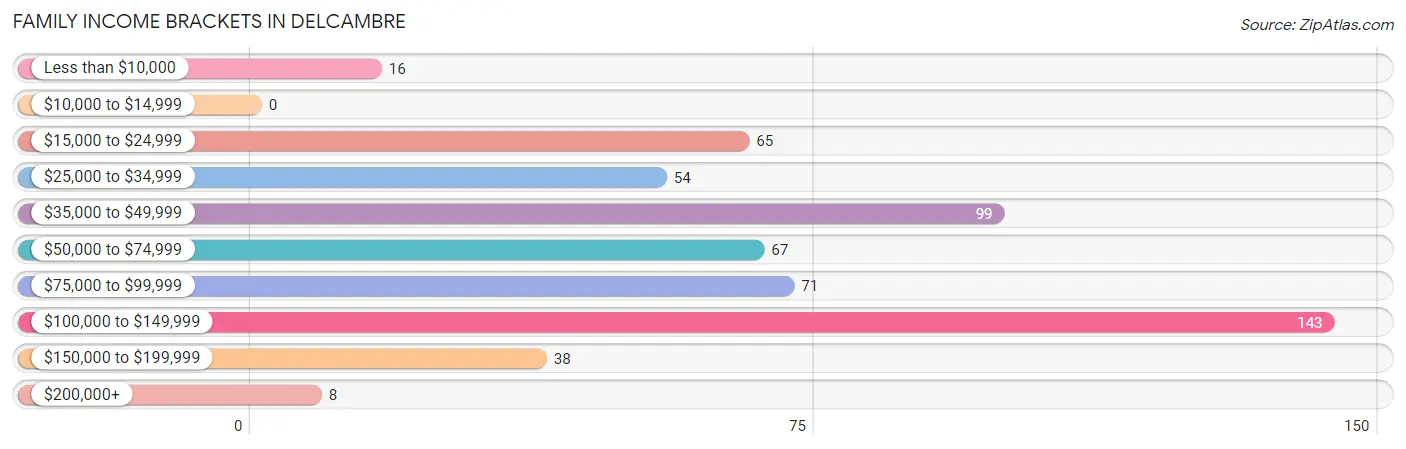
| Income Bracket | # Families | % Families |
| Less than $10,000 | 16 | 2.9% |
| $10,000 to $14,999 | 0 | 0.0% |
| $15,000 to $24,999 | 65 | 11.6% |
| $25,000 to $34,999 | 54 | 9.6% |
| $35,000 to $49,999 | 99 | 17.6% |
| $50,000 to $74,999 | 67 | 11.9% |
| $75,000 to $99,999 | 71 | 12.7% |
| $100,000 to $149,999 | 143 | 25.5% |
| $150,000 to $199,999 | 38 | 6.8% |
| $200,000+ | 8 | 1.4% |
Family Income by Famaliy Size in Delcambre
3-person families (121 | 21.6%) account for the highest median family income in Delcambre with $97,292 per family, while 3-person families (121 | 21.6%) have the highest median income of $32,431 per family member.
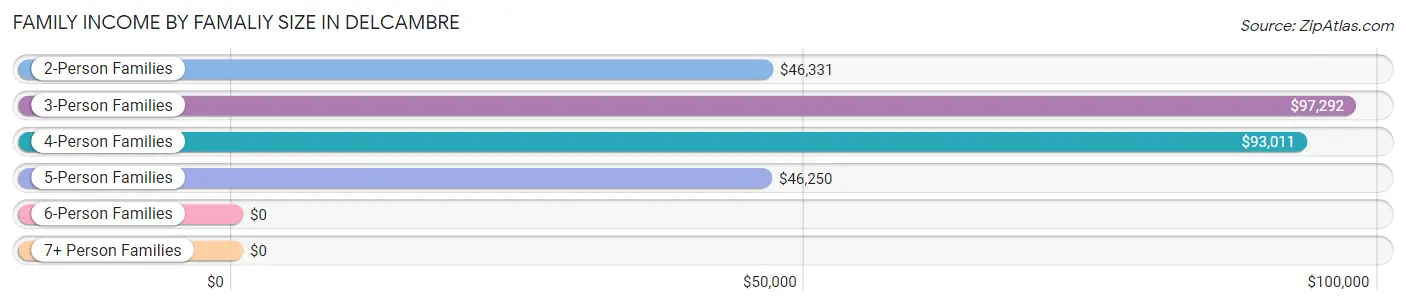
| Income Bracket | # Families | Median Income |
| 2-Person Families | 205 (36.5%) | $46,331 |
| 3-Person Families | 121 (21.6%) | $97,292 |
| 4-Person Families | 155 (27.6%) | $93,011 |
| 5-Person Families | 21 (3.7%) | $46,250 |
| 6-Person Families | 54 (9.6%) | $0 |
| 7+ Person Families | 5 (0.9%) | $0 |
| Total | 561 (100.0%) | $70,655 |
Family Income by Number of Earners in Delcambre
The median family income in Delcambre is $70,655, with families comprising 3+ earners (41) having the highest median family income of $104,313, while families with 1 earner (269) have the lowest median family income of $44,073, accounting for 7.3% and 47.9% of families, respectively.
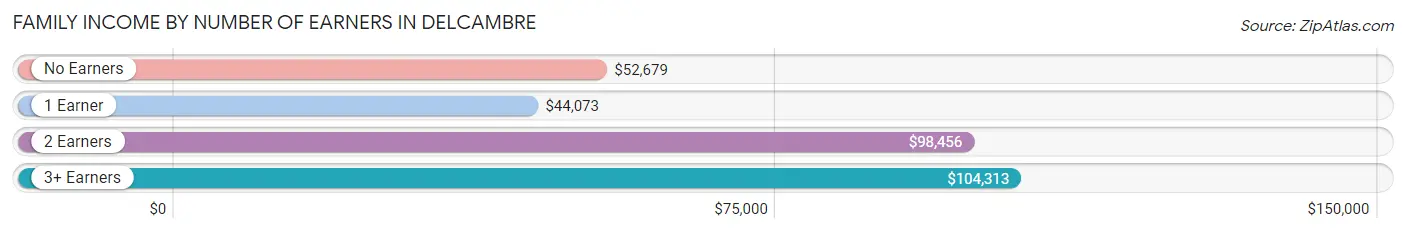
| Number of Earners | # Families | Median Income |
| No Earners | 64 (11.4%) | $52,679 |
| 1 Earner | 269 (47.9%) | $44,073 |
| 2 Earners | 187 (33.3%) | $98,456 |
| 3+ Earners | 41 (7.3%) | $104,313 |
| Total | 561 (100.0%) | $70,655 |
Household Income in Delcambre
Household Income Brackets in Delcambre
With 184 households falling in the category, the $100,000 to $149,999 income range is the most frequent in Delcambre, accounting for 21.8% of all households. In contrast, only 8 households (0.9%) fall into the $200,000+ income bracket, making it the least populous group.
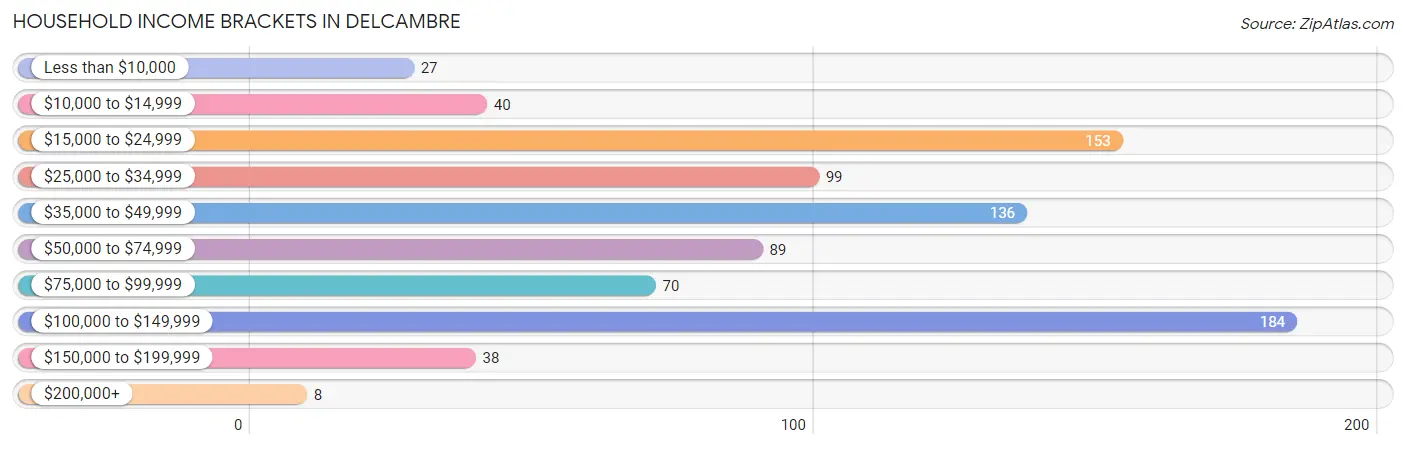
| Income Bracket | # Households | % Households |
| Less than $10,000 | 27 | 3.2% |
| $10,000 to $14,999 | 40 | 4.7% |
| $15,000 to $24,999 | 153 | 18.1% |
| $25,000 to $34,999 | 99 | 11.7% |
| $35,000 to $49,999 | 136 | 16.1% |
| $50,000 to $74,999 | 89 | 10.5% |
| $75,000 to $99,999 | 70 | 8.3% |
| $100,000 to $149,999 | 184 | 21.8% |
| $150,000 to $199,999 | 38 | 4.5% |
| $200,000+ | 8 | 0.9% |
Household Income by Householder Age in Delcambre
The median household income in Delcambre is $45,943, with the highest median household income of $82,000 found in the 25 to 44 years age bracket for the primary householder. A total of 314 households (37.2%) fall into this category. Meanwhile, the 15 to 24 years age bracket for the primary householder has the lowest median household income of $0, with 8 households (0.9%) in this group.
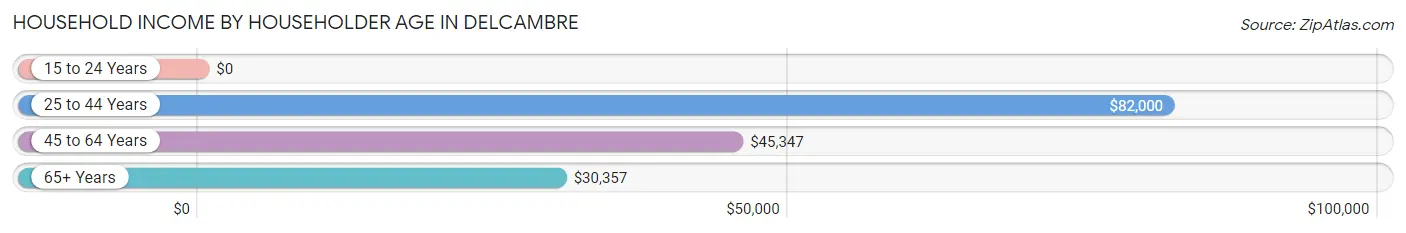
| Income Bracket | # Households | Median Income |
| 15 to 24 Years | 8 (0.9%) | $0 |
| 25 to 44 Years | 314 (37.2%) | $82,000 |
| 45 to 64 Years | 268 (31.8%) | $45,347 |
| 65+ Years | 254 (30.1%) | $30,357 |
| Total | 844 (100.0%) | $45,943 |
Poverty in Delcambre
Income Below Poverty by Sex and Age in Delcambre
With 12.8% poverty level for males and 14.4% for females among the residents of Delcambre, 16 and 17 year old males and 18 to 24 year old females are the most vulnerable to poverty, with 14 males (100.0%) and 44 females (50.0%) in their respective age groups living below the poverty level.
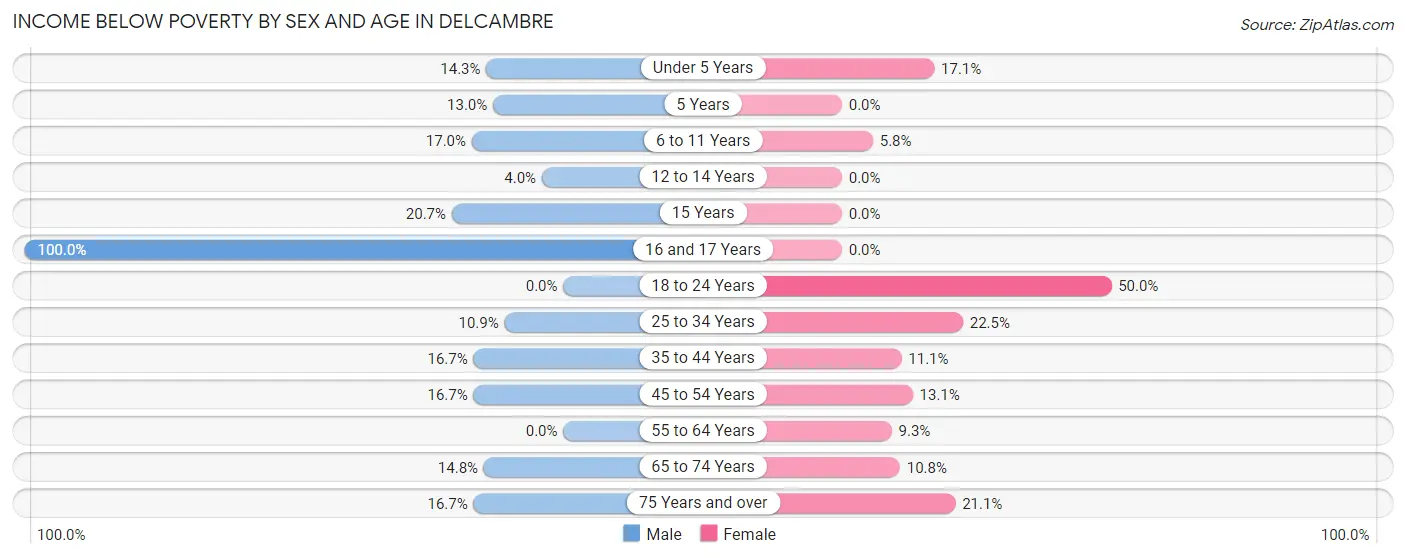
| Age Bracket | Male | Female |
| Under 5 Years | 11 (14.3%) | 12 (17.1%) |
| 5 Years | 3 (13.0%) | 0 (0.0%) |
| 6 to 11 Years | 9 (17.0%) | 5 (5.8%) |
| 12 to 14 Years | 5 (4.0%) | 0 (0.0%) |
| 15 Years | 6 (20.7%) | 0 (0.0%) |
| 16 and 17 Years | 14 (100.0%) | 0 (0.0%) |
| 18 to 24 Years | 0 (0.0%) | 44 (50.0%) |
| 25 to 34 Years | 18 (10.9%) | 31 (22.5%) |
| 35 to 44 Years | 14 (16.7%) | 19 (11.1%) |
| 45 to 54 Years | 27 (16.7%) | 18 (13.1%) |
| 55 to 64 Years | 0 (0.0%) | 26 (9.2%) |
| 65 to 74 Years | 27 (14.7%) | 14 (10.8%) |
| 75 Years and over | 7 (16.7%) | 16 (21.0%) |
| Total | 141 (12.8%) | 185 (14.4%) |
Income Above Poverty by Sex and Age in Delcambre
According to the poverty statistics in Delcambre, males aged 18 to 24 years and females aged 5 years are the age groups that are most secure financially, with 100.0% of males and 100.0% of females in these age groups living above the poverty line.
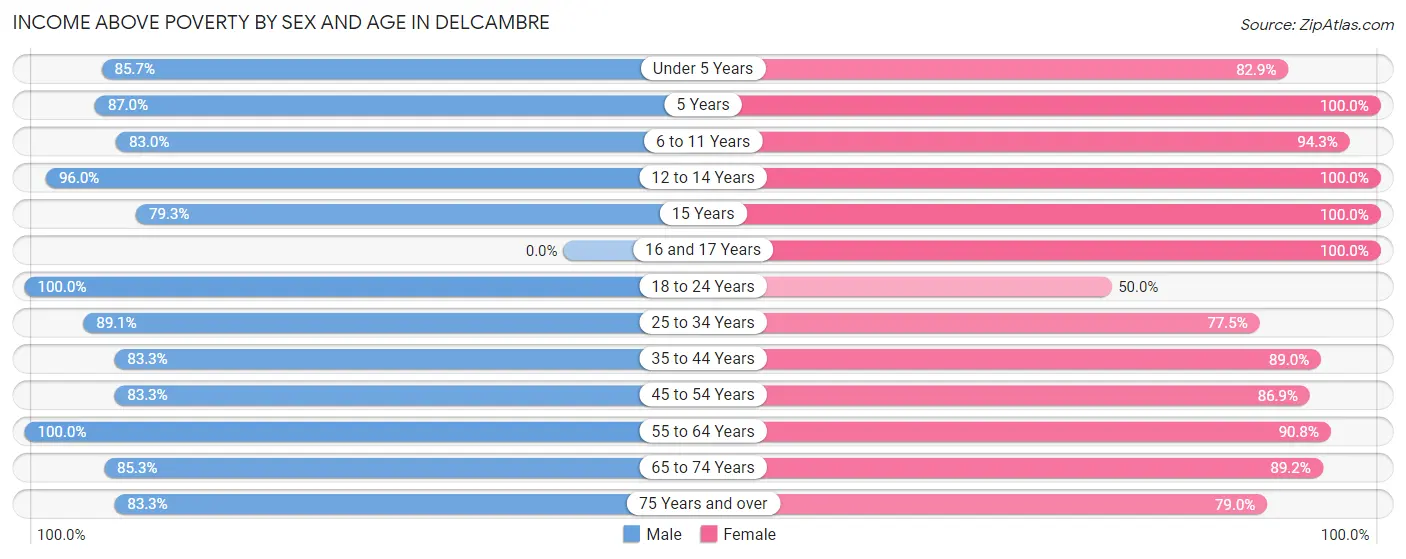
| Age Bracket | Male | Female |
| Under 5 Years | 66 (85.7%) | 58 (82.9%) |
| 5 Years | 20 (87.0%) | 16 (100.0%) |
| 6 to 11 Years | 44 (83.0%) | 82 (94.3%) |
| 12 to 14 Years | 121 (96.0%) | 43 (100.0%) |
| 15 Years | 23 (79.3%) | 27 (100.0%) |
| 16 and 17 Years | 0 (0.0%) | 16 (100.0%) |
| 18 to 24 Years | 62 (100.0%) | 44 (50.0%) |
| 25 to 34 Years | 147 (89.1%) | 107 (77.5%) |
| 35 to 44 Years | 70 (83.3%) | 153 (88.9%) |
| 45 to 54 Years | 135 (83.3%) | 119 (86.9%) |
| 55 to 64 Years | 85 (100.0%) | 255 (90.7%) |
| 65 to 74 Years | 156 (85.3%) | 116 (89.2%) |
| 75 Years and over | 35 (83.3%) | 60 (78.9%) |
| Total | 964 (87.2%) | 1,096 (85.6%) |
Income Below Poverty Among Married-Couple Families in Delcambre
The poverty statistics for married-couple families in Delcambre show that 11.8% or 45 of the total 380 families live below the poverty line. Families with 1 or 2 children have the highest poverty rate of 15.2%, comprising of 29 families. On the other hand, families with 3 or 4 children have the lowest poverty rate of 0.0%, which includes 0 families.
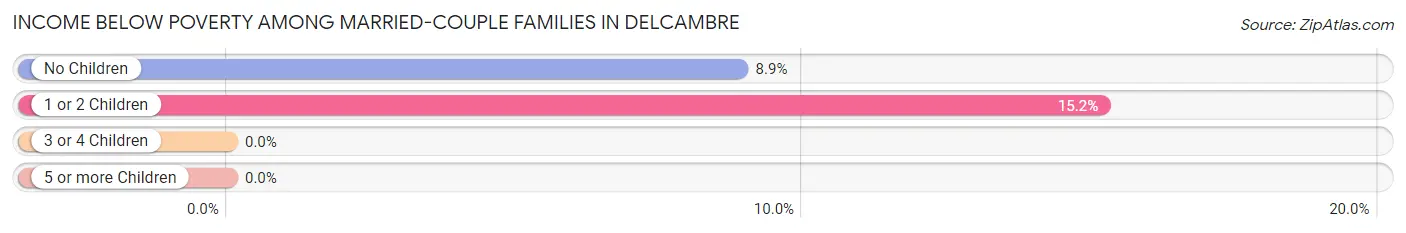
| Children | Above Poverty | Below Poverty |
| No Children | 164 (91.1%) | 16 (8.9%) |
| 1 or 2 Children | 162 (84.8%) | 29 (15.2%) |
| 3 or 4 Children | 9 (100.0%) | 0 (0.0%) |
| 5 or more Children | 0 (0.0%) | 0 (0.0%) |
| Total | 335 (88.2%) | 45 (11.8%) |
Income Below Poverty Among Single-Parent Households in Delcambre
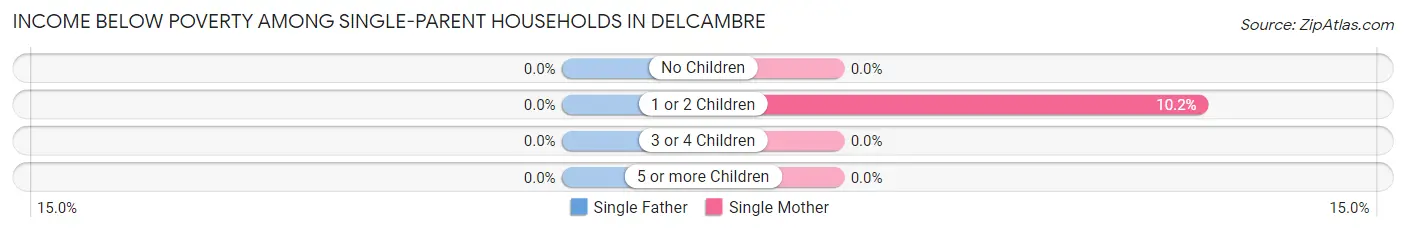
| Children | Single Father | Single Mother |
| No Children | 0 (0.0%) | 0 (0.0%) |
| 1 or 2 Children | 0 (0.0%) | 11 (10.2%) |
| 3 or 4 Children | 0 (0.0%) | 0 (0.0%) |
| 5 or more Children | 0 (0.0%) | 0 (0.0%) |
| Total | 0 (0.0%) | 11 (8.2%) |
Income Below Poverty Among Married-Couple vs Single-Parent Households in Delcambre
The poverty data for Delcambre shows that 45 of the married-couple family households (11.8%) and 11 of the single-parent households (6.1%) are living below the poverty level. Within the married-couple family households, those with 1 or 2 children have the highest poverty rate, with 29 households (15.2%) falling below the poverty line. Among the single-parent households, those with 1 or 2 children have the highest poverty rate, with 11 household (8.6%) living below poverty.
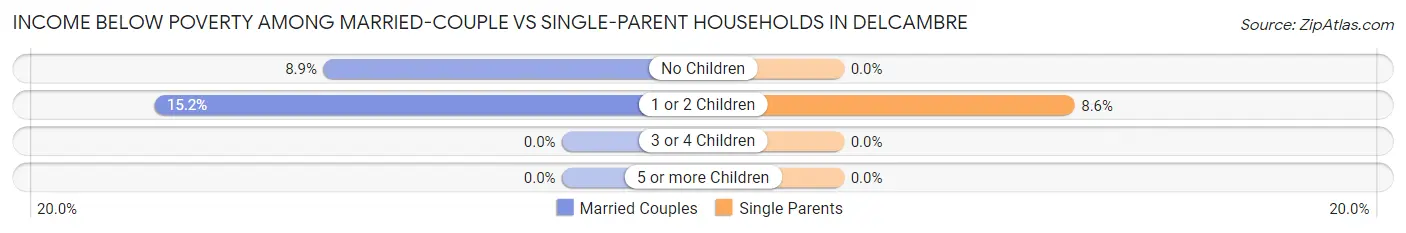
| Children | Married-Couple Families | Single-Parent Households |
| No Children | 16 (8.9%) | 0 (0.0%) |
| 1 or 2 Children | 29 (15.2%) | 11 (8.6%) |
| 3 or 4 Children | 0 (0.0%) | 0 (0.0%) |
| 5 or more Children | 0 (0.0%) | 0 (0.0%) |
| Total | 45 (11.8%) | 11 (6.1%) |
Race in Delcambre
The most populous races in Delcambre are White / Caucasian (2,028 | 83.7%), Two or more Races (197 | 8.1%), and Black / African American (179 | 7.4%).
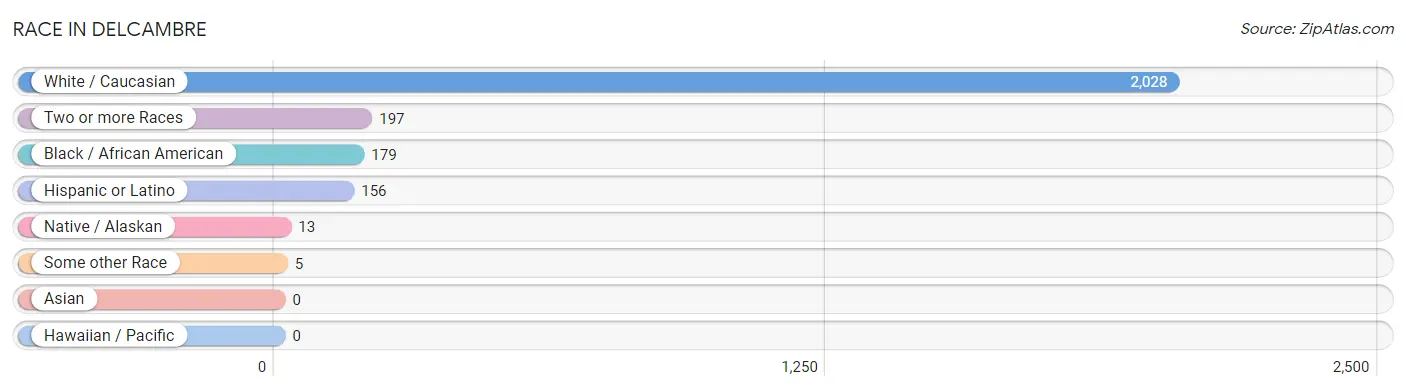
| Race | # Population | % Population |
| Asian | 0 | 0.0% |
| Black / African American | 179 | 7.4% |
| Hawaiian / Pacific | 0 | 0.0% |
| Hispanic or Latino | 156 | 6.4% |
| Native / Alaskan | 13 | 0.5% |
| White / Caucasian | 2,028 | 83.7% |
| Two or more Races | 197 | 8.1% |
| Some other Race | 5 | 0.2% |
| Total | 2,422 | 100.0% |
Ancestry in Delcambre
The most populous ancestries reported in Delcambre are French (389 | 16.1%), Cajun (195 | 8.1%), American (161 | 6.7%), Spanish (141 | 5.8%), and French Canadian (122 | 5.0%), together accounting for 41.6% of all Delcambre residents.
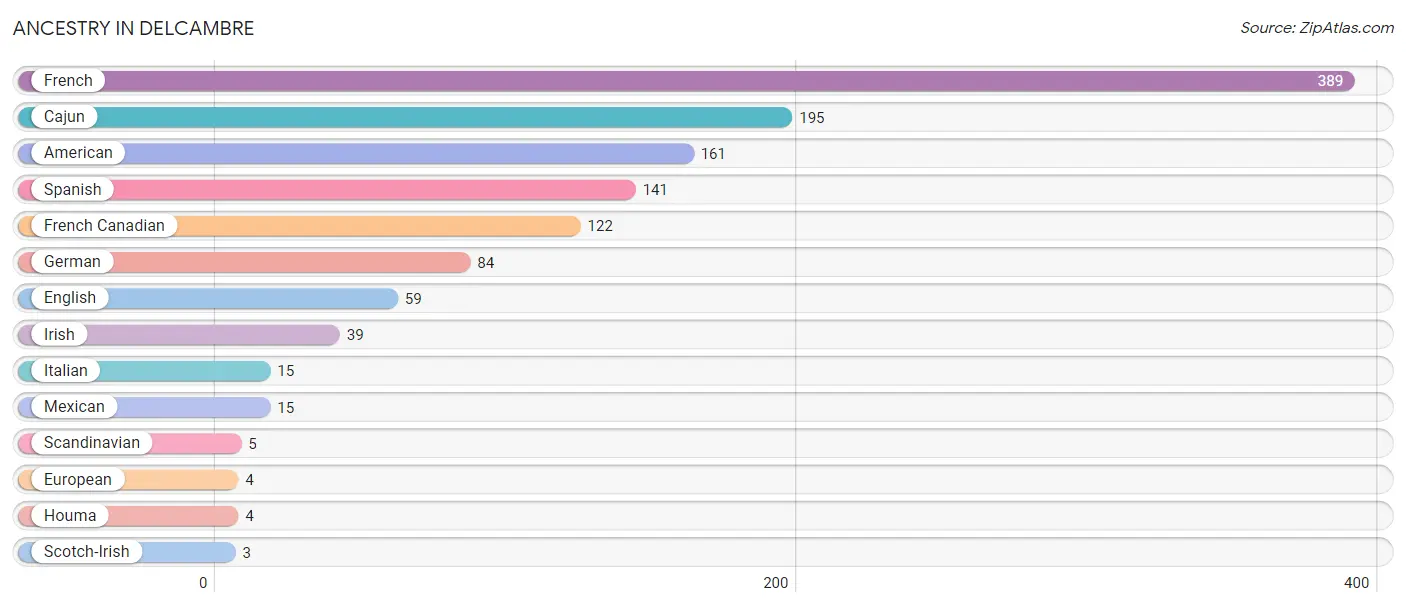
| Ancestry | # Population | % Population |
| American | 161 | 6.7% |
| Cajun | 195 | 8.1% |
| English | 59 | 2.4% |
| European | 4 | 0.2% |
| French | 389 | 16.1% |
| French Canadian | 122 | 5.0% |
| German | 84 | 3.5% |
| Houma | 4 | 0.2% |
| Irish | 39 | 1.6% |
| Italian | 15 | 0.6% |
| Mexican | 15 | 0.6% |
| Scandinavian | 5 | 0.2% |
| Scotch-Irish | 3 | 0.1% |
| Spanish | 141 | 5.8% | View All 14 Rows |
Immigrants in Delcambre
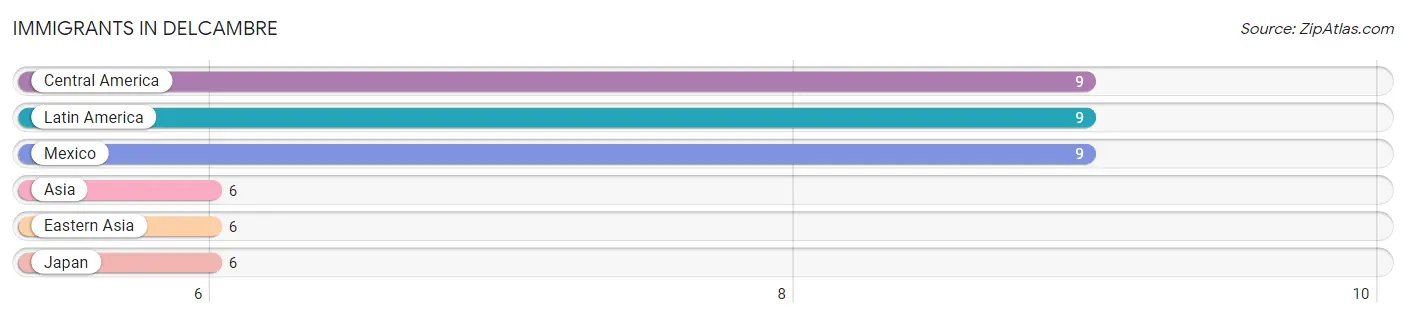
The most numerous immigrant groups reported in Delcambre came from Central America (9 | 0.4%), Latin America (9 | 0.4%), Mexico (9 | 0.4%), Asia (6 | 0.3%), and Eastern Asia (6 | 0.3%), together accounting for 1.6% of all Delcambre residents.
| Immigration Origin | # Population | % Population |
| Asia | 6 | 0.3% |
| Central America | 9 | 0.4% |
| Eastern Asia | 6 | 0.3% |
| Japan | 6 | 0.3% |
| Latin America | 9 | 0.4% |
| Mexico | 9 | 0.4% | View All 6 Rows |
Sex and Age in Delcambre
Sex and Age in Delcambre
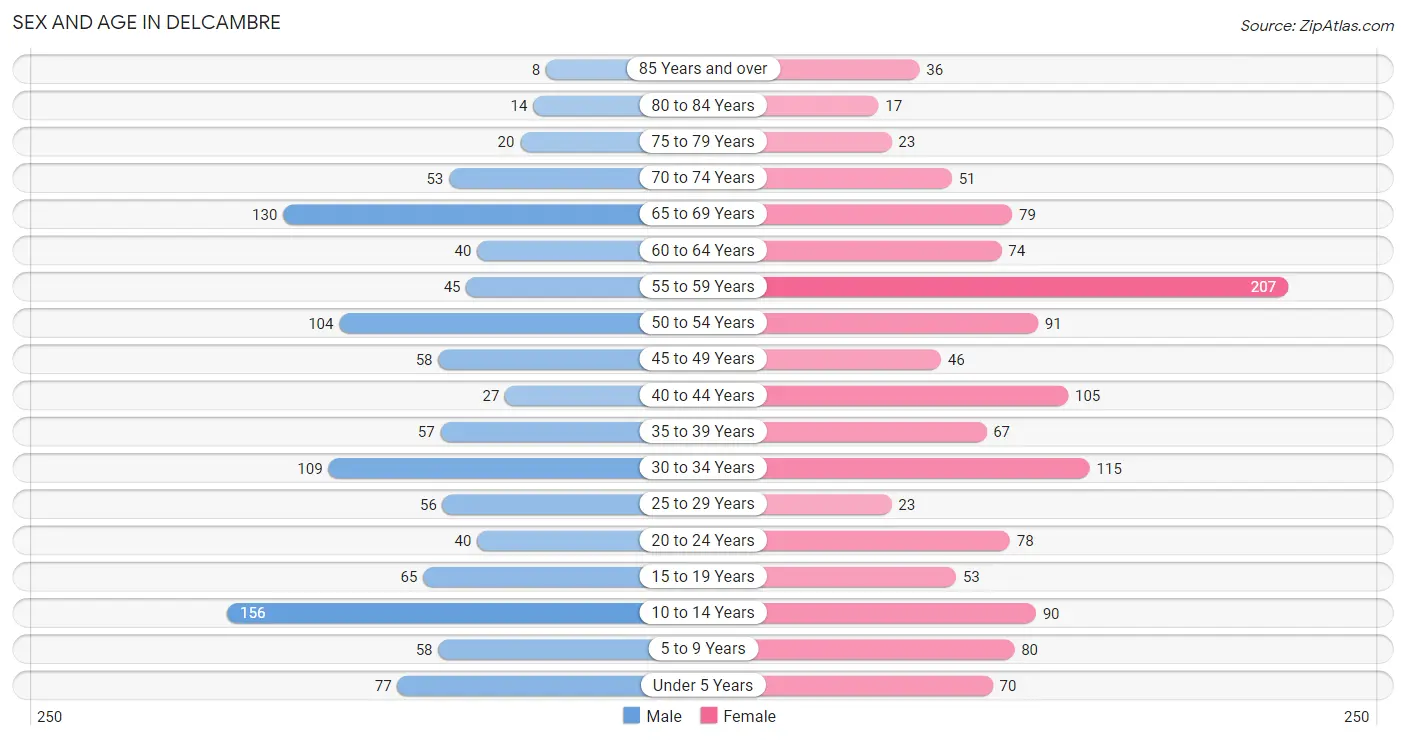
The most populous age groups in Delcambre are 10 to 14 Years (156 | 14.0%) for men and 55 to 59 Years (207 | 15.9%) for women.
| Age Bracket | Male | Female |
| Under 5 Years | 77 (6.9%) | 70 (5.4%) |
| 5 to 9 Years | 58 (5.2%) | 80 (6.1%) |
| 10 to 14 Years | 156 (14.0%) | 90 (6.9%) |
| 15 to 19 Years | 65 (5.8%) | 53 (4.1%) |
| 20 to 24 Years | 40 (3.6%) | 78 (6.0%) |
| 25 to 29 Years | 56 (5.0%) | 23 (1.8%) |
| 30 to 34 Years | 109 (9.8%) | 115 (8.8%) |
| 35 to 39 Years | 57 (5.1%) | 67 (5.1%) |
| 40 to 44 Years | 27 (2.4%) | 105 (8.1%) |
| 45 to 49 Years | 58 (5.2%) | 46 (3.5%) |
| 50 to 54 Years | 104 (9.3%) | 91 (7.0%) |
| 55 to 59 Years | 45 (4.0%) | 207 (15.9%) |
| 60 to 64 Years | 40 (3.6%) | 74 (5.7%) |
| 65 to 69 Years | 130 (11.6%) | 79 (6.0%) |
| 70 to 74 Years | 53 (4.7%) | 51 (3.9%) |
| 75 to 79 Years | 20 (1.8%) | 23 (1.8%) |
| 80 to 84 Years | 14 (1.3%) | 17 (1.3%) |
| 85 Years and over | 8 (0.7%) | 36 (2.8%) |
| Total | 1,117 (100.0%) | 1,305 (100.0%) |
Families and Households in Delcambre
Median Family Size in Delcambre
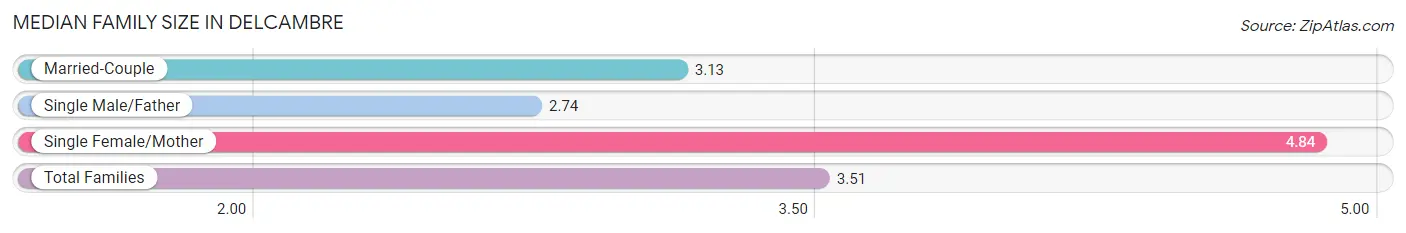
The median family size in Delcambre is 3.51 persons per family, with single female/mother families (134 | 23.9%) accounting for the largest median family size of 4.84 persons per family. On the other hand, single male/father families (47 | 8.4%) represent the smallest median family size with 2.74 persons per family.
| Family Type | # Families | Family Size |
| Married-Couple | 380 (67.7%) | 3.13 |
| Single Male/Father | 47 (8.4%) | 2.74 |
| Single Female/Mother | 134 (23.9%) | 4.84 |
| Total Families | 561 (100.0%) | 3.51 |
Median Household Size in Delcambre
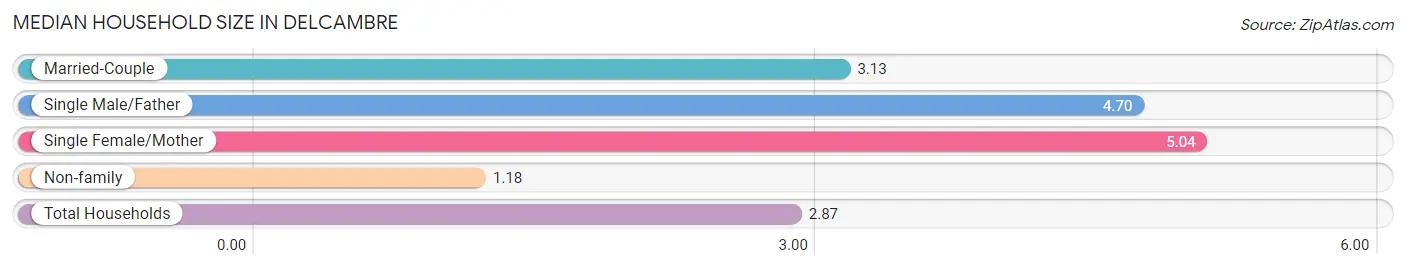
The median household size in Delcambre is 2.87 persons per household, with single female/mother households (134 | 15.9%) accounting for the largest median household size of 5.04 persons per household. non-family households (283 | 33.5%) represent the smallest median household size with 1.18 persons per household.
| Household Type | # Households | Household Size |
| Married-Couple | 380 (45.0%) | 3.13 |
| Single Male/Father | 47 (5.6%) | 4.70 |
| Single Female/Mother | 134 (15.9%) | 5.04 |
| Non-family | 283 (33.5%) | 1.18 |
| Total Households | 844 (100.0%) | 2.87 |
Household Size by Marriage Status in Delcambre
Out of a total of 844 households in Delcambre, 561 (66.5%) are family households, while 283 (33.5%) are nonfamily households. The most numerous type of family households are 2-person households, comprising 183, and the most common type of nonfamily households are 1-person households, comprising 237.
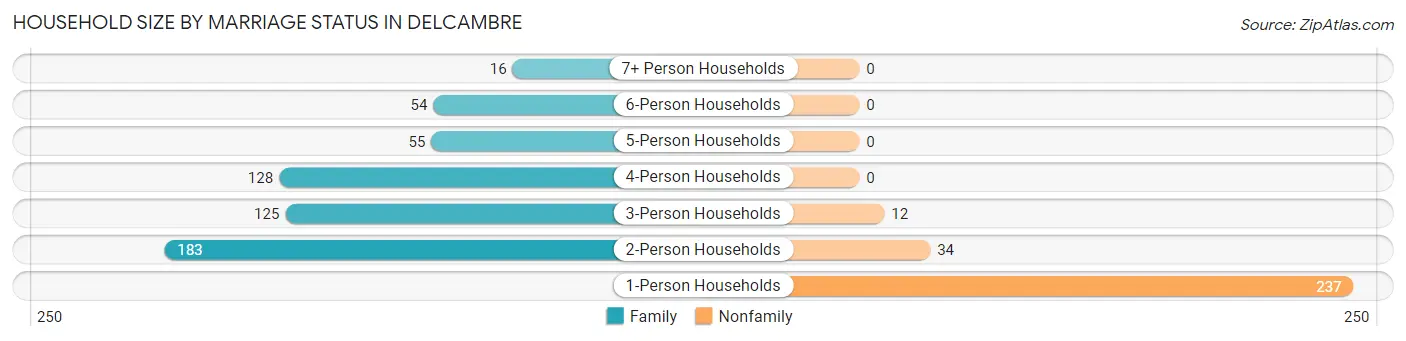
| Household Size | Family Households | Nonfamily Households |
| 1-Person Households | - | 237 (28.1%) |
| 2-Person Households | 183 (21.7%) | 34 (4.0%) |
| 3-Person Households | 125 (14.8%) | 12 (1.4%) |
| 4-Person Households | 128 (15.2%) | 0 (0.0%) |
| 5-Person Households | 55 (6.5%) | 0 (0.0%) |
| 6-Person Households | 54 (6.4%) | 0 (0.0%) |
| 7+ Person Households | 16 (1.9%) | 0 (0.0%) |
| Total | 561 (66.5%) | 283 (33.5%) |
Female Fertility in Delcambre
Fertility by Age in Delcambre
Average fertility rate in Delcambre is 48.0 births per 1,000 women. Women in the age bracket of 20 to 34 years have the highest fertility rate with 111.0 births per 1,000 women. Women in the age bracket of 20 to 34 years acount for 100.0% of all women with births.
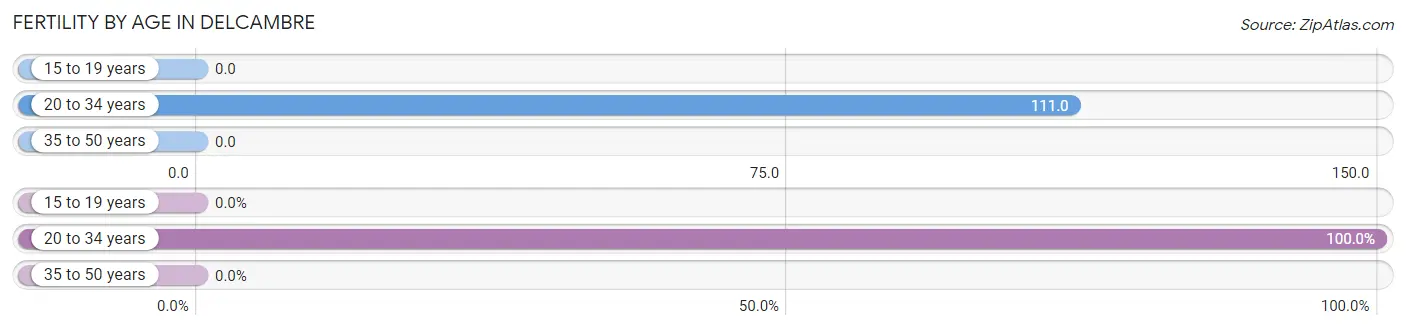
| Age Bracket | Women with Births | Births / 1,000 Women |
| 15 to 19 years | 0 (0.0%) | 0.0 |
| 20 to 34 years | 24 (100.0%) | 111.0 |
| 35 to 50 years | 0 (0.0%) | 0.0 |
| Total | 24 (100.0%) | 48.0 |
Fertility by Age by Marriage Status in Delcambre
70.8% of women with births (24) in Delcambre are married. The highest percentage of unmarried women with births falls into 20 to 34 years age bracket with 29.2% of them unmarried at the time of birth, while the lowest percentage of unmarried women with births belong to 20 to 34 years age bracket with 29.2% of them unmarried.
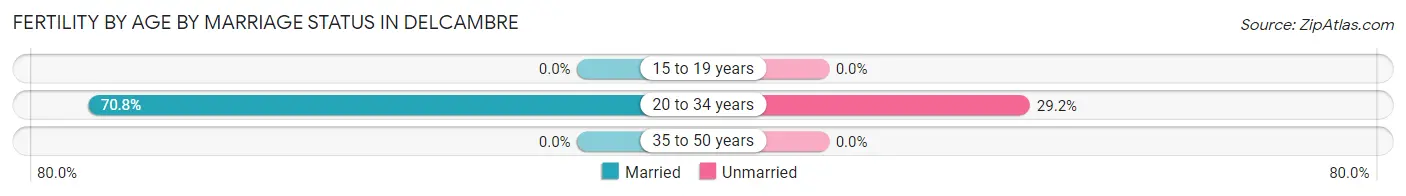
| Age Bracket | Married | Unmarried |
| 15 to 19 years | 0 (0.0%) | 0 (0.0%) |
| 20 to 34 years | 17 (70.8%) | 7 (29.2%) |
| 35 to 50 years | 0 (0.0%) | 0 (0.0%) |
| Total | 17 (70.8%) | 7 (29.2%) |
Fertility by Education in Delcambre
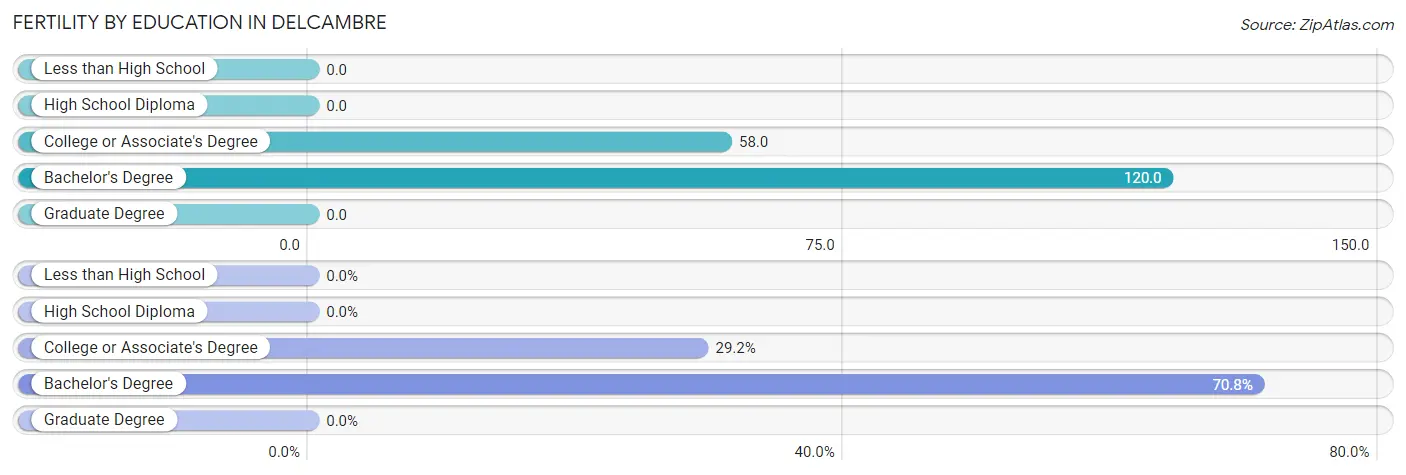
| Educational Attainment | Women with Births | Births / 1,000 Women |
| Less than High School | 0 (0.0%) | 0.0 |
| High School Diploma | 0 (0.0%) | 0.0 |
| College or Associate's Degree | 7 (29.2%) | 58.0 |
| Bachelor's Degree | 17 (70.8%) | 120.0 |
| Graduate Degree | 0 (0.0%) | 0.0 |
| Total | 24 (100.0%) | 48.0 |
Fertility by Education by Marriage Status in Delcambre
29.2% of women with births in Delcambre are unmarried. Women with the educational attainment of bachelor's degree are most likely to be married with 100.0% of them married at childbirth, while women with the educational attainment of college or associate's degree are least likely to be married with 100.0% of them unmarried at childbirth.
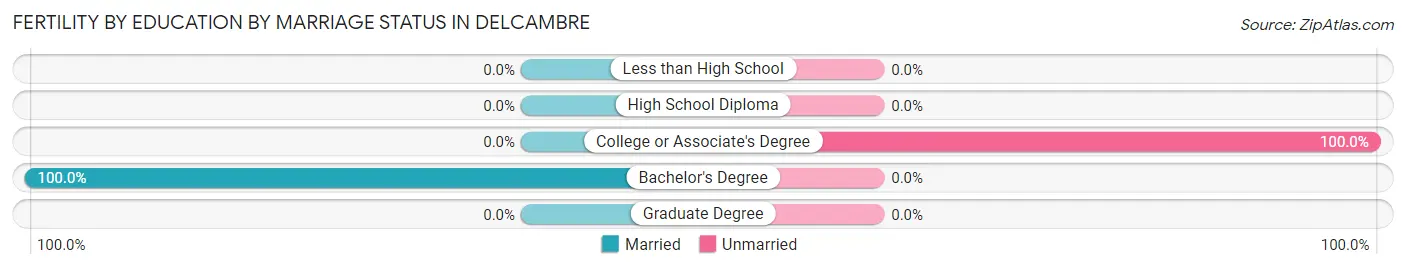
| Educational Attainment | Married | Unmarried |
| Less than High School | 0 (0.0%) | 0 (0.0%) |
| High School Diploma | 0 (0.0%) | 0 (0.0%) |
| College or Associate's Degree | 0 (0.0%) | 7 (100.0%) |
| Bachelor's Degree | 17 (100.0%) | 0 (0.0%) |
| Graduate Degree | 0 (0.0%) | 0 (0.0%) |
| Total | 17 (70.8%) | 7 (29.2%) |
Employment Characteristics in Delcambre
Employment by Class of Employer in Delcambre
Among the 815 employed individuals in Delcambre, private company employees (536 | 65.8%), local government employees (83 | 10.2%), and self-employed (not incorporated) (78 | 9.6%) make up the most common classes of employment.
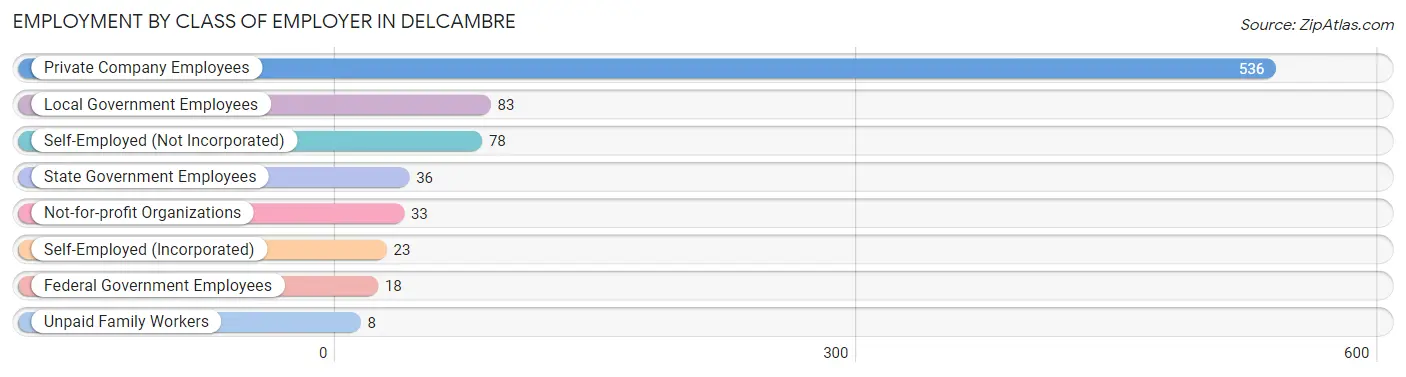
| Employer Class | # Employees | % Employees |
| Private Company Employees | 536 | 65.8% |
| Self-Employed (Incorporated) | 23 | 2.8% |
| Self-Employed (Not Incorporated) | 78 | 9.6% |
| Not-for-profit Organizations | 33 | 4.1% |
| Local Government Employees | 83 | 10.2% |
| State Government Employees | 36 | 4.4% |
| Federal Government Employees | 18 | 2.2% |
| Unpaid Family Workers | 8 | 1.0% |
| Total | 815 | 100.0% |
Employment Status by Age in Delcambre
According to the labor force statistics for Delcambre, out of the total population over 16 years of age (1,835), 52.4% or 962 individuals are in the labor force, with 5.7% or 55 of them unemployed. The age group with the highest labor force participation rate is 30 to 34 years, with 88.8% or 199 individuals in the labor force. Within the labor force, the 30 to 34 years age range has the highest percentage of unemployed individuals, with 15.6% or 31 of them being unemployed.
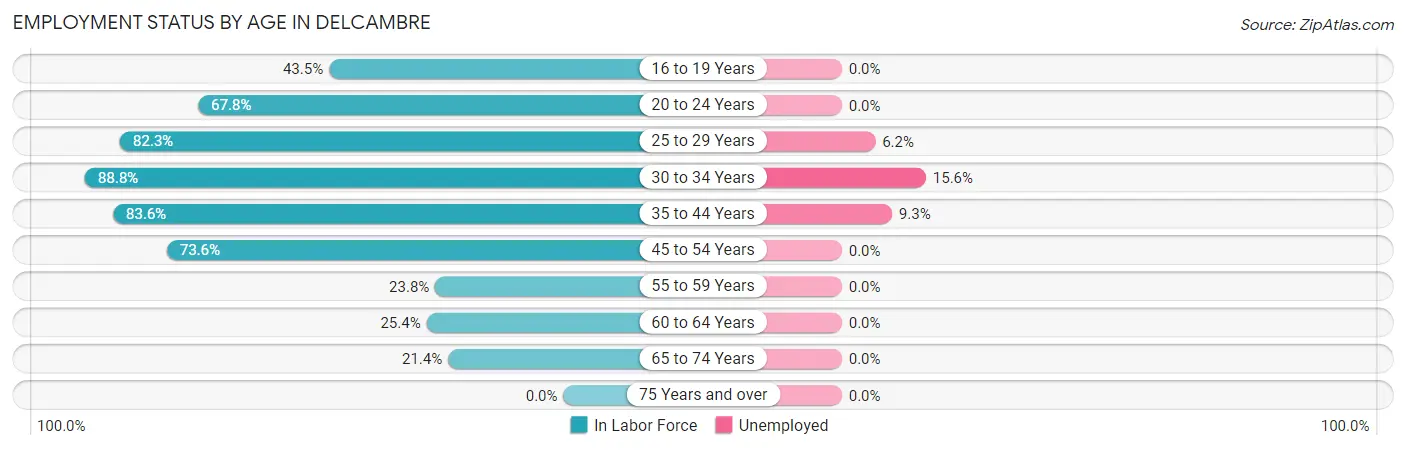
| Age Bracket | In Labor Force | Unemployed |
| 16 to 19 Years | 27 (43.5%) | 0 (0.0%) |
| 20 to 24 Years | 80 (67.8%) | 0 (0.0%) |
| 25 to 29 Years | 65 (82.3%) | 4 (6.2%) |
| 30 to 34 Years | 199 (88.8%) | 31 (15.6%) |
| 35 to 44 Years | 214 (83.6%) | 20 (9.3%) |
| 45 to 54 Years | 220 (73.6%) | 0 (0.0%) |
| 55 to 59 Years | 60 (23.8%) | 0 (0.0%) |
| 60 to 64 Years | 29 (25.4%) | 0 (0.0%) |
| 65 to 74 Years | 67 (21.4%) | 0 (0.0%) |
| 75 Years and over | 0 (0.0%) | 0 (0.0%) |
| Total | 962 (52.4%) | 55 (5.7%) |
Employment Status by Educational Attainment in Delcambre
According to labor force statistics for Delcambre, 64.3% of individuals (787) out of the total population between 25 and 64 years of age (1,224) are in the labor force, with 7.0% or 55 of them being unemployed. The group with the highest labor force participation rate are those with the educational attainment of bachelor's degree or higher, with 96.4% or 212 individuals in the labor force. Within the labor force, individuals with bachelor's degree or higher education have the highest percentage of unemployment, with 11.8% or 25 of them being unemployed.
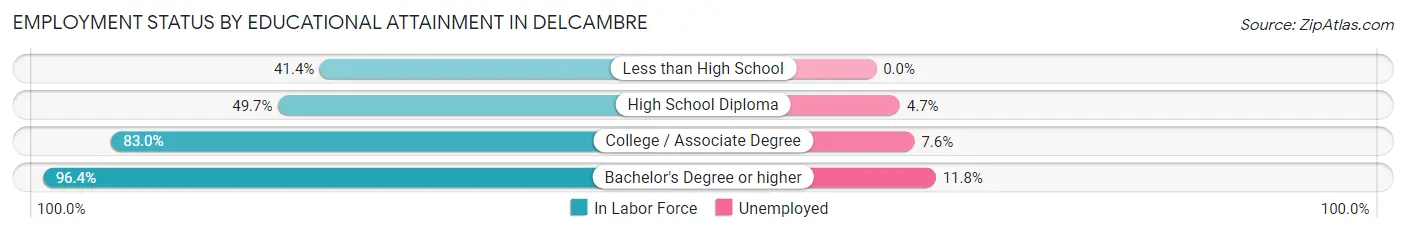
| Educational Attainment | In Labor Force | Unemployed |
| Less than High School | 72 (41.4%) | 0 (0.0%) |
| High School Diploma | 278 (49.7%) | 26 (4.7%) |
| College / Associate Degree | 225 (83.0%) | 21 (7.6%) |
| Bachelor's Degree or higher | 212 (96.4%) | 26 (11.8%) |
| Total | 787 (64.3%) | 86 (7.0%) |
Employment Occupations by Sex in Delcambre
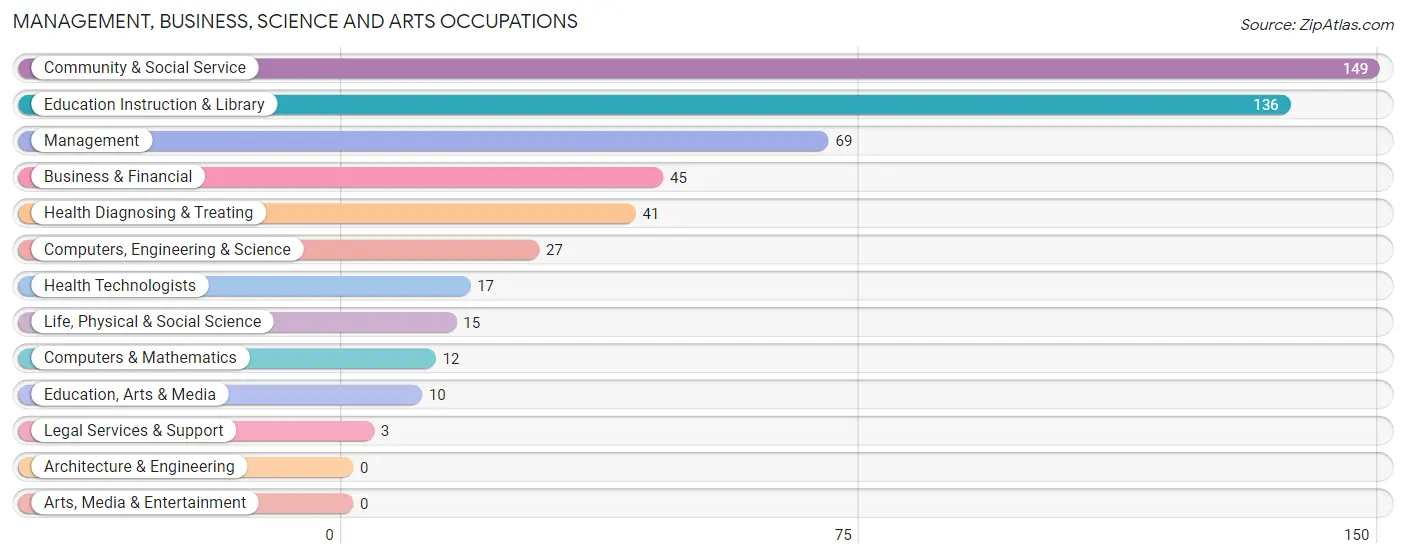
Management, Business, Science and Arts Occupations
The most common Management, Business, Science and Arts occupations in Delcambre are Community & Social Service (149 | 16.5%), Education Instruction & Library (136 | 15.0%), Management (69 | 7.6%), Business & Financial (45 | 5.0%), and Health Diagnosing & Treating (41 | 4.5%).
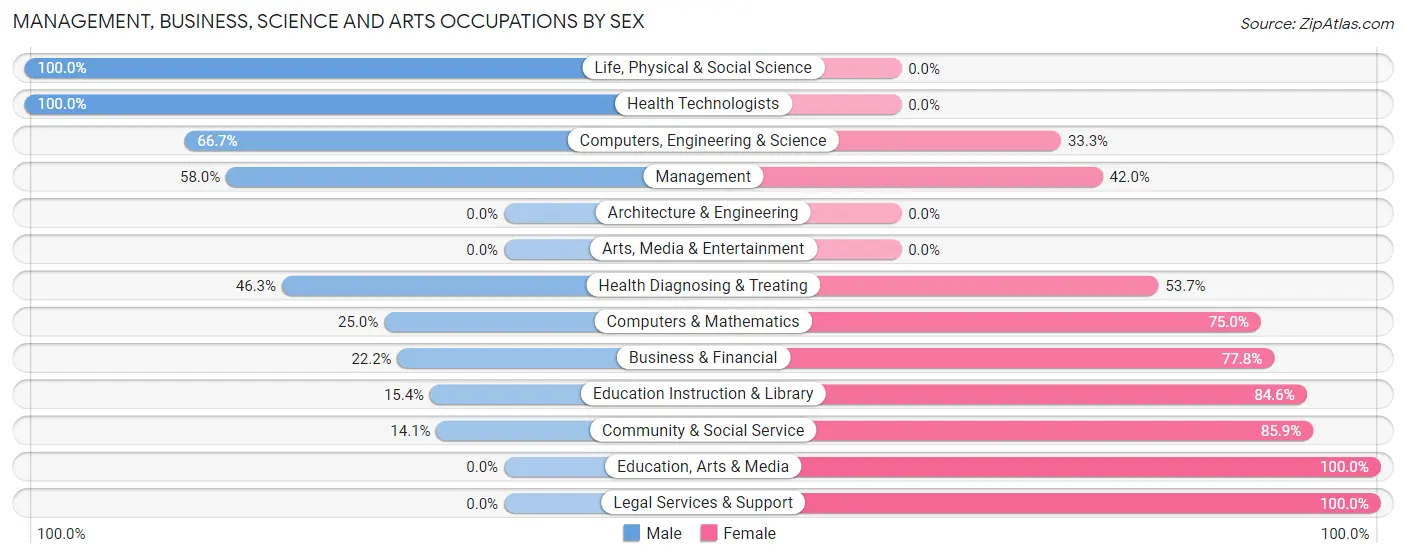
Management, Business, Science and Arts Occupations by Sex
Within the Management, Business, Science and Arts occupations in Delcambre, the most male-oriented occupations are Life, Physical & Social Science (100.0%), Health Technologists (100.0%), and Computers, Engineering & Science (66.7%), while the most female-oriented occupations are Education, Arts & Media (100.0%), Legal Services & Support (100.0%), and Community & Social Service (85.9%).
| Occupation | Male | Female |
| Management | 40 (58.0%) | 29 (42.0%) |
| Business & Financial | 10 (22.2%) | 35 (77.8%) |
| Computers, Engineering & Science | 18 (66.7%) | 9 (33.3%) |
| Computers & Mathematics | 3 (25.0%) | 9 (75.0%) |
| Architecture & Engineering | 0 (0.0%) | 0 (0.0%) |
| Life, Physical & Social Science | 15 (100.0%) | 0 (0.0%) |
| Community & Social Service | 21 (14.1%) | 128 (85.9%) |
| Education, Arts & Media | 0 (0.0%) | 10 (100.0%) |
| Legal Services & Support | 0 (0.0%) | 3 (100.0%) |
| Education Instruction & Library | 21 (15.4%) | 115 (84.6%) |
| Arts, Media & Entertainment | 0 (0.0%) | 0 (0.0%) |
| Health Diagnosing & Treating | 19 (46.3%) | 22 (53.7%) |
| Health Technologists | 17 (100.0%) | 0 (0.0%) |
| Total (Category) | 108 (32.6%) | 223 (67.4%) |
| Total (Overall) | 446 (49.2%) | 460 (50.8%) |
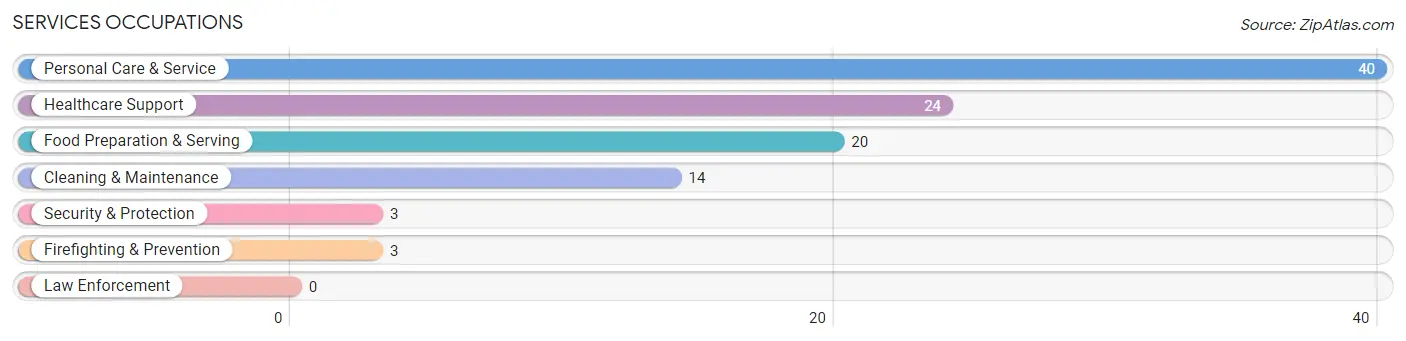
Services Occupations
The most common Services occupations in Delcambre are Personal Care & Service (40 | 4.4%), Healthcare Support (24 | 2.6%), Food Preparation & Serving (20 | 2.2%), Cleaning & Maintenance (14 | 1.5%), and Security & Protection (3 | 0.3%).
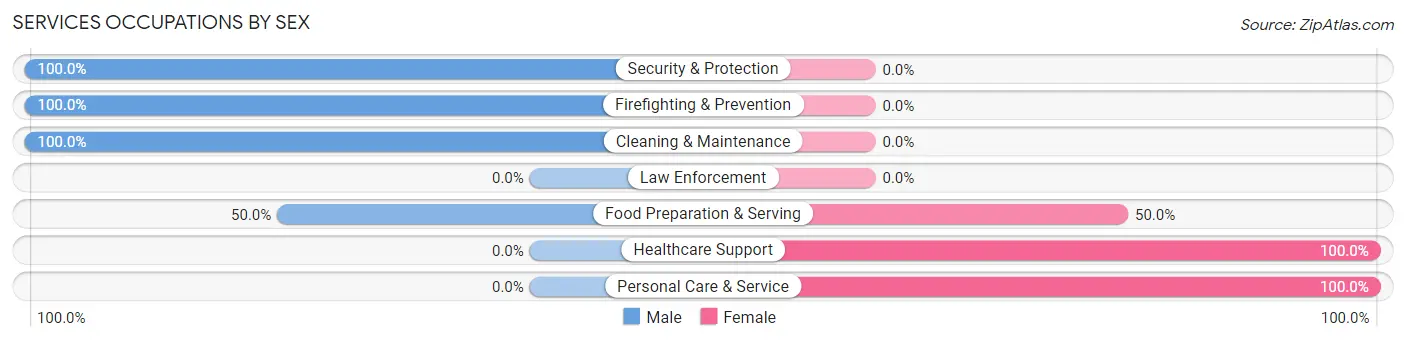
Services Occupations by Sex
Within the Services occupations in Delcambre, the most male-oriented occupations are Security & Protection (100.0%), Firefighting & Prevention (100.0%), and Cleaning & Maintenance (100.0%), while the most female-oriented occupations are Healthcare Support (100.0%), Personal Care & Service (100.0%), and Food Preparation & Serving (50.0%).
| Occupation | Male | Female |
| Healthcare Support | 0 (0.0%) | 24 (100.0%) |
| Security & Protection | 3 (100.0%) | 0 (0.0%) |
| Firefighting & Prevention | 3 (100.0%) | 0 (0.0%) |
| Law Enforcement | 0 (0.0%) | 0 (0.0%) |
| Food Preparation & Serving | 10 (50.0%) | 10 (50.0%) |
| Cleaning & Maintenance | 14 (100.0%) | 0 (0.0%) |
| Personal Care & Service | 0 (0.0%) | 40 (100.0%) |
| Total (Category) | 27 (26.7%) | 74 (73.3%) |
| Total (Overall) | 446 (49.2%) | 460 (50.8%) |
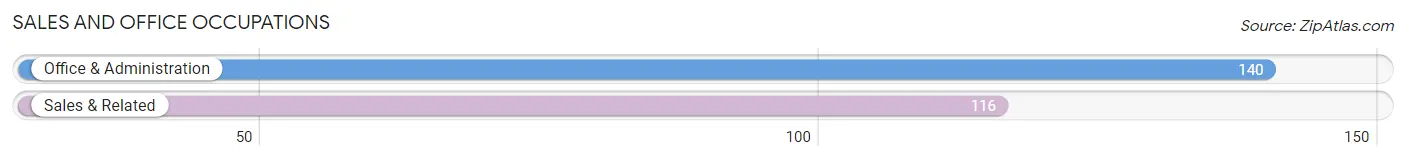
Sales and Office Occupations
The most common Sales and Office occupations in Delcambre are Office & Administration (140 | 15.4%), and Sales & Related (116 | 12.8%).
Sales and Office Occupations by Sex
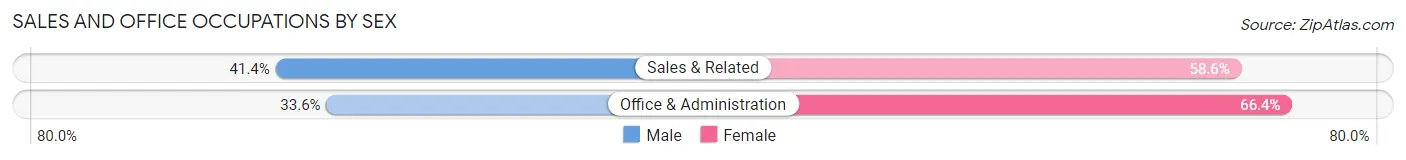
| Occupation | Male | Female |
| Sales & Related | 48 (41.4%) | 68 (58.6%) |
| Office & Administration | 47 (33.6%) | 93 (66.4%) |
| Total (Category) | 95 (37.1%) | 161 (62.9%) |
| Total (Overall) | 446 (49.2%) | 460 (50.8%) |
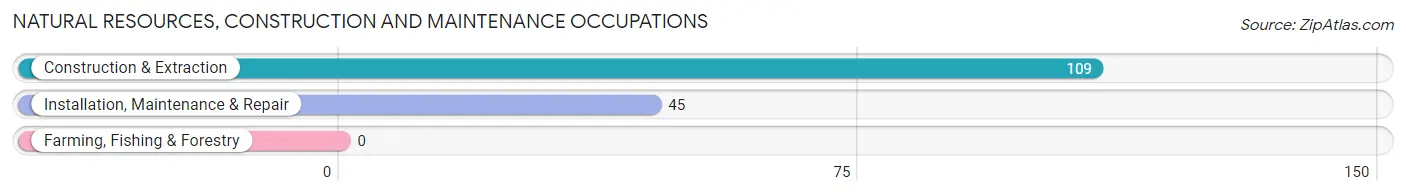
Natural Resources, Construction and Maintenance Occupations
The most common Natural Resources, Construction and Maintenance occupations in Delcambre are Construction & Extraction (109 | 12.0%), and Installation, Maintenance & Repair (45 | 5.0%).
Natural Resources, Construction and Maintenance Occupations by Sex
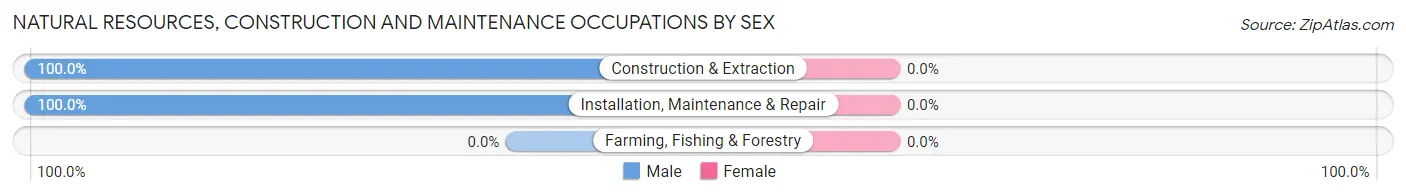
| Occupation | Male | Female |
| Farming, Fishing & Forestry | 0 (0.0%) | 0 (0.0%) |
| Construction & Extraction | 109 (100.0%) | 0 (0.0%) |
| Installation, Maintenance & Repair | 45 (100.0%) | 0 (0.0%) |
| Total (Category) | 154 (100.0%) | 0 (0.0%) |
| Total (Overall) | 446 (49.2%) | 460 (50.8%) |
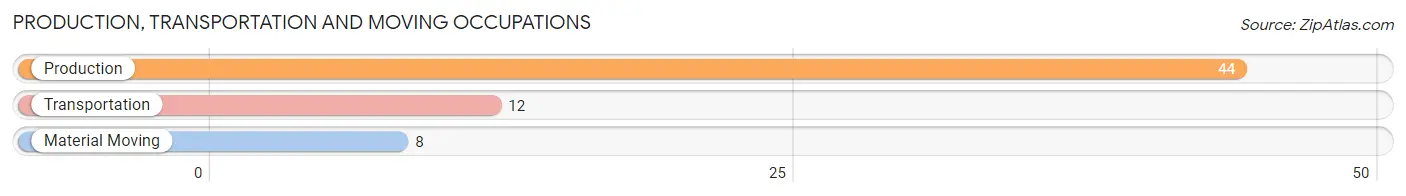
Production, Transportation and Moving Occupations
The most common Production, Transportation and Moving occupations in Delcambre are Production (44 | 4.9%), Transportation (12 | 1.3%), and Material Moving (8 | 0.9%).
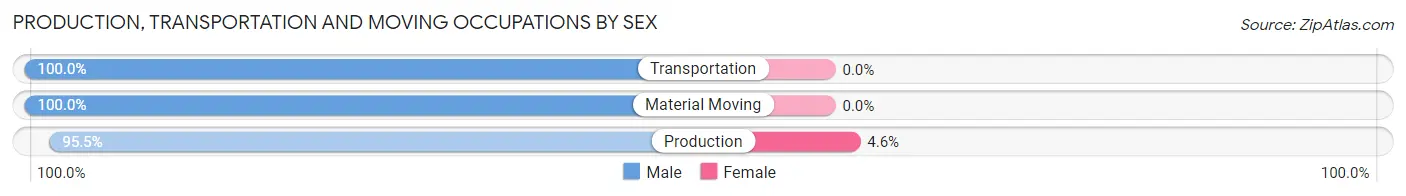
Production, Transportation and Moving Occupations by Sex
| Occupation | Male | Female |
| Production | 42 (95.5%) | 2 (4.5%) |
| Transportation | 12 (100.0%) | 0 (0.0%) |
| Material Moving | 8 (100.0%) | 0 (0.0%) |
| Total (Category) | 62 (96.9%) | 2 (3.1%) |
| Total (Overall) | 446 (49.2%) | 460 (50.8%) |
Employment Industries by Sex in Delcambre
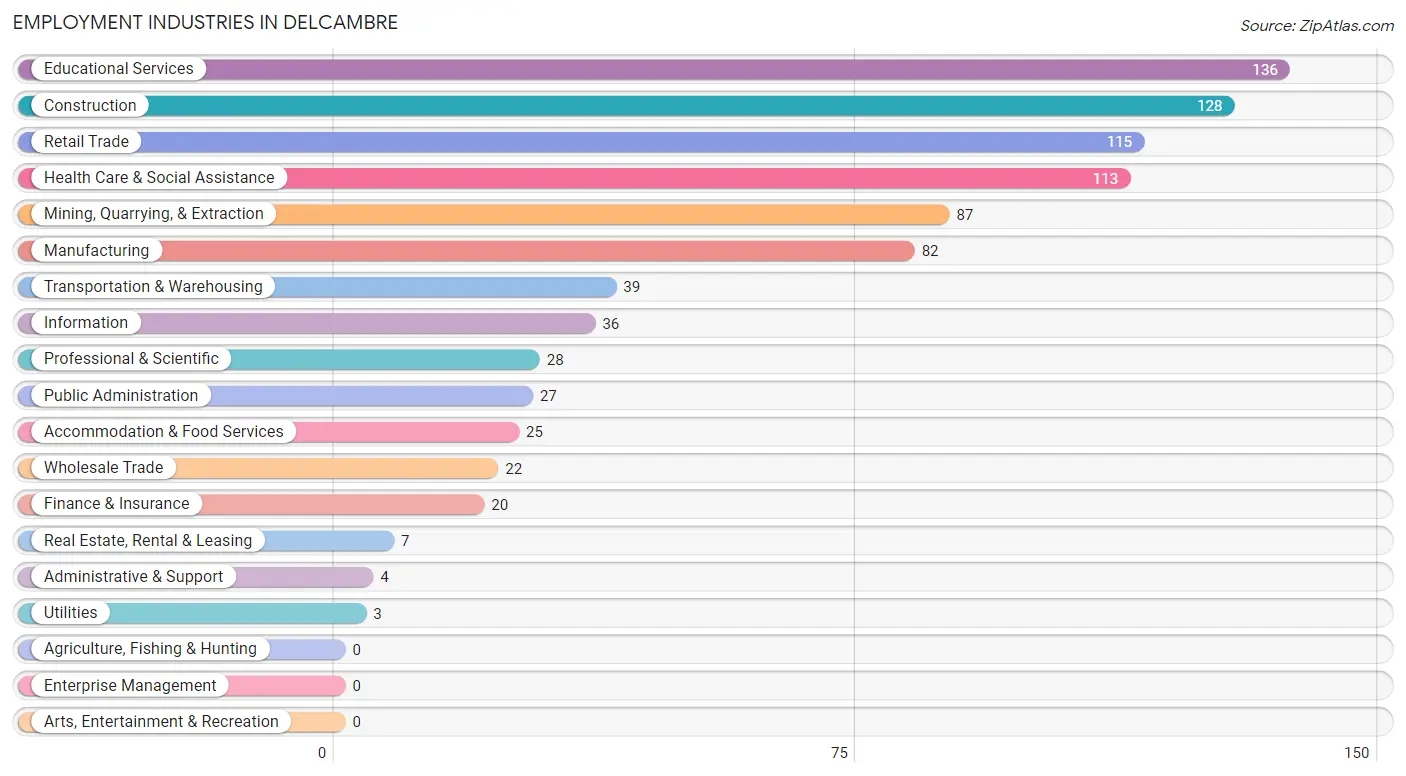
Employment Industries in Delcambre
The major employment industries in Delcambre include Educational Services (136 | 15.0%), Construction (128 | 14.1%), Retail Trade (115 | 12.7%), Health Care & Social Assistance (113 | 12.5%), and Mining, Quarrying, & Extraction (87 | 9.6%).
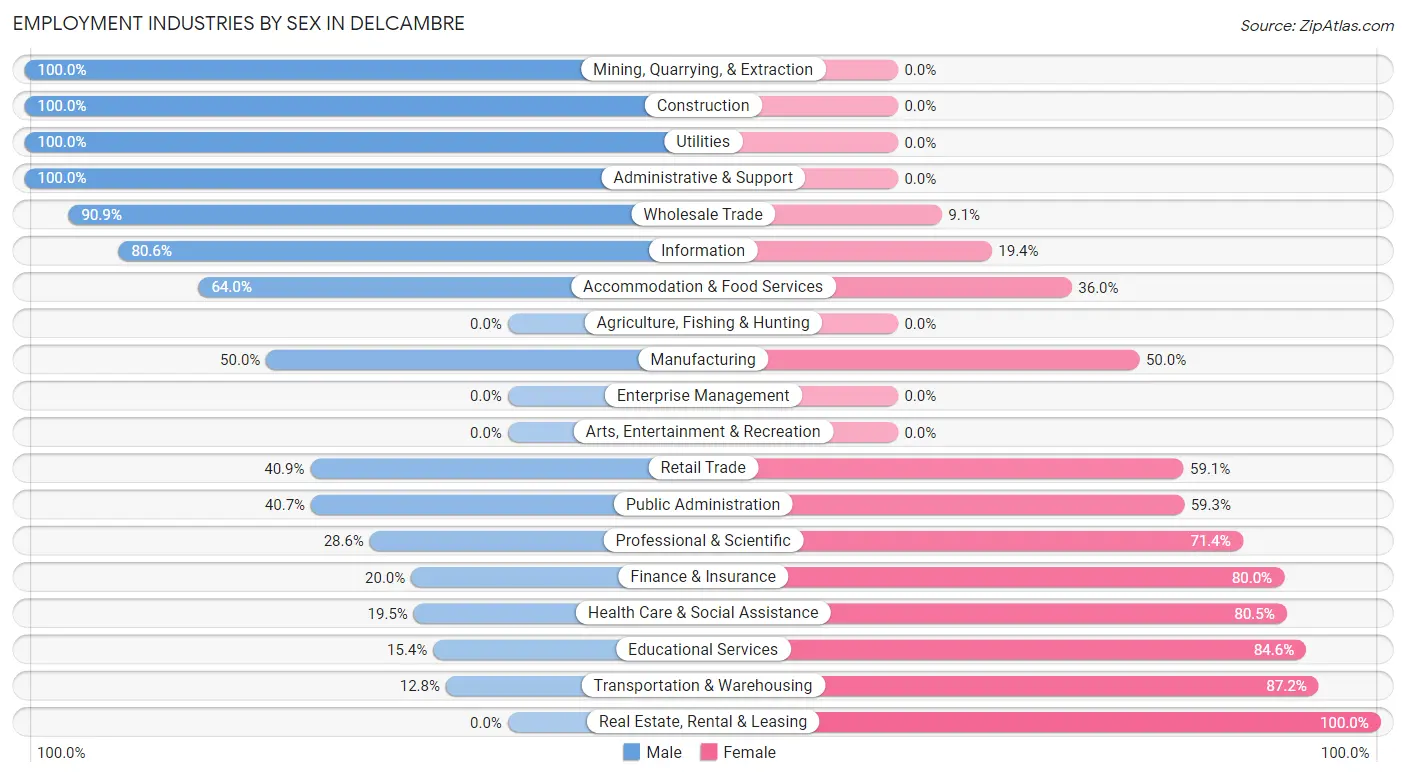
Employment Industries by Sex in Delcambre
The Delcambre industries that see more men than women are Mining, Quarrying, & Extraction (100.0%), Construction (100.0%), and Utilities (100.0%), whereas the industries that tend to have a higher number of women are Real Estate, Rental & Leasing (100.0%), Transportation & Warehousing (87.2%), and Educational Services (84.6%).
| Industry | Male | Female |
| Agriculture, Fishing & Hunting | 0 (0.0%) | 0 (0.0%) |
| Mining, Quarrying, & Extraction | 87 (100.0%) | 0 (0.0%) |
| Construction | 128 (100.0%) | 0 (0.0%) |
| Manufacturing | 41 (50.0%) | 41 (50.0%) |
| Wholesale Trade | 20 (90.9%) | 2 (9.1%) |
| Retail Trade | 47 (40.9%) | 68 (59.1%) |
| Transportation & Warehousing | 5 (12.8%) | 34 (87.2%) |
| Utilities | 3 (100.0%) | 0 (0.0%) |
| Information | 29 (80.6%) | 7 (19.4%) |
| Finance & Insurance | 4 (20.0%) | 16 (80.0%) |
| Real Estate, Rental & Leasing | 0 (0.0%) | 7 (100.0%) |
| Professional & Scientific | 8 (28.6%) | 20 (71.4%) |
| Enterprise Management | 0 (0.0%) | 0 (0.0%) |
| Administrative & Support | 4 (100.0%) | 0 (0.0%) |
| Educational Services | 21 (15.4%) | 115 (84.6%) |
| Health Care & Social Assistance | 22 (19.5%) | 91 (80.5%) |
| Arts, Entertainment & Recreation | 0 (0.0%) | 0 (0.0%) |
| Accommodation & Food Services | 16 (64.0%) | 9 (36.0%) |
| Public Administration | 11 (40.7%) | 16 (59.3%) |
| Total | 446 (49.2%) | 460 (50.8%) |
Education in Delcambre
School Enrollment in Delcambre
The most common levels of schooling among the 566 students in Delcambre are middle school (258 | 45.6%), high school (100 | 17.7%), and college / undergraduate (74 | 13.1%).
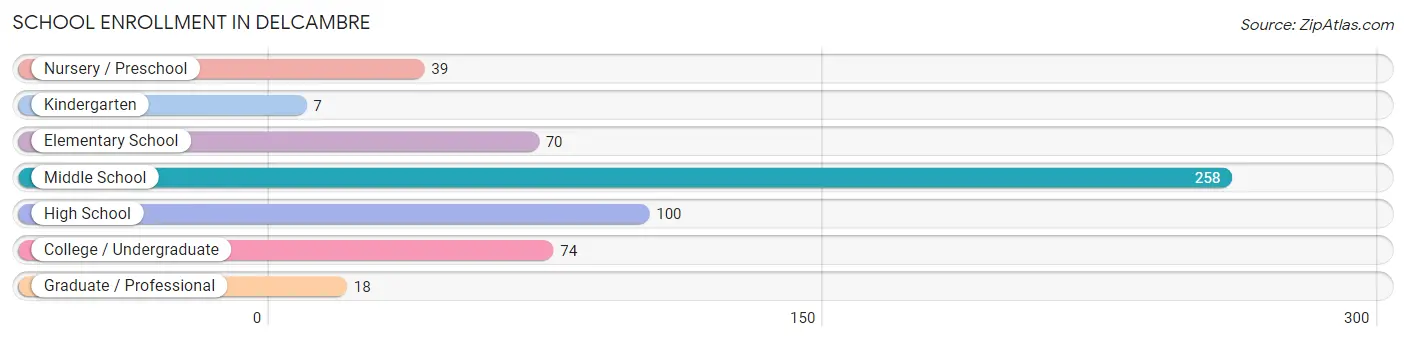
| School Level | # Students | % Students |
| Nursery / Preschool | 39 | 6.9% |
| Kindergarten | 7 | 1.2% |
| Elementary School | 70 | 12.4% |
| Middle School | 258 | 45.6% |
| High School | 100 | 17.7% |
| College / Undergraduate | 74 | 13.1% |
| Graduate / Professional | 18 | 3.2% |
| Total | 566 | 100.0% |
School Enrollment by Age by Funding Source in Delcambre
Out of a total of 566 students who are enrolled in schools in Delcambre, 9 (1.6%) attend a private institution, while the remaining 557 (98.4%) are enrolled in public schools. The age group of 3 to 4 year olds has the highest likelihood of being enrolled in private schools, with 7 (100.0% in the age bracket) enrolled. Conversely, the age group of 5 to 9 year old has the lowest likelihood of being enrolled in a private school, with 138 (100.0% in the age bracket) attending a public institution.
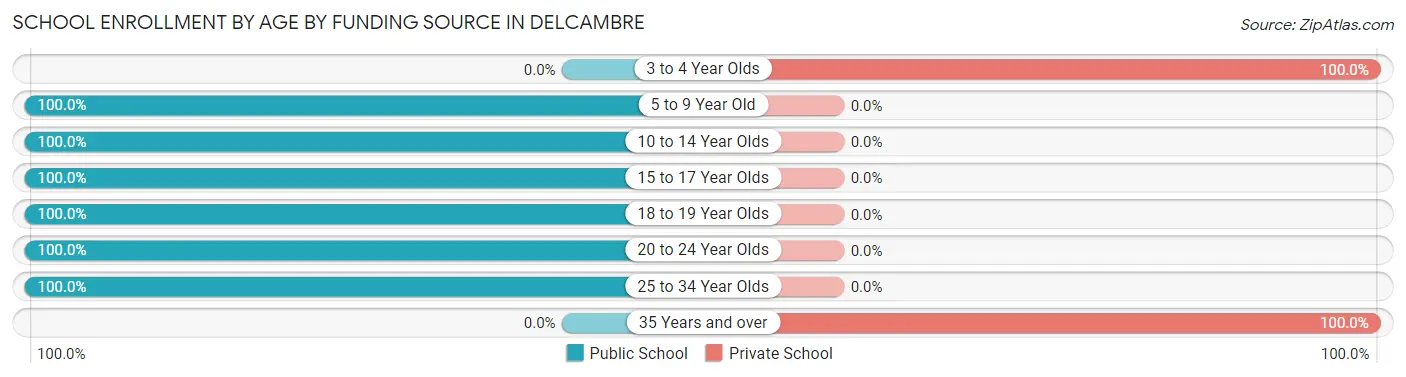
| Age Bracket | Public School | Private School |
| 3 to 4 Year Olds | 0 (0.0%) | 7 (100.0%) |
| 5 to 9 Year Old | 138 (100.0%) | 0 (0.0%) |
| 10 to 14 Year Olds | 246 (100.0%) | 0 (0.0%) |
| 15 to 17 Year Olds | 80 (100.0%) | 0 (0.0%) |
| 18 to 19 Year Olds | 22 (100.0%) | 0 (0.0%) |
| 20 to 24 Year Olds | 42 (100.0%) | 0 (0.0%) |
| 25 to 34 Year Olds | 29 (100.0%) | 0 (0.0%) |
| 35 Years and over | 0 (0.0%) | 2 (100.0%) |
| Total | 557 (98.4%) | 9 (1.6%) |
Educational Attainment by Field of Study in Delcambre
Education (133 | 48.9%), business (40 | 14.7%), science & technology (33 | 12.1%), bio, nature & agricultural (20 | 7.3%), and arts & humanities (19 | 7.0%) are the most common fields of study among 272 individuals in Delcambre who have obtained a bachelor's degree or higher.
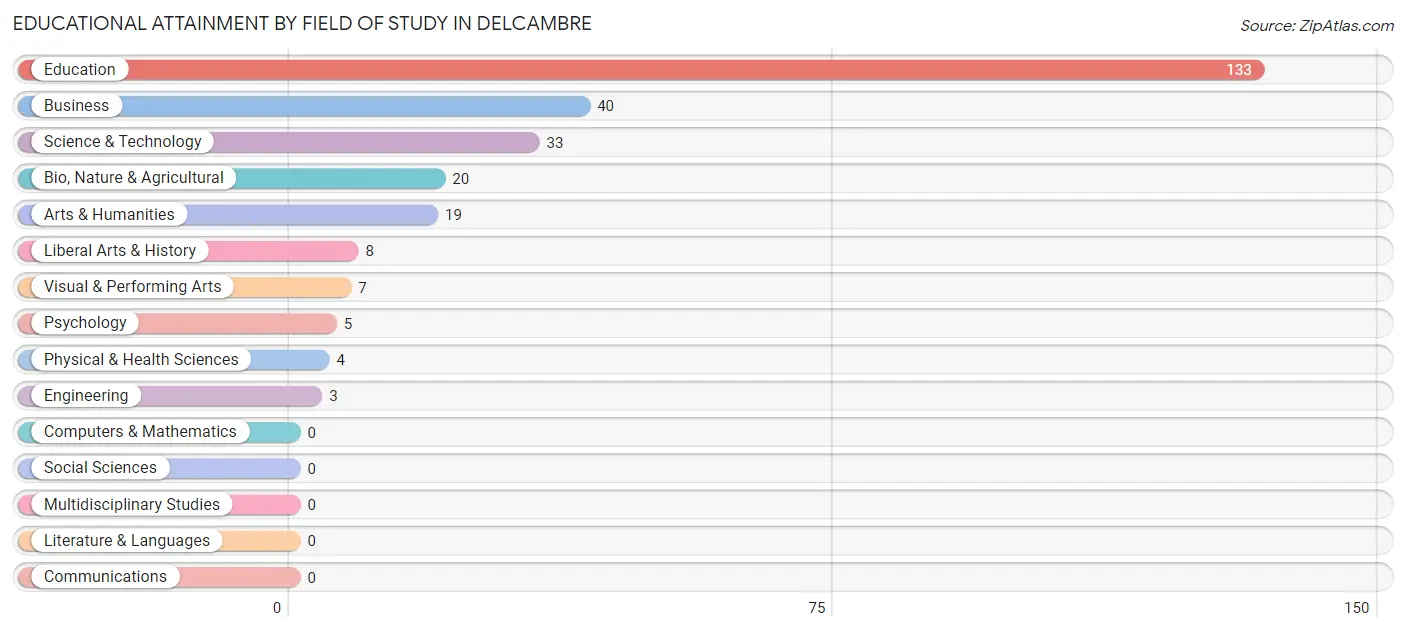
| Field of Study | # Graduates | % Graduates |
| Computers & Mathematics | 0 | 0.0% |
| Bio, Nature & Agricultural | 20 | 7.3% |
| Physical & Health Sciences | 4 | 1.5% |
| Psychology | 5 | 1.8% |
| Social Sciences | 0 | 0.0% |
| Engineering | 3 | 1.1% |
| Multidisciplinary Studies | 0 | 0.0% |
| Science & Technology | 33 | 12.1% |
| Business | 40 | 14.7% |
| Education | 133 | 48.9% |
| Literature & Languages | 0 | 0.0% |
| Liberal Arts & History | 8 | 2.9% |
| Visual & Performing Arts | 7 | 2.6% |
| Communications | 0 | 0.0% |
| Arts & Humanities | 19 | 7.0% |
| Total | 272 | 100.0% |
Transportation & Commute in Delcambre
Vehicle Availability by Sex in Delcambre
The most prevalent vehicle ownership categories in Delcambre are males with 2 vehicles (201, accounting for 48.1%) and females with 2 vehicles (177, making up 50.6%).
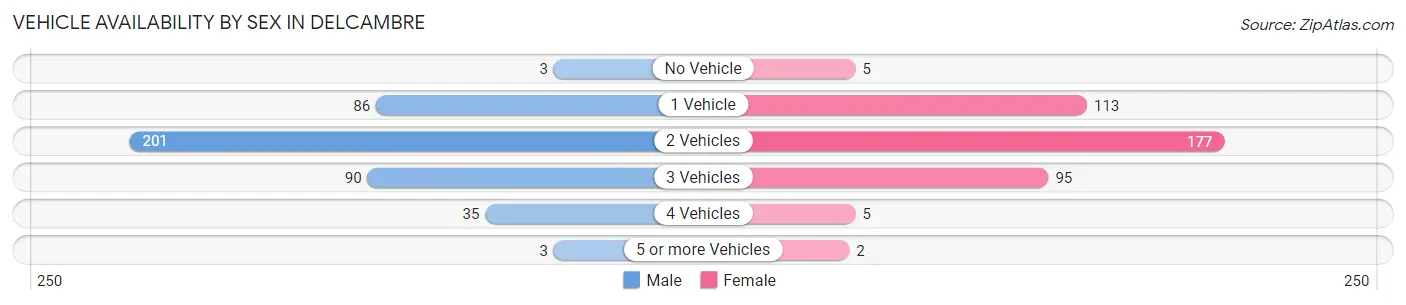
| Vehicles Available | Male | Female |
| No Vehicle | 3 (0.7%) | 5 (1.3%) |
| 1 Vehicle | 86 (20.6%) | 113 (28.5%) |
| 2 Vehicles | 201 (48.1%) | 177 (44.6%) |
| 3 Vehicles | 90 (21.5%) | 95 (23.9%) |
| 4 Vehicles | 35 (8.4%) | 5 (1.3%) |
| 5 or more Vehicles | 3 (0.7%) | 2 (0.5%) |
| Total | 418 (100.0%) | 397 (100.0%) |
Commute Time in Delcambre
The most frequently occuring commute durations in Delcambre are 20 to 24 minutes (142 commuters, 18.1%), 30 to 34 minutes (103 commuters, 13.2%), and less than 5 minutes (93 commuters, 11.9%).
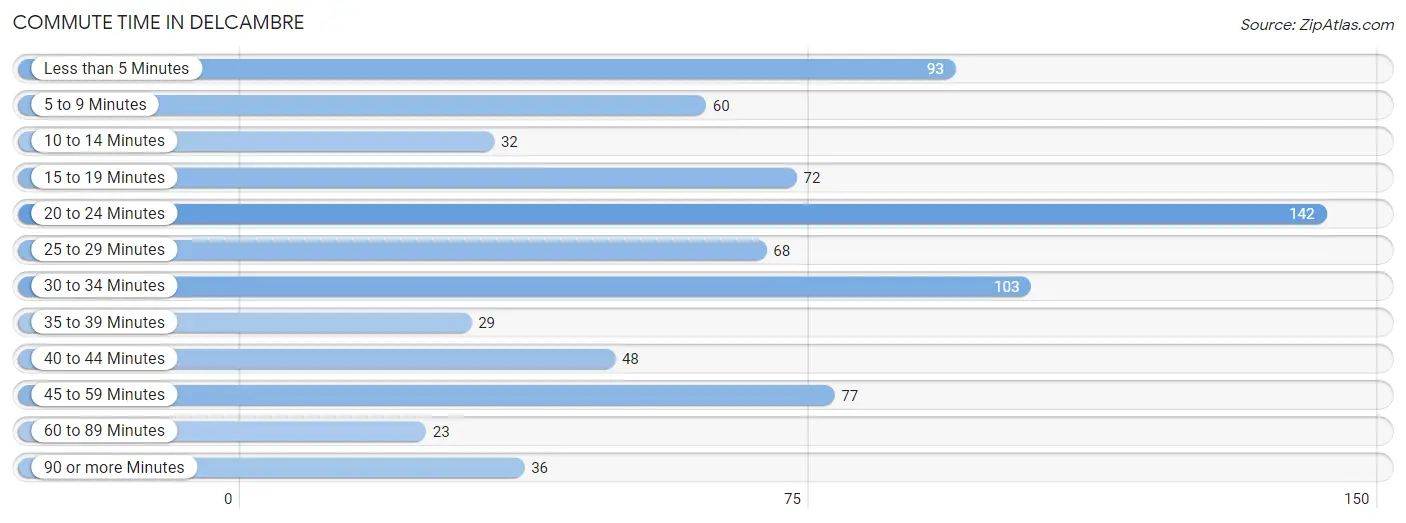
| Commute Time | # Commuters | % Commuters |
| Less than 5 Minutes | 93 | 11.9% |
| 5 to 9 Minutes | 60 | 7.7% |
| 10 to 14 Minutes | 32 | 4.1% |
| 15 to 19 Minutes | 72 | 9.2% |
| 20 to 24 Minutes | 142 | 18.1% |
| 25 to 29 Minutes | 68 | 8.7% |
| 30 to 34 Minutes | 103 | 13.2% |
| 35 to 39 Minutes | 29 | 3.7% |
| 40 to 44 Minutes | 48 | 6.1% |
| 45 to 59 Minutes | 77 | 9.8% |
| 60 to 89 Minutes | 23 | 2.9% |
| 90 or more Minutes | 36 | 4.6% |
Commute Time by Sex in Delcambre
The most common commute times in Delcambre are 20 to 24 minutes (101 commuters, 24.7%) for males and less than 5 minutes (64 commuters, 17.1%) for females.
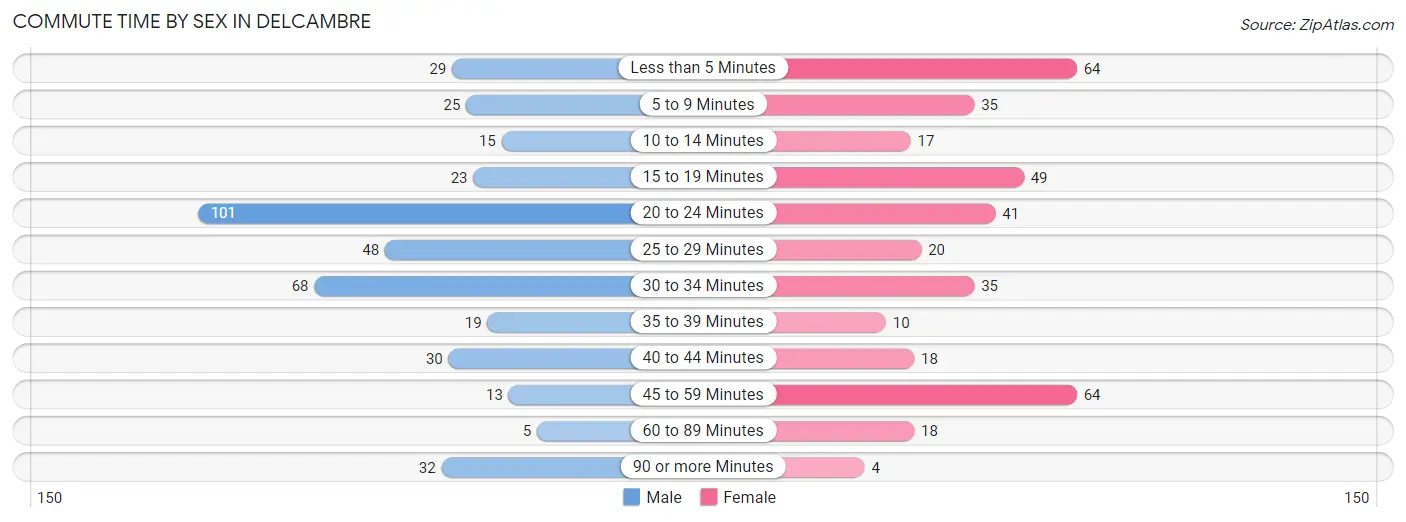
| Commute Time | Male | Female |
| Less than 5 Minutes | 29 (7.1%) | 64 (17.1%) |
| 5 to 9 Minutes | 25 (6.1%) | 35 (9.3%) |
| 10 to 14 Minutes | 15 (3.7%) | 17 (4.5%) |
| 15 to 19 Minutes | 23 (5.6%) | 49 (13.1%) |
| 20 to 24 Minutes | 101 (24.7%) | 41 (10.9%) |
| 25 to 29 Minutes | 48 (11.8%) | 20 (5.3%) |
| 30 to 34 Minutes | 68 (16.7%) | 35 (9.3%) |
| 35 to 39 Minutes | 19 (4.7%) | 10 (2.7%) |
| 40 to 44 Minutes | 30 (7.3%) | 18 (4.8%) |
| 45 to 59 Minutes | 13 (3.2%) | 64 (17.1%) |
| 60 to 89 Minutes | 5 (1.2%) | 18 (4.8%) |
| 90 or more Minutes | 32 (7.8%) | 4 (1.1%) |
Time of Departure to Work by Sex in Delcambre
The most frequent times of departure to work in Delcambre are 7:00 AM to 7:29 AM (143, 35.0%) for males and 7:00 AM to 7:29 AM (81, 21.6%) for females.
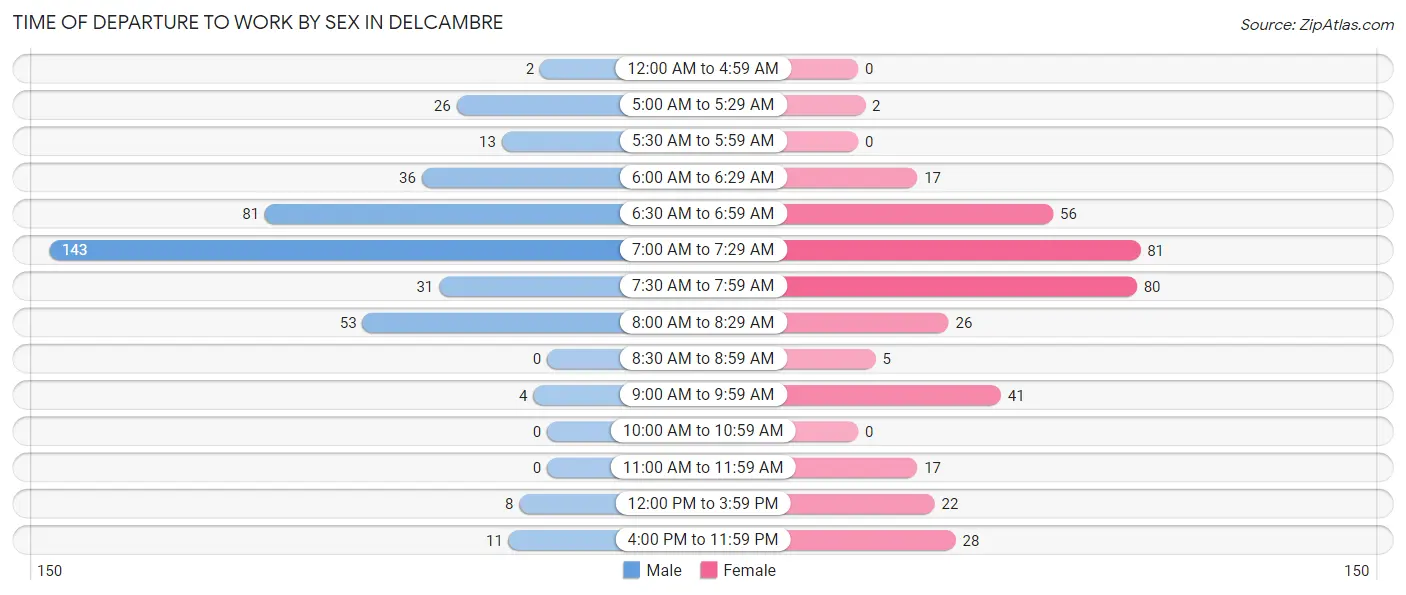
| Time of Departure | Male | Female |
| 12:00 AM to 4:59 AM | 2 (0.5%) | 0 (0.0%) |
| 5:00 AM to 5:29 AM | 26 (6.4%) | 2 (0.5%) |
| 5:30 AM to 5:59 AM | 13 (3.2%) | 0 (0.0%) |
| 6:00 AM to 6:29 AM | 36 (8.8%) | 17 (4.5%) |
| 6:30 AM to 6:59 AM | 81 (19.9%) | 56 (14.9%) |
| 7:00 AM to 7:29 AM | 143 (35.0%) | 81 (21.6%) |
| 7:30 AM to 7:59 AM | 31 (7.6%) | 80 (21.3%) |
| 8:00 AM to 8:29 AM | 53 (13.0%) | 26 (6.9%) |
| 8:30 AM to 8:59 AM | 0 (0.0%) | 5 (1.3%) |
| 9:00 AM to 9:59 AM | 4 (1.0%) | 41 (10.9%) |
| 10:00 AM to 10:59 AM | 0 (0.0%) | 0 (0.0%) |
| 11:00 AM to 11:59 AM | 0 (0.0%) | 17 (4.5%) |
| 12:00 PM to 3:59 PM | 8 (2.0%) | 22 (5.9%) |
| 4:00 PM to 11:59 PM | 11 (2.7%) | 28 (7.5%) |
| Total | 408 (100.0%) | 375 (100.0%) |
Housing Occupancy in Delcambre
Occupancy by Ownership in Delcambre
Of the total 844 dwellings in Delcambre, owner-occupied units account for 616 (73.0%), while renter-occupied units make up 228 (27.0%).
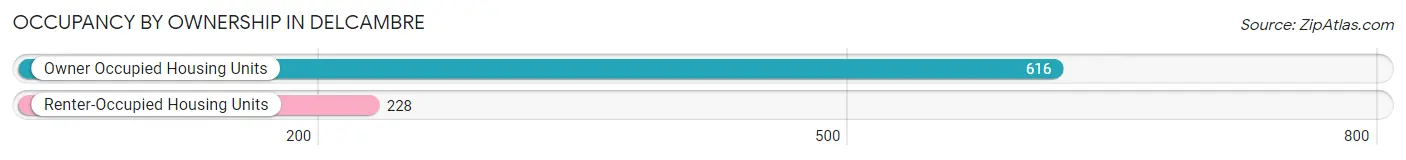
| Occupancy | # Housing Units | % Housing Units |
| Owner Occupied Housing Units | 616 | 73.0% |
| Renter-Occupied Housing Units | 228 | 27.0% |
| Total Occupied Housing Units | 844 | 100.0% |
Occupancy by Household Size in Delcambre
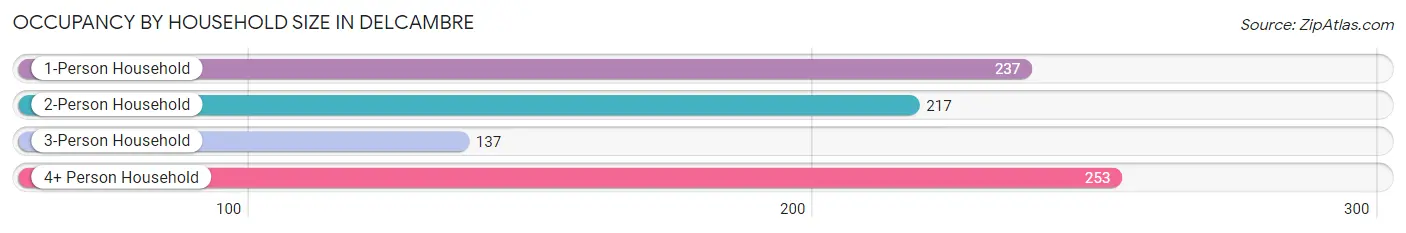
| Household Size | # Housing Units | % Housing Units |
| 1-Person Household | 237 | 28.1% |
| 2-Person Household | 217 | 25.7% |
| 3-Person Household | 137 | 16.2% |
| 4+ Person Household | 253 | 30.0% |
| Total Housing Units | 844 | 100.0% |
Occupancy by Ownership by Household Size in Delcambre
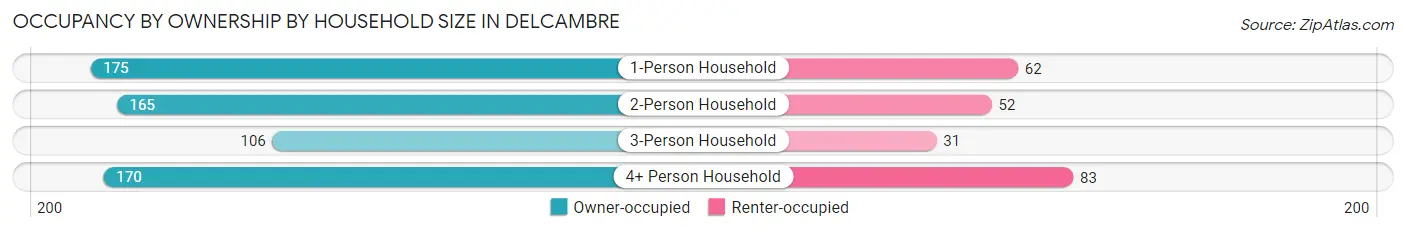
| Household Size | Owner-occupied | Renter-occupied |
| 1-Person Household | 175 (73.8%) | 62 (26.2%) |
| 2-Person Household | 165 (76.0%) | 52 (24.0%) |
| 3-Person Household | 106 (77.4%) | 31 (22.6%) |
| 4+ Person Household | 170 (67.2%) | 83 (32.8%) |
| Total Housing Units | 616 (73.0%) | 228 (27.0%) |
Occupancy by Educational Attainment in Delcambre
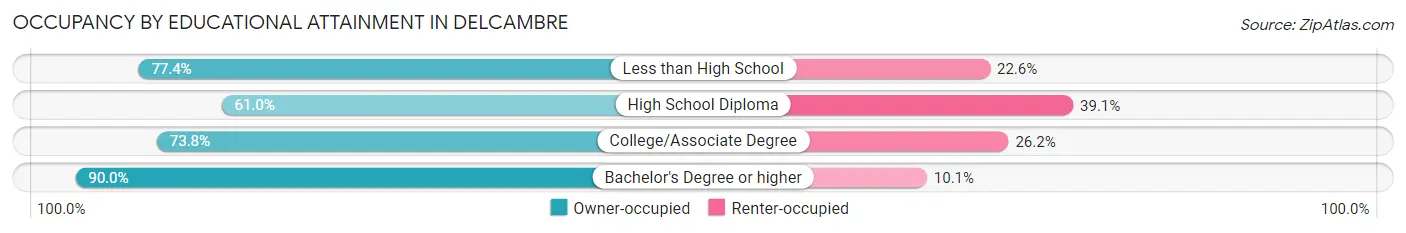
| Household Size | Owner-occupied | Renter-occupied |
| Less than High School | 96 (77.4%) | 28 (22.6%) |
| High School Diploma | 206 (61.0%) | 132 (39.1%) |
| College/Associate Degree | 135 (73.8%) | 48 (26.2%) |
| Bachelor's Degree or higher | 179 (89.9%) | 20 (10.1%) |
Occupancy by Age of Householder in Delcambre
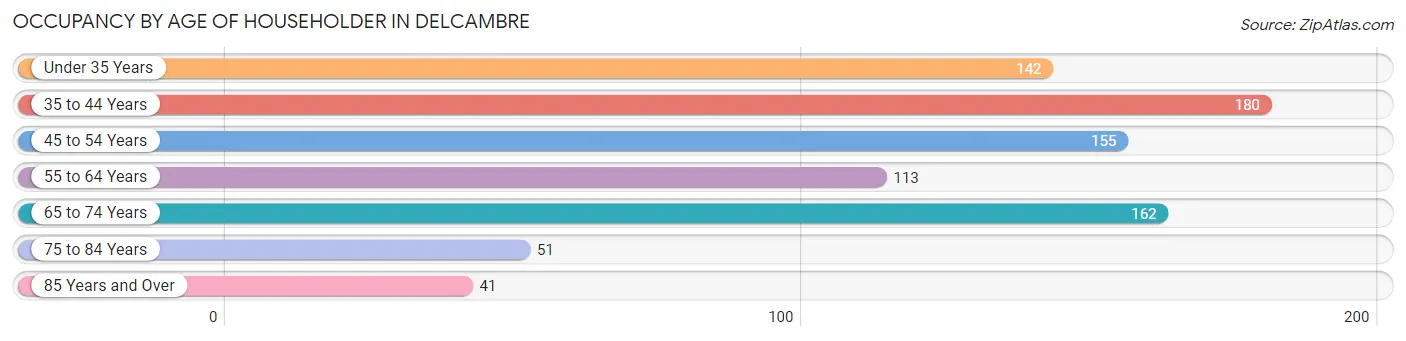
| Age Bracket | # Households | % Households |
| Under 35 Years | 142 | 16.8% |
| 35 to 44 Years | 180 | 21.3% |
| 45 to 54 Years | 155 | 18.4% |
| 55 to 64 Years | 113 | 13.4% |
| 65 to 74 Years | 162 | 19.2% |
| 75 to 84 Years | 51 | 6.0% |
| 85 Years and Over | 41 | 4.9% |
| Total | 844 | 100.0% |
Housing Finances in Delcambre
Median Income by Occupancy in Delcambre
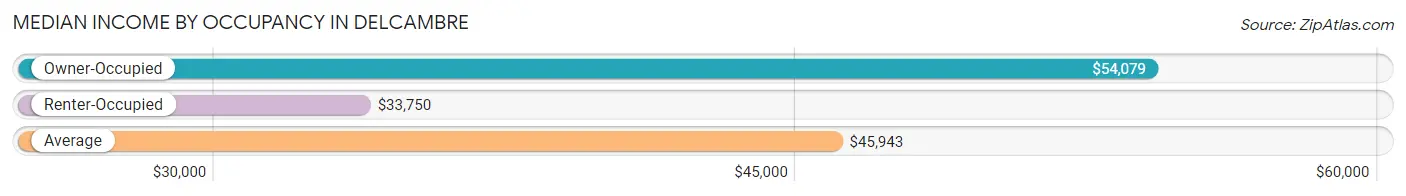
| Occupancy Type | # Households | Median Income |
| Owner-Occupied | 616 (73.0%) | $54,079 |
| Renter-Occupied | 228 (27.0%) | $33,750 |
| Average | 844 (100.0%) | $45,943 |
Occupancy by Householder Income Bracket in Delcambre
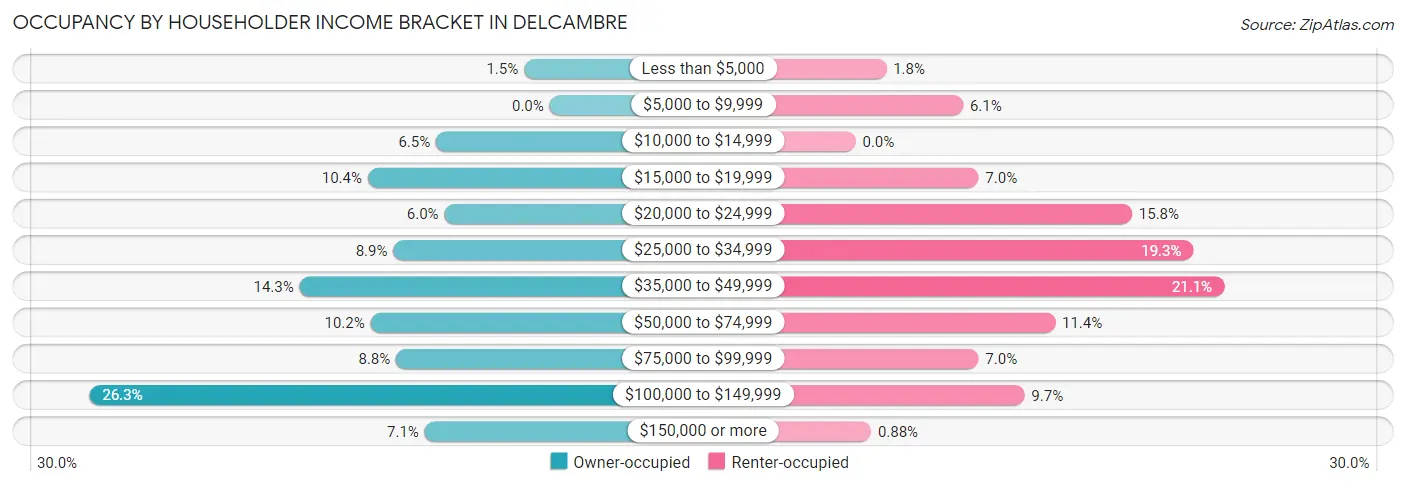
| Income Bracket | Owner-occupied | Renter-occupied |
| Less than $5,000 | 9 (1.5%) | 4 (1.8%) |
| $5,000 to $9,999 | 0 (0.0%) | 14 (6.1%) |
| $10,000 to $14,999 | 40 (6.5%) | 0 (0.0%) |
| $15,000 to $19,999 | 64 (10.4%) | 16 (7.0%) |
| $20,000 to $24,999 | 37 (6.0%) | 36 (15.8%) |
| $25,000 to $34,999 | 55 (8.9%) | 44 (19.3%) |
| $35,000 to $49,999 | 88 (14.3%) | 48 (21.0%) |
| $50,000 to $74,999 | 63 (10.2%) | 26 (11.4%) |
| $75,000 to $99,999 | 54 (8.8%) | 16 (7.0%) |
| $100,000 to $149,999 | 162 (26.3%) | 22 (9.7%) |
| $150,000 or more | 44 (7.1%) | 2 (0.9%) |
| Total | 616 (100.0%) | 228 (100.0%) |
Monthly Housing Cost Tiers in Delcambre
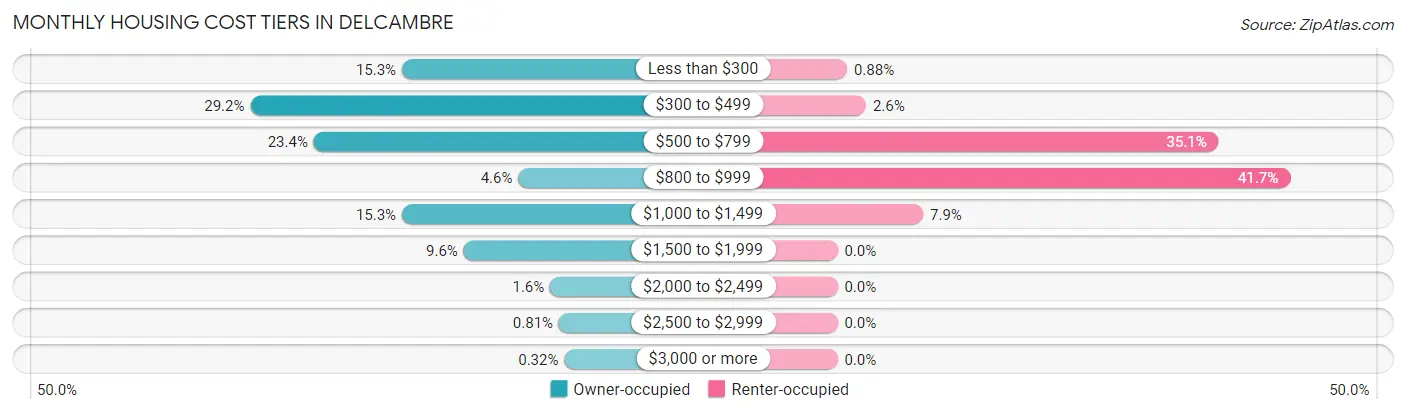
| Monthly Cost | Owner-occupied | Renter-occupied |
| Less than $300 | 94 (15.3%) | 2 (0.9%) |
| $300 to $499 | 180 (29.2%) | 6 (2.6%) |
| $500 to $799 | 144 (23.4%) | 80 (35.1%) |
| $800 to $999 | 28 (4.5%) | 95 (41.7%) |
| $1,000 to $1,499 | 94 (15.3%) | 18 (7.9%) |
| $1,500 to $1,999 | 59 (9.6%) | 0 (0.0%) |
| $2,000 to $2,499 | 10 (1.6%) | 0 (0.0%) |
| $2,500 to $2,999 | 5 (0.8%) | 0 (0.0%) |
| $3,000 or more | 2 (0.3%) | 0 (0.0%) |
| Total | 616 (100.0%) | 228 (100.0%) |
Physical Housing Characteristics in Delcambre
Housing Structures in Delcambre
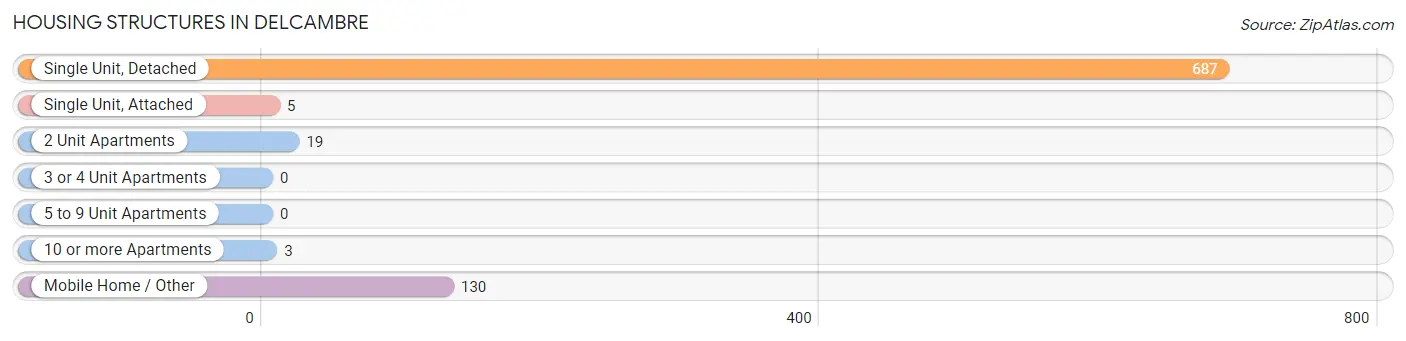
| Structure Type | # Housing Units | % Housing Units |
| Single Unit, Detached | 687 | 81.4% |
| Single Unit, Attached | 5 | 0.6% |
| 2 Unit Apartments | 19 | 2.2% |
| 3 or 4 Unit Apartments | 0 | 0.0% |
| 5 to 9 Unit Apartments | 0 | 0.0% |
| 10 or more Apartments | 3 | 0.4% |
| Mobile Home / Other | 130 | 15.4% |
| Total | 844 | 100.0% |
Housing Structures by Occupancy in Delcambre
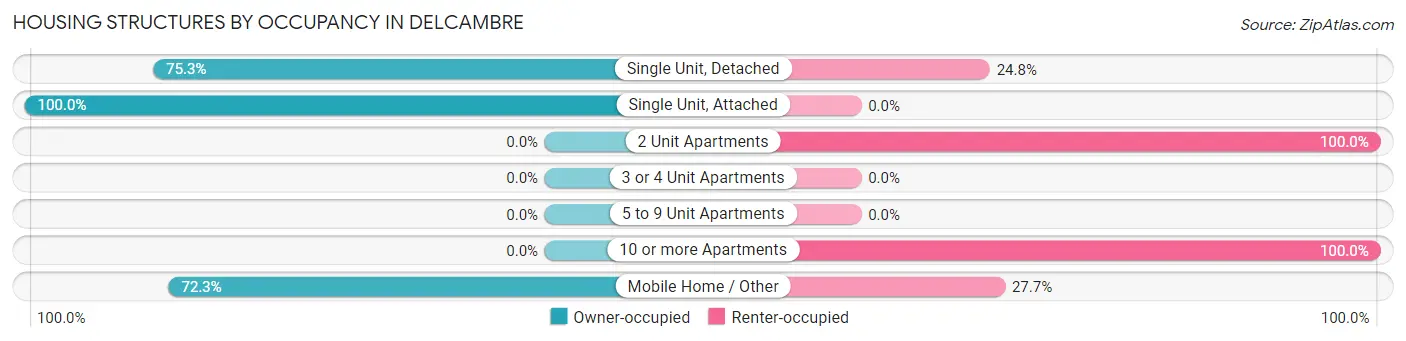
| Structure Type | Owner-occupied | Renter-occupied |
| Single Unit, Detached | 517 (75.2%) | 170 (24.7%) |
| Single Unit, Attached | 5 (100.0%) | 0 (0.0%) |
| 2 Unit Apartments | 0 (0.0%) | 19 (100.0%) |
| 3 or 4 Unit Apartments | 0 (0.0%) | 0 (0.0%) |
| 5 to 9 Unit Apartments | 0 (0.0%) | 0 (0.0%) |
| 10 or more Apartments | 0 (0.0%) | 3 (100.0%) |
| Mobile Home / Other | 94 (72.3%) | 36 (27.7%) |
| Total | 616 (73.0%) | 228 (27.0%) |
Housing Structures by Number of Rooms in Delcambre
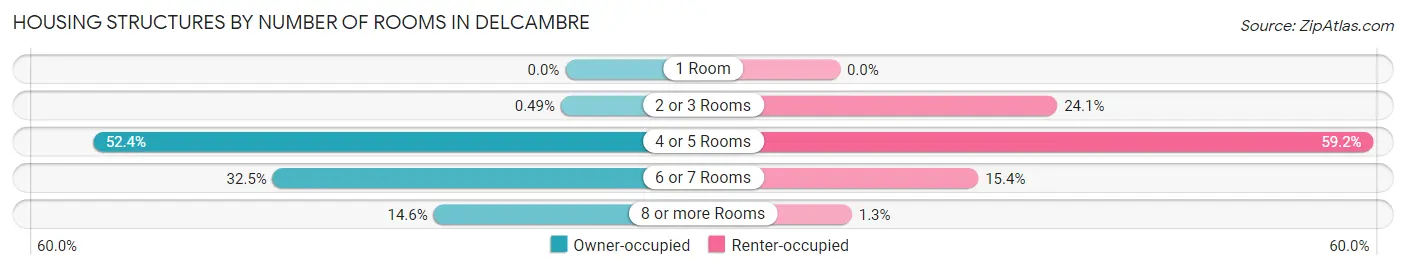
| Number of Rooms | Owner-occupied | Renter-occupied |
| 1 Room | 0 (0.0%) | 0 (0.0%) |
| 2 or 3 Rooms | 3 (0.5%) | 55 (24.1%) |
| 4 or 5 Rooms | 323 (52.4%) | 135 (59.2%) |
| 6 or 7 Rooms | 200 (32.5%) | 35 (15.3%) |
| 8 or more Rooms | 90 (14.6%) | 3 (1.3%) |
| Total | 616 (100.0%) | 228 (100.0%) |
Housing Structure by Heating Type in Delcambre
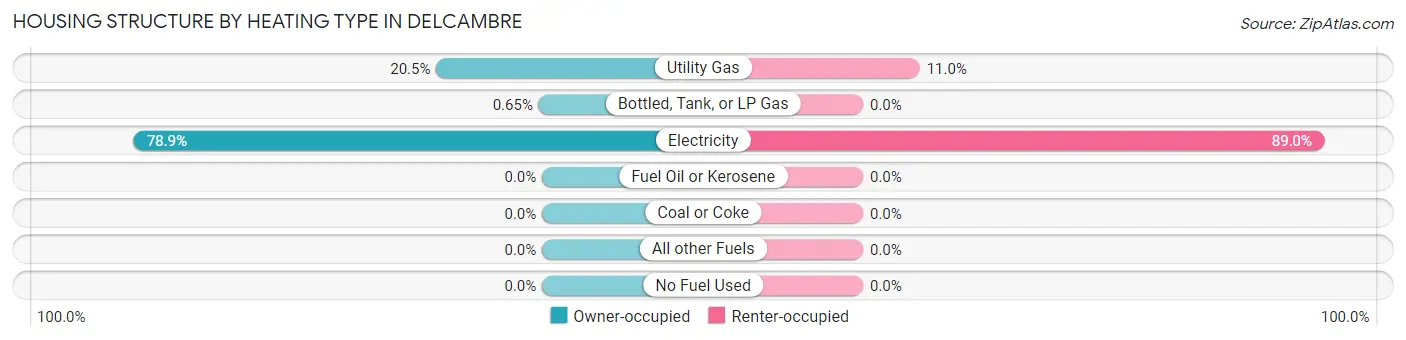
| Heating Type | Owner-occupied | Renter-occupied |
| Utility Gas | 126 (20.4%) | 25 (11.0%) |
| Bottled, Tank, or LP Gas | 4 (0.6%) | 0 (0.0%) |
| Electricity | 486 (78.9%) | 203 (89.0%) |
| Fuel Oil or Kerosene | 0 (0.0%) | 0 (0.0%) |
| Coal or Coke | 0 (0.0%) | 0 (0.0%) |
| All other Fuels | 0 (0.0%) | 0 (0.0%) |
| No Fuel Used | 0 (0.0%) | 0 (0.0%) |
| Total | 616 (100.0%) | 228 (100.0%) |
Household Vehicle Usage in Delcambre
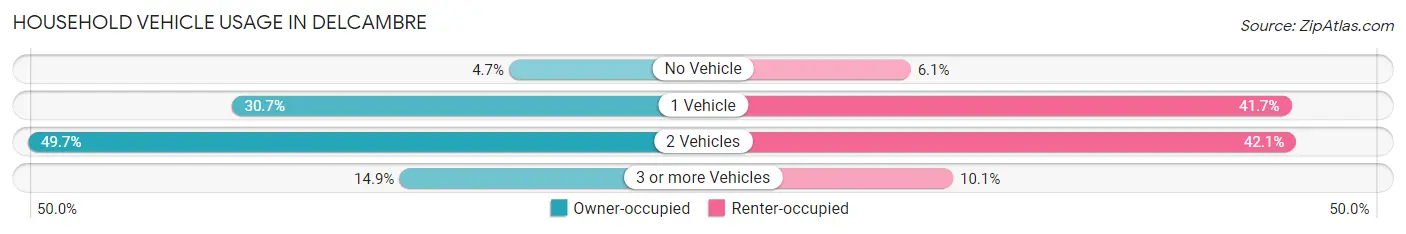
| Vehicles per Household | Owner-occupied | Renter-occupied |
| No Vehicle | 29 (4.7%) | 14 (6.1%) |
| 1 Vehicle | 189 (30.7%) | 95 (41.7%) |
| 2 Vehicles | 306 (49.7%) | 96 (42.1%) |
| 3 or more Vehicles | 92 (14.9%) | 23 (10.1%) |
| Total | 616 (100.0%) | 228 (100.0%) |
Real Estate & Mortgages in Delcambre
Real Estate and Mortgage Overview in Delcambre
| Characteristic | Without Mortgage | With Mortgage |
| Housing Units | 358 | 258 |
| Median Property Value | $101,000 | $162,500 |
| Median Household Income | $45,648 | $9 |
| Monthly Housing Costs | $415 | $2 |
| Real Estate Taxes | $199 | $33 |
Property Value by Mortgage Status in Delcambre
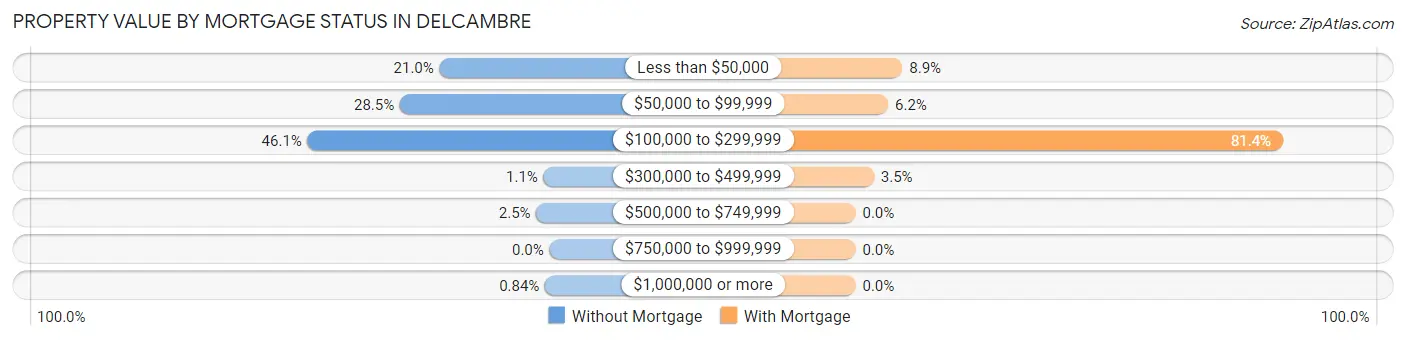
| Property Value | Without Mortgage | With Mortgage |
| Less than $50,000 | 75 (20.9%) | 23 (8.9%) |
| $50,000 to $99,999 | 102 (28.5%) | 16 (6.2%) |
| $100,000 to $299,999 | 165 (46.1%) | 210 (81.4%) |
| $300,000 to $499,999 | 4 (1.1%) | 9 (3.5%) |
| $500,000 to $749,999 | 9 (2.5%) | 0 (0.0%) |
| $750,000 to $999,999 | 0 (0.0%) | 0 (0.0%) |
| $1,000,000 or more | 3 (0.8%) | 0 (0.0%) |
| Total | 358 (100.0%) | 258 (100.0%) |
Household Income by Mortgage Status in Delcambre
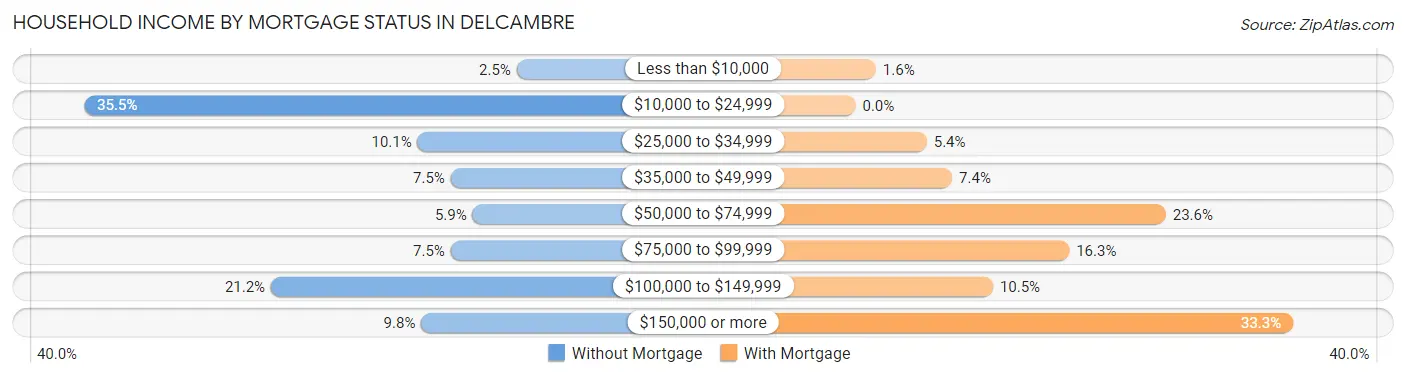
| Household Income | Without Mortgage | With Mortgage |
| Less than $10,000 | 9 (2.5%) | 4 (1.5%) |
| $10,000 to $24,999 | 127 (35.5%) | 0 (0.0%) |
| $25,000 to $34,999 | 36 (10.1%) | 14 (5.4%) |
| $35,000 to $49,999 | 27 (7.5%) | 19 (7.4%) |
| $50,000 to $74,999 | 21 (5.9%) | 61 (23.6%) |
| $75,000 to $99,999 | 27 (7.5%) | 42 (16.3%) |
| $100,000 to $149,999 | 76 (21.2%) | 27 (10.5%) |
| $150,000 or more | 35 (9.8%) | 86 (33.3%) |
| Total | 358 (100.0%) | 258 (100.0%) |
Property Value to Household Income Ratio in Delcambre
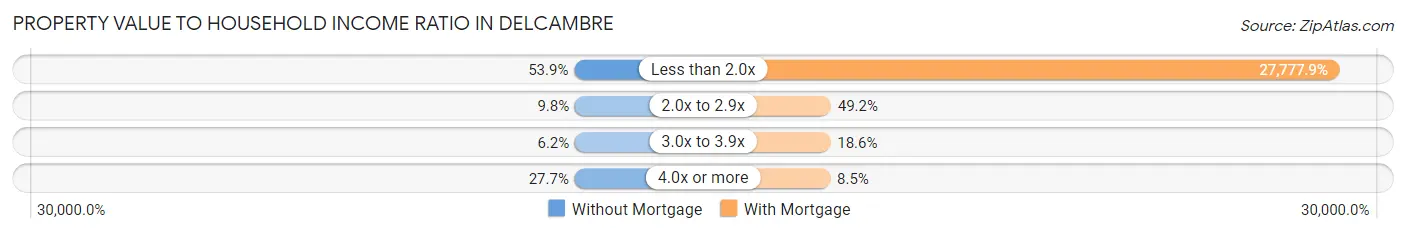
| Value-to-Income Ratio | Without Mortgage | With Mortgage |
| Less than 2.0x | 193 (53.9%) | 71,667 (27,777.9%) |
| 2.0x to 2.9x | 35 (9.8%) | 127 (49.2%) |
| 3.0x to 3.9x | 22 (6.1%) | 48 (18.6%) |
| 4.0x or more | 99 (27.7%) | 22 (8.5%) |
| Total | 358 (100.0%) | 258 (100.0%) |
Real Estate Taxes by Mortgage Status in Delcambre
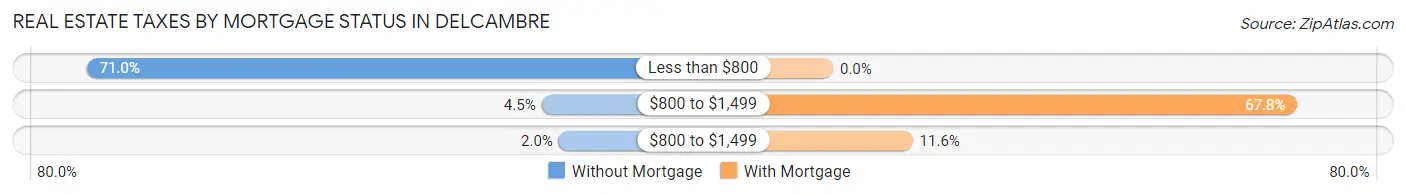
| Property Taxes | Without Mortgage | With Mortgage |
| Less than $800 | 254 (71.0%) | 0 (0.0%) |
| $800 to $1,499 | 16 (4.5%) | 175 (67.8%) |
| $800 to $1,499 | 7 (2.0%) | 30 (11.6%) |
| Total | 358 (100.0%) | 258 (100.0%) |
Health & Disability in Delcambre
Health Insurance Coverage by Age in Delcambre
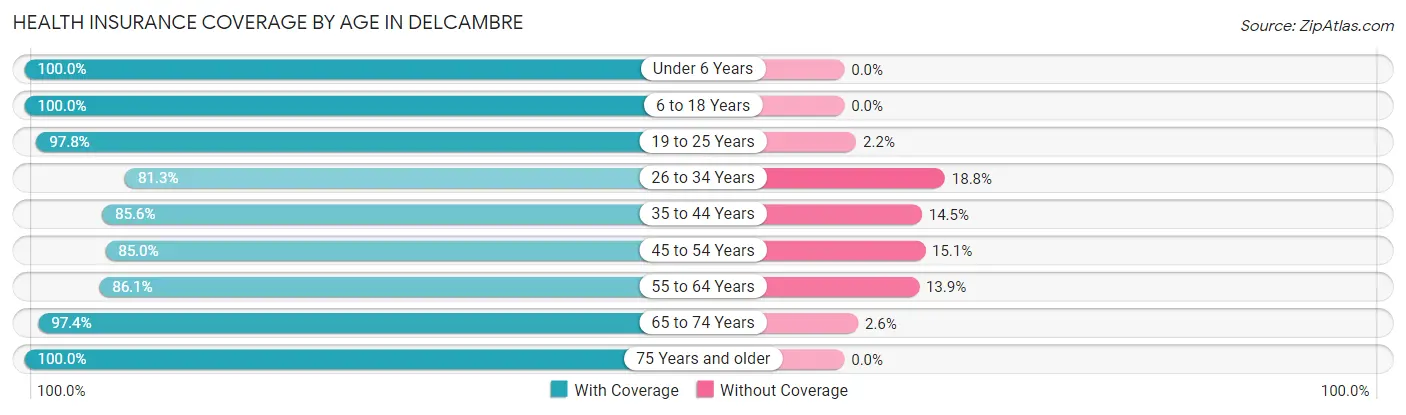
| Age Bracket | With Coverage | Without Coverage |
| Under 6 Years | 186 (100.0%) | 0 (0.0%) |
| 6 to 18 Years | 431 (100.0%) | 0 (0.0%) |
| 19 to 25 Years | 177 (97.8%) | 4 (2.2%) |
| 26 to 34 Years | 221 (81.2%) | 51 (18.8%) |
| 35 to 44 Years | 219 (85.6%) | 37 (14.4%) |
| 45 to 54 Years | 254 (85.0%) | 45 (15.0%) |
| 55 to 64 Years | 315 (86.1%) | 51 (13.9%) |
| 65 to 74 Years | 305 (97.4%) | 8 (2.6%) |
| 75 Years and older | 118 (100.0%) | 0 (0.0%) |
| Total | 2,226 (91.9%) | 196 (8.1%) |
Health Insurance Coverage by Citizenship Status in Delcambre
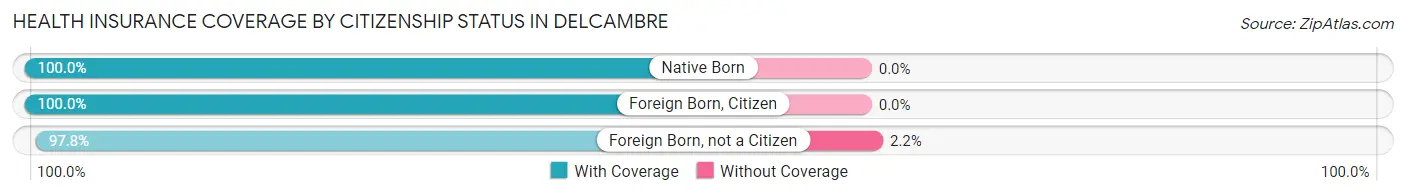
| Citizenship Status | With Coverage | Without Coverage |
| Native Born | 186 (100.0%) | 0 (0.0%) |
| Foreign Born, Citizen | 431 (100.0%) | 0 (0.0%) |
| Foreign Born, not a Citizen | 177 (97.8%) | 4 (2.2%) |
Health Insurance Coverage by Household Income in Delcambre
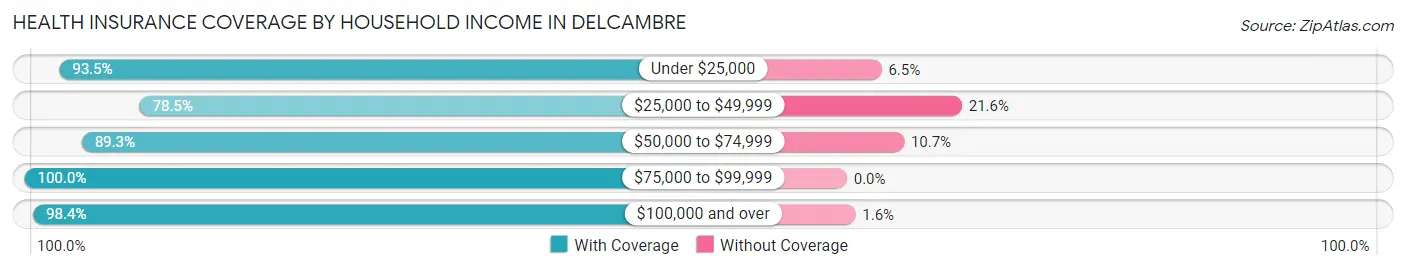
| Household Income | With Coverage | Without Coverage |
| Under $25,000 | 345 (93.5%) | 24 (6.5%) |
| $25,000 to $49,999 | 477 (78.4%) | 131 (21.5%) |
| $50,000 to $74,999 | 200 (89.3%) | 24 (10.7%) |
| $75,000 to $99,999 | 163 (100.0%) | 0 (0.0%) |
| $100,000 and over | 1,041 (98.4%) | 17 (1.6%) |
Public vs Private Health Insurance Coverage by Age in Delcambre
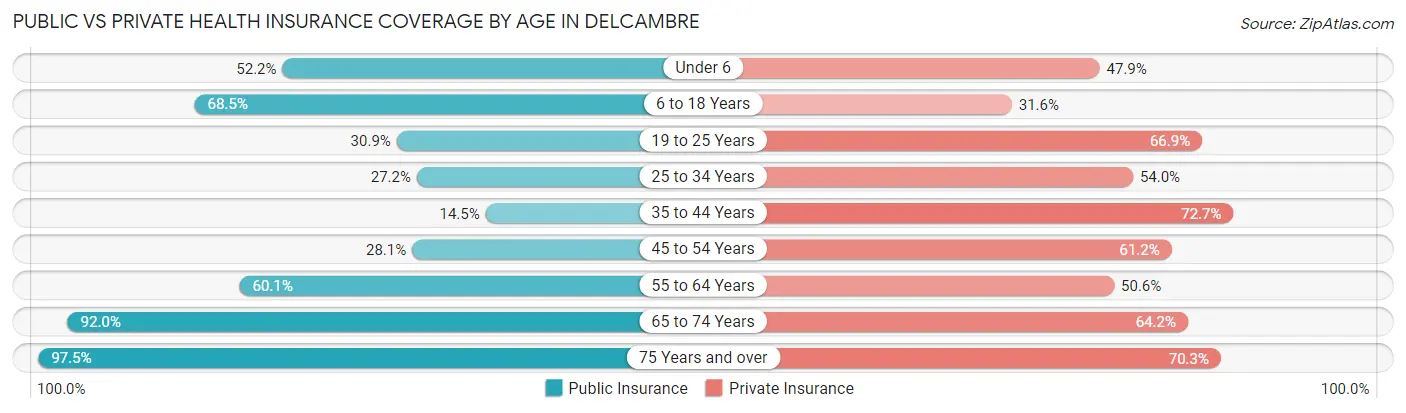
| Age Bracket | Public Insurance | Private Insurance |
| Under 6 | 97 (52.1%) | 89 (47.8%) |
| 6 to 18 Years | 295 (68.4%) | 136 (31.6%) |
| 19 to 25 Years | 56 (30.9%) | 121 (66.8%) |
| 25 to 34 Years | 74 (27.2%) | 147 (54.0%) |
| 35 to 44 Years | 37 (14.4%) | 186 (72.7%) |
| 45 to 54 Years | 84 (28.1%) | 183 (61.2%) |
| 55 to 64 Years | 220 (60.1%) | 185 (50.5%) |
| 65 to 74 Years | 288 (92.0%) | 201 (64.2%) |
| 75 Years and over | 115 (97.5%) | 83 (70.3%) |
| Total | 1,266 (52.3%) | 1,331 (54.9%) |
Disability Status by Sex by Age in Delcambre
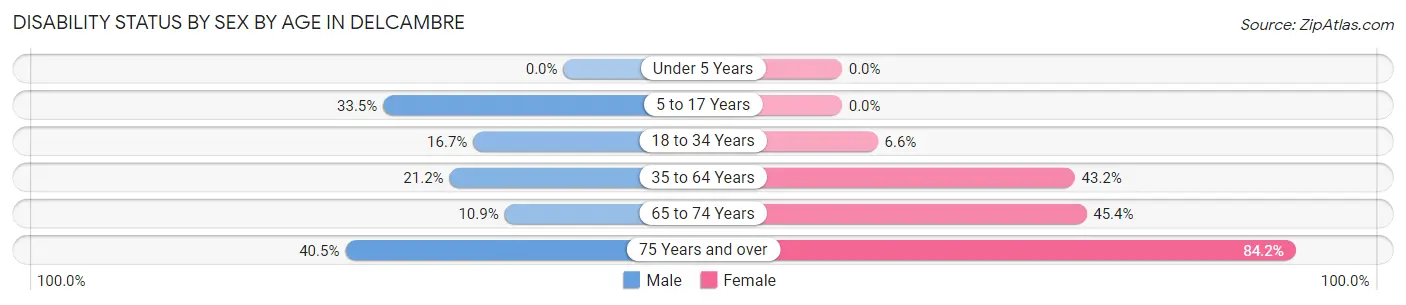
| Age Bracket | Male | Female |
| Under 5 Years | 0 (0.0%) | 0 (0.0%) |
| 5 to 17 Years | 86 (33.5%) | 0 (0.0%) |
| 18 to 34 Years | 38 (16.7%) | 15 (6.6%) |
| 35 to 64 Years | 70 (21.1%) | 255 (43.2%) |
| 65 to 74 Years | 20 (10.9%) | 59 (45.4%) |
| 75 Years and over | 17 (40.5%) | 64 (84.2%) |
Disability Class by Sex by Age in Delcambre
Disability Class: Hearing Difficulty
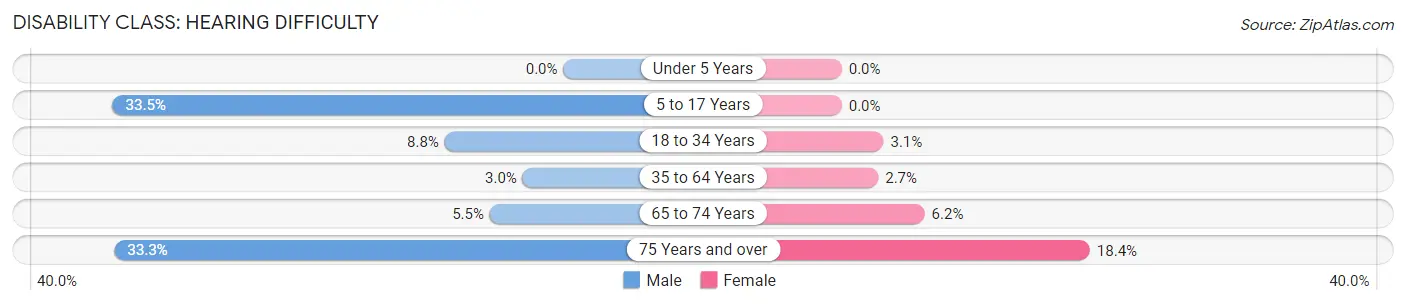
| Age Bracket | Male | Female |
| Under 5 Years | 0 (0.0%) | 0 (0.0%) |
| 5 to 17 Years | 86 (33.5%) | 0 (0.0%) |
| 18 to 34 Years | 20 (8.8%) | 7 (3.1%) |
| 35 to 64 Years | 10 (3.0%) | 16 (2.7%) |
| 65 to 74 Years | 10 (5.5%) | 8 (6.1%) |
| 75 Years and over | 14 (33.3%) | 14 (18.4%) |
Disability Class: Vision Difficulty
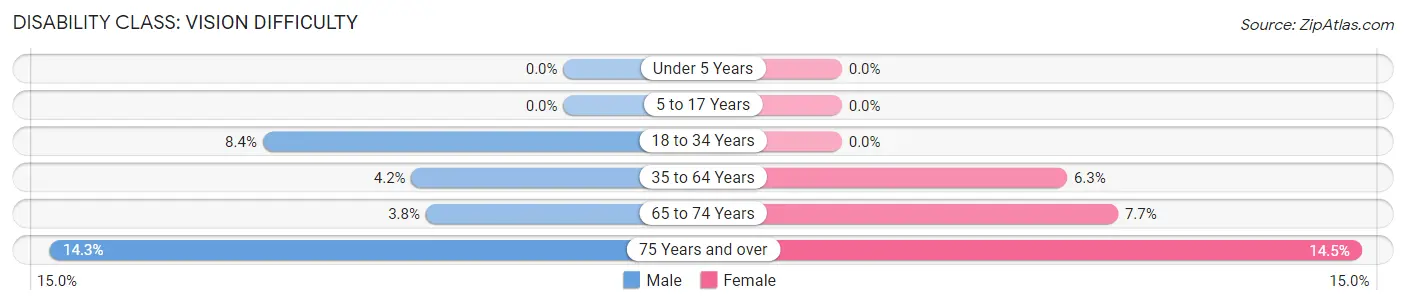
| Age Bracket | Male | Female |
| Under 5 Years | 0 (0.0%) | 0 (0.0%) |
| 5 to 17 Years | 0 (0.0%) | 0 (0.0%) |
| 18 to 34 Years | 19 (8.4%) | 0 (0.0%) |
| 35 to 64 Years | 14 (4.2%) | 37 (6.3%) |
| 65 to 74 Years | 7 (3.8%) | 10 (7.7%) |
| 75 Years and over | 6 (14.3%) | 11 (14.5%) |
Disability Class: Cognitive Difficulty
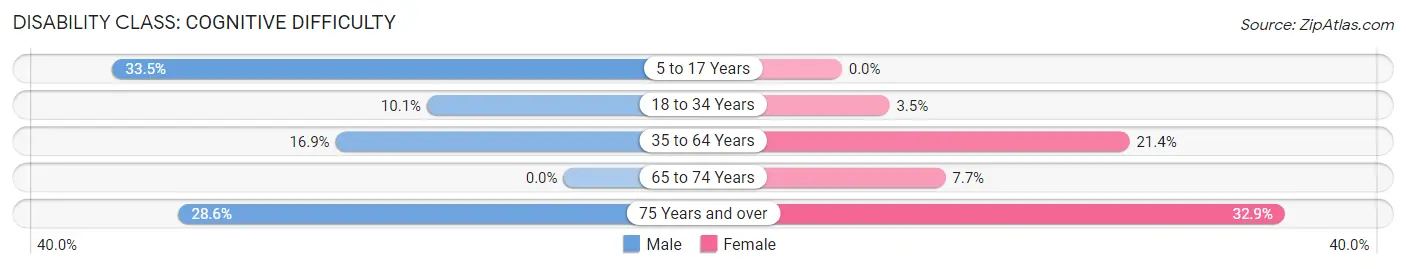
| Age Bracket | Male | Female |
| 5 to 17 Years | 86 (33.5%) | 0 (0.0%) |
| 18 to 34 Years | 23 (10.1%) | 8 (3.5%) |
| 35 to 64 Years | 56 (16.9%) | 126 (21.4%) |
| 65 to 74 Years | 0 (0.0%) | 10 (7.7%) |
| 75 Years and over | 12 (28.6%) | 25 (32.9%) |
Disability Class: Ambulatory Difficulty
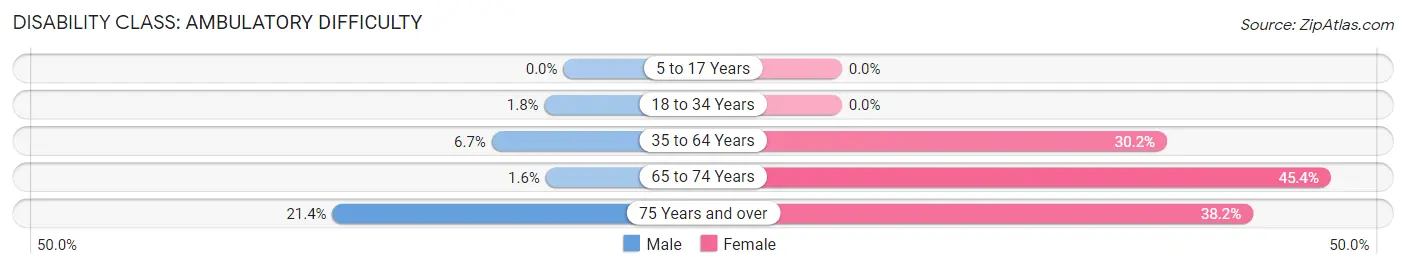
| Age Bracket | Male | Female |
| 5 to 17 Years | 0 (0.0%) | 0 (0.0%) |
| 18 to 34 Years | 4 (1.8%) | 0 (0.0%) |
| 35 to 64 Years | 22 (6.7%) | 178 (30.2%) |
| 65 to 74 Years | 3 (1.6%) | 59 (45.4%) |
| 75 Years and over | 9 (21.4%) | 29 (38.2%) |
Disability Class: Self-Care Difficulty
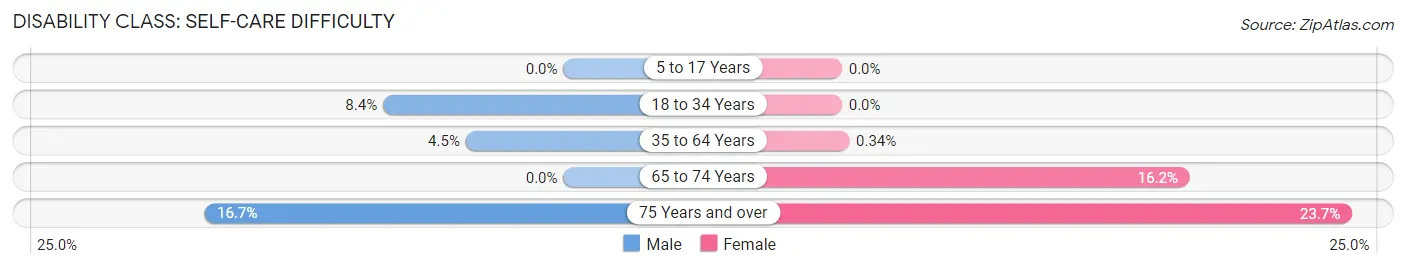
| Age Bracket | Male | Female |
| 5 to 17 Years | 0 (0.0%) | 0 (0.0%) |
| 18 to 34 Years | 19 (8.4%) | 0 (0.0%) |
| 35 to 64 Years | 15 (4.5%) | 2 (0.3%) |
| 65 to 74 Years | 0 (0.0%) | 21 (16.2%) |
| 75 Years and over | 7 (16.7%) | 18 (23.7%) |
Technology Access in Delcambre
Computing Device Access in Delcambre
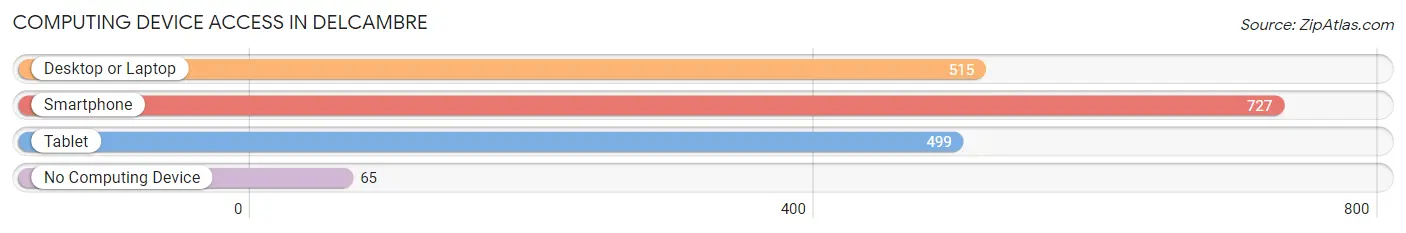
| Device Type | # Households | % Households |
| Desktop or Laptop | 515 | 61.0% |
| Smartphone | 727 | 86.1% |
| Tablet | 499 | 59.1% |
| No Computing Device | 65 | 7.7% |
| Total | 844 | 100.0% |
Internet Access in Delcambre
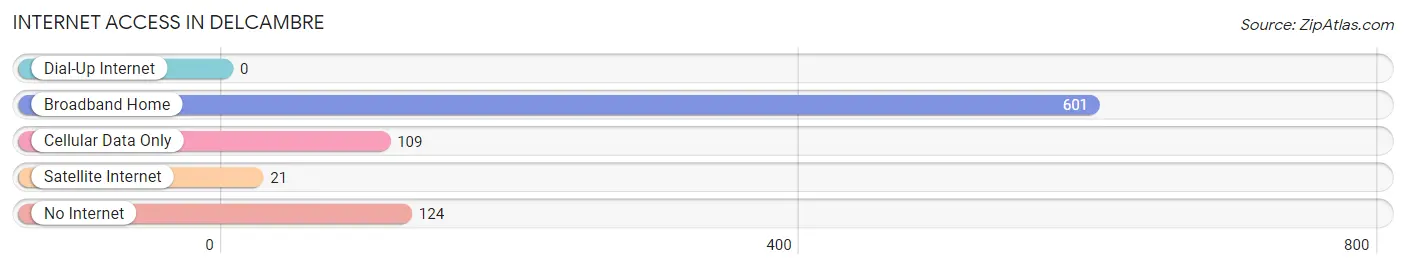
| Internet Type | # Households | % Households |
| Dial-Up Internet | 0 | 0.0% |
| Broadband Home | 601 | 71.2% |
| Cellular Data Only | 109 | 12.9% |
| Satellite Internet | 21 | 2.5% |
| No Internet | 124 | 14.7% |
| Total | 844 | 100.0% |
Delcambre Summary
Delcambre is a small town located in Iberia Parish, Louisiana. It is situated on the Vermilion River, approximately 15 miles south of Lafayette. The town has a population of 1,845 people, according to the 2010 census.
History
Delcambre was founded in 1848 by French-speaking Acadians who had been exiled from Nova Scotia in 1755. The town was named after the Delcambre family, who were among the first settlers. The town was incorporated in 1884.
In the late 19th century, Delcambre was a thriving port town, with a bustling economy based on the shipping of cotton, sugar, and other goods. The town was also home to a number of sawmills and other industries.
In the early 20th century, the town began to decline as the shipping industry moved away from the area. The Great Depression further weakened the economy, and the town’s population began to decline.
In the 1950s, the town began to experience a resurgence as the oil and gas industry moved into the area. This brought new jobs and economic growth to the area, and the population began to increase.
Geography
Delcambre is located in Iberia Parish, Louisiana, approximately 15 miles south of Lafayette. The town is situated on the Vermilion River, which is a major tributary of the Atchafalaya River.
The town is located in a flat, low-lying area, with an elevation of just 10 feet above sea level. The climate is humid subtropical, with hot, humid summers and mild winters.
Economy
The economy of Delcambre is largely based on the oil and gas industry. The town is home to several oil and gas companies, as well as a number of related businesses.
The town is also home to a number of small businesses, including restaurants, retail stores, and other services. The town is also home to a number of seafood processing plants, which process shrimp, oysters, and other seafood.
Demographics
According to the 2010 census, the population of Delcambre was 1,845 people. The racial makeup of the town was 79.3% White, 17.2% African American, 0.7% Native American, 0.3% Asian, 0.1% Pacific Islander, and 2.4% from other races.
The median household income in Delcambre was $37,917, and the median family income was $45,938. The per capita income was $18,945. About 17.2% of the population was below the poverty line.
Conclusion
Delcambre is a small town located in Iberia Parish, Louisiana. It was founded in 1848 by French-speaking Acadians, and was incorporated in 1884. The town has a population of 1,845 people, according to the 2010 census. The economy of Delcambre is largely based on the oil and gas industry, and the town is also home to a number of small businesses. The racial makeup of the town is 79.3% White, 17.2% African American, 0.7% Native American, 0.3% Asian, 0.1% Pacific Islander, and 2.4% from other races. The median household income in Delcambre was $37,917, and the median family income was $45,938. About 17.2% of the population was below the poverty line.
Common Questions
What is Per Capita Income in Delcambre?
Per Capita income in Delcambre is $23,694.
What is the Median Family Income in Delcambre?
Median Family Income in Delcambre is $70,655.
What is the Median Household income in Delcambre?
Median Household Income in Delcambre is $45,943.
What is Income or Wage Gap in Delcambre?
Income or Wage Gap in Delcambre is 25.5%.
Women in Delcambre earn 74.5 cents for every dollar earned by a man.
What is Inequality or Gini Index in Delcambre?
Inequality or Gini Index in Delcambre is 0.41.
What is the Total Population of Delcambre?
Total Population of Delcambre is 2,422.
What is the Total Male Population of Delcambre?
Total Male Population of Delcambre is 1,117.
What is the Total Female Population of Delcambre?
Total Female Population of Delcambre is 1,305.
What is the Ratio of Males per 100 Females in Delcambre?
There are 85.59 Males per 100 Females in Delcambre.
What is the Ratio of Females per 100 Males in Delcambre?
There are 116.83 Females per 100 Males in Delcambre.
What is the Median Population Age in Delcambre?
Median Population Age in Delcambre is 41.1 Years.
What is the Average Family Size in Delcambre
Average Family Size in Delcambre is 3.5 People.
What is the Average Household Size in Delcambre
Average Household Size in Delcambre is 2.9 People.
How Large is the Labor Force in Delcambre?
There are 962 People in the Labor Forcein in Delcambre.
What is the Percentage of People in the Labor Force in Delcambre?
52.4% of People are in the Labor Force in Delcambre.
What is the Unemployment Rate in Delcambre?
Unemployment Rate in Delcambre is 5.7%.