Livingston, LA Map & Demographics
Livingston Map
Livingston Overview
$29,969
PER CAPITA INCOME
$83,952
AVG FAMILY INCOME
$70,156
AVG HOUSEHOLD INCOME
38.0%
WAGE / INCOME GAP [ % ]
62.0¢/ $1
WAGE / INCOME GAP [ $ ]
0.45
INEQUALITY / GINI INDEX
2,008
TOTAL POPULATION
934
MALE POPULATION
1,074
FEMALE POPULATION
86.96
MALES / 100 FEMALES
114.99
FEMALES / 100 MALES
36.3
MEDIAN AGE
3.4
AVG FAMILY SIZE
2.8
AVG HOUSEHOLD SIZE
960
LABOR FORCE [ PEOPLE ]
61.6%
PERCENT IN LABOR FORCE
4.1%
UNEMPLOYMENT RATE
Livingston Zip Codes
Livingston Area Codes
Income in Livingston
Income Overview in Livingston
Per Capita Income in Livingston is $29,969, while median incomes of families and households are $83,952 and $70,156 respectively.
| Characteristic | Number | Measure |
| Per Capita Income | 2,008 | $29,969 |
| Median Family Income | 504 | $83,952 |
| Mean Family Income | 504 | $100,753 |
| Median Household Income | 709 | $70,156 |
| Mean Household Income | 709 | $81,623 |
| Income Deficit | 504 | $0 |
| Wage / Income Gap (%) | 2,008 | 37.96% |
| Wage / Income Gap ($) | 2,008 | 62.04¢ per $1 |
| Gini / Inequality Index | 2,008 | 0.45 |
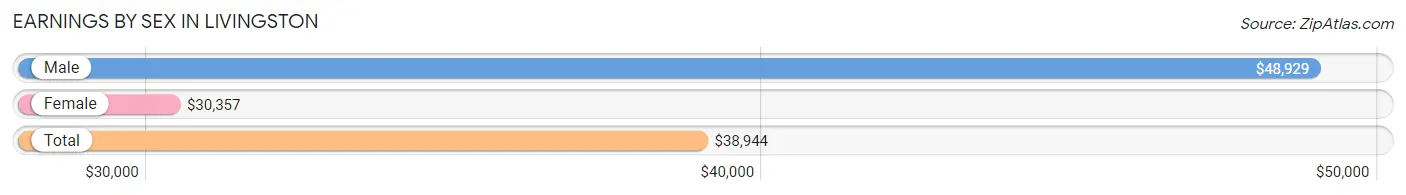
Earnings by Sex in Livingston
Average Earnings in Livingston are $38,944, $48,929 for men and $30,357 for women, a difference of 38.0%.
| Sex | Number | Average Earnings |
| Male | 532 (52.9%) | $48,929 |
| Female | 474 (47.1%) | $30,357 |
| Total | 1,006 (100.0%) | $38,944 |
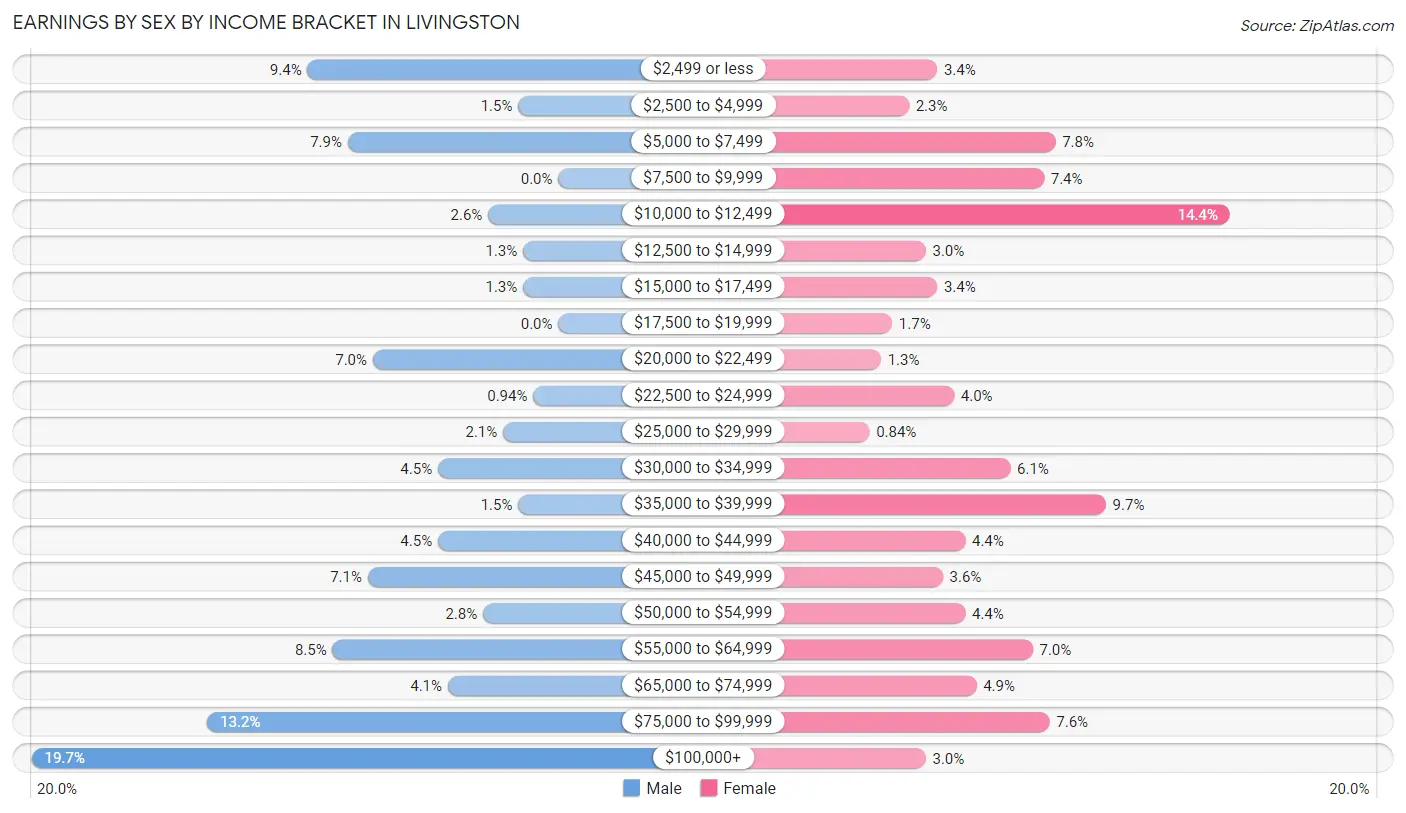
Earnings by Sex by Income Bracket in Livingston
The most common earnings brackets in Livingston are $100,000+ for men (105 | 19.7%) and $10,000 to $12,499 for women (68 | 14.3%).
| Income | Male | Female |
| $2,499 or less | 50 (9.4%) | 16 (3.4%) |
| $2,500 to $4,999 | 8 (1.5%) | 11 (2.3%) |
| $5,000 to $7,499 | 42 (7.9%) | 37 (7.8%) |
| $7,500 to $9,999 | 0 (0.0%) | 35 (7.4%) |
| $10,000 to $12,499 | 14 (2.6%) | 68 (14.3%) |
| $12,500 to $14,999 | 7 (1.3%) | 14 (2.9%) |
| $15,000 to $17,499 | 7 (1.3%) | 16 (3.4%) |
| $17,500 to $19,999 | 0 (0.0%) | 8 (1.7%) |
| $20,000 to $22,499 | 37 (7.0%) | 6 (1.3%) |
| $22,500 to $24,999 | 5 (0.9%) | 19 (4.0%) |
| $25,000 to $29,999 | 11 (2.1%) | 4 (0.8%) |
| $30,000 to $34,999 | 24 (4.5%) | 29 (6.1%) |
| $35,000 to $39,999 | 8 (1.5%) | 46 (9.7%) |
| $40,000 to $44,999 | 24 (4.5%) | 21 (4.4%) |
| $45,000 to $49,999 | 38 (7.1%) | 17 (3.6%) |
| $50,000 to $54,999 | 15 (2.8%) | 21 (4.4%) |
| $55,000 to $64,999 | 45 (8.5%) | 33 (7.0%) |
| $65,000 to $74,999 | 22 (4.1%) | 23 (4.9%) |
| $75,000 to $99,999 | 70 (13.2%) | 36 (7.6%) |
| $100,000+ | 105 (19.7%) | 14 (2.9%) |
| Total | 532 (100.0%) | 474 (100.0%) |
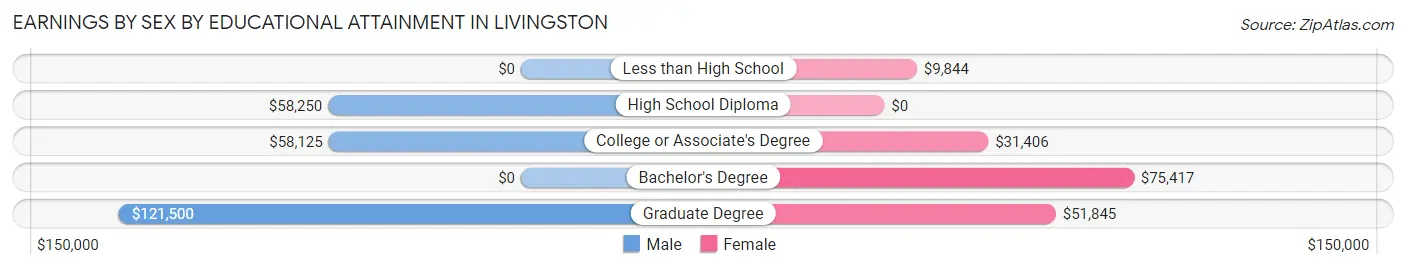
Earnings by Sex by Educational Attainment in Livingston
Average earnings in Livingston are $63,264 for men and $37,361 for women, a difference of 40.9%. Men with an educational attainment of graduate degree enjoy the highest average annual earnings of $121,500, while those with college or associate's degree education earn the least with $58,125. Women with an educational attainment of bachelor's degree earn the most with the average annual earnings of $75,417, while those with less than high school education have the smallest earnings of $9,844.
| Educational Attainment | Male Income | Female Income |
| Less than High School | - | - |
| High School Diploma | $58,250 | $0 |
| College or Associate's Degree | $58,125 | $31,406 |
| Bachelor's Degree | - | - |
| Graduate Degree | $121,500 | $51,845 |
| Total | $63,264 | $37,361 |
Family Income in Livingston
Family Income Brackets in Livingston
According to the Livingston family income data, there are 129 families falling into the $75,000 to $99,999 income range, which is the most common income bracket and makes up 25.6% of all families.
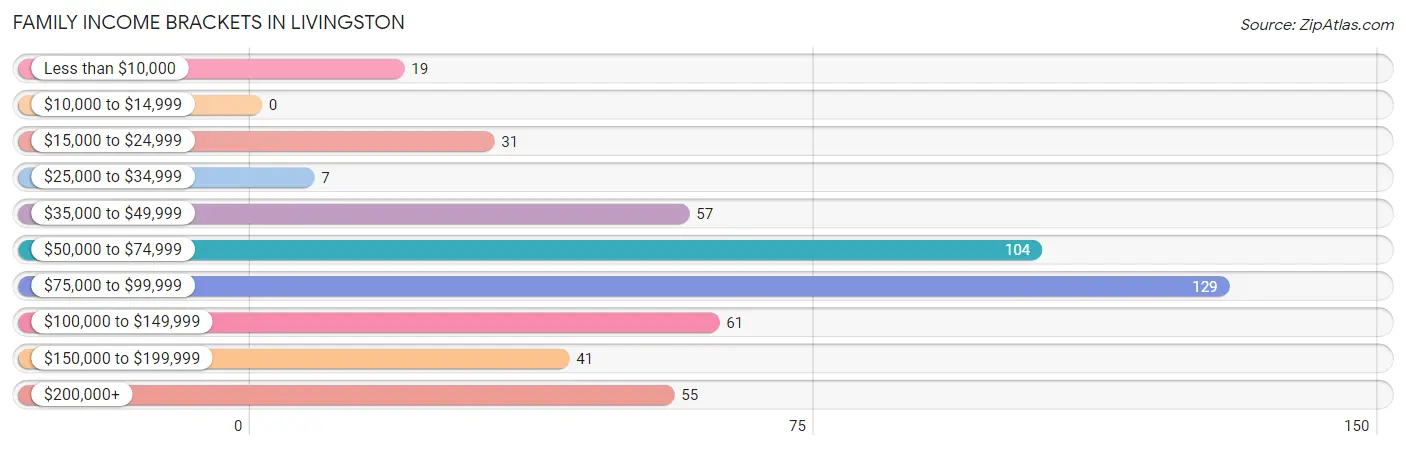
| Income Bracket | # Families | % Families |
| Less than $10,000 | 19 | 3.8% |
| $10,000 to $14,999 | 0 | 0.0% |
| $15,000 to $24,999 | 31 | 6.2% |
| $25,000 to $34,999 | 7 | 1.4% |
| $35,000 to $49,999 | 57 | 11.3% |
| $50,000 to $74,999 | 104 | 20.6% |
| $75,000 to $99,999 | 129 | 25.6% |
| $100,000 to $149,999 | 61 | 12.1% |
| $150,000 to $199,999 | 41 | 8.1% |
| $200,000+ | 55 | 10.9% |
Family Income by Famaliy Size in Livingston
5-person families (22 | 4.4%) account for the highest median family income in Livingston with $112,500 per family, while 2-person families (166 | 32.9%) have the highest median income of $41,340 per family member.
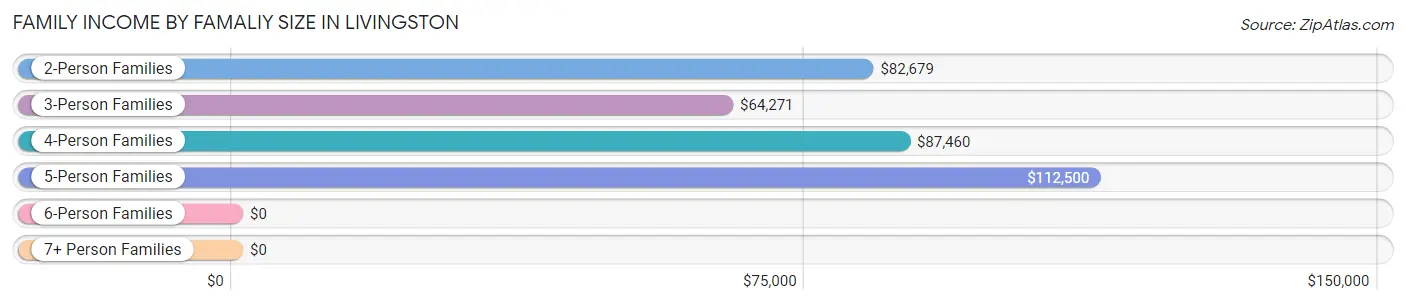
| Income Bracket | # Families | Median Income |
| 2-Person Families | 166 (32.9%) | $82,679 |
| 3-Person Families | 121 (24.0%) | $64,271 |
| 4-Person Families | 195 (38.7%) | $87,460 |
| 5-Person Families | 22 (4.4%) | $112,500 |
| 6-Person Families | 0 (0.0%) | $0 |
| 7+ Person Families | 0 (0.0%) | $0 |
| Total | 504 (100.0%) | $83,952 |
Family Income by Number of Earners in Livingston
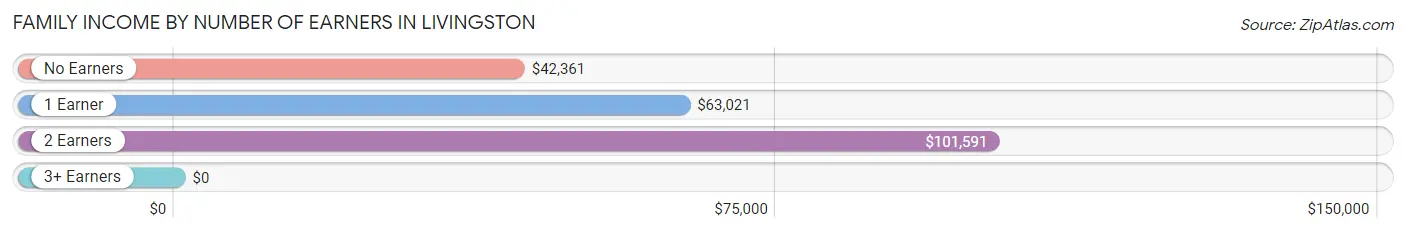
| Number of Earners | # Families | Median Income |
| No Earners | 72 (14.3%) | $42,361 |
| 1 Earner | 189 (37.5%) | $63,021 |
| 2 Earners | 158 (31.4%) | $101,591 |
| 3+ Earners | 85 (16.9%) | $0 |
| Total | 504 (100.0%) | $83,952 |
Household Income in Livingston
Household Income Brackets in Livingston
With 142 households falling in the category, the $50,000 to $74,999 income range is the most frequent in Livingston, accounting for 20.0% of all households. In contrast, only 16 households (2.3%) fall into the $10,000 to $14,999 income bracket, making it the least populous group.
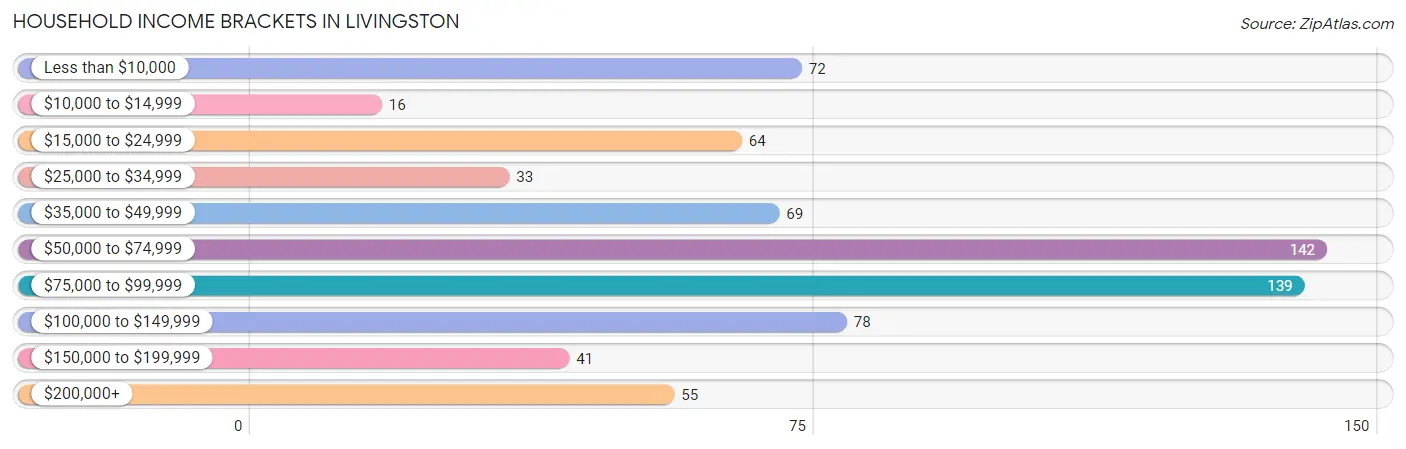
| Income Bracket | # Households | % Households |
| Less than $10,000 | 72 | 10.2% |
| $10,000 to $14,999 | 16 | 2.3% |
| $15,000 to $24,999 | 64 | 9.0% |
| $25,000 to $34,999 | 33 | 4.7% |
| $35,000 to $49,999 | 69 | 9.7% |
| $50,000 to $74,999 | 142 | 20.0% |
| $75,000 to $99,999 | 139 | 19.6% |
| $100,000 to $149,999 | 78 | 11.0% |
| $150,000 to $199,999 | 41 | 5.8% |
| $200,000+ | 55 | 7.8% |
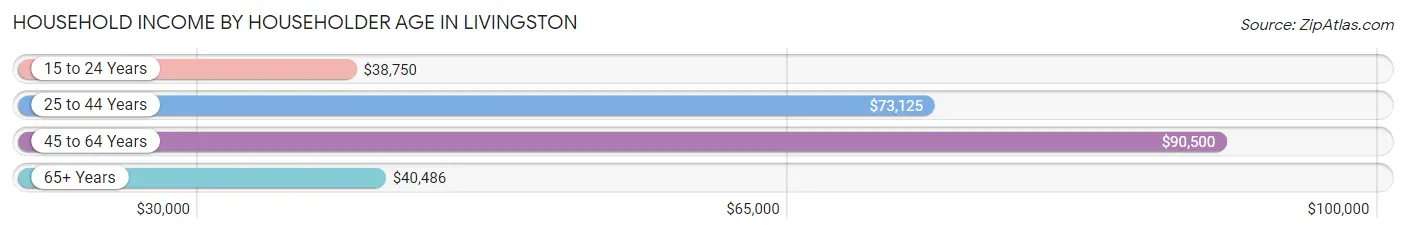
Household Income by Householder Age in Livingston
The median household income in Livingston is $70,156, with the highest median household income of $90,500 found in the 45 to 64 years age bracket for the primary householder. A total of 242 households (34.1%) fall into this category. Meanwhile, the 15 to 24 years age bracket for the primary householder has the lowest median household income of $38,750, with 18 households (2.5%) in this group.
| Income Bracket | # Households | Median Income |
| 15 to 24 Years | 18 (2.5%) | $38,750 |
| 25 to 44 Years | 284 (40.1%) | $73,125 |
| 45 to 64 Years | 242 (34.1%) | $90,500 |
| 65+ Years | 165 (23.3%) | $40,486 |
| Total | 709 (100.0%) | $70,156 |
Poverty in Livingston
Income Below Poverty by Sex and Age in Livingston
With 6.0% poverty level for males and 12.3% for females among the residents of Livingston, 65 to 74 year old males and 65 to 74 year old females are the most vulnerable to poverty, with 13 males (22.0%) and 24 females (32.9%) in their respective age groups living below the poverty level.
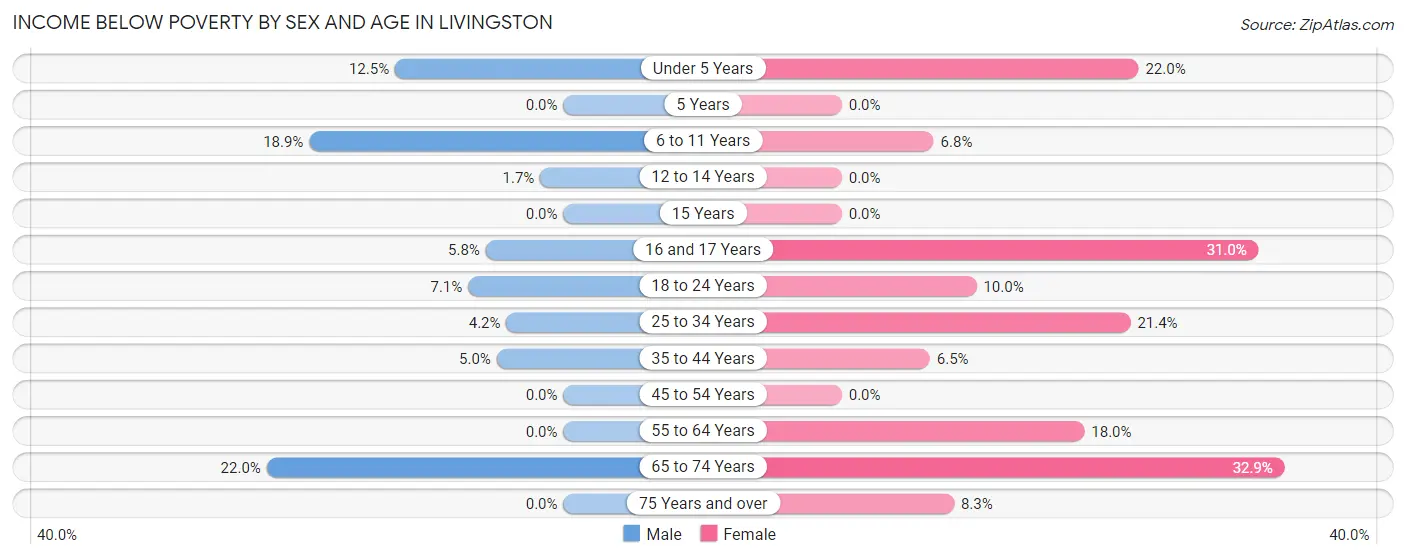
| Age Bracket | Male | Female |
| Under 5 Years | 11 (12.5%) | 13 (22.0%) |
| 5 Years | 0 (0.0%) | 0 (0.0%) |
| 6 to 11 Years | 10 (18.9%) | 6 (6.8%) |
| 12 to 14 Years | 1 (1.7%) | 0 (0.0%) |
| 15 Years | 0 (0.0%) | 0 (0.0%) |
| 16 and 17 Years | 3 (5.8%) | 13 (30.9%) |
| 18 to 24 Years | 7 (7.1%) | 9 (10.0%) |
| 25 to 34 Years | 6 (4.2%) | 18 (21.4%) |
| 35 to 44 Years | 5 (5.0%) | 14 (6.5%) |
| 45 to 54 Years | 0 (0.0%) | 0 (0.0%) |
| 55 to 64 Years | 0 (0.0%) | 29 (18.0%) |
| 65 to 74 Years | 13 (22.0%) | 24 (32.9%) |
| 75 Years and over | 0 (0.0%) | 6 (8.3%) |
| Total | 56 (6.0%) | 132 (12.3%) |
Income Above Poverty by Sex and Age in Livingston
According to the poverty statistics in Livingston, males aged 5 years and females aged 5 years are the age groups that are most secure financially, with 100.0% of males and 100.0% of females in these age groups living above the poverty line.
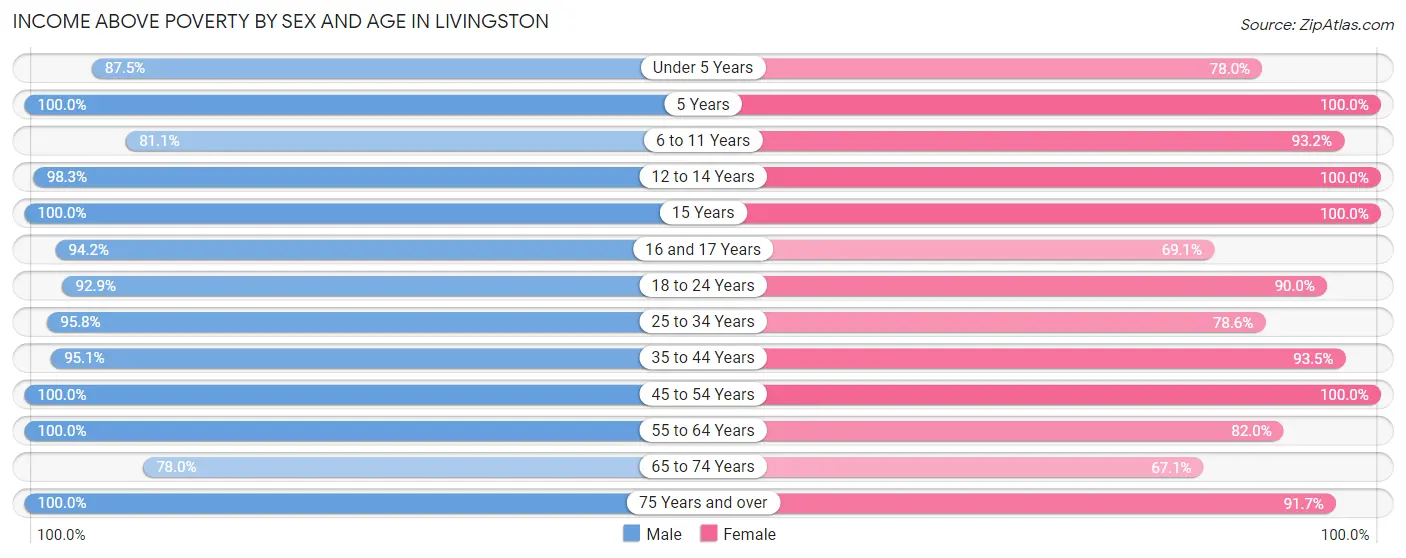
| Age Bracket | Male | Female |
| Under 5 Years | 77 (87.5%) | 46 (78.0%) |
| 5 Years | 5 (100.0%) | 5 (100.0%) |
| 6 to 11 Years | 43 (81.1%) | 82 (93.2%) |
| 12 to 14 Years | 57 (98.3%) | 33 (100.0%) |
| 15 Years | 36 (100.0%) | 25 (100.0%) |
| 16 and 17 Years | 49 (94.2%) | 29 (69.1%) |
| 18 to 24 Years | 92 (92.9%) | 81 (90.0%) |
| 25 to 34 Years | 136 (95.8%) | 66 (78.6%) |
| 35 to 44 Years | 96 (95.1%) | 200 (93.5%) |
| 45 to 54 Years | 88 (100.0%) | 128 (100.0%) |
| 55 to 64 Years | 109 (100.0%) | 132 (82.0%) |
| 65 to 74 Years | 46 (78.0%) | 49 (67.1%) |
| 75 Years and over | 44 (100.0%) | 66 (91.7%) |
| Total | 878 (94.0%) | 942 (87.7%) |
Income Below Poverty Among Married-Couple Families in Livingston
The poverty statistics for married-couple families in Livingston show that 2.4% or 9 of the total 383 families live below the poverty line. Families with 1 or 2 children have the highest poverty rate of 4.8%, comprising of 9 families. On the other hand, families with no children have the lowest poverty rate of 0.0%, which includes 0 families.
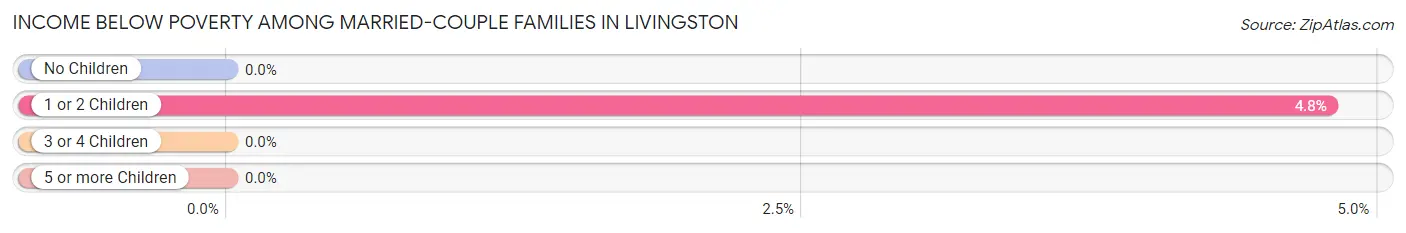
| Children | Above Poverty | Below Poverty |
| No Children | 183 (100.0%) | 0 (0.0%) |
| 1 or 2 Children | 179 (95.2%) | 9 (4.8%) |
| 3 or 4 Children | 12 (100.0%) | 0 (0.0%) |
| 5 or more Children | 0 (0.0%) | 0 (0.0%) |
| Total | 374 (97.7%) | 9 (2.4%) |
Income Below Poverty Among Single-Parent Households in Livingston
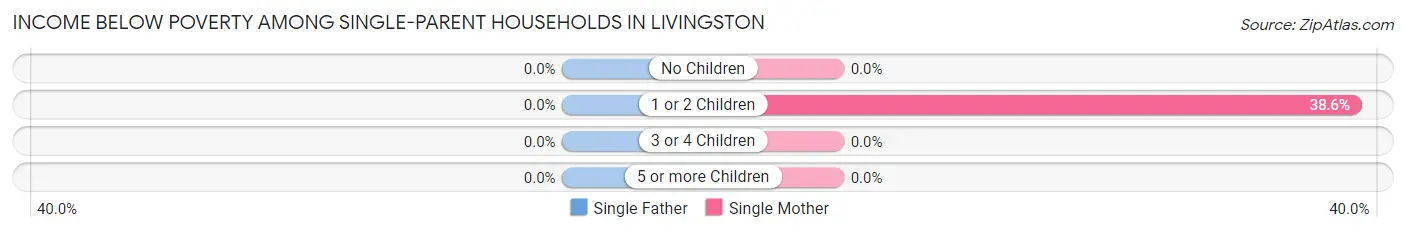
| Children | Single Father | Single Mother |
| No Children | 0 (0.0%) | 0 (0.0%) |
| 1 or 2 Children | 0 (0.0%) | 22 (38.6%) |
| 3 or 4 Children | 0 (0.0%) | 0 (0.0%) |
| 5 or more Children | 0 (0.0%) | 0 (0.0%) |
| Total | 0 (0.0%) | 22 (21.4%) |
Income Below Poverty Among Married-Couple vs Single-Parent Households in Livingston
The poverty data for Livingston shows that 9 of the married-couple family households (2.4%) and 22 of the single-parent households (18.2%) are living below the poverty level. Within the married-couple family households, those with 1 or 2 children have the highest poverty rate, with 9 households (4.8%) falling below the poverty line. Among the single-parent households, those with 1 or 2 children have the highest poverty rate, with 22 household (31.0%) living below poverty.
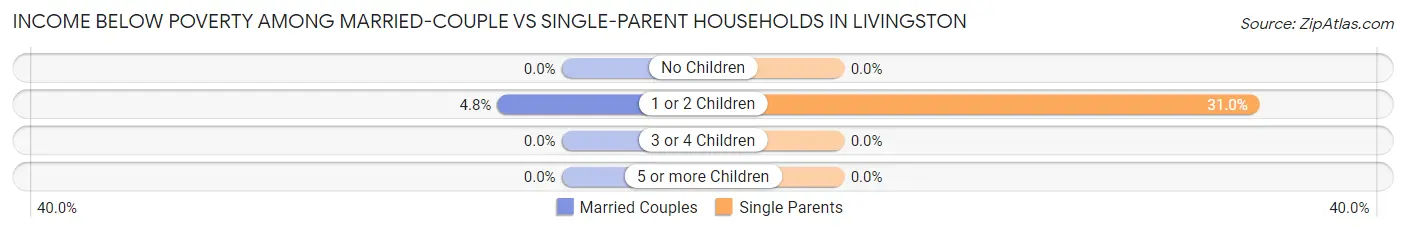
| Children | Married-Couple Families | Single-Parent Households |
| No Children | 0 (0.0%) | 0 (0.0%) |
| 1 or 2 Children | 9 (4.8%) | 22 (31.0%) |
| 3 or 4 Children | 0 (0.0%) | 0 (0.0%) |
| 5 or more Children | 0 (0.0%) | 0 (0.0%) |
| Total | 9 (2.4%) | 22 (18.2%) |
Race in Livingston
The most populous races in Livingston are White / Caucasian (1,849 | 92.1%), Black / African American (79 | 3.9%), and Two or more Races (63 | 3.1%).
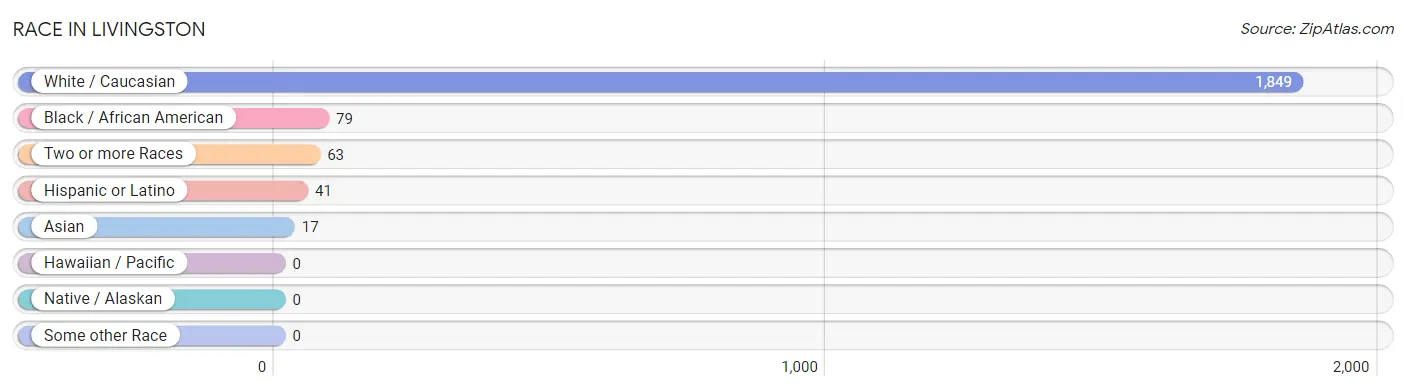
| Race | # Population | % Population |
| Asian | 17 | 0.9% |
| Black / African American | 79 | 3.9% |
| Hawaiian / Pacific | 0 | 0.0% |
| Hispanic or Latino | 41 | 2.0% |
| Native / Alaskan | 0 | 0.0% |
| White / Caucasian | 1,849 | 92.1% |
| Two or more Races | 63 | 3.1% |
| Some other Race | 0 | 0.0% |
| Total | 2,008 | 100.0% |
Ancestry in Livingston
The most populous ancestries reported in Livingston are Irish (227 | 11.3%), German (195 | 9.7%), English (192 | 9.6%), American (187 | 9.3%), and French (167 | 8.3%), together accounting for 48.2% of all Livingston residents.
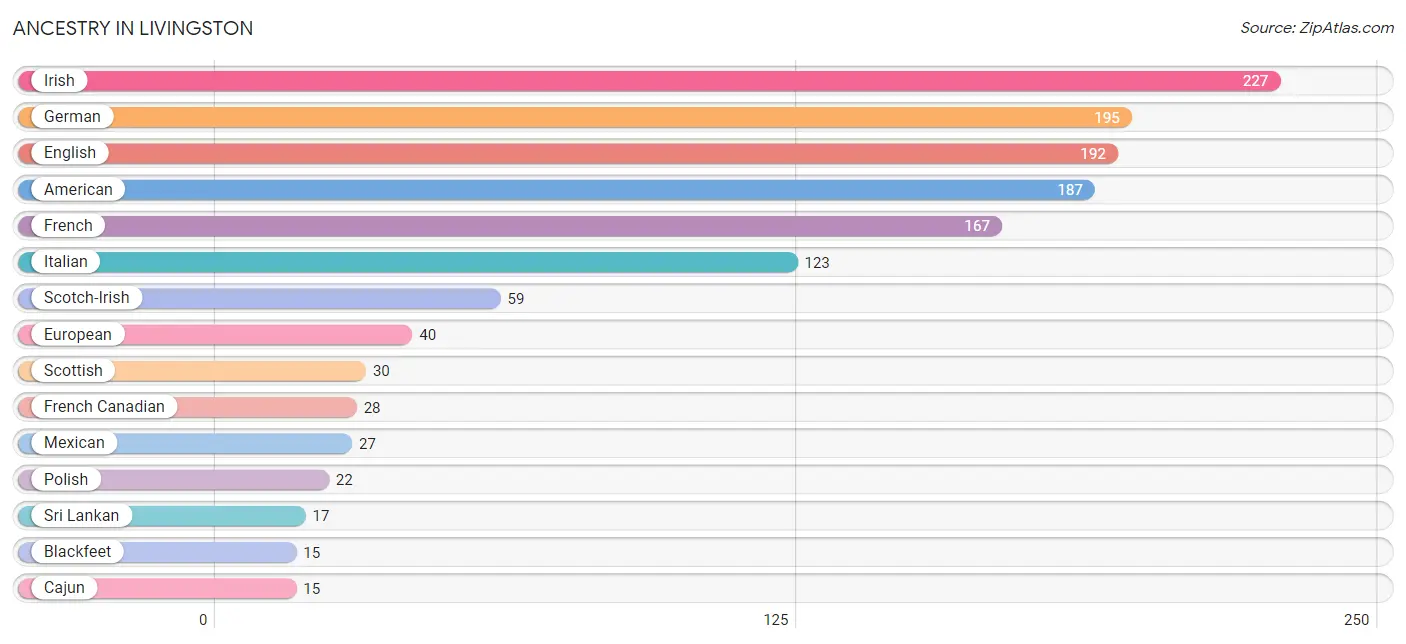
| Ancestry | # Population | % Population |
| American | 187 | 9.3% |
| Arab | 3 | 0.2% |
| Blackfeet | 15 | 0.7% |
| British | 14 | 0.7% |
| Cajun | 15 | 0.7% |
| Cherokee | 4 | 0.2% |
| Colombian | 10 | 0.5% |
| Dutch | 3 | 0.2% |
| English | 192 | 9.6% |
| European | 40 | 2.0% |
| French | 167 | 8.3% |
| French Canadian | 28 | 1.4% |
| German | 195 | 9.7% |
| Hungarian | 5 | 0.3% |
| Irish | 227 | 11.3% |
| Italian | 123 | 6.1% |
| Korean | 9 | 0.4% |
| Lebanese | 3 | 0.2% |
| Mexican | 27 | 1.3% |
| Norwegian | 6 | 0.3% |
| Polish | 22 | 1.1% |
| Russian | 5 | 0.3% |
| Scotch-Irish | 59 | 2.9% |
| Scottish | 30 | 1.5% |
| Slovak | 7 | 0.4% |
| South American | 10 | 0.5% |
| Spanish | 4 | 0.2% |
| Sri Lankan | 17 | 0.9% | View All 28 Rows |
Immigrants in Livingston
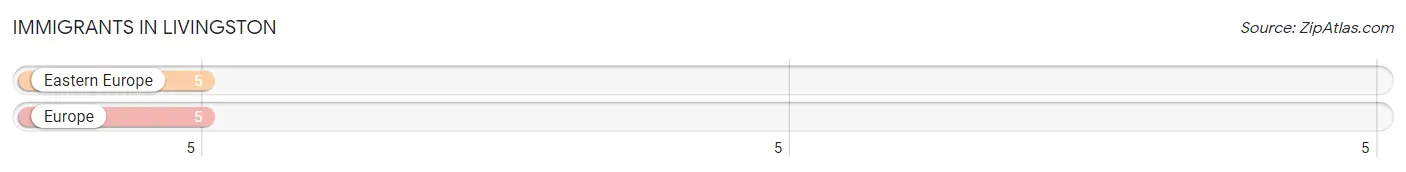
The most numerous immigrant groups reported in Livingston came from Eastern Europe (5 | 0.3%), and Europe (5 | 0.3%), together accounting for 0.5% of all Livingston residents.
| Immigration Origin | # Population | % Population |
| Eastern Europe | 5 | 0.3% |
| Europe | 5 | 0.3% | View All 2 Rows |
Sex and Age in Livingston
Sex and Age in Livingston
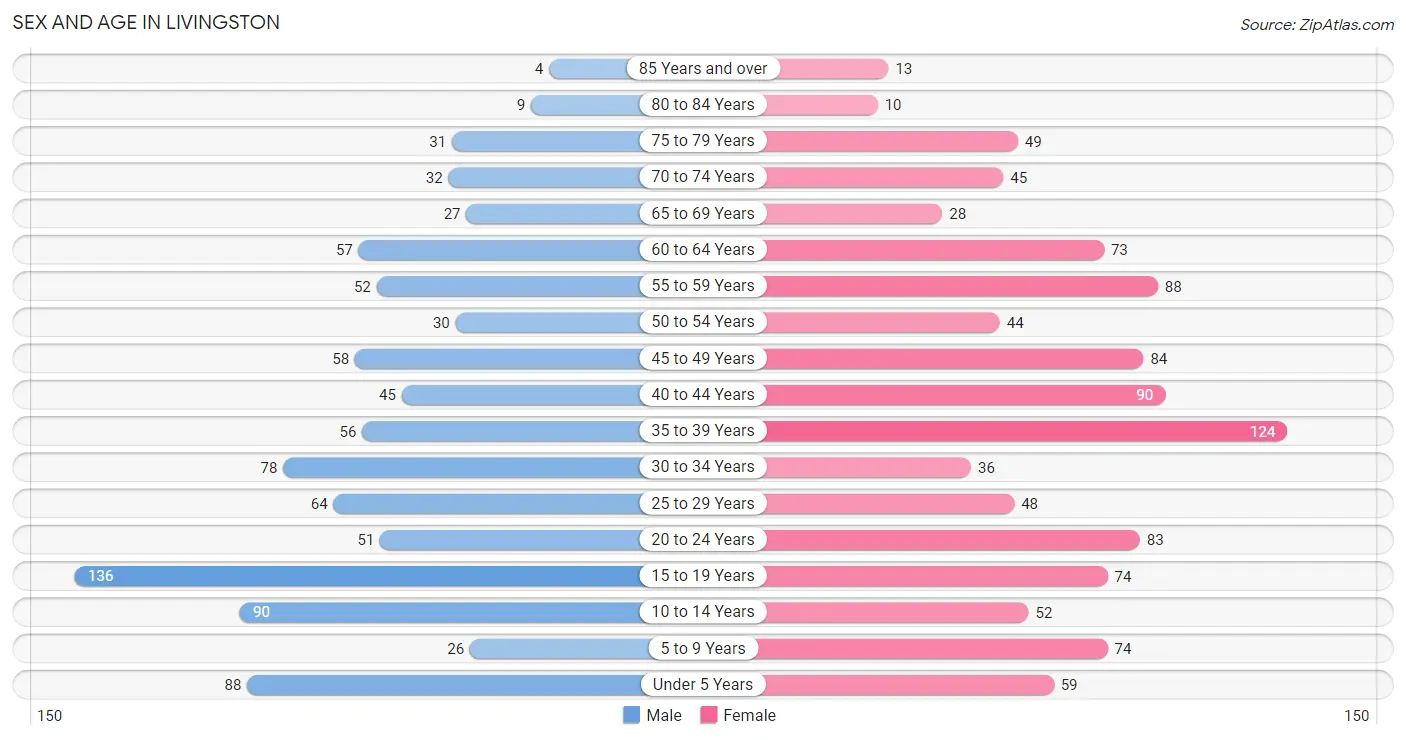
The most populous age groups in Livingston are 15 to 19 Years (136 | 14.6%) for men and 35 to 39 Years (124 | 11.6%) for women.
| Age Bracket | Male | Female |
| Under 5 Years | 88 (9.4%) | 59 (5.5%) |
| 5 to 9 Years | 26 (2.8%) | 74 (6.9%) |
| 10 to 14 Years | 90 (9.6%) | 52 (4.8%) |
| 15 to 19 Years | 136 (14.6%) | 74 (6.9%) |
| 20 to 24 Years | 51 (5.5%) | 83 (7.7%) |
| 25 to 29 Years | 64 (6.9%) | 48 (4.5%) |
| 30 to 34 Years | 78 (8.4%) | 36 (3.4%) |
| 35 to 39 Years | 56 (6.0%) | 124 (11.6%) |
| 40 to 44 Years | 45 (4.8%) | 90 (8.4%) |
| 45 to 49 Years | 58 (6.2%) | 84 (7.8%) |
| 50 to 54 Years | 30 (3.2%) | 44 (4.1%) |
| 55 to 59 Years | 52 (5.6%) | 88 (8.2%) |
| 60 to 64 Years | 57 (6.1%) | 73 (6.8%) |
| 65 to 69 Years | 27 (2.9%) | 28 (2.6%) |
| 70 to 74 Years | 32 (3.4%) | 45 (4.2%) |
| 75 to 79 Years | 31 (3.3%) | 49 (4.6%) |
| 80 to 84 Years | 9 (1.0%) | 10 (0.9%) |
| 85 Years and over | 4 (0.4%) | 13 (1.2%) |
| Total | 934 (100.0%) | 1,074 (100.0%) |
Families and Households in Livingston
Median Family Size in Livingston
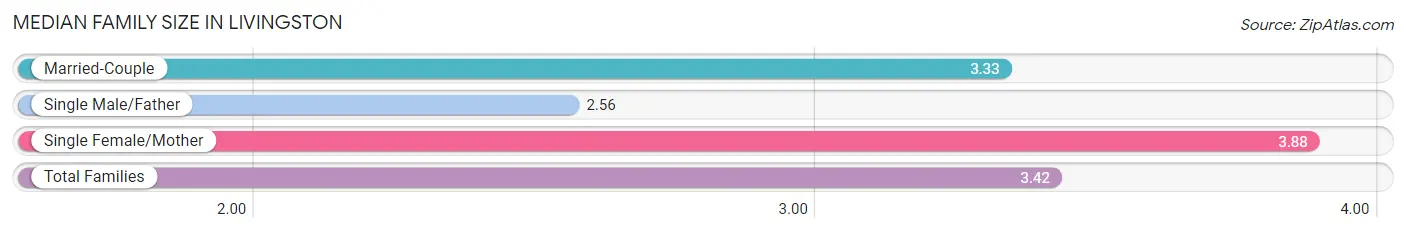
The median family size in Livingston is 3.42 persons per family, with single female/mother families (103 | 20.4%) accounting for the largest median family size of 3.88 persons per family. On the other hand, single male/father families (18 | 3.6%) represent the smallest median family size with 2.56 persons per family.
| Family Type | # Families | Family Size |
| Married-Couple | 383 (76.0%) | 3.33 |
| Single Male/Father | 18 (3.6%) | 2.56 |
| Single Female/Mother | 103 (20.4%) | 3.88 |
| Total Families | 504 (100.0%) | 3.42 |
Median Household Size in Livingston
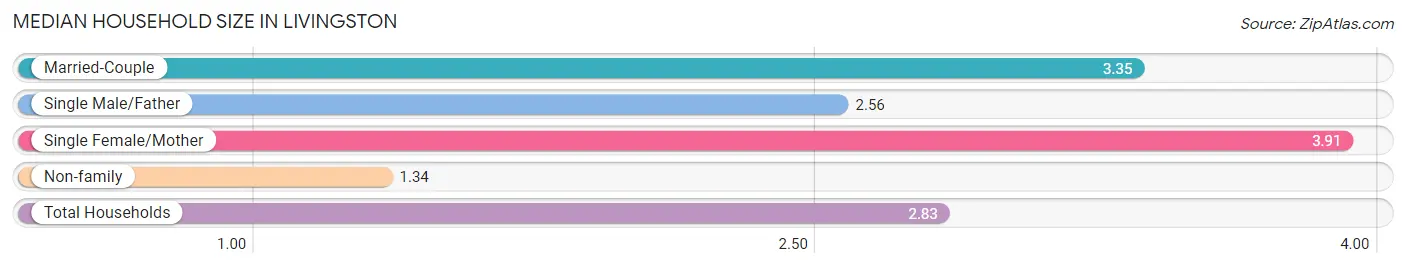
The median household size in Livingston is 2.83 persons per household, with single female/mother households (103 | 14.5%) accounting for the largest median household size of 3.91 persons per household. non-family households (205 | 28.9%) represent the smallest median household size with 1.34 persons per household.
| Household Type | # Households | Household Size |
| Married-Couple | 383 (54.0%) | 3.35 |
| Single Male/Father | 18 (2.5%) | 2.56 |
| Single Female/Mother | 103 (14.5%) | 3.91 |
| Non-family | 205 (28.9%) | 1.34 |
| Total Households | 709 (100.0%) | 2.83 |
Household Size by Marriage Status in Livingston
Out of a total of 709 households in Livingston, 504 (71.1%) are family households, while 205 (28.9%) are nonfamily households. The most numerous type of family households are 4-person households, comprising 200, and the most common type of nonfamily households are 1-person households, comprising 159.
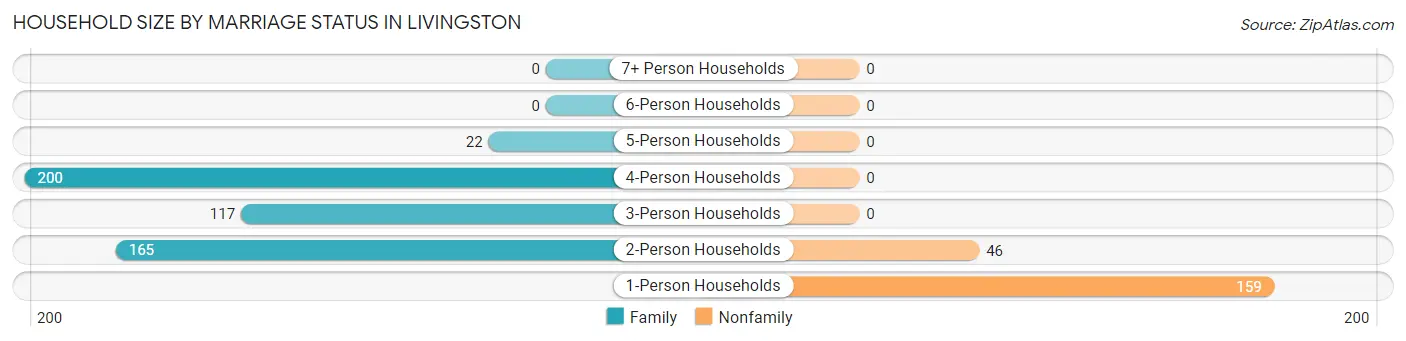
| Household Size | Family Households | Nonfamily Households |
| 1-Person Households | - | 159 (22.4%) |
| 2-Person Households | 165 (23.3%) | 46 (6.5%) |
| 3-Person Households | 117 (16.5%) | 0 (0.0%) |
| 4-Person Households | 200 (28.2%) | 0 (0.0%) |
| 5-Person Households | 22 (3.1%) | 0 (0.0%) |
| 6-Person Households | 0 (0.0%) | 0 (0.0%) |
| 7+ Person Households | 0 (0.0%) | 0 (0.0%) |
| Total | 504 (71.1%) | 205 (28.9%) |
Female Fertility in Livingston
Fertility by Age in Livingston
Average fertility rate in Livingston is 31.0 births per 1,000 women. Women in the age bracket of 20 to 34 years have the highest fertility rate with 102.0 births per 1,000 women. Women in the age bracket of 20 to 34 years acount for 100.0% of all women with births.
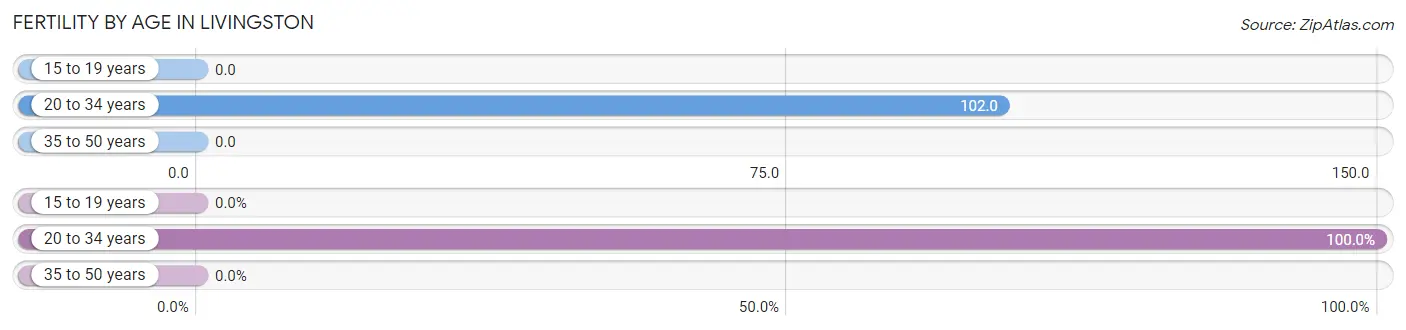
| Age Bracket | Women with Births | Births / 1,000 Women |
| 15 to 19 years | 0 (0.0%) | 0.0 |
| 20 to 34 years | 17 (100.0%) | 102.0 |
| 35 to 50 years | 0 (0.0%) | 0.0 |
| Total | 17 (100.0%) | 31.0 |
Fertility by Age by Marriage Status in Livingston
58.8% of women with births (17) in Livingston are married. The highest percentage of unmarried women with births falls into 20 to 34 years age bracket with 41.2% of them unmarried at the time of birth, while the lowest percentage of unmarried women with births belong to 20 to 34 years age bracket with 41.2% of them unmarried.
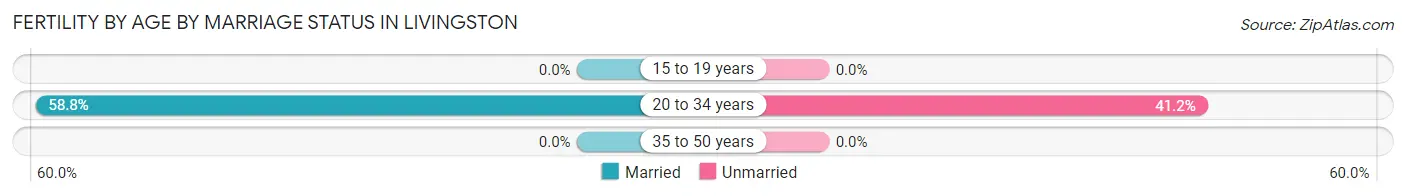
| Age Bracket | Married | Unmarried |
| 15 to 19 years | 0 (0.0%) | 0 (0.0%) |
| 20 to 34 years | 10 (58.8%) | 7 (41.2%) |
| 35 to 50 years | 0 (0.0%) | 0 (0.0%) |
| Total | 10 (58.8%) | 7 (41.2%) |
Fertility by Education in Livingston
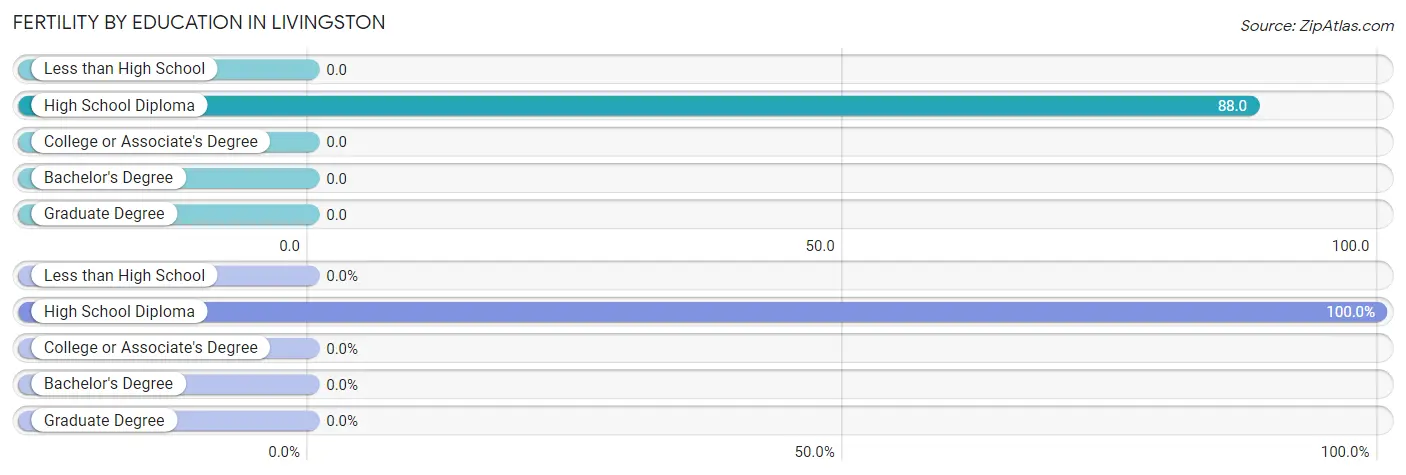
| Educational Attainment | Women with Births | Births / 1,000 Women |
| Less than High School | 0 (0.0%) | 0.0 |
| High School Diploma | 17 (100.0%) | 88.0 |
| College or Associate's Degree | 0 (0.0%) | 0.0 |
| Bachelor's Degree | 0 (0.0%) | 0.0 |
| Graduate Degree | 0 (0.0%) | 0.0 |
| Total | 17 (100.0%) | 31.0 |
Fertility by Education by Marriage Status in Livingston
41.2% of women with births in Livingston are unmarried. Women with the educational attainment of high school diploma are most likely to be married with 58.8% of them married at childbirth, while women with the educational attainment of high school diploma are least likely to be married with 41.2% of them unmarried at childbirth.
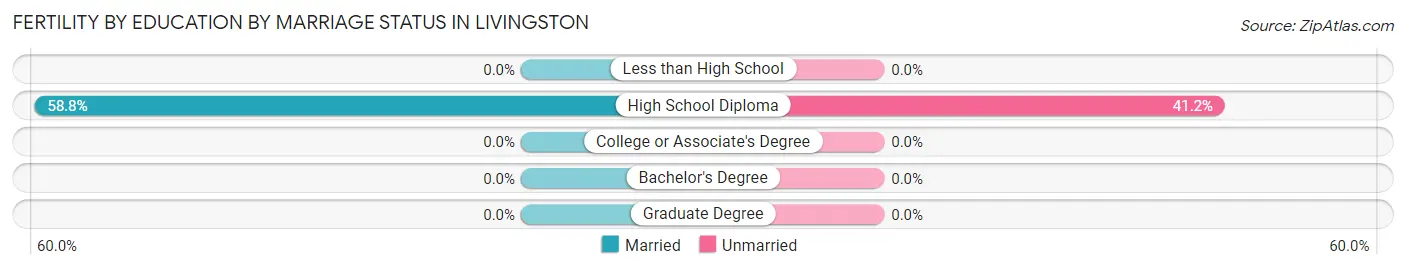
| Educational Attainment | Married | Unmarried |
| Less than High School | 0 (0.0%) | 0 (0.0%) |
| High School Diploma | 10 (58.8%) | 7 (41.2%) |
| College or Associate's Degree | 0 (0.0%) | 0 (0.0%) |
| Bachelor's Degree | 0 (0.0%) | 0 (0.0%) |
| Graduate Degree | 0 (0.0%) | 0 (0.0%) |
| Total | 10 (58.8%) | 7 (41.2%) |
Employment Characteristics in Livingston
Employment by Class of Employer in Livingston
Among the 893 employed individuals in Livingston, private company employees (505 | 56.6%), local government employees (140 | 15.7%), and state government employees (106 | 11.9%) make up the most common classes of employment.
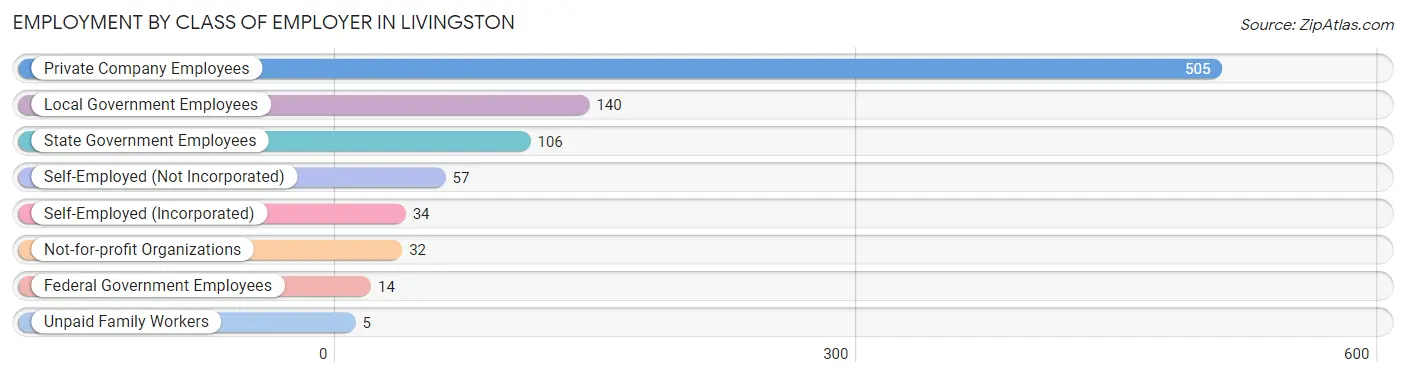
| Employer Class | # Employees | % Employees |
| Private Company Employees | 505 | 56.6% |
| Self-Employed (Incorporated) | 34 | 3.8% |
| Self-Employed (Not Incorporated) | 57 | 6.4% |
| Not-for-profit Organizations | 32 | 3.6% |
| Local Government Employees | 140 | 15.7% |
| State Government Employees | 106 | 11.9% |
| Federal Government Employees | 14 | 1.6% |
| Unpaid Family Workers | 5 | 0.6% |
| Total | 893 | 100.0% |
Employment Status by Age in Livingston
According to the labor force statistics for Livingston, out of the total population over 16 years of age (1,558), 61.6% or 960 individuals are in the labor force, with 4.1% or 39 of them unemployed. The age group with the highest labor force participation rate is 45 to 54 years, with 94.0% or 203 individuals in the labor force. Within the labor force, the 20 to 24 years age range has the highest percentage of unemployed individuals, with 19.2% or 24 of them being unemployed.
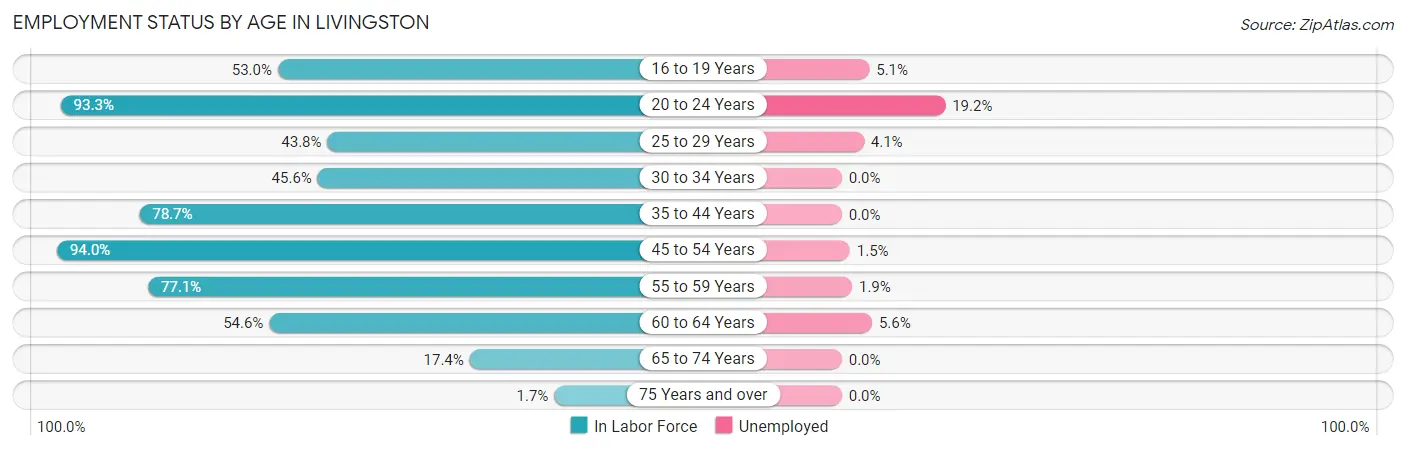
| Age Bracket | In Labor Force | Unemployed |
| 16 to 19 Years | 79 (53.0%) | 4 (5.1%) |
| 20 to 24 Years | 125 (93.3%) | 24 (19.2%) |
| 25 to 29 Years | 49 (43.8%) | 2 (4.1%) |
| 30 to 34 Years | 52 (45.6%) | 0 (0.0%) |
| 35 to 44 Years | 248 (78.7%) | 0 (0.0%) |
| 45 to 54 Years | 203 (94.0%) | 3 (1.5%) |
| 55 to 59 Years | 108 (77.1%) | 2 (1.9%) |
| 60 to 64 Years | 71 (54.6%) | 4 (5.6%) |
| 65 to 74 Years | 23 (17.4%) | 0 (0.0%) |
| 75 Years and over | 2 (1.7%) | 0 (0.0%) |
| Total | 960 (61.6%) | 39 (4.1%) |
Employment Status by Educational Attainment in Livingston
According to labor force statistics for Livingston, 71.2% of individuals (731) out of the total population between 25 and 64 years of age (1,027) are in the labor force, with 1.5% or 11 of them being unemployed. The group with the highest labor force participation rate are those with the educational attainment of bachelor's degree or higher, with 90.7% or 186 individuals in the labor force. Within the labor force, individuals with less than high school education have the highest percentage of unemployment, with 5.4% or 3 of them being unemployed.
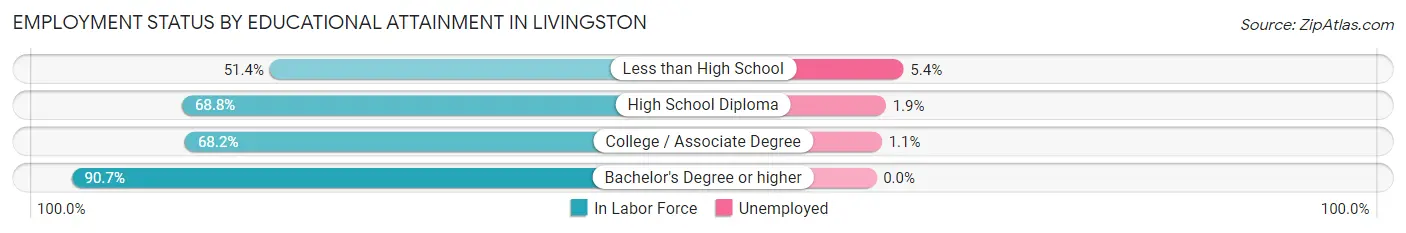
| Educational Attainment | In Labor Force | Unemployed |
| Less than High School | 56 (51.4%) | 6 (5.4%) |
| High School Diploma | 311 (68.8%) | 9 (1.9%) |
| College / Associate Degree | 178 (68.2%) | 3 (1.1%) |
| Bachelor's Degree or higher | 186 (90.7%) | 0 (0.0%) |
| Total | 731 (71.2%) | 15 (1.5%) |
Employment Occupations by Sex in Livingston
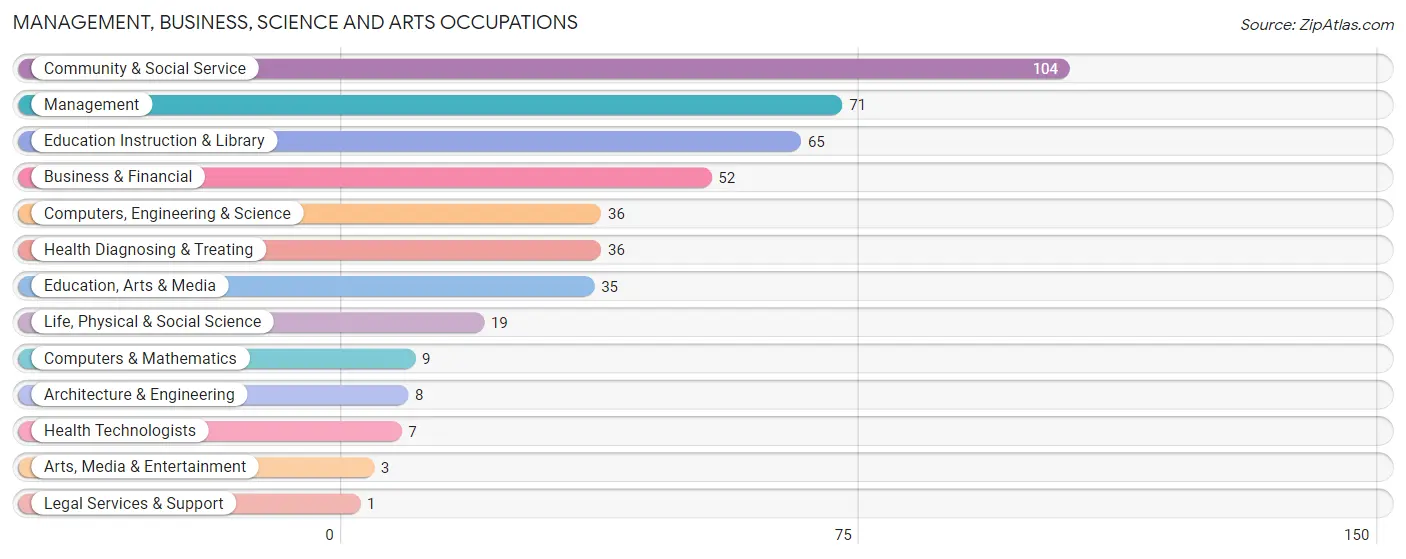
Management, Business, Science and Arts Occupations
The most common Management, Business, Science and Arts occupations in Livingston are Community & Social Service (104 | 11.3%), Management (71 | 7.7%), Education Instruction & Library (65 | 7.1%), Business & Financial (52 | 5.7%), and Computers, Engineering & Science (36 | 3.9%).
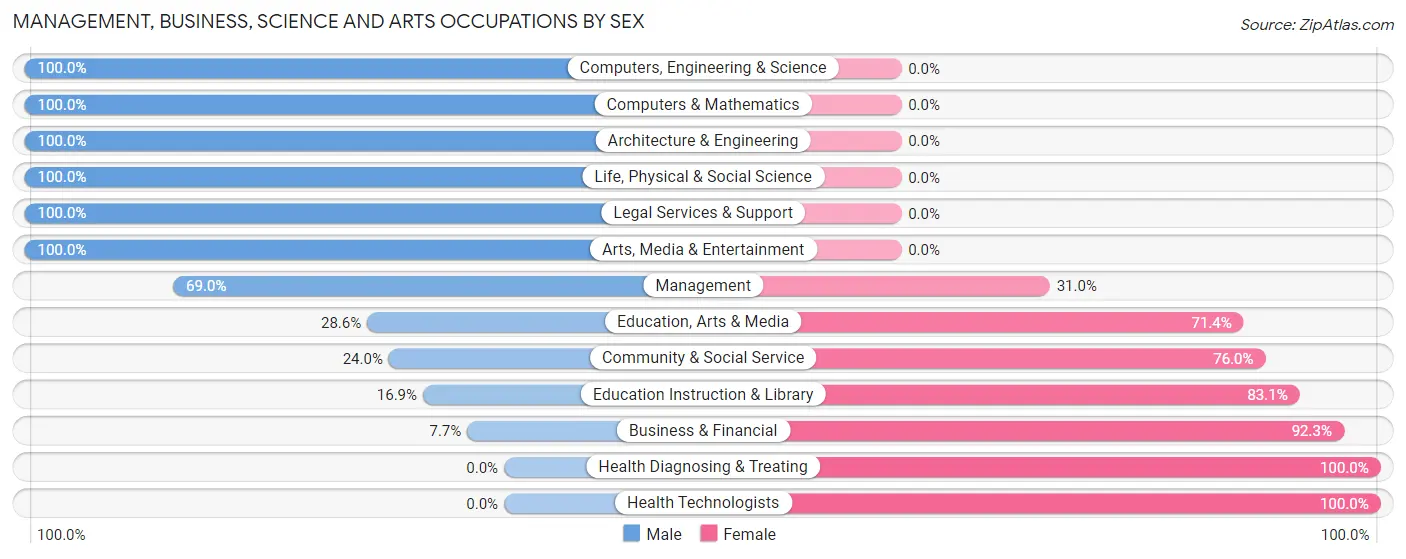
Management, Business, Science and Arts Occupations by Sex
Within the Management, Business, Science and Arts occupations in Livingston, the most male-oriented occupations are Computers, Engineering & Science (100.0%), Computers & Mathematics (100.0%), and Architecture & Engineering (100.0%), while the most female-oriented occupations are Health Diagnosing & Treating (100.0%), Health Technologists (100.0%), and Business & Financial (92.3%).
| Occupation | Male | Female |
| Management | 49 (69.0%) | 22 (31.0%) |
| Business & Financial | 4 (7.7%) | 48 (92.3%) |
| Computers, Engineering & Science | 36 (100.0%) | 0 (0.0%) |
| Computers & Mathematics | 9 (100.0%) | 0 (0.0%) |
| Architecture & Engineering | 8 (100.0%) | 0 (0.0%) |
| Life, Physical & Social Science | 19 (100.0%) | 0 (0.0%) |
| Community & Social Service | 25 (24.0%) | 79 (76.0%) |
| Education, Arts & Media | 10 (28.6%) | 25 (71.4%) |
| Legal Services & Support | 1 (100.0%) | 0 (0.0%) |
| Education Instruction & Library | 11 (16.9%) | 54 (83.1%) |
| Arts, Media & Entertainment | 3 (100.0%) | 0 (0.0%) |
| Health Diagnosing & Treating | 0 (0.0%) | 36 (100.0%) |
| Health Technologists | 0 (0.0%) | 7 (100.0%) |
| Total (Category) | 114 (38.1%) | 185 (61.9%) |
| Total (Overall) | 483 (52.4%) | 438 (47.6%) |
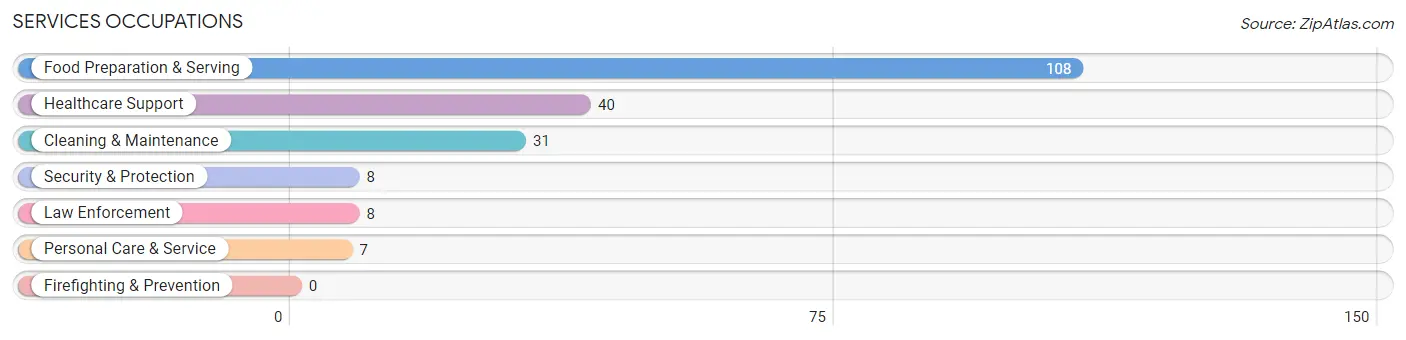
Services Occupations
The most common Services occupations in Livingston are Food Preparation & Serving (108 | 11.7%), Healthcare Support (40 | 4.3%), Cleaning & Maintenance (31 | 3.4%), Security & Protection (8 | 0.9%), and Law Enforcement (8 | 0.9%).
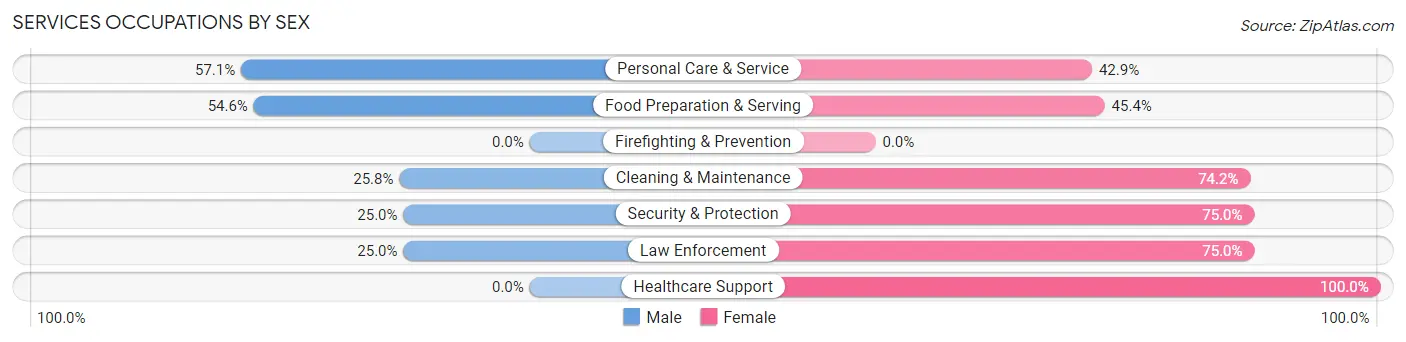
Services Occupations by Sex
Within the Services occupations in Livingston, the most male-oriented occupations are Personal Care & Service (57.1%), Food Preparation & Serving (54.6%), and Cleaning & Maintenance (25.8%), while the most female-oriented occupations are Healthcare Support (100.0%), Security & Protection (75.0%), and Law Enforcement (75.0%).
| Occupation | Male | Female |
| Healthcare Support | 0 (0.0%) | 40 (100.0%) |
| Security & Protection | 2 (25.0%) | 6 (75.0%) |
| Firefighting & Prevention | 0 (0.0%) | 0 (0.0%) |
| Law Enforcement | 2 (25.0%) | 6 (75.0%) |
| Food Preparation & Serving | 59 (54.6%) | 49 (45.4%) |
| Cleaning & Maintenance | 8 (25.8%) | 23 (74.2%) |
| Personal Care & Service | 4 (57.1%) | 3 (42.9%) |
| Total (Category) | 73 (37.6%) | 121 (62.4%) |
| Total (Overall) | 483 (52.4%) | 438 (47.6%) |
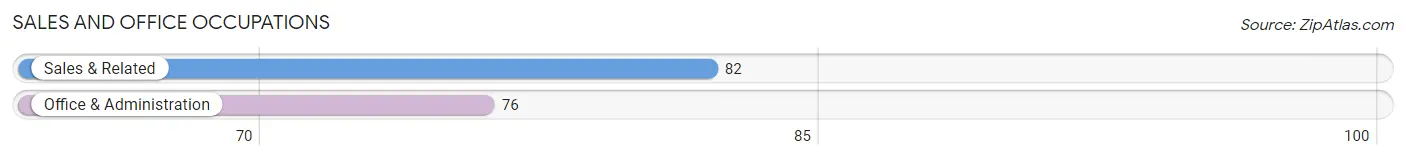
Sales and Office Occupations
The most common Sales and Office occupations in Livingston are Sales & Related (82 | 8.9%), and Office & Administration (76 | 8.3%).
Sales and Office Occupations by Sex
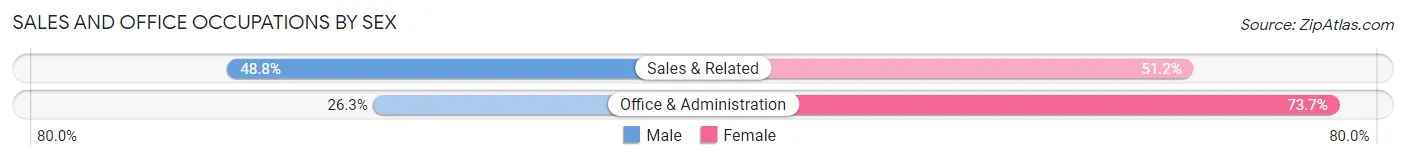
| Occupation | Male | Female |
| Sales & Related | 40 (48.8%) | 42 (51.2%) |
| Office & Administration | 20 (26.3%) | 56 (73.7%) |
| Total (Category) | 60 (38.0%) | 98 (62.0%) |
| Total (Overall) | 483 (52.4%) | 438 (47.6%) |
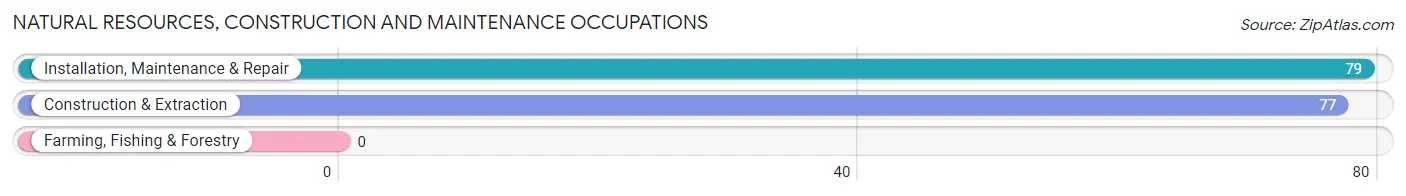
Natural Resources, Construction and Maintenance Occupations
The most common Natural Resources, Construction and Maintenance occupations in Livingston are Installation, Maintenance & Repair (79 | 8.6%), and Construction & Extraction (77 | 8.4%).
Natural Resources, Construction and Maintenance Occupations by Sex
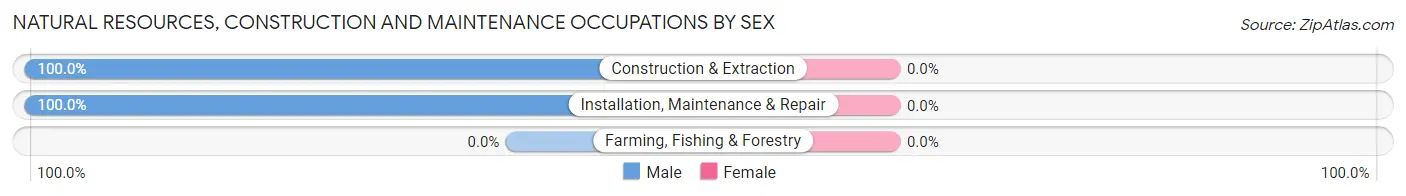
| Occupation | Male | Female |
| Farming, Fishing & Forestry | 0 (0.0%) | 0 (0.0%) |
| Construction & Extraction | 77 (100.0%) | 0 (0.0%) |
| Installation, Maintenance & Repair | 79 (100.0%) | 0 (0.0%) |
| Total (Category) | 156 (100.0%) | 0 (0.0%) |
| Total (Overall) | 483 (52.4%) | 438 (47.6%) |
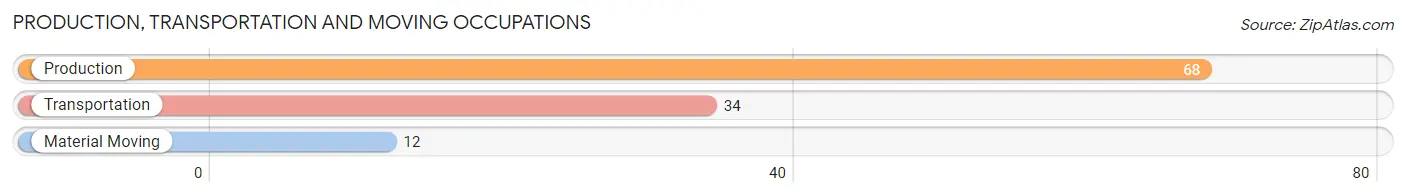
Production, Transportation and Moving Occupations
The most common Production, Transportation and Moving occupations in Livingston are Production (68 | 7.4%), Transportation (34 | 3.7%), and Material Moving (12 | 1.3%).
Production, Transportation and Moving Occupations by Sex
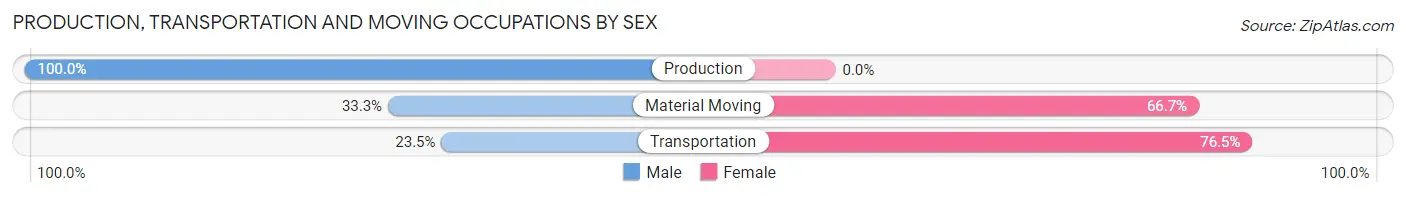
| Occupation | Male | Female |
| Production | 68 (100.0%) | 0 (0.0%) |
| Transportation | 8 (23.5%) | 26 (76.5%) |
| Material Moving | 4 (33.3%) | 8 (66.7%) |
| Total (Category) | 80 (70.2%) | 34 (29.8%) |
| Total (Overall) | 483 (52.4%) | 438 (47.6%) |
Employment Industries by Sex in Livingston
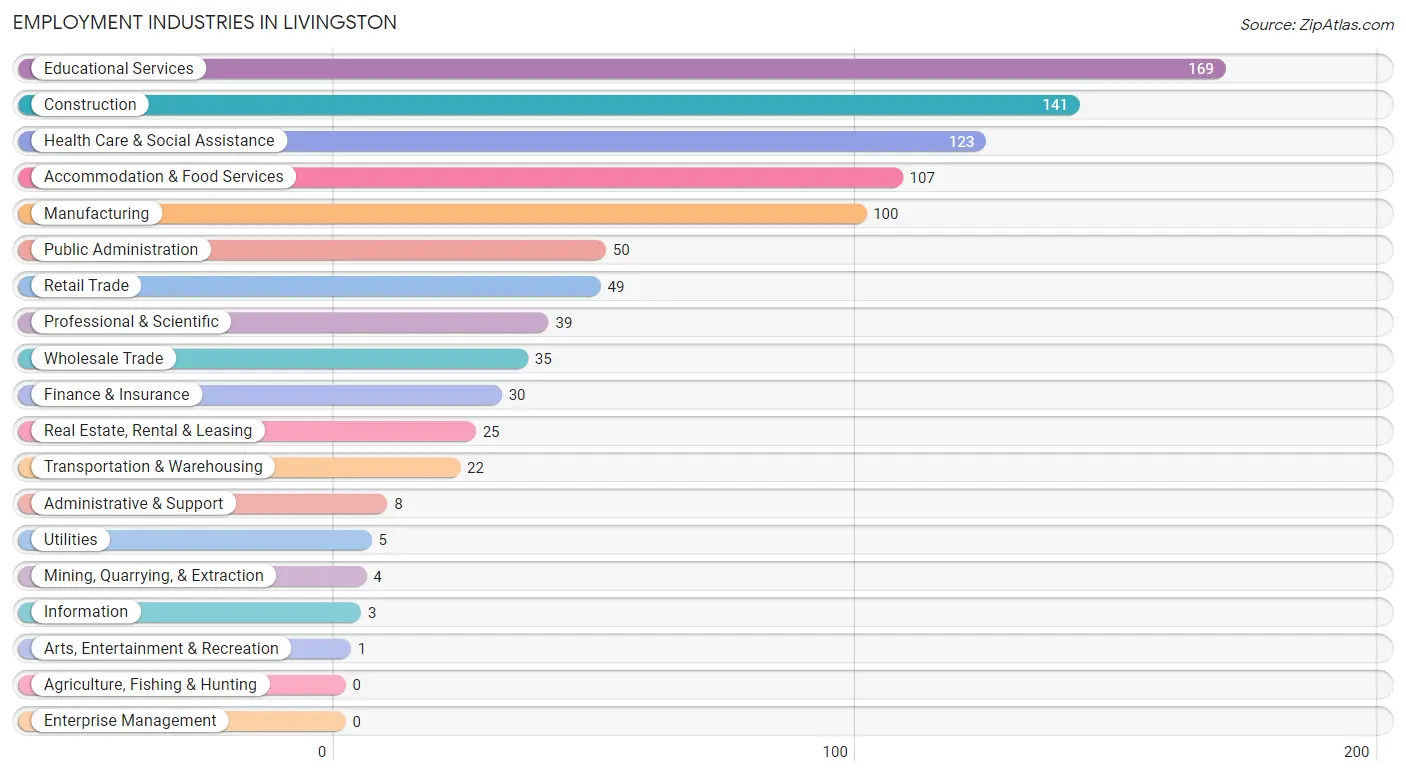
Employment Industries in Livingston
The major employment industries in Livingston include Educational Services (169 | 18.3%), Construction (141 | 15.3%), Health Care & Social Assistance (123 | 13.4%), Accommodation & Food Services (107 | 11.6%), and Manufacturing (100 | 10.9%).
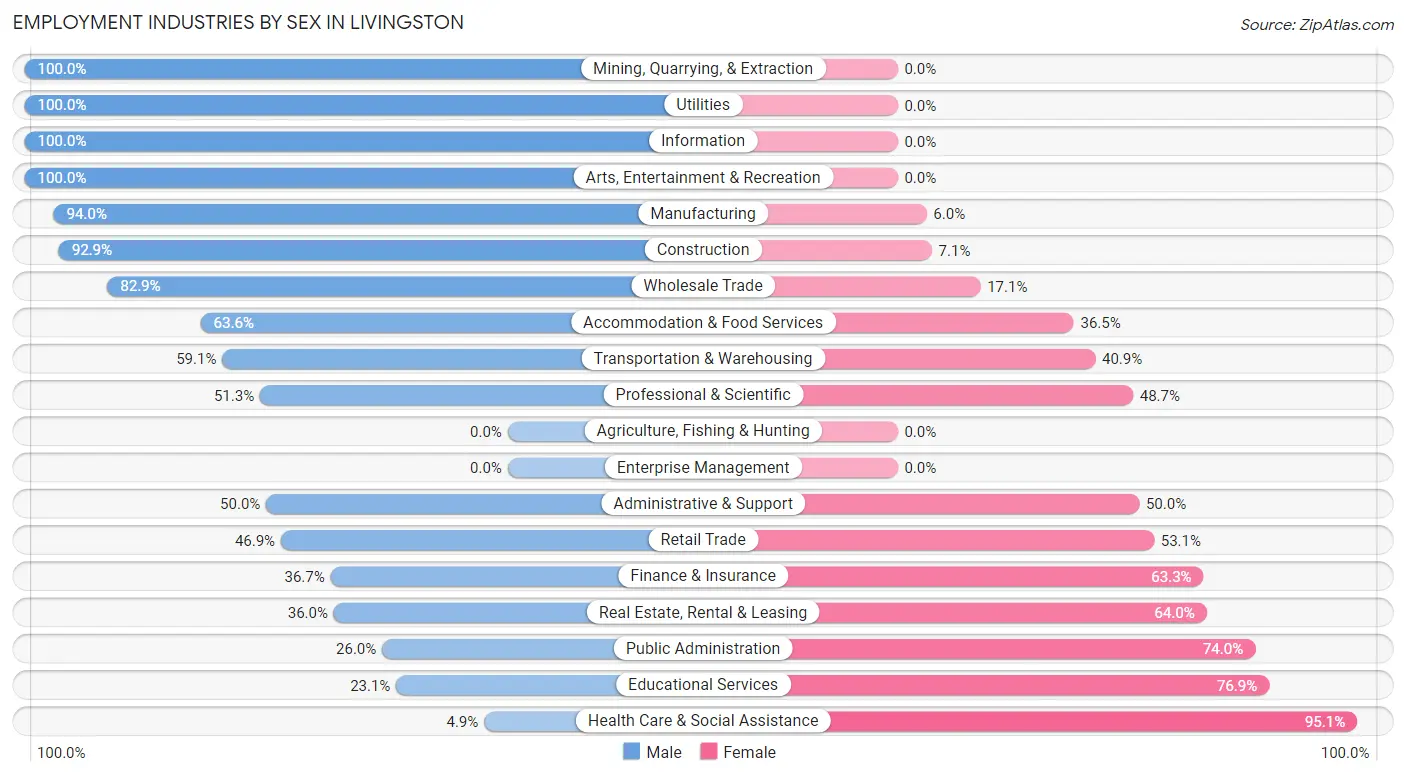
Employment Industries by Sex in Livingston
The Livingston industries that see more men than women are Mining, Quarrying, & Extraction (100.0%), Utilities (100.0%), and Information (100.0%), whereas the industries that tend to have a higher number of women are Health Care & Social Assistance (95.1%), Educational Services (76.9%), and Public Administration (74.0%).
| Industry | Male | Female |
| Agriculture, Fishing & Hunting | 0 (0.0%) | 0 (0.0%) |
| Mining, Quarrying, & Extraction | 4 (100.0%) | 0 (0.0%) |
| Construction | 131 (92.9%) | 10 (7.1%) |
| Manufacturing | 94 (94.0%) | 6 (6.0%) |
| Wholesale Trade | 29 (82.9%) | 6 (17.1%) |
| Retail Trade | 23 (46.9%) | 26 (53.1%) |
| Transportation & Warehousing | 13 (59.1%) | 9 (40.9%) |
| Utilities | 5 (100.0%) | 0 (0.0%) |
| Information | 3 (100.0%) | 0 (0.0%) |
| Finance & Insurance | 11 (36.7%) | 19 (63.3%) |
| Real Estate, Rental & Leasing | 9 (36.0%) | 16 (64.0%) |
| Professional & Scientific | 20 (51.3%) | 19 (48.7%) |
| Enterprise Management | 0 (0.0%) | 0 (0.0%) |
| Administrative & Support | 4 (50.0%) | 4 (50.0%) |
| Educational Services | 39 (23.1%) | 130 (76.9%) |
| Health Care & Social Assistance | 6 (4.9%) | 117 (95.1%) |
| Arts, Entertainment & Recreation | 1 (100.0%) | 0 (0.0%) |
| Accommodation & Food Services | 68 (63.5%) | 39 (36.4%) |
| Public Administration | 13 (26.0%) | 37 (74.0%) |
| Total | 483 (52.4%) | 438 (47.6%) |
Education in Livingston
School Enrollment in Livingston
The most common levels of schooling among the 509 students in Livingston are high school (197 | 38.7%), middle school (132 | 25.9%), and elementary school (84 | 16.5%).
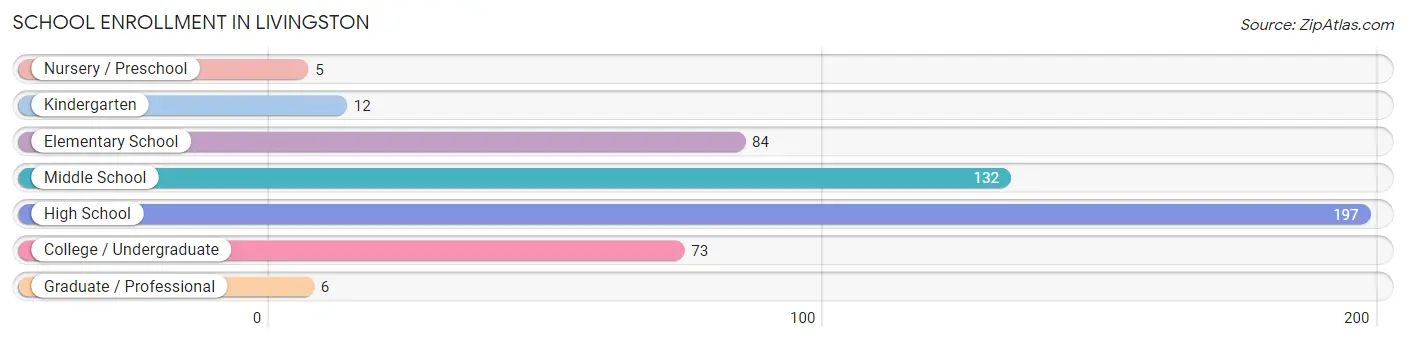
| School Level | # Students | % Students |
| Nursery / Preschool | 5 | 1.0% |
| Kindergarten | 12 | 2.4% |
| Elementary School | 84 | 16.5% |
| Middle School | 132 | 25.9% |
| High School | 197 | 38.7% |
| College / Undergraduate | 73 | 14.3% |
| Graduate / Professional | 6 | 1.2% |
| Total | 509 | 100.0% |
School Enrollment by Age by Funding Source in Livingston
Out of a total of 509 students who are enrolled in schools in Livingston, 29 (5.7%) attend a private institution, while the remaining 480 (94.3%) are enrolled in public schools. The age group of 35 years and over has the highest likelihood of being enrolled in private schools, with 6 (46.2% in the age bracket) enrolled. Conversely, the age group of 5 to 9 year old has the lowest likelihood of being enrolled in a private school, with 100 (100.0% in the age bracket) attending a public institution.
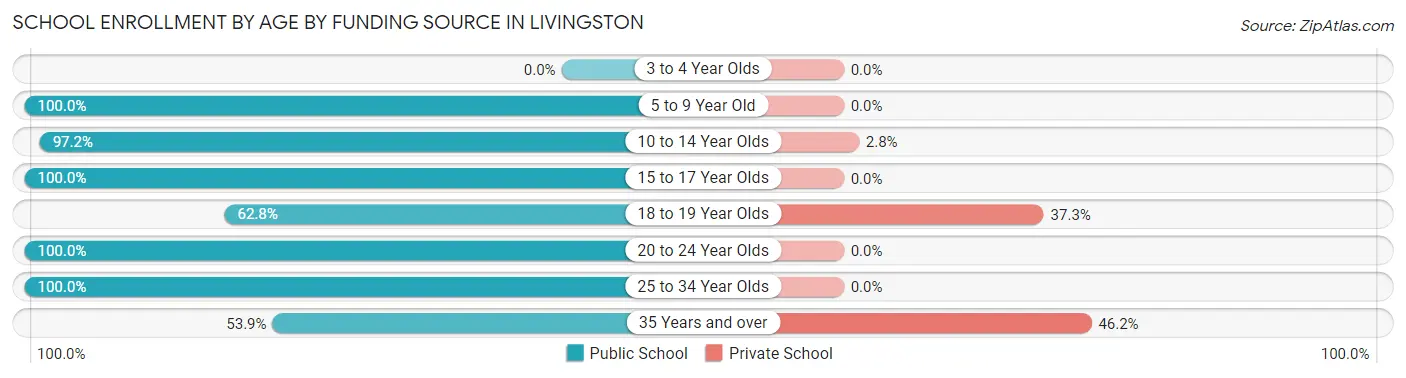
| Age Bracket | Public School | Private School |
| 3 to 4 Year Olds | 0 (0.0%) | 0 (0.0%) |
| 5 to 9 Year Old | 100 (100.0%) | 0 (0.0%) |
| 10 to 14 Year Olds | 138 (97.2%) | 4 (2.8%) |
| 15 to 17 Year Olds | 152 (100.0%) | 0 (0.0%) |
| 18 to 19 Year Olds | 32 (62.7%) | 19 (37.2%) |
| 20 to 24 Year Olds | 46 (100.0%) | 0 (0.0%) |
| 25 to 34 Year Olds | 5 (100.0%) | 0 (0.0%) |
| 35 Years and over | 7 (53.8%) | 6 (46.2%) |
| Total | 480 (94.3%) | 29 (5.7%) |
Educational Attainment by Field of Study in Livingston
Business (70 | 30.7%), arts & humanities (46 | 20.2%), education (40 | 17.5%), science & technology (23 | 10.1%), and liberal arts & history (19 | 8.3%) are the most common fields of study among 228 individuals in Livingston who have obtained a bachelor's degree or higher.
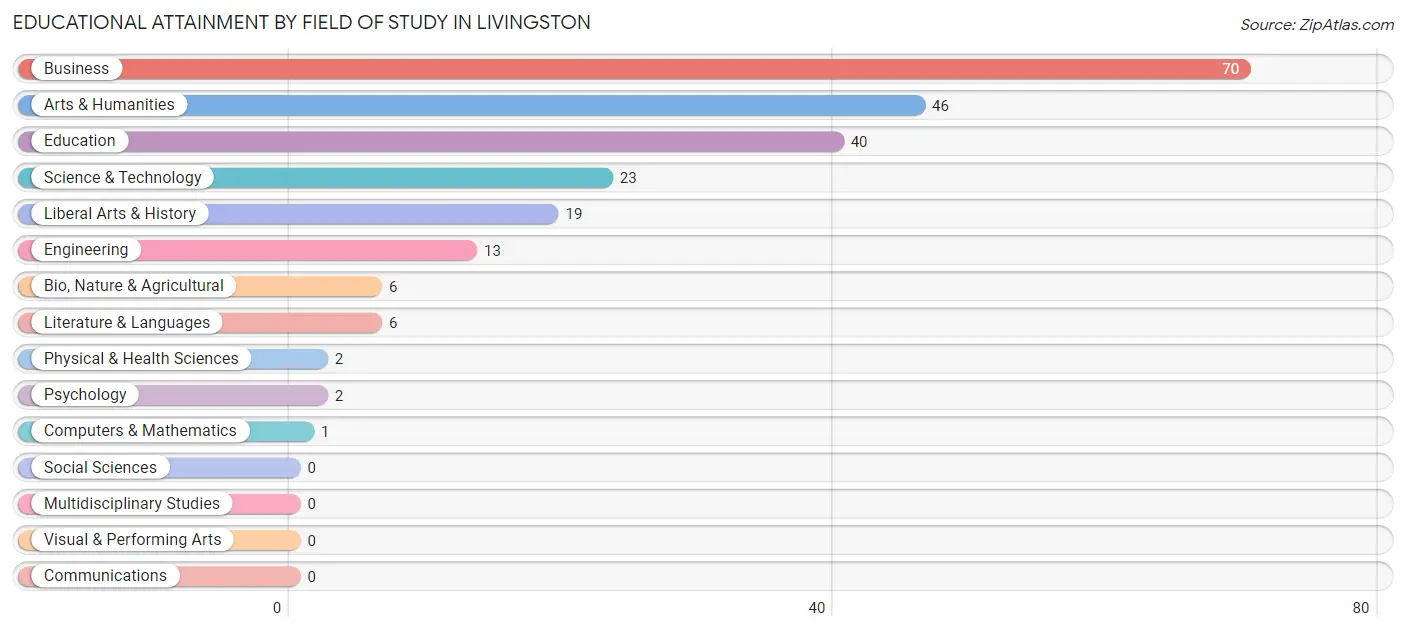
| Field of Study | # Graduates | % Graduates |
| Computers & Mathematics | 1 | 0.4% |
| Bio, Nature & Agricultural | 6 | 2.6% |
| Physical & Health Sciences | 2 | 0.9% |
| Psychology | 2 | 0.9% |
| Social Sciences | 0 | 0.0% |
| Engineering | 13 | 5.7% |
| Multidisciplinary Studies | 0 | 0.0% |
| Science & Technology | 23 | 10.1% |
| Business | 70 | 30.7% |
| Education | 40 | 17.5% |
| Literature & Languages | 6 | 2.6% |
| Liberal Arts & History | 19 | 8.3% |
| Visual & Performing Arts | 0 | 0.0% |
| Communications | 0 | 0.0% |
| Arts & Humanities | 46 | 20.2% |
| Total | 228 | 100.0% |
Transportation & Commute in Livingston
Vehicle Availability by Sex in Livingston
The most prevalent vehicle ownership categories in Livingston are males with 2 vehicles (172, accounting for 36.1%) and females with 2 vehicles (184, making up 41.3%).
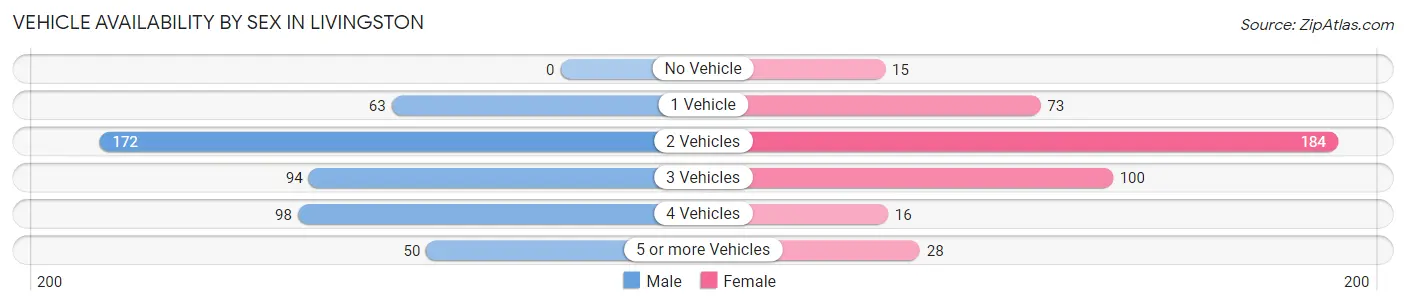
| Vehicles Available | Male | Female |
| No Vehicle | 0 (0.0%) | 15 (3.6%) |
| 1 Vehicle | 63 (13.2%) | 73 (17.5%) |
| 2 Vehicles | 172 (36.1%) | 184 (44.2%) |
| 3 Vehicles | 94 (19.7%) | 100 (24.0%) |
| 4 Vehicles | 98 (20.5%) | 16 (3.8%) |
| 5 or more Vehicles | 50 (10.5%) | 28 (6.7%) |
| Total | 477 (100.0%) | 416 (100.0%) |
Commute Time in Livingston
The most frequently occuring commute durations in Livingston are 30 to 34 minutes (200 commuters, 22.5%), 5 to 9 minutes (125 commuters, 14.1%), and 10 to 14 minutes (110 commuters, 12.4%).
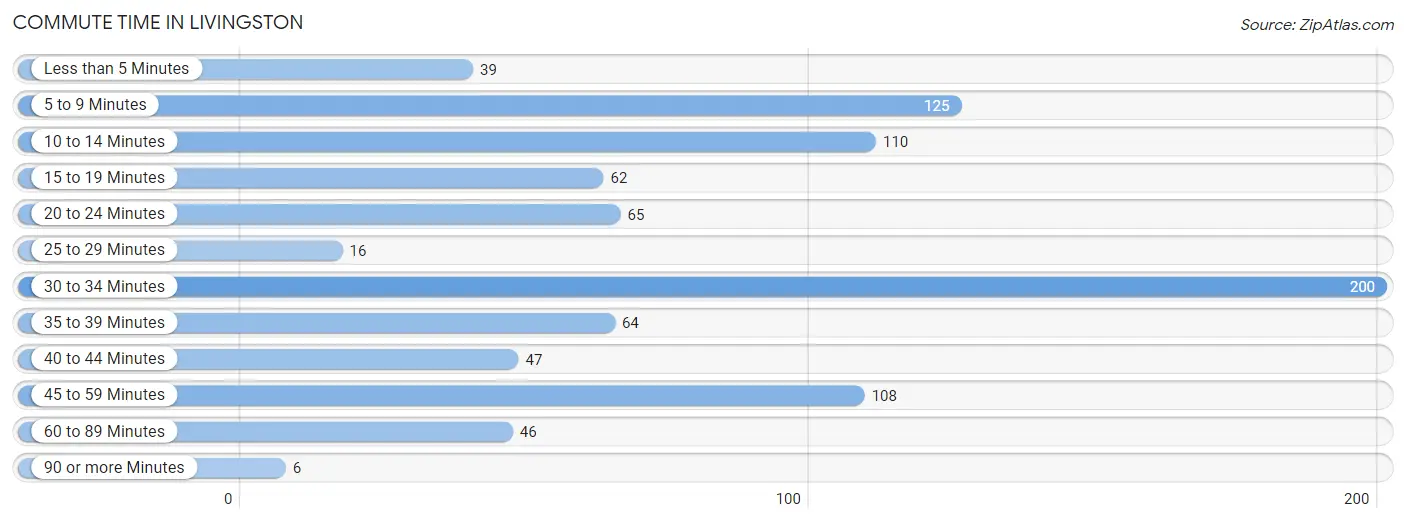
| Commute Time | # Commuters | % Commuters |
| Less than 5 Minutes | 39 | 4.4% |
| 5 to 9 Minutes | 125 | 14.1% |
| 10 to 14 Minutes | 110 | 12.4% |
| 15 to 19 Minutes | 62 | 7.0% |
| 20 to 24 Minutes | 65 | 7.3% |
| 25 to 29 Minutes | 16 | 1.8% |
| 30 to 34 Minutes | 200 | 22.5% |
| 35 to 39 Minutes | 64 | 7.2% |
| 40 to 44 Minutes | 47 | 5.3% |
| 45 to 59 Minutes | 108 | 12.2% |
| 60 to 89 Minutes | 46 | 5.2% |
| 90 or more Minutes | 6 | 0.7% |
Commute Time by Sex in Livingston
The most common commute times in Livingston are 30 to 34 minutes (107 commuters, 22.7%) for males and 5 to 9 minutes (97 commuters, 23.3%) for females.
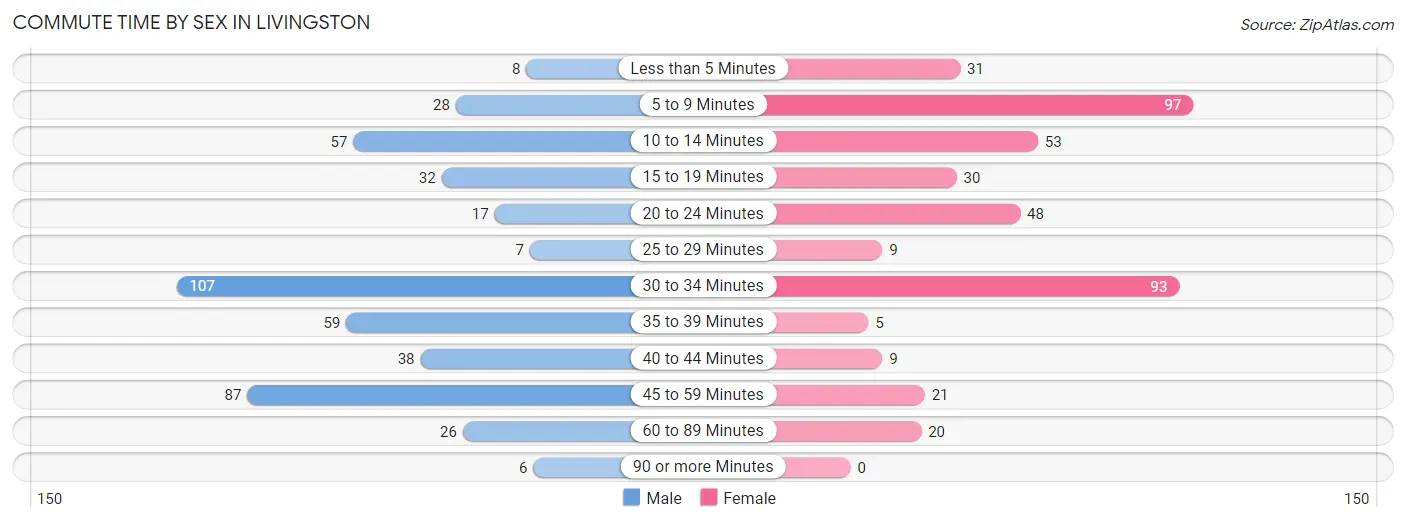
| Commute Time | Male | Female |
| Less than 5 Minutes | 8 (1.7%) | 31 (7.4%) |
| 5 to 9 Minutes | 28 (5.9%) | 97 (23.3%) |
| 10 to 14 Minutes | 57 (12.1%) | 53 (12.7%) |
| 15 to 19 Minutes | 32 (6.8%) | 30 (7.2%) |
| 20 to 24 Minutes | 17 (3.6%) | 48 (11.5%) |
| 25 to 29 Minutes | 7 (1.5%) | 9 (2.2%) |
| 30 to 34 Minutes | 107 (22.7%) | 93 (22.4%) |
| 35 to 39 Minutes | 59 (12.5%) | 5 (1.2%) |
| 40 to 44 Minutes | 38 (8.1%) | 9 (2.2%) |
| 45 to 59 Minutes | 87 (18.4%) | 21 (5.1%) |
| 60 to 89 Minutes | 26 (5.5%) | 20 (4.8%) |
| 90 or more Minutes | 6 (1.3%) | 0 (0.0%) |
Time of Departure to Work by Sex in Livingston
The most frequent times of departure to work in Livingston are 12:00 AM to 4:59 AM (117, 24.8%) for males and 8:00 AM to 8:29 AM (90, 21.6%) for females.
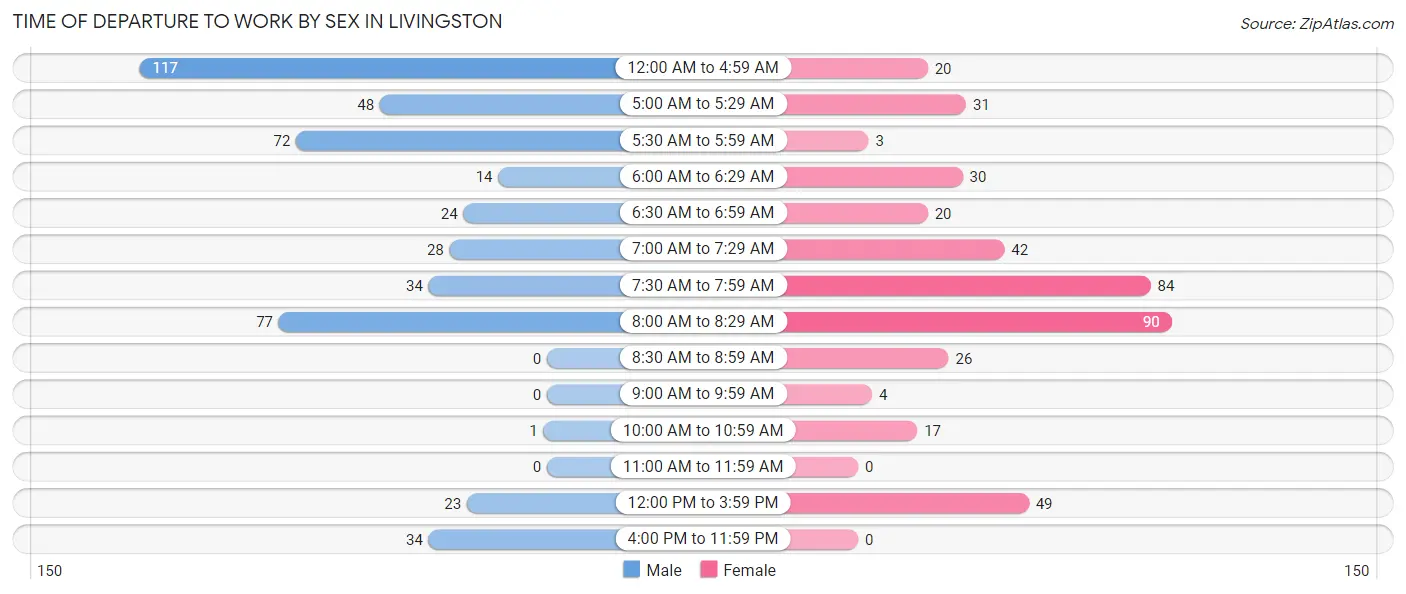
| Time of Departure | Male | Female |
| 12:00 AM to 4:59 AM | 117 (24.8%) | 20 (4.8%) |
| 5:00 AM to 5:29 AM | 48 (10.2%) | 31 (7.4%) |
| 5:30 AM to 5:59 AM | 72 (15.2%) | 3 (0.7%) |
| 6:00 AM to 6:29 AM | 14 (3.0%) | 30 (7.2%) |
| 6:30 AM to 6:59 AM | 24 (5.1%) | 20 (4.8%) |
| 7:00 AM to 7:29 AM | 28 (5.9%) | 42 (10.1%) |
| 7:30 AM to 7:59 AM | 34 (7.2%) | 84 (20.2%) |
| 8:00 AM to 8:29 AM | 77 (16.3%) | 90 (21.6%) |
| 8:30 AM to 8:59 AM | 0 (0.0%) | 26 (6.2%) |
| 9:00 AM to 9:59 AM | 0 (0.0%) | 4 (1.0%) |
| 10:00 AM to 10:59 AM | 1 (0.2%) | 17 (4.1%) |
| 11:00 AM to 11:59 AM | 0 (0.0%) | 0 (0.0%) |
| 12:00 PM to 3:59 PM | 23 (4.9%) | 49 (11.8%) |
| 4:00 PM to 11:59 PM | 34 (7.2%) | 0 (0.0%) |
| Total | 472 (100.0%) | 416 (100.0%) |
Housing Occupancy in Livingston
Occupancy by Ownership in Livingston
Of the total 709 dwellings in Livingston, owner-occupied units account for 470 (66.3%), while renter-occupied units make up 239 (33.7%).
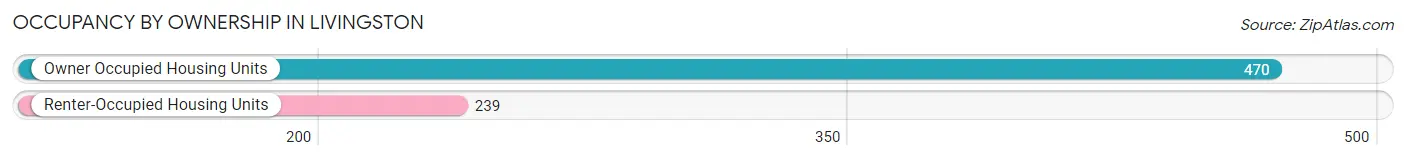
| Occupancy | # Housing Units | % Housing Units |
| Owner Occupied Housing Units | 470 | 66.3% |
| Renter-Occupied Housing Units | 239 | 33.7% |
| Total Occupied Housing Units | 709 | 100.0% |
Occupancy by Household Size in Livingston
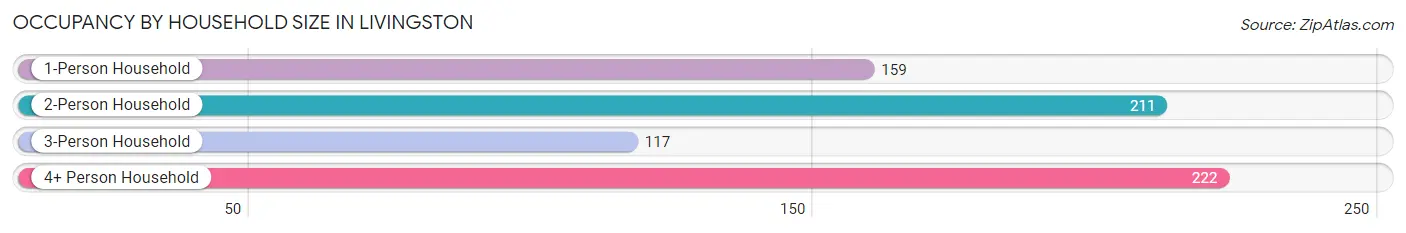
| Household Size | # Housing Units | % Housing Units |
| 1-Person Household | 159 | 22.4% |
| 2-Person Household | 211 | 29.8% |
| 3-Person Household | 117 | 16.5% |
| 4+ Person Household | 222 | 31.3% |
| Total Housing Units | 709 | 100.0% |
Occupancy by Ownership by Household Size in Livingston
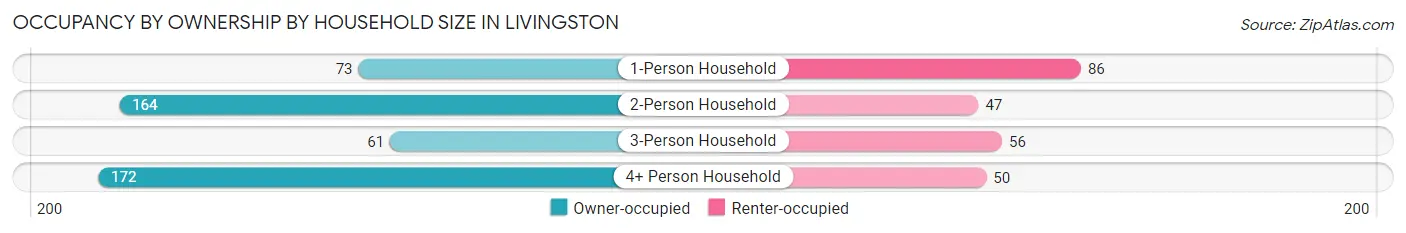
| Household Size | Owner-occupied | Renter-occupied |
| 1-Person Household | 73 (45.9%) | 86 (54.1%) |
| 2-Person Household | 164 (77.7%) | 47 (22.3%) |
| 3-Person Household | 61 (52.1%) | 56 (47.9%) |
| 4+ Person Household | 172 (77.5%) | 50 (22.5%) |
| Total Housing Units | 470 (66.3%) | 239 (33.7%) |
Occupancy by Educational Attainment in Livingston
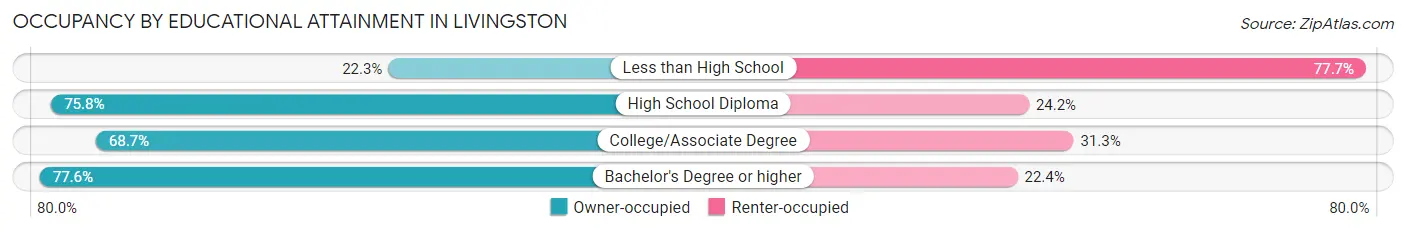
| Household Size | Owner-occupied | Renter-occupied |
| Less than High School | 23 (22.3%) | 80 (77.7%) |
| High School Diploma | 172 (75.8%) | 55 (24.2%) |
| College/Associate Degree | 147 (68.7%) | 67 (31.3%) |
| Bachelor's Degree or higher | 128 (77.6%) | 37 (22.4%) |
Occupancy by Age of Householder in Livingston
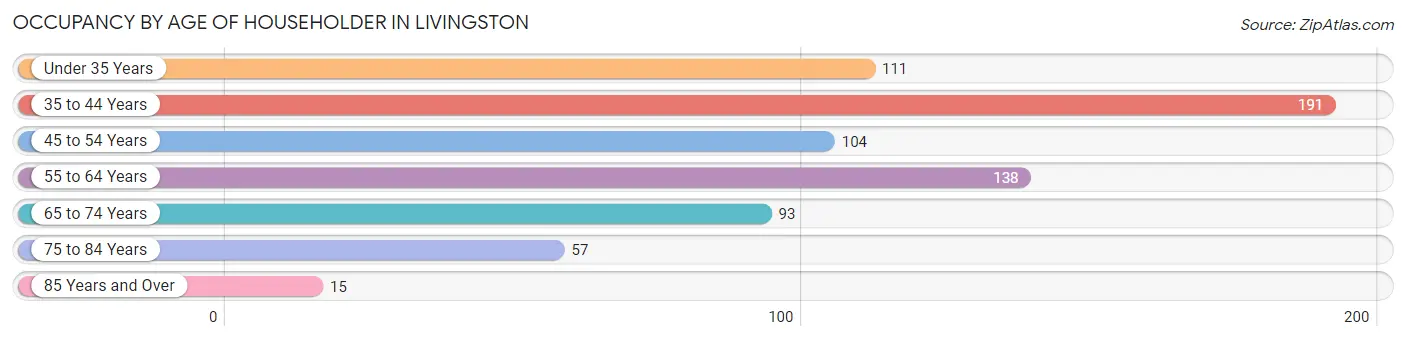
| Age Bracket | # Households | % Households |
| Under 35 Years | 111 | 15.7% |
| 35 to 44 Years | 191 | 26.9% |
| 45 to 54 Years | 104 | 14.7% |
| 55 to 64 Years | 138 | 19.5% |
| 65 to 74 Years | 93 | 13.1% |
| 75 to 84 Years | 57 | 8.0% |
| 85 Years and Over | 15 | 2.1% |
| Total | 709 | 100.0% |
Housing Finances in Livingston
Median Income by Occupancy in Livingston
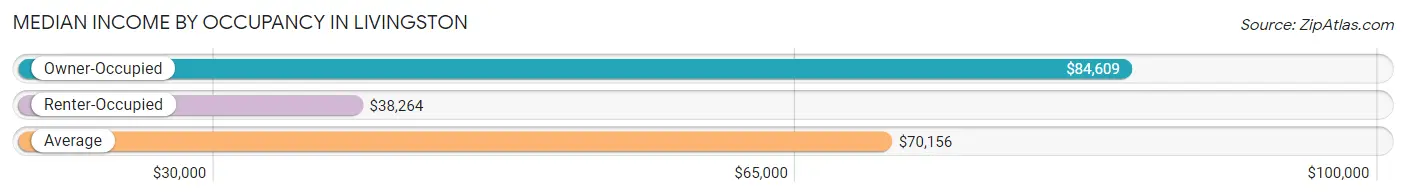
| Occupancy Type | # Households | Median Income |
| Owner-Occupied | 470 (66.3%) | $84,609 |
| Renter-Occupied | 239 (33.7%) | $38,264 |
| Average | 709 (100.0%) | $70,156 |
Occupancy by Householder Income Bracket in Livingston
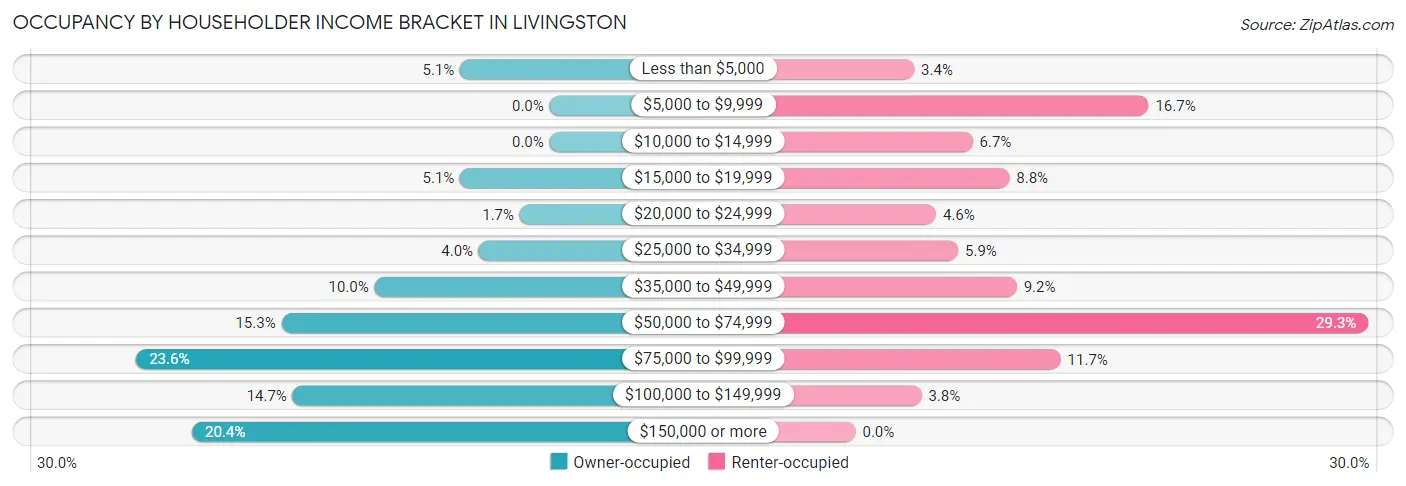
| Income Bracket | Owner-occupied | Renter-occupied |
| Less than $5,000 | 24 (5.1%) | 8 (3.4%) |
| $5,000 to $9,999 | 0 (0.0%) | 40 (16.7%) |
| $10,000 to $14,999 | 0 (0.0%) | 16 (6.7%) |
| $15,000 to $19,999 | 24 (5.1%) | 21 (8.8%) |
| $20,000 to $24,999 | 8 (1.7%) | 11 (4.6%) |
| $25,000 to $34,999 | 19 (4.0%) | 14 (5.9%) |
| $35,000 to $49,999 | 47 (10.0%) | 22 (9.2%) |
| $50,000 to $74,999 | 72 (15.3%) | 70 (29.3%) |
| $75,000 to $99,999 | 111 (23.6%) | 28 (11.7%) |
| $100,000 to $149,999 | 69 (14.7%) | 9 (3.8%) |
| $150,000 or more | 96 (20.4%) | 0 (0.0%) |
| Total | 470 (100.0%) | 239 (100.0%) |
Monthly Housing Cost Tiers in Livingston
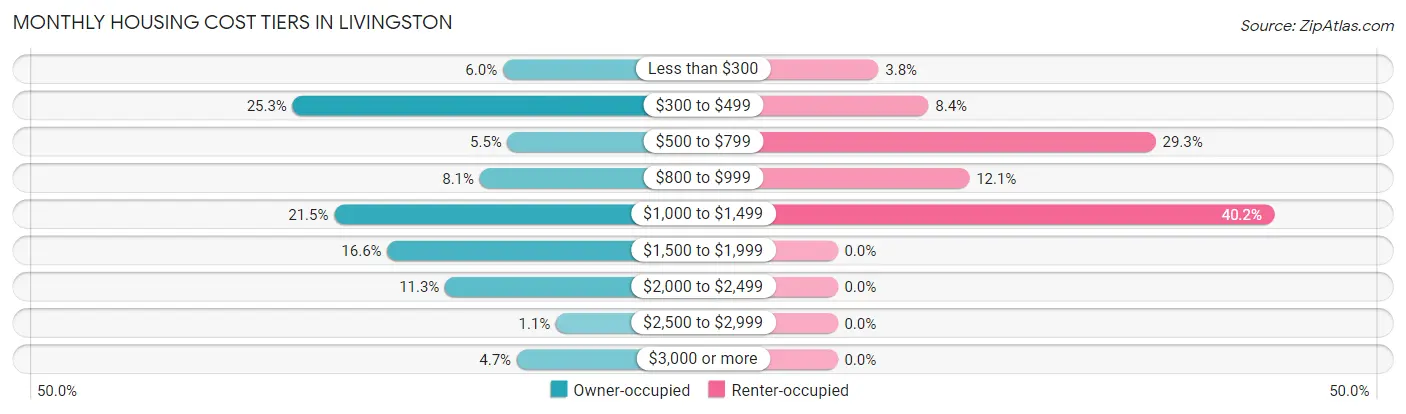
| Monthly Cost | Owner-occupied | Renter-occupied |
| Less than $300 | 28 (6.0%) | 9 (3.8%) |
| $300 to $499 | 119 (25.3%) | 20 (8.4%) |
| $500 to $799 | 26 (5.5%) | 70 (29.3%) |
| $800 to $999 | 38 (8.1%) | 29 (12.1%) |
| $1,000 to $1,499 | 101 (21.5%) | 96 (40.2%) |
| $1,500 to $1,999 | 78 (16.6%) | 0 (0.0%) |
| $2,000 to $2,499 | 53 (11.3%) | 0 (0.0%) |
| $2,500 to $2,999 | 5 (1.1%) | 0 (0.0%) |
| $3,000 or more | 22 (4.7%) | 0 (0.0%) |
| Total | 470 (100.0%) | 239 (100.0%) |
Physical Housing Characteristics in Livingston
Housing Structures in Livingston
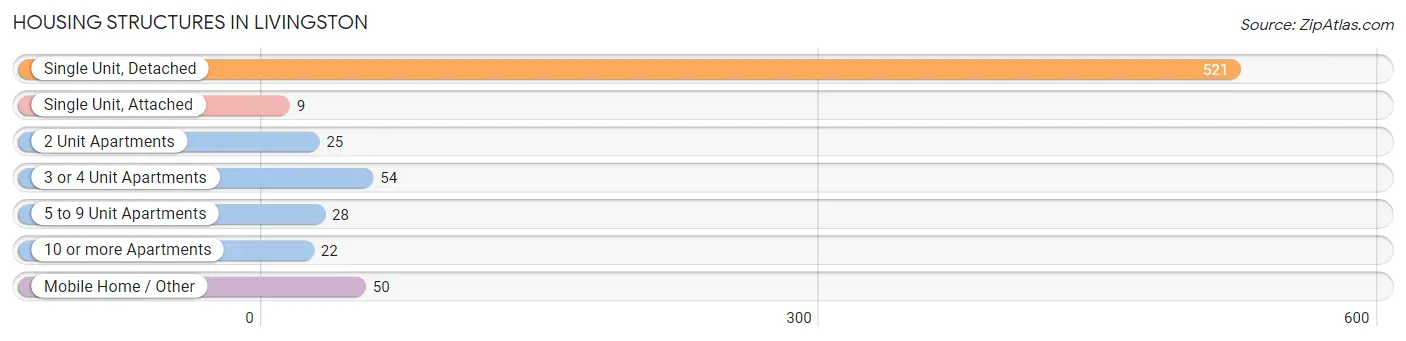
| Structure Type | # Housing Units | % Housing Units |
| Single Unit, Detached | 521 | 73.5% |
| Single Unit, Attached | 9 | 1.3% |
| 2 Unit Apartments | 25 | 3.5% |
| 3 or 4 Unit Apartments | 54 | 7.6% |
| 5 to 9 Unit Apartments | 28 | 4.0% |
| 10 or more Apartments | 22 | 3.1% |
| Mobile Home / Other | 50 | 7.0% |
| Total | 709 | 100.0% |
Housing Structures by Occupancy in Livingston
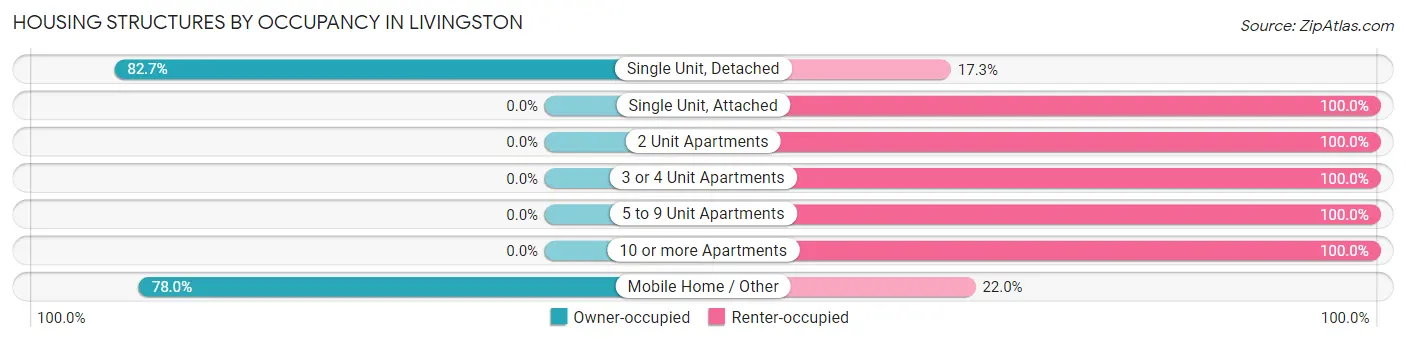
| Structure Type | Owner-occupied | Renter-occupied |
| Single Unit, Detached | 431 (82.7%) | 90 (17.3%) |
| Single Unit, Attached | 0 (0.0%) | 9 (100.0%) |
| 2 Unit Apartments | 0 (0.0%) | 25 (100.0%) |
| 3 or 4 Unit Apartments | 0 (0.0%) | 54 (100.0%) |
| 5 to 9 Unit Apartments | 0 (0.0%) | 28 (100.0%) |
| 10 or more Apartments | 0 (0.0%) | 22 (100.0%) |
| Mobile Home / Other | 39 (78.0%) | 11 (22.0%) |
| Total | 470 (66.3%) | 239 (33.7%) |
Housing Structures by Number of Rooms in Livingston
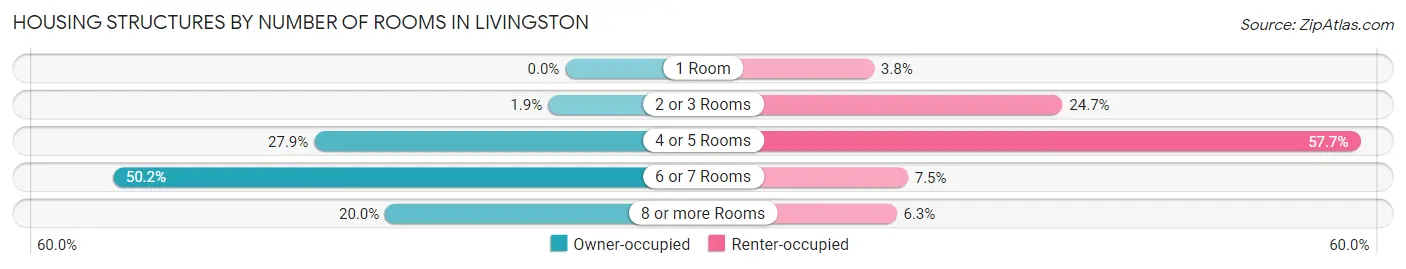
| Number of Rooms | Owner-occupied | Renter-occupied |
| 1 Room | 0 (0.0%) | 9 (3.8%) |
| 2 or 3 Rooms | 9 (1.9%) | 59 (24.7%) |
| 4 or 5 Rooms | 131 (27.9%) | 138 (57.7%) |
| 6 or 7 Rooms | 236 (50.2%) | 18 (7.5%) |
| 8 or more Rooms | 94 (20.0%) | 15 (6.3%) |
| Total | 470 (100.0%) | 239 (100.0%) |
Housing Structure by Heating Type in Livingston
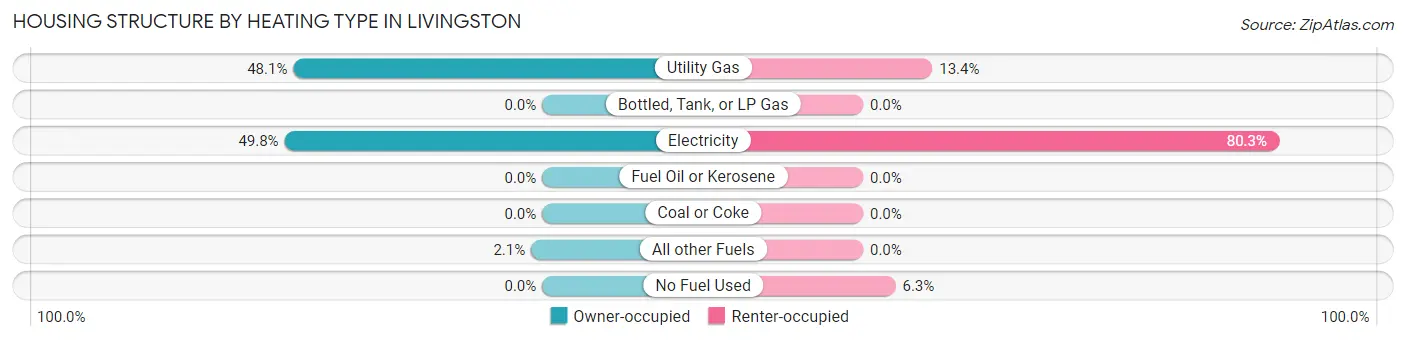
| Heating Type | Owner-occupied | Renter-occupied |
| Utility Gas | 226 (48.1%) | 32 (13.4%) |
| Bottled, Tank, or LP Gas | 0 (0.0%) | 0 (0.0%) |
| Electricity | 234 (49.8%) | 192 (80.3%) |
| Fuel Oil or Kerosene | 0 (0.0%) | 0 (0.0%) |
| Coal or Coke | 0 (0.0%) | 0 (0.0%) |
| All other Fuels | 10 (2.1%) | 0 (0.0%) |
| No Fuel Used | 0 (0.0%) | 15 (6.3%) |
| Total | 470 (100.0%) | 239 (100.0%) |
Household Vehicle Usage in Livingston
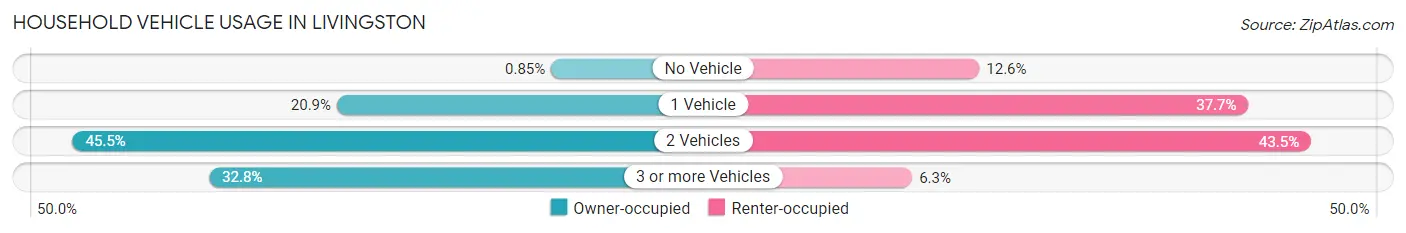
| Vehicles per Household | Owner-occupied | Renter-occupied |
| No Vehicle | 4 (0.9%) | 30 (12.6%) |
| 1 Vehicle | 98 (20.8%) | 90 (37.7%) |
| 2 Vehicles | 214 (45.5%) | 104 (43.5%) |
| 3 or more Vehicles | 154 (32.8%) | 15 (6.3%) |
| Total | 470 (100.0%) | 239 (100.0%) |
Real Estate & Mortgages in Livingston
Real Estate and Mortgage Overview in Livingston
| Characteristic | Without Mortgage | With Mortgage |
| Housing Units | 170 | 300 |
| Median Property Value | $212,500 | $209,200 |
| Median Household Income | $71,250 | $84 |
| Monthly Housing Costs | $399 | $22 |
| Real Estate Taxes | - | - |
Property Value by Mortgage Status in Livingston
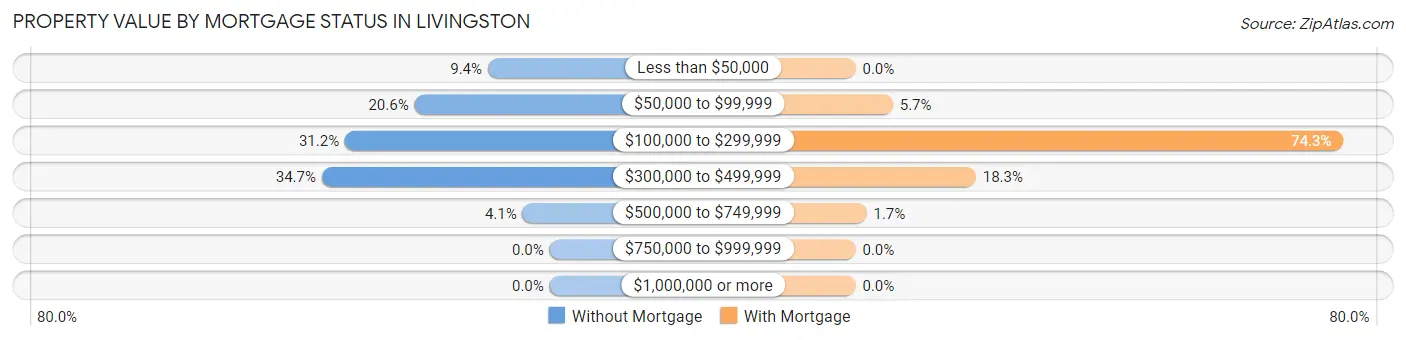
| Property Value | Without Mortgage | With Mortgage |
| Less than $50,000 | 16 (9.4%) | 0 (0.0%) |
| $50,000 to $99,999 | 35 (20.6%) | 17 (5.7%) |
| $100,000 to $299,999 | 53 (31.2%) | 223 (74.3%) |
| $300,000 to $499,999 | 59 (34.7%) | 55 (18.3%) |
| $500,000 to $749,999 | 7 (4.1%) | 5 (1.7%) |
| $750,000 to $999,999 | 0 (0.0%) | 0 (0.0%) |
| $1,000,000 or more | 0 (0.0%) | 0 (0.0%) |
| Total | 170 (100.0%) | 300 (100.0%) |
Household Income by Mortgage Status in Livingston
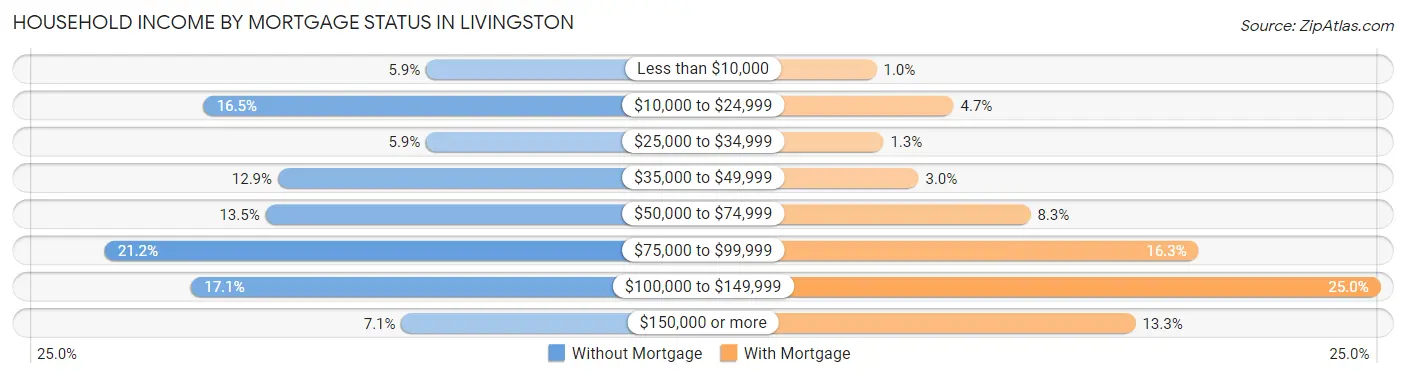
| Household Income | Without Mortgage | With Mortgage |
| Less than $10,000 | 10 (5.9%) | 3 (1.0%) |
| $10,000 to $24,999 | 28 (16.5%) | 14 (4.7%) |
| $25,000 to $34,999 | 10 (5.9%) | 4 (1.3%) |
| $35,000 to $49,999 | 22 (12.9%) | 9 (3.0%) |
| $50,000 to $74,999 | 23 (13.5%) | 25 (8.3%) |
| $75,000 to $99,999 | 36 (21.2%) | 49 (16.3%) |
| $100,000 to $149,999 | 29 (17.1%) | 75 (25.0%) |
| $150,000 or more | 12 (7.1%) | 40 (13.3%) |
| Total | 170 (100.0%) | 300 (100.0%) |
Property Value to Household Income Ratio in Livingston
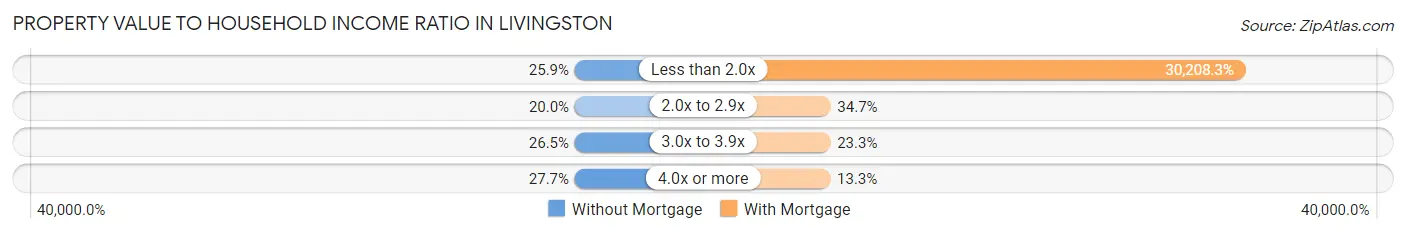
| Value-to-Income Ratio | Without Mortgage | With Mortgage |
| Less than 2.0x | 44 (25.9%) | 90,625 (30,208.3%) |
| 2.0x to 2.9x | 34 (20.0%) | 104 (34.7%) |
| 3.0x to 3.9x | 45 (26.5%) | 70 (23.3%) |
| 4.0x or more | 47 (27.7%) | 40 (13.3%) |
| Total | 170 (100.0%) | 300 (100.0%) |
Real Estate Taxes by Mortgage Status in Livingston
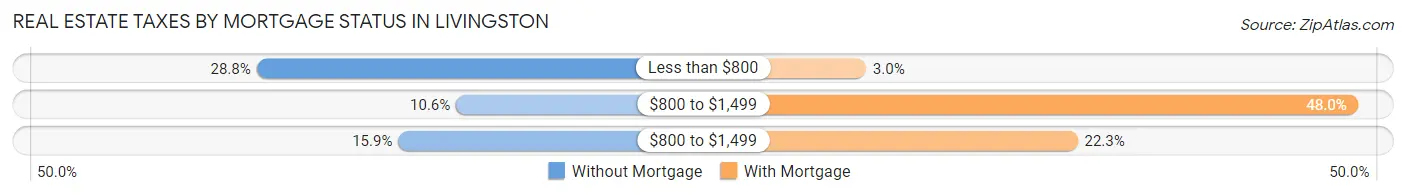
| Property Taxes | Without Mortgage | With Mortgage |
| Less than $800 | 49 (28.8%) | 9 (3.0%) |
| $800 to $1,499 | 18 (10.6%) | 144 (48.0%) |
| $800 to $1,499 | 27 (15.9%) | 67 (22.3%) |
| Total | 170 (100.0%) | 300 (100.0%) |
Health & Disability in Livingston
Health Insurance Coverage by Age in Livingston
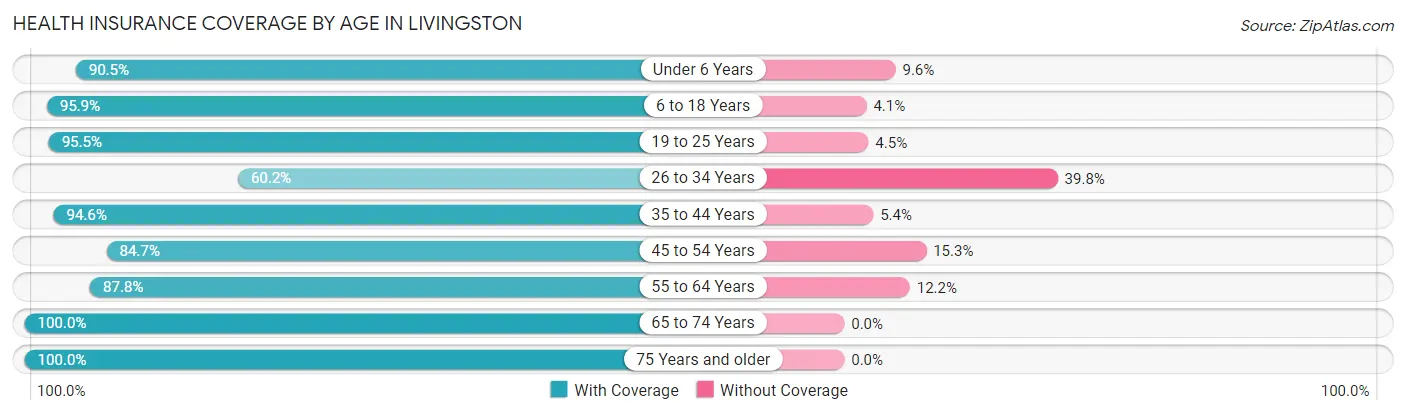
| Age Bracket | With Coverage | Without Coverage |
| Under 6 Years | 142 (90.4%) | 15 (9.6%) |
| 6 to 18 Years | 394 (95.9%) | 17 (4.1%) |
| 19 to 25 Years | 191 (95.5%) | 9 (4.5%) |
| 26 to 34 Years | 115 (60.2%) | 76 (39.8%) |
| 35 to 44 Years | 298 (94.6%) | 17 (5.4%) |
| 45 to 54 Years | 183 (84.7%) | 33 (15.3%) |
| 55 to 64 Years | 237 (87.8%) | 33 (12.2%) |
| 65 to 74 Years | 132 (100.0%) | 0 (0.0%) |
| 75 Years and older | 116 (100.0%) | 0 (0.0%) |
| Total | 1,808 (90.0%) | 200 (10.0%) |
Health Insurance Coverage by Citizenship Status in Livingston
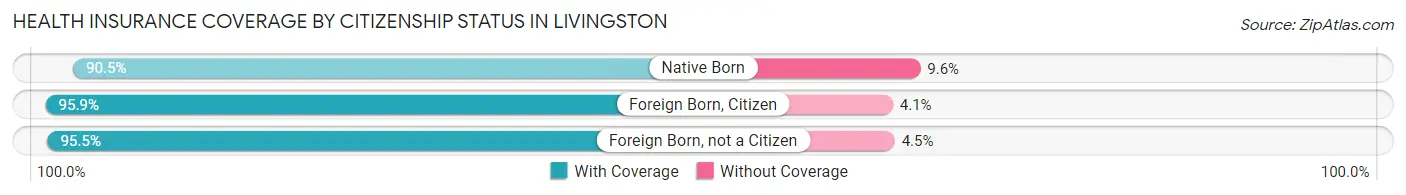
| Citizenship Status | With Coverage | Without Coverage |
| Native Born | 142 (90.4%) | 15 (9.6%) |
| Foreign Born, Citizen | 394 (95.9%) | 17 (4.1%) |
| Foreign Born, not a Citizen | 191 (95.5%) | 9 (4.5%) |
Health Insurance Coverage by Household Income in Livingston
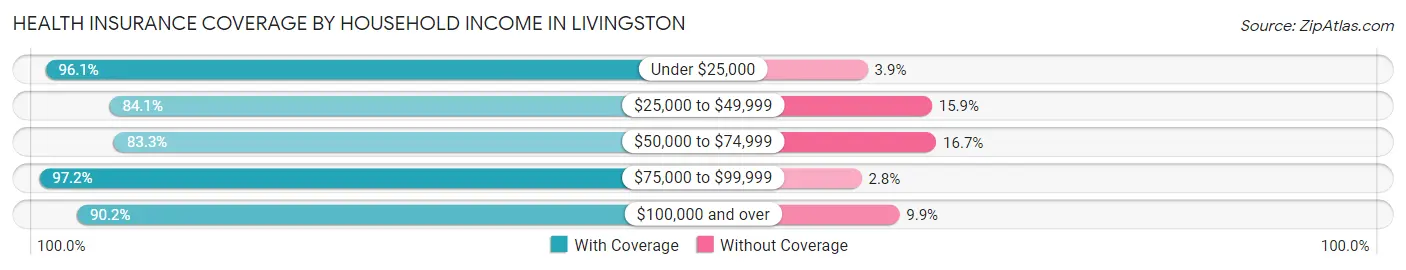
| Household Income | With Coverage | Without Coverage |
| Under $25,000 | 246 (96.1%) | 10 (3.9%) |
| $25,000 to $49,999 | 206 (84.1%) | 39 (15.9%) |
| $50,000 to $74,999 | 403 (83.3%) | 81 (16.7%) |
| $75,000 to $99,999 | 422 (97.2%) | 12 (2.8%) |
| $100,000 and over | 531 (90.1%) | 58 (9.9%) |
Public vs Private Health Insurance Coverage by Age in Livingston
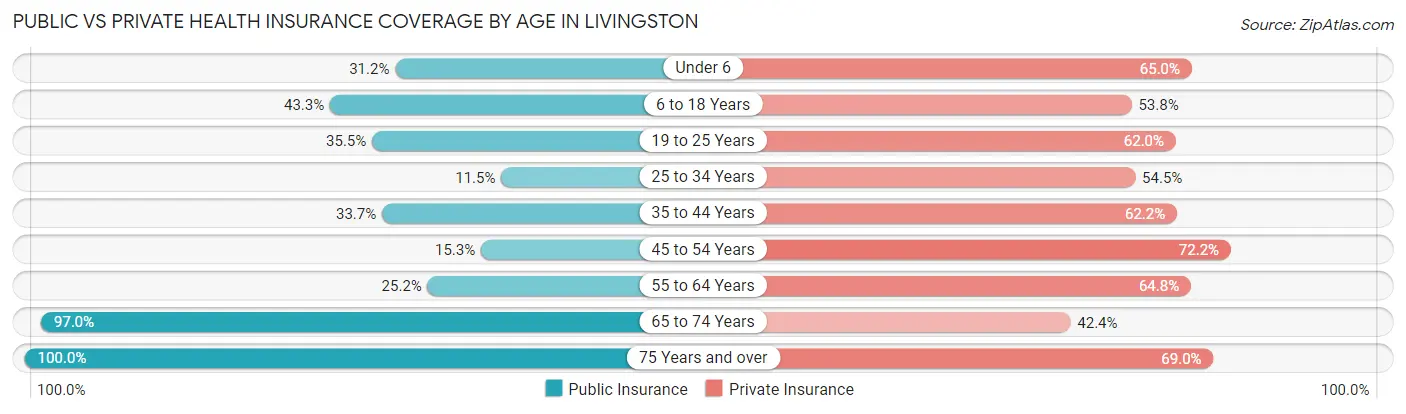
| Age Bracket | Public Insurance | Private Insurance |
| Under 6 | 49 (31.2%) | 102 (65.0%) |
| 6 to 18 Years | 178 (43.3%) | 221 (53.8%) |
| 19 to 25 Years | 71 (35.5%) | 124 (62.0%) |
| 25 to 34 Years | 22 (11.5%) | 104 (54.4%) |
| 35 to 44 Years | 106 (33.7%) | 196 (62.2%) |
| 45 to 54 Years | 33 (15.3%) | 156 (72.2%) |
| 55 to 64 Years | 68 (25.2%) | 175 (64.8%) |
| 65 to 74 Years | 128 (97.0%) | 56 (42.4%) |
| 75 Years and over | 116 (100.0%) | 80 (69.0%) |
| Total | 771 (38.4%) | 1,214 (60.5%) |
Disability Status by Sex by Age in Livingston
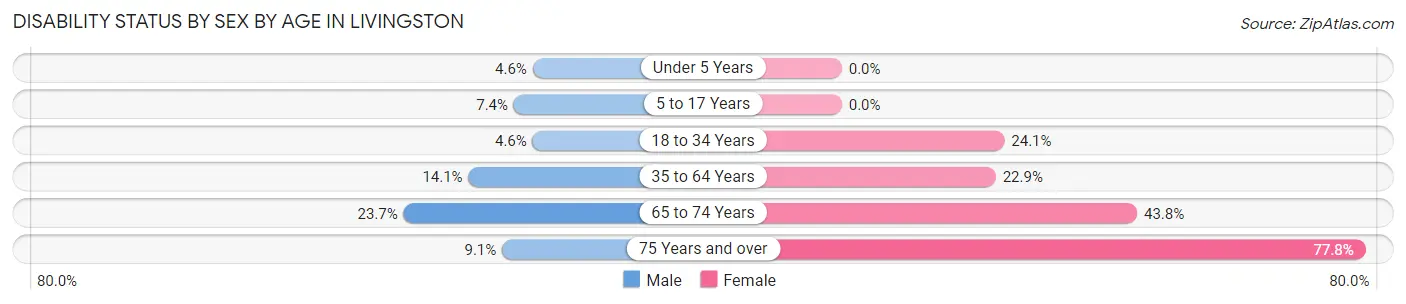
| Age Bracket | Male | Female |
| Under 5 Years | 4 (4.5%) | 0 (0.0%) |
| 5 to 17 Years | 15 (7.3%) | 0 (0.0%) |
| 18 to 34 Years | 11 (4.6%) | 42 (24.1%) |
| 35 to 64 Years | 42 (14.1%) | 115 (22.9%) |
| 65 to 74 Years | 14 (23.7%) | 32 (43.8%) |
| 75 Years and over | 4 (9.1%) | 56 (77.8%) |
Disability Class by Sex by Age in Livingston
Disability Class: Hearing Difficulty
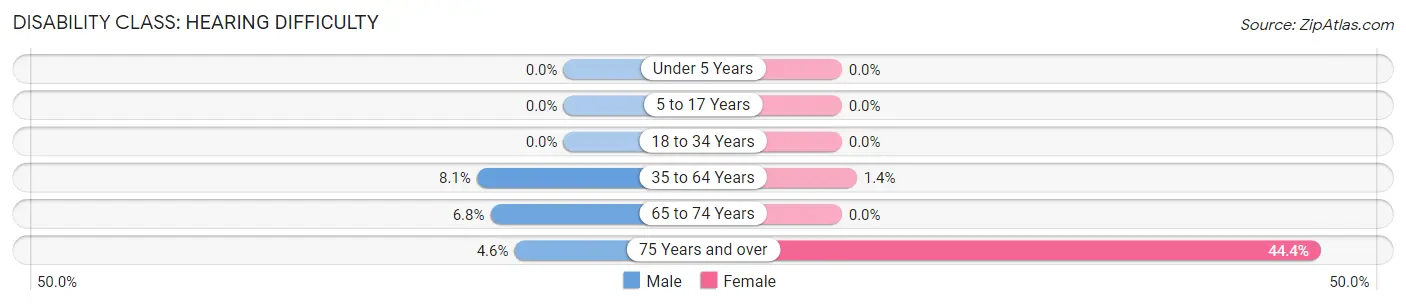
| Age Bracket | Male | Female |
| Under 5 Years | 0 (0.0%) | 0 (0.0%) |
| 5 to 17 Years | 0 (0.0%) | 0 (0.0%) |
| 18 to 34 Years | 0 (0.0%) | 0 (0.0%) |
| 35 to 64 Years | 24 (8.1%) | 7 (1.4%) |
| 65 to 74 Years | 4 (6.8%) | 0 (0.0%) |
| 75 Years and over | 2 (4.5%) | 32 (44.4%) |
Disability Class: Vision Difficulty
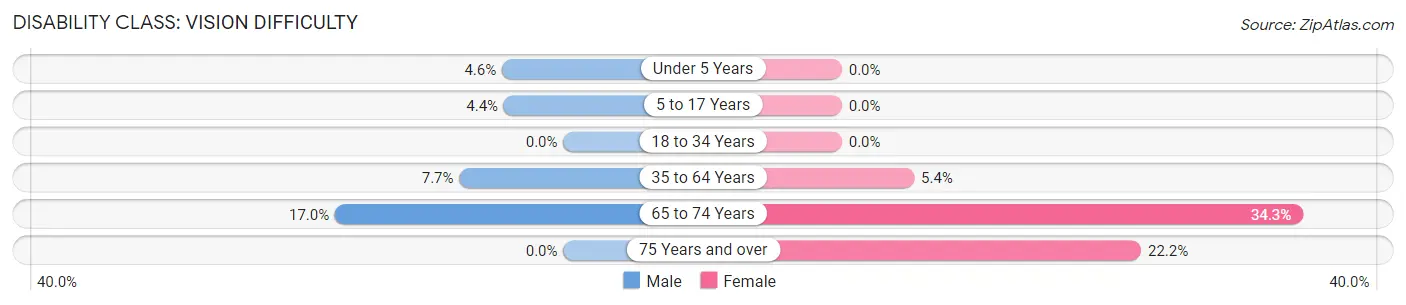
| Age Bracket | Male | Female |
| Under 5 Years | 4 (4.5%) | 0 (0.0%) |
| 5 to 17 Years | 9 (4.4%) | 0 (0.0%) |
| 18 to 34 Years | 0 (0.0%) | 0 (0.0%) |
| 35 to 64 Years | 23 (7.7%) | 27 (5.4%) |
| 65 to 74 Years | 10 (17.0%) | 25 (34.3%) |
| 75 Years and over | 0 (0.0%) | 16 (22.2%) |
Disability Class: Cognitive Difficulty
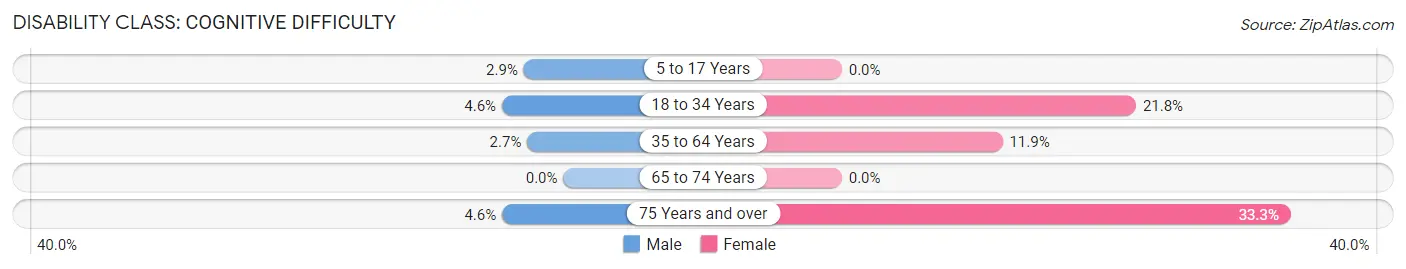
| Age Bracket | Male | Female |
| 5 to 17 Years | 6 (2.9%) | 0 (0.0%) |
| 18 to 34 Years | 11 (4.6%) | 38 (21.8%) |
| 35 to 64 Years | 8 (2.7%) | 60 (11.9%) |
| 65 to 74 Years | 0 (0.0%) | 0 (0.0%) |
| 75 Years and over | 2 (4.5%) | 24 (33.3%) |
Disability Class: Ambulatory Difficulty
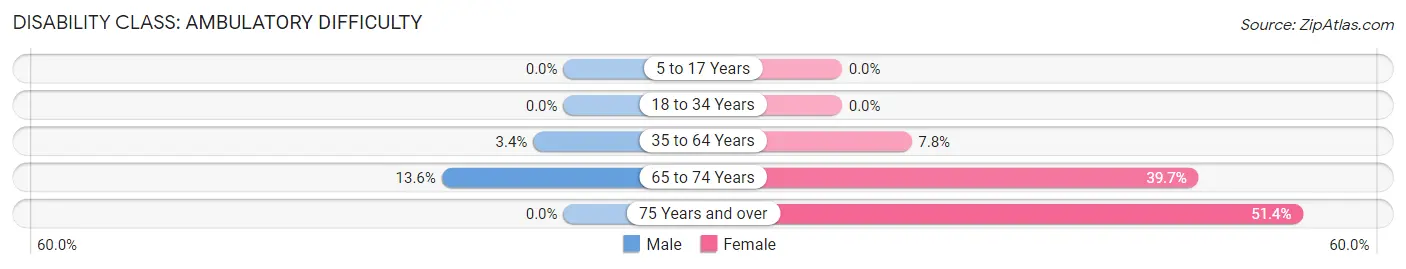
| Age Bracket | Male | Female |
| 5 to 17 Years | 0 (0.0%) | 0 (0.0%) |
| 18 to 34 Years | 0 (0.0%) | 0 (0.0%) |
| 35 to 64 Years | 10 (3.4%) | 39 (7.7%) |
| 65 to 74 Years | 8 (13.6%) | 29 (39.7%) |
| 75 Years and over | 0 (0.0%) | 37 (51.4%) |
Disability Class: Self-Care Difficulty
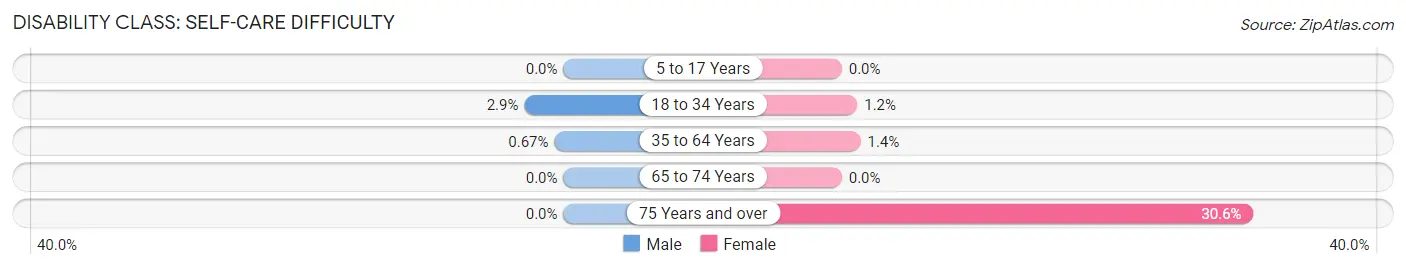
| Age Bracket | Male | Female |
| 5 to 17 Years | 0 (0.0%) | 0 (0.0%) |
| 18 to 34 Years | 7 (2.9%) | 2 (1.1%) |
| 35 to 64 Years | 2 (0.7%) | 7 (1.4%) |
| 65 to 74 Years | 0 (0.0%) | 0 (0.0%) |
| 75 Years and over | 0 (0.0%) | 22 (30.6%) |
Technology Access in Livingston
Computing Device Access in Livingston
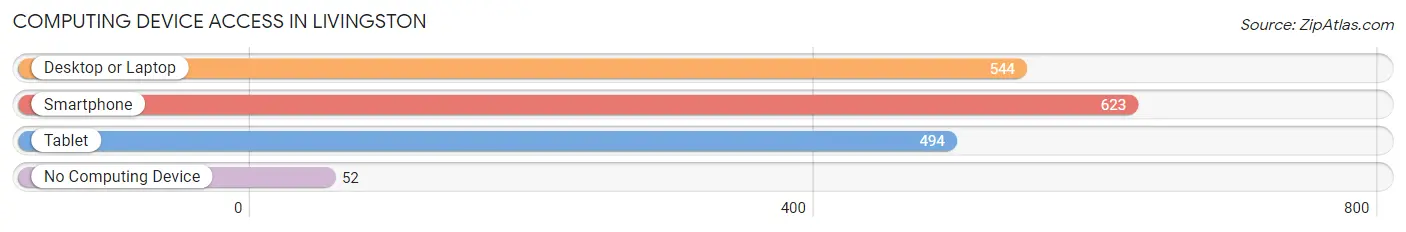
| Device Type | # Households | % Households |
| Desktop or Laptop | 544 | 76.7% |
| Smartphone | 623 | 87.9% |
| Tablet | 494 | 69.7% |
| No Computing Device | 52 | 7.3% |
| Total | 709 | 100.0% |
Internet Access in Livingston
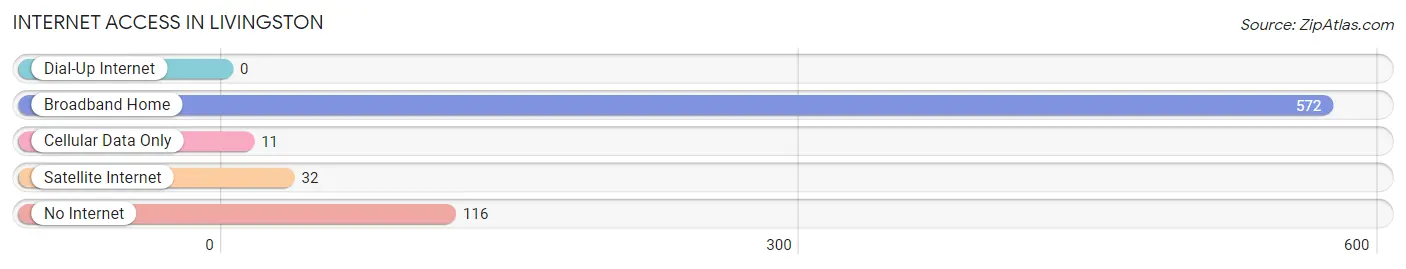
| Internet Type | # Households | % Households |
| Dial-Up Internet | 0 | 0.0% |
| Broadband Home | 572 | 80.7% |
| Cellular Data Only | 11 | 1.5% |
| Satellite Internet | 32 | 4.5% |
| No Internet | 116 | 16.4% |
| Total | 709 | 100.0% |
Livingston Summary
Livingston, Louisiana is a small town located in the southeastern part of the state, about 40 miles from Baton Rouge. It is part of the Livingston Parish, which is home to over 130,000 people. The town itself has a population of just over 1,000 people.
History
Livingston was founded in 1810 by a group of settlers from the Natchez area. The town was named after Edward Livingston, a prominent lawyer and politician from New York. The town was originally a trading post and was known as Livingston’s Landing. In 1821, the town was incorporated and the name was changed to Livingston.
In the early 1900s, the town began to grow and develop. The first bank was established in 1906 and the first school was built in 1910. The town also had a cotton gin, a sawmill, and a gristmill.
In the 1950s, the town began to experience a population boom. This was due to the growth of the oil and gas industry in the area. The town also experienced a surge in tourism due to its proximity to the Gulf of Mexico.
Geography
Livingston is located in the southeastern part of Louisiana, about 40 miles from Baton Rouge. It is part of the Livingston Parish, which is home to over 130,000 people. The town itself has a population of just over 1,000 people.
The town is situated on the banks of the Amite River. The terrain is mostly flat and the climate is humid subtropical. The average temperature in the summer is around 90 degrees Fahrenheit and the average temperature in the winter is around 50 degrees Fahrenheit.
Economy
The economy of Livingston is largely based on the oil and gas industry. The town is home to several oil and gas companies, including Chevron, Shell, and ExxonMobil. The town also has a number of small businesses, including restaurants, retail stores, and service providers.
The town is also home to a number of manufacturing companies, including a paper mill and a furniture factory. The town also has a number of agricultural businesses, including a dairy farm and a poultry farm.
Demographics
As of the 2010 census, the population of Livingston was 1,037. The racial makeup of the town was 79.3% White, 17.2% African American, 0.7% Native American, 0.3% Asian, 0.1% Pacific Islander, and 2.4% from other races. The median household income was $37,917 and the median family income was $45,625.
Livingston is a small town with a rich history and a vibrant economy. The town is home to a diverse population and is a great place to live and work.
Common Questions
What is Per Capita Income in Livingston?
Per Capita income in Livingston is $29,969.
What is the Median Family Income in Livingston?
Median Family Income in Livingston is $83,952.
What is the Median Household income in Livingston?
Median Household Income in Livingston is $70,156.
What is Income or Wage Gap in Livingston?
Income or Wage Gap in Livingston is 38.0%.
Women in Livingston earn 62.0 cents for every dollar earned by a man.
What is Inequality or Gini Index in Livingston?
Inequality or Gini Index in Livingston is 0.45.
What is the Total Population of Livingston?
Total Population of Livingston is 2,008.
What is the Total Male Population of Livingston?
Total Male Population of Livingston is 934.
What is the Total Female Population of Livingston?
Total Female Population of Livingston is 1,074.
What is the Ratio of Males per 100 Females in Livingston?
There are 86.96 Males per 100 Females in Livingston.
What is the Ratio of Females per 100 Males in Livingston?
There are 114.99 Females per 100 Males in Livingston.
What is the Median Population Age in Livingston?
Median Population Age in Livingston is 36.3 Years.
What is the Average Family Size in Livingston
Average Family Size in Livingston is 3.4 People.
What is the Average Household Size in Livingston
Average Household Size in Livingston is 2.8 People.
How Large is the Labor Force in Livingston?
There are 960 People in the Labor Forcein in Livingston.
What is the Percentage of People in the Labor Force in Livingston?
61.6% of People are in the Labor Force in Livingston.
What is the Unemployment Rate in Livingston?
Unemployment Rate in Livingston is 4.1%.