Grand Isle, LA Map & Demographics
Grand Isle Map
Grand Isle Overview
$31,595
PER CAPITA INCOME
$100,833
AVG FAMILY INCOME
0.46
INEQUALITY / GINI INDEX
903
TOTAL POPULATION
492
MALE POPULATION
411
FEMALE POPULATION
119.71
MALES / 100 FEMALES
83.54
FEMALES / 100 MALES
51.0
MEDIAN AGE
2.4
AVG FAMILY SIZE
2.1
AVG HOUSEHOLD SIZE
419
LABOR FORCE [ PEOPLE ]
55.6%
PERCENT IN LABOR FORCE
6.3%
UNEMPLOYMENT RATE
Grand Isle Zip Codes
Grand Isle Area Codes
Income in Grand Isle
Income Overview in Grand Isle
| Characteristic | Number | Measure |
| Per Capita Income | 903 | $31,595 |
| Median Family Income | 284 | $100,833 |
| Mean Family Income | 284 | $86,925 |
| Median Household Income | 420 | $0 |
| Mean Household Income | 420 | $69,398 |
| Income Deficit | 284 | $0 |
| Wage / Income Gap (%) | 903 | 0.00% |
| Wage / Income Gap ($) | 903 | 100.00¢ per $1 |
| Gini / Inequality Index | 903 | 0.46 |
Earnings by Sex in Grand Isle
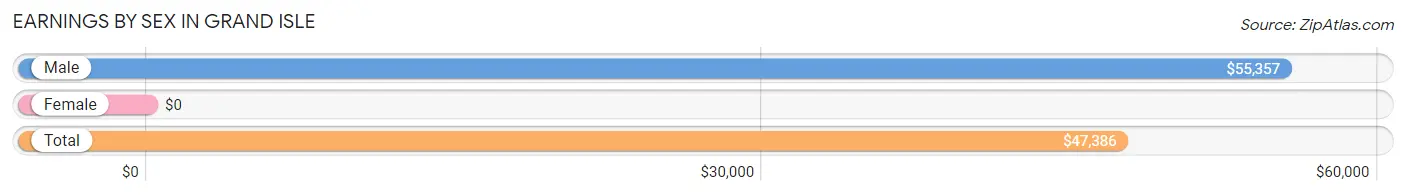
| Sex | Number | Average Earnings |
| Male | 234 (52.5%) | $55,357 |
| Female | 212 (47.5%) | $0 |
| Total | 446 (100.0%) | $47,386 |
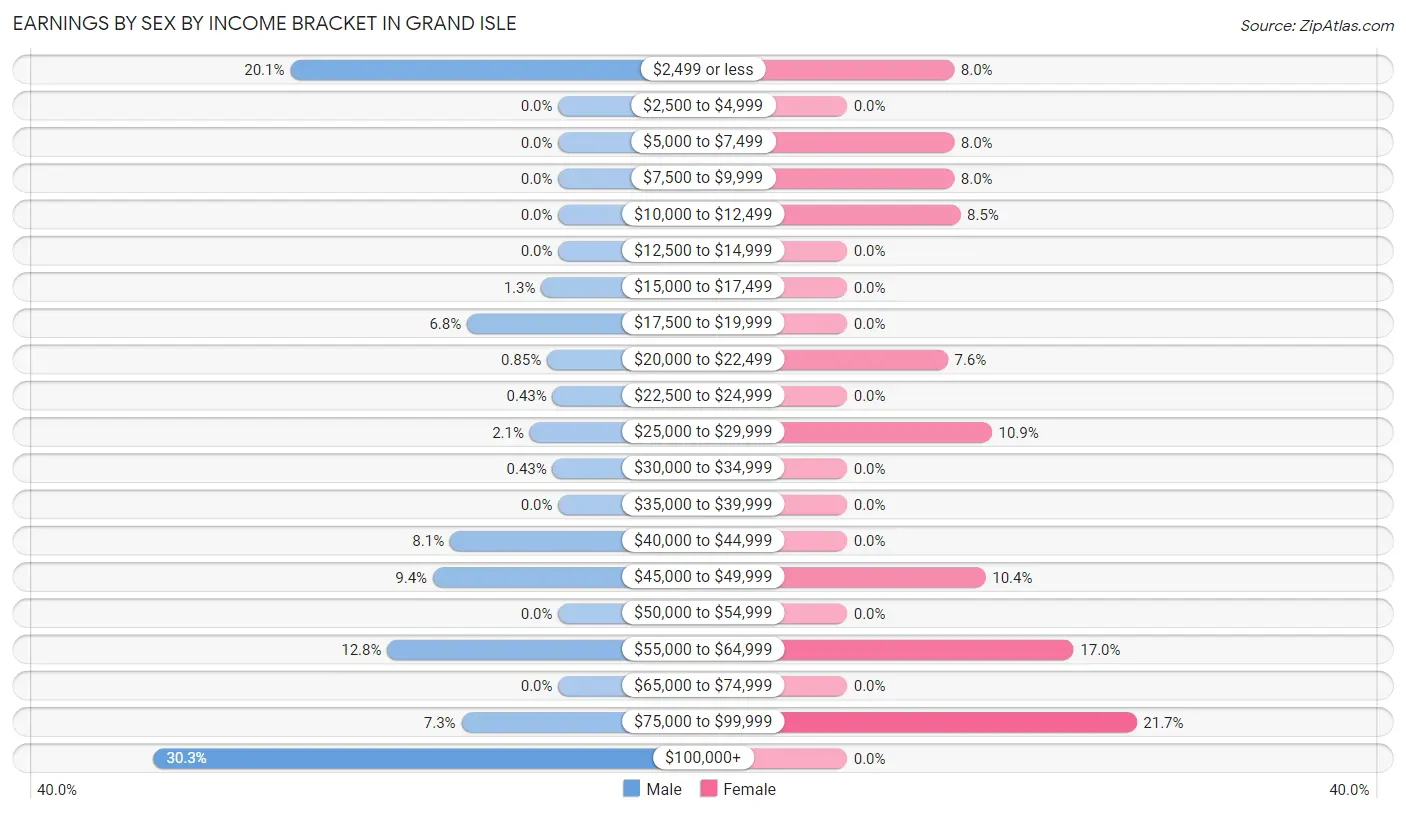
Earnings by Sex by Income Bracket in Grand Isle
The most common earnings brackets in Grand Isle are $100,000+ for men (71 | 30.3%) and $75,000 to $99,999 for women (46 | 21.7%).
| Income | Male | Female |
| $2,499 or less | 47 (20.1%) | 17 (8.0%) |
| $2,500 to $4,999 | 0 (0.0%) | 0 (0.0%) |
| $5,000 to $7,499 | 0 (0.0%) | 17 (8.0%) |
| $7,500 to $9,999 | 0 (0.0%) | 17 (8.0%) |
| $10,000 to $12,499 | 0 (0.0%) | 18 (8.5%) |
| $12,500 to $14,999 | 0 (0.0%) | 0 (0.0%) |
| $15,000 to $17,499 | 3 (1.3%) | 0 (0.0%) |
| $17,500 to $19,999 | 16 (6.8%) | 0 (0.0%) |
| $20,000 to $22,499 | 2 (0.9%) | 16 (7.5%) |
| $22,500 to $24,999 | 1 (0.4%) | 0 (0.0%) |
| $25,000 to $29,999 | 5 (2.1%) | 23 (10.8%) |
| $30,000 to $34,999 | 1 (0.4%) | 0 (0.0%) |
| $35,000 to $39,999 | 0 (0.0%) | 0 (0.0%) |
| $40,000 to $44,999 | 19 (8.1%) | 0 (0.0%) |
| $45,000 to $49,999 | 22 (9.4%) | 22 (10.4%) |
| $50,000 to $54,999 | 0 (0.0%) | 0 (0.0%) |
| $55,000 to $64,999 | 30 (12.8%) | 36 (17.0%) |
| $65,000 to $74,999 | 0 (0.0%) | 0 (0.0%) |
| $75,000 to $99,999 | 17 (7.3%) | 46 (21.7%) |
| $100,000+ | 71 (30.3%) | 0 (0.0%) |
| Total | 234 (100.0%) | 212 (100.0%) |
Earnings by Sex by Educational Attainment in Grand Isle
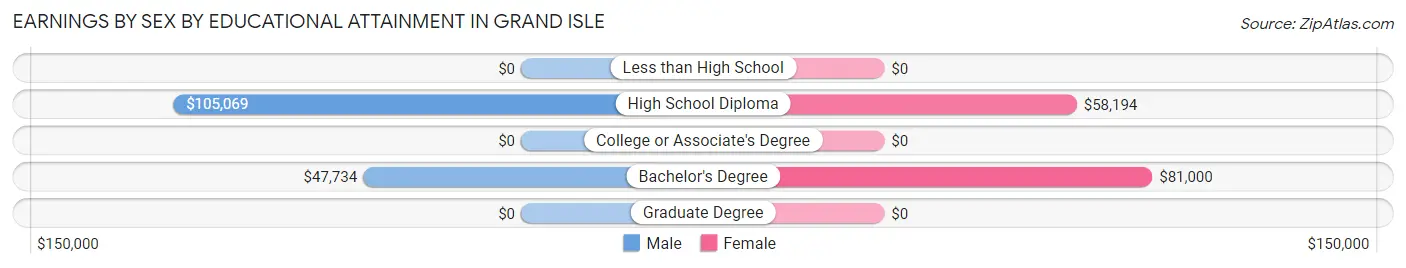
| Educational Attainment | Male Income | Female Income |
| Less than High School | - | - |
| High School Diploma | $105,069 | $58,194 |
| College or Associate's Degree | - | - |
| Bachelor's Degree | $47,734 | $81,000 |
| Graduate Degree | - | - |
| Total | $58,824 | $0 |
Family Income in Grand Isle
Family Income Brackets in Grand Isle
According to the Grand Isle family income data, there are 121 families falling into the $100,000 to $149,999 income range, which is the most common income bracket and makes up 42.6% of all families.
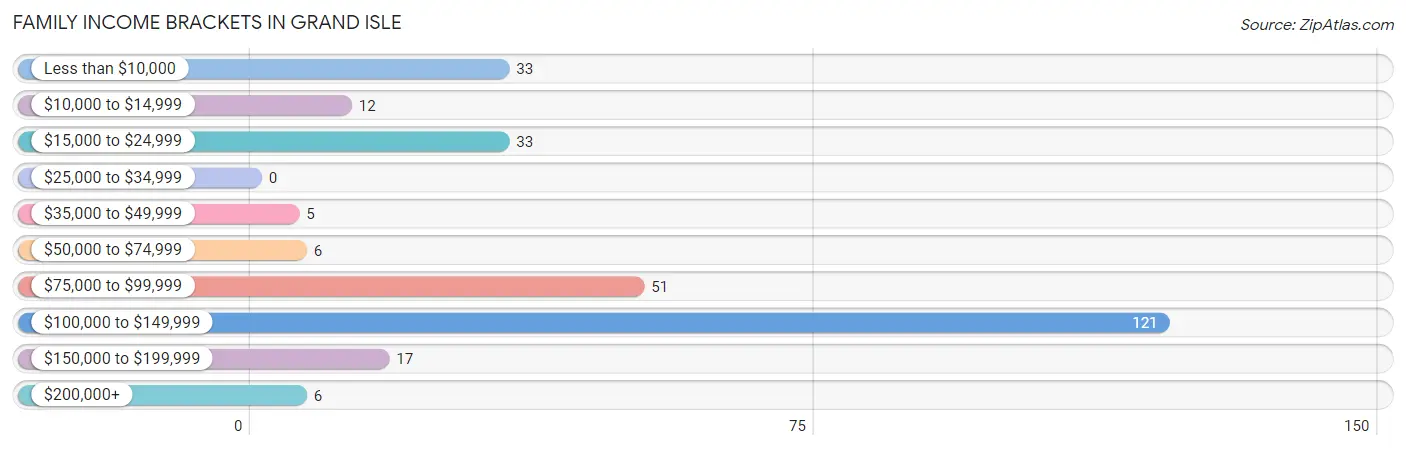
| Income Bracket | # Families | % Families |
| Less than $10,000 | 33 | 11.6% |
| $10,000 to $14,999 | 12 | 4.2% |
| $15,000 to $24,999 | 33 | 11.6% |
| $25,000 to $34,999 | 0 | 0.0% |
| $35,000 to $49,999 | 5 | 1.8% |
| $50,000 to $74,999 | 6 | 2.1% |
| $75,000 to $99,999 | 51 | 18.0% |
| $100,000 to $149,999 | 121 | 42.6% |
| $150,000 to $199,999 | 17 | 6.0% |
| $200,000+ | 6 | 2.1% |
Family Income by Famaliy Size in Grand Isle
3-person families (46 | 16.2%) account for the highest median family income in Grand Isle with $112,500 per family, while 2-person families (214 | 75.3%) have the highest median income of $48,398 per family member.
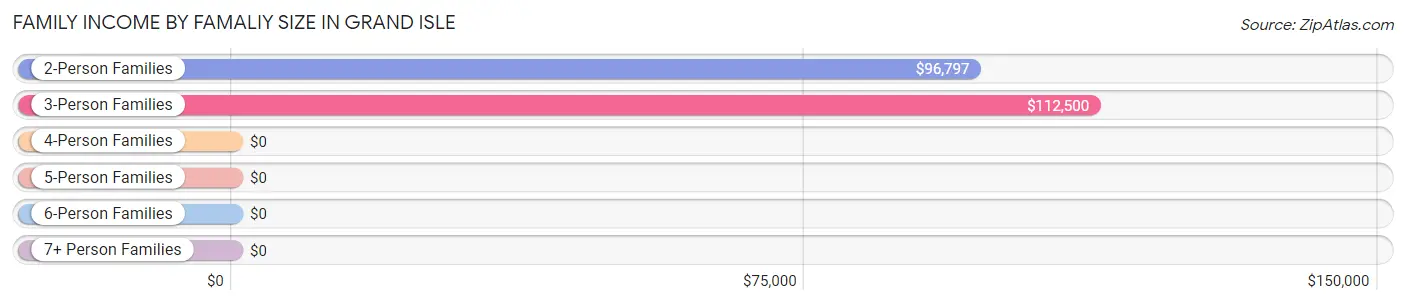
| Income Bracket | # Families | Median Income |
| 2-Person Families | 214 (75.3%) | $96,797 |
| 3-Person Families | 46 (16.2%) | $112,500 |
| 4-Person Families | 6 (2.1%) | $0 |
| 5-Person Families | 0 (0.0%) | $0 |
| 6-Person Families | 0 (0.0%) | $0 |
| 7+ Person Families | 18 (6.3%) | $0 |
| Total | 284 (100.0%) | $100,833 |
Family Income by Number of Earners in Grand Isle
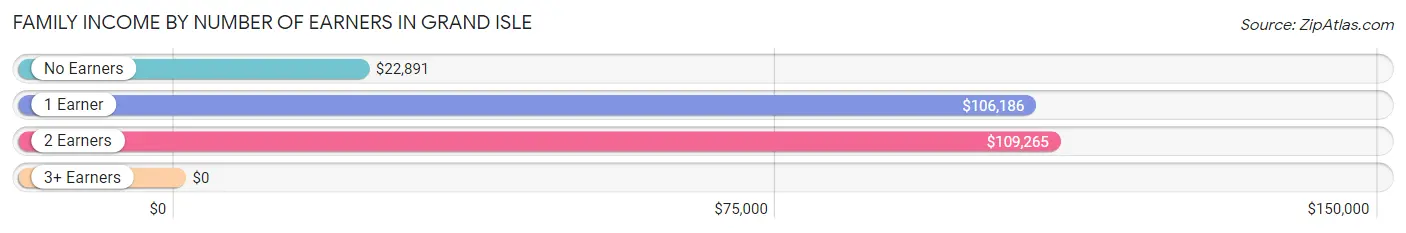
| Number of Earners | # Families | Median Income |
| No Earners | 69 (24.3%) | $22,891 |
| 1 Earner | 87 (30.6%) | $106,186 |
| 2 Earners | 128 (45.1%) | $109,265 |
| 3+ Earners | 0 (0.0%) | $0 |
| Total | 284 (100.0%) | $100,833 |
Household Income in Grand Isle
Household Income Brackets in Grand Isle
With 118 households falling in the category, the $100,000 to $149,999 income range is the most frequent in Grand Isle, accounting for 28.1% of all households. In contrast, only 5 households (1.2%) fall into the $25,000 to $34,999 income bracket, making it the least populous group.
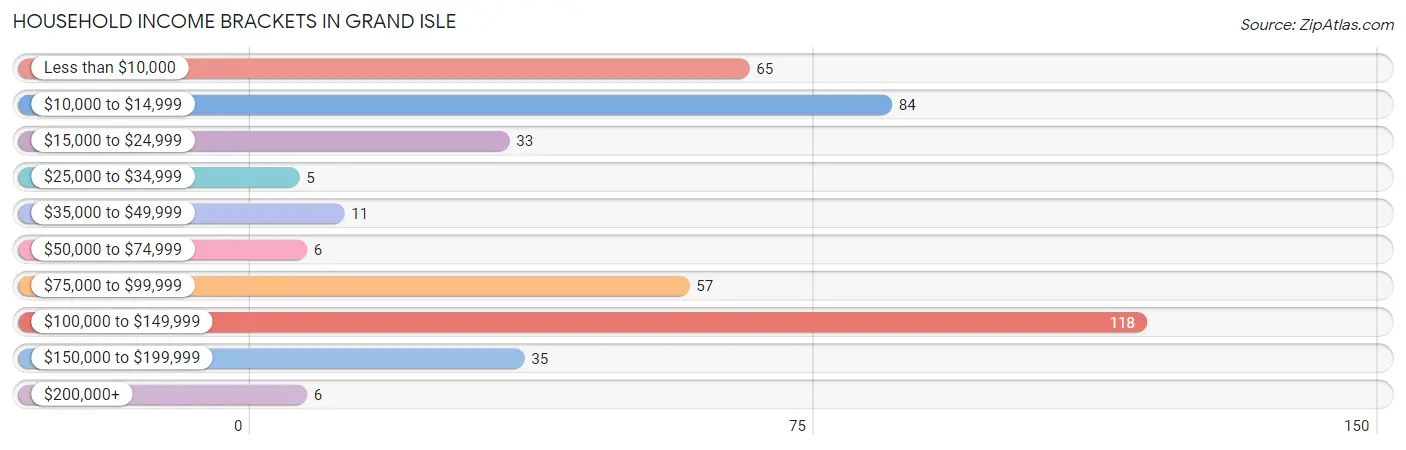
| Income Bracket | # Households | % Households |
| Less than $10,000 | 65 | 15.5% |
| $10,000 to $14,999 | 84 | 20.0% |
| $15,000 to $24,999 | 33 | 7.9% |
| $25,000 to $34,999 | 5 | 1.2% |
| $35,000 to $49,999 | 11 | 2.6% |
| $50,000 to $74,999 | 6 | 1.4% |
| $75,000 to $99,999 | 57 | 13.6% |
| $100,000 to $149,999 | 118 | 28.1% |
| $150,000 to $199,999 | 35 | 8.3% |
| $200,000+ | 6 | 1.4% |
Household Income by Householder Age in Grand Isle
The median household income in Grand Isle is $0, with the highest median household income of $127,632 found in the 25 to 44 years age bracket for the primary householder. A total of 48 households (11.4%) fall into this category.
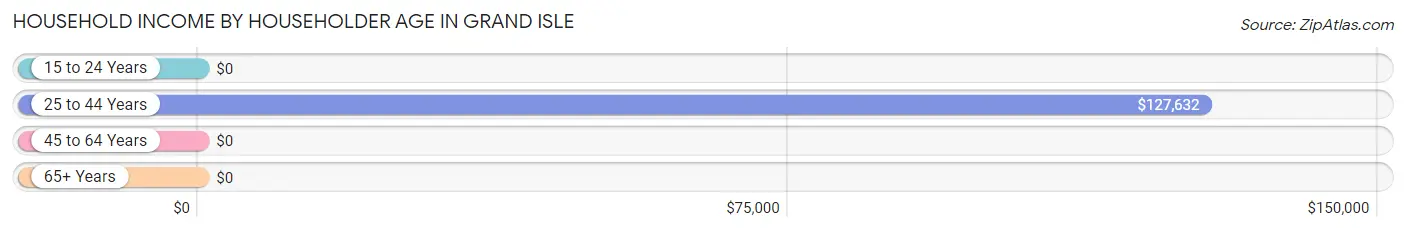
| Income Bracket | # Households | Median Income |
| 15 to 24 Years | 0 (0.0%) | $0 |
| 25 to 44 Years | 48 (11.4%) | $127,632 |
| 45 to 64 Years | 260 (61.9%) | $0 |
| 65+ Years | 112 (26.7%) | $0 |
| Total | 420 (100.0%) | $0 |
Poverty in Grand Isle
Income Below Poverty by Sex and Age in Grand Isle
With 34.2% poverty level for males and 31.0% for females among the residents of Grand Isle, under 5 year old males and under 5 year old females are the most vulnerable to poverty, with 16 males (100.0%) and 30 females (93.8%) in their respective age groups living below the poverty level.
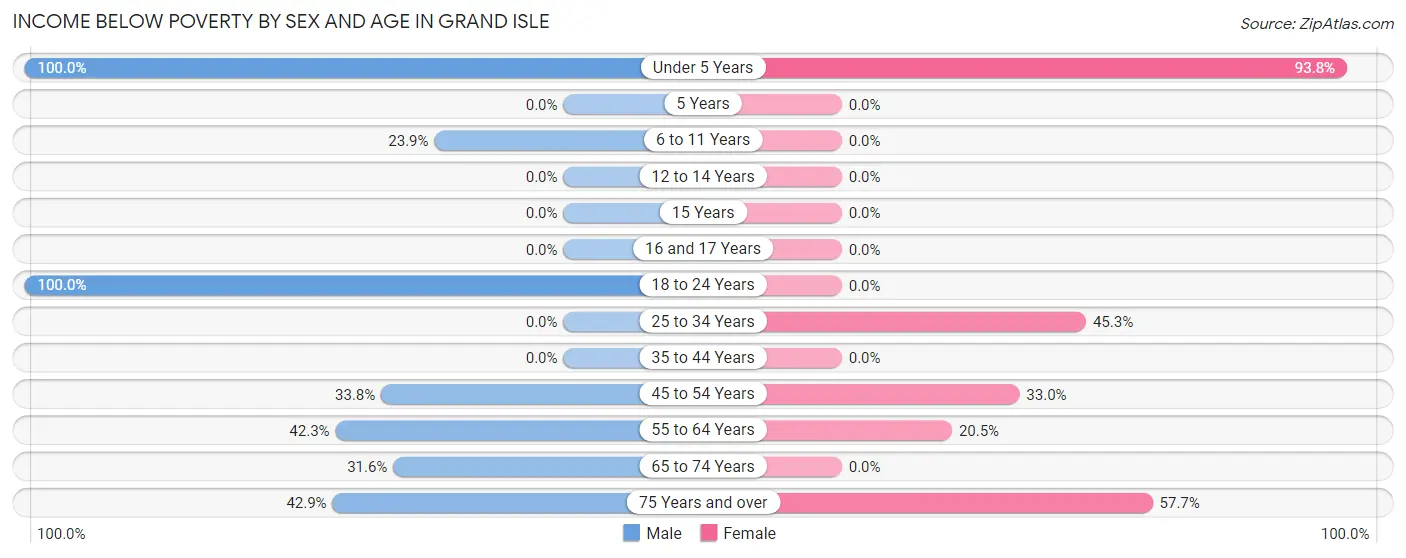
| Age Bracket | Male | Female |
| Under 5 Years | 16 (100.0%) | 30 (93.8%) |
| 5 Years | 0 (0.0%) | 0 (0.0%) |
| 6 to 11 Years | 17 (23.9%) | 0 (0.0%) |
| 12 to 14 Years | 0 (0.0%) | 0 (0.0%) |
| 15 Years | 0 (0.0%) | 0 (0.0%) |
| 16 and 17 Years | 0 (0.0%) | 0 (0.0%) |
| 18 to 24 Years | 20 (100.0%) | 0 (0.0%) |
| 25 to 34 Years | 0 (0.0%) | 34 (45.3%) |
| 35 to 44 Years | 0 (0.0%) | 0 (0.0%) |
| 45 to 54 Years | 45 (33.8%) | 30 (33.0%) |
| 55 to 64 Years | 33 (42.3%) | 18 (20.4%) |
| 65 to 74 Years | 18 (31.6%) | 0 (0.0%) |
| 75 Years and over | 15 (42.9%) | 15 (57.7%) |
| Total | 164 (34.2%) | 127 (31.0%) |
Income Above Poverty by Sex and Age in Grand Isle
According to the poverty statistics in Grand Isle, males aged 5 years and females aged 6 to 11 years are the age groups that are most secure financially, with 100.0% of males and 100.0% of females in these age groups living above the poverty line.
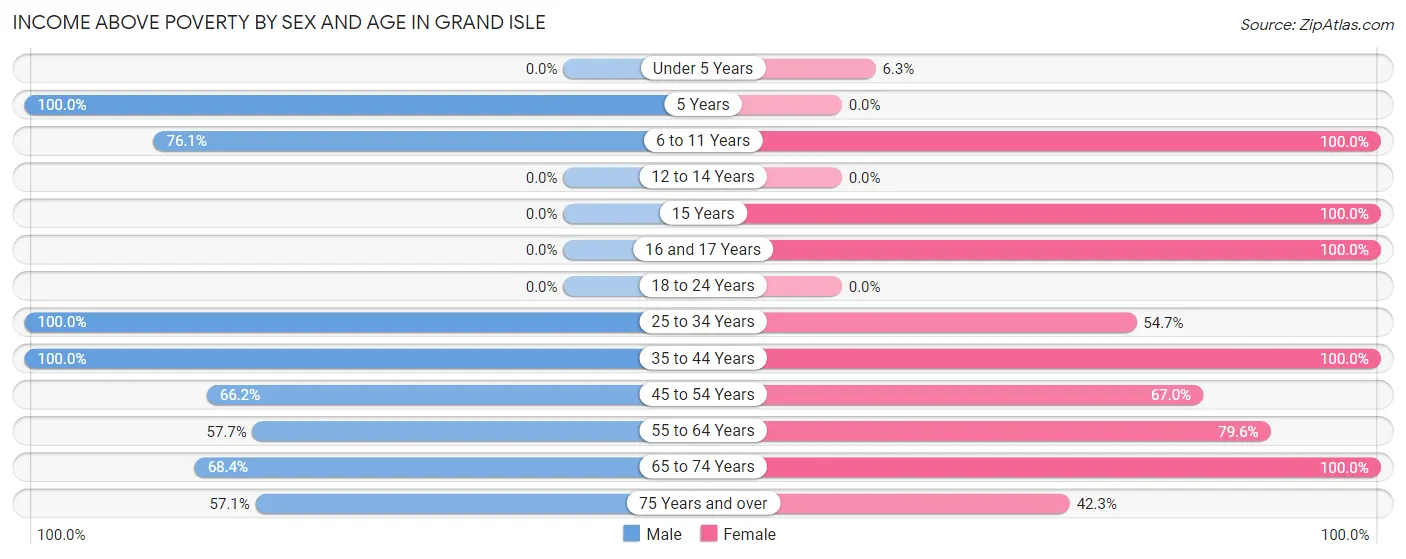
| Age Bracket | Male | Female |
| Under 5 Years | 0 (0.0%) | 2 (6.2%) |
| 5 Years | 6 (100.0%) | 0 (0.0%) |
| 6 to 11 Years | 54 (76.1%) | 6 (100.0%) |
| 12 to 14 Years | 0 (0.0%) | 0 (0.0%) |
| 15 Years | 0 (0.0%) | 19 (100.0%) |
| 16 and 17 Years | 0 (0.0%) | 18 (100.0%) |
| 18 to 24 Years | 0 (0.0%) | 0 (0.0%) |
| 25 to 34 Years | 45 (100.0%) | 41 (54.7%) |
| 35 to 44 Years | 19 (100.0%) | 7 (100.0%) |
| 45 to 54 Years | 88 (66.2%) | 61 (67.0%) |
| 55 to 64 Years | 45 (57.7%) | 70 (79.5%) |
| 65 to 74 Years | 39 (68.4%) | 48 (100.0%) |
| 75 Years and over | 20 (57.1%) | 11 (42.3%) |
| Total | 316 (65.8%) | 283 (69.0%) |
Income Below Poverty Among Married-Couple Families in Grand Isle
The poverty statistics for married-couple families in Grand Isle show that 13.2% or 27 of the total 205 families live below the poverty line. Families with no children have the highest poverty rate of 14.8%, comprising of 27 families. On the other hand, families with 1 or 2 children have the lowest poverty rate of 0.0%, which includes 0 families.
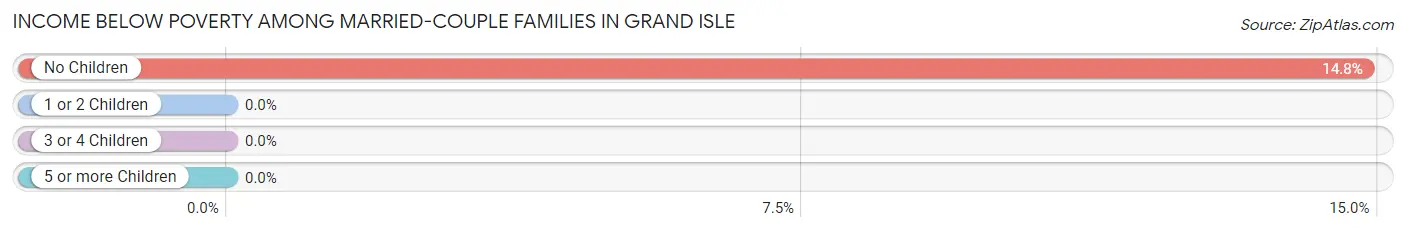
| Children | Above Poverty | Below Poverty |
| No Children | 155 (85.2%) | 27 (14.8%) |
| 1 or 2 Children | 23 (100.0%) | 0 (0.0%) |
| 3 or 4 Children | 0 (0.0%) | 0 (0.0%) |
| 5 or more Children | 0 (0.0%) | 0 (0.0%) |
| Total | 178 (86.8%) | 27 (13.2%) |
Income Below Poverty Among Single-Parent Households in Grand Isle
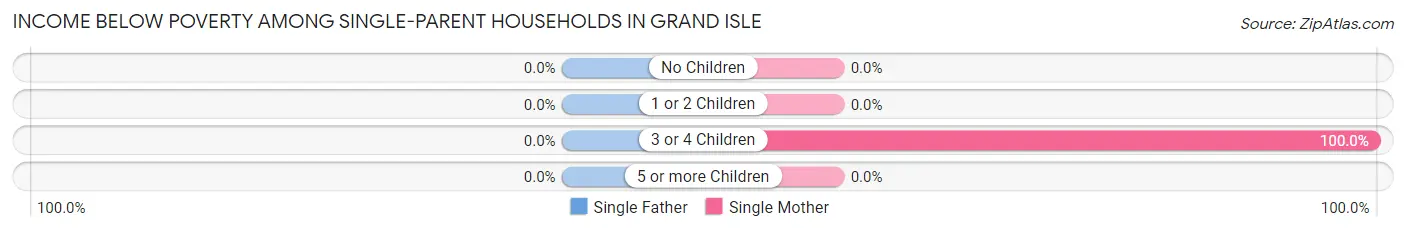
| Children | Single Father | Single Mother |
| No Children | 0 (0.0%) | 0 (0.0%) |
| 1 or 2 Children | 0 (0.0%) | 0 (0.0%) |
| 3 or 4 Children | 0 (0.0%) | 18 (100.0%) |
| 5 or more Children | 0 (0.0%) | 0 (0.0%) |
| Total | 0 (0.0%) | 18 (41.9%) |
Income Below Poverty Among Married-Couple vs Single-Parent Households in Grand Isle
The poverty data for Grand Isle shows that 27 of the married-couple family households (13.2%) and 18 of the single-parent households (22.8%) are living below the poverty level. Within the married-couple family households, those with no children have the highest poverty rate, with 27 households (14.8%) falling below the poverty line. Among the single-parent households, those with 3 or 4 children have the highest poverty rate, with 18 household (100.0%) living below poverty.
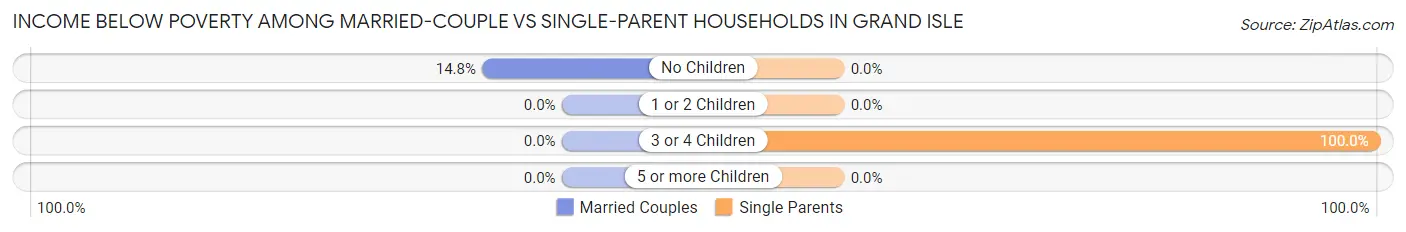
| Children | Married-Couple Families | Single-Parent Households |
| No Children | 27 (14.8%) | 0 (0.0%) |
| 1 or 2 Children | 0 (0.0%) | 0 (0.0%) |
| 3 or 4 Children | 0 (0.0%) | 18 (100.0%) |
| 5 or more Children | 0 (0.0%) | 0 (0.0%) |
| Total | 27 (13.2%) | 18 (22.8%) |
Race in Grand Isle
The most populous races in Grand Isle are White / Caucasian (860 | 95.2%), Two or more Races (33 | 3.6%), and Hispanic or Latino (22 | 2.4%).
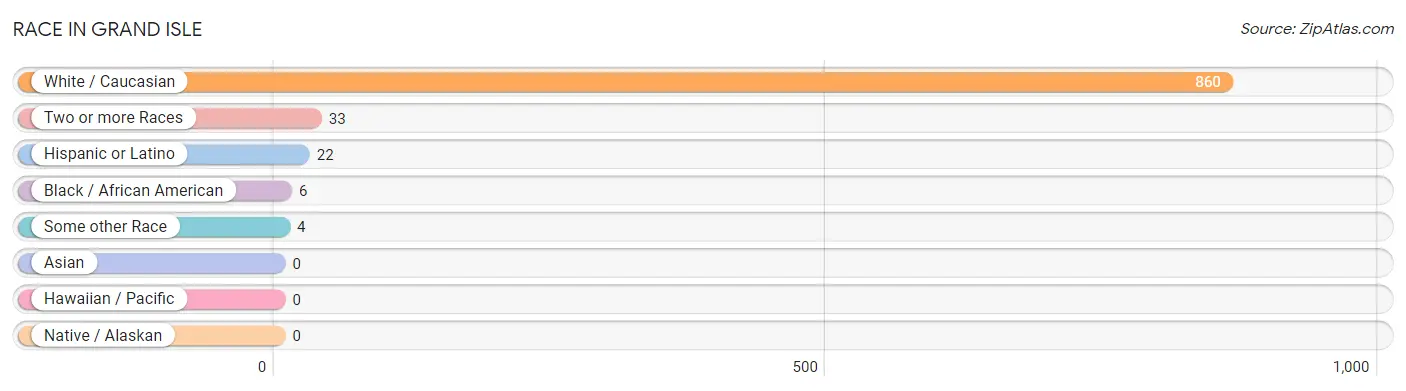
| Race | # Population | % Population |
| Asian | 0 | 0.0% |
| Black / African American | 6 | 0.7% |
| Hawaiian / Pacific | 0 | 0.0% |
| Hispanic or Latino | 22 | 2.4% |
| Native / Alaskan | 0 | 0.0% |
| White / Caucasian | 860 | 95.2% |
| Two or more Races | 33 | 3.6% |
| Some other Race | 4 | 0.4% |
| Total | 903 | 100.0% |
Ancestry in Grand Isle
The most populous ancestries reported in Grand Isle are French (230 | 25.5%), German (150 | 16.6%), French Canadian (87 | 9.6%), English (71 | 7.9%), and Irish (45 | 5.0%), together accounting for 64.5% of all Grand Isle residents.
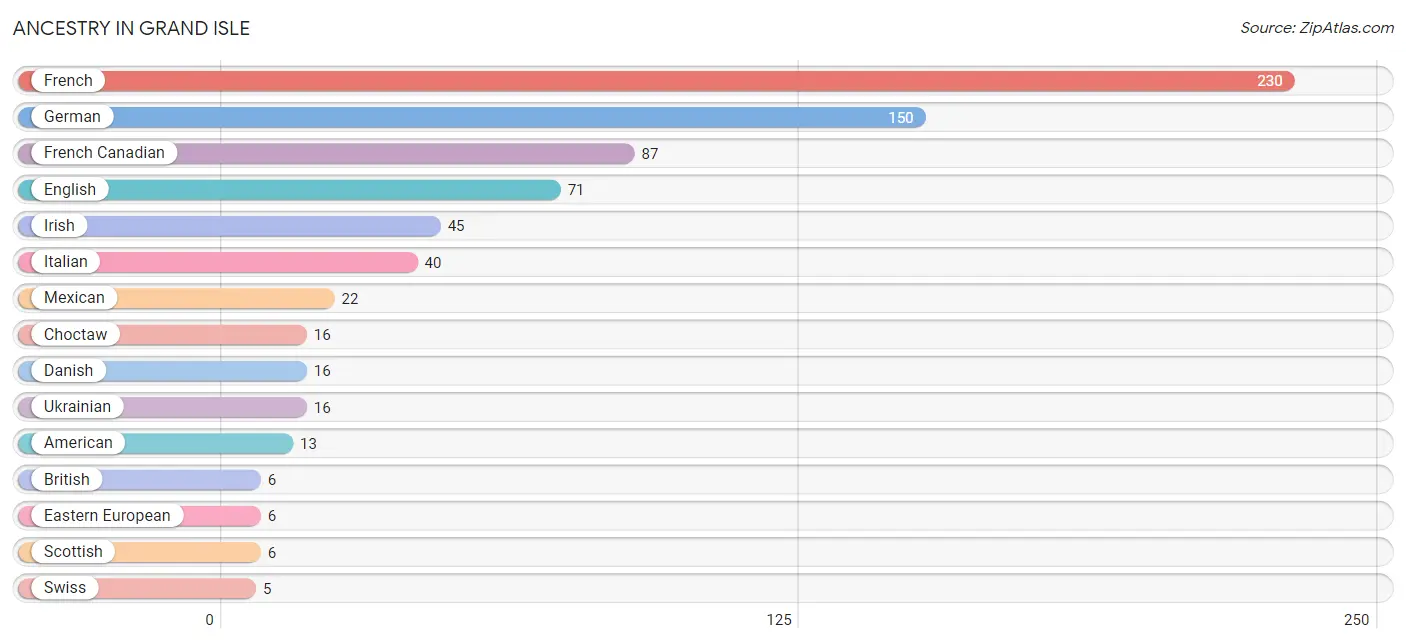
| Ancestry | # Population | % Population |
| American | 13 | 1.4% |
| British | 6 | 0.7% |
| Choctaw | 16 | 1.8% |
| Danish | 16 | 1.8% |
| Eastern European | 6 | 0.7% |
| English | 71 | 7.9% |
| French | 230 | 25.5% |
| French Canadian | 87 | 9.6% |
| German | 150 | 16.6% |
| Irish | 45 | 5.0% |
| Italian | 40 | 4.4% |
| Mexican | 22 | 2.4% |
| Scottish | 6 | 0.7% |
| Swiss | 5 | 0.5% |
| Ukrainian | 16 | 1.8% | View All 15 Rows |
Immigrants in Grand Isle
The most numerous immigrant groups reported in Grand Isle came from Central America (18 | 2.0%), Latin America (18 | 2.0%), and Mexico (18 | 2.0%), together accounting for 6.0% of all Grand Isle residents.
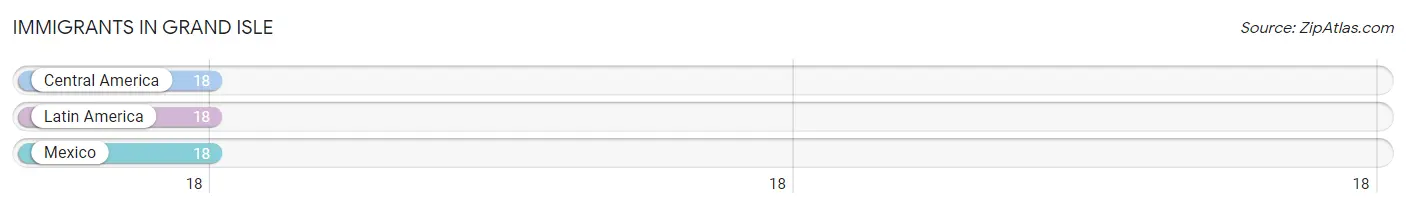
| Immigration Origin | # Population | % Population |
| Central America | 18 | 2.0% |
| Latin America | 18 | 2.0% |
| Mexico | 18 | 2.0% | View All 3 Rows |
Sex and Age in Grand Isle
Sex and Age in Grand Isle
The most populous age groups in Grand Isle are 50 to 54 Years (103 | 20.9%) for men and 55 to 59 Years (60 | 14.6%) for women.
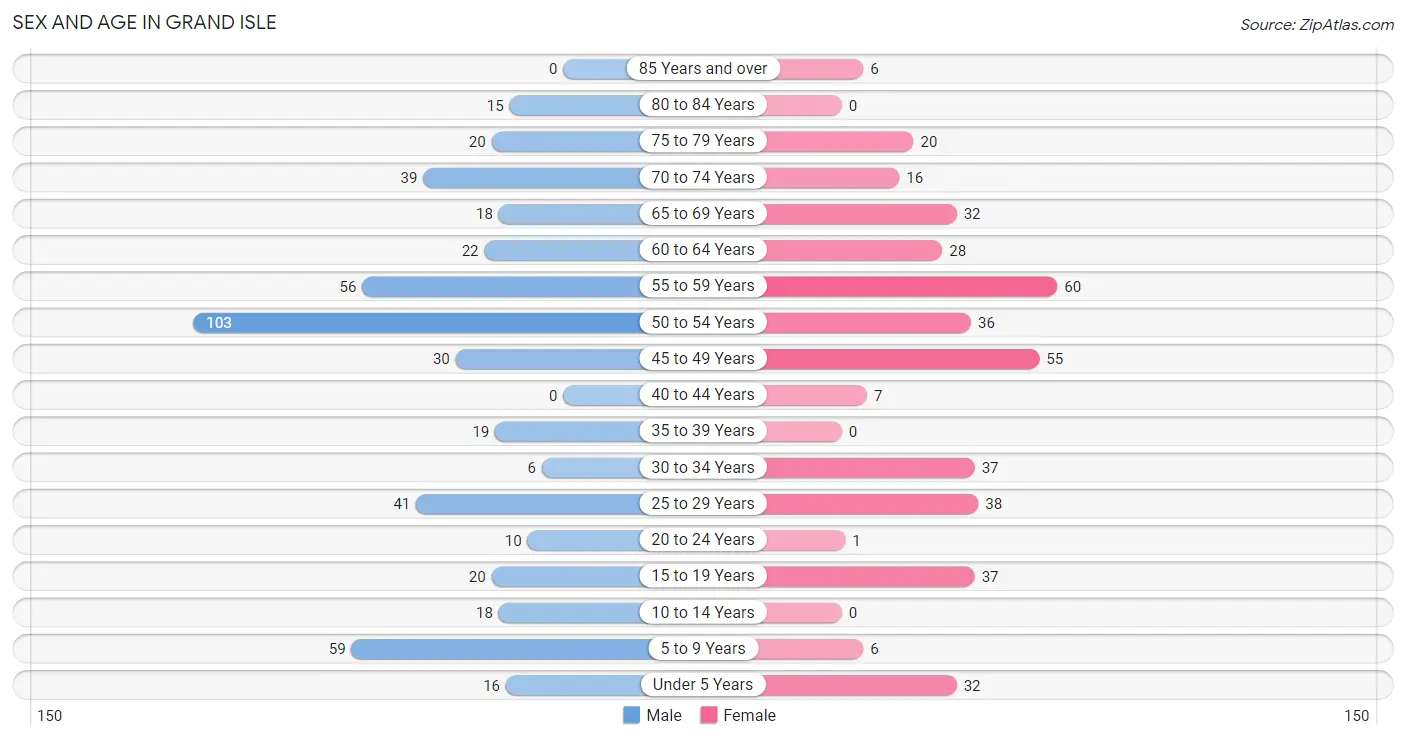
| Age Bracket | Male | Female |
| Under 5 Years | 16 (3.3%) | 32 (7.8%) |
| 5 to 9 Years | 59 (12.0%) | 6 (1.5%) |
| 10 to 14 Years | 18 (3.7%) | 0 (0.0%) |
| 15 to 19 Years | 20 (4.1%) | 37 (9.0%) |
| 20 to 24 Years | 10 (2.0%) | 1 (0.2%) |
| 25 to 29 Years | 41 (8.3%) | 38 (9.2%) |
| 30 to 34 Years | 6 (1.2%) | 37 (9.0%) |
| 35 to 39 Years | 19 (3.9%) | 0 (0.0%) |
| 40 to 44 Years | 0 (0.0%) | 7 (1.7%) |
| 45 to 49 Years | 30 (6.1%) | 55 (13.4%) |
| 50 to 54 Years | 103 (20.9%) | 36 (8.8%) |
| 55 to 59 Years | 56 (11.4%) | 60 (14.6%) |
| 60 to 64 Years | 22 (4.5%) | 28 (6.8%) |
| 65 to 69 Years | 18 (3.7%) | 32 (7.8%) |
| 70 to 74 Years | 39 (7.9%) | 16 (3.9%) |
| 75 to 79 Years | 20 (4.1%) | 20 (4.9%) |
| 80 to 84 Years | 15 (3.0%) | 0 (0.0%) |
| 85 Years and over | 0 (0.0%) | 6 (1.5%) |
| Total | 492 (100.0%) | 411 (100.0%) |
Families and Households in Grand Isle
Median Family Size in Grand Isle
The median family size in Grand Isle is 2.43 persons per family, with single female/mother families (43 | 15.1%) accounting for the largest median family size of 3.91 persons per family. On the other hand, married-couple families (205 | 72.2%) represent the smallest median family size with 2.11 persons per family.
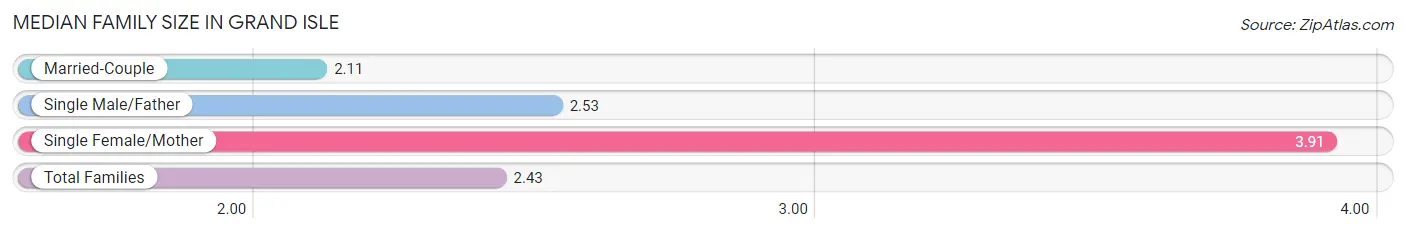
| Family Type | # Families | Family Size |
| Married-Couple | 205 (72.2%) | 2.11 |
| Single Male/Father | 36 (12.7%) | 2.53 |
| Single Female/Mother | 43 (15.1%) | 3.91 |
| Total Families | 284 (100.0%) | 2.43 |
Median Household Size in Grand Isle
The median household size in Grand Isle is 2.12 persons per household, with single female/mother households (43 | 10.2%) accounting for the largest median household size of 3.91 persons per household. non-family households (136 | 32.4%) represent the smallest median household size with 1.04 persons per household.
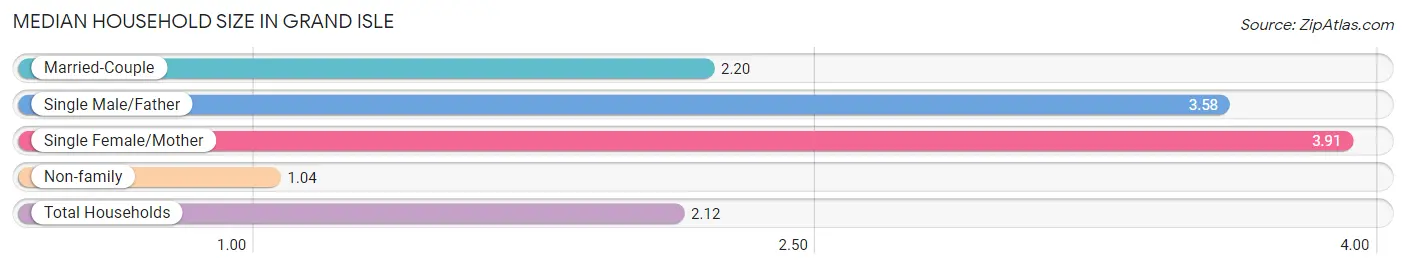
| Household Type | # Households | Household Size |
| Married-Couple | 205 (48.8%) | 2.20 |
| Single Male/Father | 36 (8.6%) | 3.58 |
| Single Female/Mother | 43 (10.2%) | 3.91 |
| Non-family | 136 (32.4%) | 1.04 |
| Total Households | 420 (100.0%) | 2.12 |
Household Size by Marriage Status in Grand Isle
Out of a total of 420 households in Grand Isle, 284 (67.6%) are family households, while 136 (32.4%) are nonfamily households. The most numerous type of family households are 2-person households, comprising 179, and the most common type of nonfamily households are 1-person households, comprising 130.
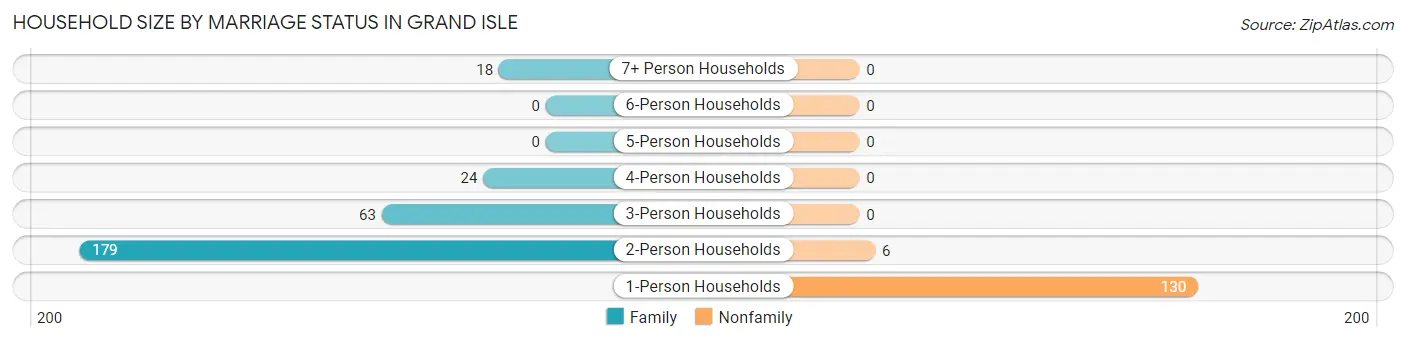
| Household Size | Family Households | Nonfamily Households |
| 1-Person Households | - | 130 (30.9%) |
| 2-Person Households | 179 (42.6%) | 6 (1.4%) |
| 3-Person Households | 63 (15.0%) | 0 (0.0%) |
| 4-Person Households | 24 (5.7%) | 0 (0.0%) |
| 5-Person Households | 0 (0.0%) | 0 (0.0%) |
| 6-Person Households | 0 (0.0%) | 0 (0.0%) |
| 7+ Person Households | 18 (4.3%) | 0 (0.0%) |
| Total | 284 (67.6%) | 136 (32.4%) |
Female Fertility in Grand Isle
Fertility by Age in Grand Isle
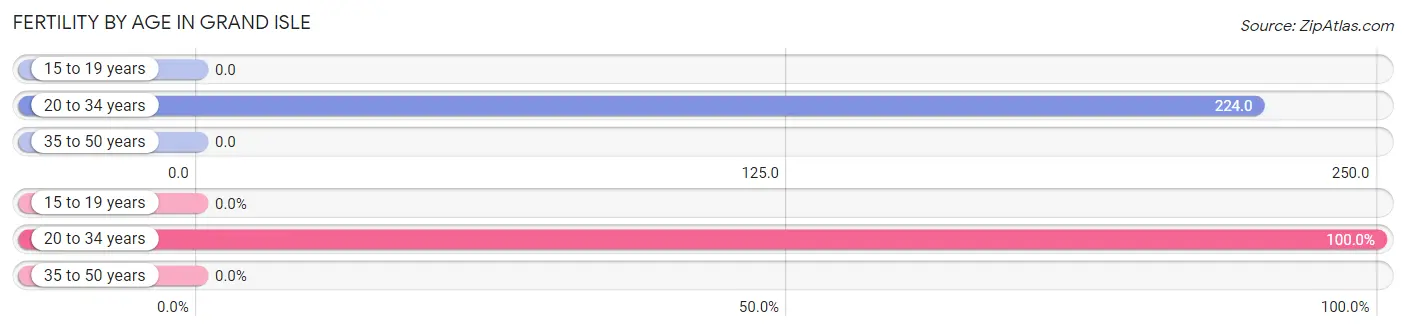
Average fertility rate in Grand Isle is 97.0 births per 1,000 women. Women in the age bracket of 20 to 34 years have the highest fertility rate with 224.0 births per 1,000 women. Women in the age bracket of 20 to 34 years acount for 100.0% of all women with births.
| Age Bracket | Women with Births | Births / 1,000 Women |
| 15 to 19 years | 0 (0.0%) | 0.0 |
| 20 to 34 years | 17 (100.0%) | 224.0 |
| 35 to 50 years | 0 (0.0%) | 0.0 |
| Total | 17 (100.0%) | 97.0 |
Fertility by Age by Marriage Status in Grand Isle
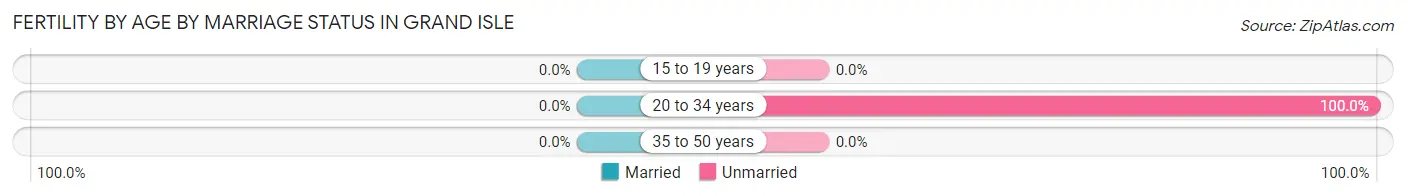
| Age Bracket | Married | Unmarried |
| 15 to 19 years | 0 (0.0%) | 0 (0.0%) |
| 20 to 34 years | 0 (0.0%) | 17 (100.0%) |
| 35 to 50 years | 0 (0.0%) | 0 (0.0%) |
| Total | 0 (0.0%) | 17 (100.0%) |
Fertility by Education in Grand Isle
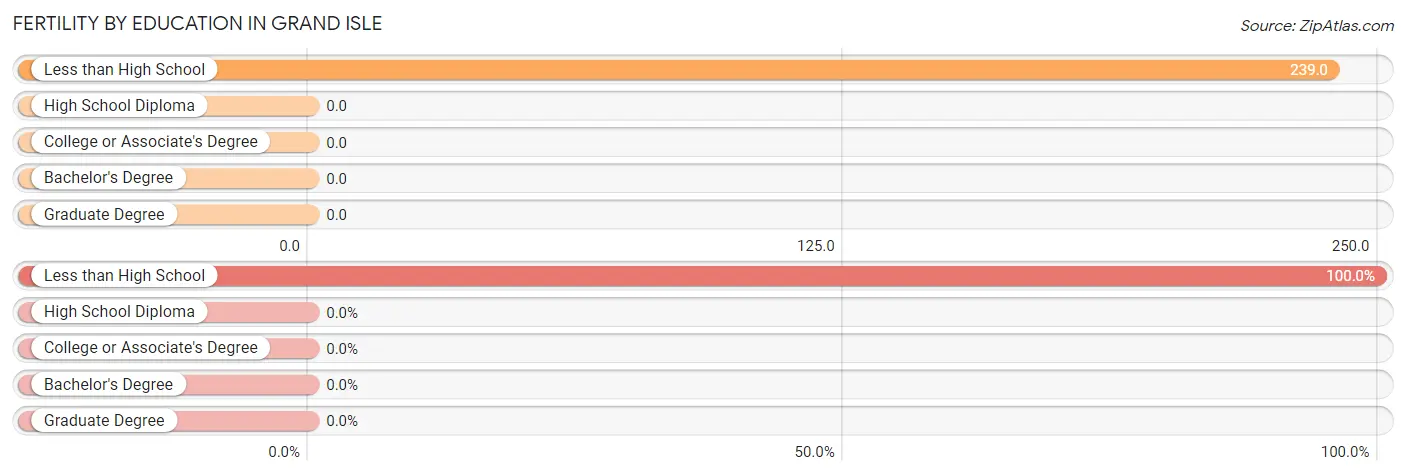
| Educational Attainment | Women with Births | Births / 1,000 Women |
| Less than High School | 17 (100.0%) | 239.0 |
| High School Diploma | 0 (0.0%) | 0.0 |
| College or Associate's Degree | 0 (0.0%) | 0.0 |
| Bachelor's Degree | 0 (0.0%) | 0.0 |
| Graduate Degree | 0 (0.0%) | 0.0 |
| Total | 17 (100.0%) | 97.0 |
Fertility by Education by Marriage Status in Grand Isle
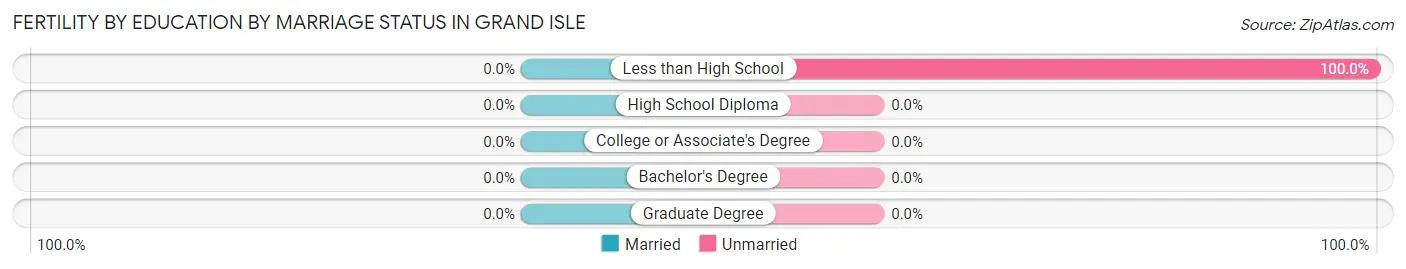
| Educational Attainment | Married | Unmarried |
| Less than High School | 0 (0.0%) | 17 (100.0%) |
| High School Diploma | 0 (0.0%) | 0 (0.0%) |
| College or Associate's Degree | 0 (0.0%) | 0 (0.0%) |
| Bachelor's Degree | 0 (0.0%) | 0 (0.0%) |
| Graduate Degree | 0 (0.0%) | 0 (0.0%) |
| Total | 0 (0.0%) | 17 (100.0%) |
Employment Characteristics in Grand Isle
Employment by Class of Employer in Grand Isle
Among the 394 employed individuals in Grand Isle, private company employees (231 | 58.6%), local government employees (63 | 16.0%), and self-employed (not incorporated) (52 | 13.2%) make up the most common classes of employment.
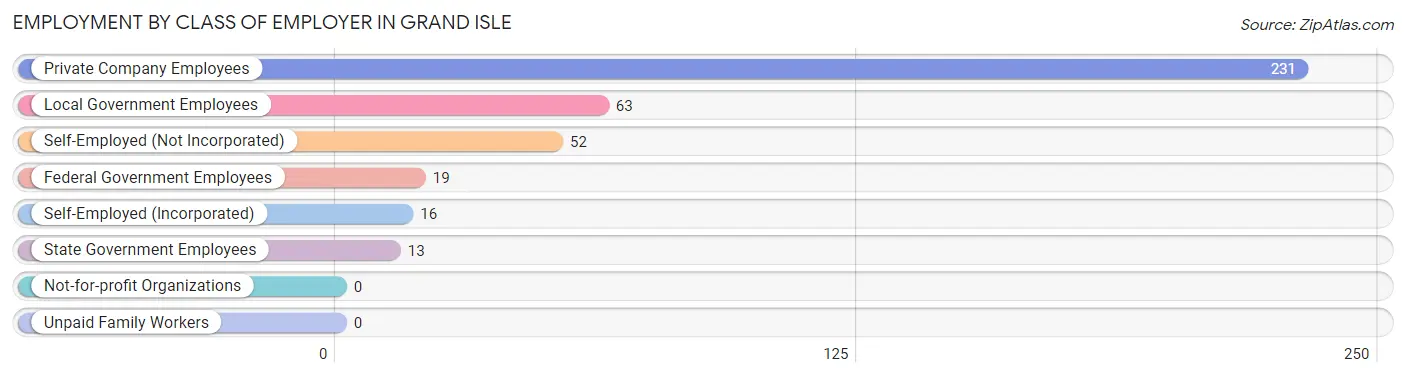
| Employer Class | # Employees | % Employees |
| Private Company Employees | 231 | 58.6% |
| Self-Employed (Incorporated) | 16 | 4.1% |
| Self-Employed (Not Incorporated) | 52 | 13.2% |
| Not-for-profit Organizations | 0 | 0.0% |
| Local Government Employees | 63 | 16.0% |
| State Government Employees | 13 | 3.3% |
| Federal Government Employees | 19 | 4.8% |
| Unpaid Family Workers | 0 | 0.0% |
| Total | 394 | 100.0% |
Employment Status by Age in Grand Isle
According to the labor force statistics for Grand Isle, out of the total population over 16 years of age (753), 55.6% or 419 individuals are in the labor force, with 6.3% or 26 of them unemployed. The age group with the highest labor force participation rate is 20 to 24 years, with 100.0% or 11 individuals in the labor force. Within the labor force, the 45 to 54 years age range has the highest percentage of unemployed individuals, with 17.9% or 25 of them being unemployed.
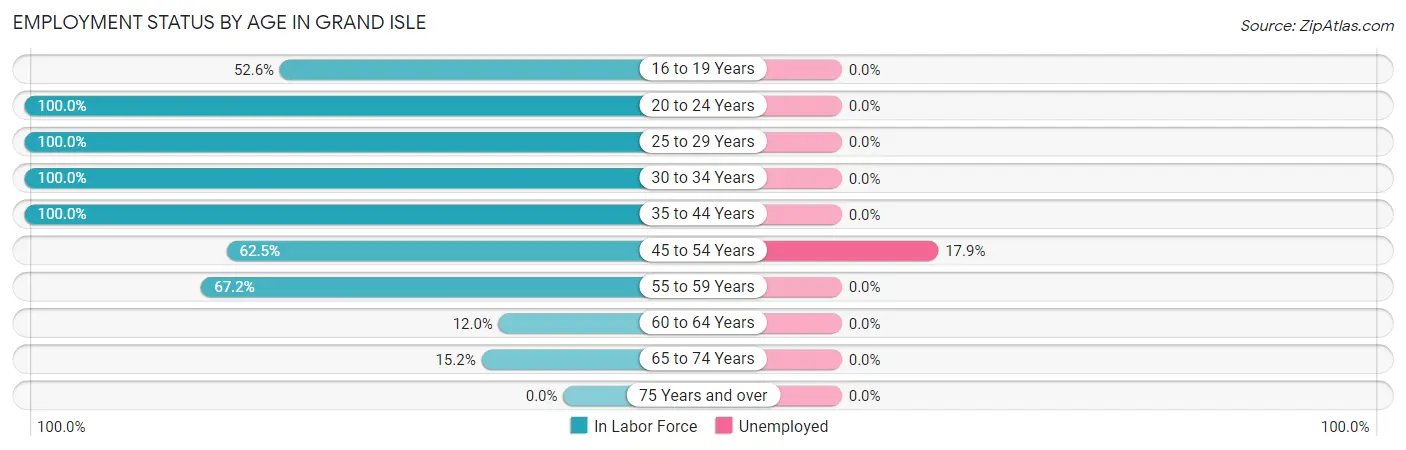
| Age Bracket | In Labor Force | Unemployed |
| 16 to 19 Years | 20 (52.6%) | 0 (0.0%) |
| 20 to 24 Years | 11 (100.0%) | 0 (0.0%) |
| 25 to 29 Years | 79 (100.0%) | 0 (0.0%) |
| 30 to 34 Years | 43 (100.0%) | 0 (0.0%) |
| 35 to 44 Years | 26 (100.0%) | 0 (0.0%) |
| 45 to 54 Years | 140 (62.5%) | 25 (17.9%) |
| 55 to 59 Years | 78 (67.2%) | 0 (0.0%) |
| 60 to 64 Years | 6 (12.0%) | 0 (0.0%) |
| 65 to 74 Years | 16 (15.2%) | 0 (0.0%) |
| 75 Years and over | 0 (0.0%) | 0 (0.0%) |
| Total | 419 (55.6%) | 26 (6.3%) |
Employment Status by Educational Attainment in Grand Isle
According to labor force statistics for Grand Isle, 69.1% of individuals (372) out of the total population between 25 and 64 years of age (538) are in the labor force, with 6.9% or 26 of them being unemployed. The group with the highest labor force participation rate are those with the educational attainment of less than high school, with 80.5% or 70 individuals in the labor force. Within the labor force, individuals with college / associate degree education have the highest percentage of unemployment, with 14.0% or 8 of them being unemployed.
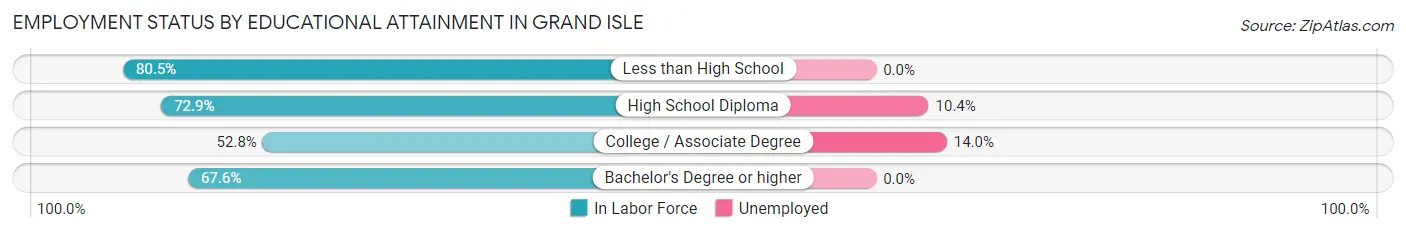
| Educational Attainment | In Labor Force | Unemployed |
| Less than High School | 70 (80.5%) | 0 (0.0%) |
| High School Diploma | 175 (72.9%) | 25 (10.4%) |
| College / Associate Degree | 56 (52.8%) | 15 (14.0%) |
| Bachelor's Degree or higher | 71 (67.6%) | 0 (0.0%) |
| Total | 372 (69.1%) | 37 (6.9%) |
Employment Occupations by Sex in Grand Isle
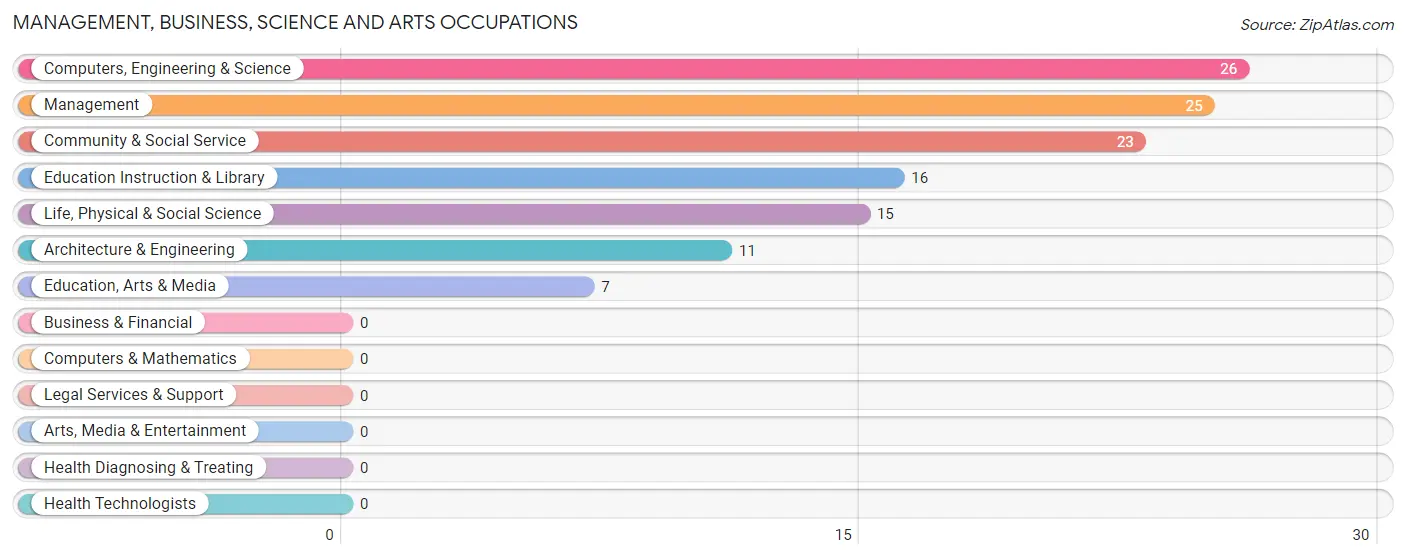
Management, Business, Science and Arts Occupations
The most common Management, Business, Science and Arts occupations in Grand Isle are Computers, Engineering & Science (26 | 6.9%), Management (25 | 6.7%), Community & Social Service (23 | 6.1%), Education Instruction & Library (16 | 4.3%), and Life, Physical & Social Science (15 | 4.0%).
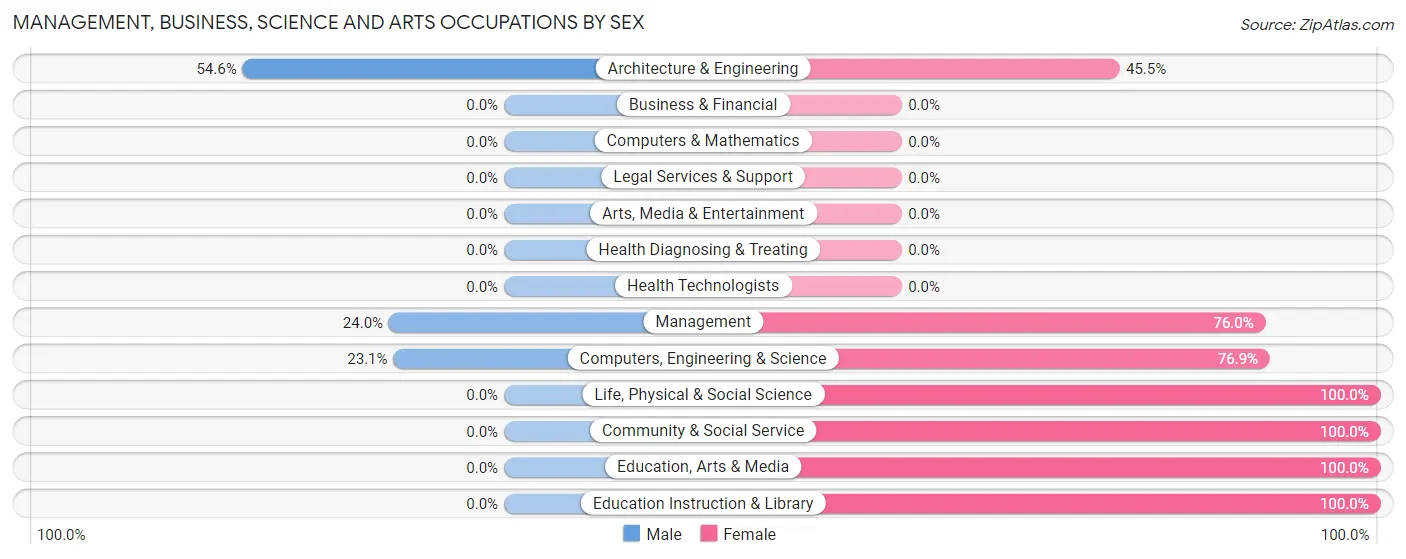
Management, Business, Science and Arts Occupations by Sex
Within the Management, Business, Science and Arts occupations in Grand Isle, the most male-oriented occupations are Architecture & Engineering (54.5%), Management (24.0%), and Computers, Engineering & Science (23.1%), while the most female-oriented occupations are Life, Physical & Social Science (100.0%), Community & Social Service (100.0%), and Education, Arts & Media (100.0%).
| Occupation | Male | Female |
| Management | 6 (24.0%) | 19 (76.0%) |
| Business & Financial | 0 (0.0%) | 0 (0.0%) |
| Computers, Engineering & Science | 6 (23.1%) | 20 (76.9%) |
| Computers & Mathematics | 0 (0.0%) | 0 (0.0%) |
| Architecture & Engineering | 6 (54.5%) | 5 (45.5%) |
| Life, Physical & Social Science | 0 (0.0%) | 15 (100.0%) |
| Community & Social Service | 0 (0.0%) | 23 (100.0%) |
| Education, Arts & Media | 0 (0.0%) | 7 (100.0%) |
| Legal Services & Support | 0 (0.0%) | 0 (0.0%) |
| Education Instruction & Library | 0 (0.0%) | 16 (100.0%) |
| Arts, Media & Entertainment | 0 (0.0%) | 0 (0.0%) |
| Health Diagnosing & Treating | 0 (0.0%) | 0 (0.0%) |
| Health Technologists | 0 (0.0%) | 0 (0.0%) |
| Total (Category) | 12 (16.2%) | 62 (83.8%) |
| Total (Overall) | 176 (46.9%) | 199 (53.1%) |
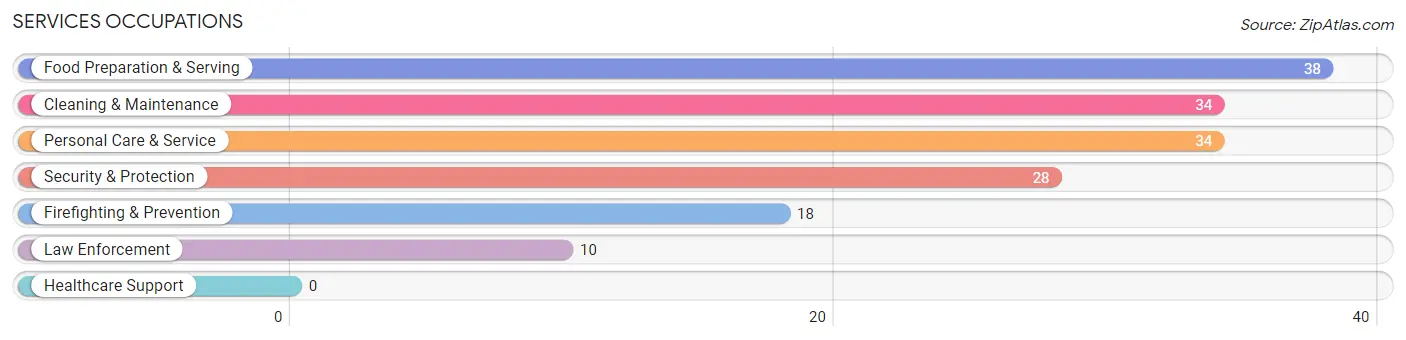
Services Occupations
The most common Services occupations in Grand Isle are Food Preparation & Serving (38 | 10.1%), Cleaning & Maintenance (34 | 9.1%), Personal Care & Service (34 | 9.1%), Security & Protection (28 | 7.5%), and Firefighting & Prevention (18 | 4.8%).
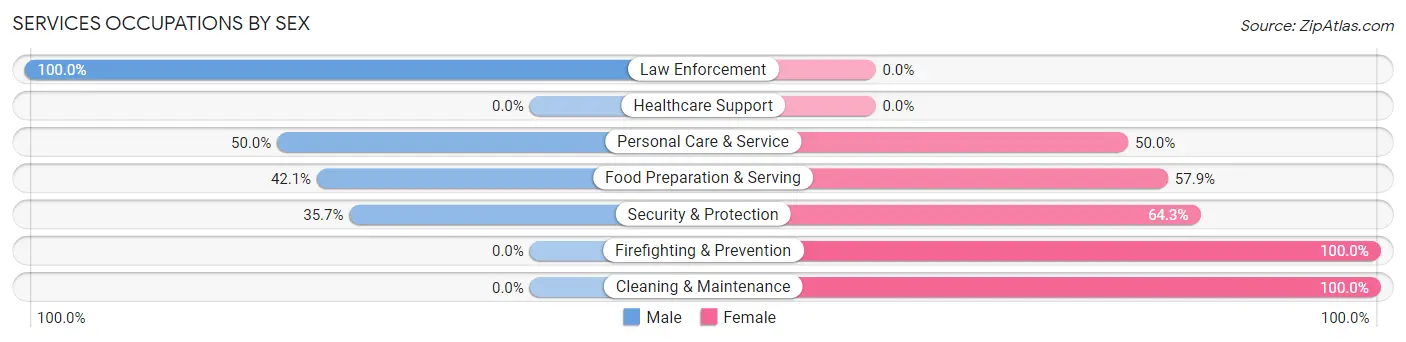
Services Occupations by Sex
Within the Services occupations in Grand Isle, the most male-oriented occupations are Law Enforcement (100.0%), Personal Care & Service (50.0%), and Food Preparation & Serving (42.1%), while the most female-oriented occupations are Firefighting & Prevention (100.0%), Cleaning & Maintenance (100.0%), and Security & Protection (64.3%).
| Occupation | Male | Female |
| Healthcare Support | 0 (0.0%) | 0 (0.0%) |
| Security & Protection | 10 (35.7%) | 18 (64.3%) |
| Firefighting & Prevention | 0 (0.0%) | 18 (100.0%) |
| Law Enforcement | 10 (100.0%) | 0 (0.0%) |
| Food Preparation & Serving | 16 (42.1%) | 22 (57.9%) |
| Cleaning & Maintenance | 0 (0.0%) | 34 (100.0%) |
| Personal Care & Service | 17 (50.0%) | 17 (50.0%) |
| Total (Category) | 43 (32.1%) | 91 (67.9%) |
| Total (Overall) | 176 (46.9%) | 199 (53.1%) |
Sales and Office Occupations
The most common Sales and Office occupations in Grand Isle are Sales & Related (57 | 15.2%), and Office & Administration (37 | 9.9%).

Sales and Office Occupations by Sex

| Occupation | Male | Female |
| Sales & Related | 17 (29.8%) | 40 (70.2%) |
| Office & Administration | 31 (83.8%) | 6 (16.2%) |
| Total (Category) | 48 (51.1%) | 46 (48.9%) |
| Total (Overall) | 176 (46.9%) | 199 (53.1%) |
Natural Resources, Construction and Maintenance Occupations
The most common Natural Resources, Construction and Maintenance occupations in Grand Isle are , and Installation, Maintenance & Repair (36 | 9.6%).
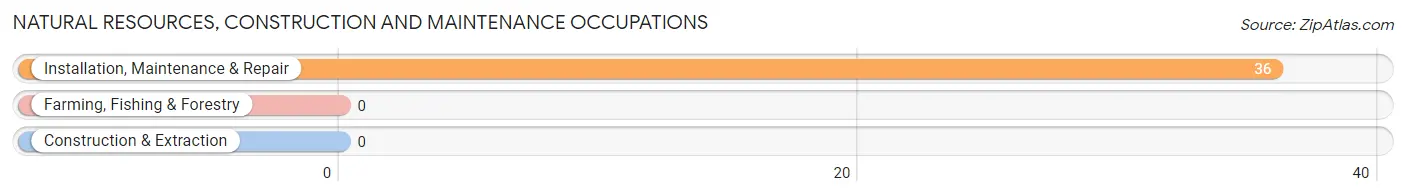
Natural Resources, Construction and Maintenance Occupations by Sex
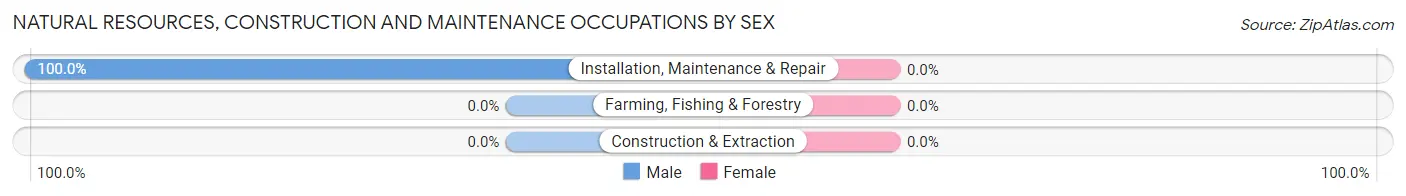
| Occupation | Male | Female |
| Farming, Fishing & Forestry | 0 (0.0%) | 0 (0.0%) |
| Construction & Extraction | 0 (0.0%) | 0 (0.0%) |
| Installation, Maintenance & Repair | 36 (100.0%) | 0 (0.0%) |
| Total (Category) | 36 (100.0%) | 0 (0.0%) |
| Total (Overall) | 176 (46.9%) | 199 (53.1%) |
Production, Transportation and Moving Occupations
The most common Production, Transportation and Moving occupations in Grand Isle are Material Moving (20 | 5.3%), and Production (17 | 4.5%).
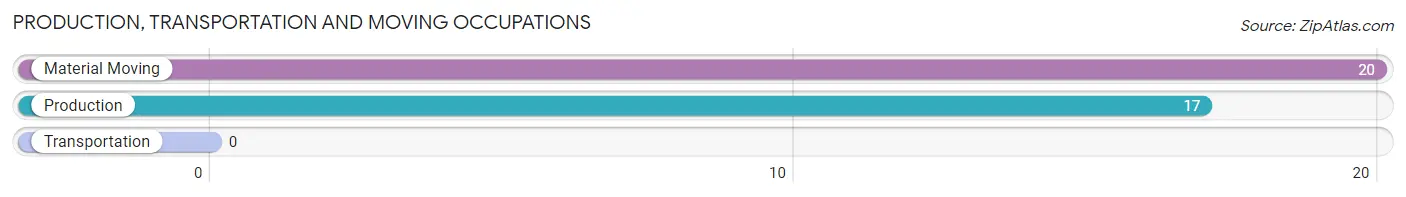
Production, Transportation and Moving Occupations by Sex
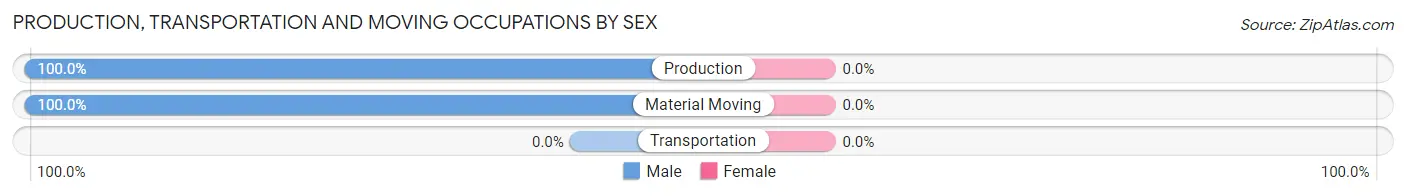
| Occupation | Male | Female |
| Production | 17 (100.0%) | 0 (0.0%) |
| Transportation | 0 (0.0%) | 0 (0.0%) |
| Material Moving | 20 (100.0%) | 0 (0.0%) |
| Total (Category) | 37 (100.0%) | 0 (0.0%) |
| Total (Overall) | 176 (46.9%) | 199 (53.1%) |
Employment Industries by Sex in Grand Isle
Employment Industries in Grand Isle
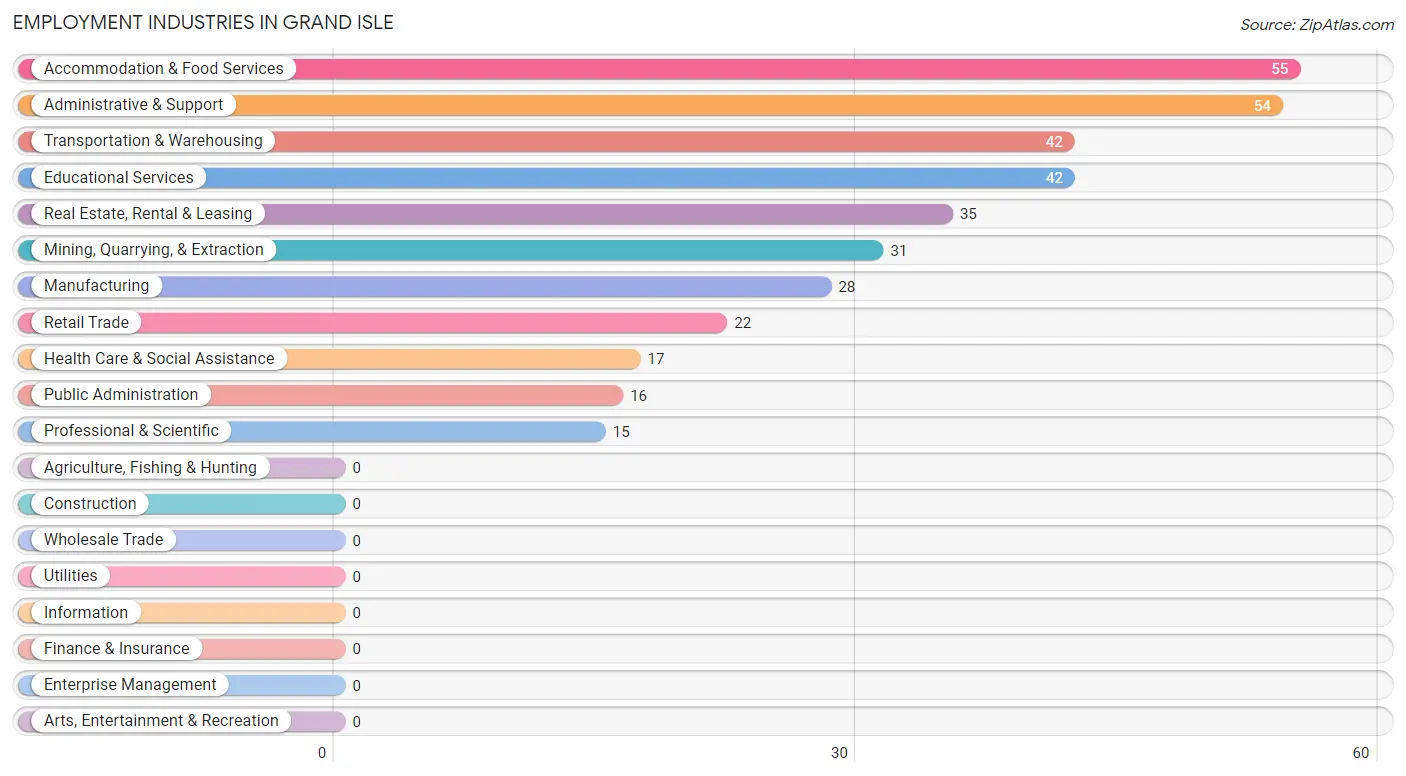
The major employment industries in Grand Isle include Accommodation & Food Services (55 | 14.7%), Administrative & Support (54 | 14.4%), Transportation & Warehousing (42 | 11.2%), Educational Services (42 | 11.2%), and Real Estate, Rental & Leasing (35 | 9.3%).
Employment Industries by Sex in Grand Isle
The Grand Isle industries that see more men than women are Mining, Quarrying, & Extraction (100.0%), Public Administration (100.0%), and Transportation & Warehousing (85.7%), whereas the industries that tend to have a higher number of women are Retail Trade (100.0%), Professional & Scientific (100.0%), and Educational Services (100.0%).
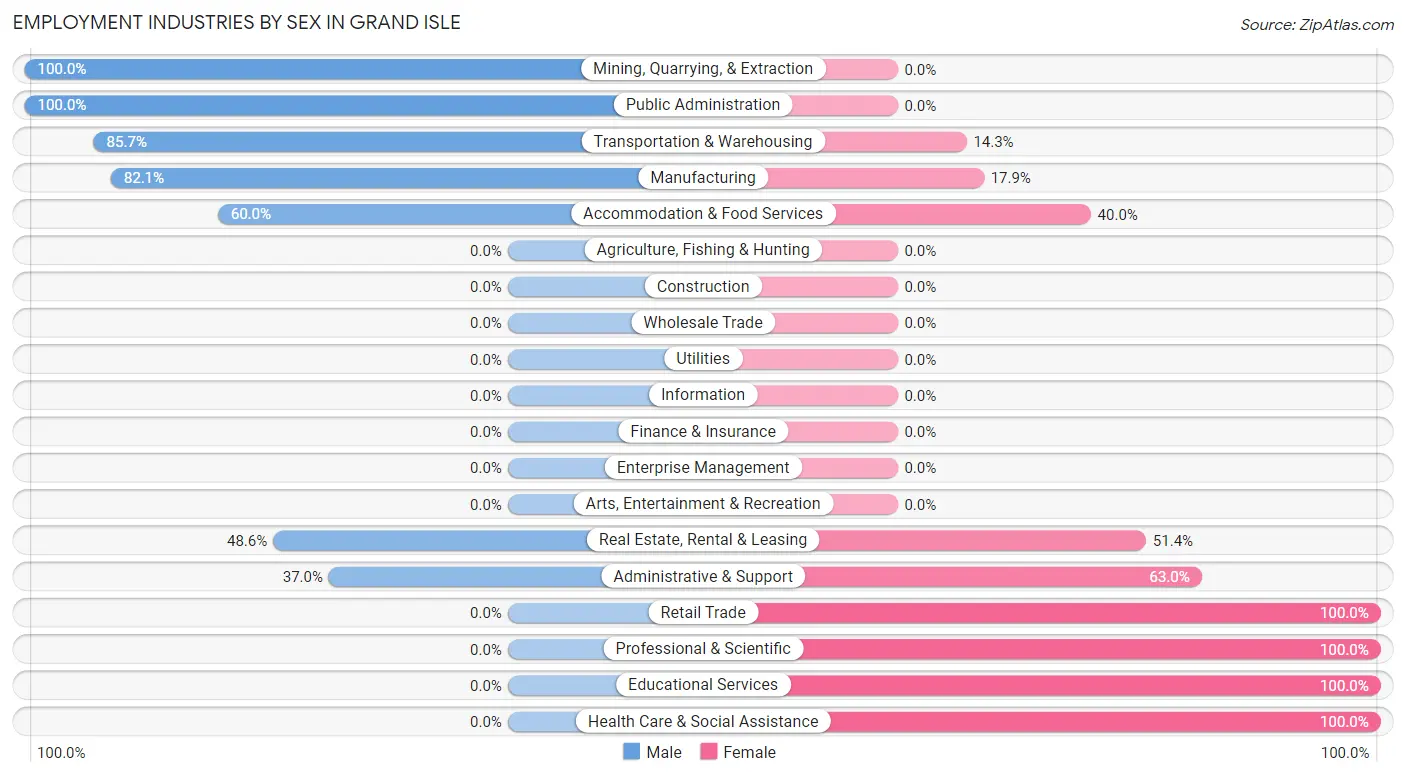
| Industry | Male | Female |
| Agriculture, Fishing & Hunting | 0 (0.0%) | 0 (0.0%) |
| Mining, Quarrying, & Extraction | 31 (100.0%) | 0 (0.0%) |
| Construction | 0 (0.0%) | 0 (0.0%) |
| Manufacturing | 23 (82.1%) | 5 (17.9%) |
| Wholesale Trade | 0 (0.0%) | 0 (0.0%) |
| Retail Trade | 0 (0.0%) | 22 (100.0%) |
| Transportation & Warehousing | 36 (85.7%) | 6 (14.3%) |
| Utilities | 0 (0.0%) | 0 (0.0%) |
| Information | 0 (0.0%) | 0 (0.0%) |
| Finance & Insurance | 0 (0.0%) | 0 (0.0%) |
| Real Estate, Rental & Leasing | 17 (48.6%) | 18 (51.4%) |
| Professional & Scientific | 0 (0.0%) | 15 (100.0%) |
| Enterprise Management | 0 (0.0%) | 0 (0.0%) |
| Administrative & Support | 20 (37.0%) | 34 (63.0%) |
| Educational Services | 0 (0.0%) | 42 (100.0%) |
| Health Care & Social Assistance | 0 (0.0%) | 17 (100.0%) |
| Arts, Entertainment & Recreation | 0 (0.0%) | 0 (0.0%) |
| Accommodation & Food Services | 33 (60.0%) | 22 (40.0%) |
| Public Administration | 16 (100.0%) | 0 (0.0%) |
| Total | 176 (46.9%) | 199 (53.1%) |
Education in Grand Isle
School Enrollment in Grand Isle
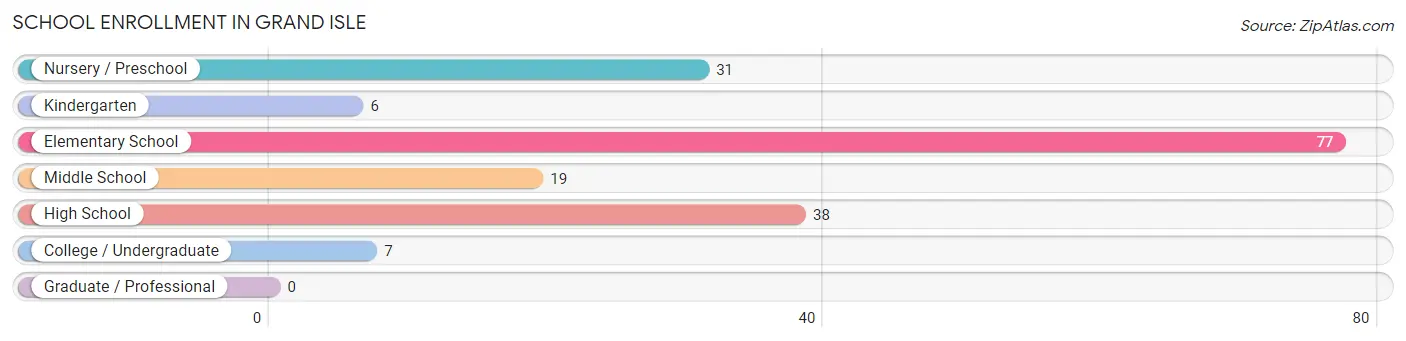
The most common levels of schooling among the 178 students in Grand Isle are elementary school (77 | 43.3%), high school (38 | 21.3%), and nursery / preschool (31 | 17.4%).
| School Level | # Students | % Students |
| Nursery / Preschool | 31 | 17.4% |
| Kindergarten | 6 | 3.4% |
| Elementary School | 77 | 43.3% |
| Middle School | 19 | 10.7% |
| High School | 38 | 21.3% |
| College / Undergraduate | 7 | 3.9% |
| Graduate / Professional | 0 | 0.0% |
| Total | 178 | 100.0% |
School Enrollment by Age by Funding Source in Grand Isle
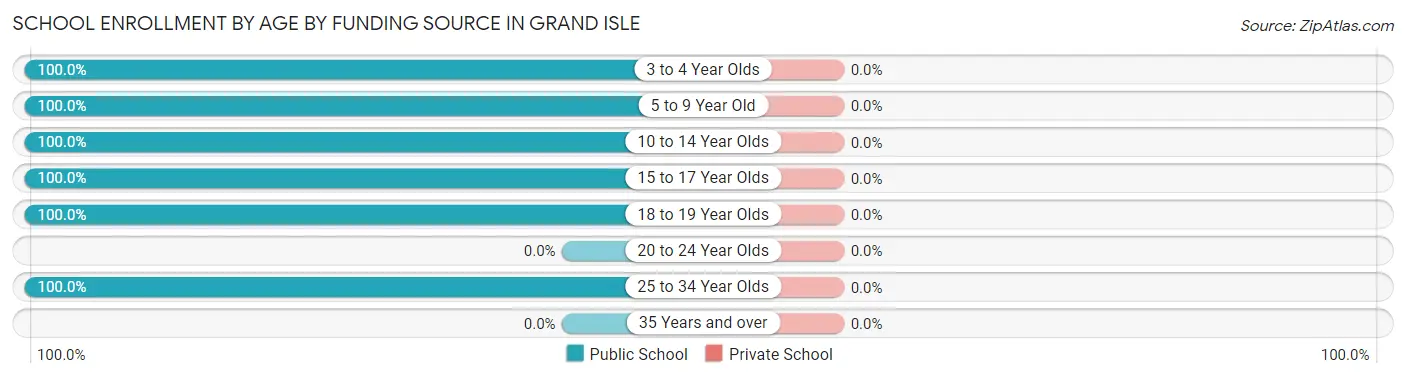
| Age Bracket | Public School | Private School |
| 3 to 4 Year Olds | 31 (100.0%) | 0 (0.0%) |
| 5 to 9 Year Old | 65 (100.0%) | 0 (0.0%) |
| 10 to 14 Year Olds | 18 (100.0%) | 0 (0.0%) |
| 15 to 17 Year Olds | 37 (100.0%) | 0 (0.0%) |
| 18 to 19 Year Olds | 20 (100.0%) | 0 (0.0%) |
| 20 to 24 Year Olds | 0 (0.0%) | 0 (0.0%) |
| 25 to 34 Year Olds | 7 (100.0%) | 0 (0.0%) |
| 35 Years and over | 0 (0.0%) | 0 (0.0%) |
| Total | 178 (100.0%) | 0 (0.0%) |
Educational Attainment by Field of Study in Grand Isle
Bio, nature & agricultural (33 | 25.2%), education (26 | 19.9%), business (21 | 16.0%), science & technology (19 | 14.5%), and psychology (16 | 12.2%) are the most common fields of study among 131 individuals in Grand Isle who have obtained a bachelor's degree or higher.
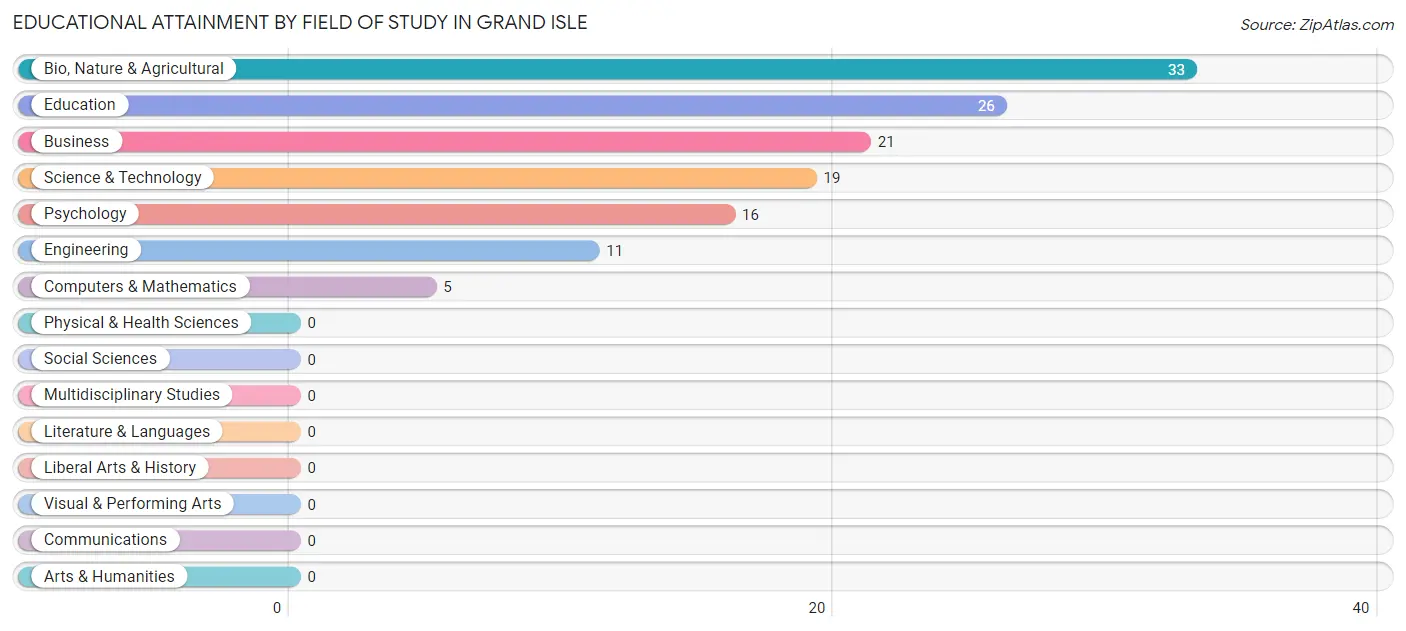
| Field of Study | # Graduates | % Graduates |
| Computers & Mathematics | 5 | 3.8% |
| Bio, Nature & Agricultural | 33 | 25.2% |
| Physical & Health Sciences | 0 | 0.0% |
| Psychology | 16 | 12.2% |
| Social Sciences | 0 | 0.0% |
| Engineering | 11 | 8.4% |
| Multidisciplinary Studies | 0 | 0.0% |
| Science & Technology | 19 | 14.5% |
| Business | 21 | 16.0% |
| Education | 26 | 19.9% |
| Literature & Languages | 0 | 0.0% |
| Liberal Arts & History | 0 | 0.0% |
| Visual & Performing Arts | 0 | 0.0% |
| Communications | 0 | 0.0% |
| Arts & Humanities | 0 | 0.0% |
| Total | 131 | 100.0% |
Transportation & Commute in Grand Isle
Vehicle Availability by Sex in Grand Isle
The most prevalent vehicle ownership categories in Grand Isle are males with 2 vehicles (113, accounting for 62.1%) and females with 2 vehicles (63, making up 56.8%).
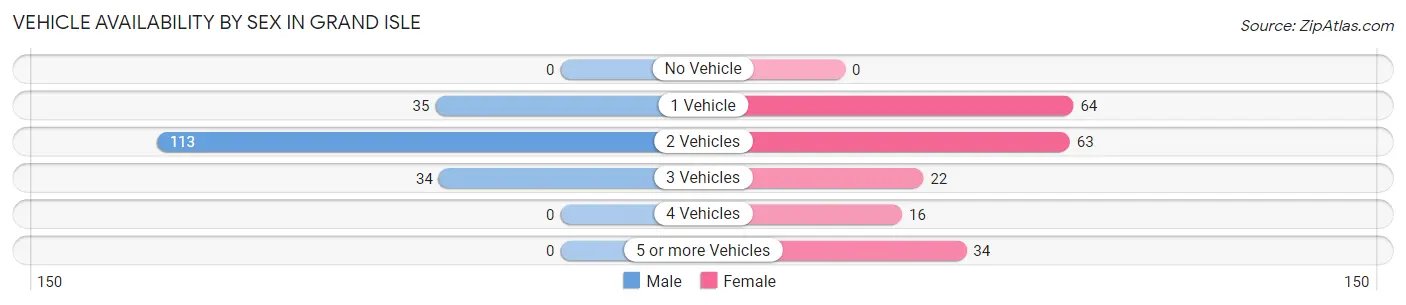
| Vehicles Available | Male | Female |
| No Vehicle | 0 (0.0%) | 0 (0.0%) |
| 1 Vehicle | 35 (19.2%) | 64 (32.2%) |
| 2 Vehicles | 113 (62.1%) | 63 (31.7%) |
| 3 Vehicles | 34 (18.7%) | 22 (11.1%) |
| 4 Vehicles | 0 (0.0%) | 16 (8.0%) |
| 5 or more Vehicles | 0 (0.0%) | 34 (17.1%) |
| Total | 182 (100.0%) | 199 (100.0%) |
Commute Time in Grand Isle
The most frequently occuring commute durations in Grand Isle are less than 5 minutes (126 commuters, 32.1%), 5 to 9 minutes (84 commuters, 21.4%), and 90 or more minutes (53 commuters, 13.5%).
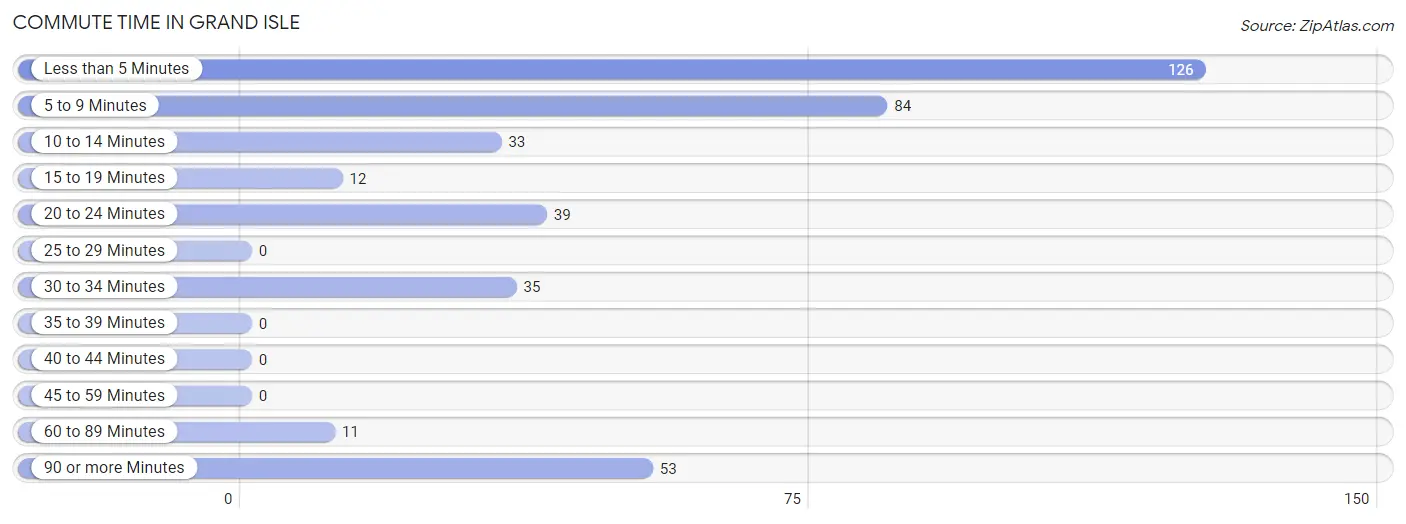
| Commute Time | # Commuters | % Commuters |
| Less than 5 Minutes | 126 | 32.1% |
| 5 to 9 Minutes | 84 | 21.4% |
| 10 to 14 Minutes | 33 | 8.4% |
| 15 to 19 Minutes | 12 | 3.0% |
| 20 to 24 Minutes | 39 | 9.9% |
| 25 to 29 Minutes | 0 | 0.0% |
| 30 to 34 Minutes | 35 | 8.9% |
| 35 to 39 Minutes | 0 | 0.0% |
| 40 to 44 Minutes | 0 | 0.0% |
| 45 to 59 Minutes | 0 | 0.0% |
| 60 to 89 Minutes | 11 | 2.8% |
| 90 or more Minutes | 53 | 13.5% |
Commute Time by Sex in Grand Isle
The most common commute times in Grand Isle are 90 or more minutes (53 commuters, 27.5%) for males and less than 5 minutes (107 commuters, 53.5%) for females.
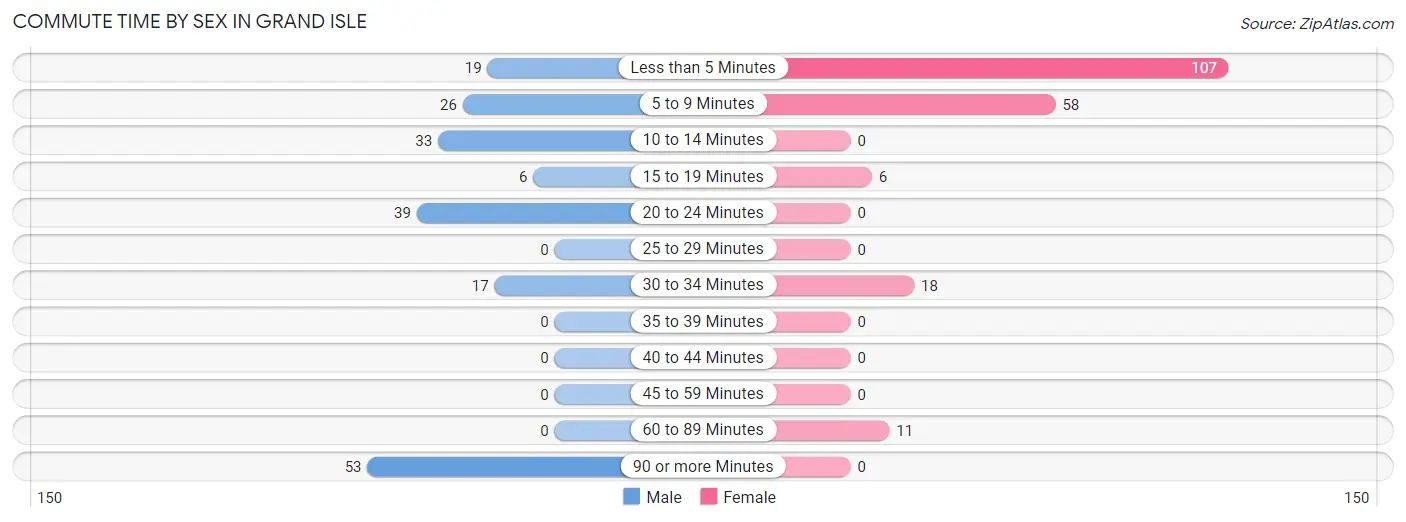
| Commute Time | Male | Female |
| Less than 5 Minutes | 19 (9.8%) | 107 (53.5%) |
| 5 to 9 Minutes | 26 (13.5%) | 58 (29.0%) |
| 10 to 14 Minutes | 33 (17.1%) | 0 (0.0%) |
| 15 to 19 Minutes | 6 (3.1%) | 6 (3.0%) |
| 20 to 24 Minutes | 39 (20.2%) | 0 (0.0%) |
| 25 to 29 Minutes | 0 (0.0%) | 0 (0.0%) |
| 30 to 34 Minutes | 17 (8.8%) | 18 (9.0%) |
| 35 to 39 Minutes | 0 (0.0%) | 0 (0.0%) |
| 40 to 44 Minutes | 0 (0.0%) | 0 (0.0%) |
| 45 to 59 Minutes | 0 (0.0%) | 0 (0.0%) |
| 60 to 89 Minutes | 0 (0.0%) | 11 (5.5%) |
| 90 or more Minutes | 53 (27.5%) | 0 (0.0%) |
Time of Departure to Work by Sex in Grand Isle
The most frequent times of departure to work in Grand Isle are 12:00 AM to 4:59 AM (50, 25.9%) for males and 7:00 AM to 7:29 AM (36, 18.0%) for females.
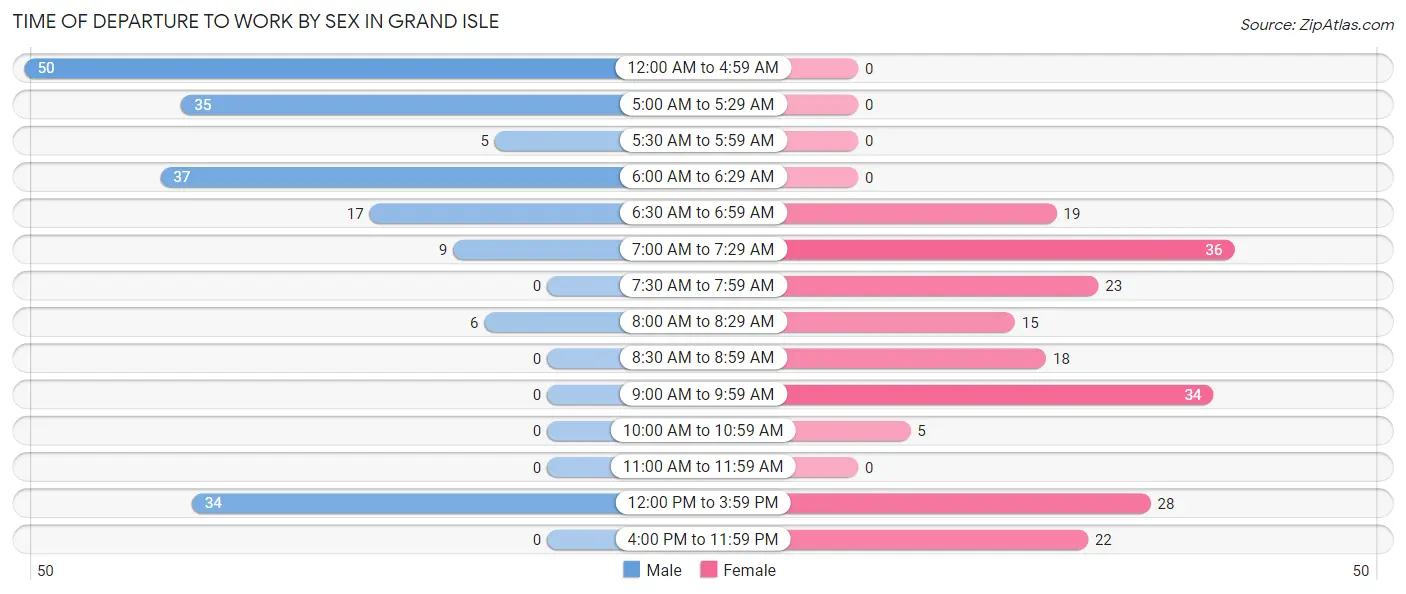
| Time of Departure | Male | Female |
| 12:00 AM to 4:59 AM | 50 (25.9%) | 0 (0.0%) |
| 5:00 AM to 5:29 AM | 35 (18.1%) | 0 (0.0%) |
| 5:30 AM to 5:59 AM | 5 (2.6%) | 0 (0.0%) |
| 6:00 AM to 6:29 AM | 37 (19.2%) | 0 (0.0%) |
| 6:30 AM to 6:59 AM | 17 (8.8%) | 19 (9.5%) |
| 7:00 AM to 7:29 AM | 9 (4.7%) | 36 (18.0%) |
| 7:30 AM to 7:59 AM | 0 (0.0%) | 23 (11.5%) |
| 8:00 AM to 8:29 AM | 6 (3.1%) | 15 (7.5%) |
| 8:30 AM to 8:59 AM | 0 (0.0%) | 18 (9.0%) |
| 9:00 AM to 9:59 AM | 0 (0.0%) | 34 (17.0%) |
| 10:00 AM to 10:59 AM | 0 (0.0%) | 5 (2.5%) |
| 11:00 AM to 11:59 AM | 0 (0.0%) | 0 (0.0%) |
| 12:00 PM to 3:59 PM | 34 (17.6%) | 28 (14.0%) |
| 4:00 PM to 11:59 PM | 0 (0.0%) | 22 (11.0%) |
| Total | 193 (100.0%) | 200 (100.0%) |
Housing Occupancy in Grand Isle
Occupancy by Ownership in Grand Isle
Of the total 420 dwellings in Grand Isle, owner-occupied units account for 304 (72.4%), while renter-occupied units make up 116 (27.6%).
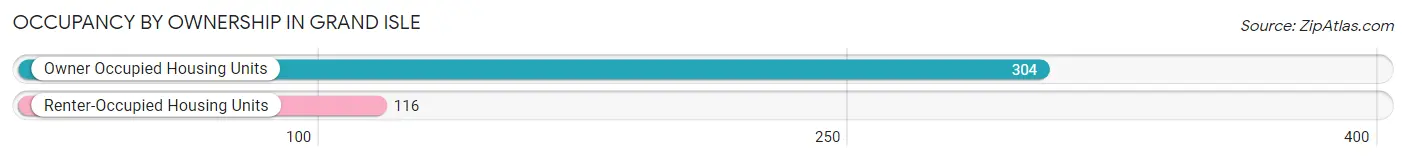
| Occupancy | # Housing Units | % Housing Units |
| Owner Occupied Housing Units | 304 | 72.4% |
| Renter-Occupied Housing Units | 116 | 27.6% |
| Total Occupied Housing Units | 420 | 100.0% |
Occupancy by Household Size in Grand Isle
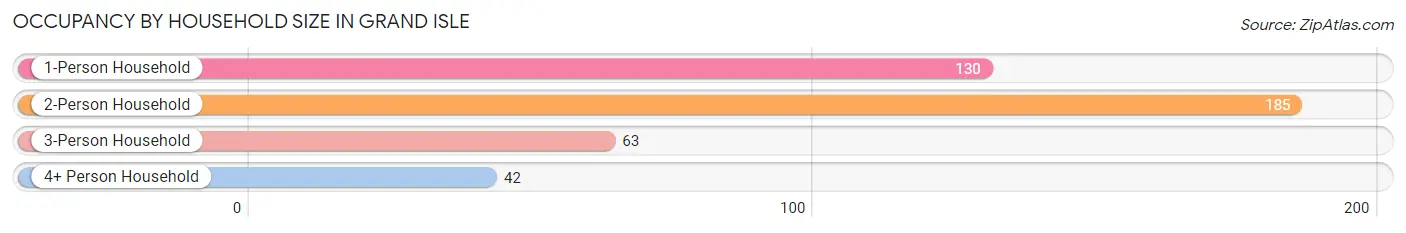
| Household Size | # Housing Units | % Housing Units |
| 1-Person Household | 130 | 30.9% |
| 2-Person Household | 185 | 44.1% |
| 3-Person Household | 63 | 15.0% |
| 4+ Person Household | 42 | 10.0% |
| Total Housing Units | 420 | 100.0% |
Occupancy by Ownership by Household Size in Grand Isle
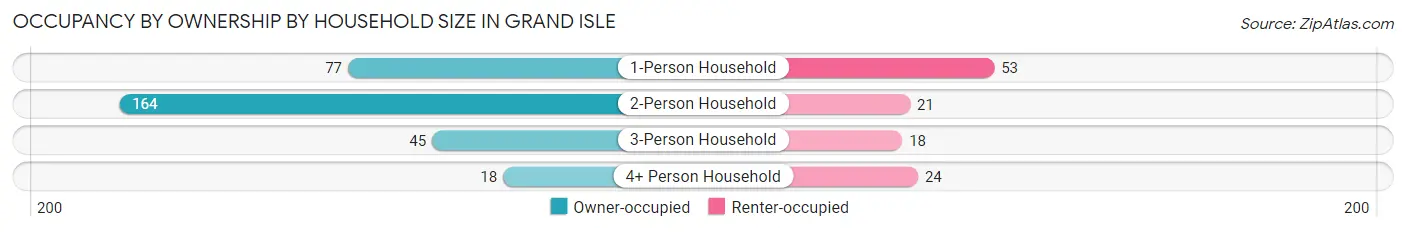
| Household Size | Owner-occupied | Renter-occupied |
| 1-Person Household | 77 (59.2%) | 53 (40.8%) |
| 2-Person Household | 164 (88.6%) | 21 (11.4%) |
| 3-Person Household | 45 (71.4%) | 18 (28.6%) |
| 4+ Person Household | 18 (42.9%) | 24 (57.1%) |
| Total Housing Units | 304 (72.4%) | 116 (27.6%) |
Occupancy by Educational Attainment in Grand Isle
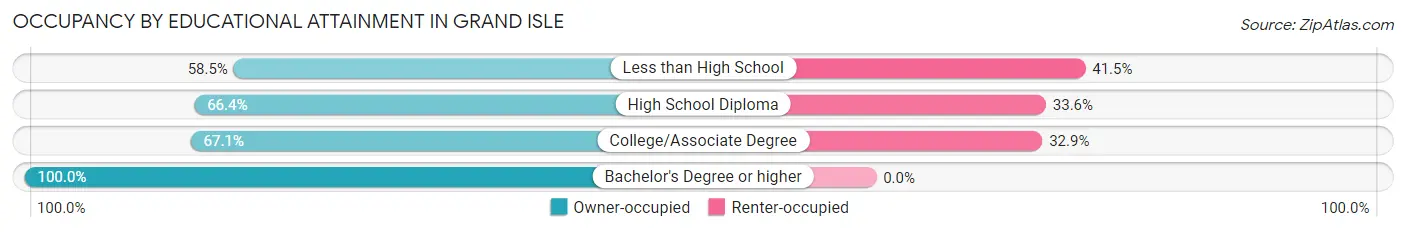
| Household Size | Owner-occupied | Renter-occupied |
| Less than High School | 24 (58.5%) | 17 (41.5%) |
| High School Diploma | 142 (66.4%) | 72 (33.6%) |
| College/Associate Degree | 55 (67.1%) | 27 (32.9%) |
| Bachelor's Degree or higher | 83 (100.0%) | 0 (0.0%) |
Occupancy by Age of Householder in Grand Isle
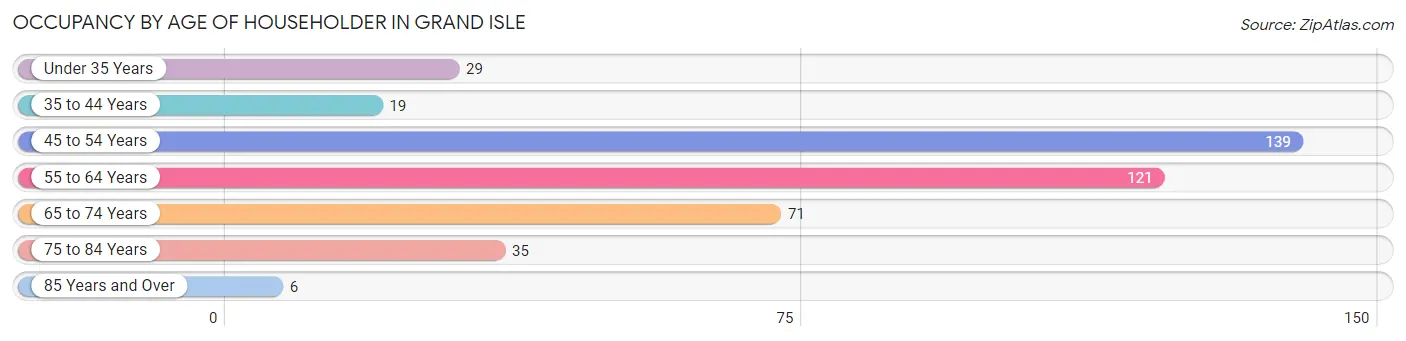
| Age Bracket | # Households | % Households |
| Under 35 Years | 29 | 6.9% |
| 35 to 44 Years | 19 | 4.5% |
| 45 to 54 Years | 139 | 33.1% |
| 55 to 64 Years | 121 | 28.8% |
| 65 to 74 Years | 71 | 16.9% |
| 75 to 84 Years | 35 | 8.3% |
| 85 Years and Over | 6 | 1.4% |
| Total | 420 | 100.0% |
Housing Finances in Grand Isle
Median Income by Occupancy in Grand Isle
| Occupancy Type | # Households | Median Income |
| Owner-Occupied | 304 (72.4%) | $0 |
| Renter-Occupied | 116 (27.6%) | $0 |
| Average | 420 (100.0%) | $0 |
Occupancy by Householder Income Bracket in Grand Isle
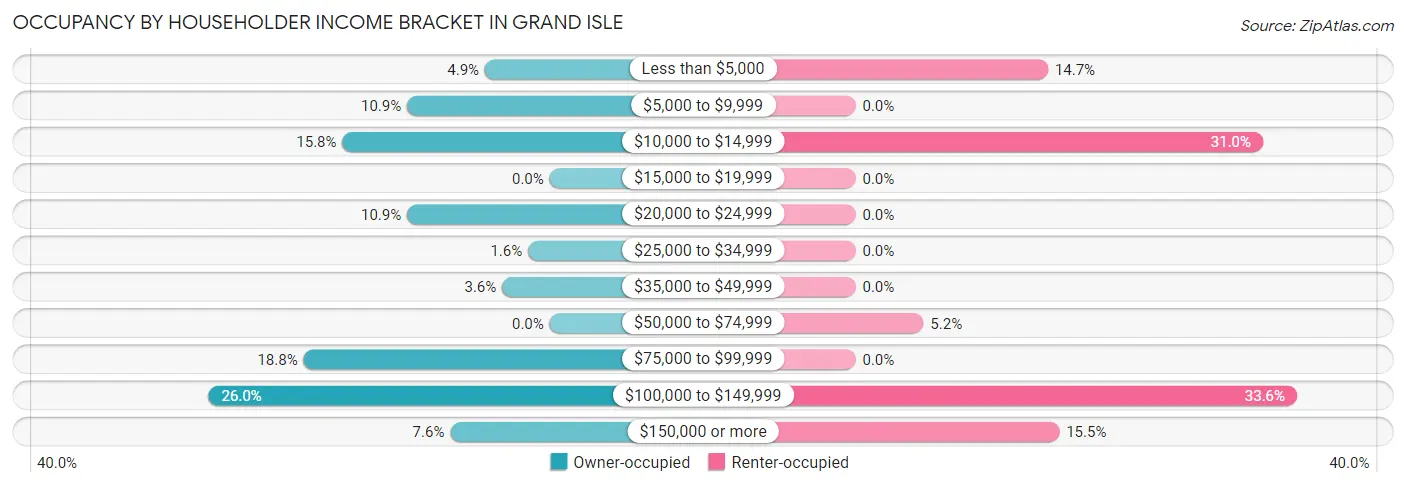
| Income Bracket | Owner-occupied | Renter-occupied |
| Less than $5,000 | 15 (4.9%) | 17 (14.7%) |
| $5,000 to $9,999 | 33 (10.9%) | 0 (0.0%) |
| $10,000 to $14,999 | 48 (15.8%) | 36 (31.0%) |
| $15,000 to $19,999 | 0 (0.0%) | 0 (0.0%) |
| $20,000 to $24,999 | 33 (10.9%) | 0 (0.0%) |
| $25,000 to $34,999 | 5 (1.6%) | 0 (0.0%) |
| $35,000 to $49,999 | 11 (3.6%) | 0 (0.0%) |
| $50,000 to $74,999 | 0 (0.0%) | 6 (5.2%) |
| $75,000 to $99,999 | 57 (18.8%) | 0 (0.0%) |
| $100,000 to $149,999 | 79 (26.0%) | 39 (33.6%) |
| $150,000 or more | 23 (7.6%) | 18 (15.5%) |
| Total | 304 (100.0%) | 116 (100.0%) |
Monthly Housing Cost Tiers in Grand Isle
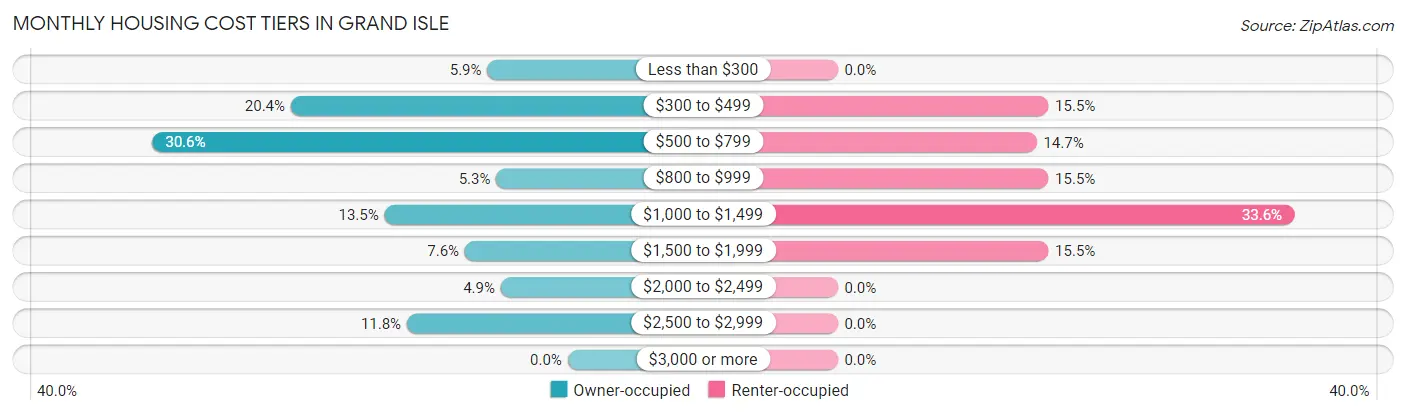
| Monthly Cost | Owner-occupied | Renter-occupied |
| Less than $300 | 18 (5.9%) | 0 (0.0%) |
| $300 to $499 | 62 (20.4%) | 18 (15.5%) |
| $500 to $799 | 93 (30.6%) | 17 (14.7%) |
| $800 to $999 | 16 (5.3%) | 18 (15.5%) |
| $1,000 to $1,499 | 41 (13.5%) | 39 (33.6%) |
| $1,500 to $1,999 | 23 (7.6%) | 18 (15.5%) |
| $2,000 to $2,499 | 15 (4.9%) | 0 (0.0%) |
| $2,500 to $2,999 | 36 (11.8%) | 0 (0.0%) |
| $3,000 or more | 0 (0.0%) | 0 (0.0%) |
| Total | 304 (100.0%) | 116 (100.0%) |
Physical Housing Characteristics in Grand Isle
Housing Structures in Grand Isle
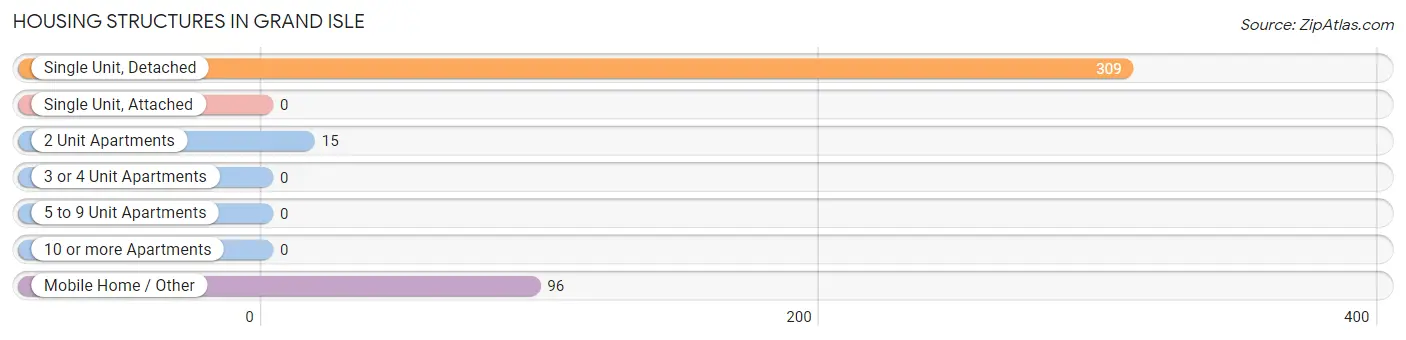
| Structure Type | # Housing Units | % Housing Units |
| Single Unit, Detached | 309 | 73.6% |
| Single Unit, Attached | 0 | 0.0% |
| 2 Unit Apartments | 15 | 3.6% |
| 3 or 4 Unit Apartments | 0 | 0.0% |
| 5 to 9 Unit Apartments | 0 | 0.0% |
| 10 or more Apartments | 0 | 0.0% |
| Mobile Home / Other | 96 | 22.9% |
| Total | 420 | 100.0% |
Housing Structures by Occupancy in Grand Isle
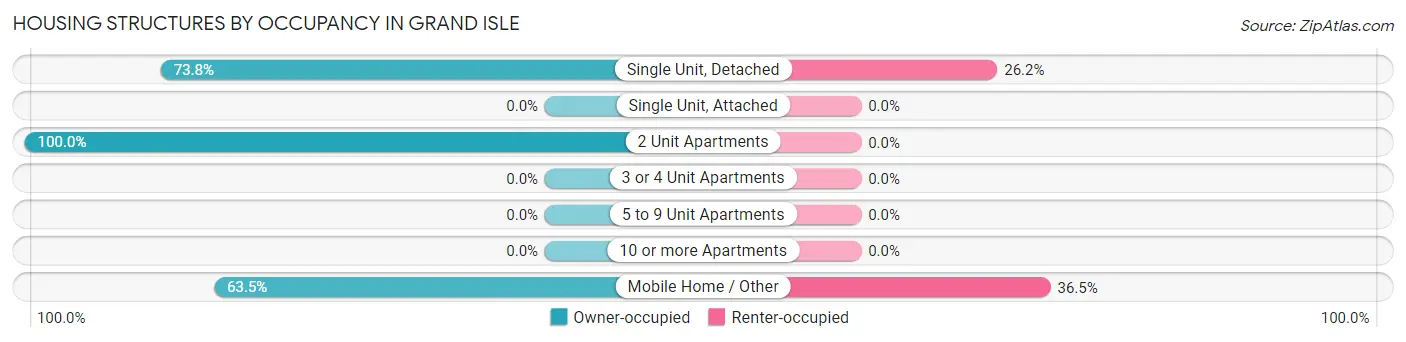
| Structure Type | Owner-occupied | Renter-occupied |
| Single Unit, Detached | 228 (73.8%) | 81 (26.2%) |
| Single Unit, Attached | 0 (0.0%) | 0 (0.0%) |
| 2 Unit Apartments | 15 (100.0%) | 0 (0.0%) |
| 3 or 4 Unit Apartments | 0 (0.0%) | 0 (0.0%) |
| 5 to 9 Unit Apartments | 0 (0.0%) | 0 (0.0%) |
| 10 or more Apartments | 0 (0.0%) | 0 (0.0%) |
| Mobile Home / Other | 61 (63.5%) | 35 (36.5%) |
| Total | 304 (72.4%) | 116 (27.6%) |
Housing Structures by Number of Rooms in Grand Isle
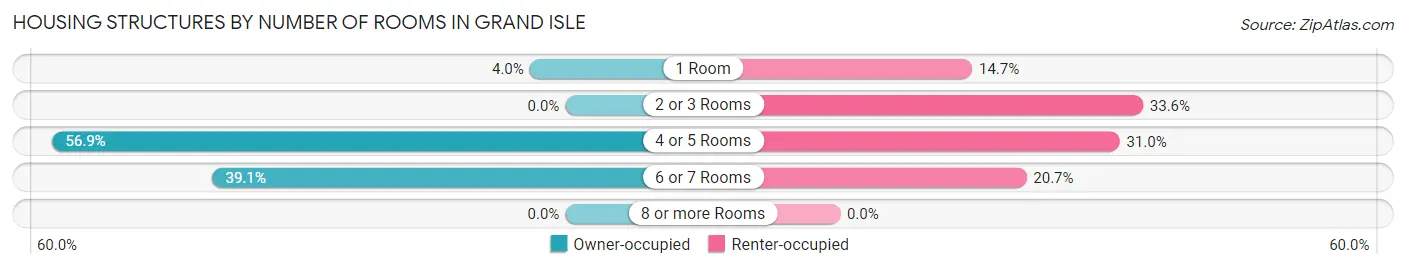
| Number of Rooms | Owner-occupied | Renter-occupied |
| 1 Room | 12 (4.0%) | 17 (14.7%) |
| 2 or 3 Rooms | 0 (0.0%) | 39 (33.6%) |
| 4 or 5 Rooms | 173 (56.9%) | 36 (31.0%) |
| 6 or 7 Rooms | 119 (39.1%) | 24 (20.7%) |
| 8 or more Rooms | 0 (0.0%) | 0 (0.0%) |
| Total | 304 (100.0%) | 116 (100.0%) |
Housing Structure by Heating Type in Grand Isle
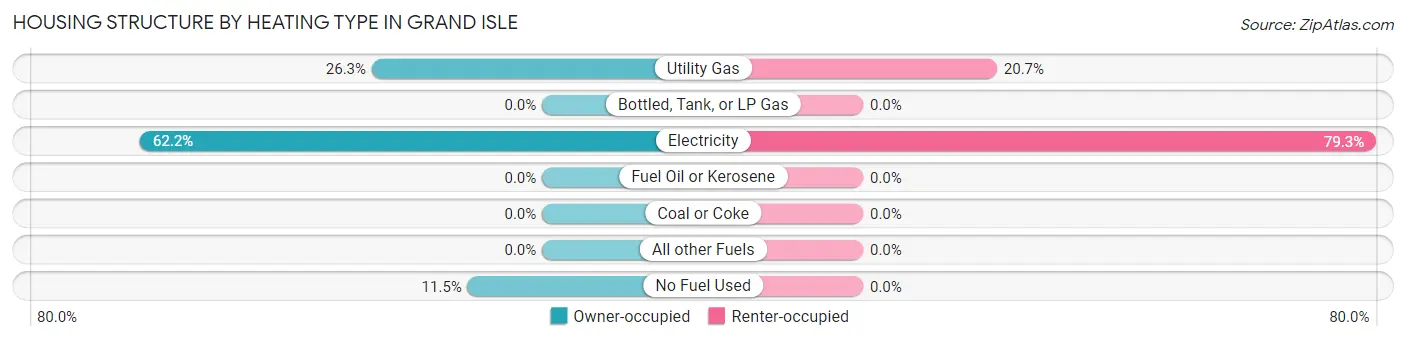
| Heating Type | Owner-occupied | Renter-occupied |
| Utility Gas | 80 (26.3%) | 24 (20.7%) |
| Bottled, Tank, or LP Gas | 0 (0.0%) | 0 (0.0%) |
| Electricity | 189 (62.2%) | 92 (79.3%) |
| Fuel Oil or Kerosene | 0 (0.0%) | 0 (0.0%) |
| Coal or Coke | 0 (0.0%) | 0 (0.0%) |
| All other Fuels | 0 (0.0%) | 0 (0.0%) |
| No Fuel Used | 35 (11.5%) | 0 (0.0%) |
| Total | 304 (100.0%) | 116 (100.0%) |
Household Vehicle Usage in Grand Isle
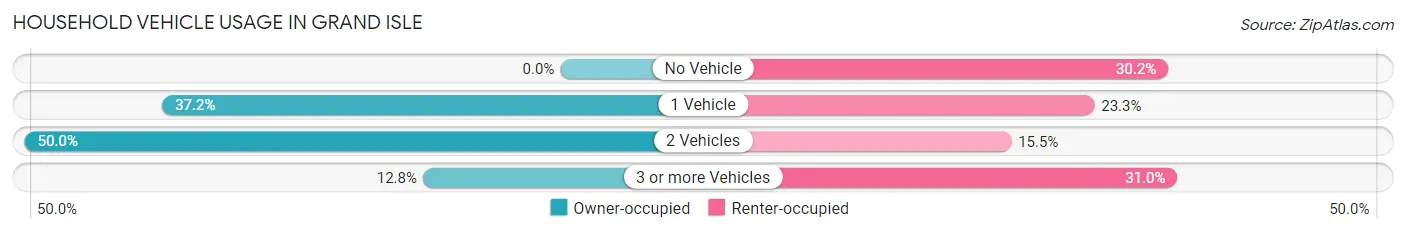
| Vehicles per Household | Owner-occupied | Renter-occupied |
| No Vehicle | 0 (0.0%) | 35 (30.2%) |
| 1 Vehicle | 113 (37.2%) | 27 (23.3%) |
| 2 Vehicles | 152 (50.0%) | 18 (15.5%) |
| 3 or more Vehicles | 39 (12.8%) | 36 (31.0%) |
| Total | 304 (100.0%) | 116 (100.0%) |
Real Estate & Mortgages in Grand Isle
Real Estate and Mortgage Overview in Grand Isle
| Characteristic | Without Mortgage | With Mortgage |
| Housing Units | 177 | 127 |
| Median Property Value | $233,100 | $284,800 |
| Median Household Income | $20,662 | $23 |
| Monthly Housing Costs | $530 | $0 |
| Real Estate Taxes | $2,066 | $0 |
Property Value by Mortgage Status in Grand Isle
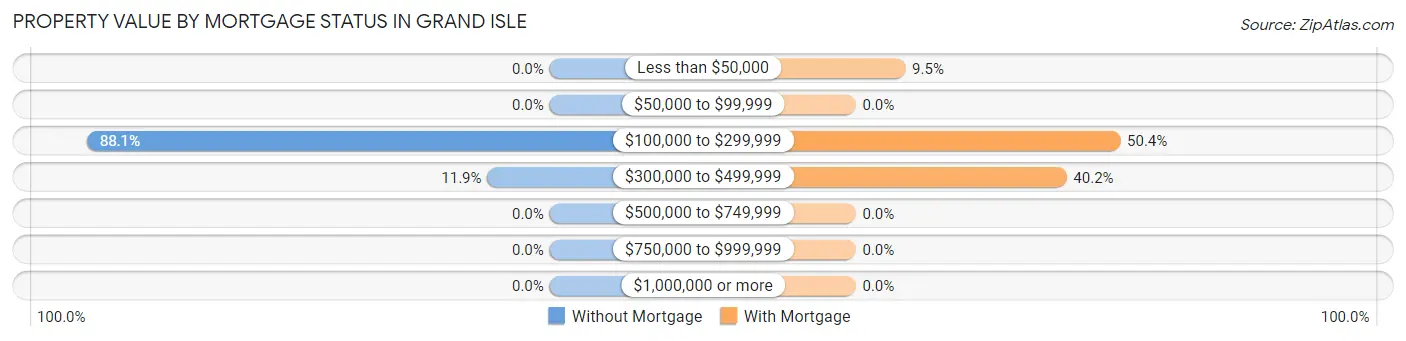
| Property Value | Without Mortgage | With Mortgage |
| Less than $50,000 | 0 (0.0%) | 12 (9.5%) |
| $50,000 to $99,999 | 0 (0.0%) | 0 (0.0%) |
| $100,000 to $299,999 | 156 (88.1%) | 64 (50.4%) |
| $300,000 to $499,999 | 21 (11.9%) | 51 (40.2%) |
| $500,000 to $749,999 | 0 (0.0%) | 0 (0.0%) |
| $750,000 to $999,999 | 0 (0.0%) | 0 (0.0%) |
| $1,000,000 or more | 0 (0.0%) | 0 (0.0%) |
| Total | 177 (100.0%) | 127 (100.0%) |
Household Income by Mortgage Status in Grand Isle
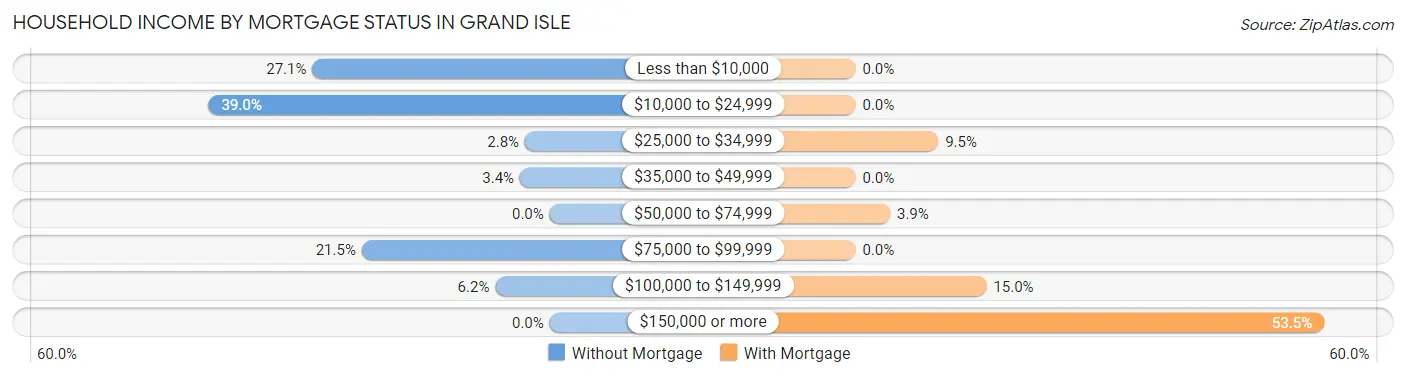
| Household Income | Without Mortgage | With Mortgage |
| Less than $10,000 | 48 (27.1%) | 0 (0.0%) |
| $10,000 to $24,999 | 69 (39.0%) | 0 (0.0%) |
| $25,000 to $34,999 | 5 (2.8%) | 12 (9.5%) |
| $35,000 to $49,999 | 6 (3.4%) | 0 (0.0%) |
| $50,000 to $74,999 | 0 (0.0%) | 5 (3.9%) |
| $75,000 to $99,999 | 38 (21.5%) | 0 (0.0%) |
| $100,000 to $149,999 | 11 (6.2%) | 19 (15.0%) |
| $150,000 or more | 0 (0.0%) | 68 (53.5%) |
| Total | 177 (100.0%) | 127 (100.0%) |
Property Value to Household Income Ratio in Grand Isle
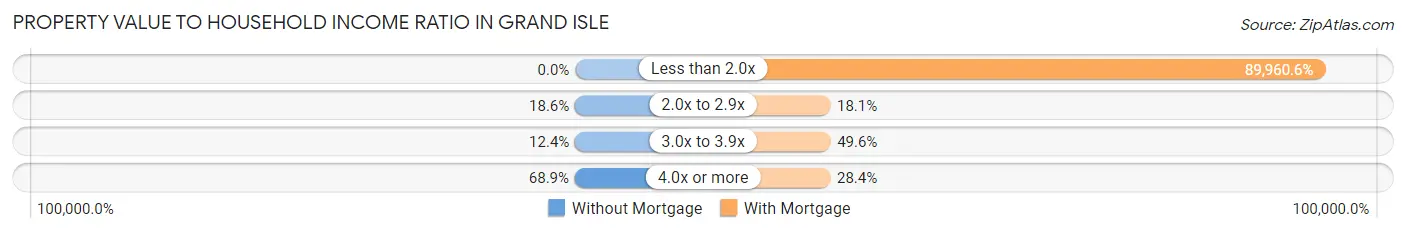
| Value-to-Income Ratio | Without Mortgage | With Mortgage |
| Less than 2.0x | 0 (0.0%) | 114,250 (89,960.6%) |
| 2.0x to 2.9x | 33 (18.6%) | 23 (18.1%) |
| 3.0x to 3.9x | 22 (12.4%) | 63 (49.6%) |
| 4.0x or more | 122 (68.9%) | 36 (28.3%) |
| Total | 177 (100.0%) | 127 (100.0%) |
Real Estate Taxes by Mortgage Status in Grand Isle
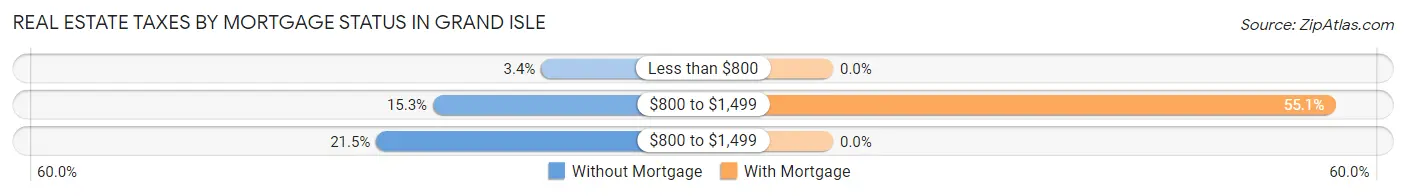
| Property Taxes | Without Mortgage | With Mortgage |
| Less than $800 | 6 (3.4%) | 0 (0.0%) |
| $800 to $1,499 | 27 (15.2%) | 70 (55.1%) |
| $800 to $1,499 | 38 (21.5%) | 0 (0.0%) |
| Total | 177 (100.0%) | 127 (100.0%) |
Health & Disability in Grand Isle
Health Insurance Coverage by Age in Grand Isle
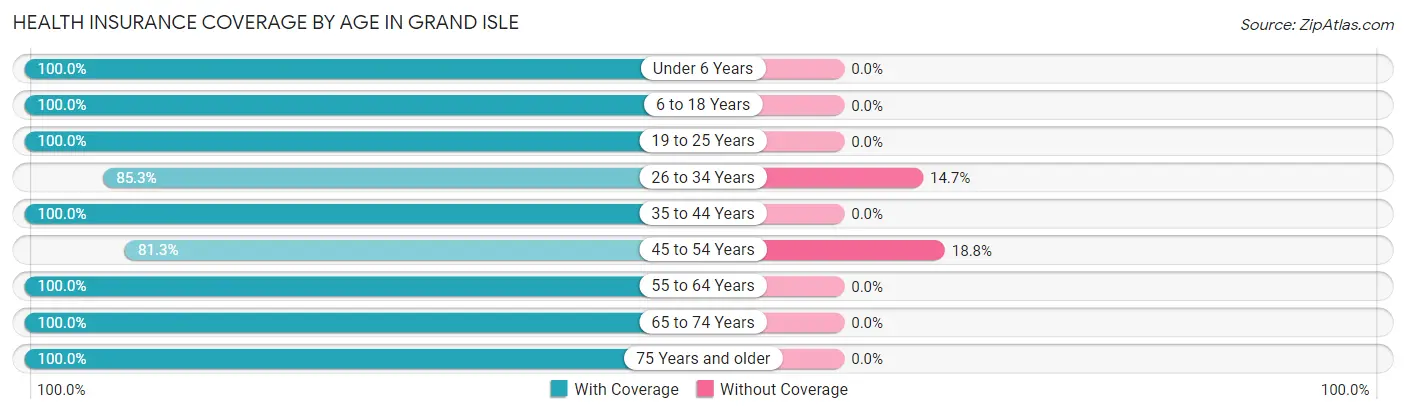
| Age Bracket | With Coverage | Without Coverage |
| Under 6 Years | 54 (100.0%) | 0 (0.0%) |
| 6 to 18 Years | 114 (100.0%) | 0 (0.0%) |
| 19 to 25 Years | 25 (100.0%) | 0 (0.0%) |
| 26 to 34 Years | 93 (85.3%) | 16 (14.7%) |
| 35 to 44 Years | 26 (100.0%) | 0 (0.0%) |
| 45 to 54 Years | 182 (81.2%) | 42 (18.8%) |
| 55 to 64 Years | 166 (100.0%) | 0 (0.0%) |
| 65 to 74 Years | 105 (100.0%) | 0 (0.0%) |
| 75 Years and older | 61 (100.0%) | 0 (0.0%) |
| Total | 826 (93.4%) | 58 (6.6%) |
Health Insurance Coverage by Citizenship Status in Grand Isle
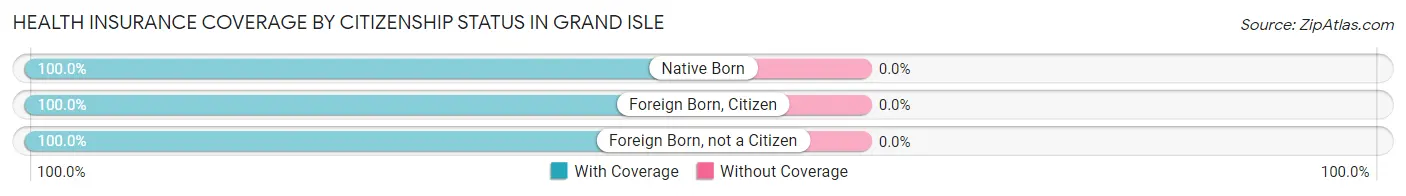
| Citizenship Status | With Coverage | Without Coverage |
| Native Born | 54 (100.0%) | 0 (0.0%) |
| Foreign Born, Citizen | 114 (100.0%) | 0 (0.0%) |
| Foreign Born, not a Citizen | 25 (100.0%) | 0 (0.0%) |
Health Insurance Coverage by Household Income in Grand Isle
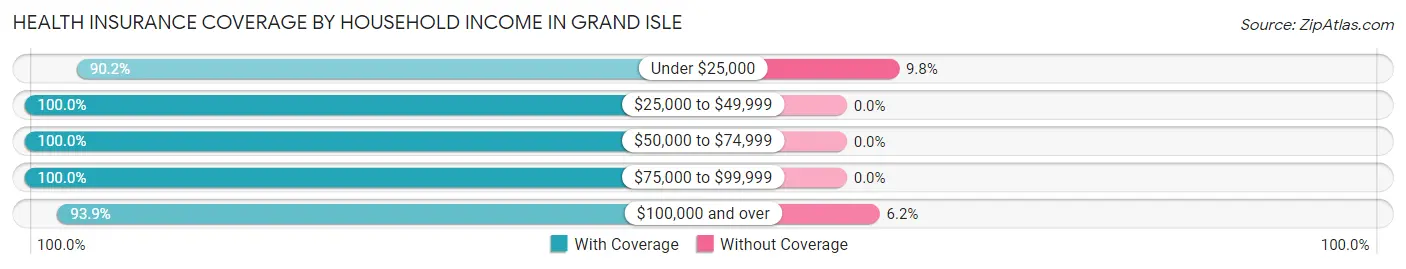
| Household Income | With Coverage | Without Coverage |
| Under $25,000 | 323 (90.2%) | 35 (9.8%) |
| $25,000 to $49,999 | 21 (100.0%) | 0 (0.0%) |
| $50,000 to $74,999 | 17 (100.0%) | 0 (0.0%) |
| $75,000 to $99,999 | 114 (100.0%) | 0 (0.0%) |
| $100,000 and over | 351 (93.9%) | 23 (6.1%) |
Public vs Private Health Insurance Coverage by Age in Grand Isle
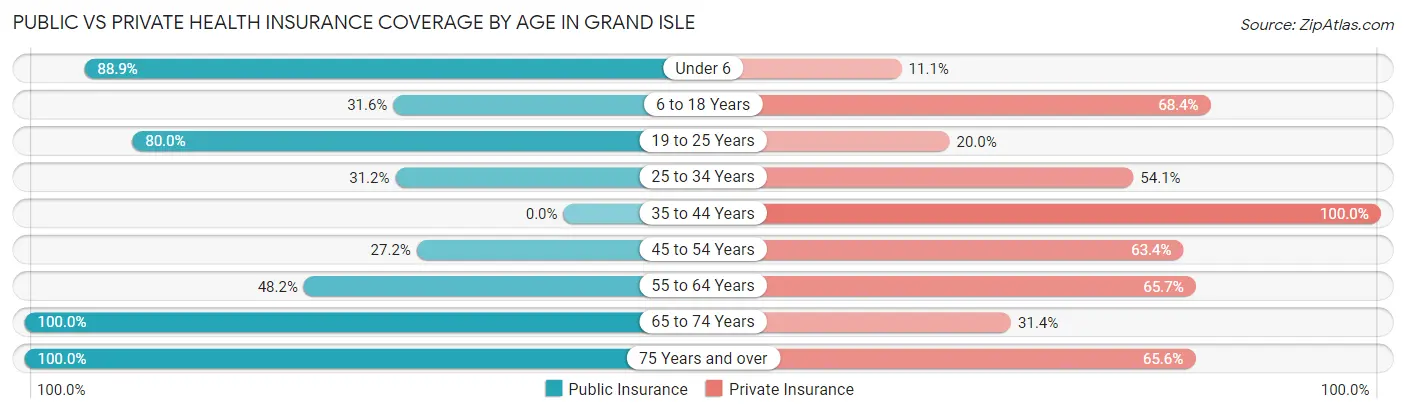
| Age Bracket | Public Insurance | Private Insurance |
| Under 6 | 48 (88.9%) | 6 (11.1%) |
| 6 to 18 Years | 36 (31.6%) | 78 (68.4%) |
| 19 to 25 Years | 20 (80.0%) | 5 (20.0%) |
| 25 to 34 Years | 34 (31.2%) | 59 (54.1%) |
| 35 to 44 Years | 0 (0.0%) | 26 (100.0%) |
| 45 to 54 Years | 61 (27.2%) | 142 (63.4%) |
| 55 to 64 Years | 80 (48.2%) | 109 (65.7%) |
| 65 to 74 Years | 105 (100.0%) | 33 (31.4%) |
| 75 Years and over | 61 (100.0%) | 40 (65.6%) |
| Total | 445 (50.3%) | 498 (56.3%) |
Disability Status by Sex by Age in Grand Isle
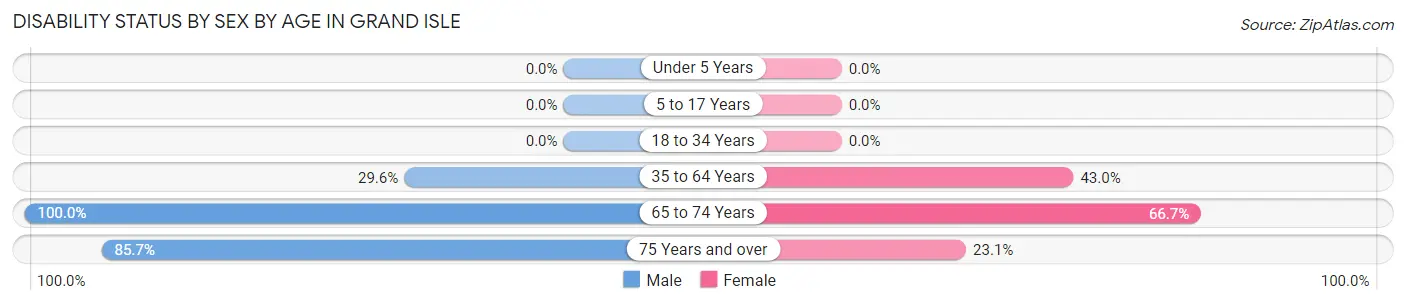
| Age Bracket | Male | Female |
| Under 5 Years | 0 (0.0%) | 0 (0.0%) |
| 5 to 17 Years | 0 (0.0%) | 0 (0.0%) |
| 18 to 34 Years | 0 (0.0%) | 0 (0.0%) |
| 35 to 64 Years | 68 (29.6%) | 80 (43.0%) |
| 65 to 74 Years | 57 (100.0%) | 32 (66.7%) |
| 75 Years and over | 30 (85.7%) | 6 (23.1%) |
Disability Class by Sex by Age in Grand Isle
Disability Class: Hearing Difficulty
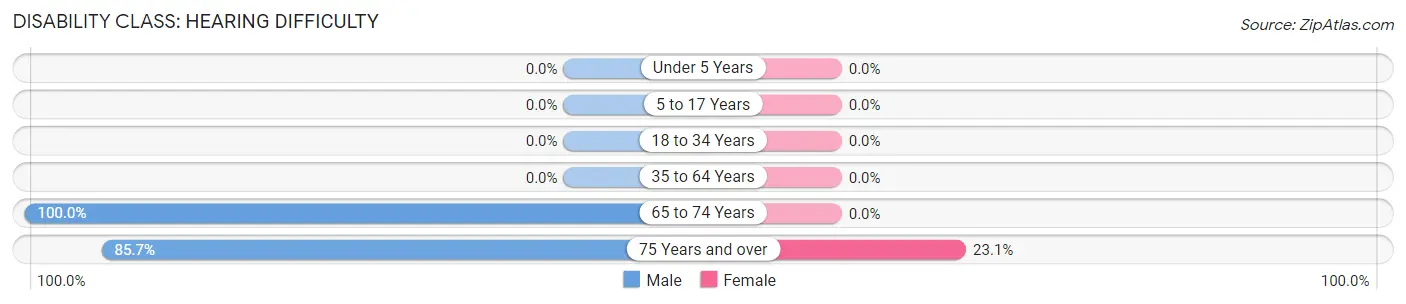
| Age Bracket | Male | Female |
| Under 5 Years | 0 (0.0%) | 0 (0.0%) |
| 5 to 17 Years | 0 (0.0%) | 0 (0.0%) |
| 18 to 34 Years | 0 (0.0%) | 0 (0.0%) |
| 35 to 64 Years | 0 (0.0%) | 0 (0.0%) |
| 65 to 74 Years | 57 (100.0%) | 0 (0.0%) |
| 75 Years and over | 30 (85.7%) | 6 (23.1%) |
Disability Class: Vision Difficulty
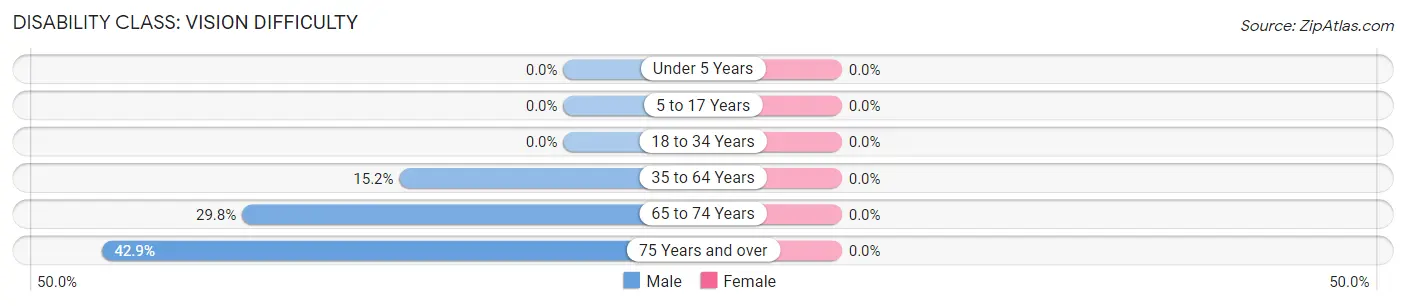
| Age Bracket | Male | Female |
| Under 5 Years | 0 (0.0%) | 0 (0.0%) |
| 5 to 17 Years | 0 (0.0%) | 0 (0.0%) |
| 18 to 34 Years | 0 (0.0%) | 0 (0.0%) |
| 35 to 64 Years | 35 (15.2%) | 0 (0.0%) |
| 65 to 74 Years | 17 (29.8%) | 0 (0.0%) |
| 75 Years and over | 15 (42.9%) | 0 (0.0%) |
Disability Class: Cognitive Difficulty
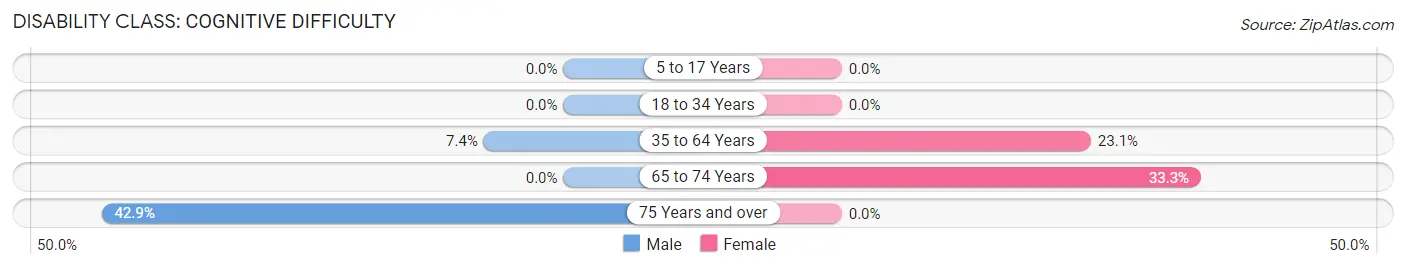
| Age Bracket | Male | Female |
| 5 to 17 Years | 0 (0.0%) | 0 (0.0%) |
| 18 to 34 Years | 0 (0.0%) | 0 (0.0%) |
| 35 to 64 Years | 17 (7.4%) | 43 (23.1%) |
| 65 to 74 Years | 0 (0.0%) | 16 (33.3%) |
| 75 Years and over | 15 (42.9%) | 0 (0.0%) |
Disability Class: Ambulatory Difficulty
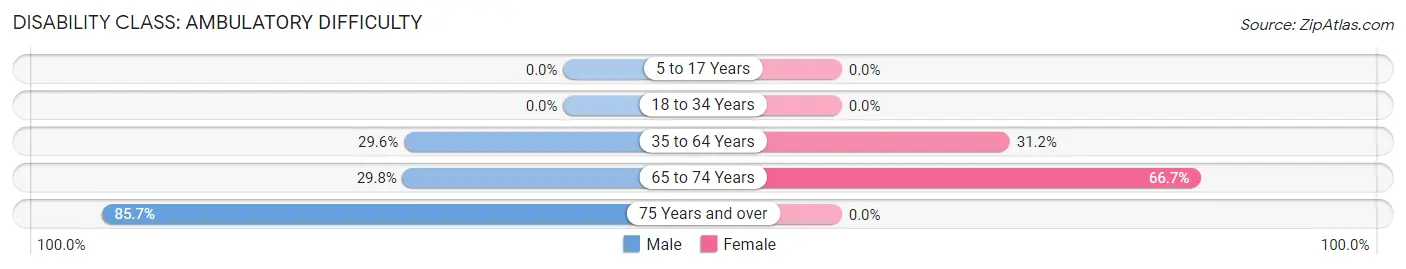
| Age Bracket | Male | Female |
| 5 to 17 Years | 0 (0.0%) | 0 (0.0%) |
| 18 to 34 Years | 0 (0.0%) | 0 (0.0%) |
| 35 to 64 Years | 68 (29.6%) | 58 (31.2%) |
| 65 to 74 Years | 17 (29.8%) | 32 (66.7%) |
| 75 Years and over | 30 (85.7%) | 0 (0.0%) |
Disability Class: Self-Care Difficulty
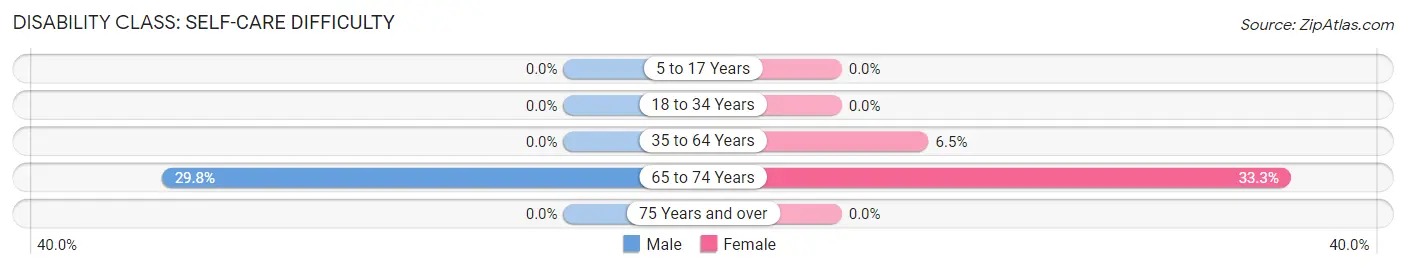
| Age Bracket | Male | Female |
| 5 to 17 Years | 0 (0.0%) | 0 (0.0%) |
| 18 to 34 Years | 0 (0.0%) | 0 (0.0%) |
| 35 to 64 Years | 0 (0.0%) | 12 (6.5%) |
| 65 to 74 Years | 17 (29.8%) | 16 (33.3%) |
| 75 Years and over | 0 (0.0%) | 0 (0.0%) |
Technology Access in Grand Isle
Computing Device Access in Grand Isle
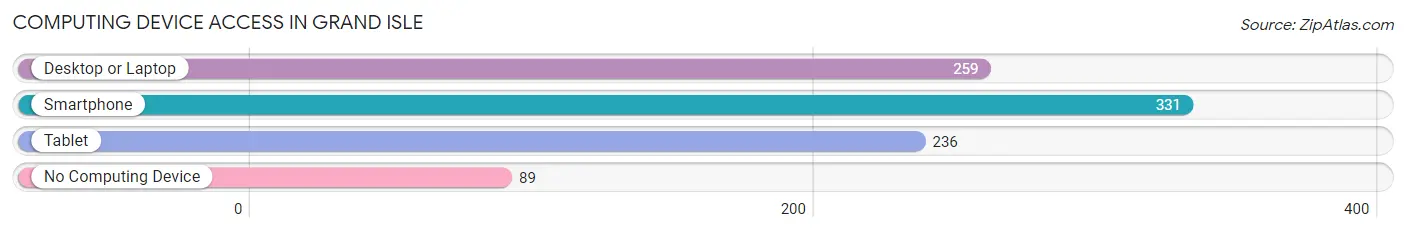
| Device Type | # Households | % Households |
| Desktop or Laptop | 259 | 61.7% |
| Smartphone | 331 | 78.8% |
| Tablet | 236 | 56.2% |
| No Computing Device | 89 | 21.2% |
| Total | 420 | 100.0% |
Internet Access in Grand Isle
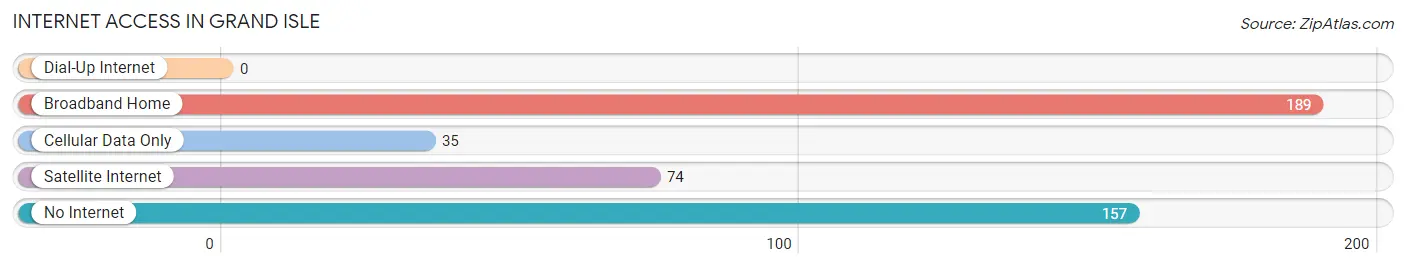
| Internet Type | # Households | % Households |
| Dial-Up Internet | 0 | 0.0% |
| Broadband Home | 189 | 45.0% |
| Cellular Data Only | 35 | 8.3% |
| Satellite Internet | 74 | 17.6% |
| No Internet | 157 | 37.4% |
| Total | 420 | 100.0% |
Grand Isle Summary
Geography
Geographically, Grand Isle is located in the Gulf of Mexico, off the coast of Louisiana. It is the only inhabited barrier island in the state, and is located in Jefferson Parish. The island is approximately 8 miles long and 1 mile wide, and is connected to the mainland by a bridge. The island is surrounded by the Gulf of Mexico to the south, Barataria Bay to the east, and Caminada Bay to the west. The island is composed of sand and marshland, and is home to a variety of wildlife, including birds, fish, and reptiles.
History
Grand Isle has a long and rich history, dating back to the early 1700s. The island was originally inhabited by Native Americans, who used it as a fishing and hunting ground. In the late 1700s, the island was settled by French and Spanish settlers, who established a fishing village. In the early 1800s, the island was used as a base for the smuggling of slaves from Africa. During the Civil War, the island was used as a base for Confederate forces. After the war, the island was used as a base for the fishing industry, and in the late 1800s, the island was developed as a resort destination.
In the early 1900s, the island was used as a base for the oil and gas industry, and in the 1950s, the island was developed as a tourist destination. In the late 1970s, the island was developed as a residential community, and today, it is a popular destination for fishing, boating, and other recreational activities.
Economy
Grand Isle’s economy is largely based on tourism and fishing. The island is home to a variety of restaurants, hotels, and other businesses that cater to tourists. The island is also home to a number of marinas, which provide services for recreational boaters. Fishing is also an important part of the island’s economy, and the island is home to a number of commercial fishing operations.
Demographics
As of the 2010 census, Grand Isle had a population of 1,296. The population is largely composed of white (90.2%) and Hispanic (7.2%) residents. The median household income is $45,000, and the median age is 44. The island is home to a variety of religious denominations, including Catholic (45.2%), Baptist (25.2%), and Methodist (7.2%).
Conclusion
Grand Isle is a small island located off the coast of Louisiana in the Gulf of Mexico. The island has a long and rich history, and is home to a variety of wildlife. The island’s economy is largely based on tourism and fishing, and the population is largely composed of white and Hispanic residents. Grand Isle is a popular destination for fishing, boating, and other recreational activities, and is an important part of the local economy.
Common Questions
What is Per Capita Income in Grand Isle?
Per Capita income in Grand Isle is $31,595.
What is the Median Family Income in Grand Isle?
Median Family Income in Grand Isle is $100,833.
What is Inequality or Gini Index in Grand Isle?
Inequality or Gini Index in Grand Isle is 0.46.
What is the Total Population of Grand Isle?
Total Population of Grand Isle is 903.
What is the Total Male Population of Grand Isle?
Total Male Population of Grand Isle is 492.
What is the Total Female Population of Grand Isle?
Total Female Population of Grand Isle is 411.
What is the Ratio of Males per 100 Females in Grand Isle?
There are 119.71 Males per 100 Females in Grand Isle.
What is the Ratio of Females per 100 Males in Grand Isle?
There are 83.54 Females per 100 Males in Grand Isle.
What is the Median Population Age in Grand Isle?
Median Population Age in Grand Isle is 51.0 Years.
What is the Average Family Size in Grand Isle
Average Family Size in Grand Isle is 2.4 People.
What is the Average Household Size in Grand Isle
Average Household Size in Grand Isle is 2.1 People.
How Large is the Labor Force in Grand Isle?
There are 419 People in the Labor Forcein in Grand Isle.
What is the Percentage of People in the Labor Force in Grand Isle?
55.6% of People are in the Labor Force in Grand Isle.
What is the Unemployment Rate in Grand Isle?
Unemployment Rate in Grand Isle is 6.3%.