Harahan, LA Map & Demographics
Harahan Map
Harahan Overview
$45,741
PER CAPITA INCOME
$103,750
AVG FAMILY INCOME
$75,099
AVG HOUSEHOLD INCOME
27.4%
WAGE / INCOME GAP [ % ]
72.6¢/ $1
WAGE / INCOME GAP [ $ ]
0.46
INEQUALITY / GINI INDEX
9,043
TOTAL POPULATION
4,050
MALE POPULATION
4,993
FEMALE POPULATION
81.11
MALES / 100 FEMALES
123.28
FEMALES / 100 MALES
47.7
MEDIAN AGE
2.8
AVG FAMILY SIZE
2.2
AVG HOUSEHOLD SIZE
4,827
LABOR FORCE [ PEOPLE ]
61.4%
PERCENT IN LABOR FORCE
2.8%
UNEMPLOYMENT RATE
Income in Harahan
Income Overview in Harahan
Per Capita Income in Harahan is $45,741, while median incomes of families and households are $103,750 and $75,099 respectively.
| Characteristic | Number | Measure |
| Per Capita Income | 9,043 | $45,741 |
| Median Family Income | 2,502 | $103,750 |
| Mean Family Income | 2,502 | $126,137 |
| Median Household Income | 4,085 | $75,099 |
| Mean Household Income | 4,085 | $99,779 |
| Income Deficit | 2,502 | $0 |
| Wage / Income Gap (%) | 9,043 | 27.37% |
| Wage / Income Gap ($) | 9,043 | 72.63¢ per $1 |
| Gini / Inequality Index | 9,043 | 0.46 |
Earnings by Sex in Harahan
Average Earnings in Harahan are $49,148, $57,239 for men and $41,575 for women, a difference of 27.4%.
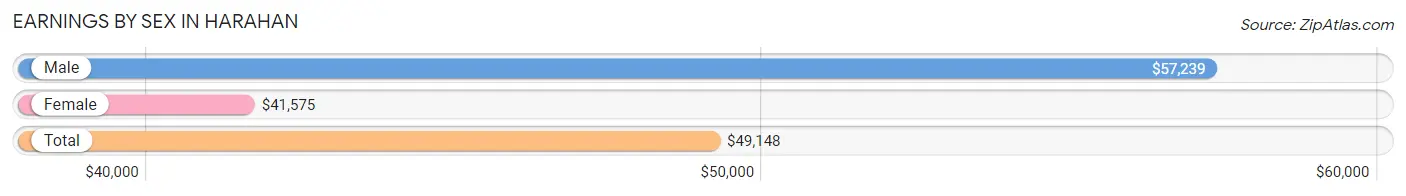
| Sex | Number | Average Earnings |
| Male | 2,359 (47.4%) | $57,239 |
| Female | 2,619 (52.6%) | $41,575 |
| Total | 4,978 (100.0%) | $49,148 |
Earnings by Sex by Income Bracket in Harahan
The most common earnings brackets in Harahan are $100,000+ for men (629 | 26.7%) and $65,000 to $74,999 for women (291 | 11.1%).
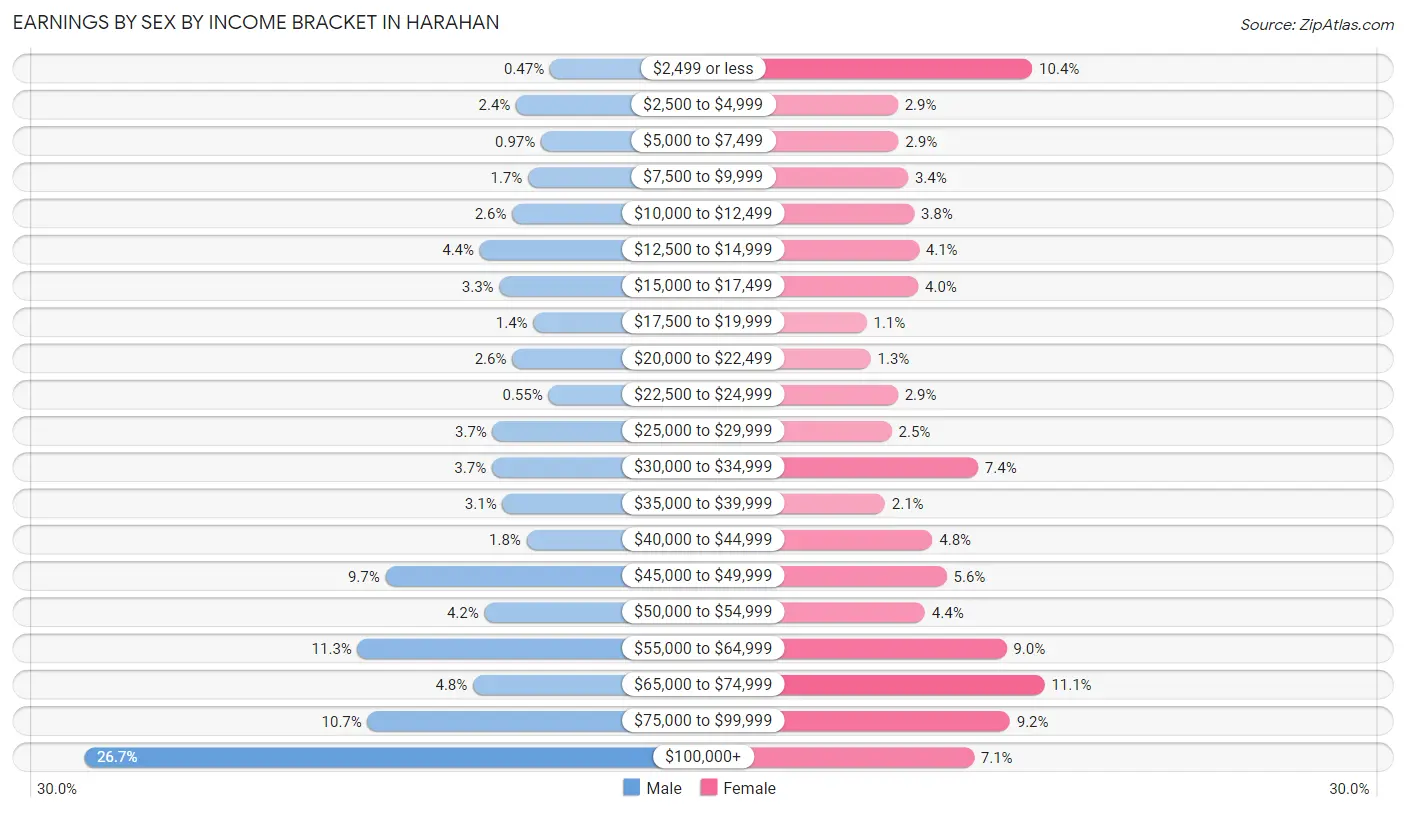
| Income | Male | Female |
| $2,499 or less | 11 (0.5%) | 273 (10.4%) |
| $2,500 to $4,999 | 56 (2.4%) | 75 (2.9%) |
| $5,000 to $7,499 | 23 (1.0%) | 76 (2.9%) |
| $7,500 to $9,999 | 40 (1.7%) | 90 (3.4%) |
| $10,000 to $12,499 | 61 (2.6%) | 99 (3.8%) |
| $12,500 to $14,999 | 104 (4.4%) | 106 (4.1%) |
| $15,000 to $17,499 | 78 (3.3%) | 105 (4.0%) |
| $17,500 to $19,999 | 33 (1.4%) | 29 (1.1%) |
| $20,000 to $22,499 | 61 (2.6%) | 35 (1.3%) |
| $22,500 to $24,999 | 13 (0.5%) | 75 (2.9%) |
| $25,000 to $29,999 | 87 (3.7%) | 66 (2.5%) |
| $30,000 to $34,999 | 88 (3.7%) | 193 (7.4%) |
| $35,000 to $39,999 | 74 (3.1%) | 56 (2.1%) |
| $40,000 to $44,999 | 42 (1.8%) | 126 (4.8%) |
| $45,000 to $49,999 | 229 (9.7%) | 147 (5.6%) |
| $50,000 to $54,999 | 98 (4.2%) | 115 (4.4%) |
| $55,000 to $64,999 | 266 (11.3%) | 235 (9.0%) |
| $65,000 to $74,999 | 113 (4.8%) | 291 (11.1%) |
| $75,000 to $99,999 | 253 (10.7%) | 240 (9.2%) |
| $100,000+ | 629 (26.7%) | 187 (7.1%) |
| Total | 2,359 (100.0%) | 2,619 (100.0%) |
Earnings by Sex by Educational Attainment in Harahan
Average earnings in Harahan are $63,223 for men and $47,658 for women, a difference of 24.6%. Men with an educational attainment of graduate degree enjoy the highest average annual earnings of $107,604, while those with less than high school education earn the least with $44,107. Women with an educational attainment of bachelor's degree earn the most with the average annual earnings of $66,500, while those with less than high school education have the smallest earnings of $27,625.
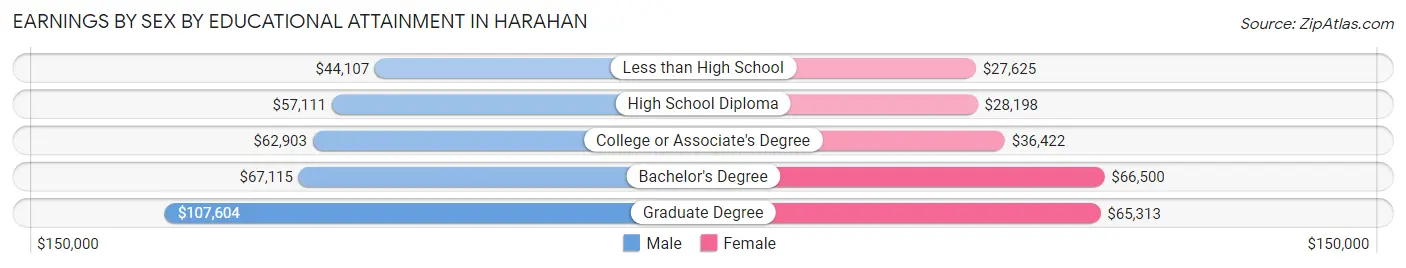
| Educational Attainment | Male Income | Female Income |
| Less than High School | $44,107 | $27,625 |
| High School Diploma | $57,111 | $28,198 |
| College or Associate's Degree | $62,903 | $36,422 |
| Bachelor's Degree | $67,115 | $66,500 |
| Graduate Degree | $107,604 | $65,313 |
| Total | $63,223 | $47,658 |
Family Income in Harahan
Family Income Brackets in Harahan
According to the Harahan family income data, there are 583 families falling into the $100,000 to $149,999 income range, which is the most common income bracket and makes up 23.3% of all families. Conversely, the $15,000 to $24,999 income bracket is the least frequent group with only 15 families (0.6%) belonging to this category.
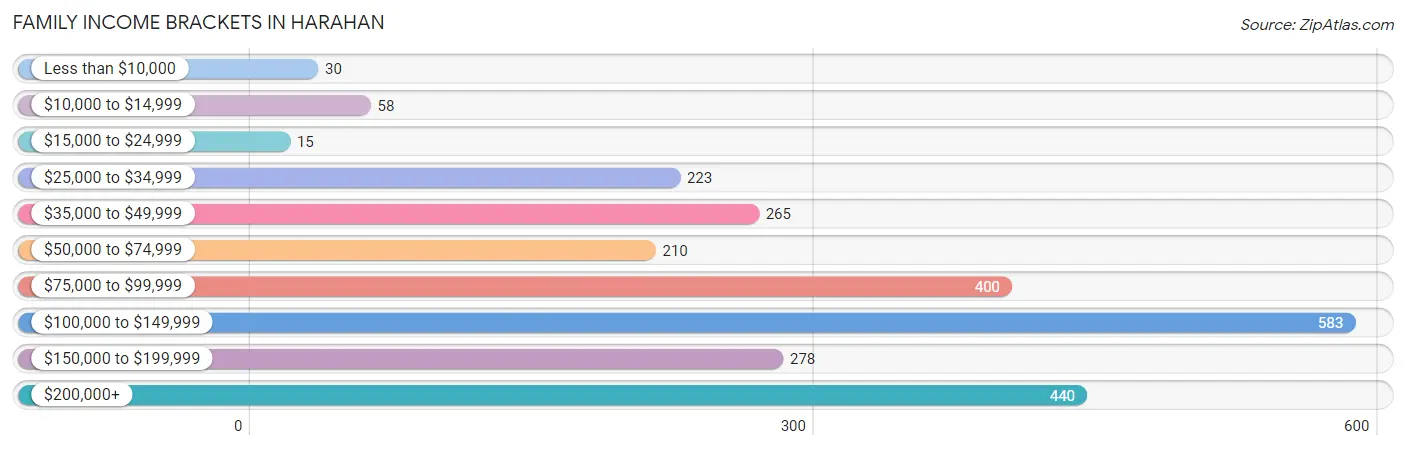
| Income Bracket | # Families | % Families |
| Less than $10,000 | 30 | 1.2% |
| $10,000 to $14,999 | 58 | 2.3% |
| $15,000 to $24,999 | 15 | 0.6% |
| $25,000 to $34,999 | 223 | 8.9% |
| $35,000 to $49,999 | 265 | 10.6% |
| $50,000 to $74,999 | 210 | 8.4% |
| $75,000 to $99,999 | 400 | 16.0% |
| $100,000 to $149,999 | 583 | 23.3% |
| $150,000 to $199,999 | 278 | 11.1% |
| $200,000+ | 440 | 17.6% |
Family Income by Famaliy Size in Harahan
5-person families (124 | 5.0%) account for the highest median family income in Harahan with $208,947 per family, while 2-person families (1,525 | 61.0%) have the highest median income of $43,326 per family member.
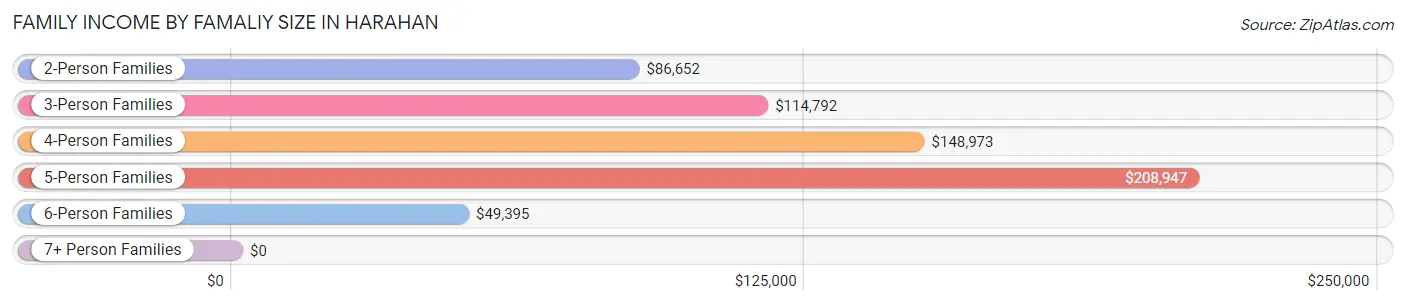
| Income Bracket | # Families | Median Income |
| 2-Person Families | 1,525 (61.0%) | $86,652 |
| 3-Person Families | 424 (17.0%) | $114,792 |
| 4-Person Families | 367 (14.7%) | $148,973 |
| 5-Person Families | 124 (5.0%) | $208,947 |
| 6-Person Families | 47 (1.9%) | $49,395 |
| 7+ Person Families | 15 (0.6%) | $0 |
| Total | 2,502 (100.0%) | $103,750 |
Family Income by Number of Earners in Harahan
The median family income in Harahan is $103,750, with families comprising 3+ earners (280) having the highest median family income of $155,500, while families with no earners (483) have the lowest median family income of $75,204, accounting for 11.2% and 19.3% of families, respectively.
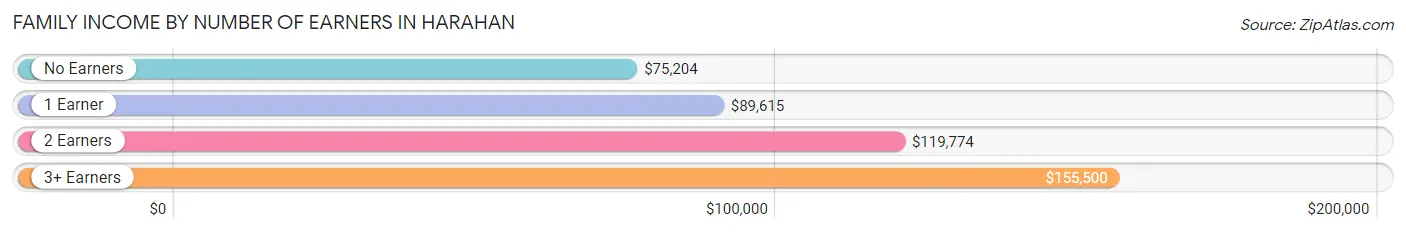
| Number of Earners | # Families | Median Income |
| No Earners | 483 (19.3%) | $75,204 |
| 1 Earner | 668 (26.7%) | $89,615 |
| 2 Earners | 1,071 (42.8%) | $119,774 |
| 3+ Earners | 280 (11.2%) | $155,500 |
| Total | 2,502 (100.0%) | $103,750 |
Household Income in Harahan
Household Income Brackets in Harahan
With 686 households falling in the category, the $100,000 to $149,999 income range is the most frequent in Harahan, accounting for 16.8% of all households. In contrast, only 147 households (3.6%) fall into the $10,000 to $14,999 income bracket, making it the least populous group.
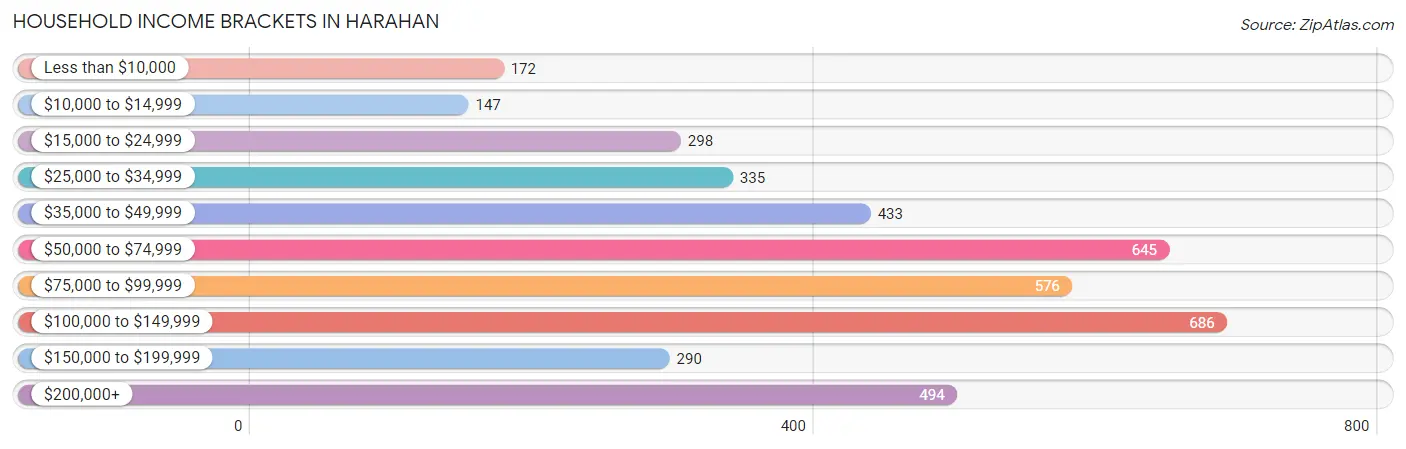
| Income Bracket | # Households | % Households |
| Less than $10,000 | 172 | 4.2% |
| $10,000 to $14,999 | 147 | 3.6% |
| $15,000 to $24,999 | 298 | 7.3% |
| $25,000 to $34,999 | 335 | 8.2% |
| $35,000 to $49,999 | 433 | 10.6% |
| $50,000 to $74,999 | 645 | 15.8% |
| $75,000 to $99,999 | 576 | 14.1% |
| $100,000 to $149,999 | 686 | 16.8% |
| $150,000 to $199,999 | 290 | 7.1% |
| $200,000+ | 494 | 12.1% |
Household Income by Householder Age in Harahan
The median household income in Harahan is $75,099, with the highest median household income of $94,625 found in the 25 to 44 years age bracket for the primary householder. A total of 969 households (23.7%) fall into this category. Meanwhile, the 15 to 24 years age bracket for the primary householder has the lowest median household income of $0, with 125 households (3.1%) in this group.
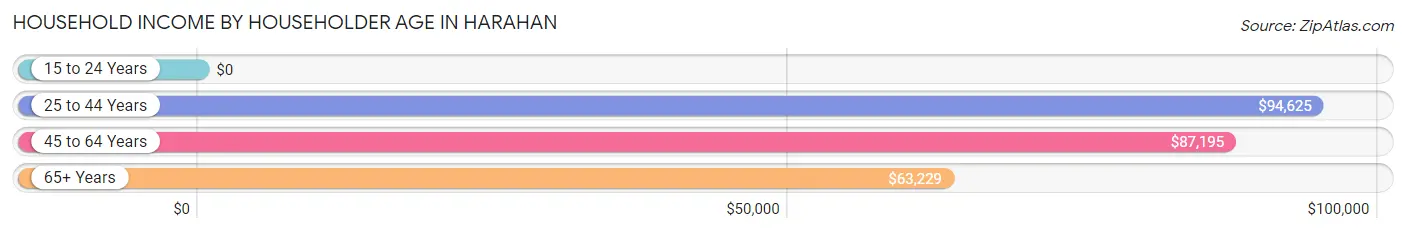
| Income Bracket | # Households | Median Income |
| 15 to 24 Years | 125 (3.1%) | $0 |
| 25 to 44 Years | 969 (23.7%) | $94,625 |
| 45 to 64 Years | 1,558 (38.1%) | $87,195 |
| 65+ Years | 1,433 (35.1%) | $63,229 |
| Total | 4,085 (100.0%) | $75,099 |
Poverty in Harahan
Income Below Poverty by Sex and Age in Harahan
With 8.2% poverty level for males and 9.8% for females among the residents of Harahan, 16 and 17 year old males and 5 year old females are the most vulnerable to poverty, with 15 males (26.8%) and 16 females (44.4%) in their respective age groups living below the poverty level.
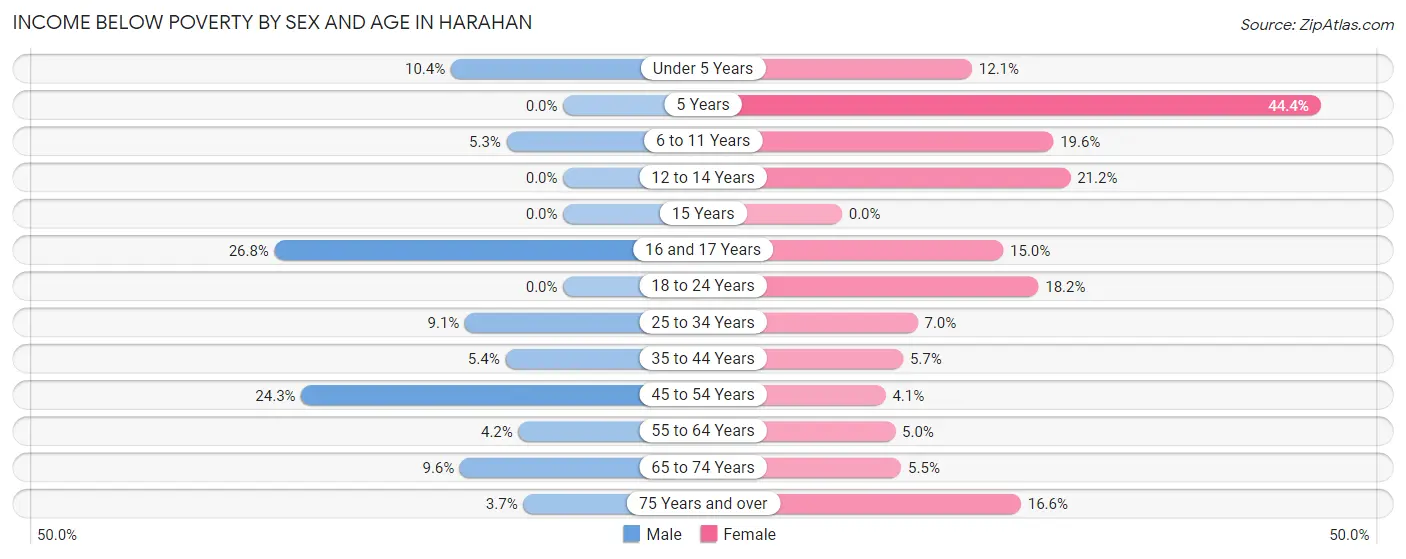
| Age Bracket | Male | Female |
| Under 5 Years | 15 (10.4%) | 14 (12.1%) |
| 5 Years | 0 (0.0%) | 16 (44.4%) |
| 6 to 11 Years | 15 (5.3%) | 51 (19.6%) |
| 12 to 14 Years | 0 (0.0%) | 39 (21.2%) |
| 15 Years | 0 (0.0%) | 0 (0.0%) |
| 16 and 17 Years | 15 (26.8%) | 25 (15.0%) |
| 18 to 24 Years | 0 (0.0%) | 60 (18.2%) |
| 25 to 34 Years | 40 (9.1%) | 43 (7.0%) |
| 35 to 44 Years | 32 (5.4%) | 32 (5.7%) |
| 45 to 54 Years | 124 (24.3%) | 24 (4.1%) |
| 55 to 64 Years | 29 (4.2%) | 38 (5.0%) |
| 65 to 74 Years | 48 (9.6%) | 34 (5.5%) |
| 75 Years and over | 10 (3.7%) | 105 (16.6%) |
| Total | 328 (8.2%) | 481 (9.8%) |
Income Above Poverty by Sex and Age in Harahan
According to the poverty statistics in Harahan, males aged 5 years and females aged 15 years are the age groups that are most secure financially, with 100.0% of males and 100.0% of females in these age groups living above the poverty line.
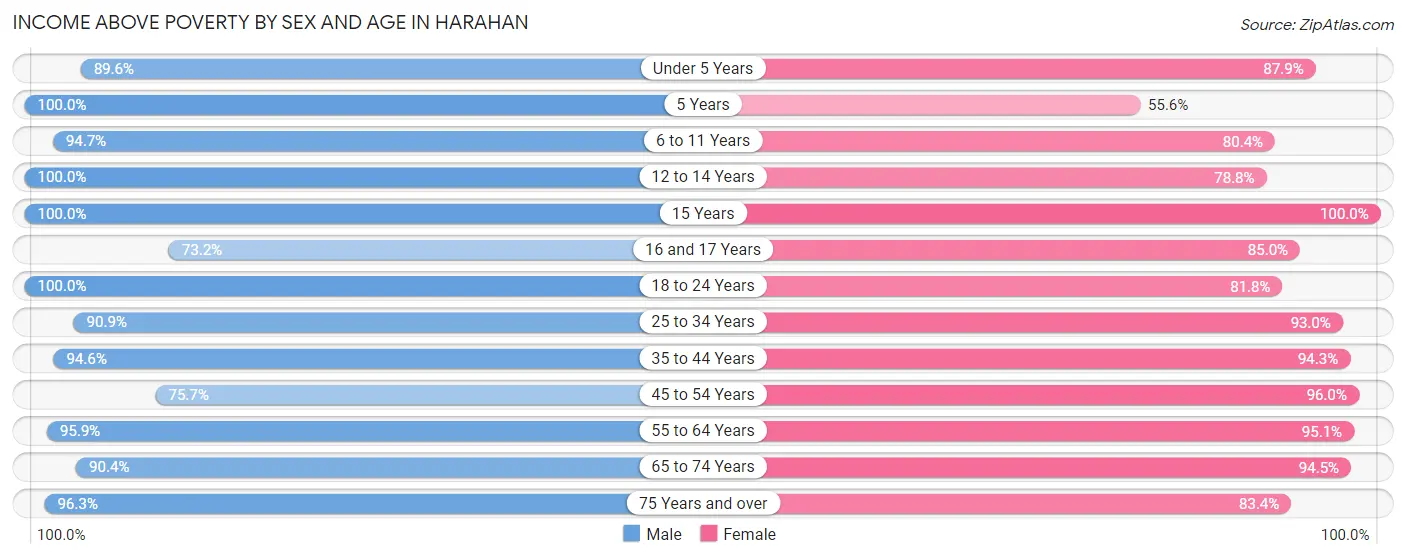
| Age Bracket | Male | Female |
| Under 5 Years | 129 (89.6%) | 102 (87.9%) |
| 5 Years | 13 (100.0%) | 20 (55.6%) |
| 6 to 11 Years | 270 (94.7%) | 209 (80.4%) |
| 12 to 14 Years | 109 (100.0%) | 145 (78.8%) |
| 15 Years | 8 (100.0%) | 26 (100.0%) |
| 16 and 17 Years | 41 (73.2%) | 142 (85.0%) |
| 18 to 24 Years | 367 (100.0%) | 269 (81.8%) |
| 25 to 34 Years | 399 (90.9%) | 569 (93.0%) |
| 35 to 44 Years | 564 (94.6%) | 531 (94.3%) |
| 45 to 54 Years | 386 (75.7%) | 568 (96.0%) |
| 55 to 64 Years | 669 (95.9%) | 729 (95.1%) |
| 65 to 74 Years | 453 (90.4%) | 583 (94.5%) |
| 75 Years and over | 260 (96.3%) | 527 (83.4%) |
| Total | 3,668 (91.8%) | 4,420 (90.2%) |
Income Below Poverty Among Married-Couple Families in Harahan
The poverty statistics for married-couple families in Harahan show that 3.1% or 60 of the total 1,943 families live below the poverty line. Families with 3 or 4 children have the highest poverty rate of 22.8%, comprising of 29 families. On the other hand, families with 1 or 2 children have the lowest poverty rate of 0.0%, which includes 0 families.
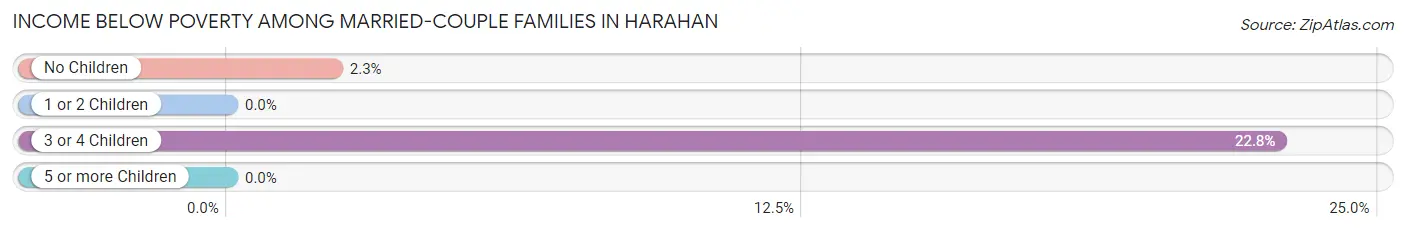
| Children | Above Poverty | Below Poverty |
| No Children | 1,328 (97.7%) | 31 (2.3%) |
| 1 or 2 Children | 457 (100.0%) | 0 (0.0%) |
| 3 or 4 Children | 98 (77.2%) | 29 (22.8%) |
| 5 or more Children | 0 (0.0%) | 0 (0.0%) |
| Total | 1,883 (96.9%) | 60 (3.1%) |
Income Below Poverty Among Single-Parent Households in Harahan
According to the poverty data in Harahan, 9.6% or 13 single-father households and 10.8% or 46 single-mother households are living below the poverty line. Among single-father households, those with no children have the highest poverty rate, with 13 households (9.6%) experiencing poverty. Likewise, among single-mother households, those with 5 or more children have the highest poverty rate, with 15 households (100.0%) falling below the poverty line.
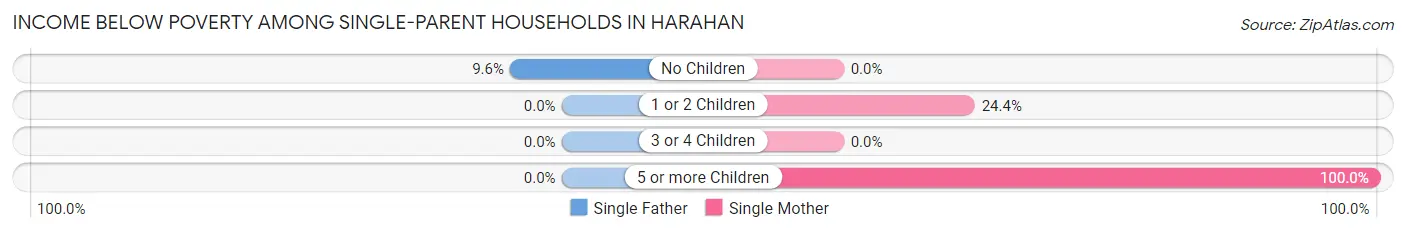
| Children | Single Father | Single Mother |
| No Children | 13 (9.6%) | 0 (0.0%) |
| 1 or 2 Children | 0 (0.0%) | 31 (24.4%) |
| 3 or 4 Children | 0 (0.0%) | 0 (0.0%) |
| 5 or more Children | 0 (0.0%) | 15 (100.0%) |
| Total | 13 (9.6%) | 46 (10.8%) |
Income Below Poverty Among Married-Couple vs Single-Parent Households in Harahan
The poverty data for Harahan shows that 60 of the married-couple family households (3.1%) and 59 of the single-parent households (10.5%) are living below the poverty level. Within the married-couple family households, those with 3 or 4 children have the highest poverty rate, with 29 households (22.8%) falling below the poverty line. Among the single-parent households, those with 5 or more children have the highest poverty rate, with 15 household (100.0%) living below poverty.
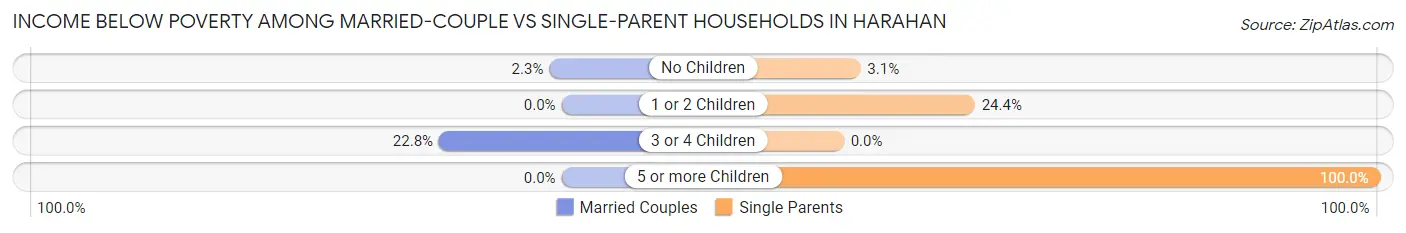
| Children | Married-Couple Families | Single-Parent Households |
| No Children | 31 (2.3%) | 13 (3.1%) |
| 1 or 2 Children | 0 (0.0%) | 31 (24.4%) |
| 3 or 4 Children | 29 (22.8%) | 0 (0.0%) |
| 5 or more Children | 0 (0.0%) | 15 (100.0%) |
| Total | 60 (3.1%) | 59 (10.5%) |
Race in Harahan
The most populous races in Harahan are White / Caucasian (8,339 | 92.2%), Hispanic or Latino (836 | 9.2%), and Two or more Races (258 | 2.9%).
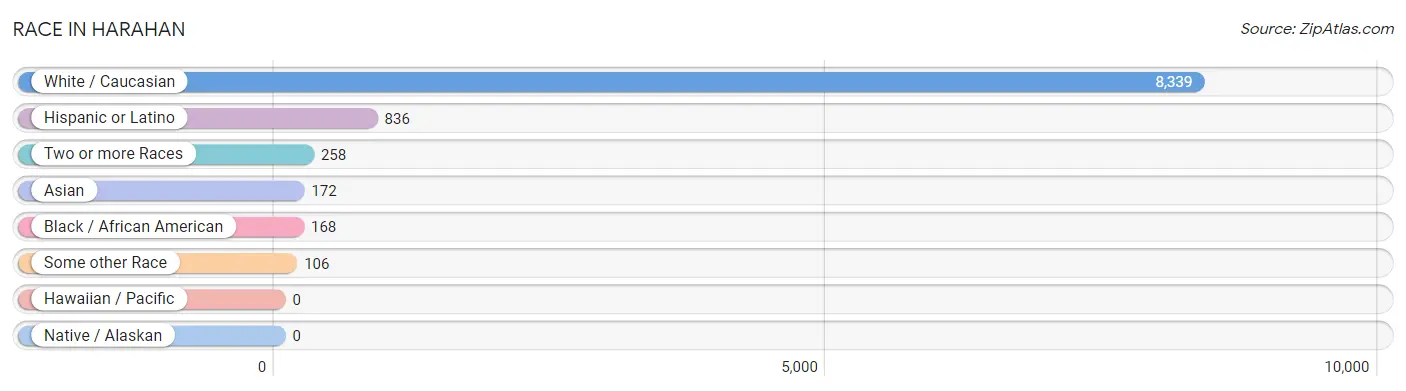
| Race | # Population | % Population |
| Asian | 172 | 1.9% |
| Black / African American | 168 | 1.9% |
| Hawaiian / Pacific | 0 | 0.0% |
| Hispanic or Latino | 836 | 9.2% |
| Native / Alaskan | 0 | 0.0% |
| White / Caucasian | 8,339 | 92.2% |
| Two or more Races | 258 | 2.9% |
| Some other Race | 106 | 1.2% |
| Total | 9,043 | 100.0% |
Ancestry in Harahan
The most populous ancestries reported in Harahan are French (2,116 | 23.4%), German (1,791 | 19.8%), Italian (1,296 | 14.3%), Irish (1,115 | 12.3%), and English (772 | 8.5%), together accounting for 78.4% of all Harahan residents.
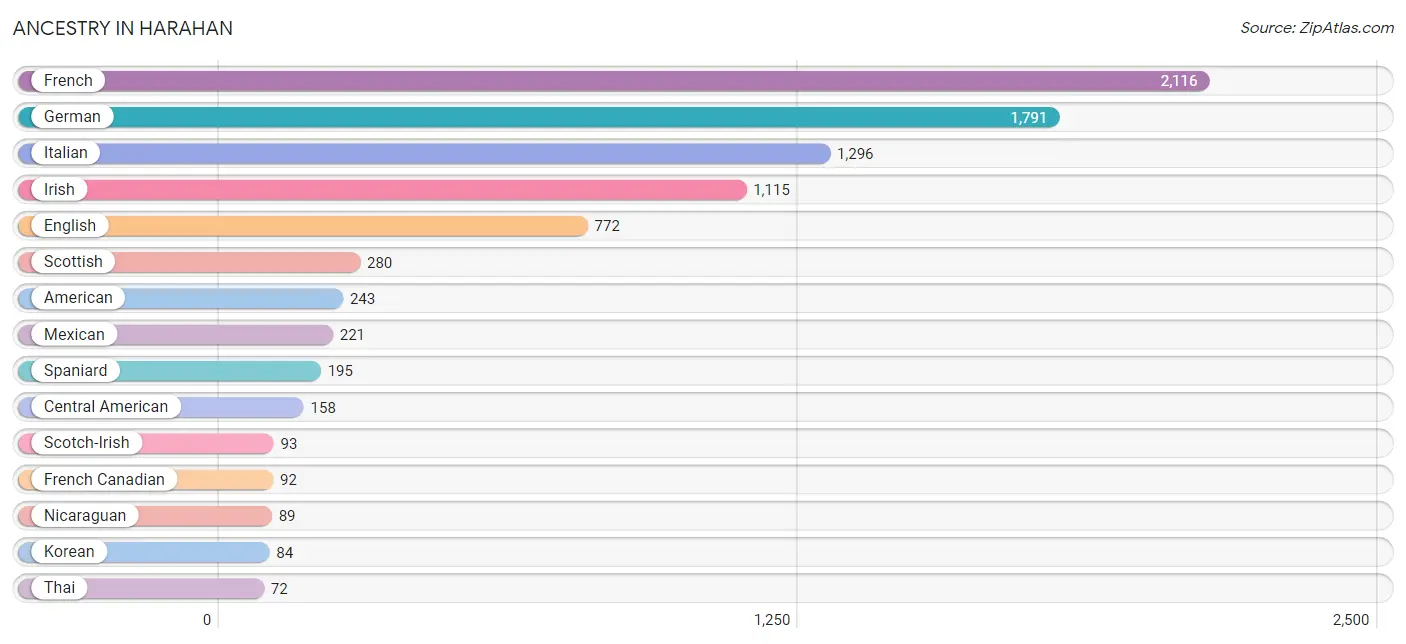
| Ancestry | # Population | % Population |
| African | 9 | 0.1% |
| American | 243 | 2.7% |
| Arab | 48 | 0.5% |
| British | 34 | 0.4% |
| Cajun | 68 | 0.7% |
| Celtic | 24 | 0.3% |
| Central American | 158 | 1.8% |
| Central American Indian | 33 | 0.4% |
| Croatian | 12 | 0.1% |
| Cuban | 29 | 0.3% |
| Dutch | 36 | 0.4% |
| English | 772 | 8.5% |
| European | 54 | 0.6% |
| French | 2,116 | 23.4% |
| French American Indian | 29 | 0.3% |
| French Canadian | 92 | 1.0% |
| German | 1,791 | 19.8% |
| Honduran | 69 | 0.8% |
| Irish | 1,115 | 12.3% |
| Italian | 1,296 | 14.3% |
| Korean | 84 | 0.9% |
| Lebanese | 21 | 0.2% |
| Mexican | 221 | 2.4% |
| Mexican American Indian | 23 | 0.3% |
| Native Hawaiian | 9 | 0.1% |
| Nicaraguan | 89 | 1.0% |
| Northern European | 14 | 0.2% |
| Pakistani | 32 | 0.4% |
| Polish | 44 | 0.5% |
| Portuguese | 24 | 0.3% |
| Puerto Rican | 41 | 0.4% |
| Russian | 7 | 0.1% |
| Scotch-Irish | 93 | 1.0% |
| Scottish | 280 | 3.1% |
| Spaniard | 195 | 2.2% |
| Spanish | 14 | 0.2% |
| Subsaharan African | 9 | 0.1% |
| Thai | 72 | 0.8% |
| Ukrainian | 7 | 0.1% |
| Welsh | 8 | 0.1% |
| Yugoslavian | 13 | 0.1% | View All 41 Rows |
Immigrants in Harahan
The most numerous immigrant groups reported in Harahan came from Asia (172 | 1.9%), South Eastern Asia (100 | 1.1%), Latin America (85 | 0.9%), India (72 | 0.8%), and South Central Asia (72 | 0.8%), together accounting for 5.6% of all Harahan residents.
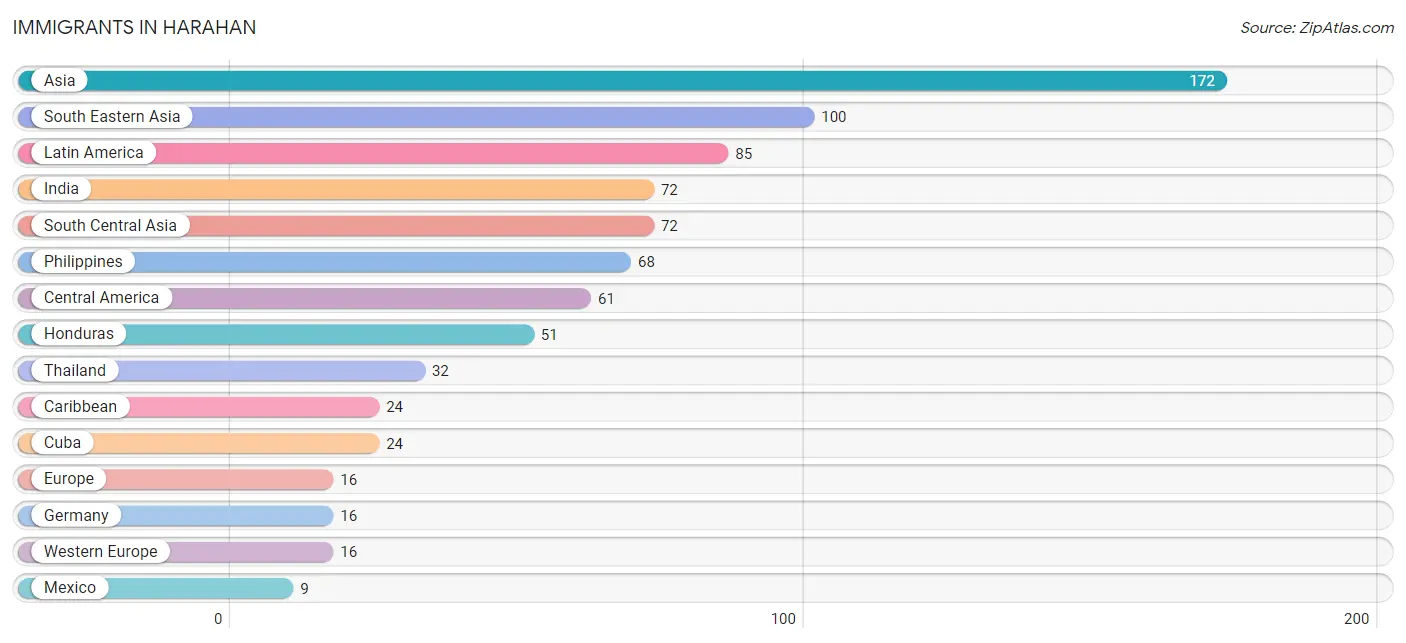
| Immigration Origin | # Population | % Population |
| Asia | 172 | 1.9% |
| Caribbean | 24 | 0.3% |
| Central America | 61 | 0.7% |
| Cuba | 24 | 0.3% |
| Europe | 16 | 0.2% |
| Germany | 16 | 0.2% |
| Honduras | 51 | 0.6% |
| India | 72 | 0.8% |
| Latin America | 85 | 0.9% |
| Mexico | 9 | 0.1% |
| Nicaragua | 1 | 0.0% |
| Philippines | 68 | 0.7% |
| South Central Asia | 72 | 0.8% |
| South Eastern Asia | 100 | 1.1% |
| Thailand | 32 | 0.4% |
| Western Europe | 16 | 0.2% | View All 16 Rows |
Sex and Age in Harahan
Sex and Age in Harahan
The most populous age groups in Harahan are 60 to 64 Years (469 | 11.6%) for men and 60 to 64 Years (554 | 11.1%) for women.
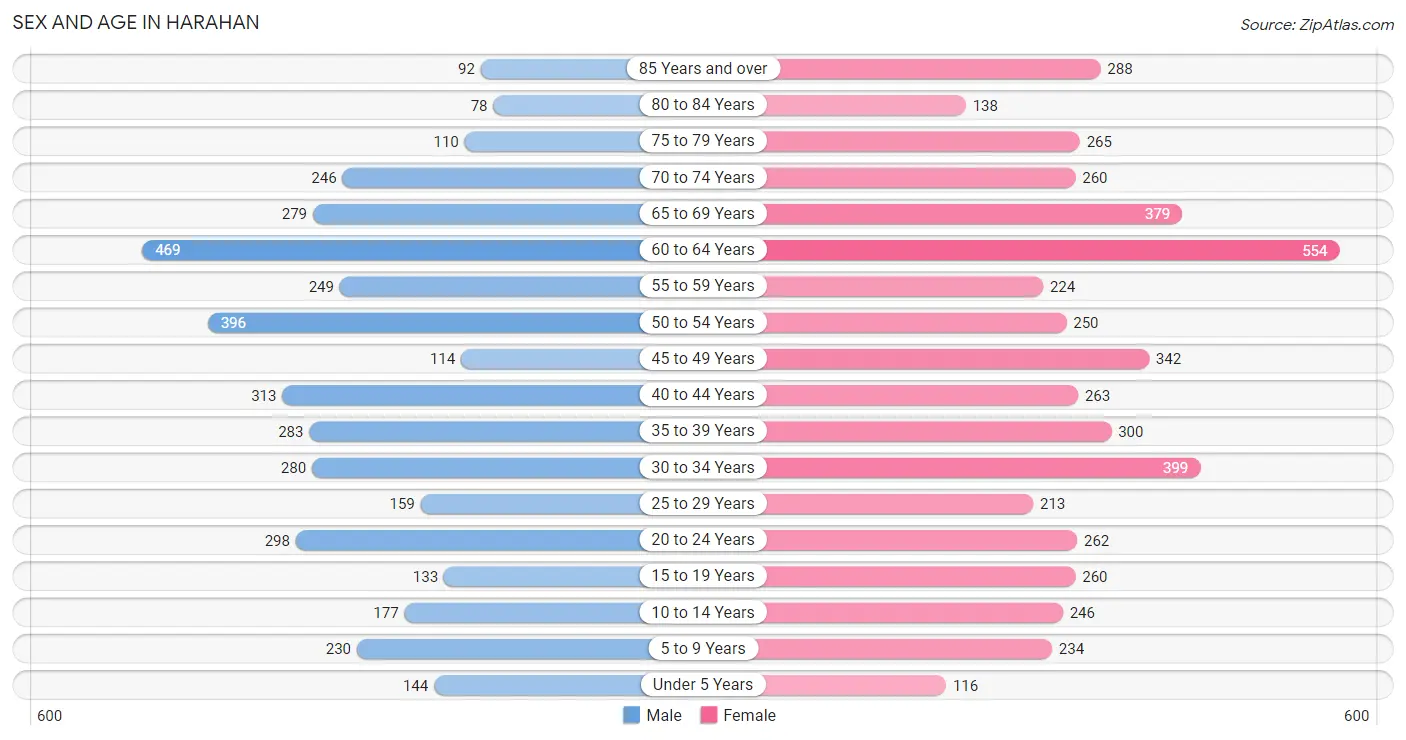
| Age Bracket | Male | Female |
| Under 5 Years | 144 (3.6%) | 116 (2.3%) |
| 5 to 9 Years | 230 (5.7%) | 234 (4.7%) |
| 10 to 14 Years | 177 (4.4%) | 246 (4.9%) |
| 15 to 19 Years | 133 (3.3%) | 260 (5.2%) |
| 20 to 24 Years | 298 (7.4%) | 262 (5.2%) |
| 25 to 29 Years | 159 (3.9%) | 213 (4.3%) |
| 30 to 34 Years | 280 (6.9%) | 399 (8.0%) |
| 35 to 39 Years | 283 (7.0%) | 300 (6.0%) |
| 40 to 44 Years | 313 (7.7%) | 263 (5.3%) |
| 45 to 49 Years | 114 (2.8%) | 342 (6.9%) |
| 50 to 54 Years | 396 (9.8%) | 250 (5.0%) |
| 55 to 59 Years | 249 (6.1%) | 224 (4.5%) |
| 60 to 64 Years | 469 (11.6%) | 554 (11.1%) |
| 65 to 69 Years | 279 (6.9%) | 379 (7.6%) |
| 70 to 74 Years | 246 (6.1%) | 260 (5.2%) |
| 75 to 79 Years | 110 (2.7%) | 265 (5.3%) |
| 80 to 84 Years | 78 (1.9%) | 138 (2.8%) |
| 85 Years and over | 92 (2.3%) | 288 (5.8%) |
| Total | 4,050 (100.0%) | 4,993 (100.0%) |
Families and Households in Harahan
Median Family Size in Harahan
The median family size in Harahan is 2.80 persons per family, with married-couple families (1,943 | 77.7%) accounting for the largest median family size of 2.86 persons per family. On the other hand, single male/father families (135 | 5.4%) represent the smallest median family size with 2.27 persons per family.
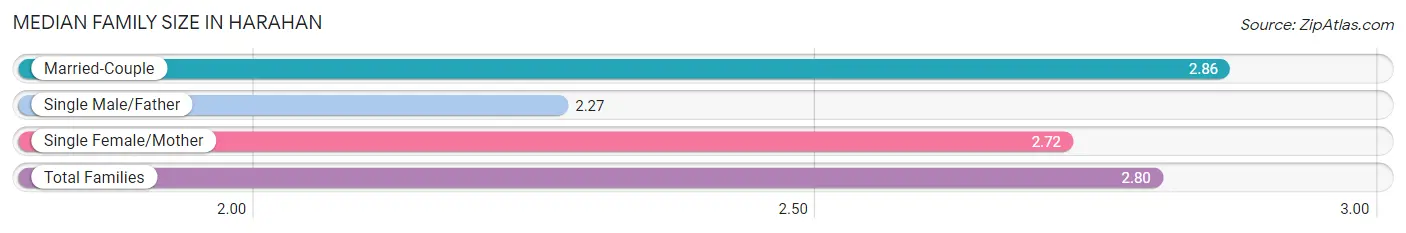
| Family Type | # Families | Family Size |
| Married-Couple | 1,943 (77.7%) | 2.86 |
| Single Male/Father | 135 (5.4%) | 2.27 |
| Single Female/Mother | 424 (17.0%) | 2.72 |
| Total Families | 2,502 (100.0%) | 2.80 |
Median Household Size in Harahan
The median household size in Harahan is 2.17 persons per household, with married-couple households (1,943 | 47.6%) accounting for the largest median household size of 2.86 persons per household. non-family households (1,583 | 38.8%) represent the smallest median household size with 1.14 persons per household.
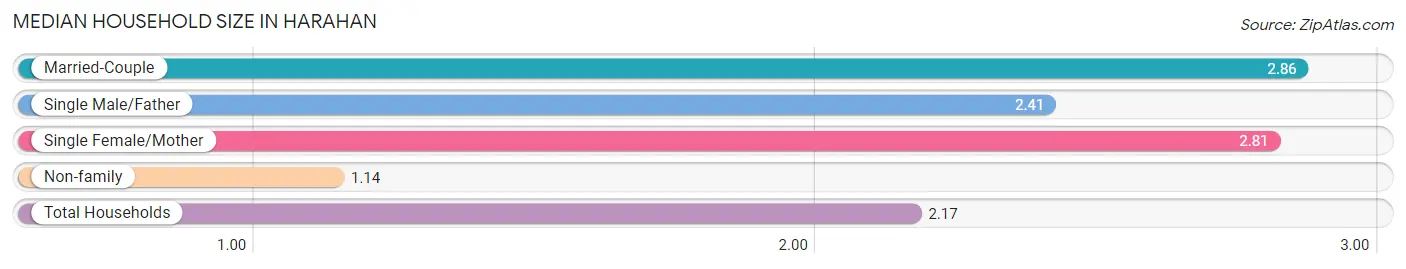
| Household Type | # Households | Household Size |
| Married-Couple | 1,943 (47.6%) | 2.86 |
| Single Male/Father | 135 (3.3%) | 2.41 |
| Single Female/Mother | 424 (10.4%) | 2.81 |
| Non-family | 1,583 (38.8%) | 1.14 |
| Total Households | 4,085 (100.0%) | 2.17 |
Household Size by Marriage Status in Harahan
Out of a total of 4,085 households in Harahan, 2,502 (61.3%) are family households, while 1,583 (38.8%) are nonfamily households. The most numerous type of family households are 2-person households, comprising 1,501, and the most common type of nonfamily households are 1-person households, comprising 1,354.
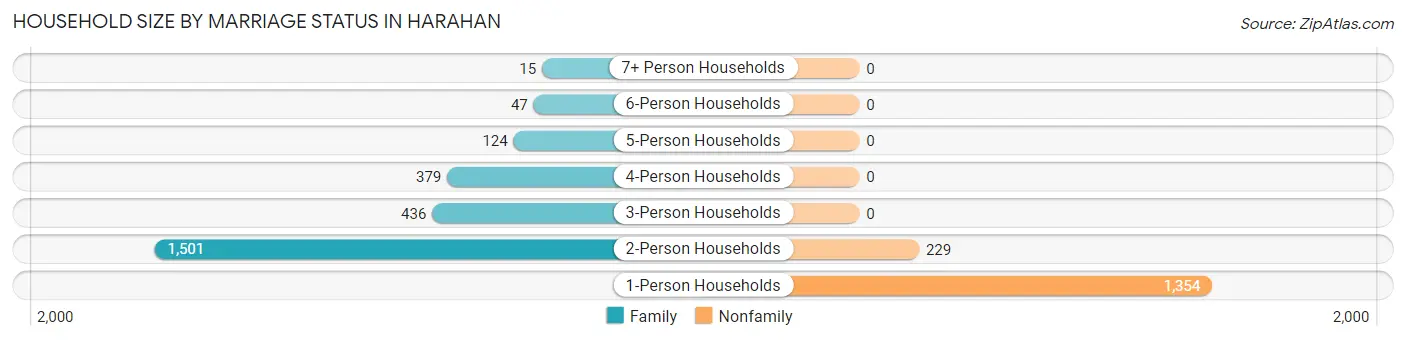
| Household Size | Family Households | Nonfamily Households |
| 1-Person Households | - | 1,354 (33.2%) |
| 2-Person Households | 1,501 (36.7%) | 229 (5.6%) |
| 3-Person Households | 436 (10.7%) | 0 (0.0%) |
| 4-Person Households | 379 (9.3%) | 0 (0.0%) |
| 5-Person Households | 124 (3.0%) | 0 (0.0%) |
| 6-Person Households | 47 (1.1%) | 0 (0.0%) |
| 7+ Person Households | 15 (0.4%) | 0 (0.0%) |
| Total | 2,502 (61.3%) | 1,583 (38.8%) |
Female Fertility in Harahan
Fertility by Age in Harahan
Average fertility rate in Harahan is 11.0 births per 1,000 women. Women in the age bracket of 35 to 50 years have the highest fertility rate with 24.0 births per 1,000 women. Women in the age bracket of 35 to 50 years acount for 100.0% of all women with births.
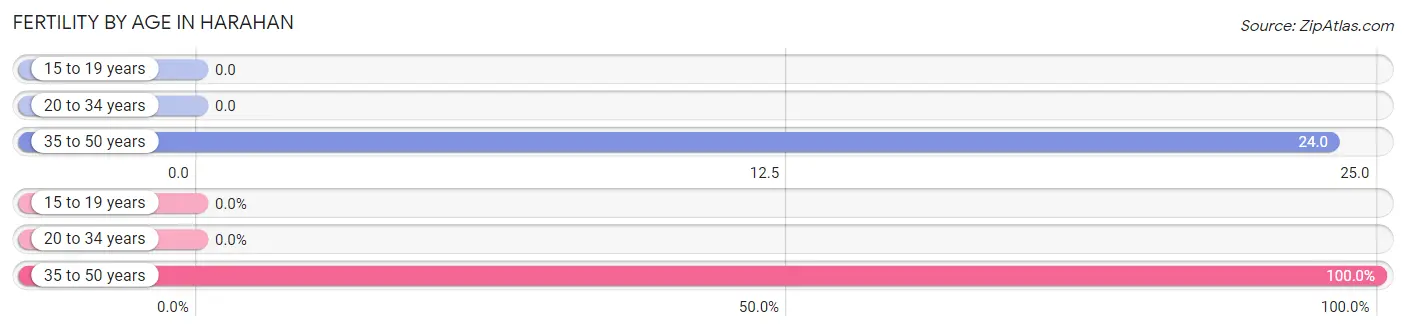
| Age Bracket | Women with Births | Births / 1,000 Women |
| 15 to 19 years | 0 (0.0%) | 0.0 |
| 20 to 34 years | 0 (0.0%) | 0.0 |
| 35 to 50 years | 22 (100.0%) | 24.0 |
| Total | 22 (100.0%) | 11.0 |
Fertility by Age by Marriage Status in Harahan
63.6% of women with births (22) in Harahan are married. The highest percentage of unmarried women with births falls into 35 to 50 years age bracket with 36.4% of them unmarried at the time of birth, while the lowest percentage of unmarried women with births belong to 35 to 50 years age bracket with 36.4% of them unmarried.
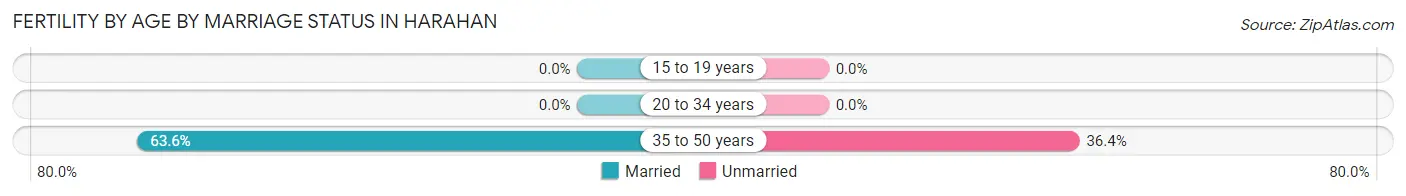
| Age Bracket | Married | Unmarried |
| 15 to 19 years | 0 (0.0%) | 0 (0.0%) |
| 20 to 34 years | 0 (0.0%) | 0 (0.0%) |
| 35 to 50 years | 14 (63.6%) | 8 (36.4%) |
| Total | 14 (63.6%) | 8 (36.4%) |
Fertility by Education in Harahan
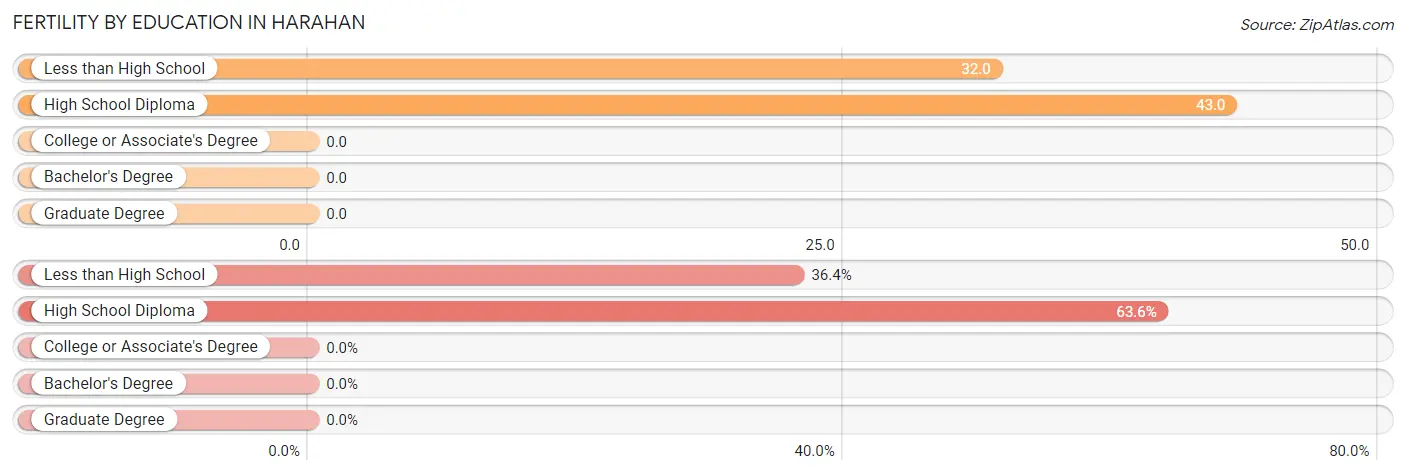
| Educational Attainment | Women with Births | Births / 1,000 Women |
| Less than High School | 8 (36.4%) | 32.0 |
| High School Diploma | 14 (63.6%) | 43.0 |
| College or Associate's Degree | 0 (0.0%) | 0.0 |
| Bachelor's Degree | 0 (0.0%) | 0.0 |
| Graduate Degree | 0 (0.0%) | 0.0 |
| Total | 22 (100.0%) | 11.0 |
Fertility by Education by Marriage Status in Harahan
36.4% of women with births in Harahan are unmarried. Women with the educational attainment of high school diploma are most likely to be married with 100.0% of them married at childbirth, while women with the educational attainment of less than high school are least likely to be married with 100.0% of them unmarried at childbirth.
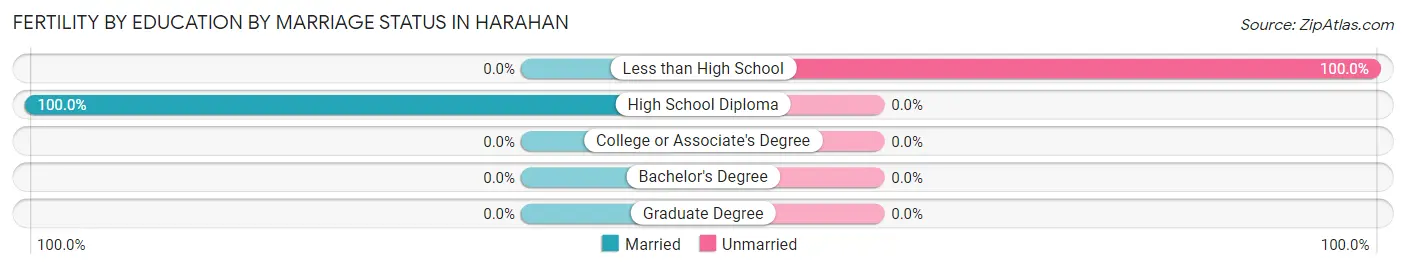
| Educational Attainment | Married | Unmarried |
| Less than High School | 0 (0.0%) | 8 (100.0%) |
| High School Diploma | 14 (100.0%) | 0 (0.0%) |
| College or Associate's Degree | 0 (0.0%) | 0 (0.0%) |
| Bachelor's Degree | 0 (0.0%) | 0 (0.0%) |
| Graduate Degree | 0 (0.0%) | 0 (0.0%) |
| Total | 14 (63.6%) | 8 (36.4%) |
Employment Characteristics in Harahan
Employment by Class of Employer in Harahan
Among the 4,655 employed individuals in Harahan, private company employees (3,054 | 65.6%), not-for-profit organizations (460 | 9.9%), and local government employees (370 | 8.0%) make up the most common classes of employment.
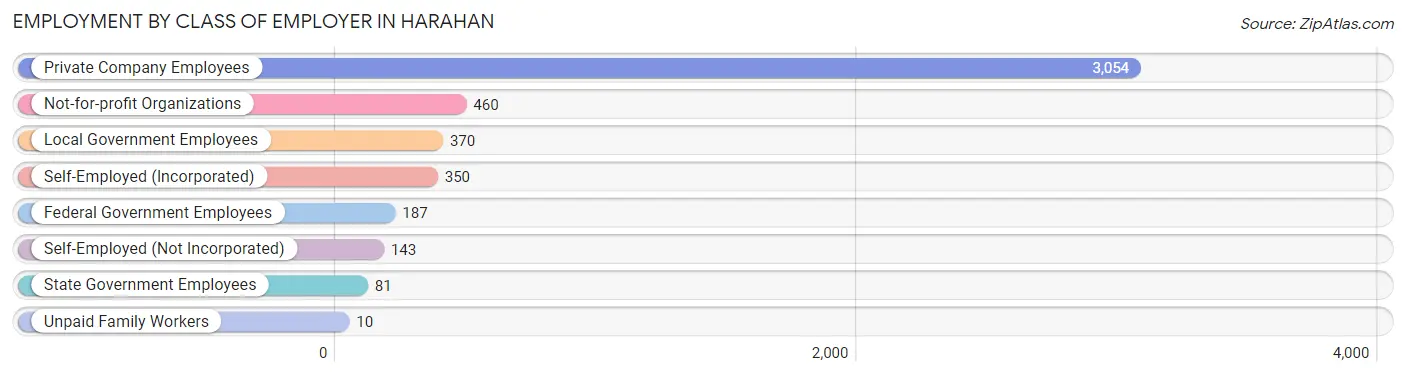
| Employer Class | # Employees | % Employees |
| Private Company Employees | 3,054 | 65.6% |
| Self-Employed (Incorporated) | 350 | 7.5% |
| Self-Employed (Not Incorporated) | 143 | 3.1% |
| Not-for-profit Organizations | 460 | 9.9% |
| Local Government Employees | 370 | 8.0% |
| State Government Employees | 81 | 1.7% |
| Federal Government Employees | 187 | 4.0% |
| Unpaid Family Workers | 10 | 0.2% |
| Total | 4,655 | 100.0% |
Employment Status by Age in Harahan
According to the labor force statistics for Harahan, out of the total population over 16 years of age (7,862), 61.4% or 4,827 individuals are in the labor force, with 2.8% or 135 of them unemployed. The age group with the highest labor force participation rate is 35 to 44 years, with 91.0% or 1,055 individuals in the labor force. Within the labor force, the 16 to 19 years age range has the highest percentage of unemployed individuals, with 32.9% or 57 of them being unemployed.
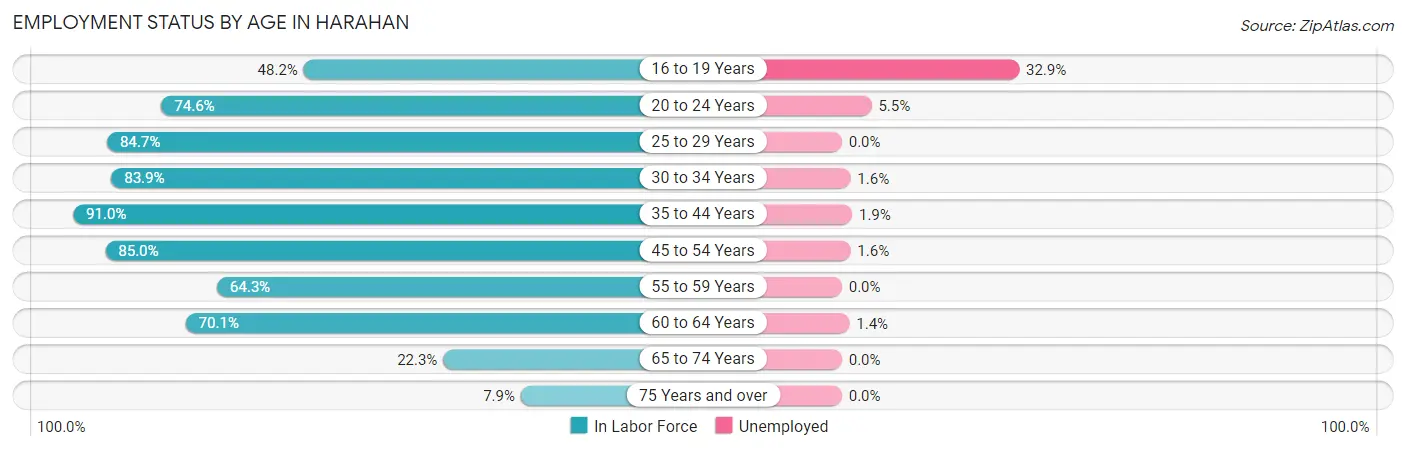
| Age Bracket | In Labor Force | Unemployed |
| 16 to 19 Years | 173 (48.2%) | 57 (32.9%) |
| 20 to 24 Years | 418 (74.6%) | 23 (5.5%) |
| 25 to 29 Years | 315 (84.7%) | 0 (0.0%) |
| 30 to 34 Years | 570 (83.9%) | 9 (1.6%) |
| 35 to 44 Years | 1,055 (91.0%) | 20 (1.9%) |
| 45 to 54 Years | 937 (85.0%) | 15 (1.6%) |
| 55 to 59 Years | 304 (64.3%) | 0 (0.0%) |
| 60 to 64 Years | 717 (70.1%) | 10 (1.4%) |
| 65 to 74 Years | 260 (22.3%) | 0 (0.0%) |
| 75 Years and over | 77 (7.9%) | 0 (0.0%) |
| Total | 4,827 (61.4%) | 135 (2.8%) |
Employment Status by Educational Attainment in Harahan
According to labor force statistics for Harahan, 81.1% of individuals (3,899) out of the total population between 25 and 64 years of age (4,808) are in the labor force, with 1.4% or 55 of them being unemployed. The group with the highest labor force participation rate are those with the educational attainment of bachelor's degree or higher, with 89.3% or 1,835 individuals in the labor force. Within the labor force, individuals with high school diploma education have the highest percentage of unemployment, with 3.5% or 24 of them being unemployed.
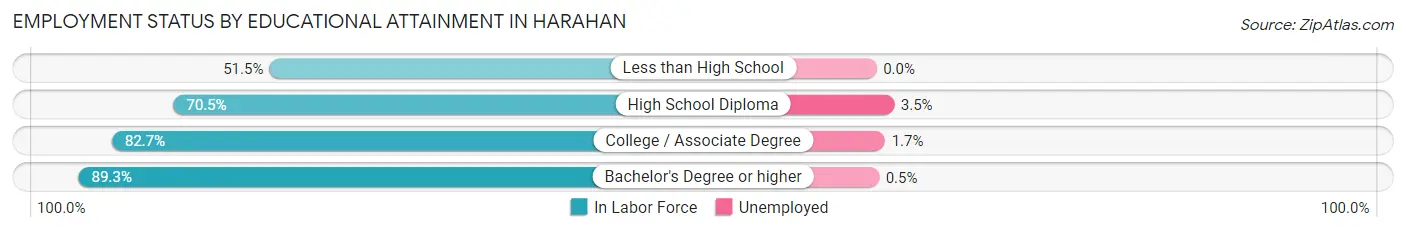
| Educational Attainment | In Labor Force | Unemployed |
| Less than High School | 155 (51.5%) | 0 (0.0%) |
| High School Diploma | 691 (70.5%) | 34 (3.5%) |
| College / Associate Degree | 1,217 (82.7%) | 25 (1.7%) |
| Bachelor's Degree or higher | 1,835 (89.3%) | 10 (0.5%) |
| Total | 3,899 (81.1%) | 67 (1.4%) |
Employment Occupations by Sex in Harahan
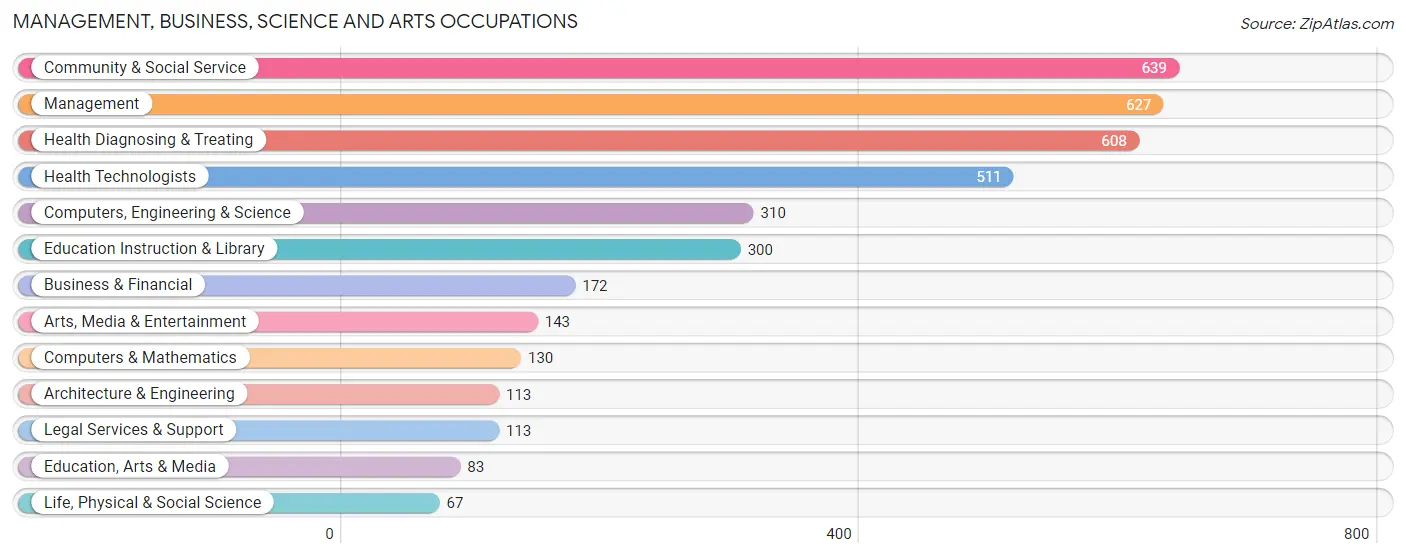
Management, Business, Science and Arts Occupations
The most common Management, Business, Science and Arts occupations in Harahan are Community & Social Service (639 | 13.7%), Management (627 | 13.4%), Health Diagnosing & Treating (608 | 13.0%), Health Technologists (511 | 10.9%), and Computers, Engineering & Science (310 | 6.6%).
Management, Business, Science and Arts Occupations by Sex
Within the Management, Business, Science and Arts occupations in Harahan, the most male-oriented occupations are Computers & Mathematics (100.0%), Architecture & Engineering (92.9%), and Arts, Media & Entertainment (85.3%), while the most female-oriented occupations are Legal Services & Support (100.0%), Health Technologists (84.5%), and Health Diagnosing & Treating (80.1%).
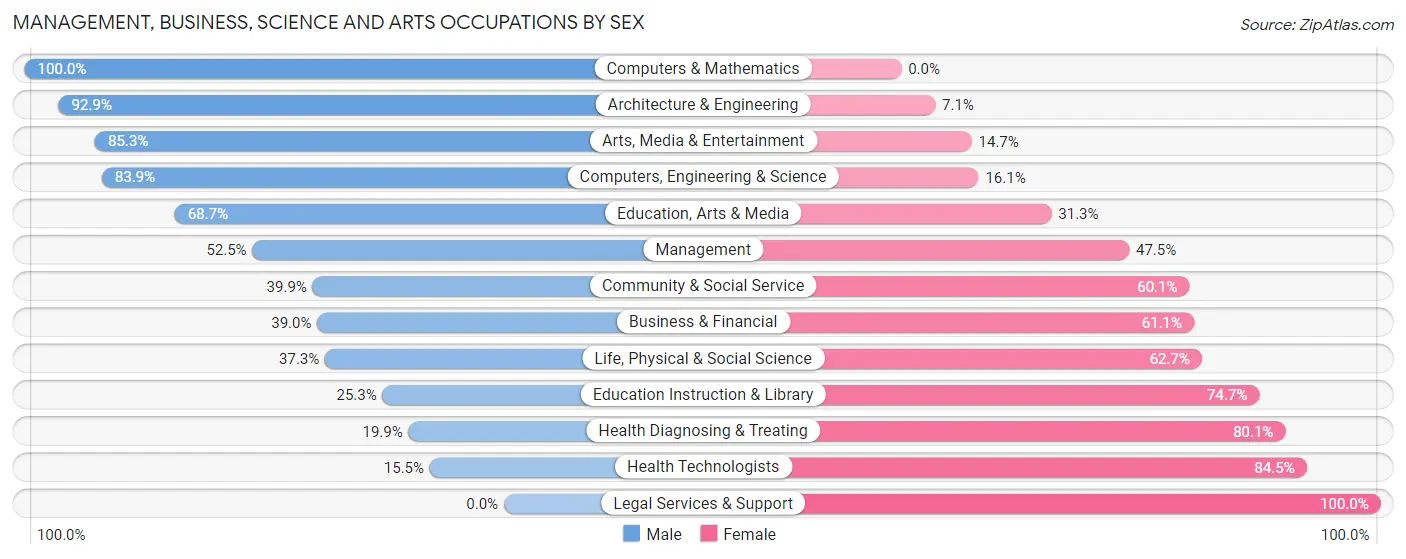
| Occupation | Male | Female |
| Management | 329 (52.5%) | 298 (47.5%) |
| Business & Financial | 67 (39.0%) | 105 (61.1%) |
| Computers, Engineering & Science | 260 (83.9%) | 50 (16.1%) |
| Computers & Mathematics | 130 (100.0%) | 0 (0.0%) |
| Architecture & Engineering | 105 (92.9%) | 8 (7.1%) |
| Life, Physical & Social Science | 25 (37.3%) | 42 (62.7%) |
| Community & Social Service | 255 (39.9%) | 384 (60.1%) |
| Education, Arts & Media | 57 (68.7%) | 26 (31.3%) |
| Legal Services & Support | 0 (0.0%) | 113 (100.0%) |
| Education Instruction & Library | 76 (25.3%) | 224 (74.7%) |
| Arts, Media & Entertainment | 122 (85.3%) | 21 (14.7%) |
| Health Diagnosing & Treating | 121 (19.9%) | 487 (80.1%) |
| Health Technologists | 79 (15.5%) | 432 (84.5%) |
| Total (Category) | 1,032 (43.8%) | 1,324 (56.2%) |
| Total (Overall) | 2,243 (48.0%) | 2,434 (52.0%) |
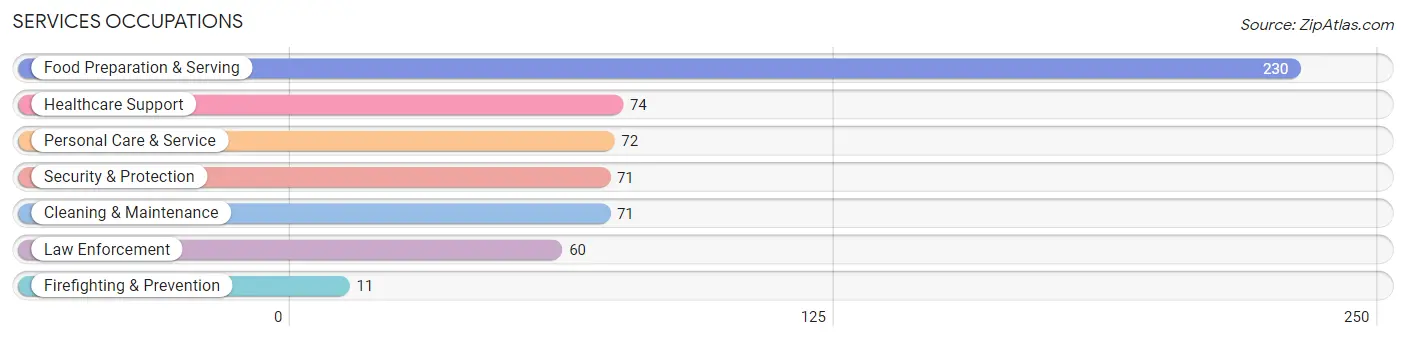
Services Occupations
The most common Services occupations in Harahan are Food Preparation & Serving (230 | 4.9%), Healthcare Support (74 | 1.6%), Personal Care & Service (72 | 1.5%), Security & Protection (71 | 1.5%), and Cleaning & Maintenance (71 | 1.5%).
Services Occupations by Sex
Within the Services occupations in Harahan, the most male-oriented occupations are Firefighting & Prevention (100.0%), Security & Protection (87.3%), and Law Enforcement (85.0%), while the most female-oriented occupations are Healthcare Support (100.0%), Personal Care & Service (80.6%), and Food Preparation & Serving (60.9%).
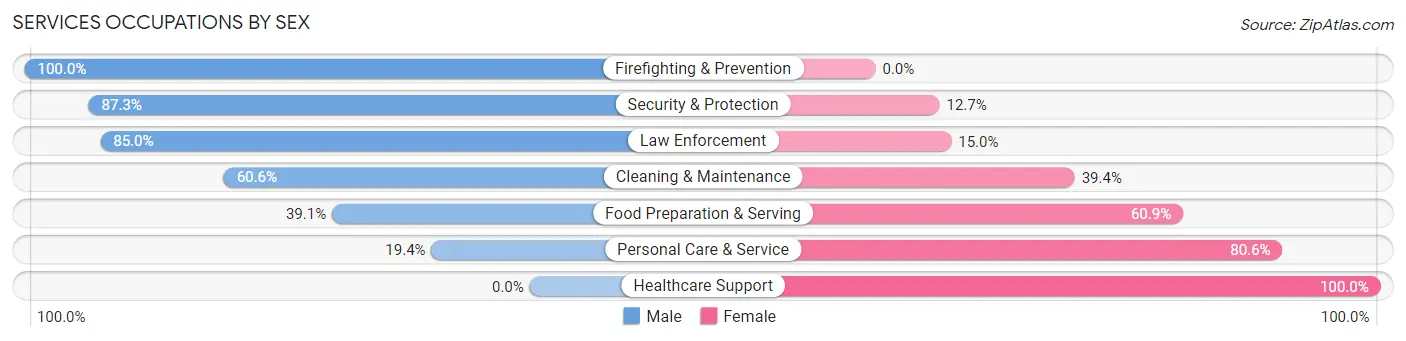
| Occupation | Male | Female |
| Healthcare Support | 0 (0.0%) | 74 (100.0%) |
| Security & Protection | 62 (87.3%) | 9 (12.7%) |
| Firefighting & Prevention | 11 (100.0%) | 0 (0.0%) |
| Law Enforcement | 51 (85.0%) | 9 (15.0%) |
| Food Preparation & Serving | 90 (39.1%) | 140 (60.9%) |
| Cleaning & Maintenance | 43 (60.6%) | 28 (39.4%) |
| Personal Care & Service | 14 (19.4%) | 58 (80.6%) |
| Total (Category) | 209 (40.4%) | 309 (59.7%) |
| Total (Overall) | 2,243 (48.0%) | 2,434 (52.0%) |
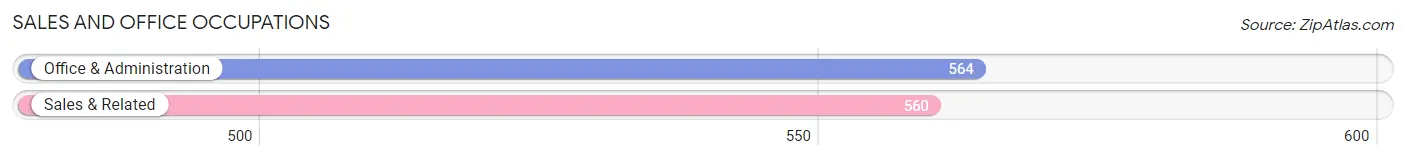
Sales and Office Occupations
The most common Sales and Office occupations in Harahan are Office & Administration (564 | 12.1%), and Sales & Related (560 | 12.0%).
Sales and Office Occupations by Sex
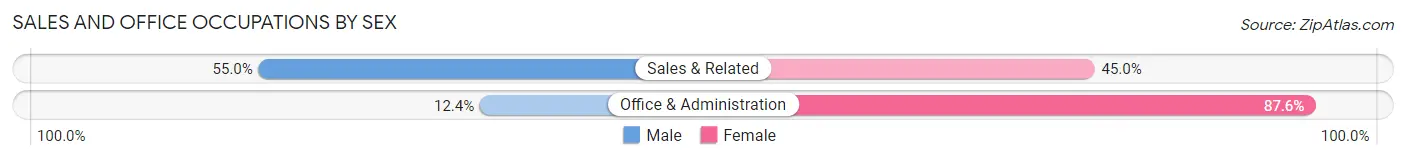
| Occupation | Male | Female |
| Sales & Related | 308 (55.0%) | 252 (45.0%) |
| Office & Administration | 70 (12.4%) | 494 (87.6%) |
| Total (Category) | 378 (33.6%) | 746 (66.4%) |
| Total (Overall) | 2,243 (48.0%) | 2,434 (52.0%) |
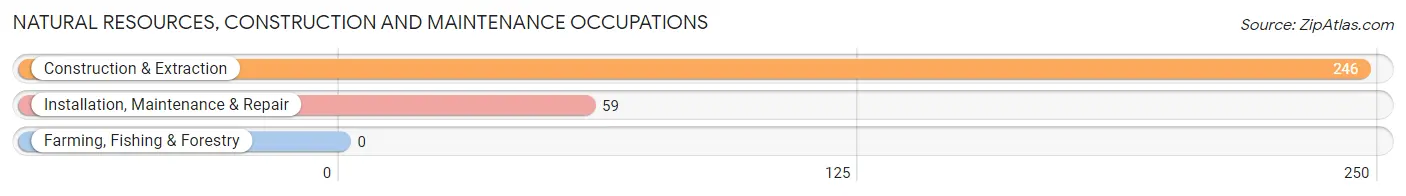
Natural Resources, Construction and Maintenance Occupations
The most common Natural Resources, Construction and Maintenance occupations in Harahan are Construction & Extraction (246 | 5.3%), and Installation, Maintenance & Repair (59 | 1.3%).
Natural Resources, Construction and Maintenance Occupations by Sex
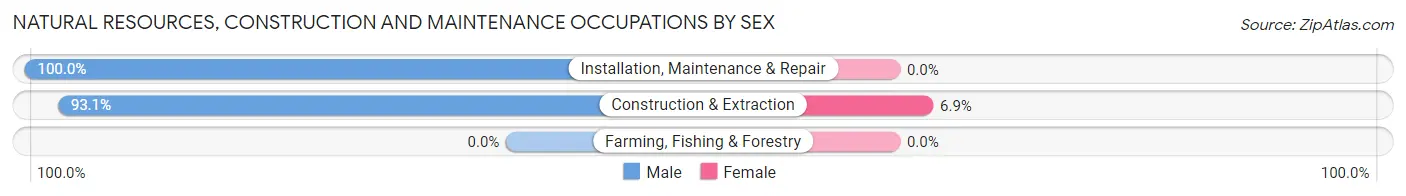
| Occupation | Male | Female |
| Farming, Fishing & Forestry | 0 (0.0%) | 0 (0.0%) |
| Construction & Extraction | 229 (93.1%) | 17 (6.9%) |
| Installation, Maintenance & Repair | 59 (100.0%) | 0 (0.0%) |
| Total (Category) | 288 (94.4%) | 17 (5.6%) |
| Total (Overall) | 2,243 (48.0%) | 2,434 (52.0%) |
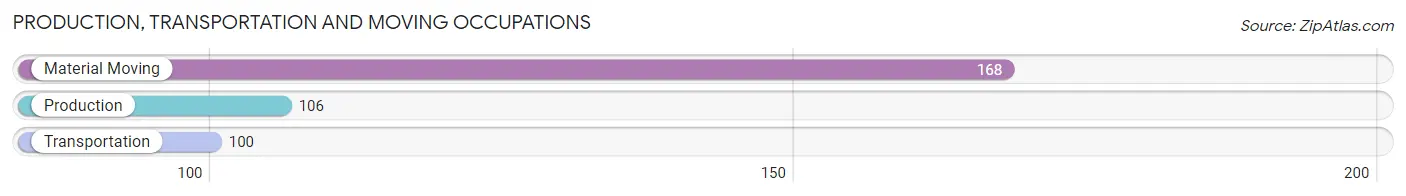
Production, Transportation and Moving Occupations
The most common Production, Transportation and Moving occupations in Harahan are Material Moving (168 | 3.6%), Production (106 | 2.3%), and Transportation (100 | 2.1%).
Production, Transportation and Moving Occupations by Sex
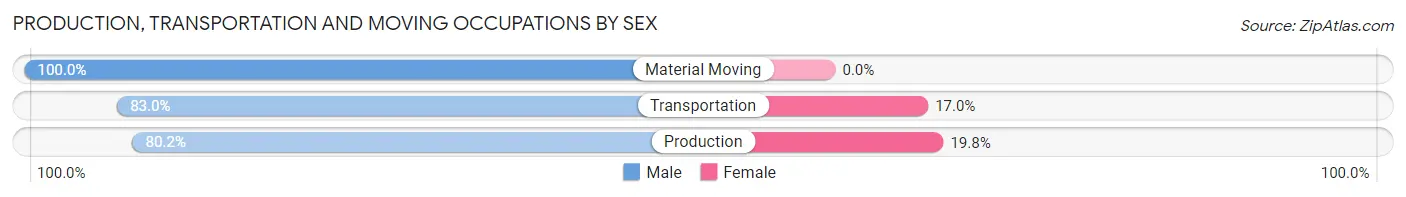
| Occupation | Male | Female |
| Production | 85 (80.2%) | 21 (19.8%) |
| Transportation | 83 (83.0%) | 17 (17.0%) |
| Material Moving | 168 (100.0%) | 0 (0.0%) |
| Total (Category) | 336 (89.8%) | 38 (10.2%) |
| Total (Overall) | 2,243 (48.0%) | 2,434 (52.0%) |
Employment Industries by Sex in Harahan
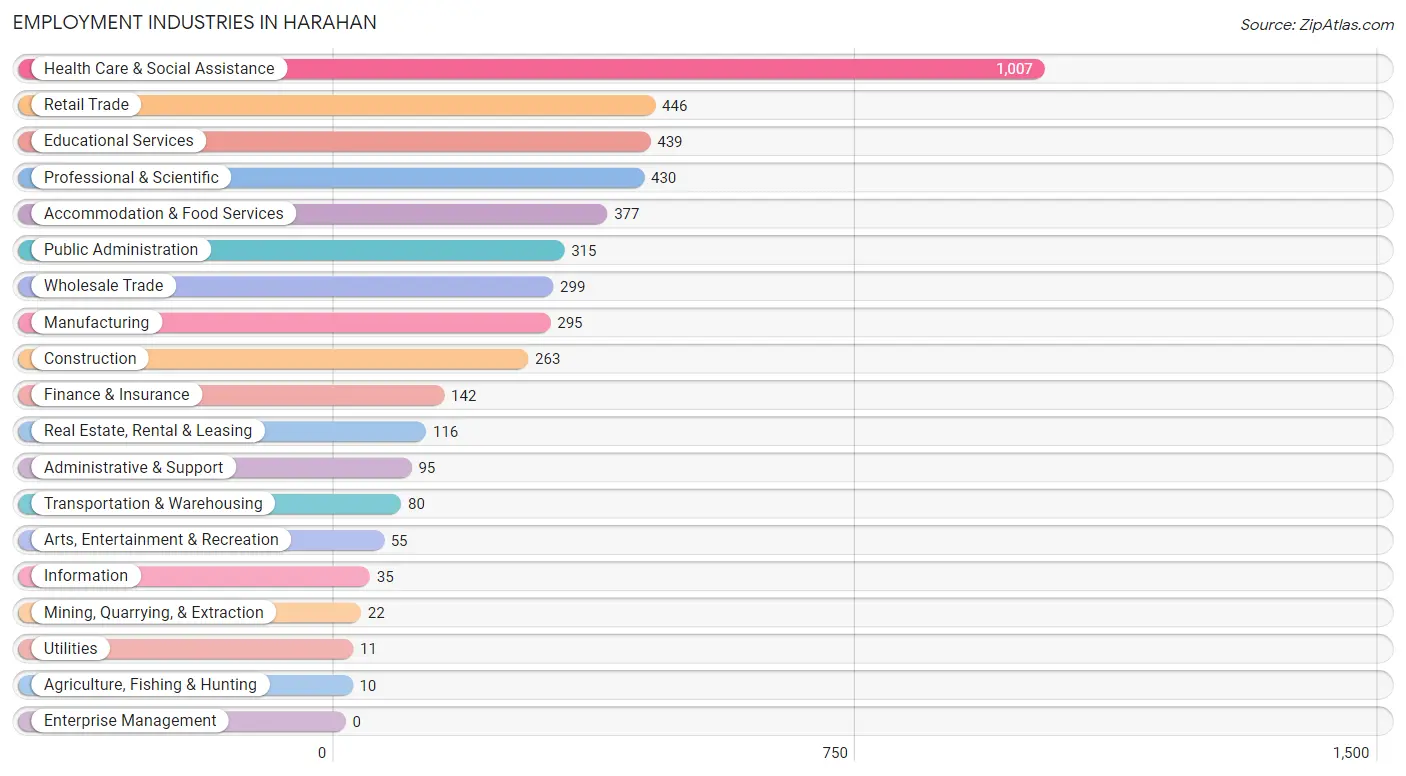
Employment Industries in Harahan
The major employment industries in Harahan include Health Care & Social Assistance (1,007 | 21.5%), Retail Trade (446 | 9.5%), Educational Services (439 | 9.4%), Professional & Scientific (430 | 9.2%), and Accommodation & Food Services (377 | 8.1%).
Employment Industries by Sex in Harahan
The Harahan industries that see more men than women are Agriculture, Fishing & Hunting (100.0%), Mining, Quarrying, & Extraction (100.0%), and Transportation & Warehousing (100.0%), whereas the industries that tend to have a higher number of women are Health Care & Social Assistance (82.7%), Finance & Insurance (73.2%), and Real Estate, Rental & Leasing (69.8%).
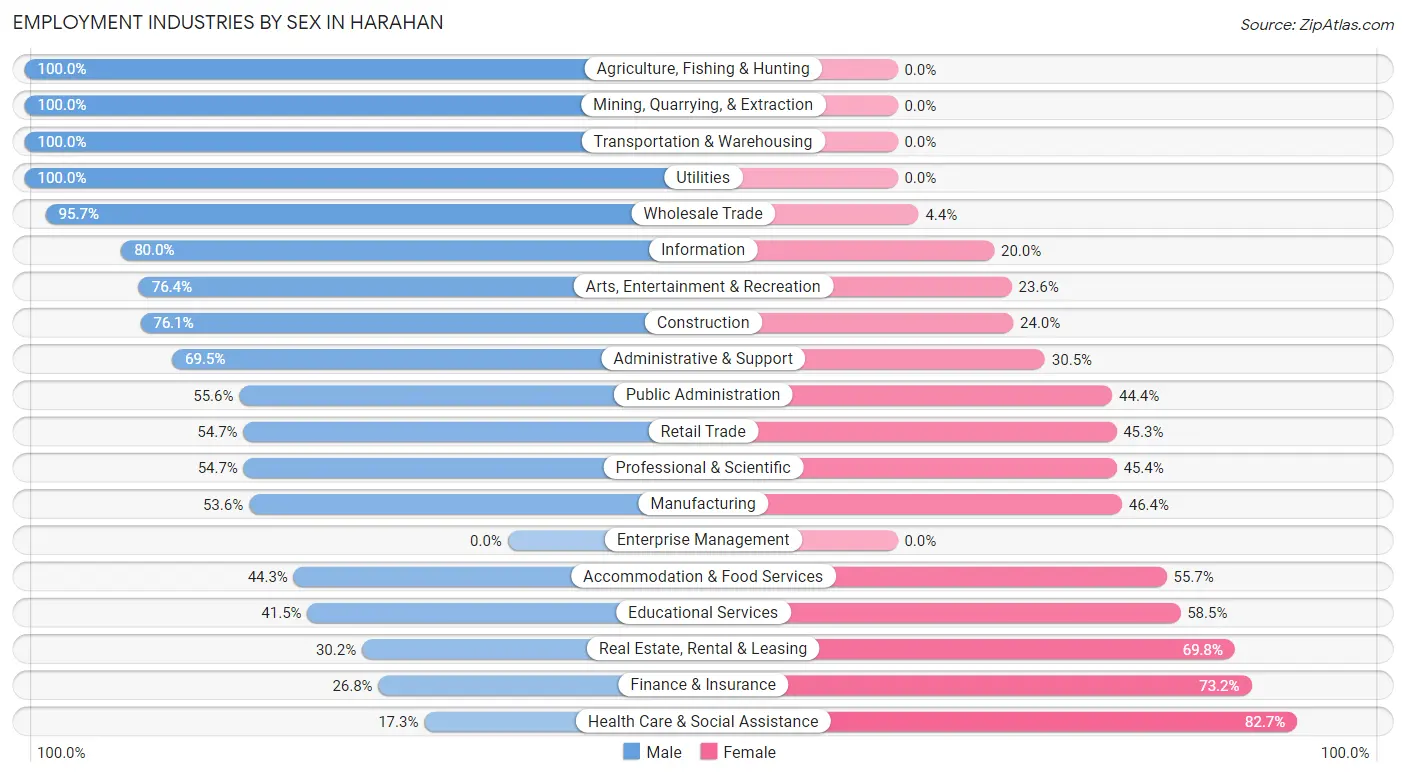
| Industry | Male | Female |
| Agriculture, Fishing & Hunting | 10 (100.0%) | 0 (0.0%) |
| Mining, Quarrying, & Extraction | 22 (100.0%) | 0 (0.0%) |
| Construction | 200 (76.0%) | 63 (23.9%) |
| Manufacturing | 158 (53.6%) | 137 (46.4%) |
| Wholesale Trade | 286 (95.7%) | 13 (4.3%) |
| Retail Trade | 244 (54.7%) | 202 (45.3%) |
| Transportation & Warehousing | 80 (100.0%) | 0 (0.0%) |
| Utilities | 11 (100.0%) | 0 (0.0%) |
| Information | 28 (80.0%) | 7 (20.0%) |
| Finance & Insurance | 38 (26.8%) | 104 (73.2%) |
| Real Estate, Rental & Leasing | 35 (30.2%) | 81 (69.8%) |
| Professional & Scientific | 235 (54.6%) | 195 (45.4%) |
| Enterprise Management | 0 (0.0%) | 0 (0.0%) |
| Administrative & Support | 66 (69.5%) | 29 (30.5%) |
| Educational Services | 182 (41.5%) | 257 (58.5%) |
| Health Care & Social Assistance | 174 (17.3%) | 833 (82.7%) |
| Arts, Entertainment & Recreation | 42 (76.4%) | 13 (23.6%) |
| Accommodation & Food Services | 167 (44.3%) | 210 (55.7%) |
| Public Administration | 175 (55.6%) | 140 (44.4%) |
| Total | 2,243 (48.0%) | 2,434 (52.0%) |
Education in Harahan
School Enrollment in Harahan
The most common levels of schooling among the 1,715 students in Harahan are high school (409 | 23.8%), college / undergraduate (373 | 21.7%), and middle school (355 | 20.7%).
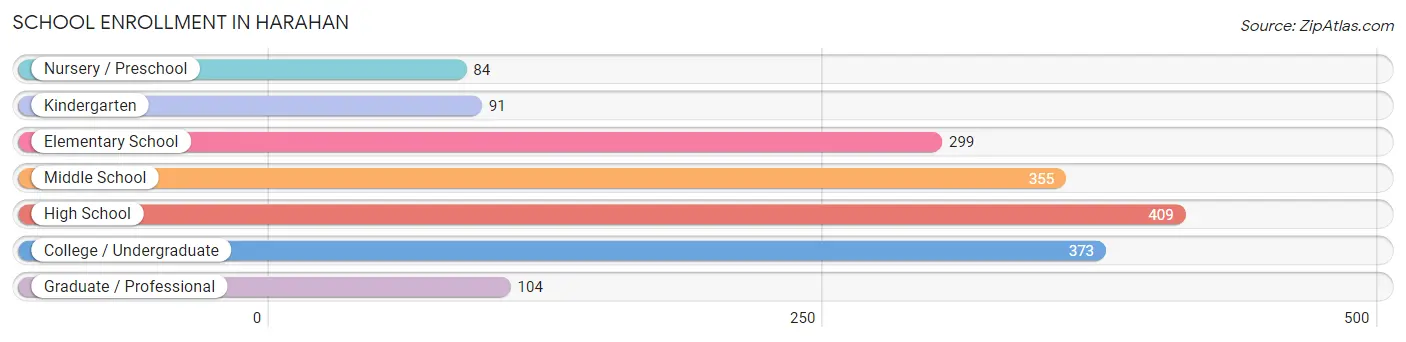
| School Level | # Students | % Students |
| Nursery / Preschool | 84 | 4.9% |
| Kindergarten | 91 | 5.3% |
| Elementary School | 299 | 17.4% |
| Middle School | 355 | 20.7% |
| High School | 409 | 23.8% |
| College / Undergraduate | 373 | 21.7% |
| Graduate / Professional | 104 | 6.1% |
| Total | 1,715 | 100.0% |
School Enrollment by Age by Funding Source in Harahan
Out of a total of 1,715 students who are enrolled in schools in Harahan, 928 (54.1%) attend a private institution, while the remaining 787 (45.9%) are enrolled in public schools. The age group of 3 to 4 year olds has the highest likelihood of being enrolled in private schools, with 71 (100.0% in the age bracket) enrolled. Conversely, the age group of 20 to 24 year olds has the lowest likelihood of being enrolled in a private school, with 143 (91.7% in the age bracket) attending a public institution.
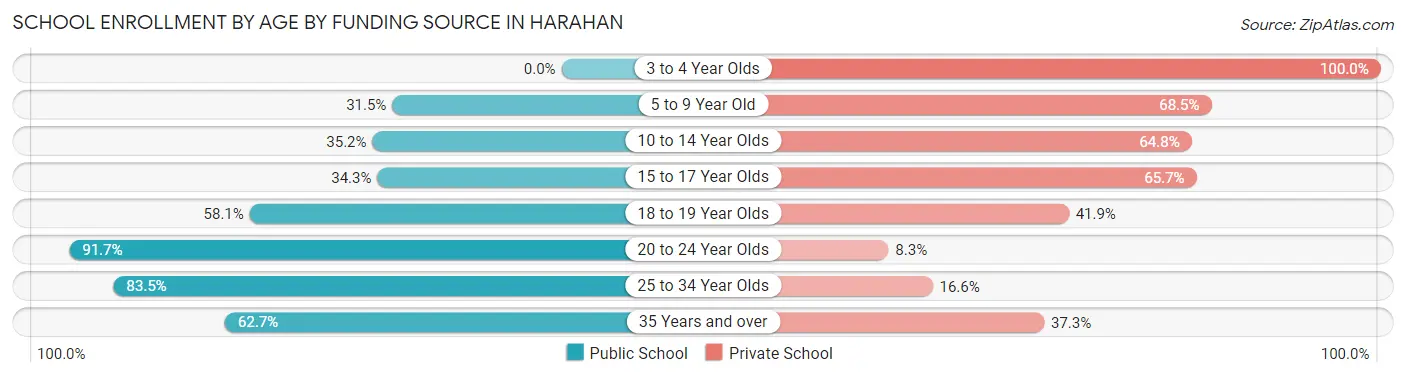
| Age Bracket | Public School | Private School |
| 3 to 4 Year Olds | 0 (0.0%) | 71 (100.0%) |
| 5 to 9 Year Old | 128 (31.5%) | 278 (68.5%) |
| 10 to 14 Year Olds | 149 (35.2%) | 274 (64.8%) |
| 15 to 17 Year Olds | 83 (34.3%) | 159 (65.7%) |
| 18 to 19 Year Olds | 79 (58.1%) | 57 (41.9%) |
| 20 to 24 Year Olds | 143 (91.7%) | 13 (8.3%) |
| 25 to 34 Year Olds | 116 (83.5%) | 23 (16.6%) |
| 35 Years and over | 89 (62.7%) | 53 (37.3%) |
| Total | 787 (45.9%) | 928 (54.1%) |
Educational Attainment by Field of Study in Harahan
Science & technology (628 | 24.4%), business (565 | 21.9%), education (221 | 8.6%), engineering (209 | 8.1%), and social sciences (168 | 6.5%) are the most common fields of study among 2,577 individuals in Harahan who have obtained a bachelor's degree or higher.
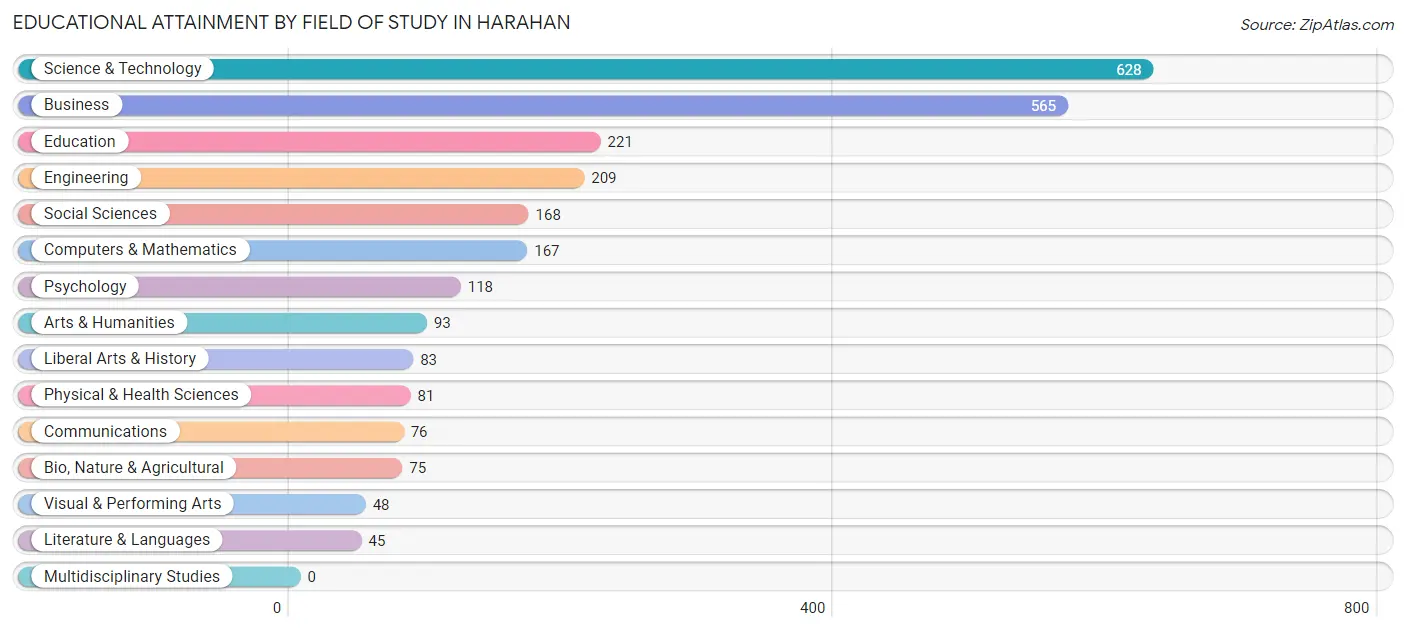
| Field of Study | # Graduates | % Graduates |
| Computers & Mathematics | 167 | 6.5% |
| Bio, Nature & Agricultural | 75 | 2.9% |
| Physical & Health Sciences | 81 | 3.1% |
| Psychology | 118 | 4.6% |
| Social Sciences | 168 | 6.5% |
| Engineering | 209 | 8.1% |
| Multidisciplinary Studies | 0 | 0.0% |
| Science & Technology | 628 | 24.4% |
| Business | 565 | 21.9% |
| Education | 221 | 8.6% |
| Literature & Languages | 45 | 1.8% |
| Liberal Arts & History | 83 | 3.2% |
| Visual & Performing Arts | 48 | 1.9% |
| Communications | 76 | 2.9% |
| Arts & Humanities | 93 | 3.6% |
| Total | 2,577 | 100.0% |
Transportation & Commute in Harahan
Vehicle Availability by Sex in Harahan
The most prevalent vehicle ownership categories in Harahan are males with 2 vehicles (1,044, accounting for 46.5%) and females with 2 vehicles (1,017, making up 43.3%).
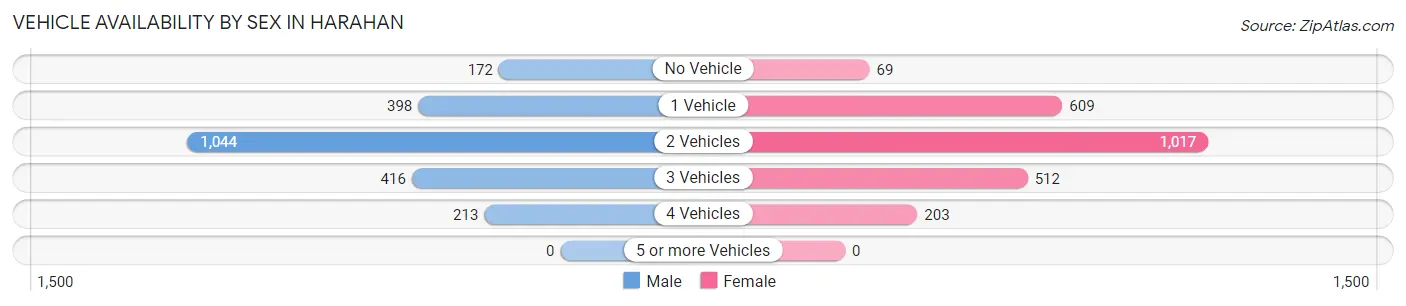
| Vehicles Available | Male | Female |
| No Vehicle | 172 (7.7%) | 69 (2.9%) |
| 1 Vehicle | 398 (17.7%) | 609 (25.3%) |
| 2 Vehicles | 1,044 (46.5%) | 1,017 (42.2%) |
| 3 Vehicles | 416 (18.5%) | 512 (21.2%) |
| 4 Vehicles | 213 (9.5%) | 203 (8.4%) |
| 5 or more Vehicles | 0 (0.0%) | 0 (0.0%) |
| Total | 2,243 (100.0%) | 2,410 (100.0%) |
Commute Time in Harahan
The most frequently occuring commute durations in Harahan are 15 to 19 minutes (980 commuters, 22.3%), 30 to 34 minutes (777 commuters, 17.7%), and 20 to 24 minutes (728 commuters, 16.6%).
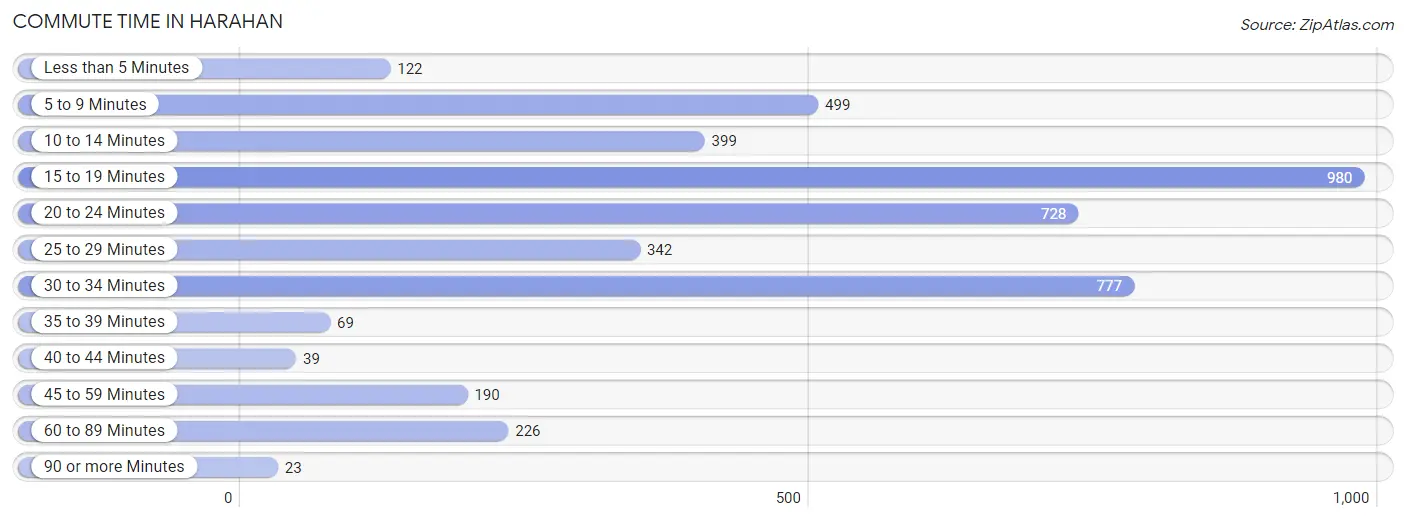
| Commute Time | # Commuters | % Commuters |
| Less than 5 Minutes | 122 | 2.8% |
| 5 to 9 Minutes | 499 | 11.4% |
| 10 to 14 Minutes | 399 | 9.1% |
| 15 to 19 Minutes | 980 | 22.3% |
| 20 to 24 Minutes | 728 | 16.6% |
| 25 to 29 Minutes | 342 | 7.8% |
| 30 to 34 Minutes | 777 | 17.7% |
| 35 to 39 Minutes | 69 | 1.6% |
| 40 to 44 Minutes | 39 | 0.9% |
| 45 to 59 Minutes | 190 | 4.3% |
| 60 to 89 Minutes | 226 | 5.1% |
| 90 or more Minutes | 23 | 0.5% |
Commute Time by Sex in Harahan
The most common commute times in Harahan are 15 to 19 minutes (409 commuters, 19.3%) for males and 15 to 19 minutes (571 commuters, 25.1%) for females.

| Commute Time | Male | Female |
| Less than 5 Minutes | 55 (2.6%) | 67 (2.9%) |
| 5 to 9 Minutes | 208 (9.8%) | 291 (12.8%) |
| 10 to 14 Minutes | 198 (9.3%) | 201 (8.8%) |
| 15 to 19 Minutes | 409 (19.3%) | 571 (25.1%) |
| 20 to 24 Minutes | 384 (18.1%) | 344 (15.1%) |
| 25 to 29 Minutes | 205 (9.7%) | 137 (6.0%) |
| 30 to 34 Minutes | 347 (16.3%) | 430 (18.9%) |
| 35 to 39 Minutes | 20 (0.9%) | 49 (2.2%) |
| 40 to 44 Minutes | 9 (0.4%) | 30 (1.3%) |
| 45 to 59 Minutes | 126 (5.9%) | 64 (2.8%) |
| 60 to 89 Minutes | 139 (6.6%) | 87 (3.8%) |
| 90 or more Minutes | 23 (1.1%) | 0 (0.0%) |
Time of Departure to Work by Sex in Harahan
The most frequent times of departure to work in Harahan are 7:30 AM to 7:59 AM (441, 20.8%) for males and 7:30 AM to 7:59 AM (573, 25.2%) for females.
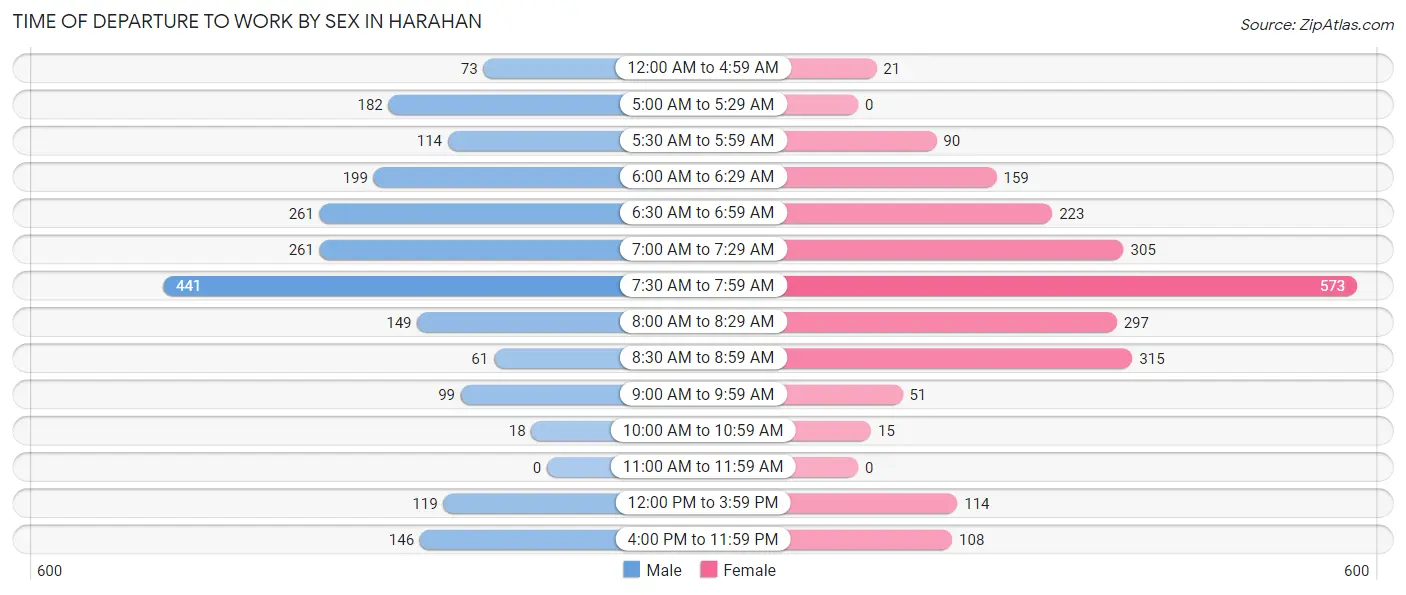
| Time of Departure | Male | Female |
| 12:00 AM to 4:59 AM | 73 (3.4%) | 21 (0.9%) |
| 5:00 AM to 5:29 AM | 182 (8.6%) | 0 (0.0%) |
| 5:30 AM to 5:59 AM | 114 (5.4%) | 90 (4.0%) |
| 6:00 AM to 6:29 AM | 199 (9.4%) | 159 (7.0%) |
| 6:30 AM to 6:59 AM | 261 (12.3%) | 223 (9.8%) |
| 7:00 AM to 7:29 AM | 261 (12.3%) | 305 (13.4%) |
| 7:30 AM to 7:59 AM | 441 (20.8%) | 573 (25.2%) |
| 8:00 AM to 8:29 AM | 149 (7.0%) | 297 (13.1%) |
| 8:30 AM to 8:59 AM | 61 (2.9%) | 315 (13.9%) |
| 9:00 AM to 9:59 AM | 99 (4.7%) | 51 (2.2%) |
| 10:00 AM to 10:59 AM | 18 (0.9%) | 15 (0.7%) |
| 11:00 AM to 11:59 AM | 0 (0.0%) | 0 (0.0%) |
| 12:00 PM to 3:59 PM | 119 (5.6%) | 114 (5.0%) |
| 4:00 PM to 11:59 PM | 146 (6.9%) | 108 (4.8%) |
| Total | 2,123 (100.0%) | 2,271 (100.0%) |
Housing Occupancy in Harahan
Occupancy by Ownership in Harahan
Of the total 4,085 dwellings in Harahan, owner-occupied units account for 3,274 (80.1%), while renter-occupied units make up 811 (19.9%).
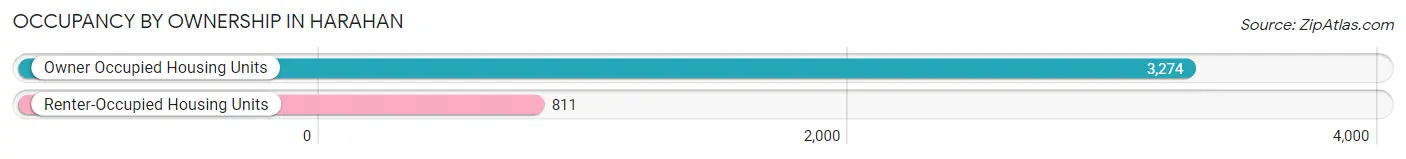
| Occupancy | # Housing Units | % Housing Units |
| Owner Occupied Housing Units | 3,274 | 80.1% |
| Renter-Occupied Housing Units | 811 | 19.9% |
| Total Occupied Housing Units | 4,085 | 100.0% |
Occupancy by Household Size in Harahan
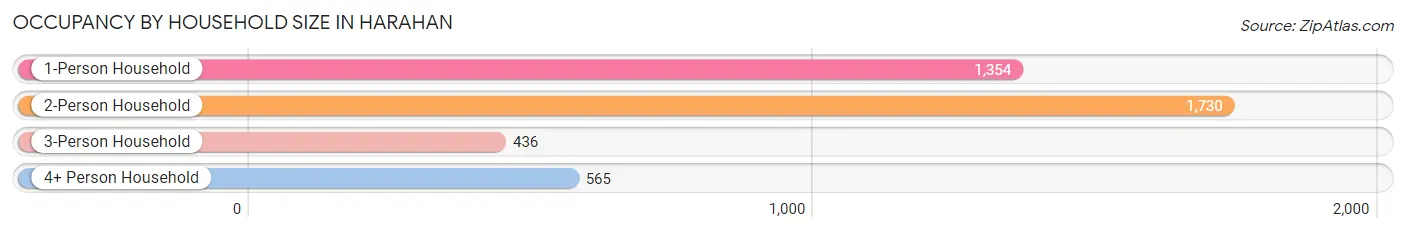
| Household Size | # Housing Units | % Housing Units |
| 1-Person Household | 1,354 | 33.2% |
| 2-Person Household | 1,730 | 42.3% |
| 3-Person Household | 436 | 10.7% |
| 4+ Person Household | 565 | 13.8% |
| Total Housing Units | 4,085 | 100.0% |
Occupancy by Ownership by Household Size in Harahan
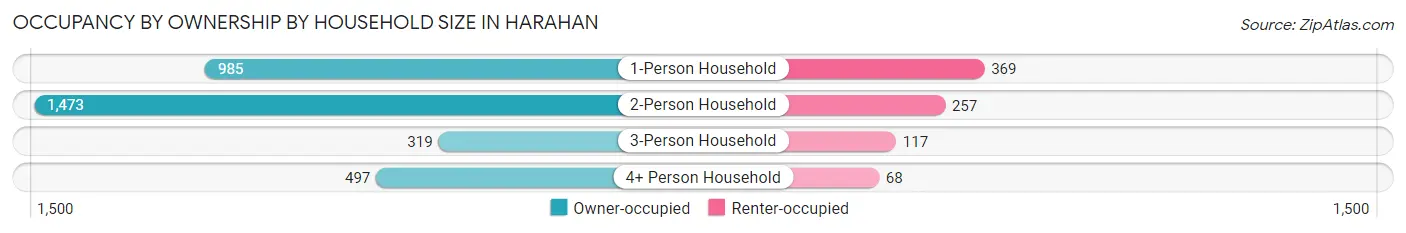
| Household Size | Owner-occupied | Renter-occupied |
| 1-Person Household | 985 (72.8%) | 369 (27.3%) |
| 2-Person Household | 1,473 (85.1%) | 257 (14.9%) |
| 3-Person Household | 319 (73.2%) | 117 (26.8%) |
| 4+ Person Household | 497 (88.0%) | 68 (12.0%) |
| Total Housing Units | 3,274 (80.1%) | 811 (19.9%) |
Occupancy by Educational Attainment in Harahan
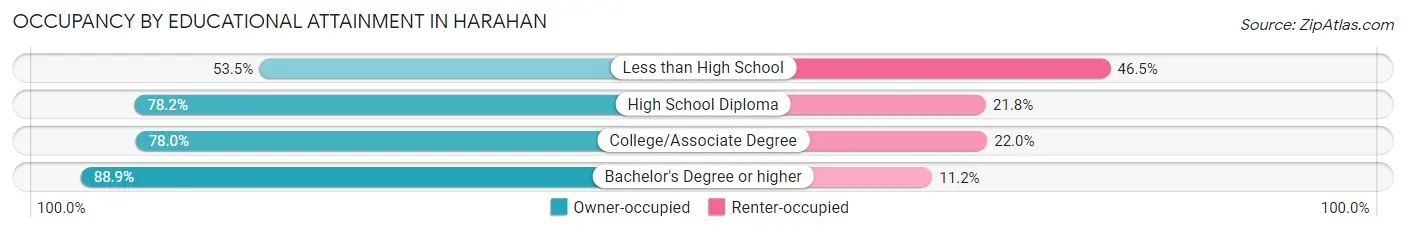
| Household Size | Owner-occupied | Renter-occupied |
| Less than High School | 152 (53.5%) | 132 (46.5%) |
| High School Diploma | 768 (78.2%) | 214 (21.8%) |
| College/Associate Degree | 1,079 (78.0%) | 305 (22.0%) |
| Bachelor's Degree or higher | 1,275 (88.8%) | 160 (11.2%) |
Occupancy by Age of Householder in Harahan
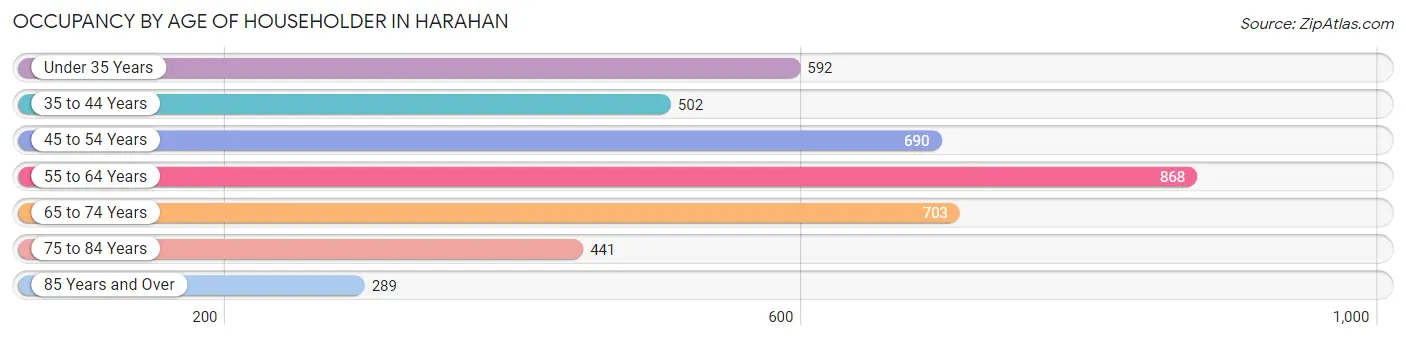
| Age Bracket | # Households | % Households |
| Under 35 Years | 592 | 14.5% |
| 35 to 44 Years | 502 | 12.3% |
| 45 to 54 Years | 690 | 16.9% |
| 55 to 64 Years | 868 | 21.2% |
| 65 to 74 Years | 703 | 17.2% |
| 75 to 84 Years | 441 | 10.8% |
| 85 Years and Over | 289 | 7.1% |
| Total | 4,085 | 100.0% |
Housing Finances in Harahan
Median Income by Occupancy in Harahan
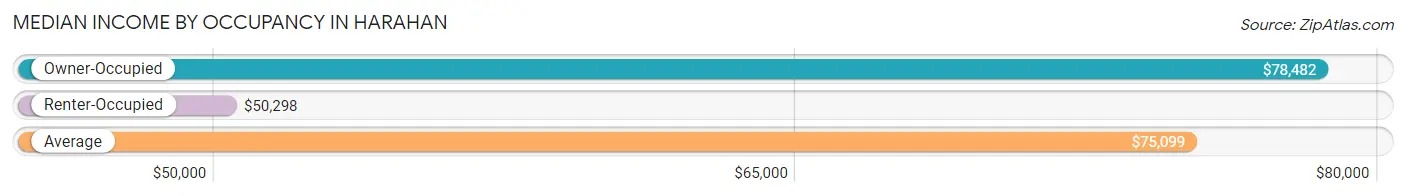
| Occupancy Type | # Households | Median Income |
| Owner-Occupied | 3,274 (80.1%) | $78,482 |
| Renter-Occupied | 811 (19.9%) | $50,298 |
| Average | 4,085 (100.0%) | $75,099 |
Occupancy by Householder Income Bracket in Harahan
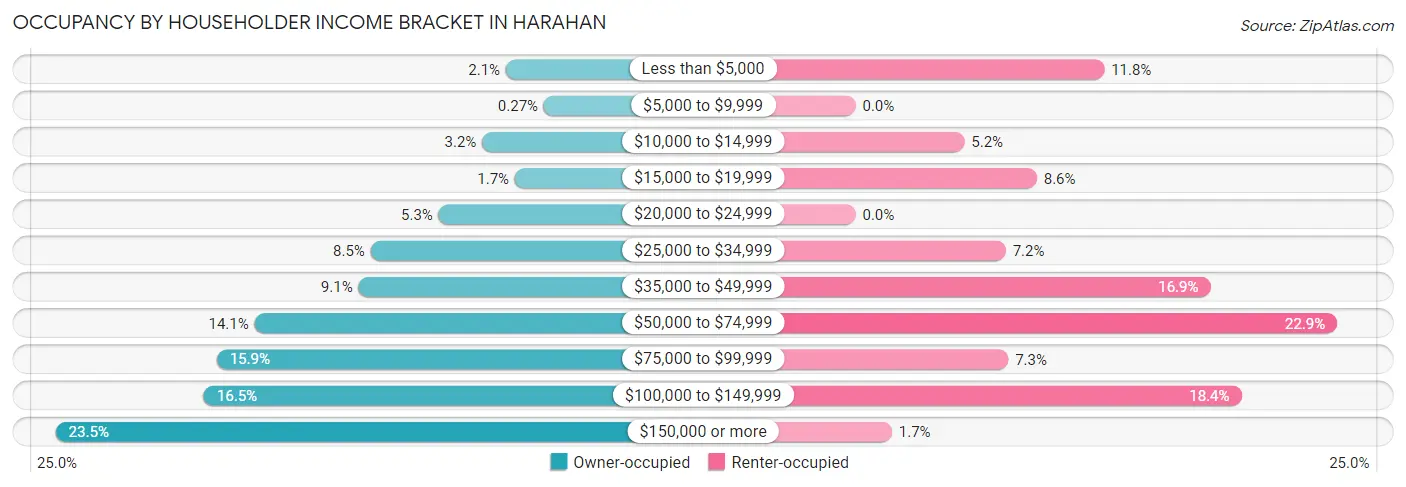
| Income Bracket | Owner-occupied | Renter-occupied |
| Less than $5,000 | 68 (2.1%) | 96 (11.8%) |
| $5,000 to $9,999 | 9 (0.3%) | 0 (0.0%) |
| $10,000 to $14,999 | 105 (3.2%) | 42 (5.2%) |
| $15,000 to $19,999 | 54 (1.7%) | 70 (8.6%) |
| $20,000 to $24,999 | 173 (5.3%) | 0 (0.0%) |
| $25,000 to $34,999 | 279 (8.5%) | 58 (7.1%) |
| $35,000 to $49,999 | 298 (9.1%) | 137 (16.9%) |
| $50,000 to $74,999 | 460 (14.1%) | 186 (22.9%) |
| $75,000 to $99,999 | 519 (15.9%) | 59 (7.3%) |
| $100,000 to $149,999 | 539 (16.5%) | 149 (18.4%) |
| $150,000 or more | 770 (23.5%) | 14 (1.7%) |
| Total | 3,274 (100.0%) | 811 (100.0%) |
Monthly Housing Cost Tiers in Harahan
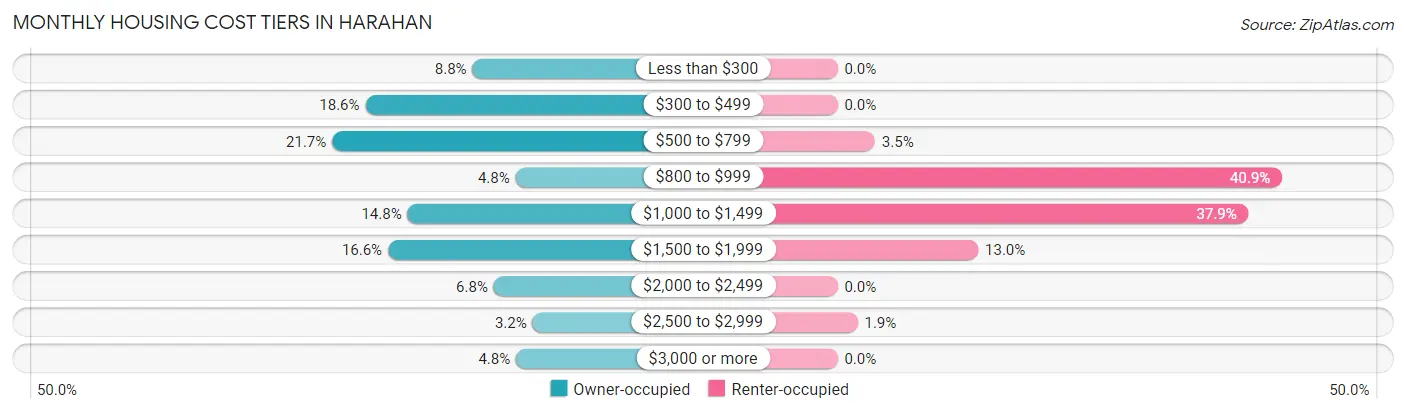
| Monthly Cost | Owner-occupied | Renter-occupied |
| Less than $300 | 287 (8.8%) | 0 (0.0%) |
| $300 to $499 | 610 (18.6%) | 0 (0.0%) |
| $500 to $799 | 710 (21.7%) | 28 (3.5%) |
| $800 to $999 | 157 (4.8%) | 332 (40.9%) |
| $1,000 to $1,499 | 483 (14.7%) | 307 (37.9%) |
| $1,500 to $1,999 | 542 (16.6%) | 105 (13.0%) |
| $2,000 to $2,499 | 223 (6.8%) | 0 (0.0%) |
| $2,500 to $2,999 | 106 (3.2%) | 15 (1.8%) |
| $3,000 or more | 156 (4.8%) | 0 (0.0%) |
| Total | 3,274 (100.0%) | 811 (100.0%) |
Physical Housing Characteristics in Harahan
Housing Structures in Harahan
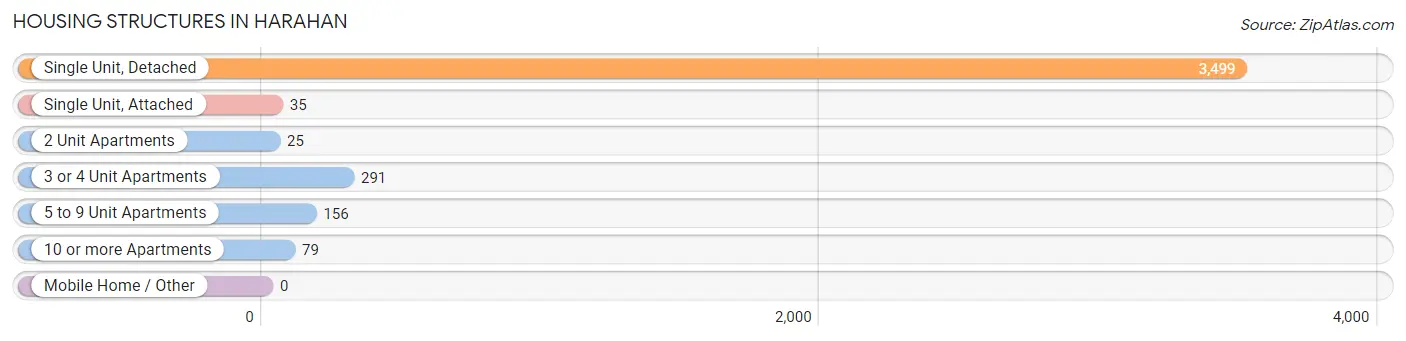
| Structure Type | # Housing Units | % Housing Units |
| Single Unit, Detached | 3,499 | 85.7% |
| Single Unit, Attached | 35 | 0.9% |
| 2 Unit Apartments | 25 | 0.6% |
| 3 or 4 Unit Apartments | 291 | 7.1% |
| 5 to 9 Unit Apartments | 156 | 3.8% |
| 10 or more Apartments | 79 | 1.9% |
| Mobile Home / Other | 0 | 0.0% |
| Total | 4,085 | 100.0% |
Housing Structures by Occupancy in Harahan
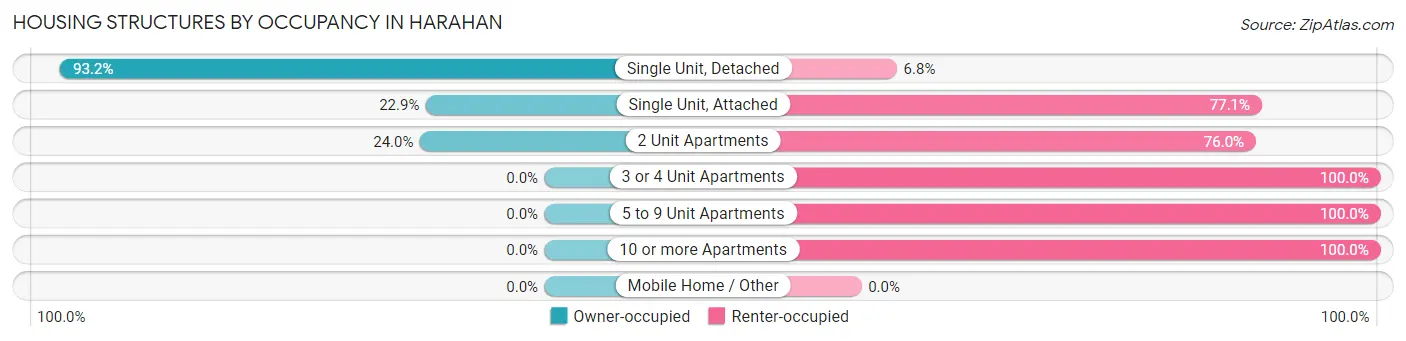
| Structure Type | Owner-occupied | Renter-occupied |
| Single Unit, Detached | 3,260 (93.2%) | 239 (6.8%) |
| Single Unit, Attached | 8 (22.9%) | 27 (77.1%) |
| 2 Unit Apartments | 6 (24.0%) | 19 (76.0%) |
| 3 or 4 Unit Apartments | 0 (0.0%) | 291 (100.0%) |
| 5 to 9 Unit Apartments | 0 (0.0%) | 156 (100.0%) |
| 10 or more Apartments | 0 (0.0%) | 79 (100.0%) |
| Mobile Home / Other | 0 (0.0%) | 0 (0.0%) |
| Total | 3,274 (80.1%) | 811 (19.9%) |
Housing Structures by Number of Rooms in Harahan
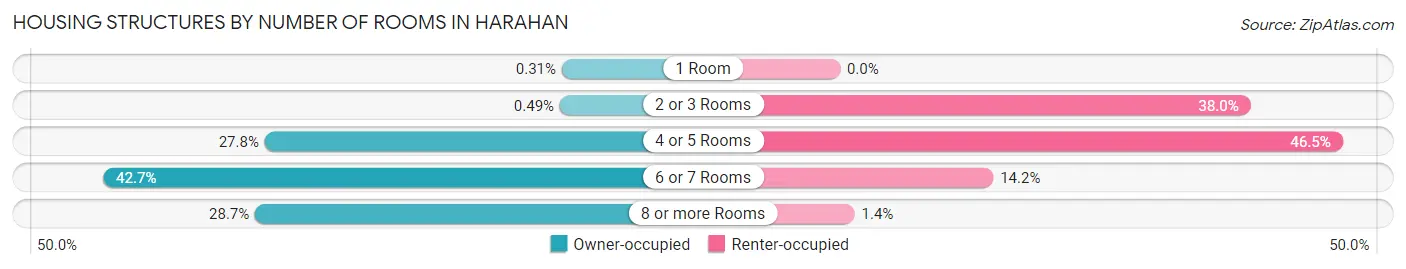
| Number of Rooms | Owner-occupied | Renter-occupied |
| 1 Room | 10 (0.3%) | 0 (0.0%) |
| 2 or 3 Rooms | 16 (0.5%) | 308 (38.0%) |
| 4 or 5 Rooms | 910 (27.8%) | 377 (46.5%) |
| 6 or 7 Rooms | 1,399 (42.7%) | 115 (14.2%) |
| 8 or more Rooms | 939 (28.7%) | 11 (1.4%) |
| Total | 3,274 (100.0%) | 811 (100.0%) |
Housing Structure by Heating Type in Harahan
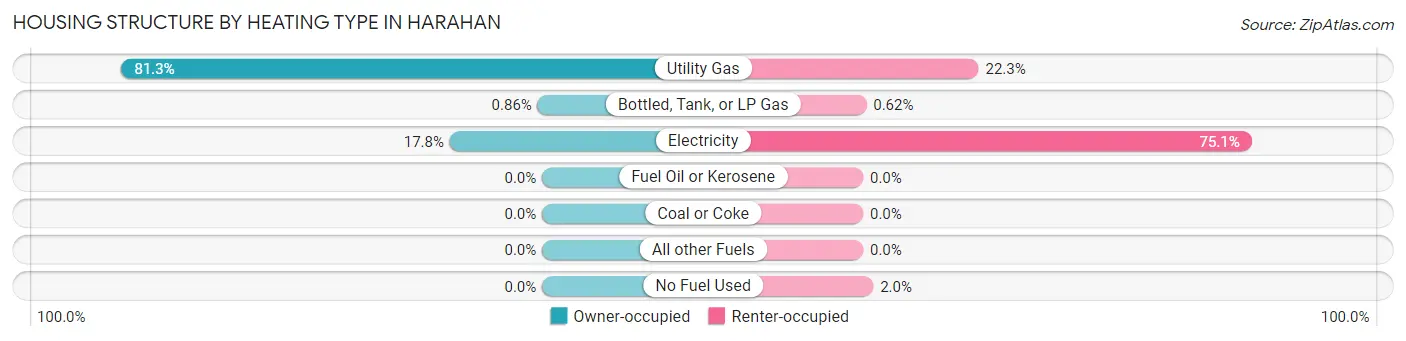
| Heating Type | Owner-occupied | Renter-occupied |
| Utility Gas | 2,662 (81.3%) | 181 (22.3%) |
| Bottled, Tank, or LP Gas | 28 (0.9%) | 5 (0.6%) |
| Electricity | 584 (17.8%) | 609 (75.1%) |
| Fuel Oil or Kerosene | 0 (0.0%) | 0 (0.0%) |
| Coal or Coke | 0 (0.0%) | 0 (0.0%) |
| All other Fuels | 0 (0.0%) | 0 (0.0%) |
| No Fuel Used | 0 (0.0%) | 16 (2.0%) |
| Total | 3,274 (100.0%) | 811 (100.0%) |
Household Vehicle Usage in Harahan
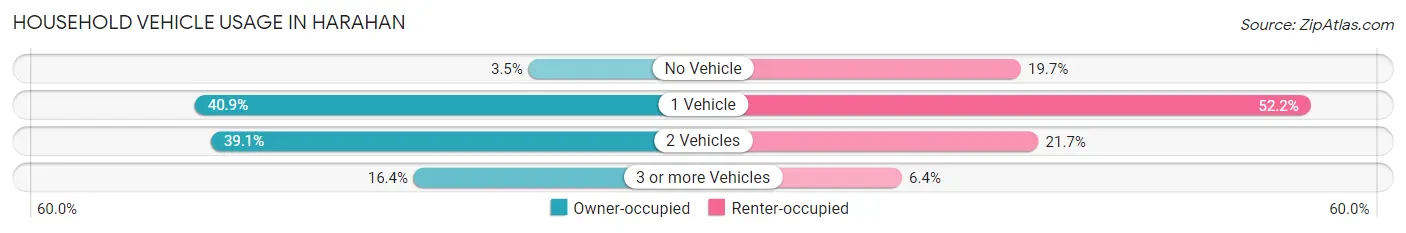
| Vehicles per Household | Owner-occupied | Renter-occupied |
| No Vehicle | 116 (3.5%) | 160 (19.7%) |
| 1 Vehicle | 1,340 (40.9%) | 423 (52.2%) |
| 2 Vehicles | 1,281 (39.1%) | 176 (21.7%) |
| 3 or more Vehicles | 537 (16.4%) | 52 (6.4%) |
| Total | 3,274 (100.0%) | 811 (100.0%) |
Real Estate & Mortgages in Harahan
Real Estate and Mortgage Overview in Harahan
| Characteristic | Without Mortgage | With Mortgage |
| Housing Units | 1,750 | 1,524 |
| Median Property Value | $289,200 | $278,900 |
| Median Household Income | $73,490 | $486 |
| Monthly Housing Costs | $513 | $156 |
| Real Estate Taxes | $1,188 | $0 |
Property Value by Mortgage Status in Harahan
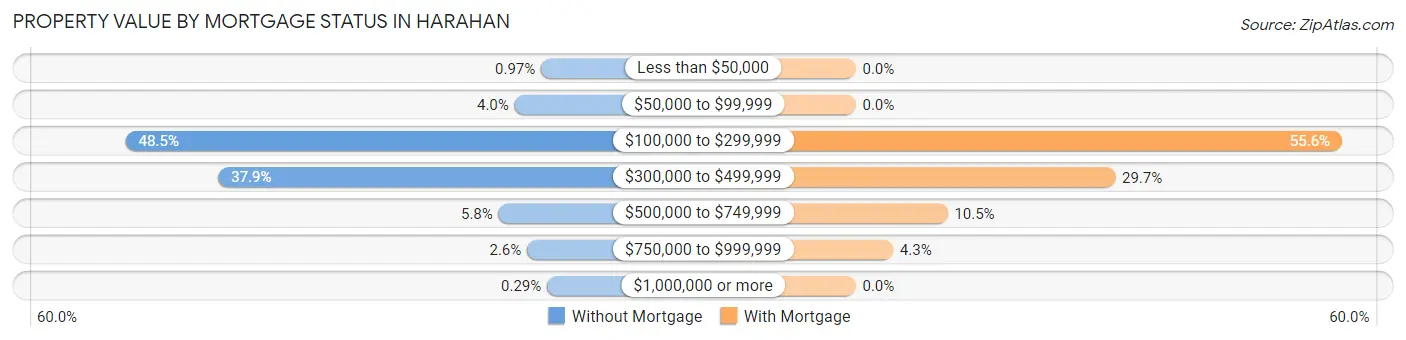
| Property Value | Without Mortgage | With Mortgage |
| Less than $50,000 | 17 (1.0%) | 0 (0.0%) |
| $50,000 to $99,999 | 70 (4.0%) | 0 (0.0%) |
| $100,000 to $299,999 | 848 (48.5%) | 847 (55.6%) |
| $300,000 to $499,999 | 663 (37.9%) | 452 (29.7%) |
| $500,000 to $749,999 | 102 (5.8%) | 160 (10.5%) |
| $750,000 to $999,999 | 45 (2.6%) | 65 (4.3%) |
| $1,000,000 or more | 5 (0.3%) | 0 (0.0%) |
| Total | 1,750 (100.0%) | 1,524 (100.0%) |
Household Income by Mortgage Status in Harahan
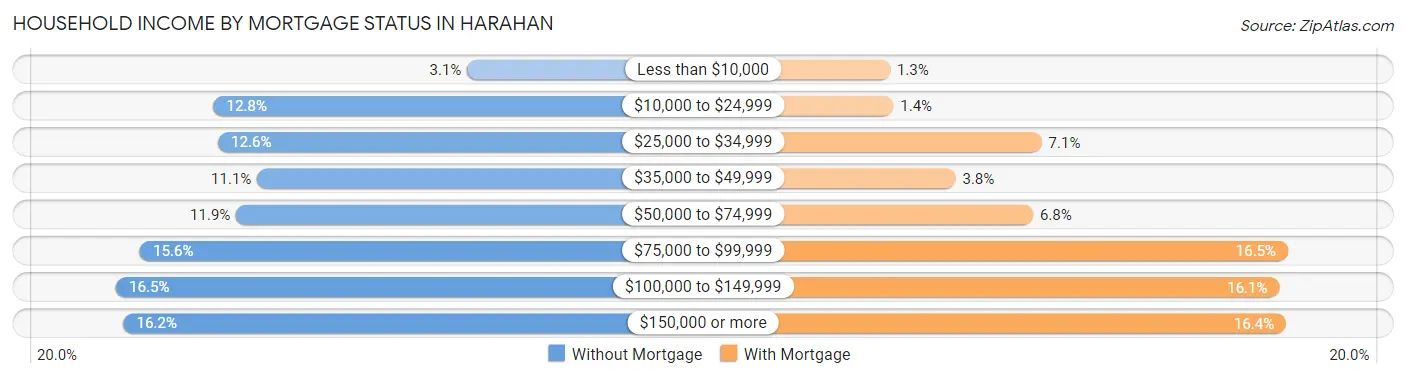
| Household Income | Without Mortgage | With Mortgage |
| Less than $10,000 | 55 (3.1%) | 20 (1.3%) |
| $10,000 to $24,999 | 224 (12.8%) | 22 (1.4%) |
| $25,000 to $34,999 | 221 (12.6%) | 108 (7.1%) |
| $35,000 to $49,999 | 195 (11.1%) | 58 (3.8%) |
| $50,000 to $74,999 | 209 (11.9%) | 103 (6.8%) |
| $75,000 to $99,999 | 273 (15.6%) | 251 (16.5%) |
| $100,000 to $149,999 | 289 (16.5%) | 246 (16.1%) |
| $150,000 or more | 284 (16.2%) | 250 (16.4%) |
| Total | 1,750 (100.0%) | 1,524 (100.0%) |
Property Value to Household Income Ratio in Harahan
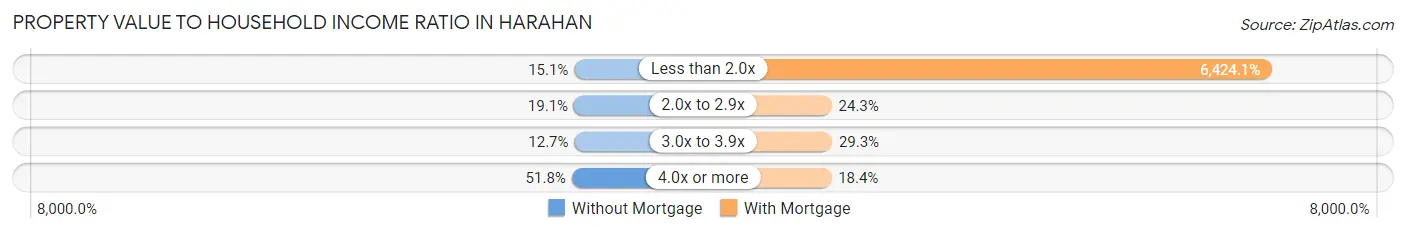
| Value-to-Income Ratio | Without Mortgage | With Mortgage |
| Less than 2.0x | 265 (15.1%) | 97,903 (6,424.1%) |
| 2.0x to 2.9x | 335 (19.1%) | 371 (24.3%) |
| 3.0x to 3.9x | 222 (12.7%) | 447 (29.3%) |
| 4.0x or more | 907 (51.8%) | 281 (18.4%) |
| Total | 1,750 (100.0%) | 1,524 (100.0%) |
Real Estate Taxes by Mortgage Status in Harahan
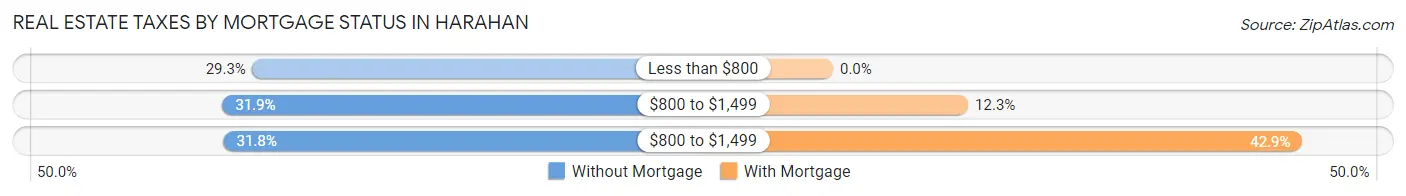
| Property Taxes | Without Mortgage | With Mortgage |
| Less than $800 | 512 (29.3%) | 0 (0.0%) |
| $800 to $1,499 | 559 (31.9%) | 188 (12.3%) |
| $800 to $1,499 | 557 (31.8%) | 653 (42.8%) |
| Total | 1,750 (100.0%) | 1,524 (100.0%) |
Health & Disability in Harahan
Health Insurance Coverage by Age in Harahan
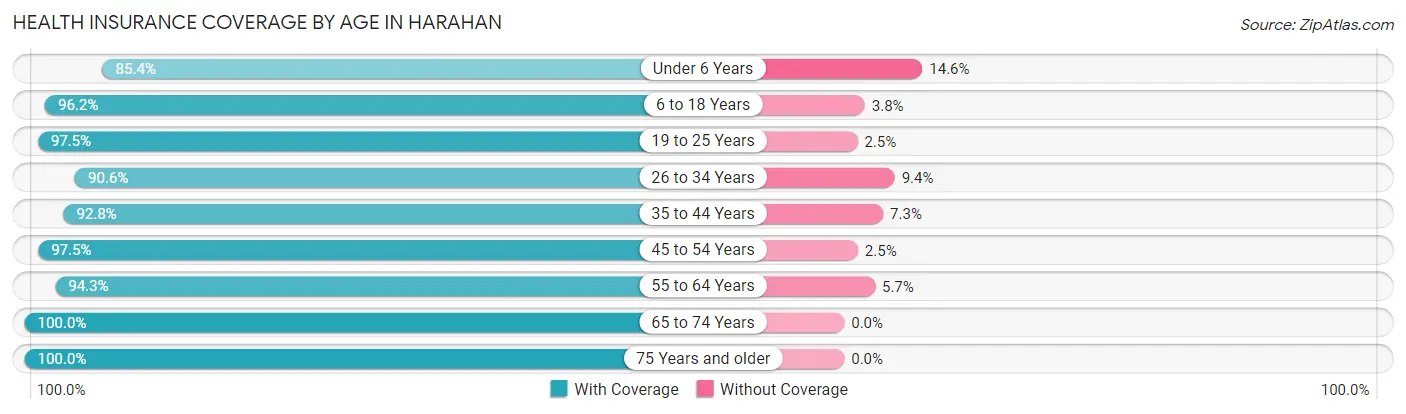
| Age Bracket | With Coverage | Without Coverage |
| Under 6 Years | 264 (85.4%) | 45 (14.6%) |
| 6 to 18 Years | 1,129 (96.2%) | 45 (3.8%) |
| 19 to 25 Years | 715 (97.5%) | 18 (2.5%) |
| 26 to 34 Years | 847 (90.6%) | 88 (9.4%) |
| 35 to 44 Years | 1,062 (92.7%) | 83 (7.2%) |
| 45 to 54 Years | 1,074 (97.5%) | 28 (2.5%) |
| 55 to 64 Years | 1,381 (94.3%) | 84 (5.7%) |
| 65 to 74 Years | 1,118 (100.0%) | 0 (0.0%) |
| 75 Years and older | 902 (100.0%) | 0 (0.0%) |
| Total | 8,492 (95.6%) | 391 (4.4%) |
Health Insurance Coverage by Citizenship Status in Harahan
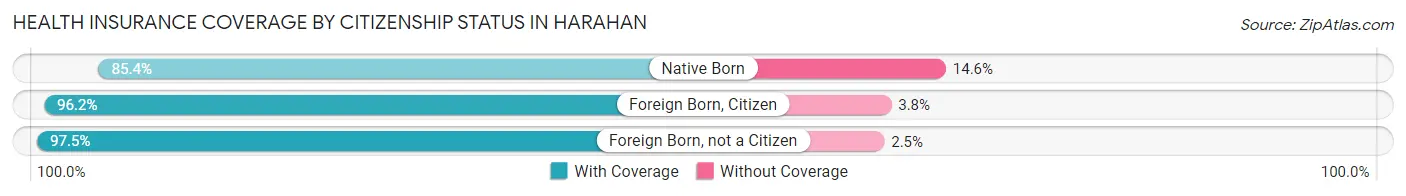
| Citizenship Status | With Coverage | Without Coverage |
| Native Born | 264 (85.4%) | 45 (14.6%) |
| Foreign Born, Citizen | 1,129 (96.2%) | 45 (3.8%) |
| Foreign Born, not a Citizen | 715 (97.5%) | 18 (2.5%) |
Health Insurance Coverage by Household Income in Harahan
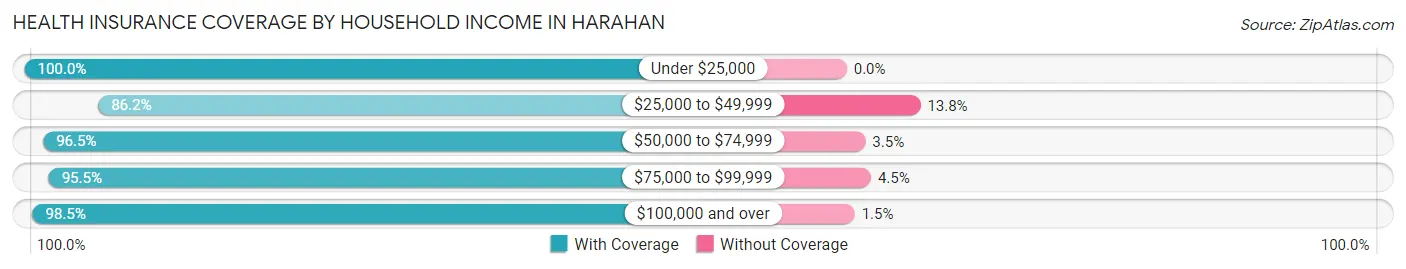
| Household Income | With Coverage | Without Coverage |
| Under $25,000 | 834 (100.0%) | 0 (0.0%) |
| $25,000 to $49,999 | 1,505 (86.2%) | 241 (13.8%) |
| $50,000 to $74,999 | 941 (96.5%) | 34 (3.5%) |
| $75,000 to $99,999 | 1,138 (95.5%) | 54 (4.5%) |
| $100,000 and over | 4,061 (98.5%) | 61 (1.5%) |
Public vs Private Health Insurance Coverage by Age in Harahan
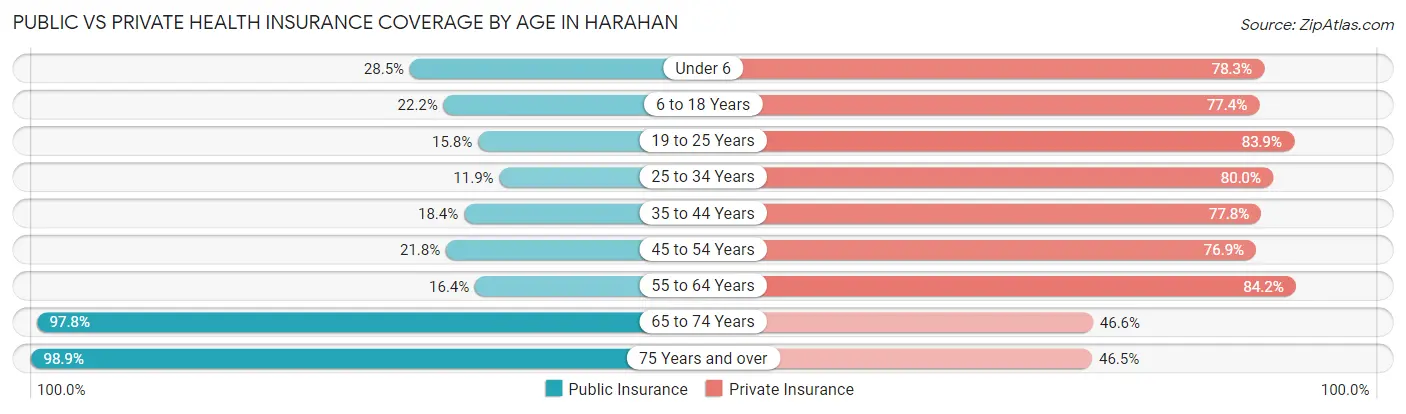
| Age Bracket | Public Insurance | Private Insurance |
| Under 6 | 88 (28.5%) | 242 (78.3%) |
| 6 to 18 Years | 261 (22.2%) | 909 (77.4%) |
| 19 to 25 Years | 116 (15.8%) | 615 (83.9%) |
| 25 to 34 Years | 111 (11.9%) | 748 (80.0%) |
| 35 to 44 Years | 211 (18.4%) | 891 (77.8%) |
| 45 to 54 Years | 240 (21.8%) | 847 (76.9%) |
| 55 to 64 Years | 240 (16.4%) | 1,234 (84.2%) |
| 65 to 74 Years | 1,093 (97.8%) | 521 (46.6%) |
| 75 Years and over | 892 (98.9%) | 419 (46.5%) |
| Total | 3,252 (36.6%) | 6,426 (72.3%) |
Disability Status by Sex by Age in Harahan
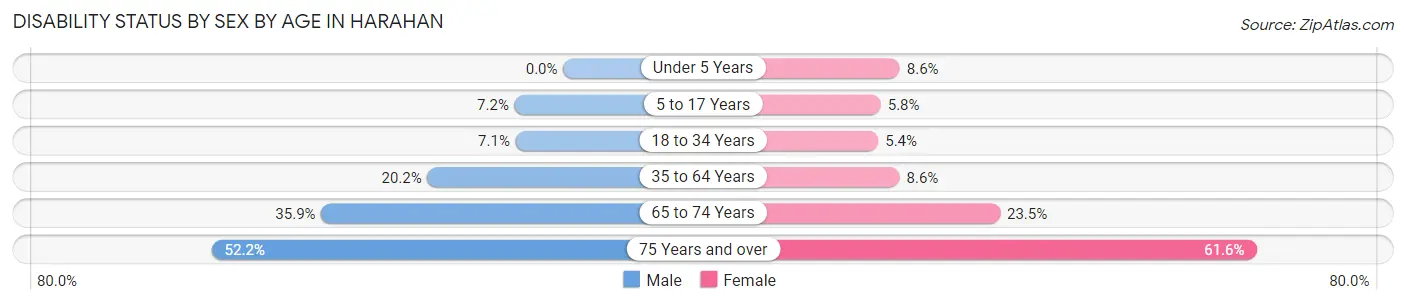
| Age Bracket | Male | Female |
| Under 5 Years | 0 (0.0%) | 10 (8.6%) |
| 5 to 17 Years | 34 (7.2%) | 39 (5.8%) |
| 18 to 34 Years | 57 (7.1%) | 51 (5.4%) |
| 35 to 64 Years | 361 (20.2%) | 165 (8.6%) |
| 65 to 74 Years | 180 (35.9%) | 145 (23.5%) |
| 75 Years and over | 141 (52.2%) | 389 (61.6%) |
Disability Class by Sex by Age in Harahan
Disability Class: Hearing Difficulty
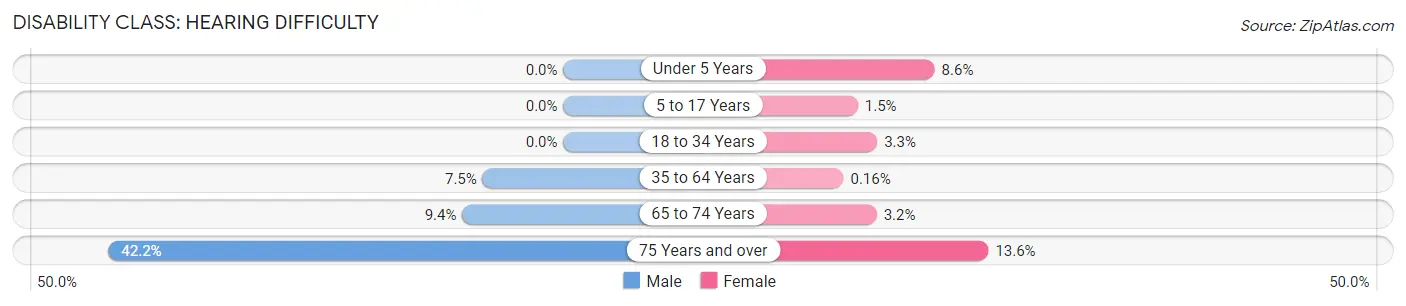
| Age Bracket | Male | Female |
| Under 5 Years | 0 (0.0%) | 10 (8.6%) |
| 5 to 17 Years | 0 (0.0%) | 10 (1.5%) |
| 18 to 34 Years | 0 (0.0%) | 31 (3.3%) |
| 35 to 64 Years | 134 (7.5%) | 3 (0.2%) |
| 65 to 74 Years | 47 (9.4%) | 20 (3.2%) |
| 75 Years and over | 114 (42.2%) | 86 (13.6%) |
Disability Class: Vision Difficulty
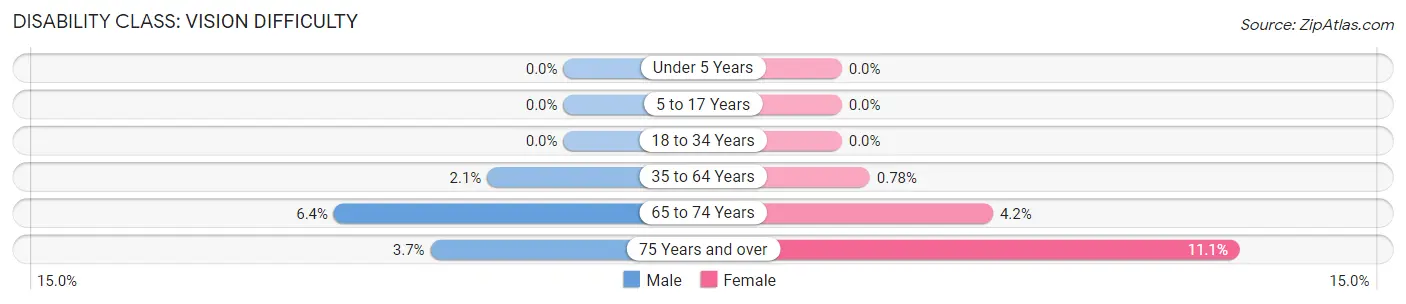
| Age Bracket | Male | Female |
| Under 5 Years | 0 (0.0%) | 0 (0.0%) |
| 5 to 17 Years | 0 (0.0%) | 0 (0.0%) |
| 18 to 34 Years | 0 (0.0%) | 0 (0.0%) |
| 35 to 64 Years | 38 (2.1%) | 15 (0.8%) |
| 65 to 74 Years | 32 (6.4%) | 26 (4.2%) |
| 75 Years and over | 10 (3.7%) | 70 (11.1%) |
Disability Class: Cognitive Difficulty
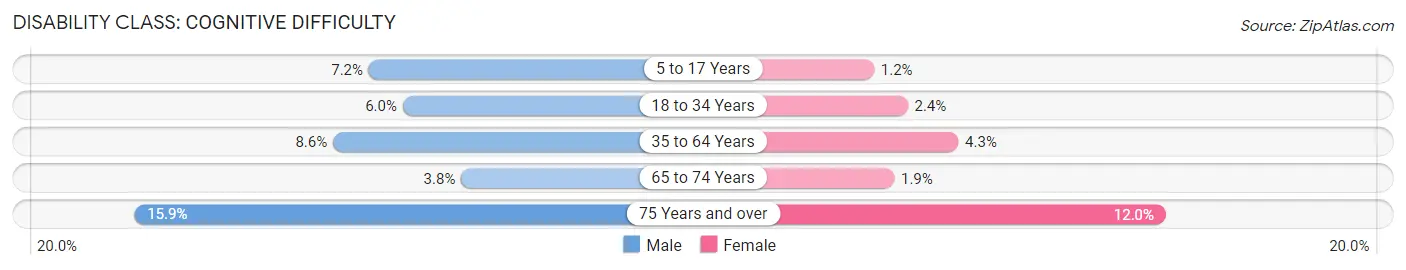
| Age Bracket | Male | Female |
| 5 to 17 Years | 34 (7.2%) | 8 (1.2%) |
| 18 to 34 Years | 48 (6.0%) | 23 (2.4%) |
| 35 to 64 Years | 153 (8.6%) | 83 (4.3%) |
| 65 to 74 Years | 19 (3.8%) | 12 (1.9%) |
| 75 Years and over | 43 (15.9%) | 76 (12.0%) |
Disability Class: Ambulatory Difficulty
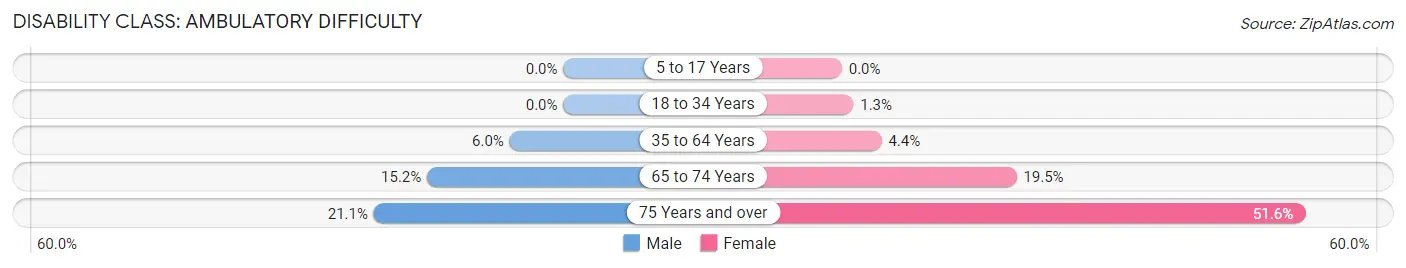
| Age Bracket | Male | Female |
| 5 to 17 Years | 0 (0.0%) | 0 (0.0%) |
| 18 to 34 Years | 0 (0.0%) | 12 (1.3%) |
| 35 to 64 Years | 107 (6.0%) | 85 (4.4%) |
| 65 to 74 Years | 76 (15.2%) | 120 (19.5%) |
| 75 Years and over | 57 (21.1%) | 326 (51.6%) |
Disability Class: Self-Care Difficulty
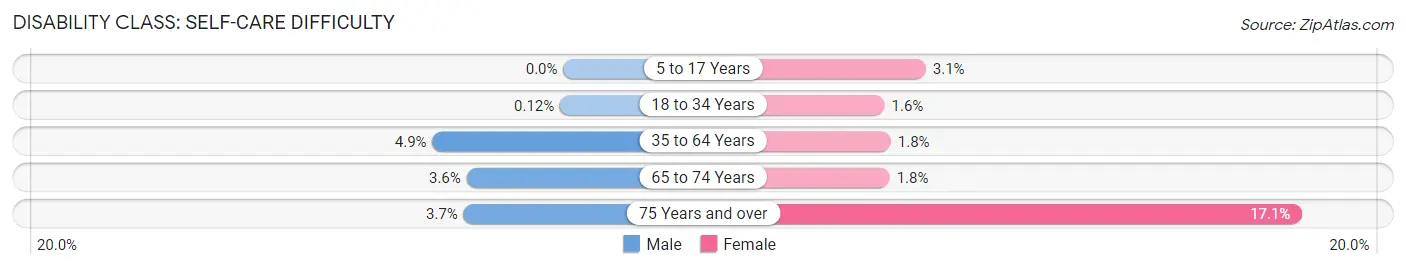
| Age Bracket | Male | Female |
| 5 to 17 Years | 0 (0.0%) | 21 (3.1%) |
| 18 to 34 Years | 1 (0.1%) | 15 (1.6%) |
| 35 to 64 Years | 87 (4.9%) | 35 (1.8%) |
| 65 to 74 Years | 18 (3.6%) | 11 (1.8%) |
| 75 Years and over | 10 (3.7%) | 108 (17.1%) |
Technology Access in Harahan
Computing Device Access in Harahan
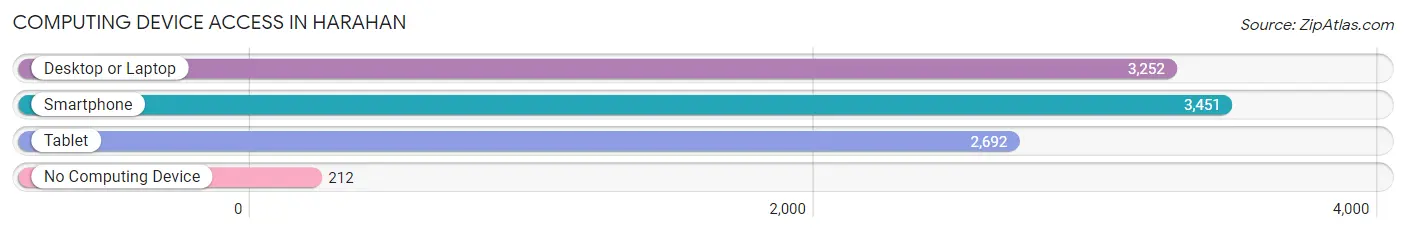
| Device Type | # Households | % Households |
| Desktop or Laptop | 3,252 | 79.6% |
| Smartphone | 3,451 | 84.5% |
| Tablet | 2,692 | 65.9% |
| No Computing Device | 212 | 5.2% |
| Total | 4,085 | 100.0% |
Internet Access in Harahan
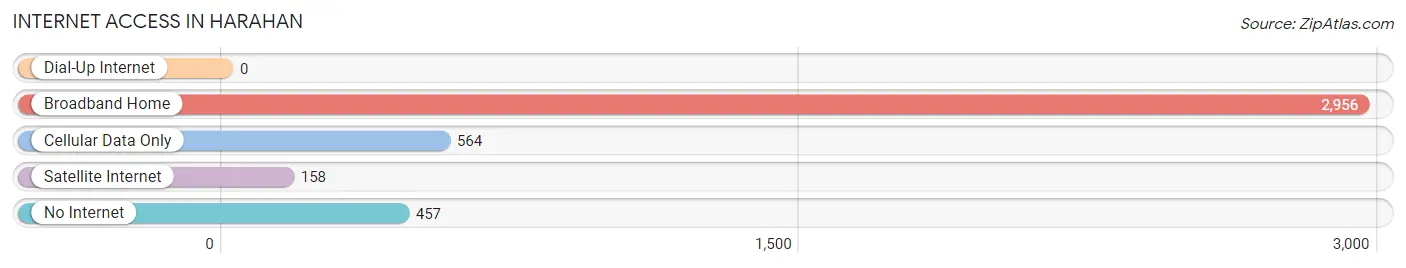
| Internet Type | # Households | % Households |
| Dial-Up Internet | 0 | 0.0% |
| Broadband Home | 2,956 | 72.4% |
| Cellular Data Only | 564 | 13.8% |
| Satellite Internet | 158 | 3.9% |
| No Internet | 457 | 11.2% |
| Total | 4,085 | 100.0% |
Harahan Summary
Harahan, Louisiana is a small city located in Jefferson Parish, just outside of New Orleans. It is a suburb of the larger city and is home to approximately 9,000 people. The city is known for its small-town charm and its proximity to the larger city of New Orleans.
History
Harahan was founded in 1892 by the Harahan family, who had moved to the area from New York. The family purchased a large tract of land and began to develop it into a small town. The town was named after the family and was incorporated in 1908.
The town grew slowly over the years, but it was not until the 1950s that it began to experience significant growth. This was due to the construction of the Huey P. Long Bridge, which connected Harahan to New Orleans. The bridge allowed for easy access to the city and made Harahan a desirable place to live.
Geography
Harahan is located in Jefferson Parish, just outside of New Orleans. It is bordered by the Mississippi River to the north, the city of New Orleans to the east, and the city of River Ridge to the south. The city covers an area of 4.2 square miles and has a population density of 2,093 people per square mile.
The city is located at an elevation of 8 feet above sea level and has a humid subtropical climate. The average temperature in the summer is around 80 degrees Fahrenheit and the average temperature in the winter is around 60 degrees Fahrenheit.
Economy
Harahan’s economy is largely based on the service industry. The city is home to a variety of restaurants, retail stores, and other businesses. The city is also home to a number of industrial and manufacturing companies, including a large chemical plant.
The city is also home to a number of government offices, including the Jefferson Parish Sheriff’s Office and the Harahan Police Department. The city is also home to a number of educational institutions, including the University of New Orleans and Tulane University.
Demographics
As of the 2010 census, the population of Harahan was 8,765. The racial makeup of the city was 79.3% White, 15.2% African American, 0.3% Native American, 1.2% Asian, 0.1% Pacific Islander, and 3.9% from other races. Hispanic or Latino of any race were 5.2% of the population.
The median household income in Harahan was $50,945, and the median family income was $60,945. The per capita income for the city was $25,945. About 8.3% of families and 10.2% of the population were below the poverty line, including 14.2% of those under age 18 and 6.2% of those age 65 or over.
Harahan is a small city with a rich history and a vibrant economy. It is a great place to live and work, and it is a great place to visit. The city is home to a variety of businesses, educational institutions, and government offices, and it is a great place to raise a family.
Common Questions
What is Per Capita Income in Harahan?
Per Capita income in Harahan is $45,741.
What is the Median Family Income in Harahan?
Median Family Income in Harahan is $103,750.
What is the Median Household income in Harahan?
Median Household Income in Harahan is $75,099.
What is Income or Wage Gap in Harahan?
Income or Wage Gap in Harahan is 27.4%.
Women in Harahan earn 72.6 cents for every dollar earned by a man.
What is Inequality or Gini Index in Harahan?
Inequality or Gini Index in Harahan is 0.46.
What is the Total Population of Harahan?
Total Population of Harahan is 9,043.
What is the Total Male Population of Harahan?
Total Male Population of Harahan is 4,050.
What is the Total Female Population of Harahan?
Total Female Population of Harahan is 4,993.
What is the Ratio of Males per 100 Females in Harahan?
There are 81.11 Males per 100 Females in Harahan.
What is the Ratio of Females per 100 Males in Harahan?
There are 123.28 Females per 100 Males in Harahan.
What is the Median Population Age in Harahan?
Median Population Age in Harahan is 47.7 Years.
What is the Average Family Size in Harahan
Average Family Size in Harahan is 2.8 People.
What is the Average Household Size in Harahan
Average Household Size in Harahan is 2.2 People.
How Large is the Labor Force in Harahan?
There are 4,827 People in the Labor Forcein in Harahan.
What is the Percentage of People in the Labor Force in Harahan?
61.4% of People are in the Labor Force in Harahan.
What is the Unemployment Rate in Harahan?
Unemployment Rate in Harahan is 2.8%.