Scott, LA Map & Demographics
Scott Map
Scott Overview
$38,919
PER CAPITA INCOME
$76,382
AVG FAMILY INCOME
$55,057
AVG HOUSEHOLD INCOME
42.8%
WAGE / INCOME GAP [ % ]
57.2¢/ $1
WAGE / INCOME GAP [ $ ]
$5,555
FAMILY INCOME DEFICIT
0.47
INEQUALITY / GINI INDEX
8,271
TOTAL POPULATION
4,150
MALE POPULATION
4,121
FEMALE POPULATION
100.70
MALES / 100 FEMALES
99.30
FEMALES / 100 MALES
44.1
MEDIAN AGE
3.0
AVG FAMILY SIZE
2.0
AVG HOUSEHOLD SIZE
4,499
LABOR FORCE [ PEOPLE ]
64.0%
PERCENT IN LABOR FORCE
5.4%
UNEMPLOYMENT RATE
Scott Zip Codes
Scott Area Codes
Income in Scott
Income Overview in Scott
Per Capita Income in Scott is $38,919, while median incomes of families and households are $76,382 and $55,057 respectively.
| Characteristic | Number | Measure |
| Per Capita Income | 8,271 | $38,919 |
| Median Family Income | 1,997 | $76,382 |
| Mean Family Income | 1,997 | $103,953 |
| Median Household Income | 4,049 | $55,057 |
| Mean Household Income | 4,049 | $77,266 |
| Income Deficit | 1,997 | $5,555 |
| Wage / Income Gap (%) | 8,271 | 42.82% |
| Wage / Income Gap ($) | 8,271 | 57.18¢ per $1 |
| Gini / Inequality Index | 8,271 | 0.47 |
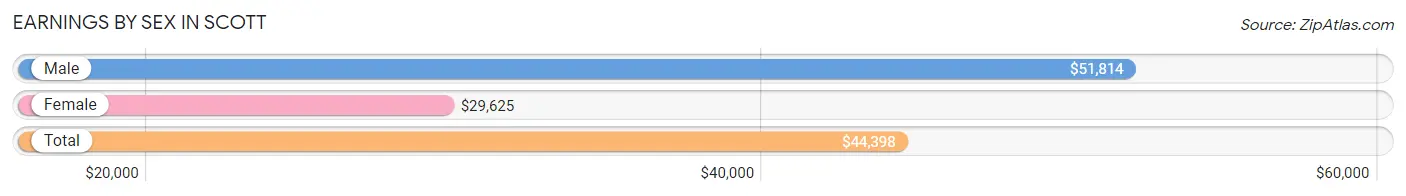
Earnings by Sex in Scott
Average Earnings in Scott are $44,398, $51,814 for men and $29,625 for women, a difference of 42.8%.
| Sex | Number | Average Earnings |
| Male | 2,646 (56.4%) | $51,814 |
| Female | 2,050 (43.6%) | $29,625 |
| Total | 4,696 (100.0%) | $44,398 |
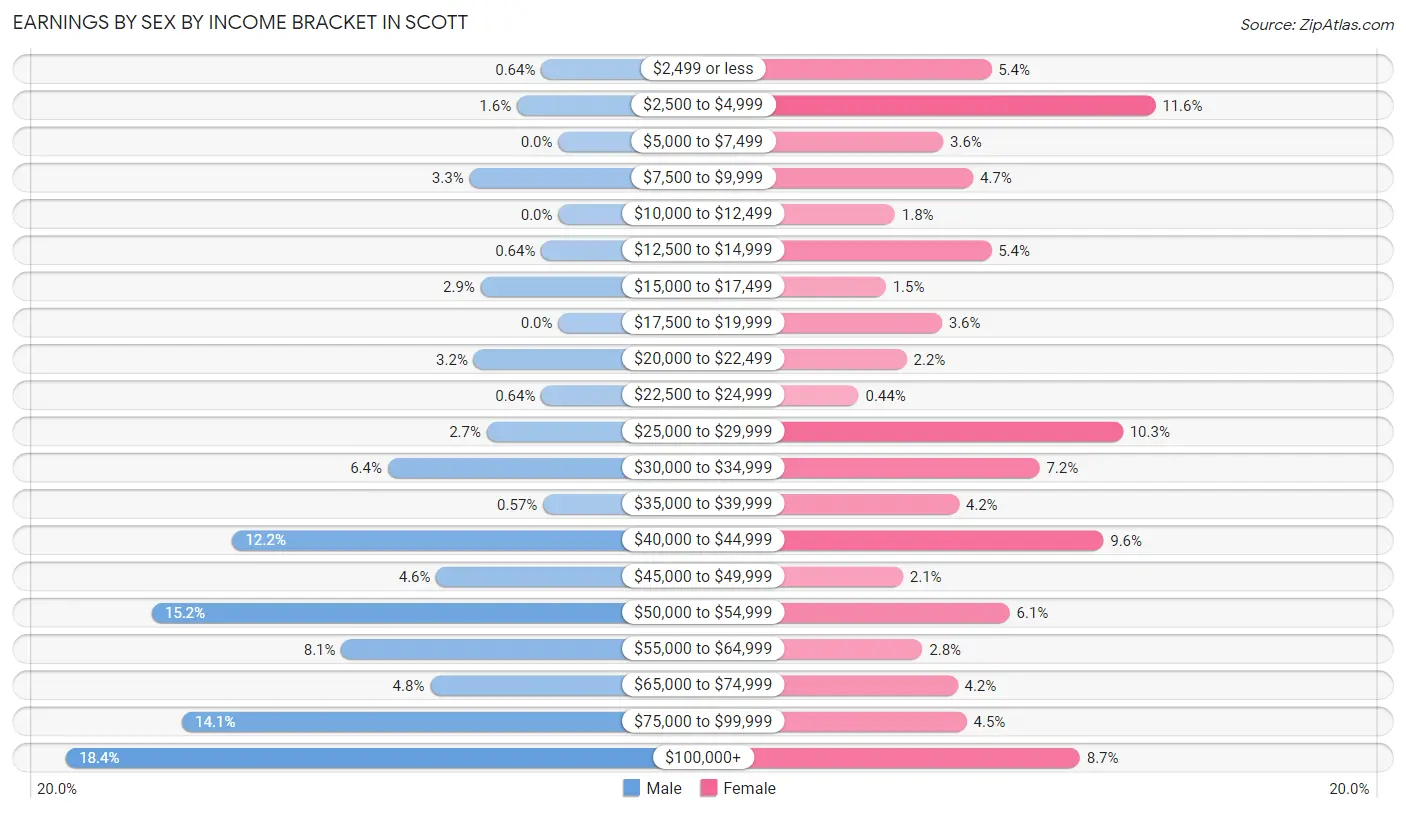
Earnings by Sex by Income Bracket in Scott
The most common earnings brackets in Scott are $100,000+ for men (488 | 18.4%) and $2,500 to $4,999 for women (237 | 11.6%).
| Income | Male | Female |
| $2,499 or less | 17 (0.6%) | 111 (5.4%) |
| $2,500 to $4,999 | 41 (1.5%) | 237 (11.6%) |
| $5,000 to $7,499 | 0 (0.0%) | 74 (3.6%) |
| $7,500 to $9,999 | 88 (3.3%) | 97 (4.7%) |
| $10,000 to $12,499 | 0 (0.0%) | 37 (1.8%) |
| $12,500 to $14,999 | 17 (0.6%) | 111 (5.4%) |
| $15,000 to $17,499 | 77 (2.9%) | 30 (1.5%) |
| $17,500 to $19,999 | 0 (0.0%) | 73 (3.6%) |
| $20,000 to $22,499 | 84 (3.2%) | 46 (2.2%) |
| $22,500 to $24,999 | 17 (0.6%) | 9 (0.4%) |
| $25,000 to $29,999 | 71 (2.7%) | 212 (10.3%) |
| $30,000 to $34,999 | 169 (6.4%) | 148 (7.2%) |
| $35,000 to $39,999 | 15 (0.6%) | 86 (4.2%) |
| $40,000 to $44,999 | 323 (12.2%) | 197 (9.6%) |
| $45,000 to $49,999 | 121 (4.6%) | 43 (2.1%) |
| $50,000 to $54,999 | 403 (15.2%) | 125 (6.1%) |
| $55,000 to $64,999 | 215 (8.1%) | 58 (2.8%) |
| $65,000 to $74,999 | 127 (4.8%) | 85 (4.2%) |
| $75,000 to $99,999 | 373 (14.1%) | 92 (4.5%) |
| $100,000+ | 488 (18.4%) | 179 (8.7%) |
| Total | 2,646 (100.0%) | 2,050 (100.0%) |
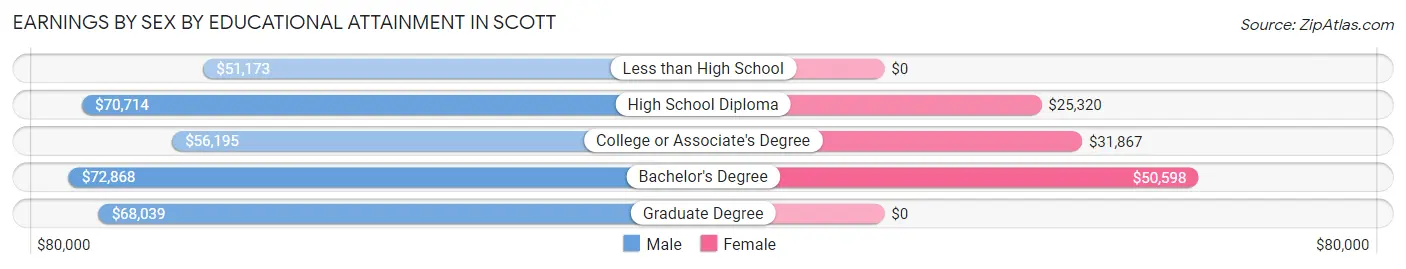
Earnings by Sex by Educational Attainment in Scott
Average earnings in Scott are $55,091 for men and $33,029 for women, a difference of 40.1%. Men with an educational attainment of bachelor's degree enjoy the highest average annual earnings of $72,868, while those with less than high school education earn the least with $51,173. Women with an educational attainment of bachelor's degree earn the most with the average annual earnings of $50,598, while those with high school diploma education have the smallest earnings of $25,320.
| Educational Attainment | Male Income | Female Income |
| Less than High School | $51,173 | $0 |
| High School Diploma | $70,714 | $25,320 |
| College or Associate's Degree | $56,195 | $31,867 |
| Bachelor's Degree | $72,868 | $50,598 |
| Graduate Degree | $68,039 | $0 |
| Total | $55,091 | $33,029 |
Family Income in Scott
Family Income Brackets in Scott
According to the Scott family income data, there are 451 families falling into the $100,000 to $149,999 income range, which is the most common income bracket and makes up 22.6% of all families. Conversely, the less than $10,000 income bracket is the least frequent group with only 6 families (0.3%) belonging to this category.
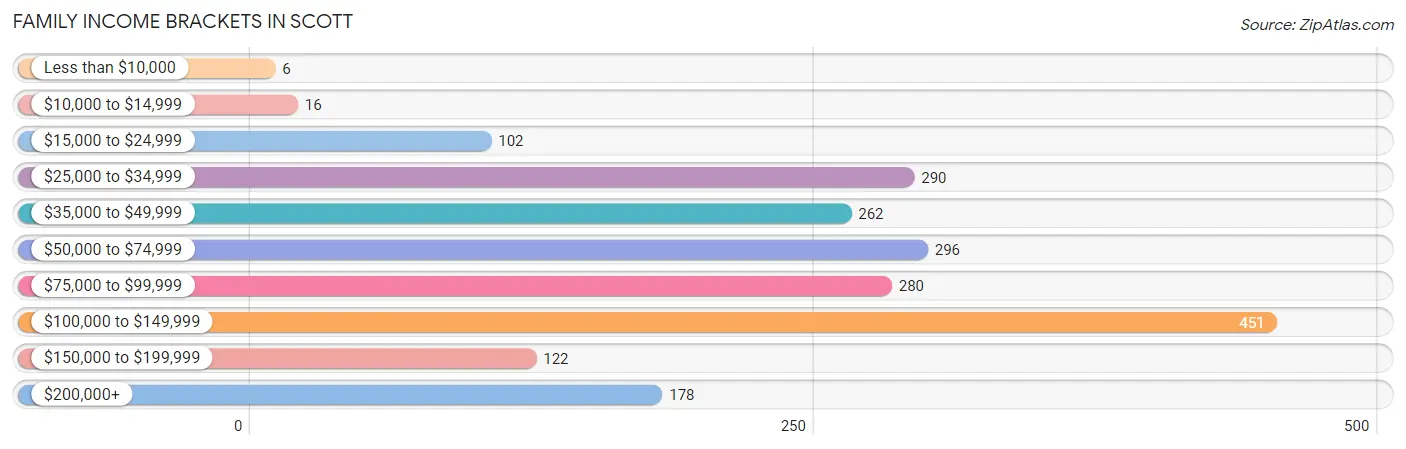
| Income Bracket | # Families | % Families |
| Less than $10,000 | 6 | 0.3% |
| $10,000 to $14,999 | 16 | 0.8% |
| $15,000 to $24,999 | 102 | 5.1% |
| $25,000 to $34,999 | 290 | 14.5% |
| $35,000 to $49,999 | 262 | 13.1% |
| $50,000 to $74,999 | 296 | 14.8% |
| $75,000 to $99,999 | 280 | 14.0% |
| $100,000 to $149,999 | 451 | 22.6% |
| $150,000 to $199,999 | 122 | 6.1% |
| $200,000+ | 178 | 8.9% |
Family Income by Famaliy Size in Scott
4-person families (384 | 19.2%) account for the highest median family income in Scott with $133,603 per family, while 2-person families (875 | 43.8%) have the highest median income of $37,577 per family member.
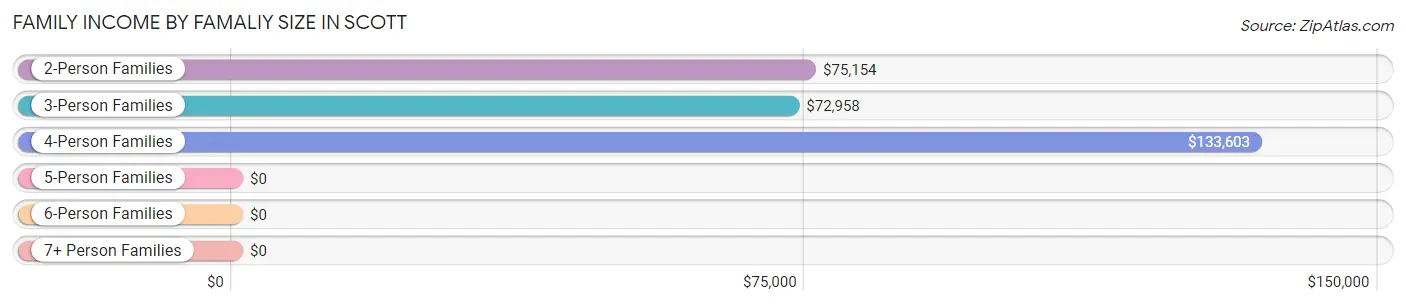
| Income Bracket | # Families | Median Income |
| 2-Person Families | 875 (43.8%) | $75,154 |
| 3-Person Families | 583 (29.2%) | $72,958 |
| 4-Person Families | 384 (19.2%) | $133,603 |
| 5-Person Families | 146 (7.3%) | $0 |
| 6-Person Families | 0 (0.0%) | $0 |
| 7+ Person Families | 9 (0.4%) | $0 |
| Total | 1,997 (100.0%) | $76,382 |
Family Income by Number of Earners in Scott
The median family income in Scott is $76,382, with families comprising 2 earners (935) having the highest median family income of $110,452, while families with no earners (219) have the lowest median family income of $39,023, accounting for 46.8% and 11.0% of families, respectively.
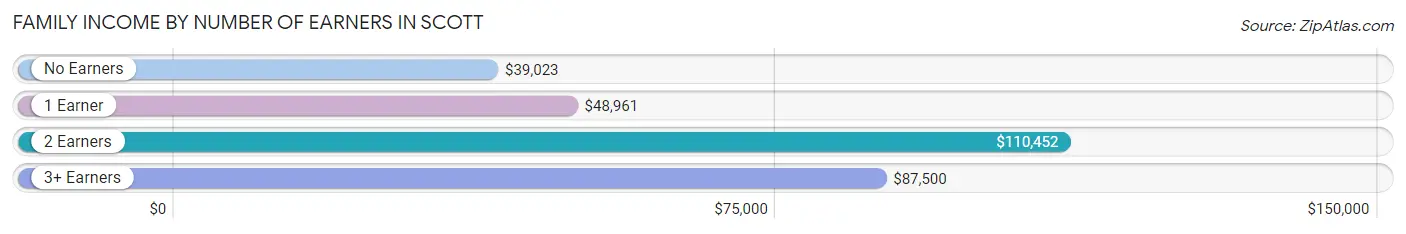
| Number of Earners | # Families | Median Income |
| No Earners | 219 (11.0%) | $39,023 |
| 1 Earner | 709 (35.5%) | $48,961 |
| 2 Earners | 935 (46.8%) | $110,452 |
| 3+ Earners | 134 (6.7%) | $87,500 |
| Total | 1,997 (100.0%) | $76,382 |
Household Income in Scott
Household Income Brackets in Scott
With 895 households falling in the category, the $50,000 to $74,999 income range is the most frequent in Scott, accounting for 22.1% of all households. In contrast, only 178 households (4.4%) fall into the $200,000+ income bracket, making it the least populous group.
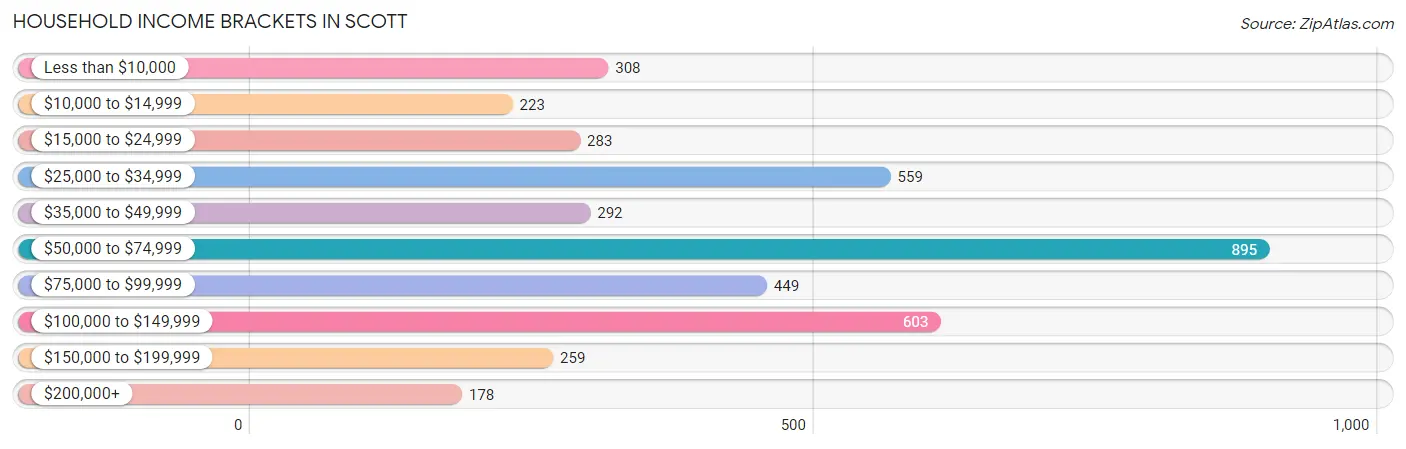
| Income Bracket | # Households | % Households |
| Less than $10,000 | 308 | 7.6% |
| $10,000 to $14,999 | 223 | 5.5% |
| $15,000 to $24,999 | 283 | 7.0% |
| $25,000 to $34,999 | 559 | 13.8% |
| $35,000 to $49,999 | 292 | 7.2% |
| $50,000 to $74,999 | 895 | 22.1% |
| $75,000 to $99,999 | 449 | 11.1% |
| $100,000 to $149,999 | 603 | 14.9% |
| $150,000 to $199,999 | 259 | 6.4% |
| $200,000+ | 178 | 4.4% |
Household Income by Householder Age in Scott
The median household income in Scott is $55,057, with the highest median household income of $75,905 found in the 25 to 44 years age bracket for the primary householder. A total of 1,221 households (30.2%) fall into this category. Meanwhile, the 65+ years age bracket for the primary householder has the lowest median household income of $38,384, with 1,205 households (29.8%) in this group.
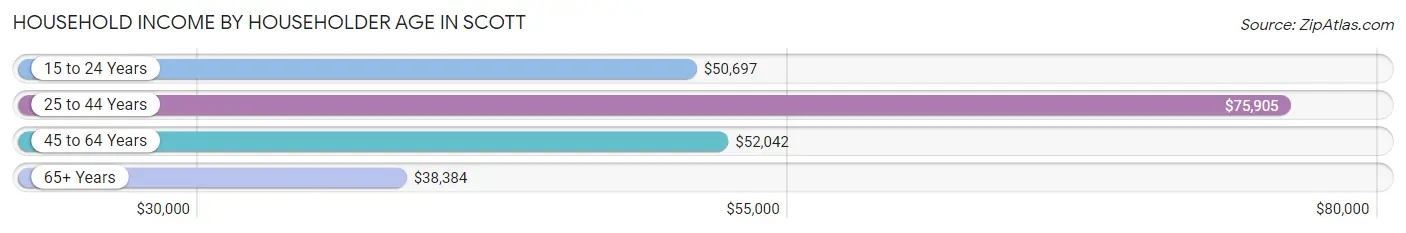
| Income Bracket | # Households | Median Income |
| 15 to 24 Years | 118 (2.9%) | $50,697 |
| 25 to 44 Years | 1,221 (30.2%) | $75,905 |
| 45 to 64 Years | 1,505 (37.2%) | $52,042 |
| 65+ Years | 1,205 (29.8%) | $38,384 |
| Total | 4,049 (100.0%) | $55,057 |
Poverty in Scott
Income Below Poverty by Sex and Age in Scott
With 11.2% poverty level for males and 20.0% for females among the residents of Scott, under 5 year old males and 15 year old females are the most vulnerable to poverty, with 45 males (28.3%) and 29 females (80.6%) in their respective age groups living below the poverty level.
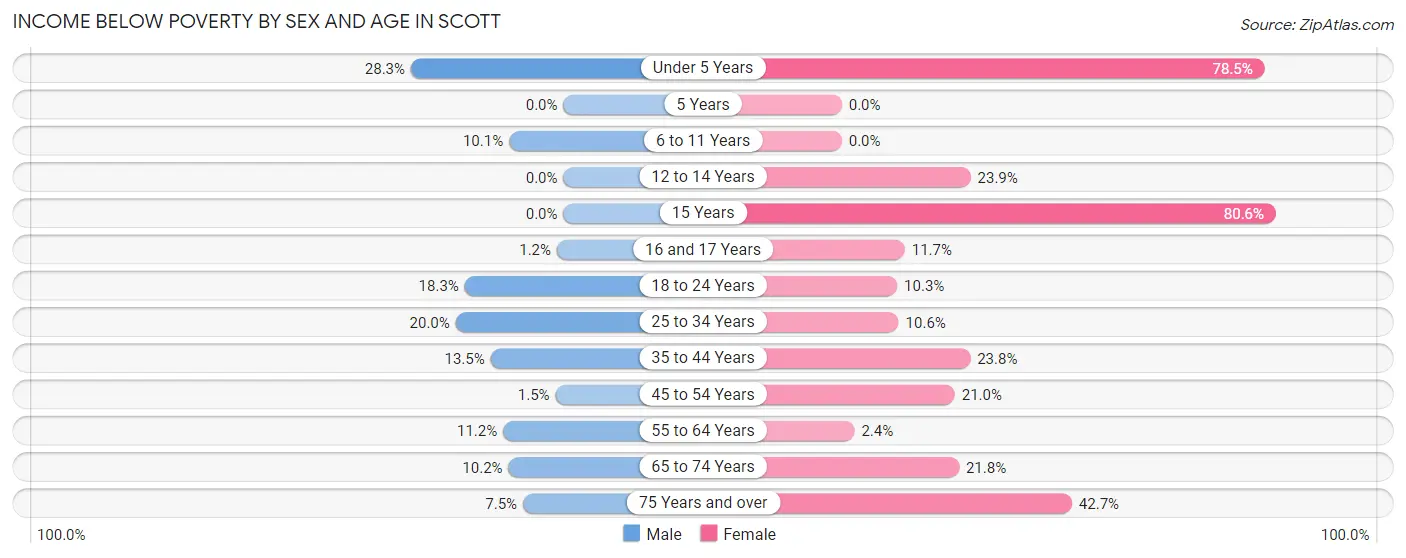
| Age Bracket | Male | Female |
| Under 5 Years | 45 (28.3%) | 113 (78.5%) |
| 5 Years | 0 (0.0%) | 0 (0.0%) |
| 6 to 11 Years | 23 (10.1%) | 0 (0.0%) |
| 12 to 14 Years | 0 (0.0%) | 33 (23.9%) |
| 15 Years | 0 (0.0%) | 29 (80.6%) |
| 16 and 17 Years | 1 (1.2%) | 29 (11.7%) |
| 18 to 24 Years | 74 (18.3%) | 26 (10.3%) |
| 25 to 34 Years | 65 (20.0%) | 52 (10.5%) |
| 35 to 44 Years | 104 (13.5%) | 118 (23.8%) |
| 45 to 54 Years | 7 (1.5%) | 130 (21.0%) |
| 55 to 64 Years | 82 (11.2%) | 13 (2.4%) |
| 65 to 74 Years | 55 (10.2%) | 117 (21.7%) |
| 75 Years and over | 9 (7.5%) | 161 (42.7%) |
| Total | 465 (11.2%) | 821 (20.0%) |
Income Above Poverty by Sex and Age in Scott
According to the poverty statistics in Scott, males aged 5 years and females aged 5 years are the age groups that are most secure financially, with 100.0% of males and 100.0% of females in these age groups living above the poverty line.
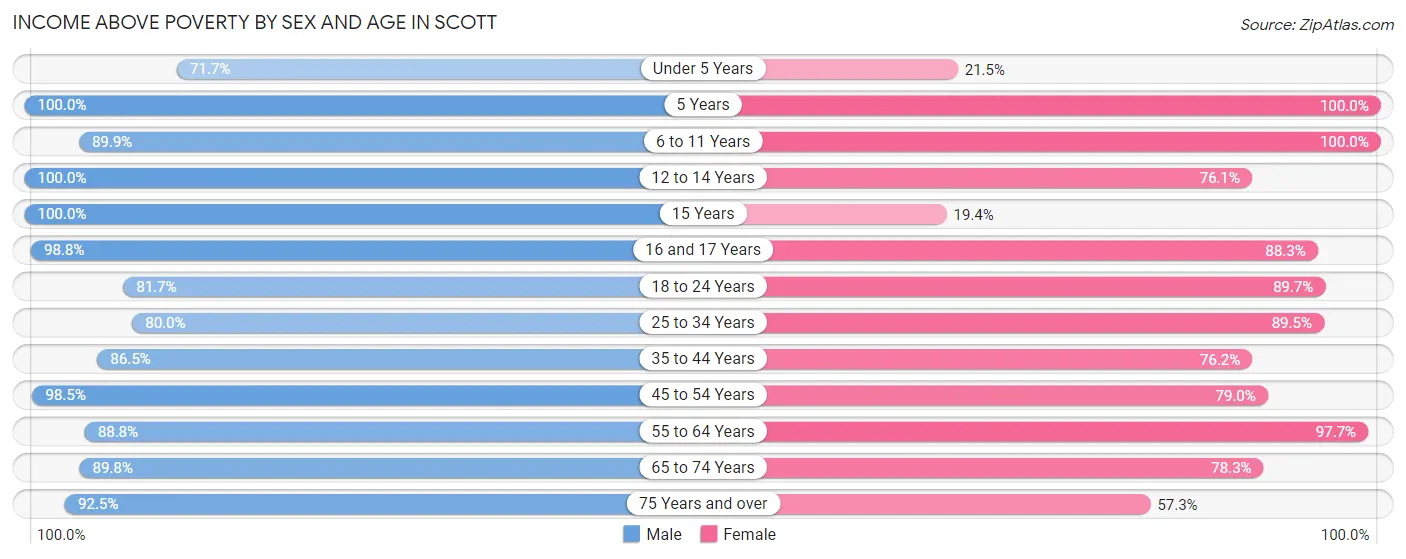
| Age Bracket | Male | Female |
| Under 5 Years | 114 (71.7%) | 31 (21.5%) |
| 5 Years | 102 (100.0%) | 15 (100.0%) |
| 6 to 11 Years | 205 (89.9%) | 194 (100.0%) |
| 12 to 14 Years | 162 (100.0%) | 105 (76.1%) |
| 15 Years | 48 (100.0%) | 7 (19.4%) |
| 16 and 17 Years | 82 (98.8%) | 219 (88.3%) |
| 18 to 24 Years | 330 (81.7%) | 227 (89.7%) |
| 25 to 34 Years | 260 (80.0%) | 441 (89.4%) |
| 35 to 44 Years | 665 (86.5%) | 377 (76.2%) |
| 45 to 54 Years | 470 (98.5%) | 490 (79.0%) |
| 55 to 64 Years | 651 (88.8%) | 541 (97.7%) |
| 65 to 74 Years | 484 (89.8%) | 421 (78.2%) |
| 75 Years and over | 111 (92.5%) | 216 (57.3%) |
| Total | 3,684 (88.8%) | 3,284 (80.0%) |
Income Below Poverty Among Married-Couple Families in Scott
The poverty statistics for married-couple families in Scott show that 5.3% or 83 of the total 1,553 families live below the poverty line. Families with 1 or 2 children have the highest poverty rate of 7.1%, comprising of 47 families. On the other hand, families with 3 or 4 children have the lowest poverty rate of 0.0%, which includes 0 families.
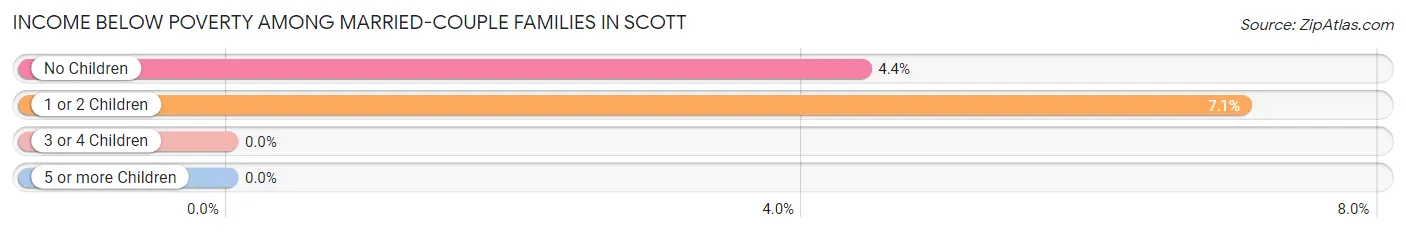
| Children | Above Poverty | Below Poverty |
| No Children | 780 (95.6%) | 36 (4.4%) |
| 1 or 2 Children | 619 (92.9%) | 47 (7.1%) |
| 3 or 4 Children | 71 (100.0%) | 0 (0.0%) |
| 5 or more Children | 0 (0.0%) | 0 (0.0%) |
| Total | 1,470 (94.7%) | 83 (5.3%) |
Income Below Poverty Among Single-Parent Households in Scott
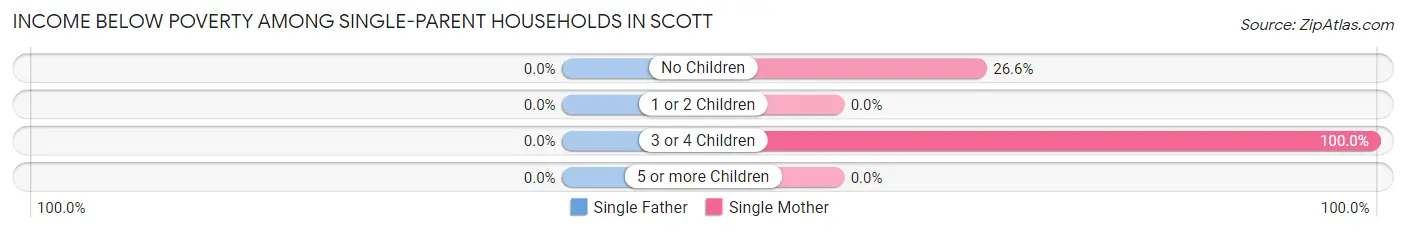
| Children | Single Father | Single Mother |
| No Children | 0 (0.0%) | 38 (26.6%) |
| 1 or 2 Children | 0 (0.0%) | 0 (0.0%) |
| 3 or 4 Children | 0 (0.0%) | 67 (100.0%) |
| 5 or more Children | 0 (0.0%) | 0 (0.0%) |
| Total | 0 (0.0%) | 105 (30.6%) |
Income Below Poverty Among Married-Couple vs Single-Parent Households in Scott
The poverty data for Scott shows that 83 of the married-couple family households (5.3%) and 105 of the single-parent households (23.6%) are living below the poverty level. Within the married-couple family households, those with 1 or 2 children have the highest poverty rate, with 47 households (7.1%) falling below the poverty line. Among the single-parent households, those with 3 or 4 children have the highest poverty rate, with 67 household (100.0%) living below poverty.
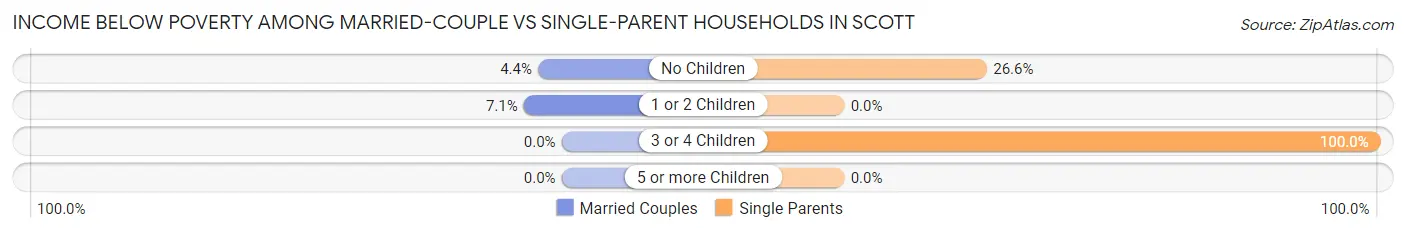
| Children | Married-Couple Families | Single-Parent Households |
| No Children | 36 (4.4%) | 38 (26.6%) |
| 1 or 2 Children | 47 (7.1%) | 0 (0.0%) |
| 3 or 4 Children | 0 (0.0%) | 67 (100.0%) |
| 5 or more Children | 0 (0.0%) | 0 (0.0%) |
| Total | 83 (5.3%) | 105 (23.6%) |
Race in Scott
The most populous races in Scott are White / Caucasian (6,465 | 78.2%), Black / African American (987 | 11.9%), and Hispanic or Latino (765 | 9.2%).
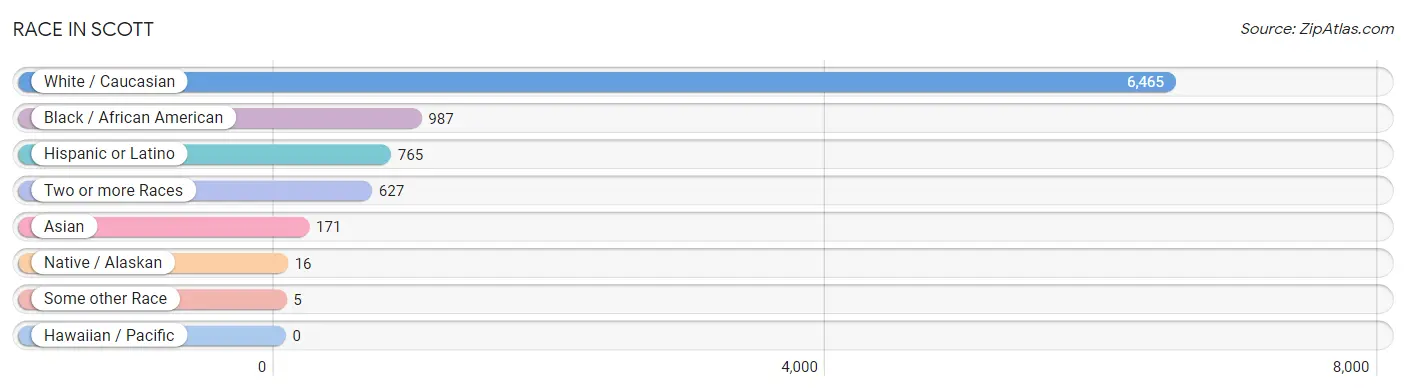
| Race | # Population | % Population |
| Asian | 171 | 2.1% |
| Black / African American | 987 | 11.9% |
| Hawaiian / Pacific | 0 | 0.0% |
| Hispanic or Latino | 765 | 9.2% |
| Native / Alaskan | 16 | 0.2% |
| White / Caucasian | 6,465 | 78.2% |
| Two or more Races | 627 | 7.6% |
| Some other Race | 5 | 0.1% |
| Total | 8,271 | 100.0% |
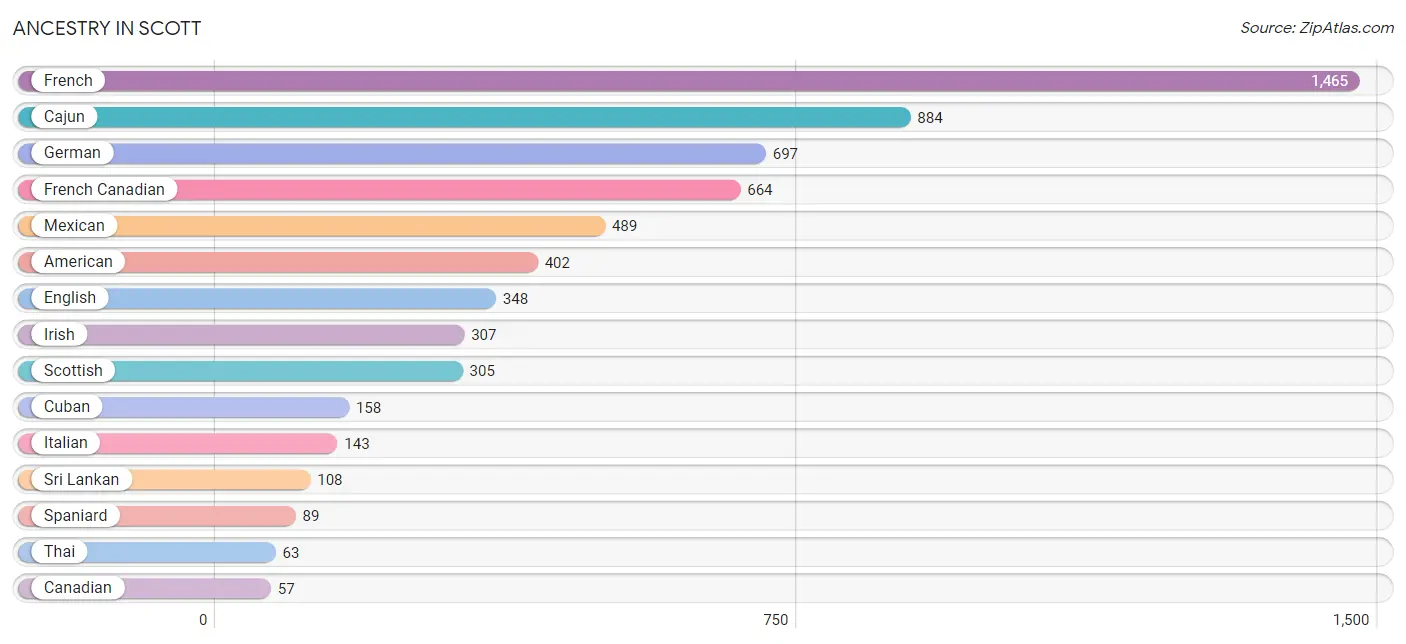
Ancestry in Scott
The most populous ancestries reported in Scott are French (1,465 | 17.7%), Cajun (884 | 10.7%), German (697 | 8.4%), French Canadian (664 | 8.0%), and Mexican (489 | 5.9%), together accounting for 50.8% of all Scott residents.
| Ancestry | # Population | % Population |
| African | 9 | 0.1% |
| American | 402 | 4.9% |
| Cajun | 884 | 10.7% |
| Canadian | 57 | 0.7% |
| Central American | 29 | 0.4% |
| Cherokee | 35 | 0.4% |
| Croatian | 10 | 0.1% |
| Cuban | 158 | 1.9% |
| Dutch | 25 | 0.3% |
| English | 348 | 4.2% |
| French | 1,465 | 17.7% |
| French American Indian | 13 | 0.2% |
| French Canadian | 664 | 8.0% |
| German | 697 | 8.4% |
| Guatemalan | 1 | 0.0% |
| Honduran | 28 | 0.3% |
| Houma | 5 | 0.1% |
| Irish | 307 | 3.7% |
| Italian | 143 | 1.7% |
| Korean | 5 | 0.1% |
| Mexican | 489 | 5.9% |
| Portuguese | 39 | 0.5% |
| Scottish | 305 | 3.7% |
| Spaniard | 89 | 1.1% |
| Sri Lankan | 108 | 1.3% |
| Subsaharan African | 9 | 0.1% |
| Thai | 63 | 0.8% |
| Ukrainian | 6 | 0.1% |
| Yugoslavian | 57 | 0.7% | View All 29 Rows |
Immigrants in Scott
The most numerous immigrant groups reported in Scott came from Latin America (449 | 5.4%), Central America (275 | 3.3%), Mexico (274 | 3.3%), Caribbean (158 | 1.9%), and Cuba (158 | 1.9%), together accounting for 15.9% of all Scott residents.
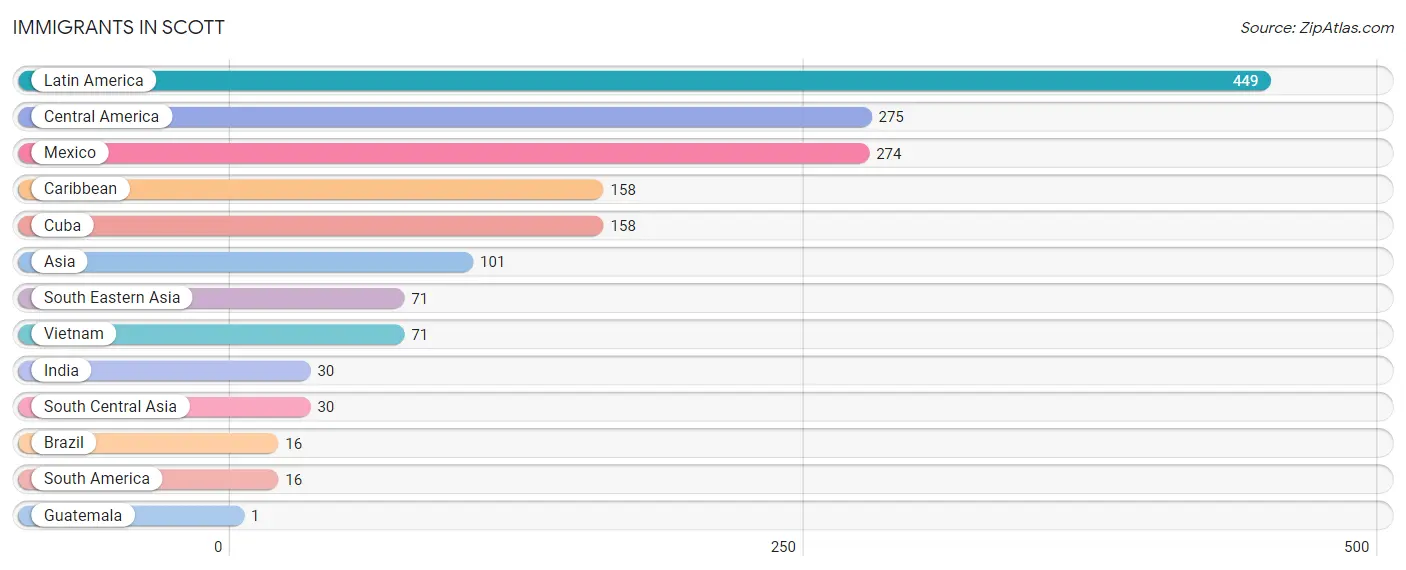
| Immigration Origin | # Population | % Population |
| Asia | 101 | 1.2% |
| Brazil | 16 | 0.2% |
| Caribbean | 158 | 1.9% |
| Central America | 275 | 3.3% |
| Cuba | 158 | 1.9% |
| Guatemala | 1 | 0.0% |
| India | 30 | 0.4% |
| Latin America | 449 | 5.4% |
| Mexico | 274 | 3.3% |
| South America | 16 | 0.2% |
| South Central Asia | 30 | 0.4% |
| South Eastern Asia | 71 | 0.9% |
| Vietnam | 71 | 0.9% | View All 13 Rows |
Sex and Age in Scott
Sex and Age in Scott
The most populous age groups in Scott are 55 to 59 Years (617 | 14.9%) for men and 50 to 54 Years (378 | 9.2%) for women.
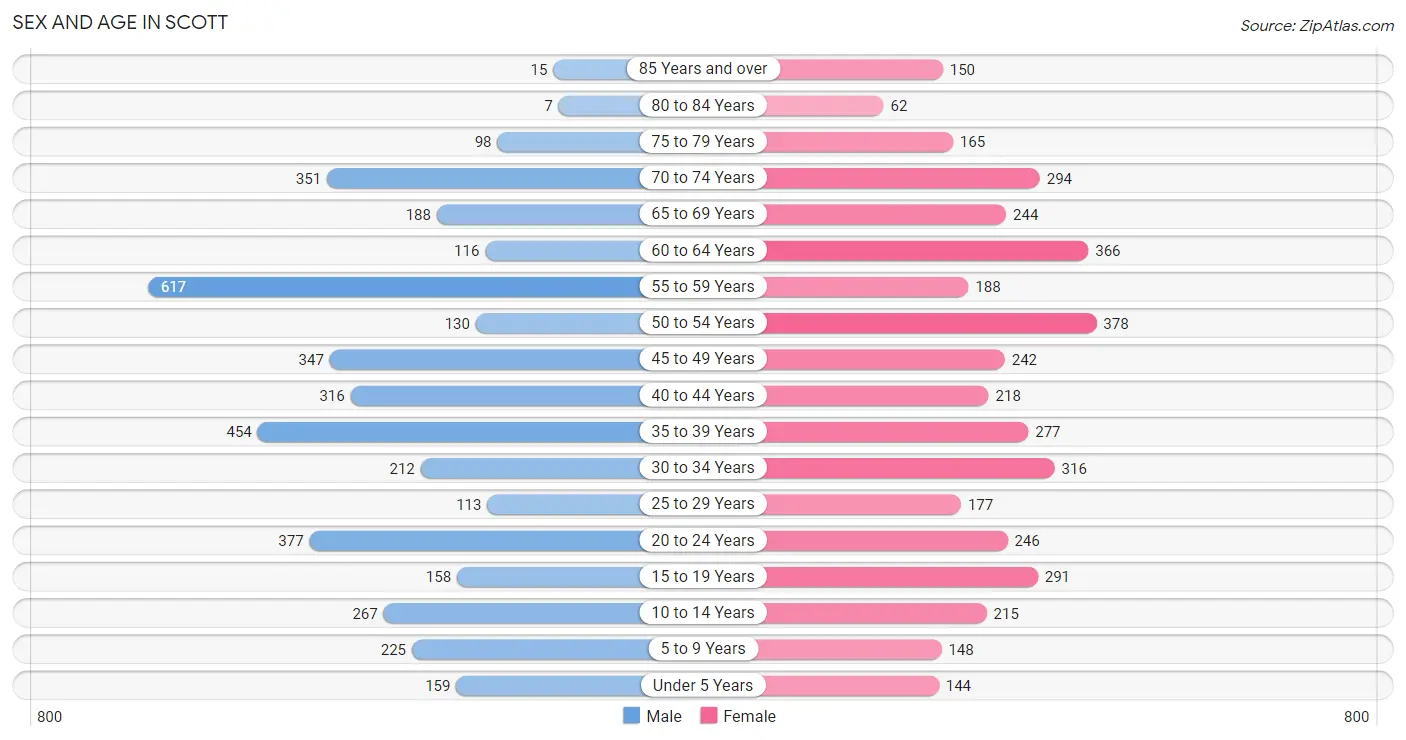
| Age Bracket | Male | Female |
| Under 5 Years | 159 (3.8%) | 144 (3.5%) |
| 5 to 9 Years | 225 (5.4%) | 148 (3.6%) |
| 10 to 14 Years | 267 (6.4%) | 215 (5.2%) |
| 15 to 19 Years | 158 (3.8%) | 291 (7.1%) |
| 20 to 24 Years | 377 (9.1%) | 246 (6.0%) |
| 25 to 29 Years | 113 (2.7%) | 177 (4.3%) |
| 30 to 34 Years | 212 (5.1%) | 316 (7.7%) |
| 35 to 39 Years | 454 (10.9%) | 277 (6.7%) |
| 40 to 44 Years | 316 (7.6%) | 218 (5.3%) |
| 45 to 49 Years | 347 (8.4%) | 242 (5.9%) |
| 50 to 54 Years | 130 (3.1%) | 378 (9.2%) |
| 55 to 59 Years | 617 (14.9%) | 188 (4.6%) |
| 60 to 64 Years | 116 (2.8%) | 366 (8.9%) |
| 65 to 69 Years | 188 (4.5%) | 244 (5.9%) |
| 70 to 74 Years | 351 (8.5%) | 294 (7.1%) |
| 75 to 79 Years | 98 (2.4%) | 165 (4.0%) |
| 80 to 84 Years | 7 (0.2%) | 62 (1.5%) |
| 85 Years and over | 15 (0.4%) | 150 (3.6%) |
| Total | 4,150 (100.0%) | 4,121 (100.0%) |
Families and Households in Scott
Median Family Size in Scott
The median family size in Scott is 2.97 persons per family, with married-couple families (1,553 | 77.8%) accounting for the largest median family size of 3.02 persons per family. On the other hand, single female/mother families (343 | 17.2%) represent the smallest median family size with 2.76 persons per family.
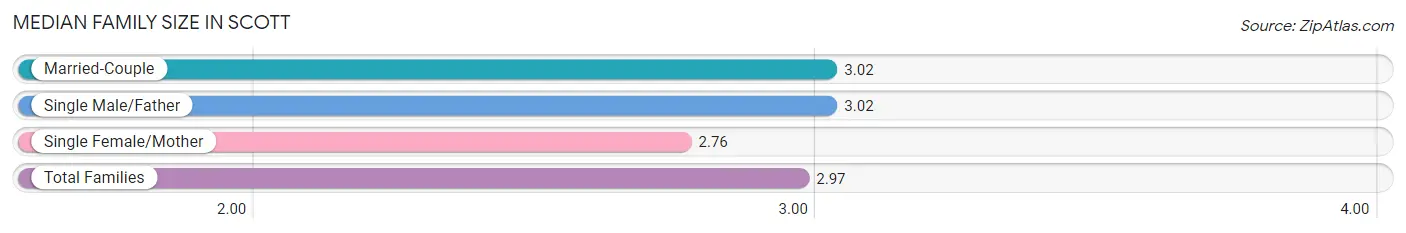
| Family Type | # Families | Family Size |
| Married-Couple | 1,553 (77.8%) | 3.02 |
| Single Male/Father | 101 (5.1%) | 3.02 |
| Single Female/Mother | 343 (17.2%) | 2.76 |
| Total Families | 1,997 (100.0%) | 2.97 |
Median Household Size in Scott
The median household size in Scott is 2.04 persons per household, with single male/father households (101 | 2.5%) accounting for the largest median household size of 3.35 persons per household. non-family households (2,052 | 50.7%) represent the smallest median household size with 1.12 persons per household.
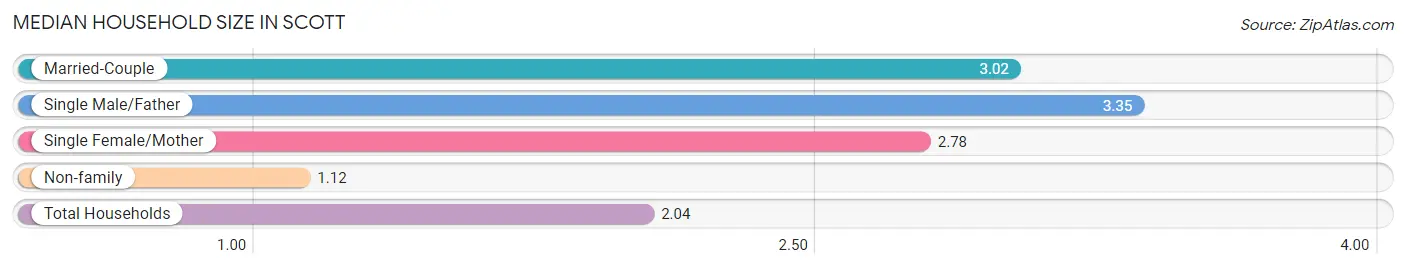
| Household Type | # Households | Household Size |
| Married-Couple | 1,553 (38.4%) | 3.02 |
| Single Male/Father | 101 (2.5%) | 3.35 |
| Single Female/Mother | 343 (8.5%) | 2.78 |
| Non-family | 2,052 (50.7%) | 1.12 |
| Total Households | 4,049 (100.0%) | 2.04 |
Household Size by Marriage Status in Scott
Out of a total of 4,049 households in Scott, 1,997 (49.3%) are family households, while 2,052 (50.7%) are nonfamily households. The most numerous type of family households are 2-person households, comprising 870, and the most common type of nonfamily households are 1-person households, comprising 1,800.
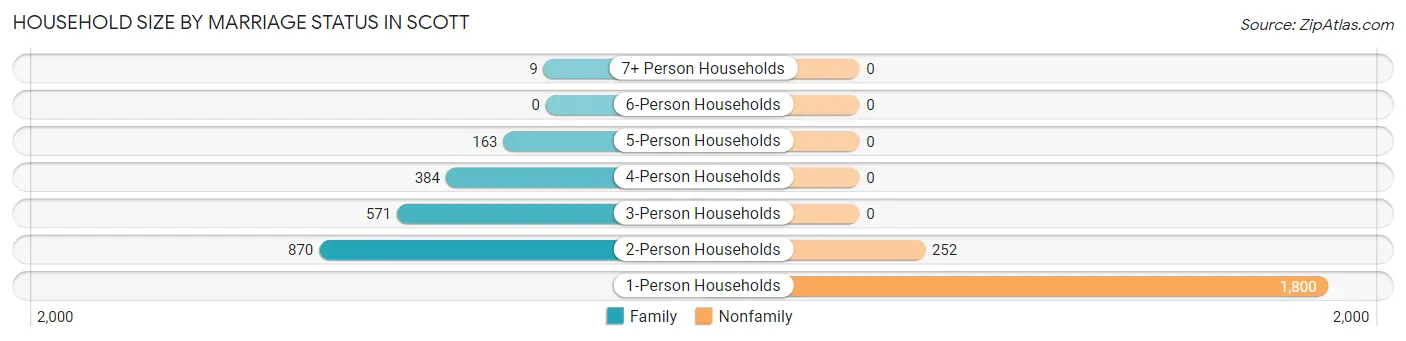
| Household Size | Family Households | Nonfamily Households |
| 1-Person Households | - | 1,800 (44.5%) |
| 2-Person Households | 870 (21.5%) | 252 (6.2%) |
| 3-Person Households | 571 (14.1%) | 0 (0.0%) |
| 4-Person Households | 384 (9.5%) | 0 (0.0%) |
| 5-Person Households | 163 (4.0%) | 0 (0.0%) |
| 6-Person Households | 0 (0.0%) | 0 (0.0%) |
| 7+ Person Households | 9 (0.2%) | 0 (0.0%) |
| Total | 1,997 (49.3%) | 2,052 (50.7%) |
Female Fertility in Scott
Fertility by Age in Scott
Average fertility rate in Scott is 28.0 births per 1,000 women. Women in the age bracket of 20 to 34 years have the highest fertility rate with 58.0 births per 1,000 women. Women in the age bracket of 20 to 34 years acount for 81.1% of all women with births.
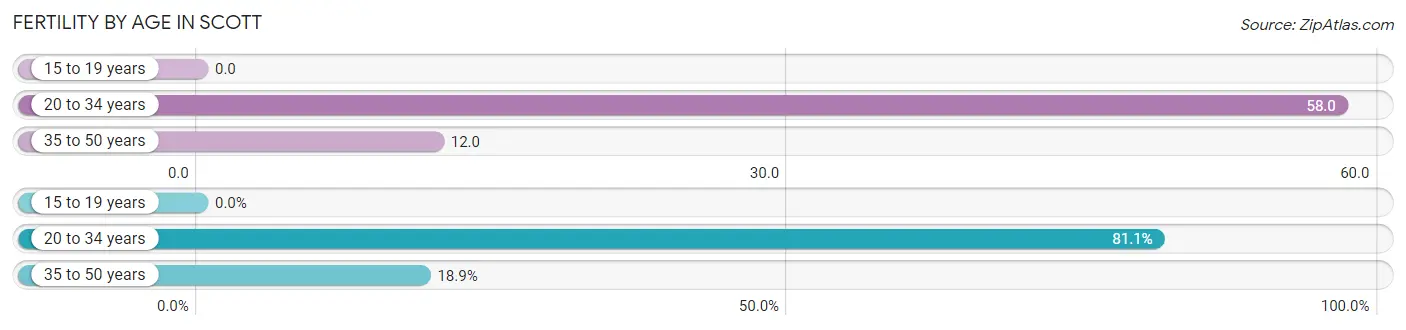
| Age Bracket | Women with Births | Births / 1,000 Women |
| 15 to 19 years | 0 (0.0%) | 0.0 |
| 20 to 34 years | 43 (81.1%) | 58.0 |
| 35 to 50 years | 10 (18.9%) | 12.0 |
| Total | 53 (100.0%) | 28.0 |
Fertility by Age by Marriage Status in Scott
58.5% of women with births (53) in Scott are married. The highest percentage of unmarried women with births falls into 20 to 34 years age bracket with 51.2% of them unmarried at the time of birth, while the lowest percentage of unmarried women with births belong to 35 to 50 years age bracket with 0.0% of them unmarried.
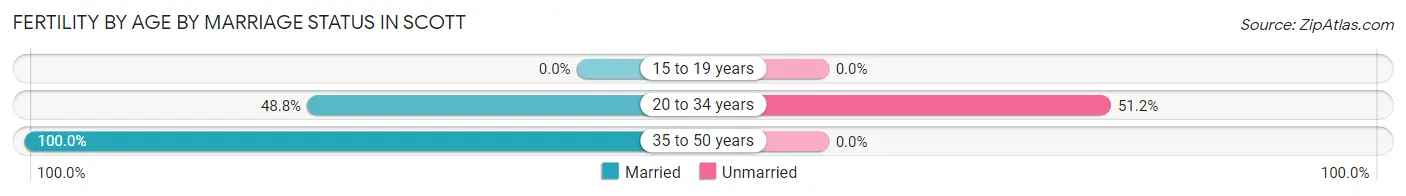
| Age Bracket | Married | Unmarried |
| 15 to 19 years | 0 (0.0%) | 0 (0.0%) |
| 20 to 34 years | 21 (48.8%) | 22 (51.2%) |
| 35 to 50 years | 10 (100.0%) | 0 (0.0%) |
| Total | 31 (58.5%) | 22 (41.5%) |
Fertility by Education in Scott
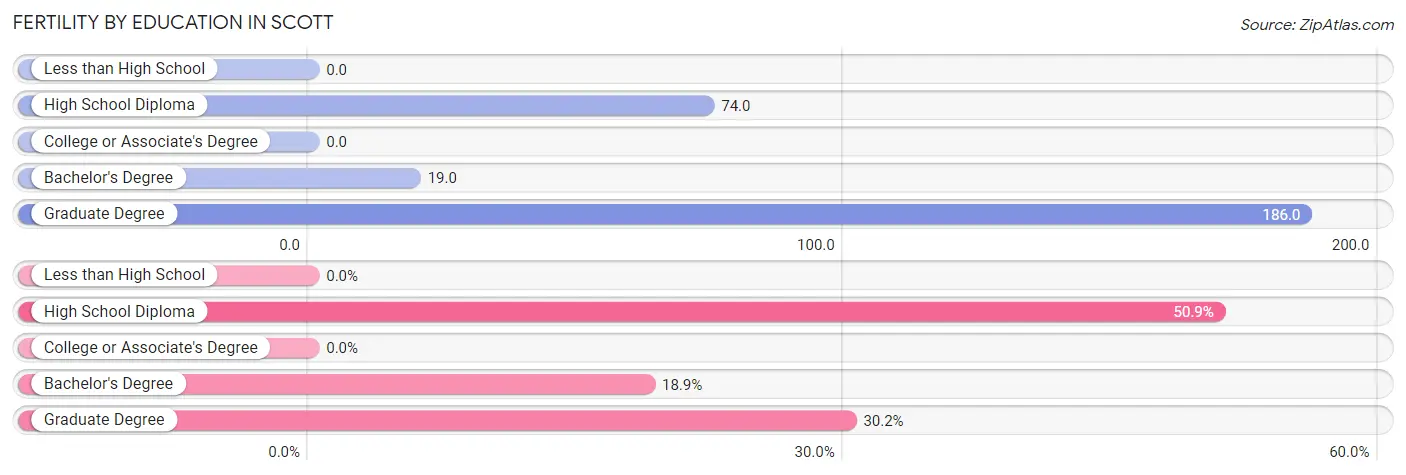
| Educational Attainment | Women with Births | Births / 1,000 Women |
| Less than High School | 0 (0.0%) | 0.0 |
| High School Diploma | 27 (50.9%) | 74.0 |
| College or Associate's Degree | 0 (0.0%) | 0.0 |
| Bachelor's Degree | 10 (18.9%) | 19.0 |
| Graduate Degree | 16 (30.2%) | 186.0 |
| Total | 53 (100.0%) | 28.0 |
Fertility by Education by Marriage Status in Scott
41.5% of women with births in Scott are unmarried. Women with the educational attainment of bachelor's degree are most likely to be married with 100.0% of them married at childbirth, while women with the educational attainment of high school diploma are least likely to be married with 81.5% of them unmarried at childbirth.
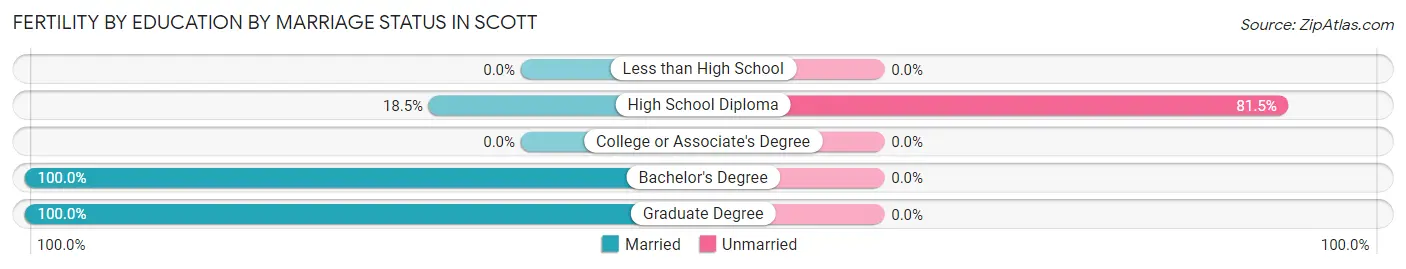
| Educational Attainment | Married | Unmarried |
| Less than High School | 0 (0.0%) | 0 (0.0%) |
| High School Diploma | 5 (18.5%) | 22 (81.5%) |
| College or Associate's Degree | 0 (0.0%) | 0 (0.0%) |
| Bachelor's Degree | 10 (100.0%) | 0 (0.0%) |
| Graduate Degree | 16 (100.0%) | 0 (0.0%) |
| Total | 31 (58.5%) | 22 (41.5%) |
Employment Characteristics in Scott
Employment by Class of Employer in Scott
Among the 4,177 employed individuals in Scott, private company employees (2,932 | 70.2%), local government employees (432 | 10.3%), and self-employed (not incorporated) (296 | 7.1%) make up the most common classes of employment.
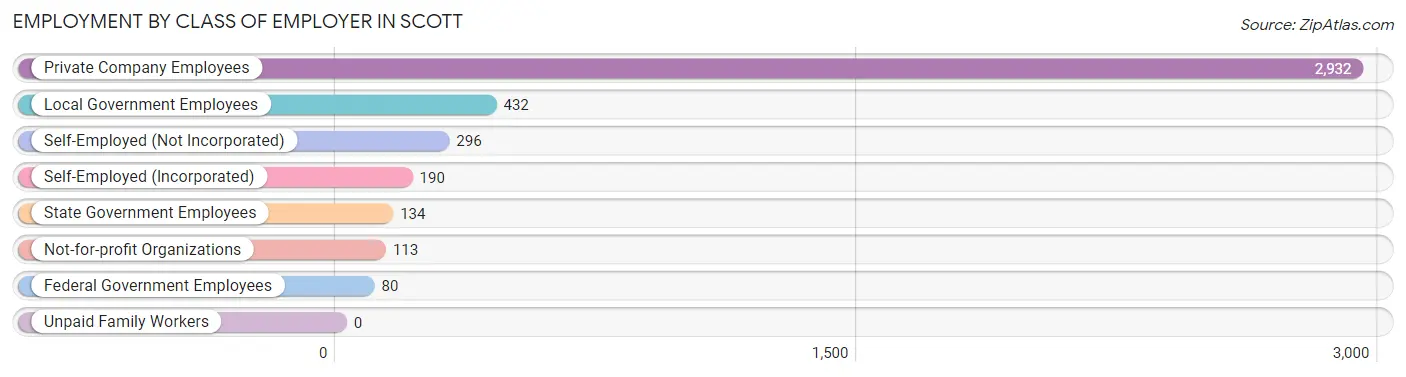
| Employer Class | # Employees | % Employees |
| Private Company Employees | 2,932 | 70.2% |
| Self-Employed (Incorporated) | 190 | 4.5% |
| Self-Employed (Not Incorporated) | 296 | 7.1% |
| Not-for-profit Organizations | 113 | 2.7% |
| Local Government Employees | 432 | 10.3% |
| State Government Employees | 134 | 3.2% |
| Federal Government Employees | 80 | 1.9% |
| Unpaid Family Workers | 0 | 0.0% |
| Total | 4,177 | 100.0% |
Employment Status by Age in Scott
According to the labor force statistics for Scott, out of the total population over 16 years of age (7,029), 64.0% or 4,499 individuals are in the labor force, with 5.4% or 243 of them unemployed. The age group with the highest labor force participation rate is 55 to 59 years, with 90.8% or 731 individuals in the labor force. Within the labor force, the 75 years and over age range has the highest percentage of unemployed individuals, with 100.0% or 10 of them being unemployed.
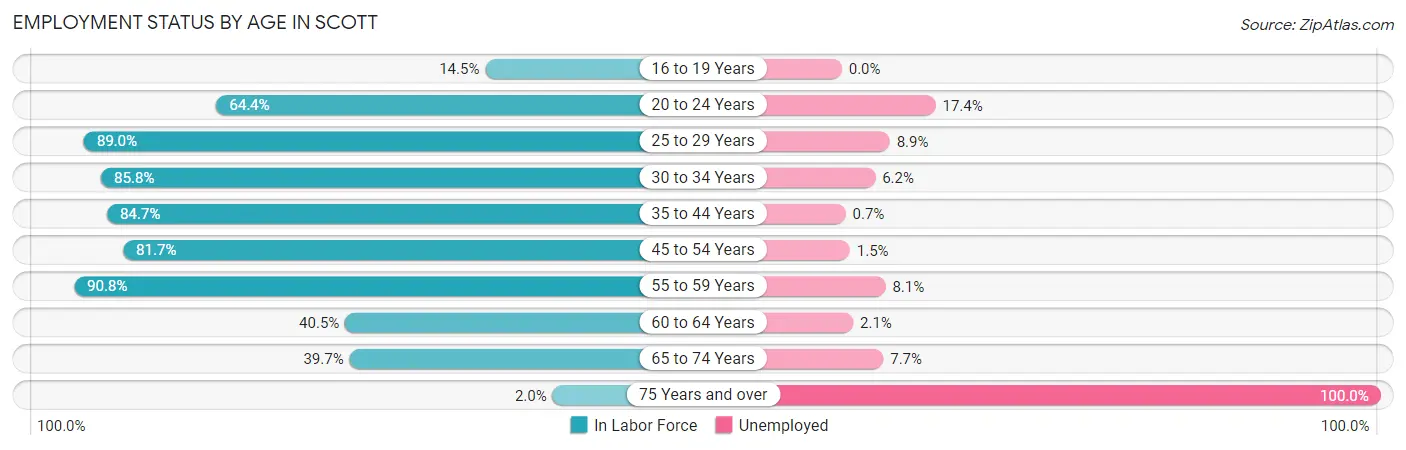
| Age Bracket | In Labor Force | Unemployed |
| 16 to 19 Years | 53 (14.5%) | 0 (0.0%) |
| 20 to 24 Years | 401 (64.4%) | 70 (17.4%) |
| 25 to 29 Years | 258 (89.0%) | 23 (8.9%) |
| 30 to 34 Years | 453 (85.8%) | 28 (6.2%) |
| 35 to 44 Years | 1,071 (84.7%) | 7 (0.7%) |
| 45 to 54 Years | 896 (81.7%) | 13 (1.5%) |
| 55 to 59 Years | 731 (90.8%) | 59 (8.1%) |
| 60 to 64 Years | 195 (40.5%) | 4 (2.1%) |
| 65 to 74 Years | 428 (39.7%) | 33 (7.7%) |
| 75 Years and over | 10 (2.0%) | 10 (100.0%) |
| Total | 4,499 (64.0%) | 243 (5.4%) |
Employment Status by Educational Attainment in Scott
According to labor force statistics for Scott, 80.7% of individuals (3,605) out of the total population between 25 and 64 years of age (4,467) are in the labor force, with 3.7% or 133 of them being unemployed. The group with the highest labor force participation rate are those with the educational attainment of bachelor's degree or higher, with 90.3% or 959 individuals in the labor force. Within the labor force, individuals with bachelor's degree or higher education have the highest percentage of unemployment, with 6.2% or 59 of them being unemployed.
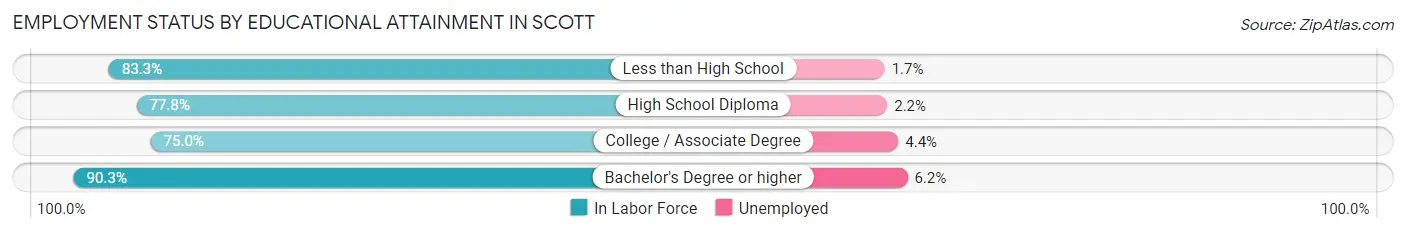
| Educational Attainment | In Labor Force | Unemployed |
| Less than High School | 483 (83.3%) | 10 (1.7%) |
| High School Diploma | 1,235 (77.8%) | 35 (2.2%) |
| College / Associate Degree | 928 (75.0%) | 54 (4.4%) |
| Bachelor's Degree or higher | 959 (90.3%) | 66 (6.2%) |
| Total | 3,605 (80.7%) | 165 (3.7%) |
Employment Occupations by Sex in Scott
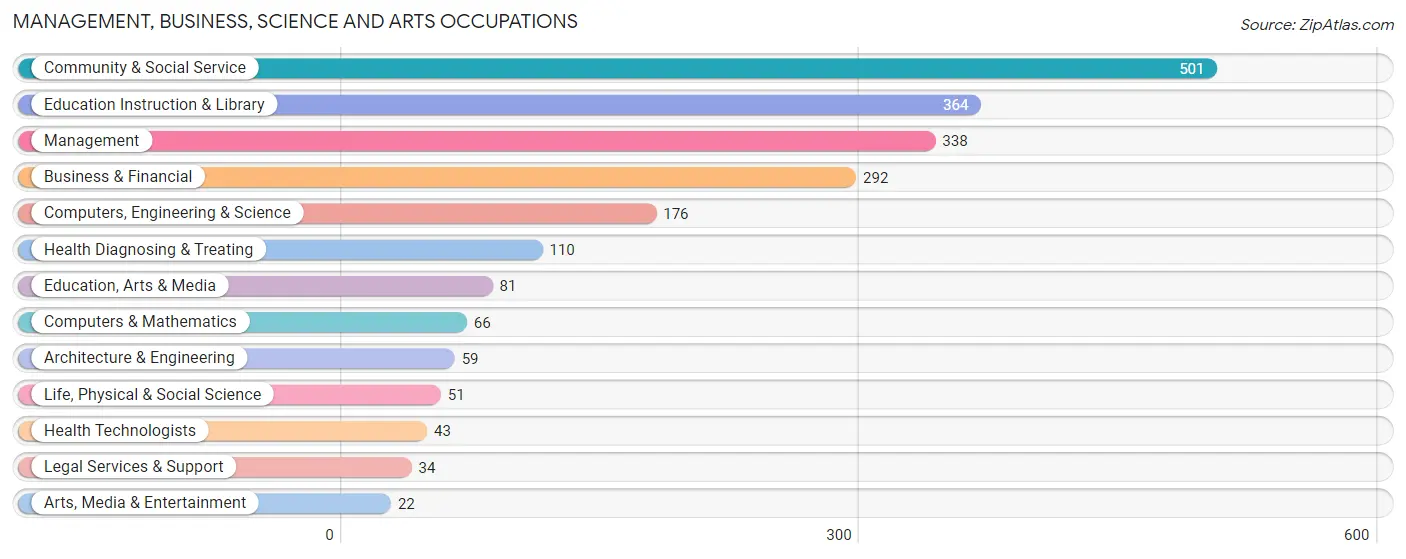
Management, Business, Science and Arts Occupations
The most common Management, Business, Science and Arts occupations in Scott are Community & Social Service (501 | 11.9%), Education Instruction & Library (364 | 8.6%), Management (338 | 8.0%), Business & Financial (292 | 6.9%), and Computers, Engineering & Science (176 | 4.2%).
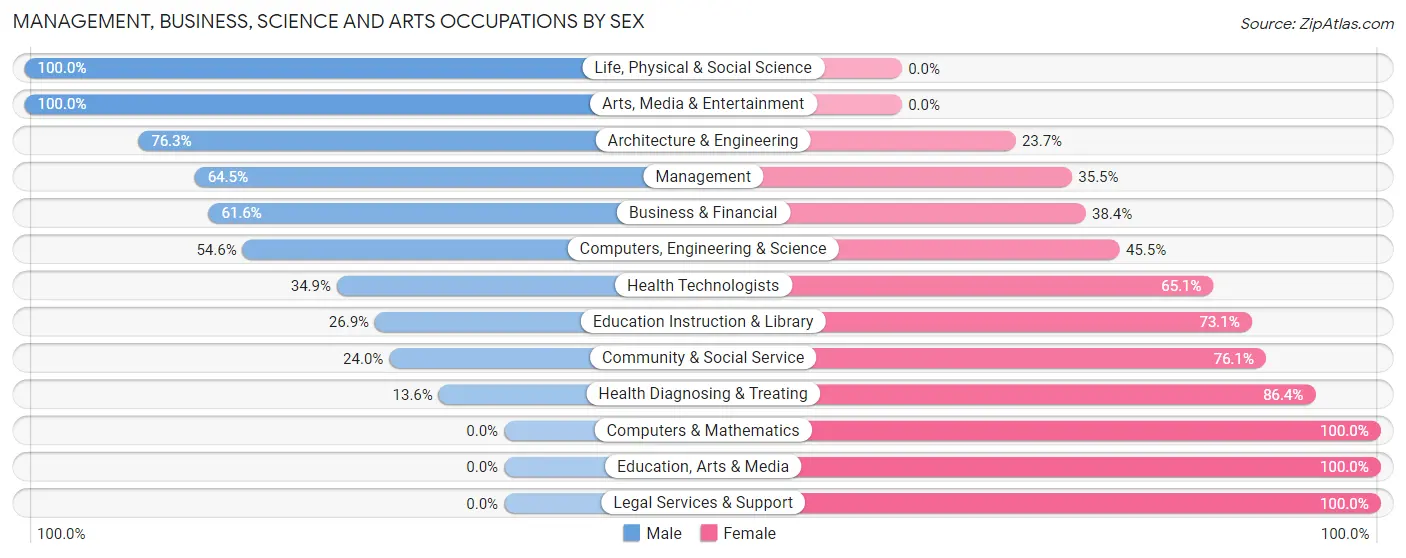
Management, Business, Science and Arts Occupations by Sex
Within the Management, Business, Science and Arts occupations in Scott, the most male-oriented occupations are Life, Physical & Social Science (100.0%), Arts, Media & Entertainment (100.0%), and Architecture & Engineering (76.3%), while the most female-oriented occupations are Computers & Mathematics (100.0%), Education, Arts & Media (100.0%), and Legal Services & Support (100.0%).
| Occupation | Male | Female |
| Management | 218 (64.5%) | 120 (35.5%) |
| Business & Financial | 180 (61.6%) | 112 (38.4%) |
| Computers, Engineering & Science | 96 (54.5%) | 80 (45.5%) |
| Computers & Mathematics | 0 (0.0%) | 66 (100.0%) |
| Architecture & Engineering | 45 (76.3%) | 14 (23.7%) |
| Life, Physical & Social Science | 51 (100.0%) | 0 (0.0%) |
| Community & Social Service | 120 (23.9%) | 381 (76.0%) |
| Education, Arts & Media | 0 (0.0%) | 81 (100.0%) |
| Legal Services & Support | 0 (0.0%) | 34 (100.0%) |
| Education Instruction & Library | 98 (26.9%) | 266 (73.1%) |
| Arts, Media & Entertainment | 22 (100.0%) | 0 (0.0%) |
| Health Diagnosing & Treating | 15 (13.6%) | 95 (86.4%) |
| Health Technologists | 15 (34.9%) | 28 (65.1%) |
| Total (Category) | 629 (44.4%) | 788 (55.6%) |
| Total (Overall) | 2,444 (57.9%) | 1,777 (42.1%) |
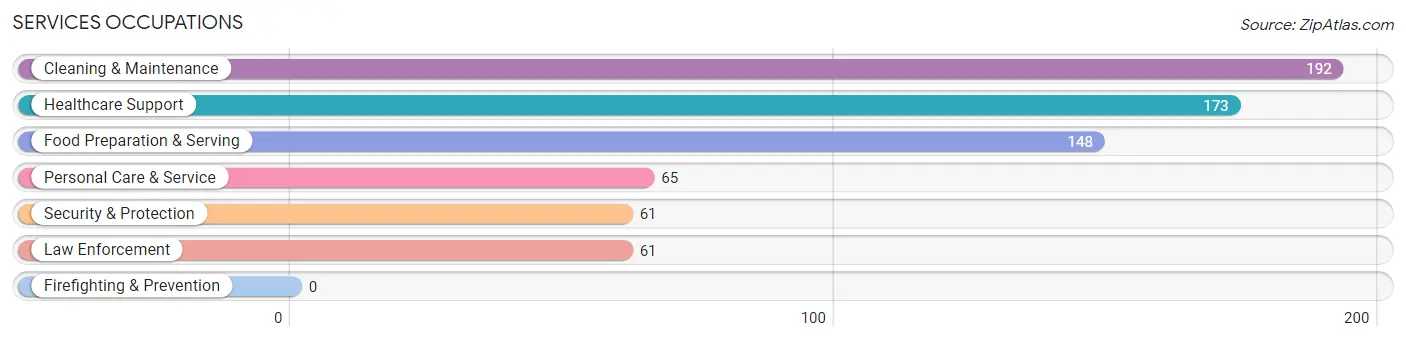
Services Occupations
The most common Services occupations in Scott are Cleaning & Maintenance (192 | 4.5%), Healthcare Support (173 | 4.1%), Food Preparation & Serving (148 | 3.5%), Personal Care & Service (65 | 1.5%), and Security & Protection (61 | 1.5%).
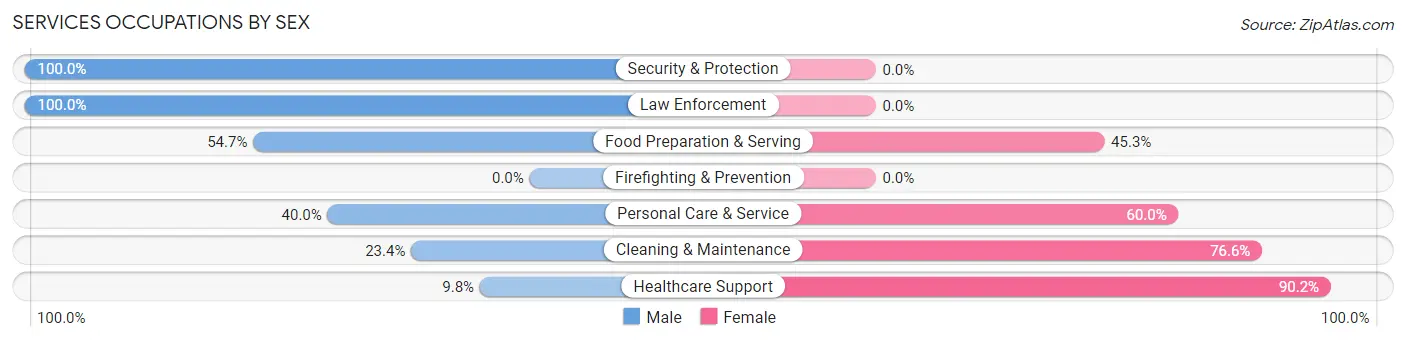
Services Occupations by Sex
Within the Services occupations in Scott, the most male-oriented occupations are Security & Protection (100.0%), Law Enforcement (100.0%), and Food Preparation & Serving (54.7%), while the most female-oriented occupations are Healthcare Support (90.2%), Cleaning & Maintenance (76.6%), and Personal Care & Service (60.0%).
| Occupation | Male | Female |
| Healthcare Support | 17 (9.8%) | 156 (90.2%) |
| Security & Protection | 61 (100.0%) | 0 (0.0%) |
| Firefighting & Prevention | 0 (0.0%) | 0 (0.0%) |
| Law Enforcement | 61 (100.0%) | 0 (0.0%) |
| Food Preparation & Serving | 81 (54.7%) | 67 (45.3%) |
| Cleaning & Maintenance | 45 (23.4%) | 147 (76.6%) |
| Personal Care & Service | 26 (40.0%) | 39 (60.0%) |
| Total (Category) | 230 (36.0%) | 409 (64.0%) |
| Total (Overall) | 2,444 (57.9%) | 1,777 (42.1%) |
Sales and Office Occupations
The most common Sales and Office occupations in Scott are Sales & Related (691 | 16.4%), and Office & Administration (284 | 6.7%).
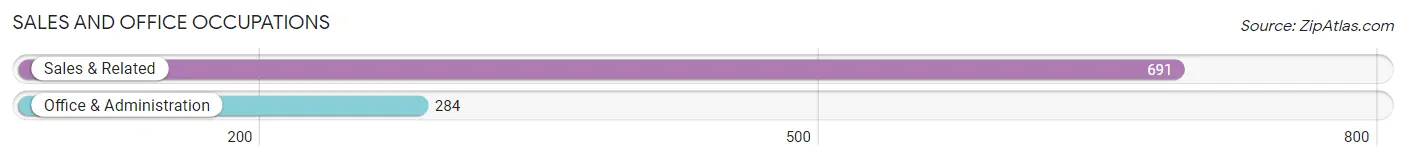
Sales and Office Occupations by Sex

| Occupation | Male | Female |
| Sales & Related | 482 (69.8%) | 209 (30.2%) |
| Office & Administration | 42 (14.8%) | 242 (85.2%) |
| Total (Category) | 524 (53.7%) | 451 (46.3%) |
| Total (Overall) | 2,444 (57.9%) | 1,777 (42.1%) |
Natural Resources, Construction and Maintenance Occupations
The most common Natural Resources, Construction and Maintenance occupations in Scott are Construction & Extraction (163 | 3.9%), and Installation, Maintenance & Repair (146 | 3.5%).
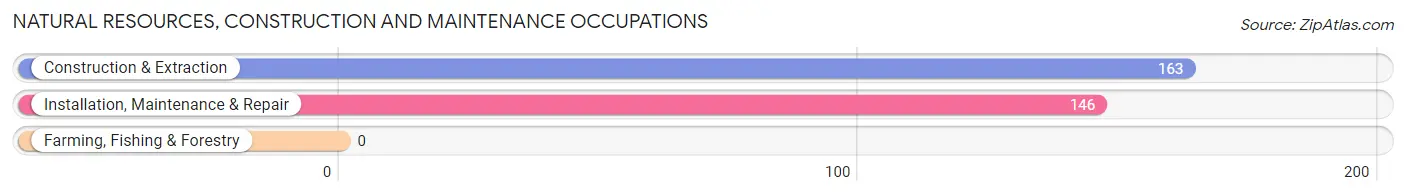
Natural Resources, Construction and Maintenance Occupations by Sex
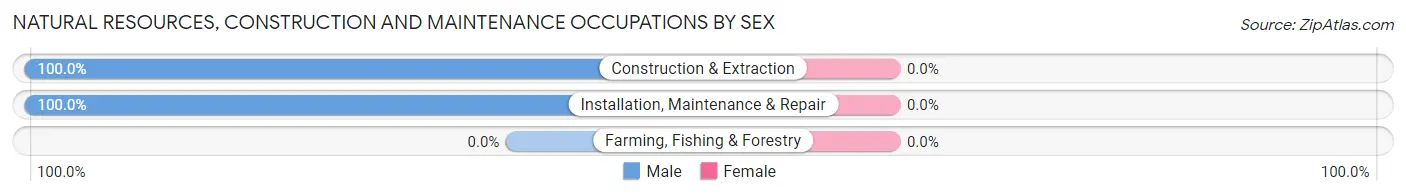
| Occupation | Male | Female |
| Farming, Fishing & Forestry | 0 (0.0%) | 0 (0.0%) |
| Construction & Extraction | 163 (100.0%) | 0 (0.0%) |
| Installation, Maintenance & Repair | 146 (100.0%) | 0 (0.0%) |
| Total (Category) | 309 (100.0%) | 0 (0.0%) |
| Total (Overall) | 2,444 (57.9%) | 1,777 (42.1%) |
Production, Transportation and Moving Occupations
The most common Production, Transportation and Moving occupations in Scott are Transportation (445 | 10.5%), Production (422 | 10.0%), and Material Moving (14 | 0.3%).
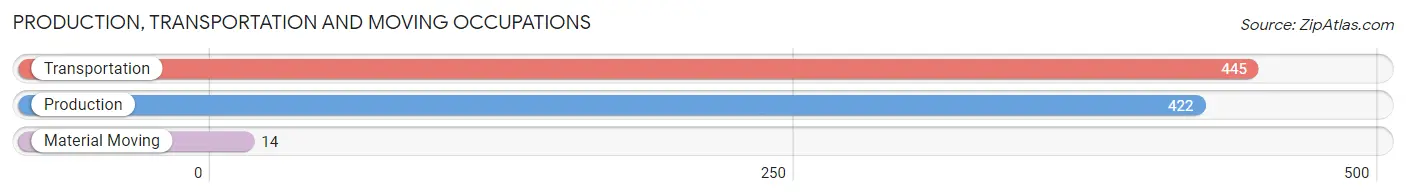
Production, Transportation and Moving Occupations by Sex
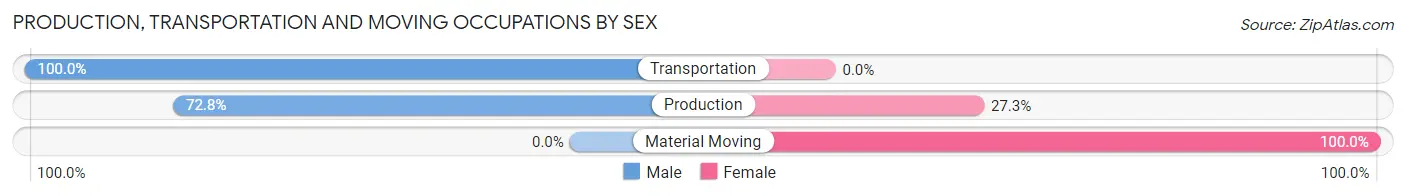
| Occupation | Male | Female |
| Production | 307 (72.8%) | 115 (27.3%) |
| Transportation | 445 (100.0%) | 0 (0.0%) |
| Material Moving | 0 (0.0%) | 14 (100.0%) |
| Total (Category) | 752 (85.4%) | 129 (14.6%) |
| Total (Overall) | 2,444 (57.9%) | 1,777 (42.1%) |
Employment Industries by Sex in Scott
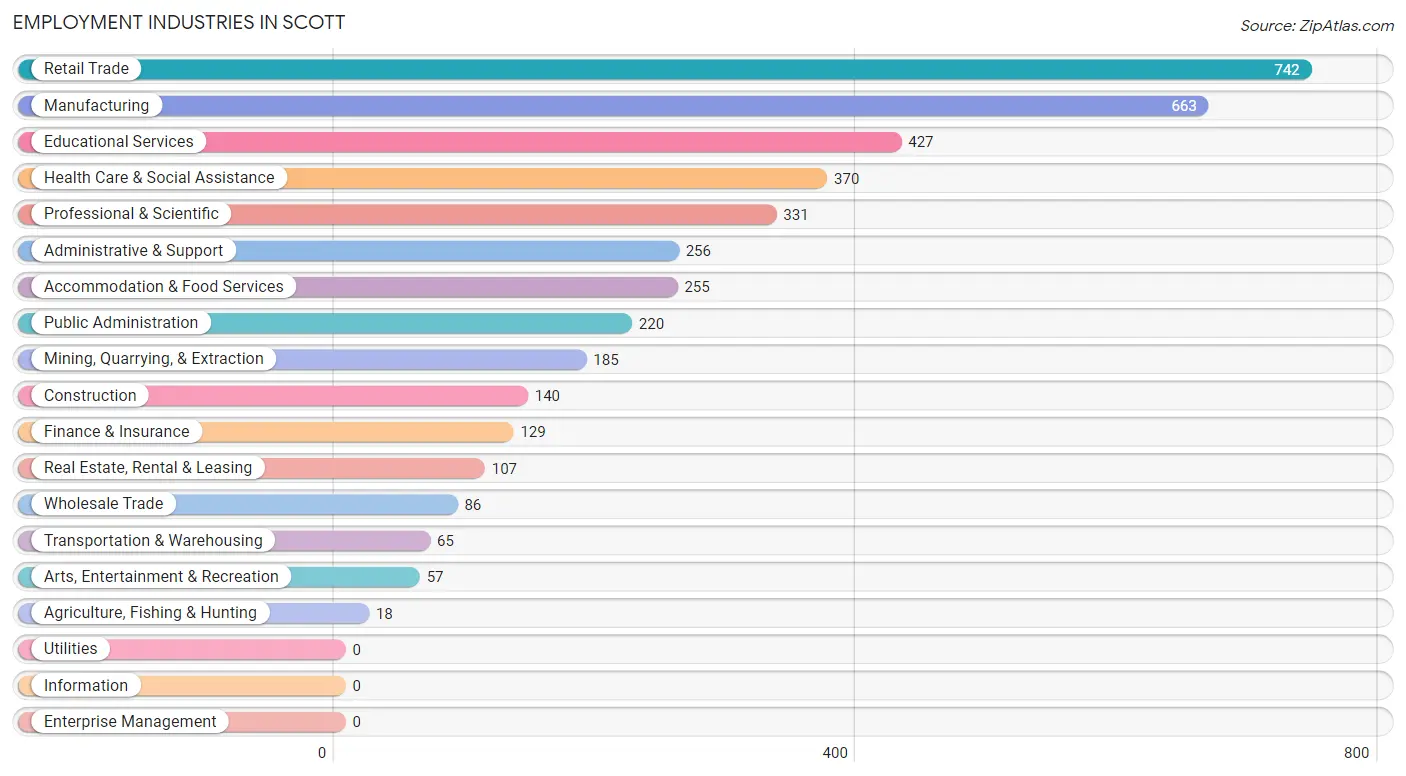
Employment Industries in Scott
The major employment industries in Scott include Retail Trade (742 | 17.6%), Manufacturing (663 | 15.7%), Educational Services (427 | 10.1%), Health Care & Social Assistance (370 | 8.8%), and Professional & Scientific (331 | 7.8%).
Employment Industries by Sex in Scott
The Scott industries that see more men than women are Agriculture, Fishing & Hunting (100.0%), Construction (100.0%), and Wholesale Trade (100.0%), whereas the industries that tend to have a higher number of women are Arts, Entertainment & Recreation (100.0%), Health Care & Social Assistance (91.3%), and Educational Services (77.7%).
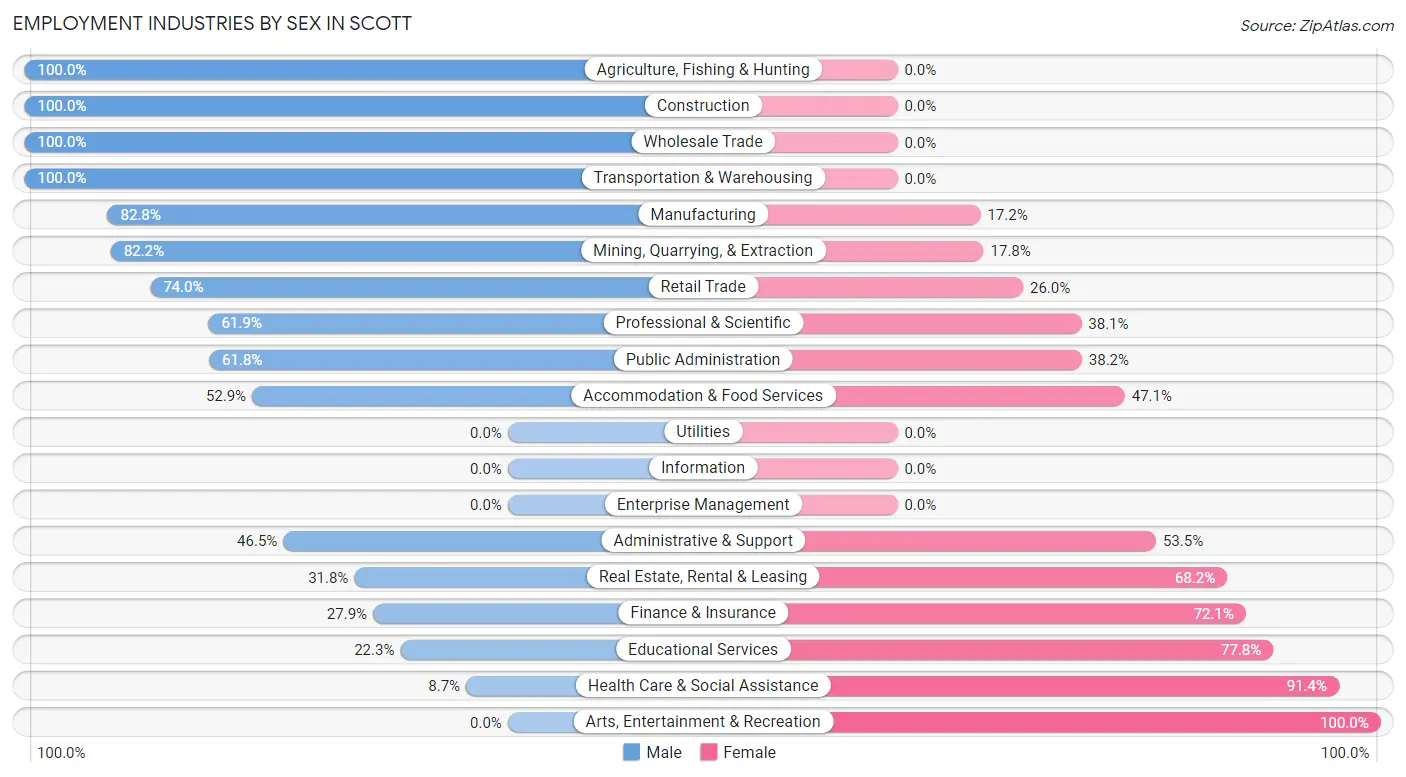
| Industry | Male | Female |
| Agriculture, Fishing & Hunting | 18 (100.0%) | 0 (0.0%) |
| Mining, Quarrying, & Extraction | 152 (82.2%) | 33 (17.8%) |
| Construction | 140 (100.0%) | 0 (0.0%) |
| Manufacturing | 549 (82.8%) | 114 (17.2%) |
| Wholesale Trade | 86 (100.0%) | 0 (0.0%) |
| Retail Trade | 549 (74.0%) | 193 (26.0%) |
| Transportation & Warehousing | 65 (100.0%) | 0 (0.0%) |
| Utilities | 0 (0.0%) | 0 (0.0%) |
| Information | 0 (0.0%) | 0 (0.0%) |
| Finance & Insurance | 36 (27.9%) | 93 (72.1%) |
| Real Estate, Rental & Leasing | 34 (31.8%) | 73 (68.2%) |
| Professional & Scientific | 205 (61.9%) | 126 (38.1%) |
| Enterprise Management | 0 (0.0%) | 0 (0.0%) |
| Administrative & Support | 119 (46.5%) | 137 (53.5%) |
| Educational Services | 95 (22.3%) | 332 (77.7%) |
| Health Care & Social Assistance | 32 (8.6%) | 338 (91.3%) |
| Arts, Entertainment & Recreation | 0 (0.0%) | 57 (100.0%) |
| Accommodation & Food Services | 135 (52.9%) | 120 (47.1%) |
| Public Administration | 136 (61.8%) | 84 (38.2%) |
| Total | 2,444 (57.9%) | 1,777 (42.1%) |
Education in Scott
School Enrollment in Scott
The most common levels of schooling among the 1,680 students in Scott are high school (449 | 26.7%), middle school (383 | 22.8%), and college / undergraduate (287 | 17.1%).
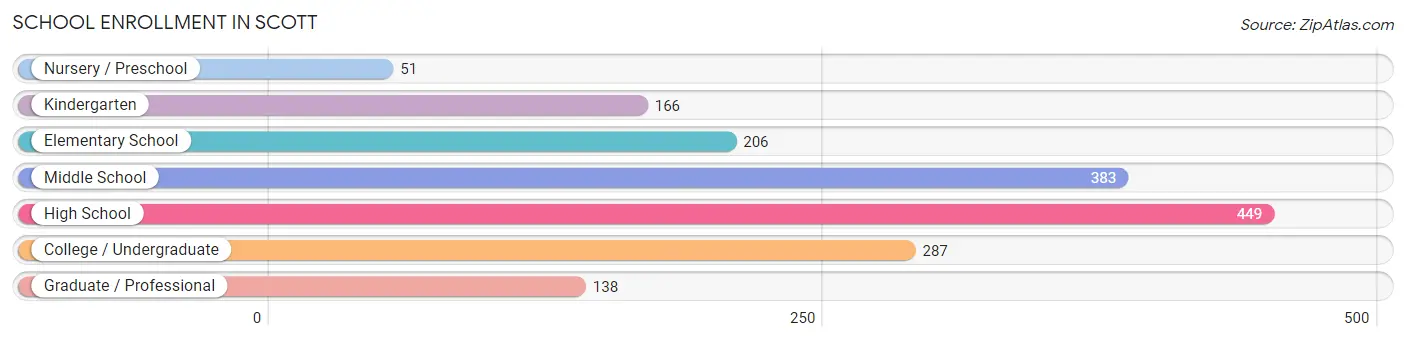
| School Level | # Students | % Students |
| Nursery / Preschool | 51 | 3.0% |
| Kindergarten | 166 | 9.9% |
| Elementary School | 206 | 12.3% |
| Middle School | 383 | 22.8% |
| High School | 449 | 26.7% |
| College / Undergraduate | 287 | 17.1% |
| Graduate / Professional | 138 | 8.2% |
| Total | 1,680 | 100.0% |
School Enrollment by Age by Funding Source in Scott
Out of a total of 1,680 students who are enrolled in schools in Scott, 333 (19.8%) attend a private institution, while the remaining 1,347 (80.2%) are enrolled in public schools. The age group of 3 to 4 year olds has the highest likelihood of being enrolled in private schools, with 36 (100.0% in the age bracket) enrolled. Conversely, the age group of 18 to 19 year olds has the lowest likelihood of being enrolled in a private school, with 34 (100.0% in the age bracket) attending a public institution.
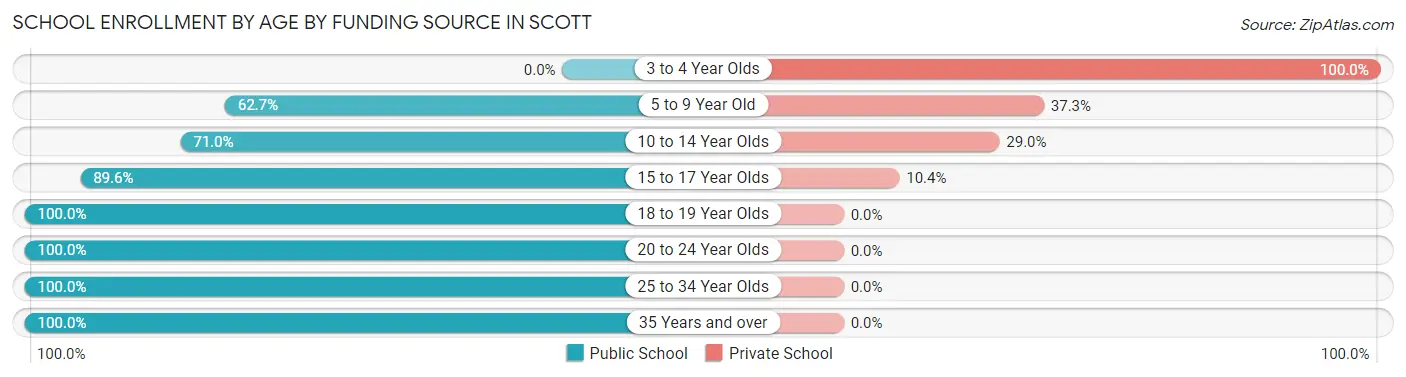
| Age Bracket | Public School | Private School |
| 3 to 4 Year Olds | 0 (0.0%) | 36 (100.0%) |
| 5 to 9 Year Old | 222 (62.7%) | 132 (37.3%) |
| 10 to 14 Year Olds | 306 (71.0%) | 125 (29.0%) |
| 15 to 17 Year Olds | 346 (89.6%) | 40 (10.4%) |
| 18 to 19 Year Olds | 34 (100.0%) | 0 (0.0%) |
| 20 to 24 Year Olds | 199 (100.0%) | 0 (0.0%) |
| 25 to 34 Year Olds | 89 (100.0%) | 0 (0.0%) |
| 35 Years and over | 151 (100.0%) | 0 (0.0%) |
| Total | 1,347 (80.2%) | 333 (19.8%) |
Educational Attainment by Field of Study in Scott
Business (475 | 37.3%), education (180 | 14.1%), liberal arts & history (141 | 11.1%), bio, nature & agricultural (119 | 9.3%), and science & technology (101 | 7.9%) are the most common fields of study among 1,274 individuals in Scott who have obtained a bachelor's degree or higher.
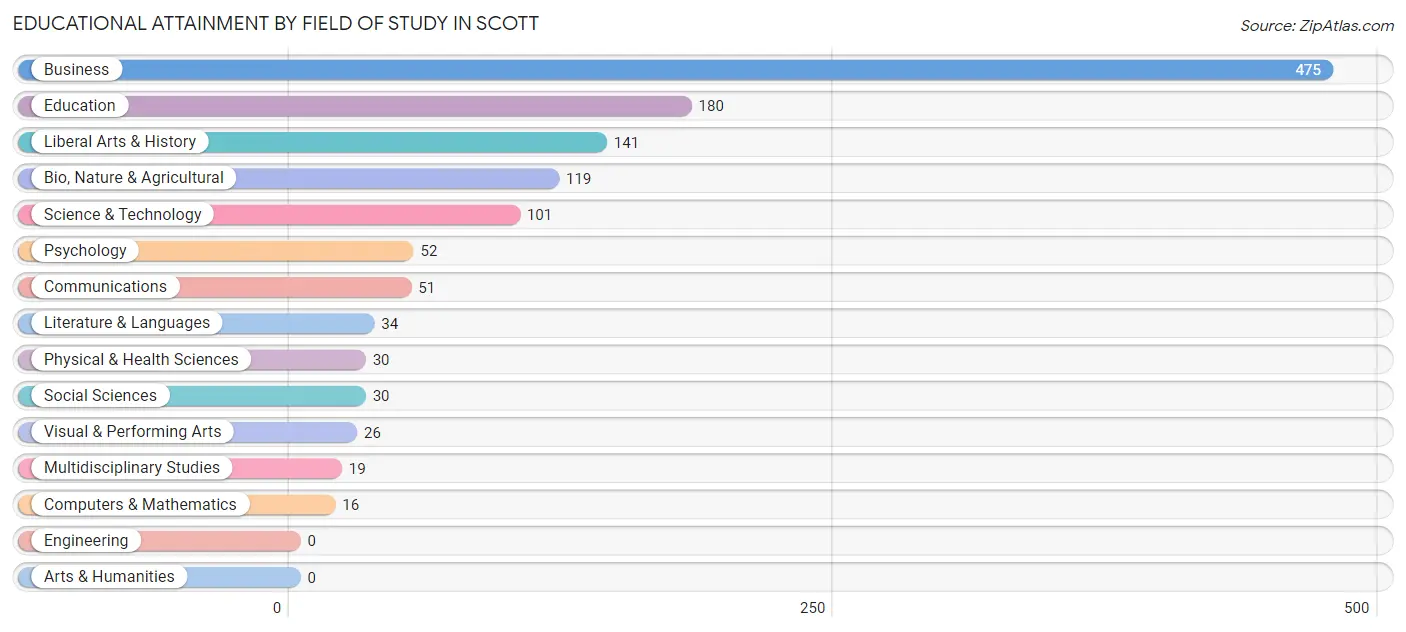
| Field of Study | # Graduates | % Graduates |
| Computers & Mathematics | 16 | 1.3% |
| Bio, Nature & Agricultural | 119 | 9.3% |
| Physical & Health Sciences | 30 | 2.4% |
| Psychology | 52 | 4.1% |
| Social Sciences | 30 | 2.4% |
| Engineering | 0 | 0.0% |
| Multidisciplinary Studies | 19 | 1.5% |
| Science & Technology | 101 | 7.9% |
| Business | 475 | 37.3% |
| Education | 180 | 14.1% |
| Literature & Languages | 34 | 2.7% |
| Liberal Arts & History | 141 | 11.1% |
| Visual & Performing Arts | 26 | 2.0% |
| Communications | 51 | 4.0% |
| Arts & Humanities | 0 | 0.0% |
| Total | 1,274 | 100.0% |
Transportation & Commute in Scott
Vehicle Availability by Sex in Scott
The most prevalent vehicle ownership categories in Scott are males with 2 vehicles (1,091, accounting for 44.8%) and females with 2 vehicles (972, making up 62.6%).
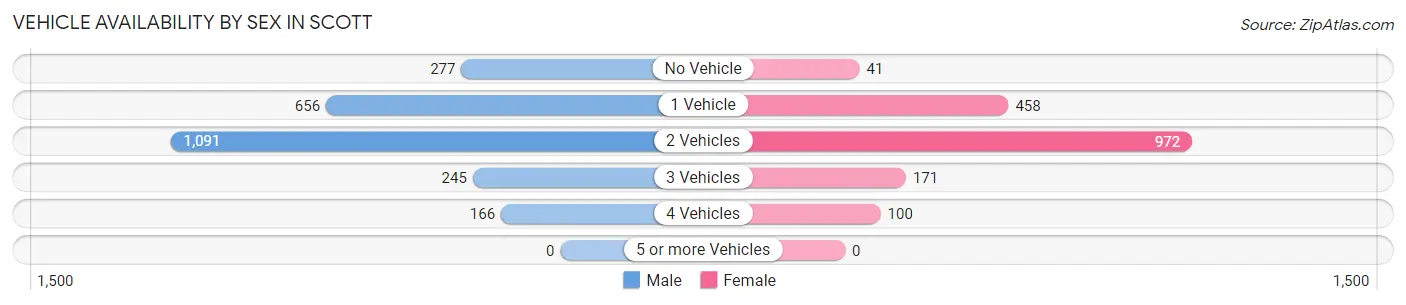
| Vehicles Available | Male | Female |
| No Vehicle | 277 (11.4%) | 41 (2.4%) |
| 1 Vehicle | 656 (26.9%) | 458 (26.3%) |
| 2 Vehicles | 1,091 (44.8%) | 972 (55.8%) |
| 3 Vehicles | 245 (10.1%) | 171 (9.8%) |
| 4 Vehicles | 166 (6.8%) | 100 (5.7%) |
| 5 or more Vehicles | 0 (0.0%) | 0 (0.0%) |
| Total | 2,435 (100.0%) | 1,742 (100.0%) |
Commute Time in Scott
The most frequently occuring commute durations in Scott are 20 to 24 minutes (826 commuters, 21.0%), 15 to 19 minutes (738 commuters, 18.8%), and 5 to 9 minutes (540 commuters, 13.8%).
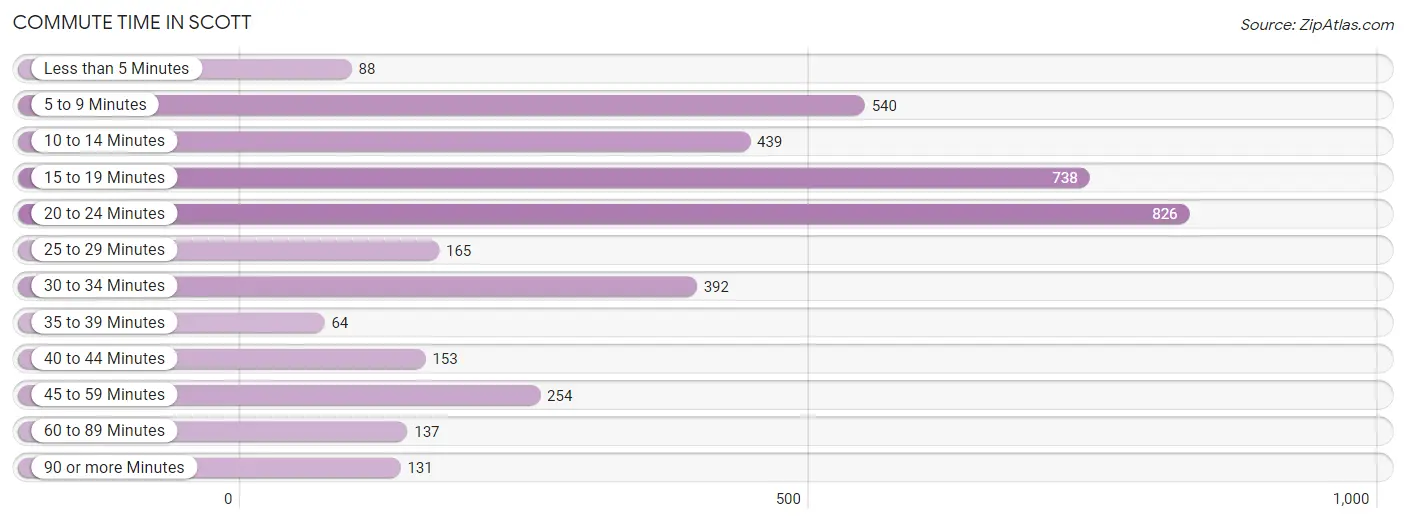
| Commute Time | # Commuters | % Commuters |
| Less than 5 Minutes | 88 | 2.2% |
| 5 to 9 Minutes | 540 | 13.8% |
| 10 to 14 Minutes | 439 | 11.2% |
| 15 to 19 Minutes | 738 | 18.8% |
| 20 to 24 Minutes | 826 | 21.0% |
| 25 to 29 Minutes | 165 | 4.2% |
| 30 to 34 Minutes | 392 | 10.0% |
| 35 to 39 Minutes | 64 | 1.6% |
| 40 to 44 Minutes | 153 | 3.9% |
| 45 to 59 Minutes | 254 | 6.5% |
| 60 to 89 Minutes | 137 | 3.5% |
| 90 or more Minutes | 131 | 3.3% |
Commute Time by Sex in Scott
The most common commute times in Scott are 15 to 19 minutes (480 commuters, 21.9%) for males and 20 to 24 minutes (555 commuters, 32.0%) for females.
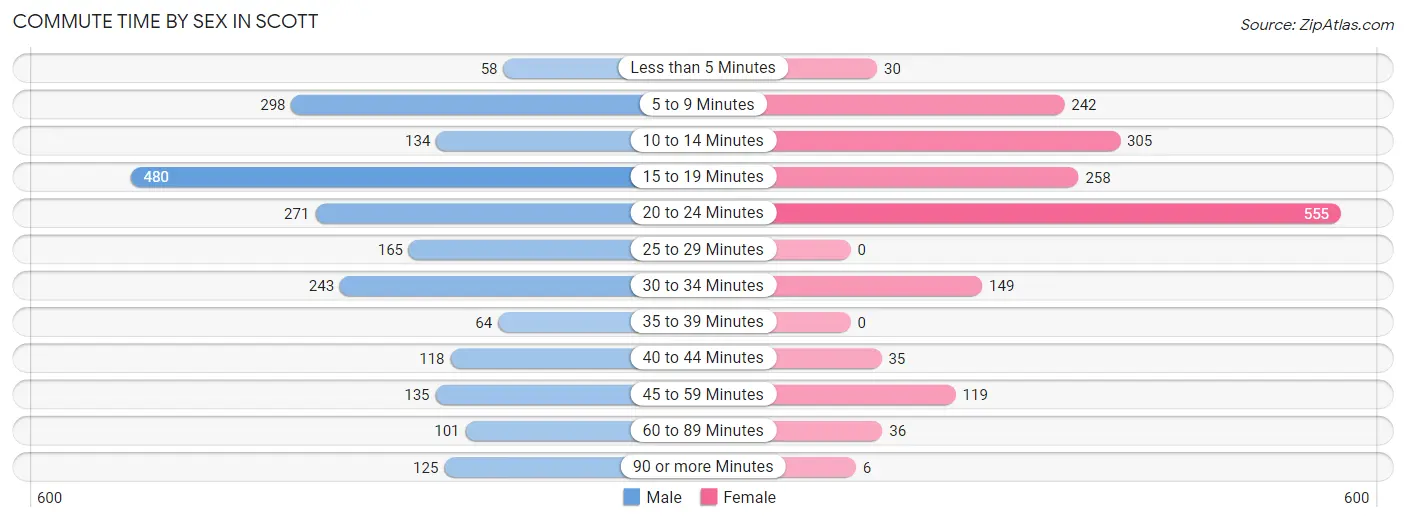
| Commute Time | Male | Female |
| Less than 5 Minutes | 58 (2.6%) | 30 (1.7%) |
| 5 to 9 Minutes | 298 (13.6%) | 242 (14.0%) |
| 10 to 14 Minutes | 134 (6.1%) | 305 (17.6%) |
| 15 to 19 Minutes | 480 (21.9%) | 258 (14.9%) |
| 20 to 24 Minutes | 271 (12.4%) | 555 (32.0%) |
| 25 to 29 Minutes | 165 (7.5%) | 0 (0.0%) |
| 30 to 34 Minutes | 243 (11.1%) | 149 (8.6%) |
| 35 to 39 Minutes | 64 (2.9%) | 0 (0.0%) |
| 40 to 44 Minutes | 118 (5.4%) | 35 (2.0%) |
| 45 to 59 Minutes | 135 (6.2%) | 119 (6.9%) |
| 60 to 89 Minutes | 101 (4.6%) | 36 (2.1%) |
| 90 or more Minutes | 125 (5.7%) | 6 (0.4%) |
Time of Departure to Work by Sex in Scott
The most frequent times of departure to work in Scott are 7:00 AM to 7:29 AM (371, 16.9%) for males and 7:00 AM to 7:29 AM (329, 19.0%) for females.
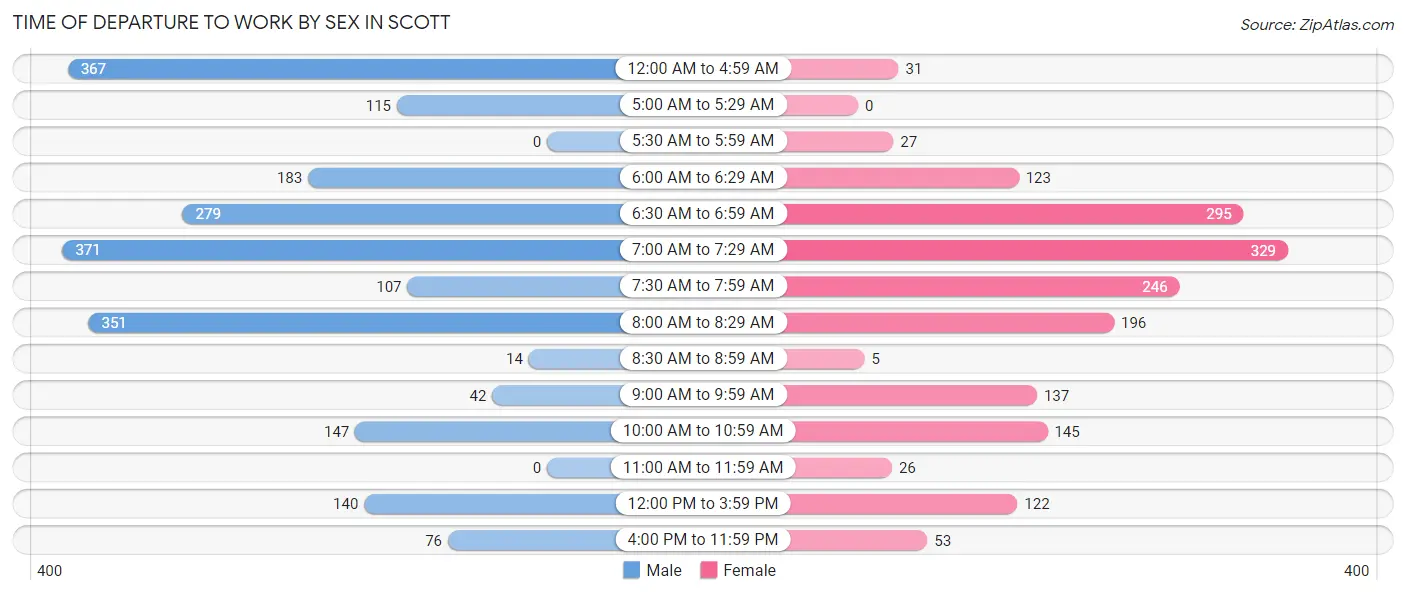
| Time of Departure | Male | Female |
| 12:00 AM to 4:59 AM | 367 (16.7%) | 31 (1.8%) |
| 5:00 AM to 5:29 AM | 115 (5.2%) | 0 (0.0%) |
| 5:30 AM to 5:59 AM | 0 (0.0%) | 27 (1.6%) |
| 6:00 AM to 6:29 AM | 183 (8.4%) | 123 (7.1%) |
| 6:30 AM to 6:59 AM | 279 (12.7%) | 295 (17.0%) |
| 7:00 AM to 7:29 AM | 371 (16.9%) | 329 (19.0%) |
| 7:30 AM to 7:59 AM | 107 (4.9%) | 246 (14.2%) |
| 8:00 AM to 8:29 AM | 351 (16.0%) | 196 (11.3%) |
| 8:30 AM to 8:59 AM | 14 (0.6%) | 5 (0.3%) |
| 9:00 AM to 9:59 AM | 42 (1.9%) | 137 (7.9%) |
| 10:00 AM to 10:59 AM | 147 (6.7%) | 145 (8.4%) |
| 11:00 AM to 11:59 AM | 0 (0.0%) | 26 (1.5%) |
| 12:00 PM to 3:59 PM | 140 (6.4%) | 122 (7.0%) |
| 4:00 PM to 11:59 PM | 76 (3.5%) | 53 (3.0%) |
| Total | 2,192 (100.0%) | 1,735 (100.0%) |
Housing Occupancy in Scott
Occupancy by Ownership in Scott
Of the total 4,049 dwellings in Scott, owner-occupied units account for 3,067 (75.7%), while renter-occupied units make up 982 (24.2%).
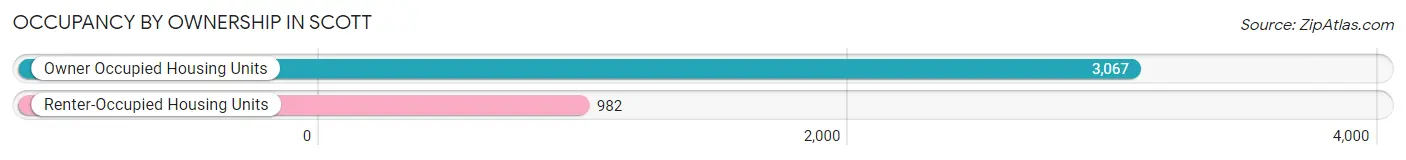
| Occupancy | # Housing Units | % Housing Units |
| Owner Occupied Housing Units | 3,067 | 75.7% |
| Renter-Occupied Housing Units | 982 | 24.2% |
| Total Occupied Housing Units | 4,049 | 100.0% |
Occupancy by Household Size in Scott
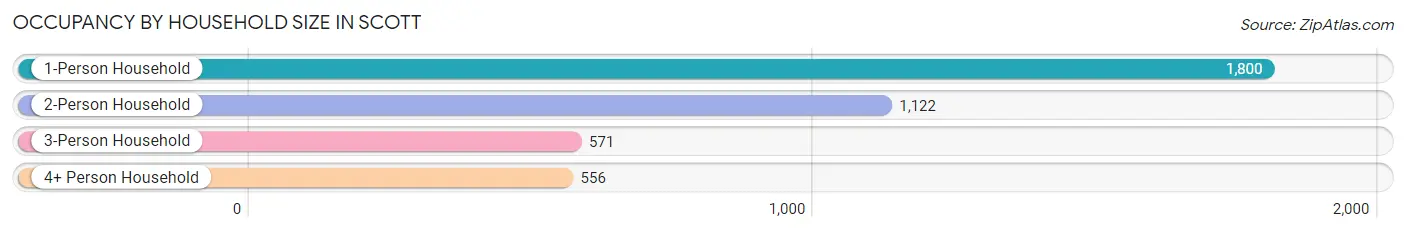
| Household Size | # Housing Units | % Housing Units |
| 1-Person Household | 1,800 | 44.5% |
| 2-Person Household | 1,122 | 27.7% |
| 3-Person Household | 571 | 14.1% |
| 4+ Person Household | 556 | 13.7% |
| Total Housing Units | 4,049 | 100.0% |
Occupancy by Ownership by Household Size in Scott
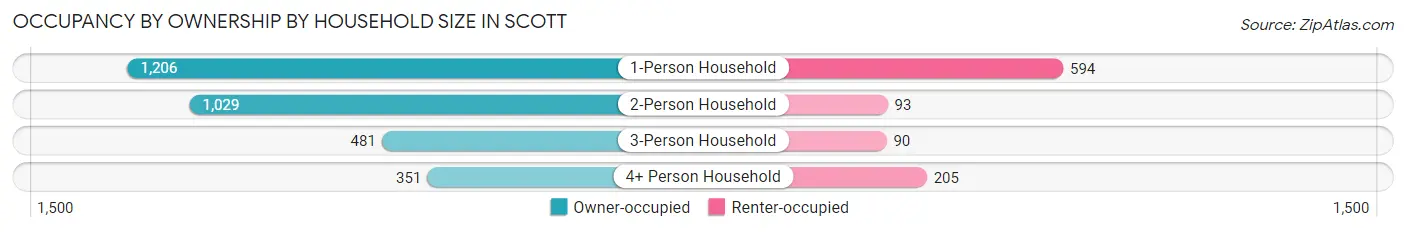
| Household Size | Owner-occupied | Renter-occupied |
| 1-Person Household | 1,206 (67.0%) | 594 (33.0%) |
| 2-Person Household | 1,029 (91.7%) | 93 (8.3%) |
| 3-Person Household | 481 (84.2%) | 90 (15.8%) |
| 4+ Person Household | 351 (63.1%) | 205 (36.9%) |
| Total Housing Units | 3,067 (75.7%) | 982 (24.2%) |
Occupancy by Educational Attainment in Scott
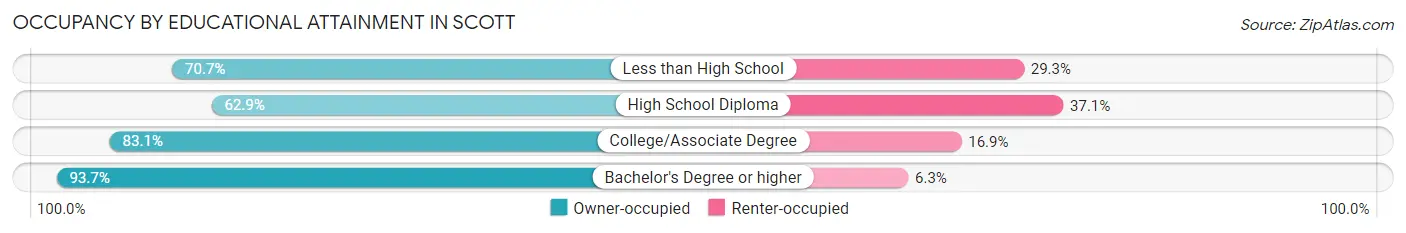
| Household Size | Owner-occupied | Renter-occupied |
| Less than High School | 423 (70.7%) | 175 (29.3%) |
| High School Diploma | 924 (62.9%) | 544 (37.1%) |
| College/Associate Degree | 1,084 (83.1%) | 220 (16.9%) |
| Bachelor's Degree or higher | 636 (93.7%) | 43 (6.3%) |
Occupancy by Age of Householder in Scott
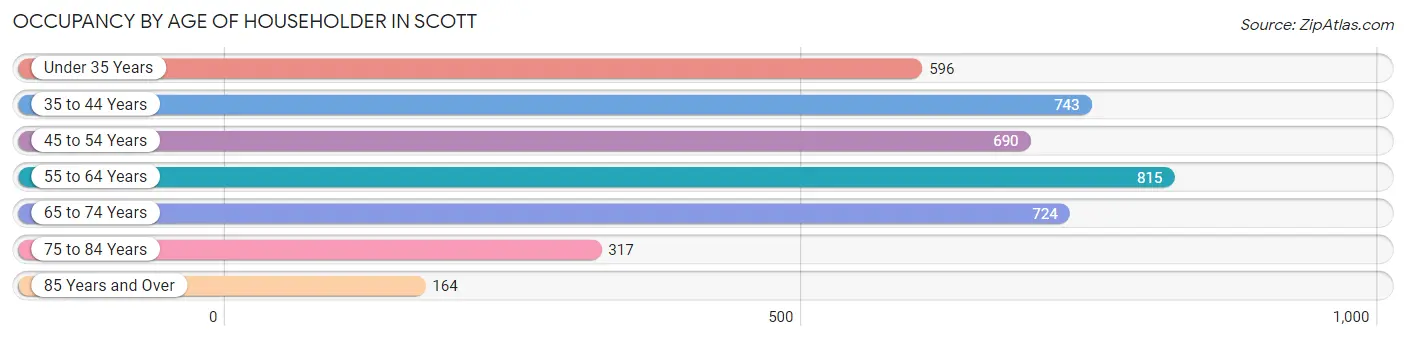
| Age Bracket | # Households | % Households |
| Under 35 Years | 596 | 14.7% |
| 35 to 44 Years | 743 | 18.3% |
| 45 to 54 Years | 690 | 17.0% |
| 55 to 64 Years | 815 | 20.1% |
| 65 to 74 Years | 724 | 17.9% |
| 75 to 84 Years | 317 | 7.8% |
| 85 Years and Over | 164 | 4.1% |
| Total | 4,049 | 100.0% |
Housing Finances in Scott
Median Income by Occupancy in Scott
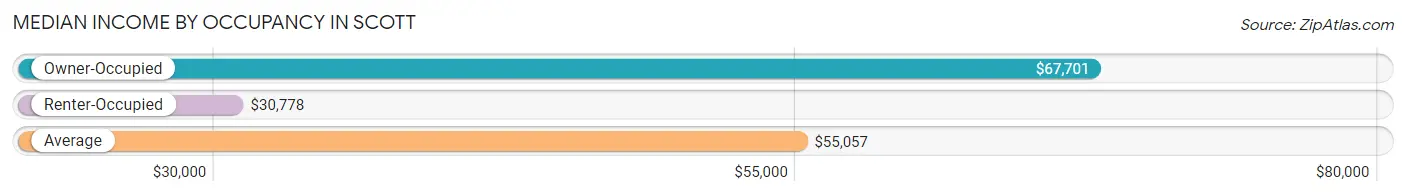
| Occupancy Type | # Households | Median Income |
| Owner-Occupied | 3,067 (75.7%) | $67,701 |
| Renter-Occupied | 982 (24.2%) | $30,778 |
| Average | 4,049 (100.0%) | $55,057 |
Occupancy by Householder Income Bracket in Scott
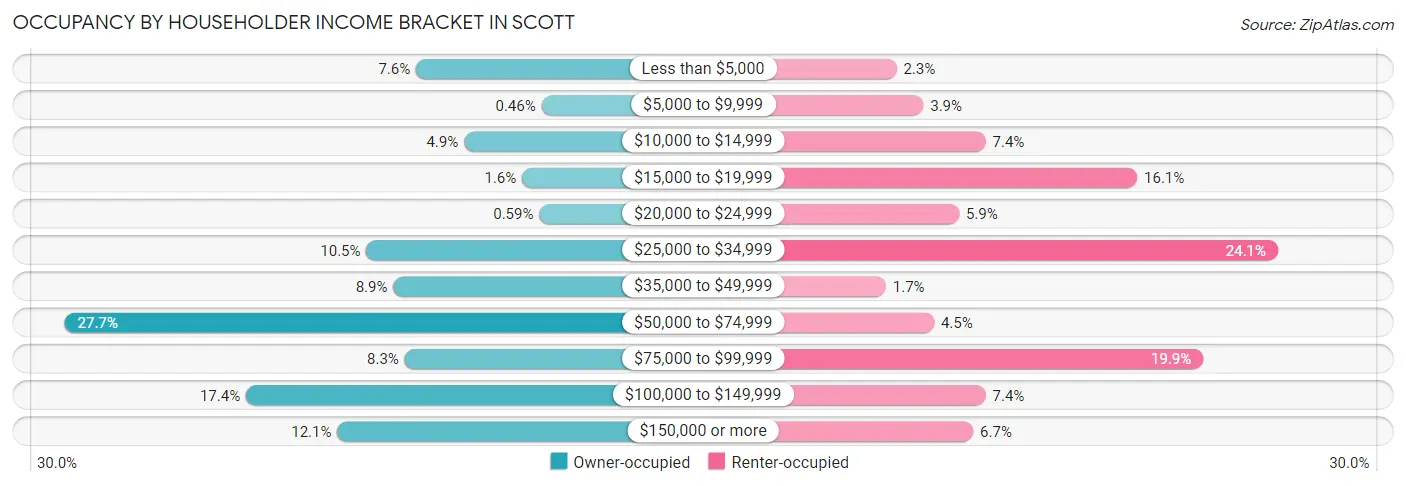
| Income Bracket | Owner-occupied | Renter-occupied |
| Less than $5,000 | 234 (7.6%) | 23 (2.3%) |
| $5,000 to $9,999 | 14 (0.5%) | 38 (3.9%) |
| $10,000 to $14,999 | 150 (4.9%) | 73 (7.4%) |
| $15,000 to $19,999 | 48 (1.6%) | 158 (16.1%) |
| $20,000 to $24,999 | 18 (0.6%) | 58 (5.9%) |
| $25,000 to $34,999 | 321 (10.5%) | 237 (24.1%) |
| $35,000 to $49,999 | 274 (8.9%) | 17 (1.7%) |
| $50,000 to $74,999 | 850 (27.7%) | 44 (4.5%) |
| $75,000 to $99,999 | 254 (8.3%) | 195 (19.9%) |
| $100,000 to $149,999 | 532 (17.3%) | 73 (7.4%) |
| $150,000 or more | 372 (12.1%) | 66 (6.7%) |
| Total | 3,067 (100.0%) | 982 (100.0%) |
Monthly Housing Cost Tiers in Scott
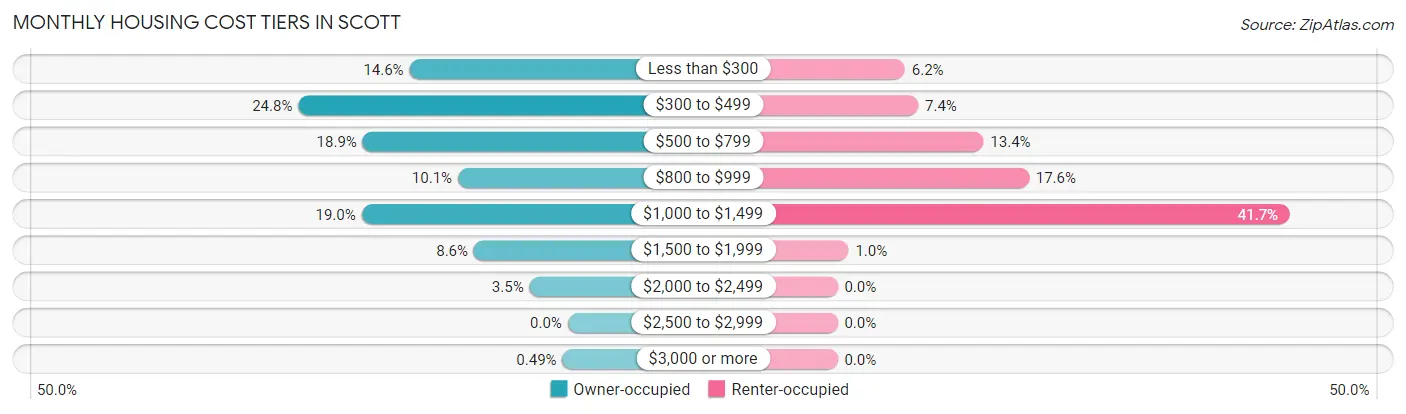
| Monthly Cost | Owner-occupied | Renter-occupied |
| Less than $300 | 447 (14.6%) | 61 (6.2%) |
| $300 to $499 | 761 (24.8%) | 73 (7.4%) |
| $500 to $799 | 579 (18.9%) | 132 (13.4%) |
| $800 to $999 | 310 (10.1%) | 173 (17.6%) |
| $1,000 to $1,499 | 582 (19.0%) | 409 (41.6%) |
| $1,500 to $1,999 | 265 (8.6%) | 10 (1.0%) |
| $2,000 to $2,499 | 108 (3.5%) | 0 (0.0%) |
| $2,500 to $2,999 | 0 (0.0%) | 0 (0.0%) |
| $3,000 or more | 15 (0.5%) | 0 (0.0%) |
| Total | 3,067 (100.0%) | 982 (100.0%) |
Physical Housing Characteristics in Scott
Housing Structures in Scott
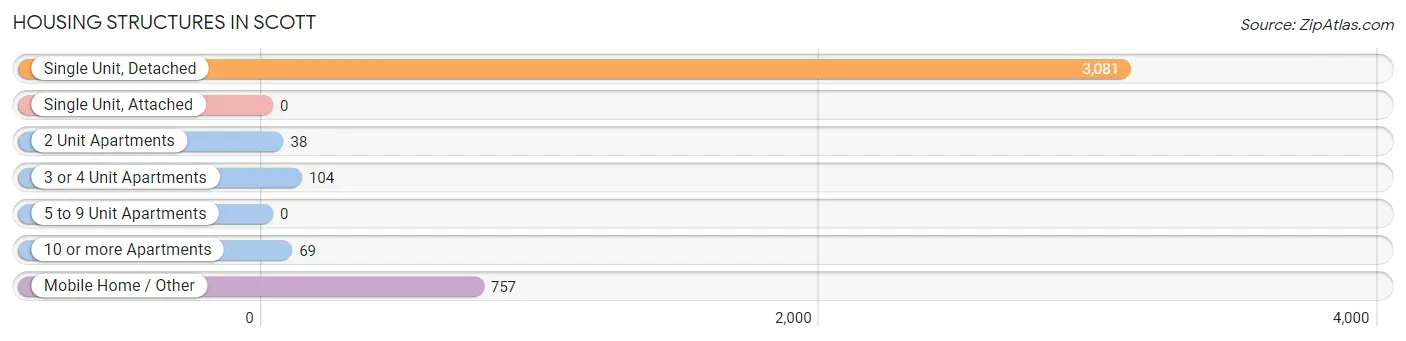
| Structure Type | # Housing Units | % Housing Units |
| Single Unit, Detached | 3,081 | 76.1% |
| Single Unit, Attached | 0 | 0.0% |
| 2 Unit Apartments | 38 | 0.9% |
| 3 or 4 Unit Apartments | 104 | 2.6% |
| 5 to 9 Unit Apartments | 0 | 0.0% |
| 10 or more Apartments | 69 | 1.7% |
| Mobile Home / Other | 757 | 18.7% |
| Total | 4,049 | 100.0% |
Housing Structures by Occupancy in Scott
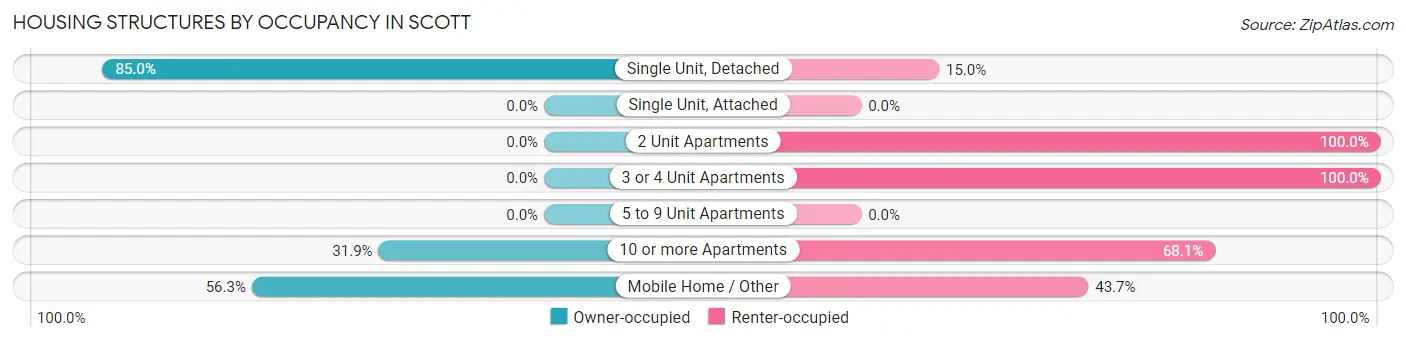
| Structure Type | Owner-occupied | Renter-occupied |
| Single Unit, Detached | 2,619 (85.0%) | 462 (15.0%) |
| Single Unit, Attached | 0 (0.0%) | 0 (0.0%) |
| 2 Unit Apartments | 0 (0.0%) | 38 (100.0%) |
| 3 or 4 Unit Apartments | 0 (0.0%) | 104 (100.0%) |
| 5 to 9 Unit Apartments | 0 (0.0%) | 0 (0.0%) |
| 10 or more Apartments | 22 (31.9%) | 47 (68.1%) |
| Mobile Home / Other | 426 (56.3%) | 331 (43.7%) |
| Total | 3,067 (75.7%) | 982 (24.2%) |
Housing Structures by Number of Rooms in Scott
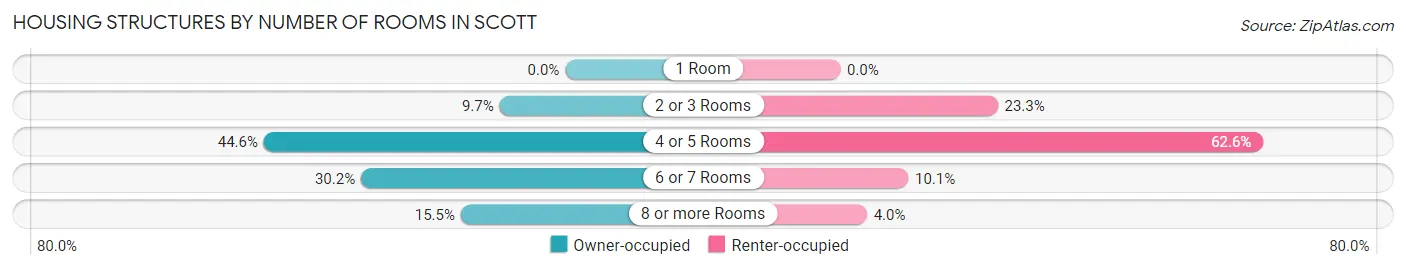
| Number of Rooms | Owner-occupied | Renter-occupied |
| 1 Room | 0 (0.0%) | 0 (0.0%) |
| 2 or 3 Rooms | 298 (9.7%) | 229 (23.3%) |
| 4 or 5 Rooms | 1,368 (44.6%) | 615 (62.6%) |
| 6 or 7 Rooms | 927 (30.2%) | 99 (10.1%) |
| 8 or more Rooms | 474 (15.4%) | 39 (4.0%) |
| Total | 3,067 (100.0%) | 982 (100.0%) |
Housing Structure by Heating Type in Scott
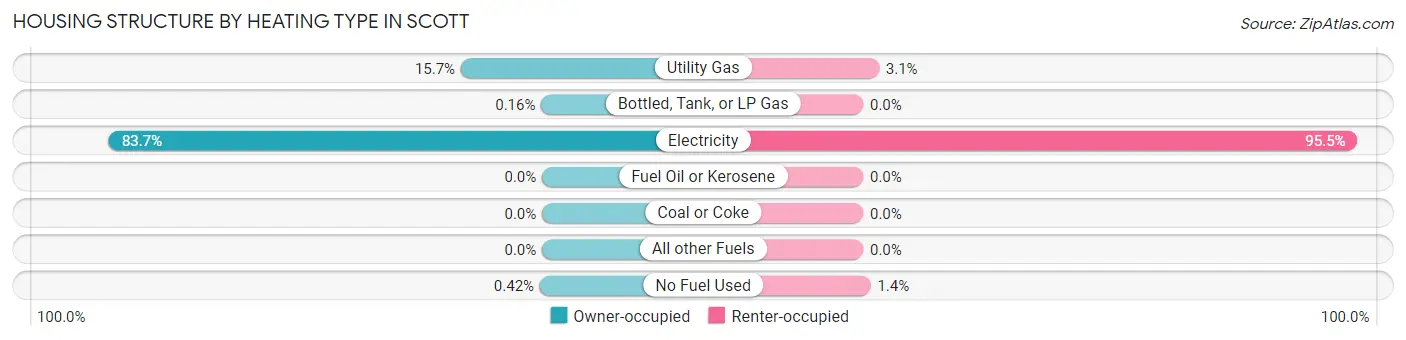
| Heating Type | Owner-occupied | Renter-occupied |
| Utility Gas | 481 (15.7%) | 30 (3.0%) |
| Bottled, Tank, or LP Gas | 5 (0.2%) | 0 (0.0%) |
| Electricity | 2,568 (83.7%) | 938 (95.5%) |
| Fuel Oil or Kerosene | 0 (0.0%) | 0 (0.0%) |
| Coal or Coke | 0 (0.0%) | 0 (0.0%) |
| All other Fuels | 0 (0.0%) | 0 (0.0%) |
| No Fuel Used | 13 (0.4%) | 14 (1.4%) |
| Total | 3,067 (100.0%) | 982 (100.0%) |
Household Vehicle Usage in Scott
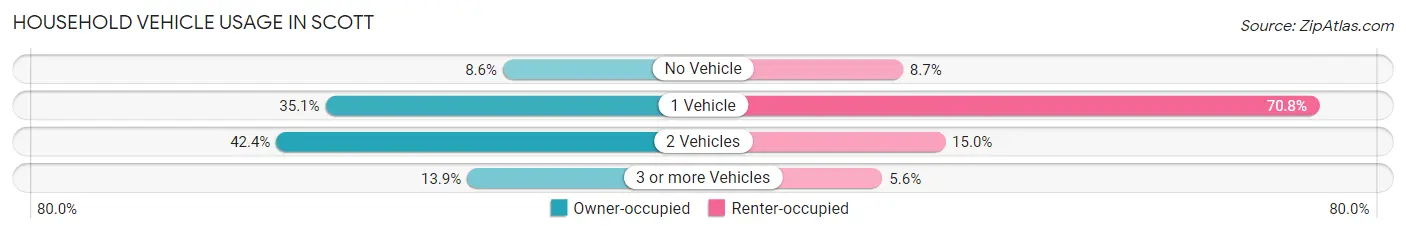
| Vehicles per Household | Owner-occupied | Renter-occupied |
| No Vehicle | 263 (8.6%) | 85 (8.7%) |
| 1 Vehicle | 1,076 (35.1%) | 695 (70.8%) |
| 2 Vehicles | 1,301 (42.4%) | 147 (15.0%) |
| 3 or more Vehicles | 427 (13.9%) | 55 (5.6%) |
| Total | 3,067 (100.0%) | 982 (100.0%) |
Real Estate & Mortgages in Scott
Real Estate and Mortgage Overview in Scott
| Characteristic | Without Mortgage | With Mortgage |
| Housing Units | 1,593 | 1,474 |
| Median Property Value | $135,500 | $179,900 |
| Median Household Income | $66,092 | $238 |
| Monthly Housing Costs | $372 | $15 |
| Real Estate Taxes | - | - |
Property Value by Mortgage Status in Scott
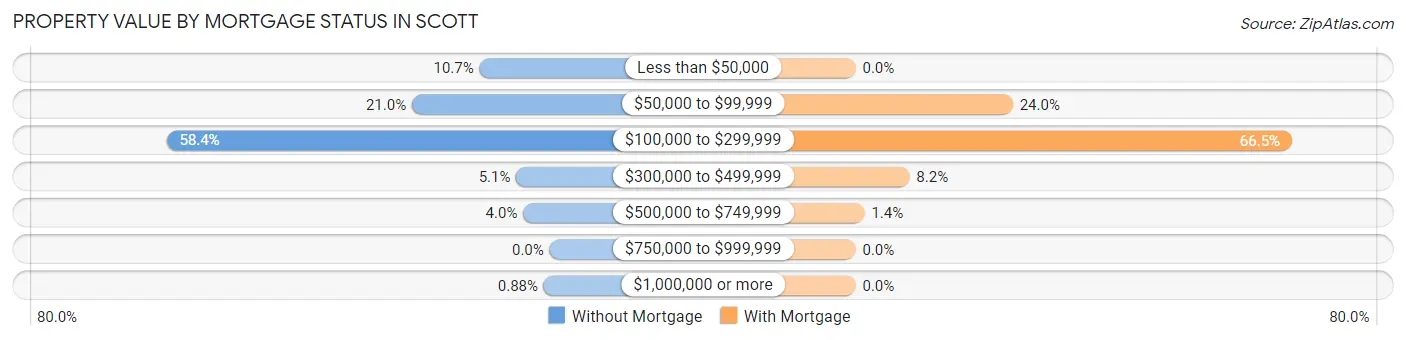
| Property Value | Without Mortgage | With Mortgage |
| Less than $50,000 | 170 (10.7%) | 0 (0.0%) |
| $50,000 to $99,999 | 334 (21.0%) | 353 (23.9%) |
| $100,000 to $299,999 | 930 (58.4%) | 980 (66.5%) |
| $300,000 to $499,999 | 81 (5.1%) | 121 (8.2%) |
| $500,000 to $749,999 | 64 (4.0%) | 20 (1.4%) |
| $750,000 to $999,999 | 0 (0.0%) | 0 (0.0%) |
| $1,000,000 or more | 14 (0.9%) | 0 (0.0%) |
| Total | 1,593 (100.0%) | 1,474 (100.0%) |
Household Income by Mortgage Status in Scott
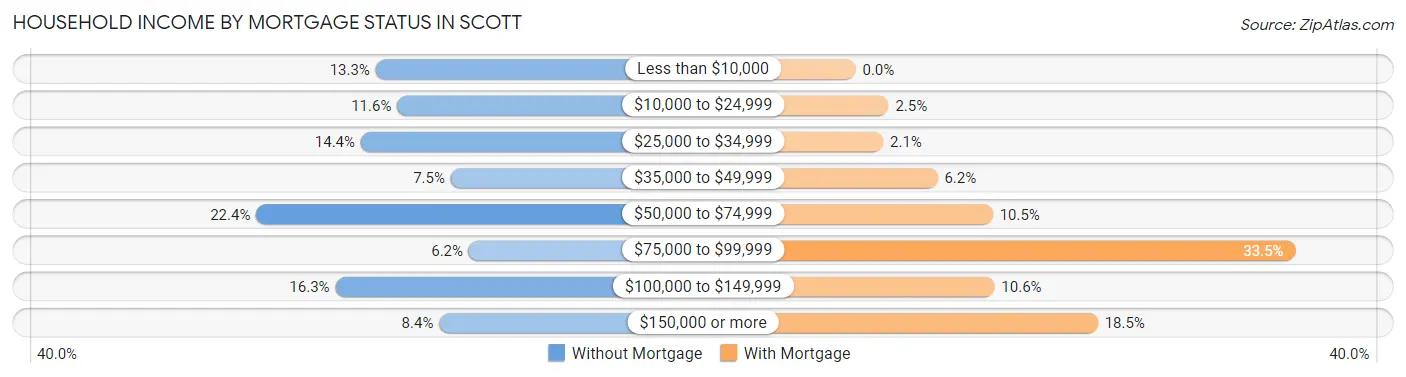
| Household Income | Without Mortgage | With Mortgage |
| Less than $10,000 | 211 (13.3%) | 0 (0.0%) |
| $10,000 to $24,999 | 185 (11.6%) | 37 (2.5%) |
| $25,000 to $34,999 | 229 (14.4%) | 31 (2.1%) |
| $35,000 to $49,999 | 120 (7.5%) | 92 (6.2%) |
| $50,000 to $74,999 | 356 (22.4%) | 154 (10.4%) |
| $75,000 to $99,999 | 98 (6.1%) | 494 (33.5%) |
| $100,000 to $149,999 | 260 (16.3%) | 156 (10.6%) |
| $150,000 or more | 134 (8.4%) | 272 (18.4%) |
| Total | 1,593 (100.0%) | 1,474 (100.0%) |
Property Value to Household Income Ratio in Scott
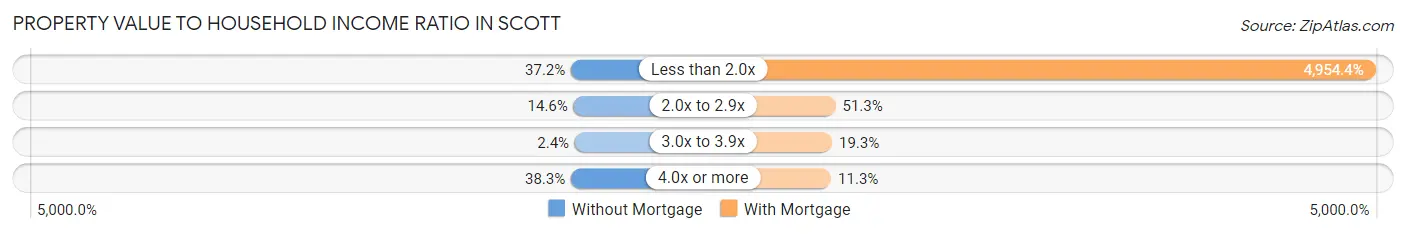
| Value-to-Income Ratio | Without Mortgage | With Mortgage |
| Less than 2.0x | 593 (37.2%) | 73,028 (4,954.4%) |
| 2.0x to 2.9x | 233 (14.6%) | 756 (51.3%) |
| 3.0x to 3.9x | 38 (2.4%) | 285 (19.3%) |
| 4.0x or more | 610 (38.3%) | 167 (11.3%) |
| Total | 1,593 (100.0%) | 1,474 (100.0%) |
Real Estate Taxes by Mortgage Status in Scott
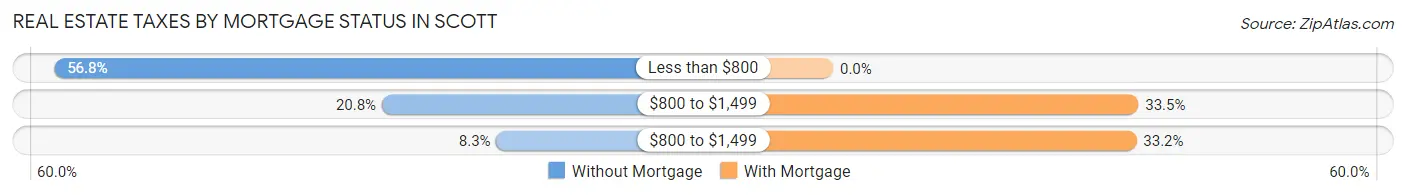
| Property Taxes | Without Mortgage | With Mortgage |
| Less than $800 | 904 (56.8%) | 0 (0.0%) |
| $800 to $1,499 | 332 (20.8%) | 493 (33.5%) |
| $800 to $1,499 | 132 (8.3%) | 490 (33.2%) |
| Total | 1,593 (100.0%) | 1,474 (100.0%) |
Health & Disability in Scott
Health Insurance Coverage by Age in Scott
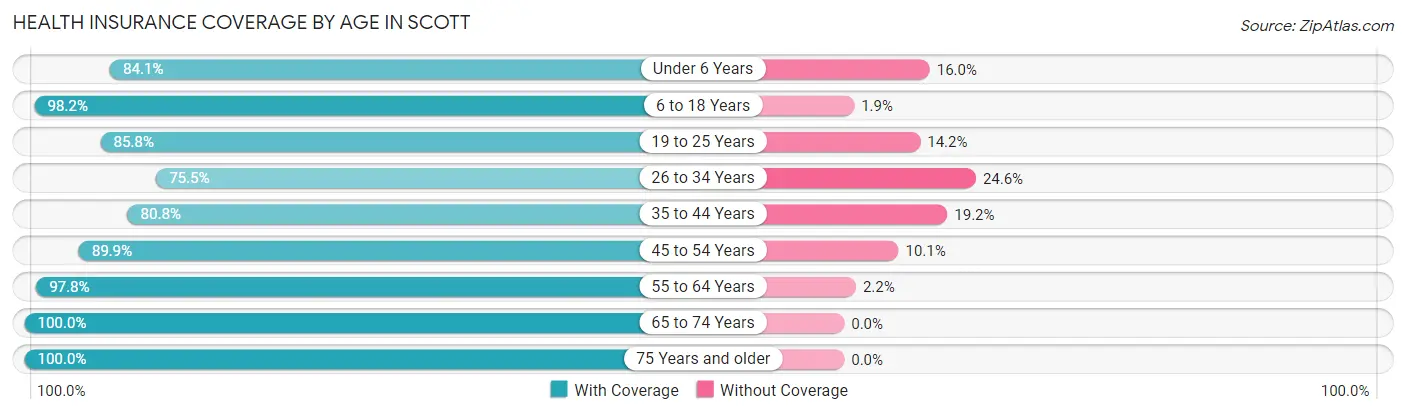
| Age Bracket | With Coverage | Without Coverage |
| Under 6 Years | 353 (84.1%) | 67 (16.0%) |
| 6 to 18 Years | 1,165 (98.2%) | 22 (1.8%) |
| 19 to 25 Years | 533 (85.8%) | 88 (14.2%) |
| 26 to 34 Years | 593 (75.4%) | 193 (24.5%) |
| 35 to 44 Years | 1,021 (80.8%) | 243 (19.2%) |
| 45 to 54 Years | 986 (89.9%) | 111 (10.1%) |
| 55 to 64 Years | 1,259 (97.8%) | 28 (2.2%) |
| 65 to 74 Years | 1,077 (100.0%) | 0 (0.0%) |
| 75 Years and older | 497 (100.0%) | 0 (0.0%) |
| Total | 7,484 (90.9%) | 752 (9.1%) |
Health Insurance Coverage by Citizenship Status in Scott
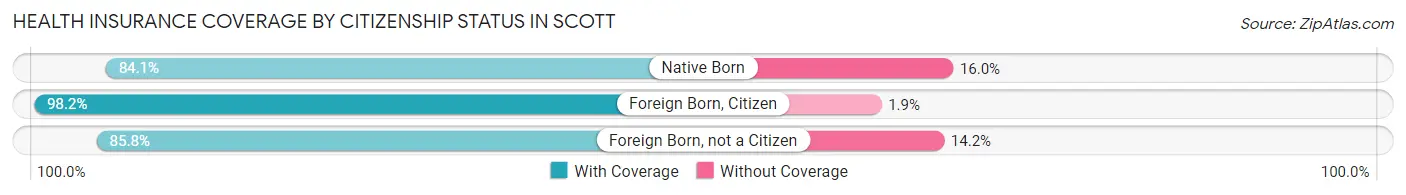
| Citizenship Status | With Coverage | Without Coverage |
| Native Born | 353 (84.1%) | 67 (16.0%) |
| Foreign Born, Citizen | 1,165 (98.2%) | 22 (1.8%) |
| Foreign Born, not a Citizen | 533 (85.8%) | 88 (14.2%) |
Health Insurance Coverage by Household Income in Scott
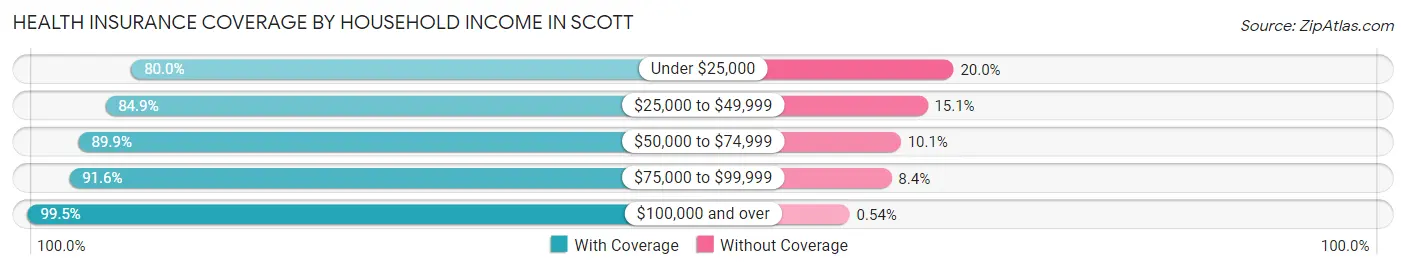
| Household Income | With Coverage | Without Coverage |
| Under $25,000 | 853 (80.0%) | 213 (20.0%) |
| $25,000 to $49,999 | 1,613 (84.9%) | 287 (15.1%) |
| $50,000 to $74,999 | 1,353 (89.9%) | 152 (10.1%) |
| $75,000 to $99,999 | 921 (91.6%) | 84 (8.4%) |
| $100,000 and over | 2,742 (99.5%) | 15 (0.5%) |
Public vs Private Health Insurance Coverage by Age in Scott
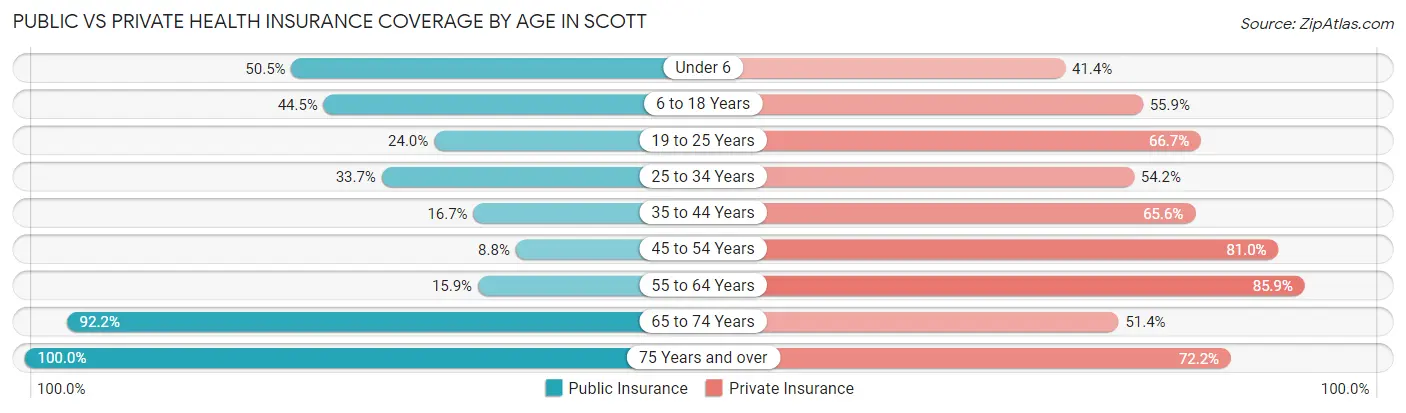
| Age Bracket | Public Insurance | Private Insurance |
| Under 6 | 212 (50.5%) | 174 (41.4%) |
| 6 to 18 Years | 528 (44.5%) | 663 (55.9%) |
| 19 to 25 Years | 149 (24.0%) | 414 (66.7%) |
| 25 to 34 Years | 265 (33.7%) | 426 (54.2%) |
| 35 to 44 Years | 211 (16.7%) | 829 (65.6%) |
| 45 to 54 Years | 97 (8.8%) | 889 (81.0%) |
| 55 to 64 Years | 204 (15.9%) | 1,106 (85.9%) |
| 65 to 74 Years | 993 (92.2%) | 553 (51.3%) |
| 75 Years and over | 497 (100.0%) | 359 (72.2%) |
| Total | 3,156 (38.3%) | 5,413 (65.7%) |
Disability Status by Sex by Age in Scott
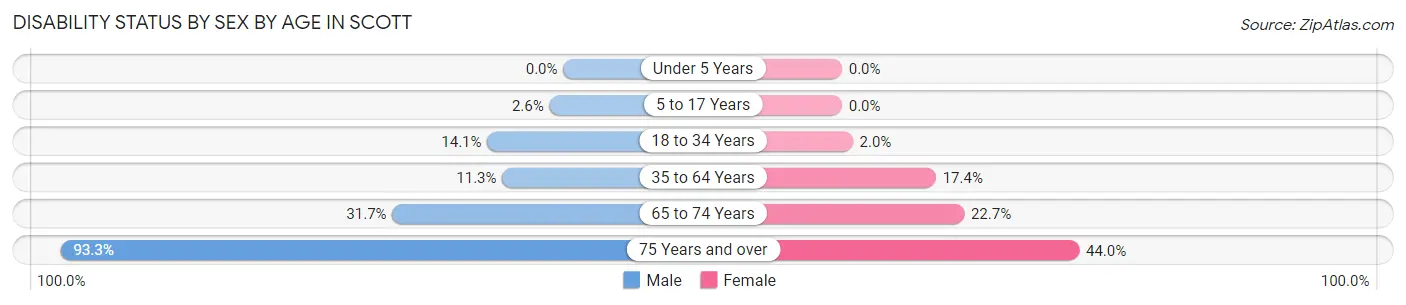
| Age Bracket | Male | Female |
| Under 5 Years | 0 (0.0%) | 0 (0.0%) |
| 5 to 17 Years | 16 (2.6%) | 0 (0.0%) |
| 18 to 34 Years | 98 (14.1%) | 15 (2.0%) |
| 35 to 64 Years | 224 (11.3%) | 291 (17.4%) |
| 65 to 74 Years | 171 (31.7%) | 122 (22.7%) |
| 75 Years and over | 112 (93.3%) | 166 (44.0%) |
Disability Class by Sex by Age in Scott
Disability Class: Hearing Difficulty
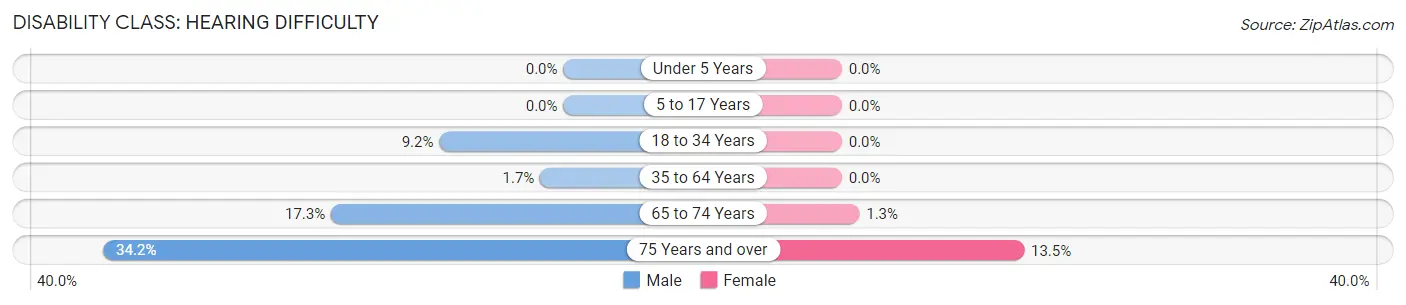
| Age Bracket | Male | Female |
| Under 5 Years | 0 (0.0%) | 0 (0.0%) |
| 5 to 17 Years | 0 (0.0%) | 0 (0.0%) |
| 18 to 34 Years | 64 (9.2%) | 0 (0.0%) |
| 35 to 64 Years | 34 (1.7%) | 0 (0.0%) |
| 65 to 74 Years | 93 (17.2%) | 7 (1.3%) |
| 75 Years and over | 41 (34.2%) | 51 (13.5%) |
Disability Class: Vision Difficulty
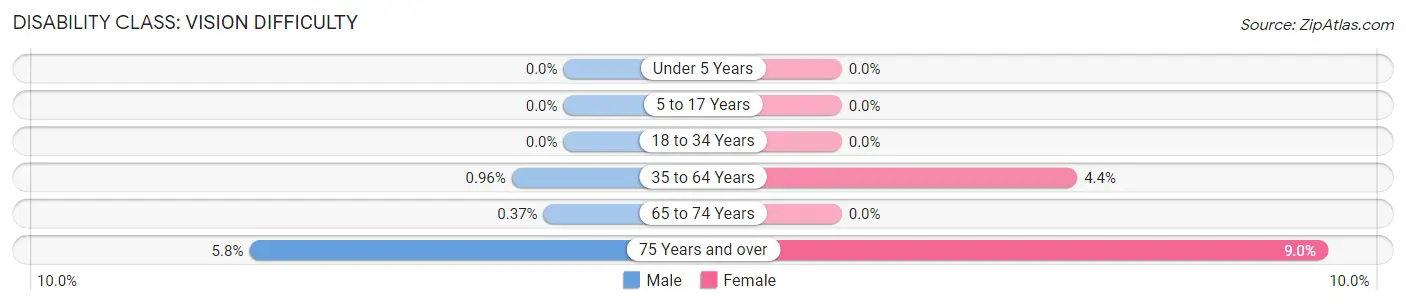
| Age Bracket | Male | Female |
| Under 5 Years | 0 (0.0%) | 0 (0.0%) |
| 5 to 17 Years | 0 (0.0%) | 0 (0.0%) |
| 18 to 34 Years | 0 (0.0%) | 0 (0.0%) |
| 35 to 64 Years | 19 (1.0%) | 73 (4.4%) |
| 65 to 74 Years | 2 (0.4%) | 0 (0.0%) |
| 75 Years and over | 7 (5.8%) | 34 (9.0%) |
Disability Class: Cognitive Difficulty
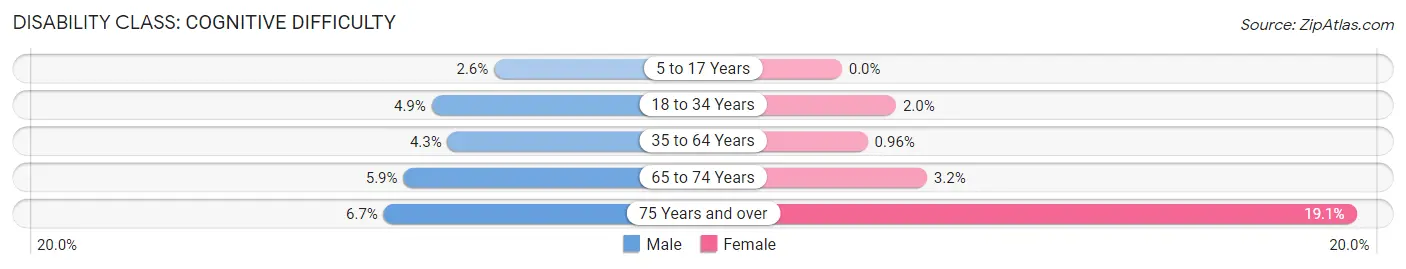
| Age Bracket | Male | Female |
| 5 to 17 Years | 16 (2.6%) | 0 (0.0%) |
| 18 to 34 Years | 34 (4.9%) | 15 (2.0%) |
| 35 to 64 Years | 85 (4.3%) | 16 (1.0%) |
| 65 to 74 Years | 32 (5.9%) | 17 (3.2%) |
| 75 Years and over | 8 (6.7%) | 72 (19.1%) |
Disability Class: Ambulatory Difficulty
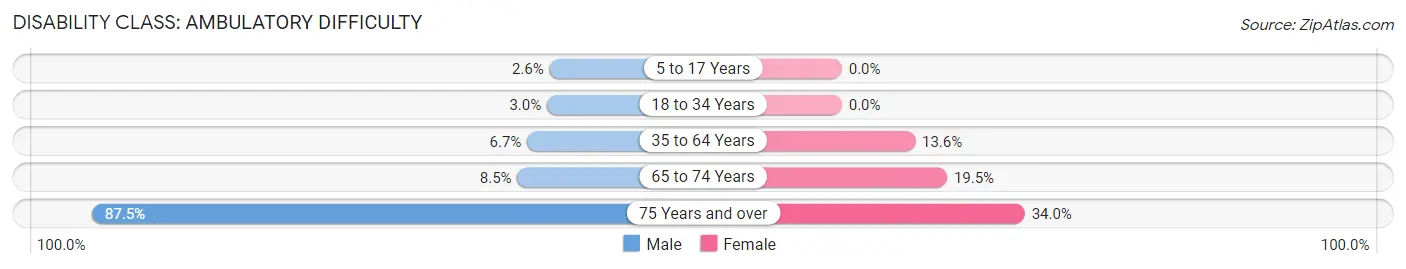
| Age Bracket | Male | Female |
| 5 to 17 Years | 16 (2.6%) | 0 (0.0%) |
| 18 to 34 Years | 21 (3.0%) | 0 (0.0%) |
| 35 to 64 Years | 133 (6.7%) | 227 (13.6%) |
| 65 to 74 Years | 46 (8.5%) | 105 (19.5%) |
| 75 Years and over | 105 (87.5%) | 128 (34.0%) |
Disability Class: Self-Care Difficulty
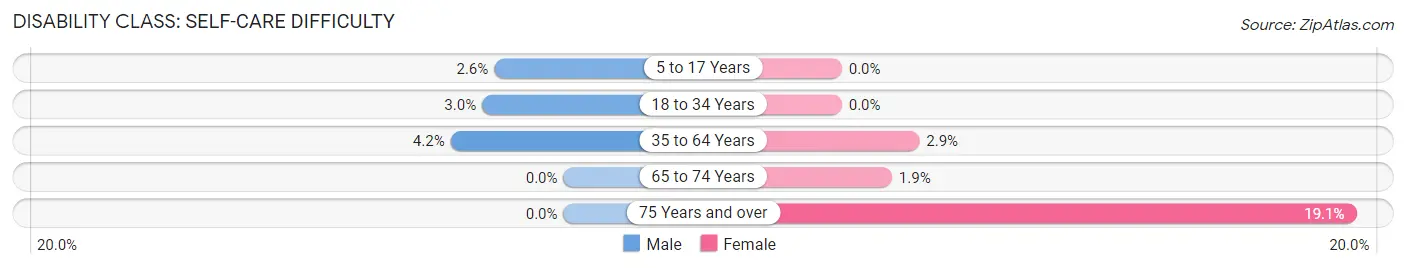
| Age Bracket | Male | Female |
| 5 to 17 Years | 16 (2.6%) | 0 (0.0%) |
| 18 to 34 Years | 21 (3.0%) | 0 (0.0%) |
| 35 to 64 Years | 83 (4.2%) | 48 (2.9%) |
| 65 to 74 Years | 0 (0.0%) | 10 (1.9%) |
| 75 Years and over | 0 (0.0%) | 72 (19.1%) |
Technology Access in Scott
Computing Device Access in Scott
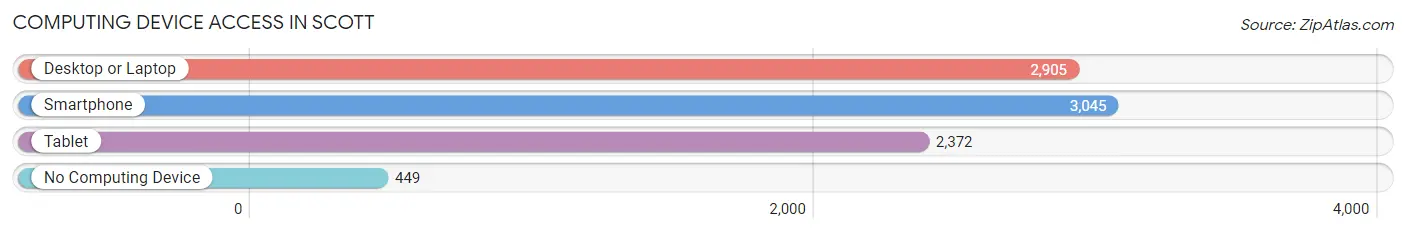
| Device Type | # Households | % Households |
| Desktop or Laptop | 2,905 | 71.8% |
| Smartphone | 3,045 | 75.2% |
| Tablet | 2,372 | 58.6% |
| No Computing Device | 449 | 11.1% |
| Total | 4,049 | 100.0% |
Internet Access in Scott
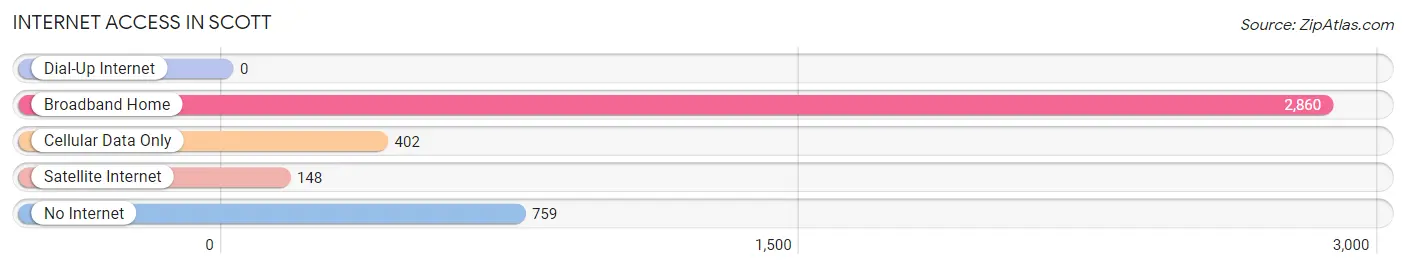
| Internet Type | # Households | % Households |
| Dial-Up Internet | 0 | 0.0% |
| Broadband Home | 2,860 | 70.6% |
| Cellular Data Only | 402 | 9.9% |
| Satellite Internet | 148 | 3.7% |
| No Internet | 759 | 18.8% |
| Total | 4,049 | 100.0% |
Scott Summary
LA History
Los Angeles, California, is a city with a rich and diverse history. It was founded in 1781 by Spanish settlers, who named it El Pueblo de Nuestra Señora la Reina de los Angeles de Porciuncula. The city was originally a small agricultural settlement, but it quickly grew into a bustling metropolis. In the late 19th century, Los Angeles was transformed by the arrival of the railroad, which connected it to the rest of the country. This allowed for the growth of the city’s economy, as well as its population.
In the early 20th century, Los Angeles was a major center of the film industry. The city was home to many of the most famous movie studios, including Paramount Pictures, Warner Brothers, and Universal Studios. This period of growth was also marked by the development of the city’s infrastructure, including the construction of the Los Angeles Aqueduct, which brought water from the Owens Valley to the city.
In the mid-20th century, Los Angeles experienced a period of rapid growth and development. This was due in part to the influx of people from other parts of the country, as well as the growth of the city’s economy. This period of growth was also marked by the development of the city’s infrastructure, including the construction of the Los Angeles International Airport.
In the late 20th century, Los Angeles experienced a period of decline. This was due in part to the decline of the city’s manufacturing industry, as well as the rise of crime and gang violence. However, the city has since experienced a period of revitalization, with the development of new industries, such as technology and entertainment.
LA Geography
Los Angeles is located in the southern part of California, on the Pacific Coast. The city is bordered by the San Gabriel Mountains to the north, the Santa Monica Mountains to the west, and the San Fernando Valley to the east. The city is divided into four main regions: Downtown, Hollywood, the San Fernando Valley, and the South Bay.
The city is home to a variety of landscapes, from the beaches of Santa Monica and Malibu to the mountains of the San Gabriel Valley. The city is also home to a variety of parks, including Griffith Park, Elysian Park, and the Los Angeles Zoo.
LA Economy
Los Angeles is one of the largest and most important cities in the United States. It is a major center of business, finance, and culture. The city’s economy is driven by a variety of industries, including entertainment, technology, tourism, and manufacturing.
The entertainment industry is one of the city’s largest employers. Los Angeles is home to many of the world’s most famous movie studios, including Paramount Pictures, Warner Brothers, and Universal Studios. The city is also home to a variety of television and music production companies.
The technology industry is also a major part of the city’s economy. Los Angeles is home to many of the world’s leading technology companies, including Google, Apple, and Microsoft. The city is also home to a variety of start-ups and venture capital firms.
The tourism industry is also a major part of the city’s economy. Los Angeles is home to many of the world’s most famous attractions, including the Hollywood Walk of Fame, the Griffith Observatory, and the Santa Monica Pier. The city is also home to a variety of museums, galleries, and other cultural attractions.
LA Demographics
Los Angeles is one of the most diverse cities in the United States. According to the 2010 census, the city’s population was 3,792,621. The city is home to people from a variety of racial and ethnic backgrounds, including African Americans, Latinos, Asians, and Native Americans.
The city is also home to a variety of religious groups, including Christians, Jews, Muslims, Buddhists, and Hindus. The city is also home to a variety of languages, including English, Spanish, Chinese, Korean, and Tagalog.
Los Angeles is also home to a variety of economic classes. The city is home to both wealthy and poor neighborhoods, as well as a variety of middle-class neighborhoods. The city is also home to a variety of educational institutions, including the University of California, Los Angeles, and the California Institute of Technology.
Common Questions
What is Per Capita Income in Scott?
Per Capita income in Scott is $38,919.
What is the Median Family Income in Scott?
Median Family Income in Scott is $76,382.
What is the Median Household income in Scott?
Median Household Income in Scott is $55,057.
What is Income or Wage Gap in Scott?
Income or Wage Gap in Scott is 42.8%.
Women in Scott earn 57.2 cents for every dollar earned by a man.
What is Family Income Deficit in Scott?
Family Income Deficit in Scott is $5,555.
Families that are below poverty line in Scott earn $5,555 less on average than the poverty threshold level.
What is Inequality or Gini Index in Scott?
Inequality or Gini Index in Scott is 0.47.
What is the Total Population of Scott?
Total Population of Scott is 8,271.
What is the Total Male Population of Scott?
Total Male Population of Scott is 4,150.
What is the Total Female Population of Scott?
Total Female Population of Scott is 4,121.
What is the Ratio of Males per 100 Females in Scott?
There are 100.70 Males per 100 Females in Scott.
What is the Ratio of Females per 100 Males in Scott?
There are 99.30 Females per 100 Males in Scott.
What is the Median Population Age in Scott?
Median Population Age in Scott is 44.1 Years.
What is the Average Family Size in Scott
Average Family Size in Scott is 3.0 People.
What is the Average Household Size in Scott
Average Household Size in Scott is 2.0 People.
How Large is the Labor Force in Scott?
There are 4,499 People in the Labor Forcein in Scott.
What is the Percentage of People in the Labor Force in Scott?
64.0% of People are in the Labor Force in Scott.
What is the Unemployment Rate in Scott?
Unemployment Rate in Scott is 5.4%.