Merrydale, LA Map & Demographics
Merrydale Map
Merrydale Overview
$23,781
PER CAPITA INCOME
$48,111
AVG FAMILY INCOME
$42,873
AVG HOUSEHOLD INCOME
11.4%
WAGE / INCOME GAP [ % ]
88.6¢/ $1
WAGE / INCOME GAP [ $ ]
0.52
INEQUALITY / GINI INDEX
8,557
TOTAL POPULATION
3,754
MALE POPULATION
4,803
FEMALE POPULATION
78.16
MALES / 100 FEMALES
127.94
FEMALES / 100 MALES
39.1
MEDIAN AGE
3.3
AVG FAMILY SIZE
2.9
AVG HOUSEHOLD SIZE
3,675
LABOR FORCE [ PEOPLE ]
57.3%
PERCENT IN LABOR FORCE
16.6%
UNEMPLOYMENT RATE
Income in Merrydale
Income Overview in Merrydale
Per Capita Income in Merrydale is $23,781, while median incomes of families and households are $48,111 and $42,873 respectively.
| Characteristic | Number | Measure |
| Per Capita Income | 8,557 | $23,781 |
| Median Family Income | 2,288 | $48,111 |
| Mean Family Income | 2,288 | $74,318 |
| Median Household Income | 2,947 | $42,873 |
| Mean Household Income | 2,947 | $66,574 |
| Income Deficit | 2,288 | $0 |
| Wage / Income Gap (%) | 8,557 | 11.43% |
| Wage / Income Gap ($) | 8,557 | 88.57¢ per $1 |
| Gini / Inequality Index | 8,557 | 0.52 |
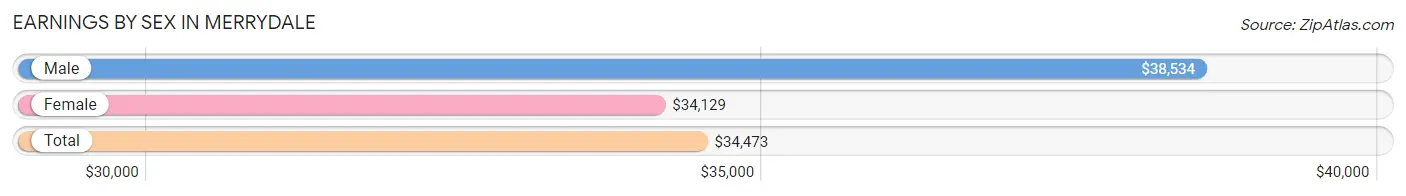
Earnings by Sex in Merrydale
Average Earnings in Merrydale are $34,473, $38,534 for men and $34,129 for women, a difference of 11.4%.
| Sex | Number | Average Earnings |
| Male | 1,422 (42.5%) | $38,534 |
| Female | 1,924 (57.5%) | $34,129 |
| Total | 3,346 (100.0%) | $34,473 |
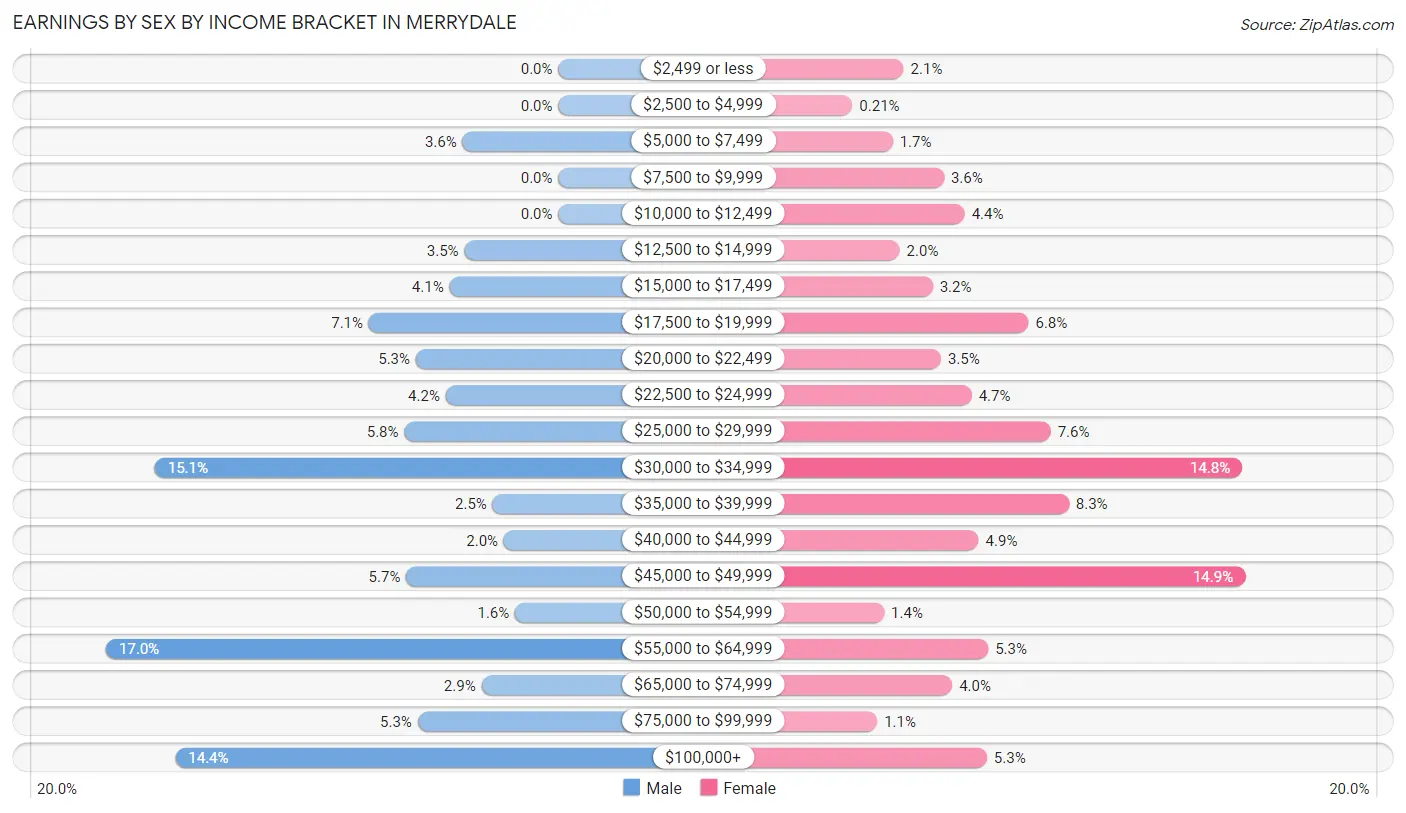
Earnings by Sex by Income Bracket in Merrydale
The most common earnings brackets in Merrydale are $55,000 to $64,999 for men (241 | 17.0%) and $45,000 to $49,999 for women (287 | 14.9%).
| Income | Male | Female |
| $2,499 or less | 0 (0.0%) | 41 (2.1%) |
| $2,500 to $4,999 | 0 (0.0%) | 4 (0.2%) |
| $5,000 to $7,499 | 51 (3.6%) | 33 (1.7%) |
| $7,500 to $9,999 | 0 (0.0%) | 70 (3.6%) |
| $10,000 to $12,499 | 0 (0.0%) | 85 (4.4%) |
| $12,500 to $14,999 | 50 (3.5%) | 38 (2.0%) |
| $15,000 to $17,499 | 58 (4.1%) | 62 (3.2%) |
| $17,500 to $19,999 | 101 (7.1%) | 131 (6.8%) |
| $20,000 to $22,499 | 76 (5.3%) | 68 (3.5%) |
| $22,500 to $24,999 | 60 (4.2%) | 90 (4.7%) |
| $25,000 to $29,999 | 82 (5.8%) | 147 (7.6%) |
| $30,000 to $34,999 | 215 (15.1%) | 285 (14.8%) |
| $35,000 to $39,999 | 35 (2.5%) | 160 (8.3%) |
| $40,000 to $44,999 | 29 (2.0%) | 95 (4.9%) |
| $45,000 to $49,999 | 81 (5.7%) | 287 (14.9%) |
| $50,000 to $54,999 | 23 (1.6%) | 27 (1.4%) |
| $55,000 to $64,999 | 241 (17.0%) | 102 (5.3%) |
| $65,000 to $74,999 | 41 (2.9%) | 76 (4.0%) |
| $75,000 to $99,999 | 75 (5.3%) | 22 (1.1%) |
| $100,000+ | 204 (14.3%) | 101 (5.2%) |
| Total | 1,422 (100.0%) | 1,924 (100.0%) |
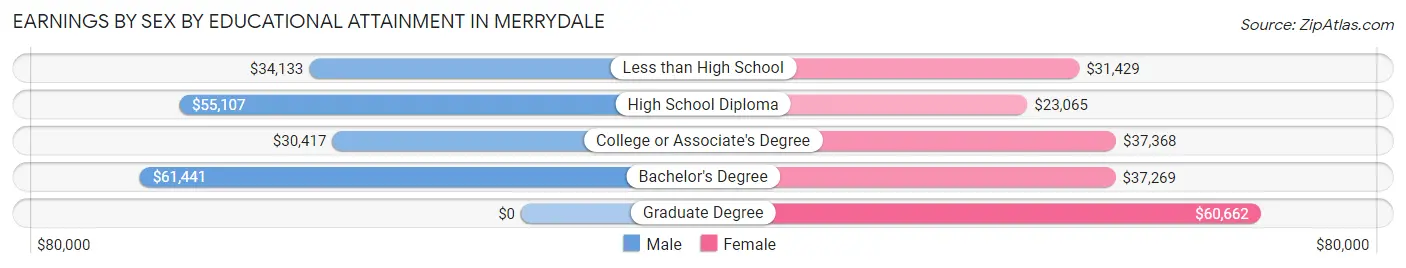
Earnings by Sex by Educational Attainment in Merrydale
Average earnings in Merrydale are $41,897 for men and $34,138 for women, a difference of 18.5%. Men with an educational attainment of bachelor's degree enjoy the highest average annual earnings of $61,441, while those with college or associate's degree education earn the least with $30,417. Women with an educational attainment of graduate degree earn the most with the average annual earnings of $60,662, while those with high school diploma education have the smallest earnings of $23,065.
| Educational Attainment | Male Income | Female Income |
| Less than High School | $34,133 | $31,429 |
| High School Diploma | $55,107 | $23,065 |
| College or Associate's Degree | $30,417 | $37,368 |
| Bachelor's Degree | $61,441 | $37,269 |
| Graduate Degree | - | - |
| Total | $41,897 | $34,138 |
Family Income in Merrydale
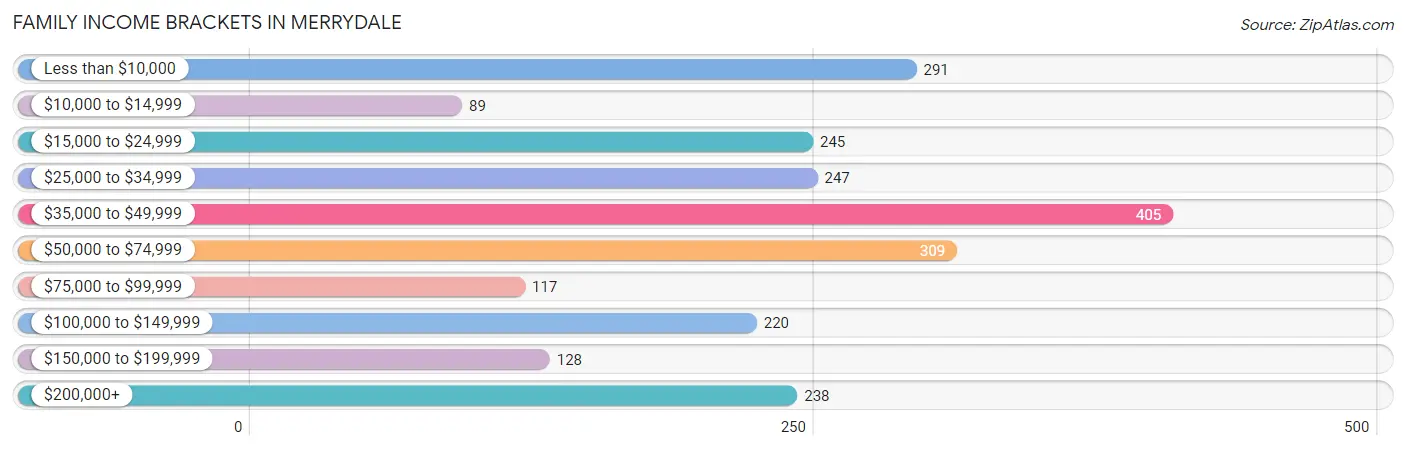
Family Income Brackets in Merrydale
According to the Merrydale family income data, there are 405 families falling into the $35,000 to $49,999 income range, which is the most common income bracket and makes up 17.7% of all families. Conversely, the $10,000 to $14,999 income bracket is the least frequent group with only 89 families (3.9%) belonging to this category.
| Income Bracket | # Families | % Families |
| Less than $10,000 | 291 | 12.7% |
| $10,000 to $14,999 | 89 | 3.9% |
| $15,000 to $24,999 | 245 | 10.7% |
| $25,000 to $34,999 | 247 | 10.8% |
| $35,000 to $49,999 | 405 | 17.7% |
| $50,000 to $74,999 | 309 | 13.5% |
| $75,000 to $99,999 | 117 | 5.1% |
| $100,000 to $149,999 | 220 | 9.6% |
| $150,000 to $199,999 | 128 | 5.6% |
| $200,000+ | 238 | 10.4% |
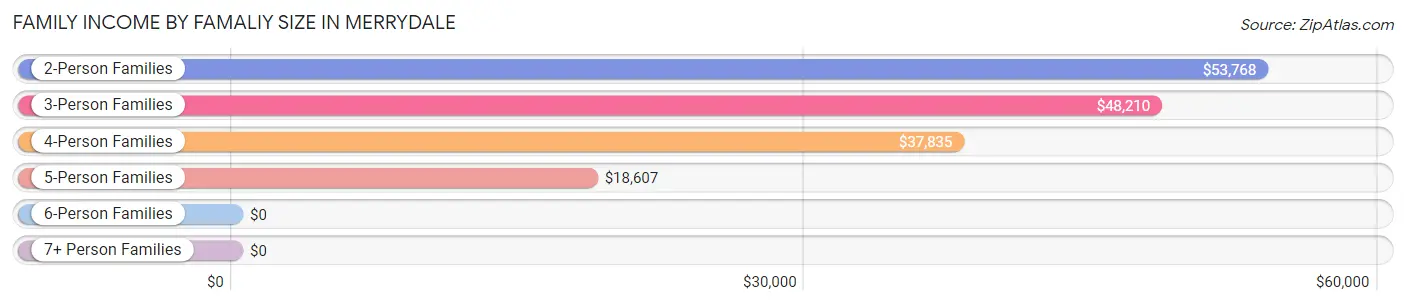
Family Income by Famaliy Size in Merrydale
2-person families (900 | 39.3%) account for the highest median family income in Merrydale with $53,768 per family, while 2-person families (900 | 39.3%) have the highest median income of $26,884 per family member.
| Income Bracket | # Families | Median Income |
| 2-Person Families | 900 (39.3%) | $53,768 |
| 3-Person Families | 1,058 (46.2%) | $48,210 |
| 4-Person Families | 189 (8.3%) | $37,835 |
| 5-Person Families | 72 (3.2%) | $18,607 |
| 6-Person Families | 60 (2.6%) | $0 |
| 7+ Person Families | 9 (0.4%) | $0 |
| Total | 2,288 (100.0%) | $48,111 |
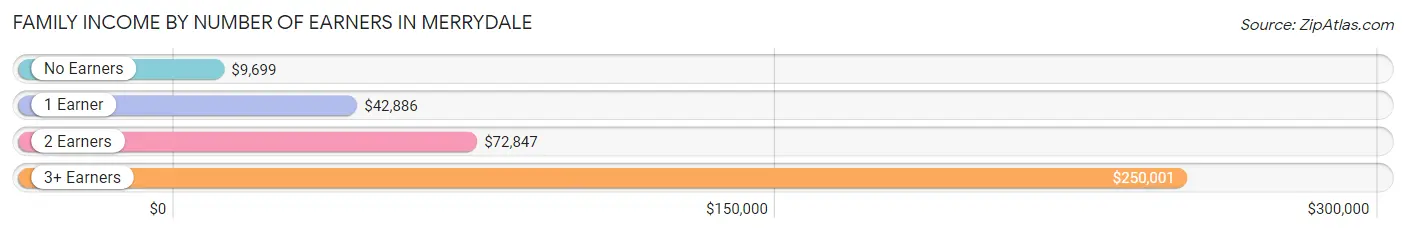
Family Income by Number of Earners in Merrydale
The median family income in Merrydale is $48,111, with families comprising 3+ earners (112) having the highest median family income of $250,001, while families with no earners (389) have the lowest median family income of $9,699, accounting for 4.9% and 17.0% of families, respectively.
| Number of Earners | # Families | Median Income |
| No Earners | 389 (17.0%) | $9,699 |
| 1 Earner | 1,273 (55.6%) | $42,886 |
| 2 Earners | 514 (22.5%) | $72,847 |
| 3+ Earners | 112 (4.9%) | $250,001 |
| Total | 2,288 (100.0%) | $48,111 |
Household Income in Merrydale
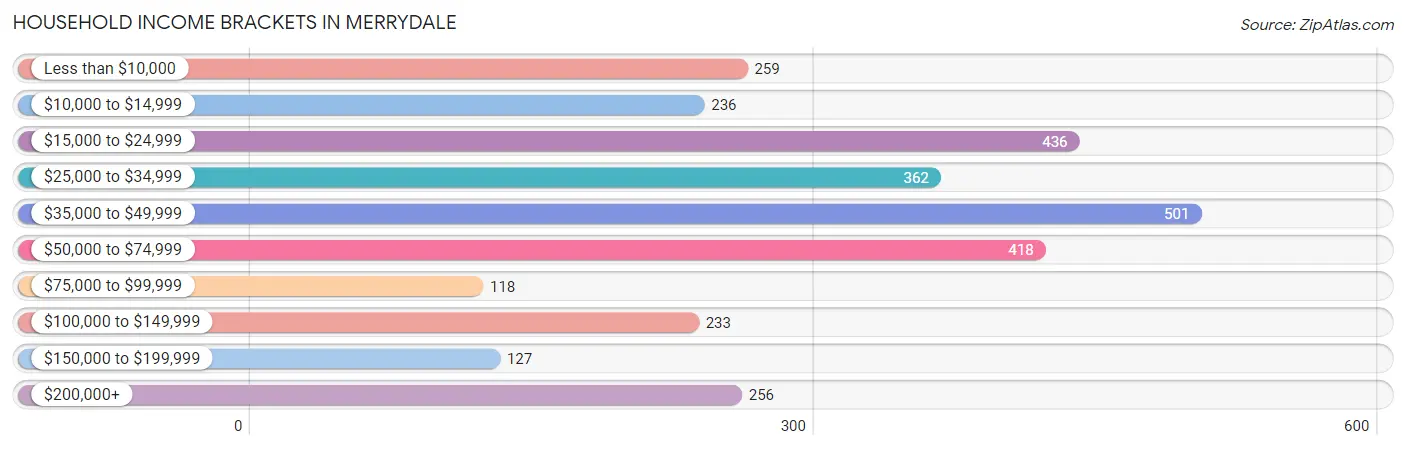
Household Income Brackets in Merrydale
With 501 households falling in the category, the $35,000 to $49,999 income range is the most frequent in Merrydale, accounting for 17.0% of all households. In contrast, only 118 households (4.0%) fall into the $75,000 to $99,999 income bracket, making it the least populous group.
| Income Bracket | # Households | % Households |
| Less than $10,000 | 259 | 8.8% |
| $10,000 to $14,999 | 236 | 8.0% |
| $15,000 to $24,999 | 436 | 14.8% |
| $25,000 to $34,999 | 362 | 12.3% |
| $35,000 to $49,999 | 501 | 17.0% |
| $50,000 to $74,999 | 418 | 14.2% |
| $75,000 to $99,999 | 118 | 4.0% |
| $100,000 to $149,999 | 233 | 7.9% |
| $150,000 to $199,999 | 127 | 4.3% |
| $200,000+ | 256 | 8.7% |
Household Income by Householder Age in Merrydale
The median household income in Merrydale is $42,873, with the highest median household income of $49,569 found in the 45 to 64 years age bracket for the primary householder. A total of 958 households (32.5%) fall into this category. Meanwhile, the 15 to 24 years age bracket for the primary householder has the lowest median household income of $0, with 16 households (0.5%) in this group.
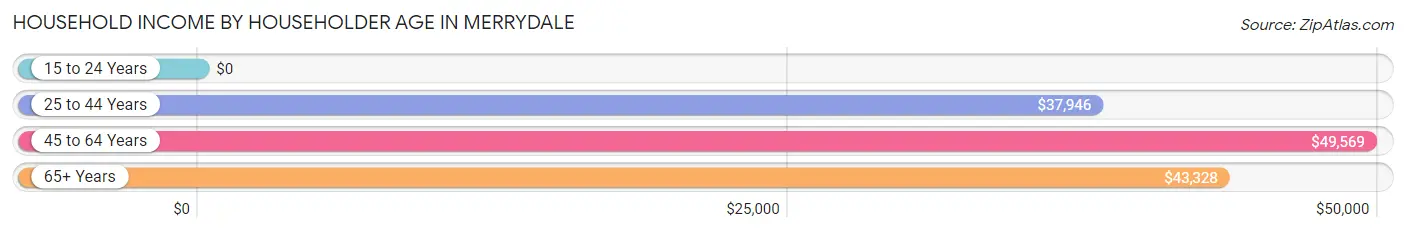
| Income Bracket | # Households | Median Income |
| 15 to 24 Years | 16 (0.5%) | $0 |
| 25 to 44 Years | 1,032 (35.0%) | $37,946 |
| 45 to 64 Years | 958 (32.5%) | $49,569 |
| 65+ Years | 941 (31.9%) | $43,328 |
| Total | 2,947 (100.0%) | $42,873 |
Poverty in Merrydale
Income Below Poverty by Sex and Age in Merrydale
With 23.5% poverty level for males and 35.6% for females among the residents of Merrydale, 16 and 17 year old males and 15 year old females are the most vulnerable to poverty, with 46 males (61.3%) and 10 females (100.0%) in their respective age groups living below the poverty level.
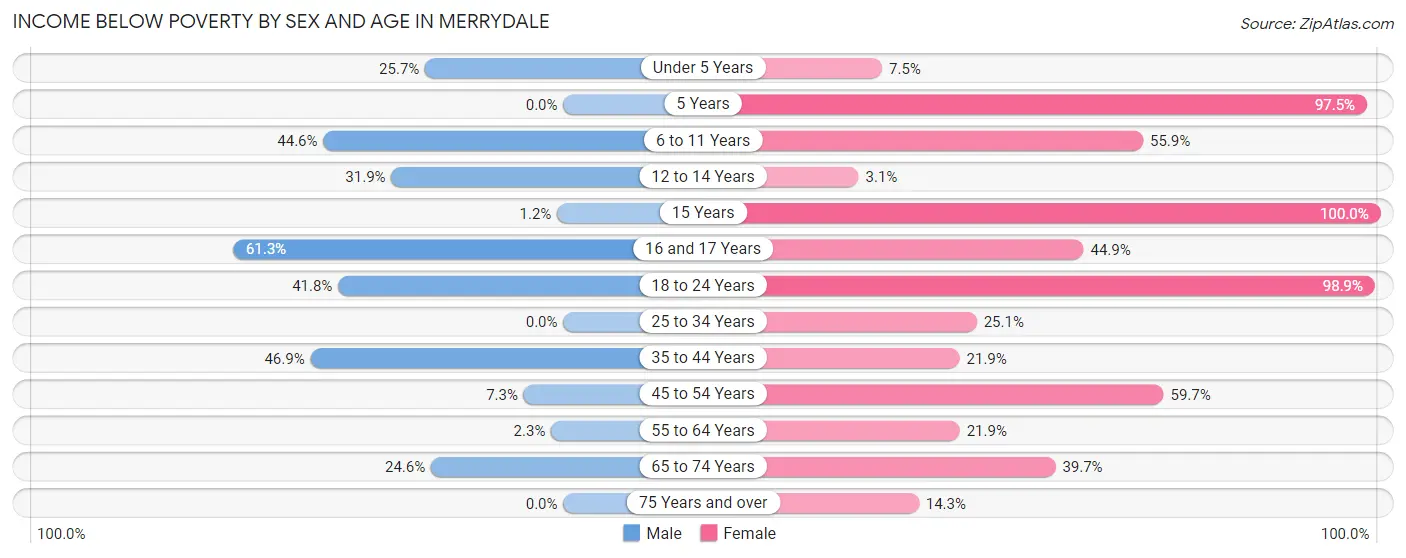
| Age Bracket | Male | Female |
| Under 5 Years | 69 (25.7%) | 27 (7.5%) |
| 5 Years | 0 (0.0%) | 77 (97.5%) |
| 6 to 11 Years | 45 (44.6%) | 336 (55.9%) |
| 12 to 14 Years | 112 (31.9%) | 2 (3.1%) |
| 15 Years | 1 (1.1%) | 10 (100.0%) |
| 16 and 17 Years | 46 (61.3%) | 105 (44.9%) |
| 18 to 24 Years | 145 (41.8%) | 187 (98.9%) |
| 25 to 34 Years | 0 (0.0%) | 131 (25.1%) |
| 35 to 44 Years | 337 (46.9%) | 173 (21.9%) |
| 45 to 54 Years | 21 (7.3%) | 221 (59.7%) |
| 55 to 64 Years | 10 (2.2%) | 192 (21.9%) |
| 65 to 74 Years | 98 (24.6%) | 232 (39.7%) |
| 75 Years and over | 0 (0.0%) | 17 (14.3%) |
| Total | 884 (23.5%) | 1,710 (35.6%) |
Income Above Poverty by Sex and Age in Merrydale
According to the poverty statistics in Merrydale, males aged 5 years and females aged 12 to 14 years are the age groups that are most secure financially, with 100.0% of males and 96.9% of females in these age groups living above the poverty line.
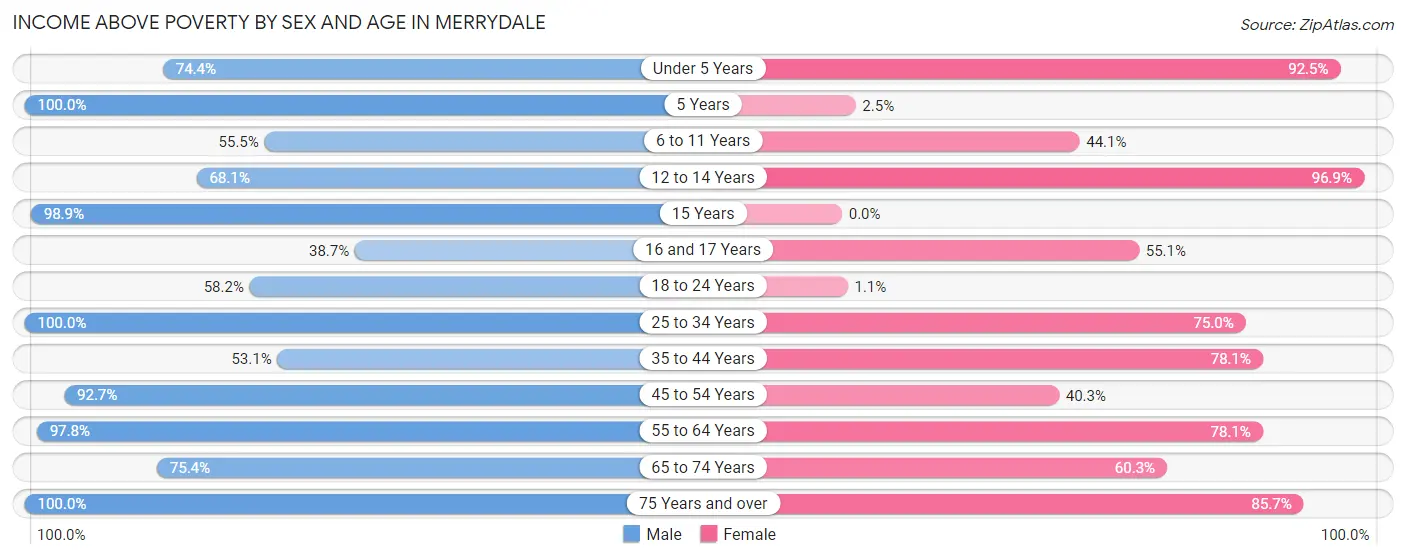
| Age Bracket | Male | Female |
| Under 5 Years | 200 (74.4%) | 334 (92.5%) |
| 5 Years | 220 (100.0%) | 2 (2.5%) |
| 6 to 11 Years | 56 (55.4%) | 265 (44.1%) |
| 12 to 14 Years | 239 (68.1%) | 62 (96.9%) |
| 15 Years | 86 (98.9%) | 0 (0.0%) |
| 16 and 17 Years | 29 (38.7%) | 129 (55.1%) |
| 18 to 24 Years | 202 (58.2%) | 2 (1.1%) |
| 25 to 34 Years | 304 (100.0%) | 392 (75.0%) |
| 35 to 44 Years | 381 (53.1%) | 618 (78.1%) |
| 45 to 54 Years | 265 (92.7%) | 149 (40.3%) |
| 55 to 64 Years | 434 (97.8%) | 685 (78.1%) |
| 65 to 74 Years | 301 (75.4%) | 353 (60.3%) |
| 75 Years and over | 153 (100.0%) | 102 (85.7%) |
| Total | 2,870 (76.4%) | 3,093 (64.4%) |
Income Below Poverty Among Married-Couple Families in Merrydale
The poverty statistics for married-couple families in Merrydale show that 2.3% or 19 of the total 812 families live below the poverty line. Families with 1 or 2 children have the highest poverty rate of 13.2%, comprising of 19 families. On the other hand, families with no children have the lowest poverty rate of 0.0%, which includes 0 families.
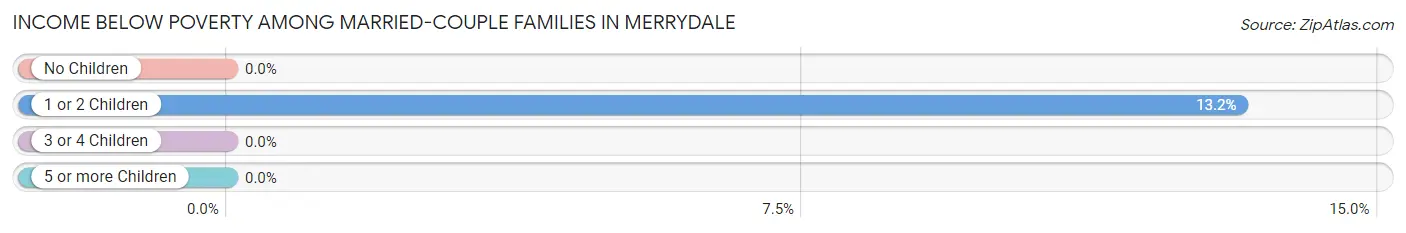
| Children | Above Poverty | Below Poverty |
| No Children | 623 (100.0%) | 0 (0.0%) |
| 1 or 2 Children | 125 (86.8%) | 19 (13.2%) |
| 3 or 4 Children | 45 (100.0%) | 0 (0.0%) |
| 5 or more Children | 0 (0.0%) | 0 (0.0%) |
| Total | 793 (97.7%) | 19 (2.3%) |
Income Below Poverty Among Single-Parent Households in Merrydale
According to the poverty data in Merrydale, 11.7% or 20 single-father households and 38.8% or 506 single-mother households are living below the poverty line. Among single-father households, those with no children have the highest poverty rate, with 20 households (24.1%) experiencing poverty. Likewise, among single-mother households, those with 3 or 4 children have the highest poverty rate, with 70 households (48.9%) falling below the poverty line.
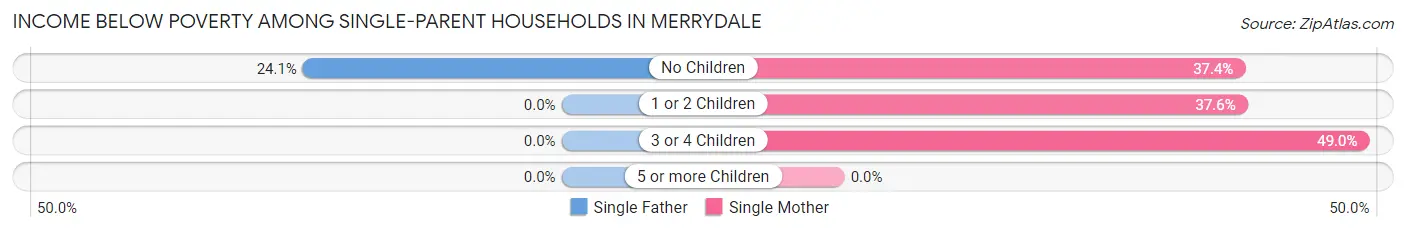
| Children | Single Father | Single Mother |
| No Children | 20 (24.1%) | 175 (37.4%) |
| 1 or 2 Children | 0 (0.0%) | 261 (37.6%) |
| 3 or 4 Children | 0 (0.0%) | 70 (48.9%) |
| 5 or more Children | 0 (0.0%) | 0 (0.0%) |
| Total | 20 (11.7%) | 506 (38.8%) |
Income Below Poverty Among Married-Couple vs Single-Parent Households in Merrydale
The poverty data for Merrydale shows that 19 of the married-couple family households (2.3%) and 526 of the single-parent households (35.6%) are living below the poverty level. Within the married-couple family households, those with 1 or 2 children have the highest poverty rate, with 19 households (13.2%) falling below the poverty line. Among the single-parent households, those with 3 or 4 children have the highest poverty rate, with 70 household (48.9%) living below poverty.
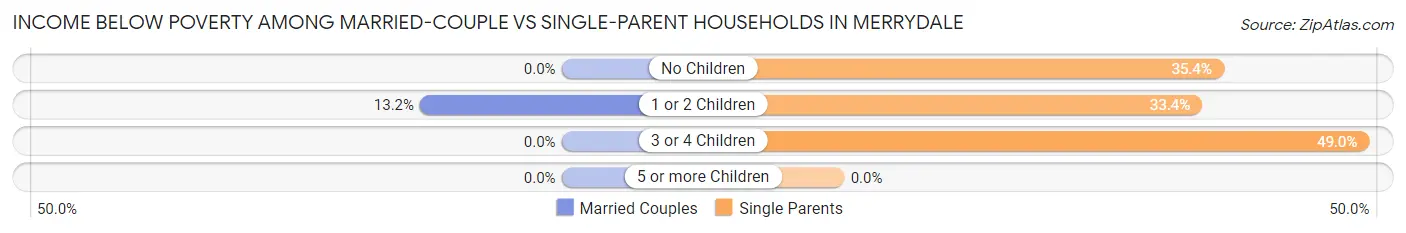
| Children | Married-Couple Families | Single-Parent Households |
| No Children | 0 (0.0%) | 195 (35.4%) |
| 1 or 2 Children | 19 (13.2%) | 261 (33.4%) |
| 3 or 4 Children | 0 (0.0%) | 70 (48.9%) |
| 5 or more Children | 0 (0.0%) | 0 (0.0%) |
| Total | 19 (2.3%) | 526 (35.6%) |
Race in Merrydale
The most populous races in Merrydale are Black / African American (8,484 | 99.2%), Hispanic or Latino (103 | 1.2%), and White / Caucasian (28 | 0.3%).
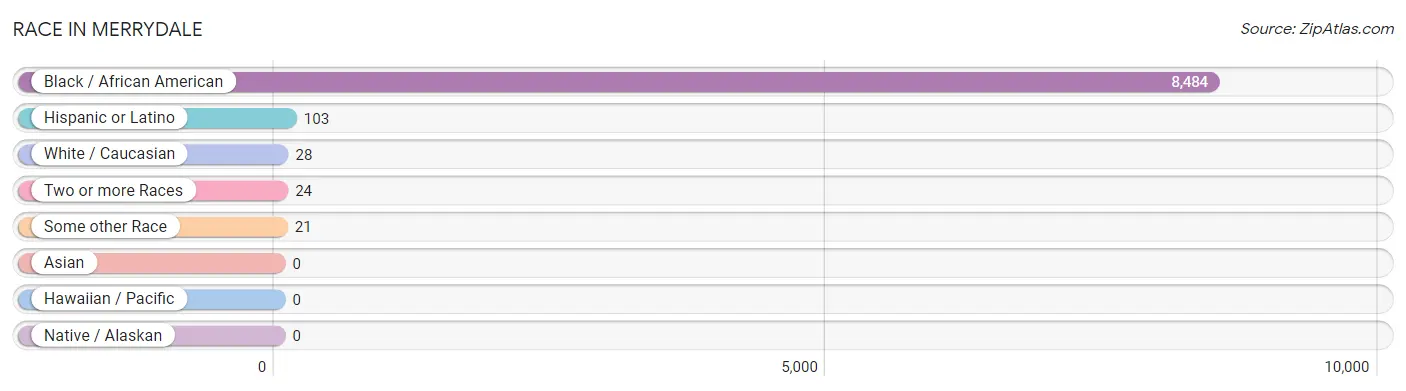
| Race | # Population | % Population |
| Asian | 0 | 0.0% |
| Black / African American | 8,484 | 99.2% |
| Hawaiian / Pacific | 0 | 0.0% |
| Hispanic or Latino | 103 | 1.2% |
| Native / Alaskan | 0 | 0.0% |
| White / Caucasian | 28 | 0.3% |
| Two or more Races | 24 | 0.3% |
| Some other Race | 21 | 0.3% |
| Total | 8,557 | 100.0% |
Ancestry in Merrydale
The most populous ancestries reported in Merrydale are American (336 | 3.9%), Mexican (88 | 1.0%), Central American (15 | 0.2%), Honduran (15 | 0.2%), and French (13 | 0.2%), together accounting for 5.5% of all Merrydale residents.
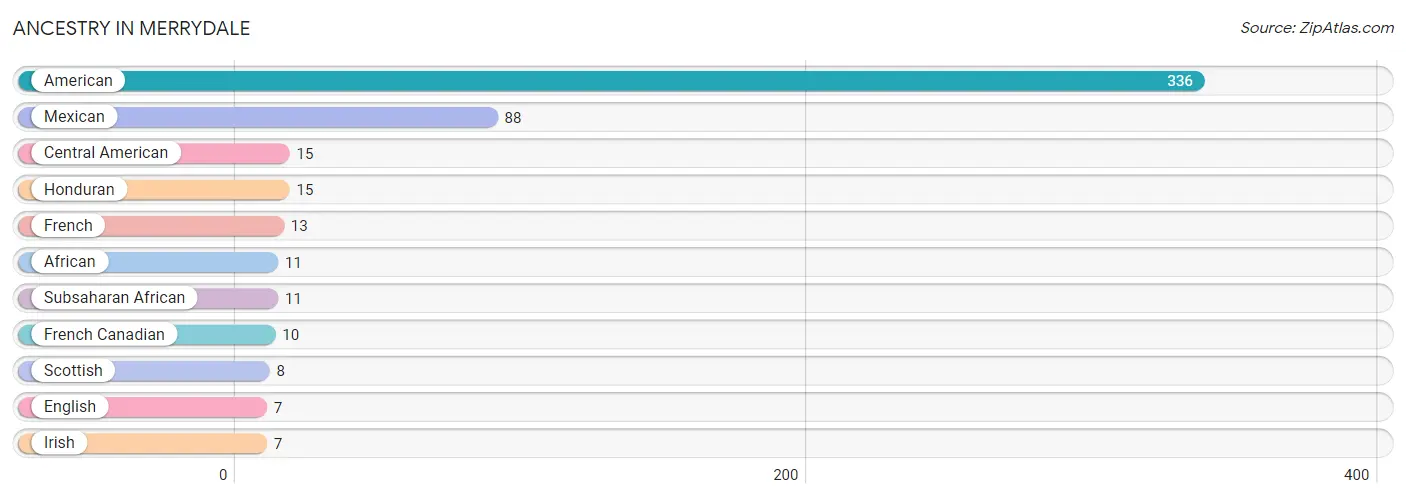
| Ancestry | # Population | % Population |
| African | 11 | 0.1% |
| American | 336 | 3.9% |
| Central American | 15 | 0.2% |
| English | 7 | 0.1% |
| French | 13 | 0.2% |
| French Canadian | 10 | 0.1% |
| Honduran | 15 | 0.2% |
| Irish | 7 | 0.1% |
| Mexican | 88 | 1.0% |
| Scottish | 8 | 0.1% |
| Subsaharan African | 11 | 0.1% | View All 11 Rows |
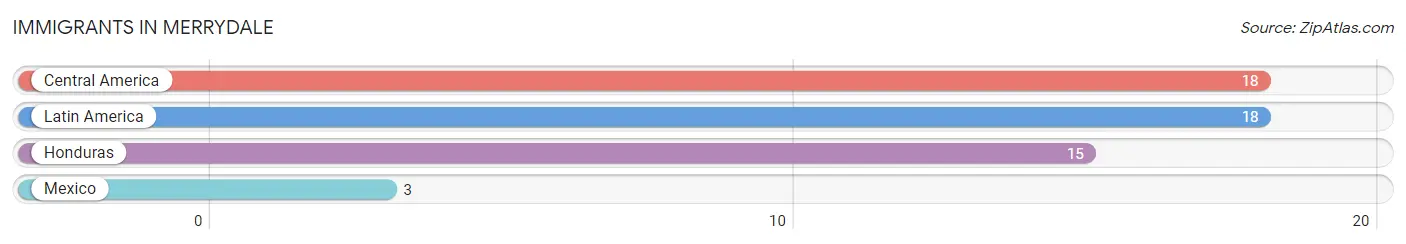
Immigrants in Merrydale
The most numerous immigrant groups reported in Merrydale came from Central America (18 | 0.2%), Latin America (18 | 0.2%), Honduras (15 | 0.2%), and Mexico (3 | 0.0%), together accounting for 0.6% of all Merrydale residents.
| Immigration Origin | # Population | % Population |
| Central America | 18 | 0.2% |
| Honduras | 15 | 0.2% |
| Latin America | 18 | 0.2% |
| Mexico | 3 | 0.0% | View All 4 Rows |
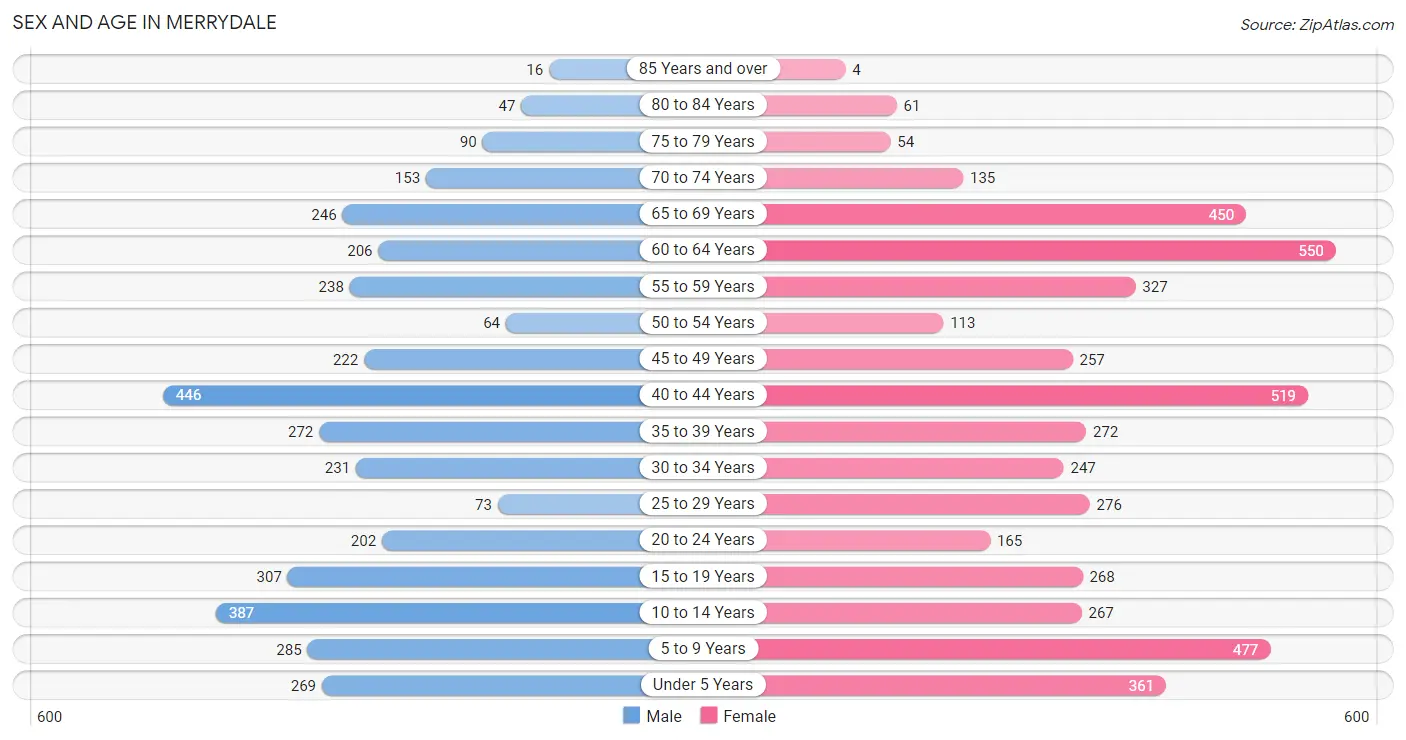
Sex and Age in Merrydale
Sex and Age in Merrydale
The most populous age groups in Merrydale are 40 to 44 Years (446 | 11.9%) for men and 60 to 64 Years (550 | 11.5%) for women.
| Age Bracket | Male | Female |
| Under 5 Years | 269 (7.2%) | 361 (7.5%) |
| 5 to 9 Years | 285 (7.6%) | 477 (9.9%) |
| 10 to 14 Years | 387 (10.3%) | 267 (5.6%) |
| 15 to 19 Years | 307 (8.2%) | 268 (5.6%) |
| 20 to 24 Years | 202 (5.4%) | 165 (3.4%) |
| 25 to 29 Years | 73 (1.9%) | 276 (5.8%) |
| 30 to 34 Years | 231 (6.1%) | 247 (5.1%) |
| 35 to 39 Years | 272 (7.2%) | 272 (5.7%) |
| 40 to 44 Years | 446 (11.9%) | 519 (10.8%) |
| 45 to 49 Years | 222 (5.9%) | 257 (5.3%) |
| 50 to 54 Years | 64 (1.7%) | 113 (2.4%) |
| 55 to 59 Years | 238 (6.3%) | 327 (6.8%) |
| 60 to 64 Years | 206 (5.5%) | 550 (11.5%) |
| 65 to 69 Years | 246 (6.6%) | 450 (9.4%) |
| 70 to 74 Years | 153 (4.1%) | 135 (2.8%) |
| 75 to 79 Years | 90 (2.4%) | 54 (1.1%) |
| 80 to 84 Years | 47 (1.3%) | 61 (1.3%) |
| 85 Years and over | 16 (0.4%) | 4 (0.1%) |
| Total | 3,754 (100.0%) | 4,803 (100.0%) |
Families and Households in Merrydale
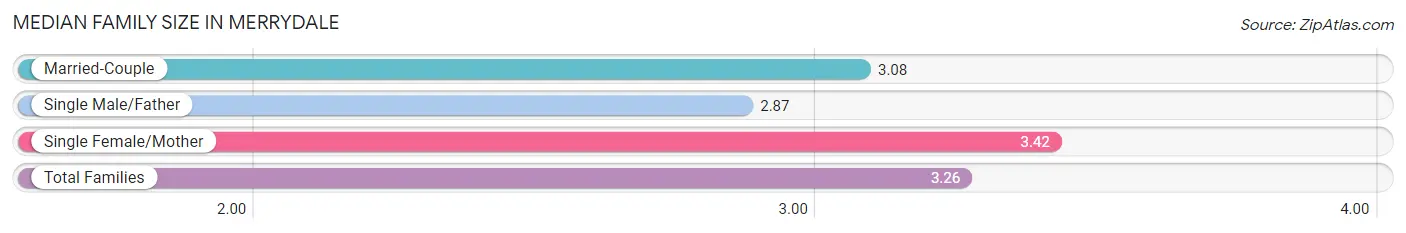
Median Family Size in Merrydale
The median family size in Merrydale is 3.26 persons per family, with single female/mother families (1,305 | 57.0%) accounting for the largest median family size of 3.42 persons per family. On the other hand, single male/father families (171 | 7.5%) represent the smallest median family size with 2.87 persons per family.
| Family Type | # Families | Family Size |
| Married-Couple | 812 (35.5%) | 3.08 |
| Single Male/Father | 171 (7.5%) | 2.87 |
| Single Female/Mother | 1,305 (57.0%) | 3.42 |
| Total Families | 2,288 (100.0%) | 3.26 |
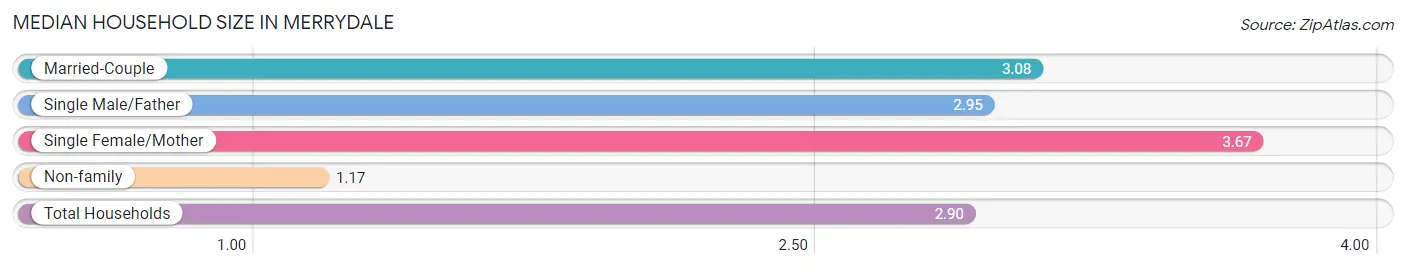
Median Household Size in Merrydale
The median household size in Merrydale is 2.90 persons per household, with single female/mother households (1,305 | 44.3%) accounting for the largest median household size of 3.67 persons per household. non-family households (659 | 22.4%) represent the smallest median household size with 1.17 persons per household.
| Household Type | # Households | Household Size |
| Married-Couple | 812 (27.6%) | 3.08 |
| Single Male/Father | 171 (5.8%) | 2.95 |
| Single Female/Mother | 1,305 (44.3%) | 3.67 |
| Non-family | 659 (22.4%) | 1.17 |
| Total Households | 2,947 (100.0%) | 2.90 |
Household Size by Marriage Status in Merrydale
Out of a total of 2,947 households in Merrydale, 2,288 (77.6%) are family households, while 659 (22.4%) are nonfamily households. The most numerous type of family households are 3-person households, comprising 948, and the most common type of nonfamily households are 1-person households, comprising 558.
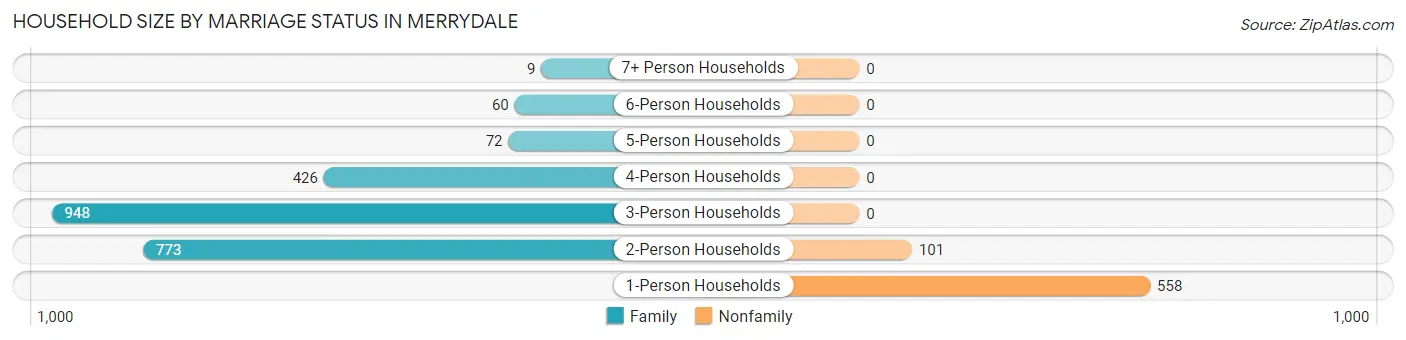
| Household Size | Family Households | Nonfamily Households |
| 1-Person Households | - | 558 (18.9%) |
| 2-Person Households | 773 (26.2%) | 101 (3.4%) |
| 3-Person Households | 948 (32.2%) | 0 (0.0%) |
| 4-Person Households | 426 (14.5%) | 0 (0.0%) |
| 5-Person Households | 72 (2.4%) | 0 (0.0%) |
| 6-Person Households | 60 (2.0%) | 0 (0.0%) |
| 7+ Person Households | 9 (0.3%) | 0 (0.0%) |
| Total | 2,288 (77.6%) | 659 (22.4%) |
Female Fertility in Merrydale
Fertility by Age in Merrydale
Average fertility rate in Merrydale is 23.0 births per 1,000 women. Women in the age bracket of 15 to 19 years have the highest fertility rate with 82.0 births per 1,000 women. Women in the age bracket of 20 to 34 years acount for 53.2% of all women with births.
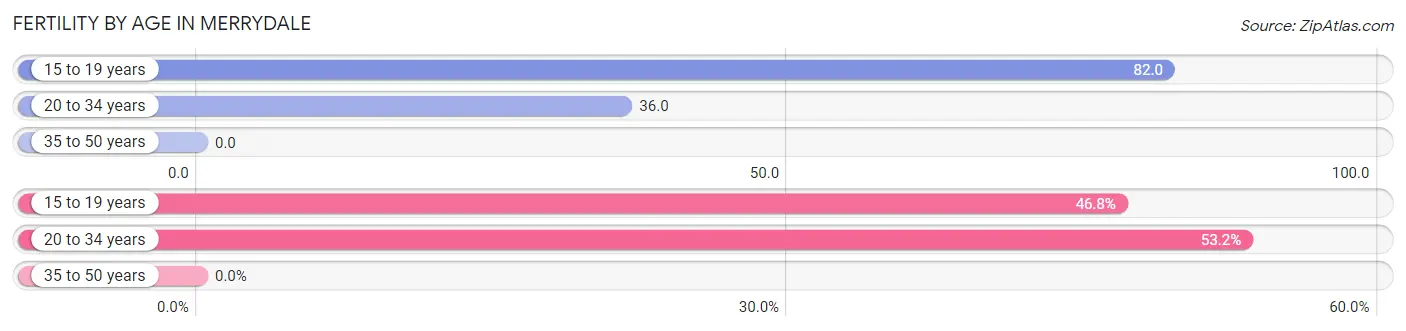
| Age Bracket | Women with Births | Births / 1,000 Women |
| 15 to 19 years | 22 (46.8%) | 82.0 |
| 20 to 34 years | 25 (53.2%) | 36.0 |
| 35 to 50 years | 0 (0.0%) | 0.0 |
| Total | 47 (100.0%) | 23.0 |
Fertility by Age by Marriage Status in Merrydale
53.2% of women with births (47) in Merrydale are married. The highest percentage of unmarried women with births falls into 15 to 19 years age bracket with 100.0% of them unmarried at the time of birth, while the lowest percentage of unmarried women with births belong to 20 to 34 years age bracket with 0.0% of them unmarried.
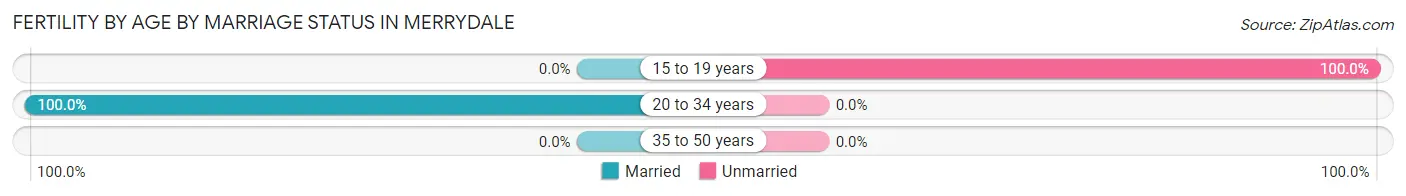
| Age Bracket | Married | Unmarried |
| 15 to 19 years | 0 (0.0%) | 22 (100.0%) |
| 20 to 34 years | 25 (100.0%) | 0 (0.0%) |
| 35 to 50 years | 0 (0.0%) | 0 (0.0%) |
| Total | 25 (53.2%) | 22 (46.8%) |
Fertility by Education in Merrydale
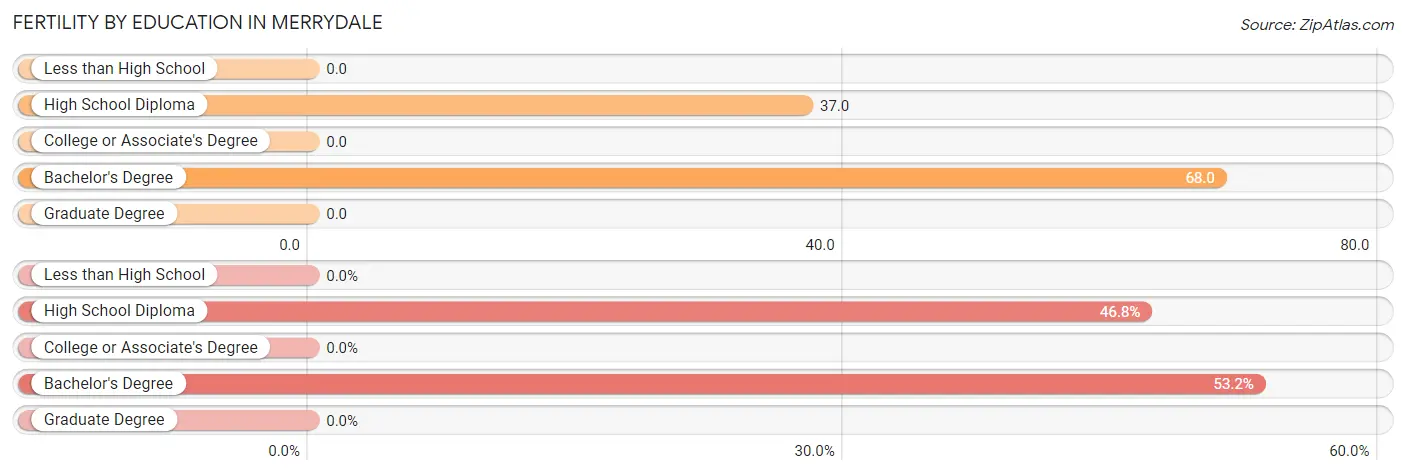
| Educational Attainment | Women with Births | Births / 1,000 Women |
| Less than High School | 0 (0.0%) | 0.0 |
| High School Diploma | 22 (46.8%) | 37.0 |
| College or Associate's Degree | 0 (0.0%) | 0.0 |
| Bachelor's Degree | 25 (53.2%) | 68.0 |
| Graduate Degree | 0 (0.0%) | 0.0 |
| Total | 47 (100.0%) | 23.0 |
Fertility by Education by Marriage Status in Merrydale
46.8% of women with births in Merrydale are unmarried. Women with the educational attainment of bachelor's degree are most likely to be married with 100.0% of them married at childbirth, while women with the educational attainment of high school diploma are least likely to be married with 100.0% of them unmarried at childbirth.
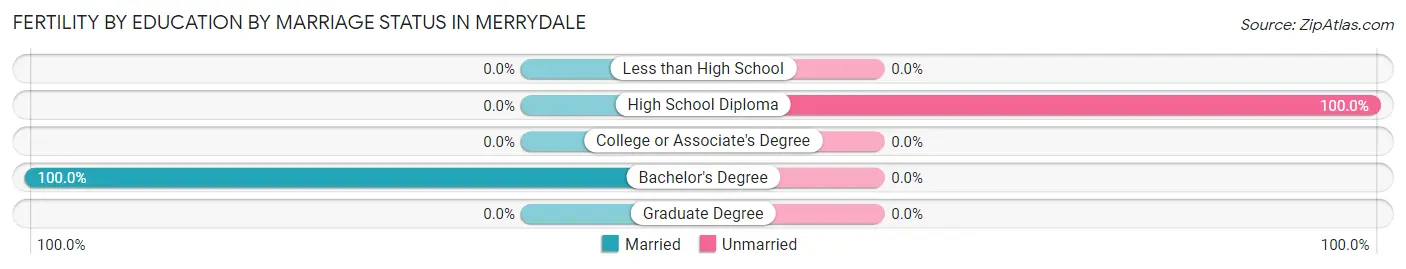
| Educational Attainment | Married | Unmarried |
| Less than High School | 0 (0.0%) | 0 (0.0%) |
| High School Diploma | 0 (0.0%) | 22 (100.0%) |
| College or Associate's Degree | 0 (0.0%) | 0 (0.0%) |
| Bachelor's Degree | 25 (100.0%) | 0 (0.0%) |
| Graduate Degree | 0 (0.0%) | 0 (0.0%) |
| Total | 25 (53.2%) | 22 (46.8%) |
Employment Characteristics in Merrydale
Employment by Class of Employer in Merrydale
Among the 2,884 employed individuals in Merrydale, private company employees (1,875 | 65.0%), state government employees (433 | 15.0%), and local government employees (322 | 11.2%) make up the most common classes of employment.
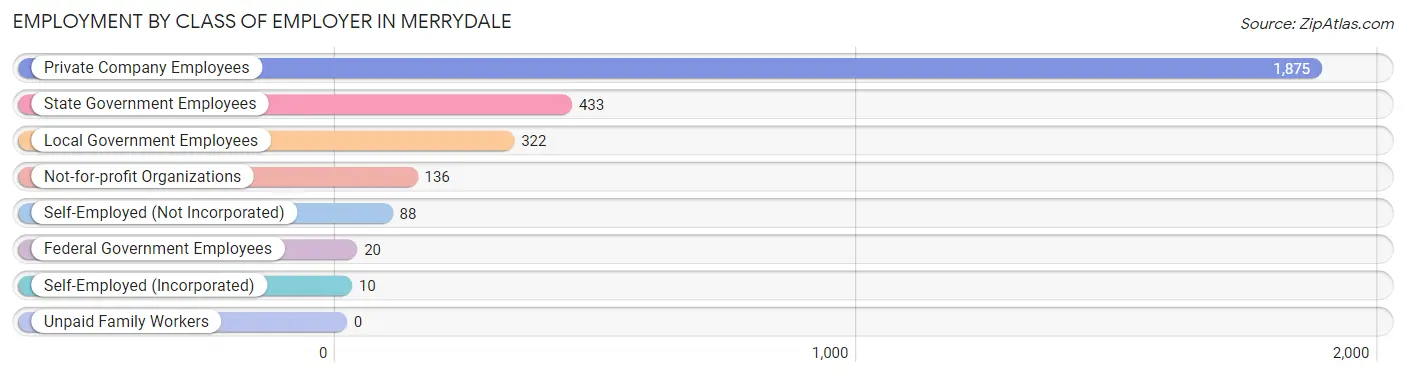
| Employer Class | # Employees | % Employees |
| Private Company Employees | 1,875 | 65.0% |
| Self-Employed (Incorporated) | 10 | 0.4% |
| Self-Employed (Not Incorporated) | 88 | 3.0% |
| Not-for-profit Organizations | 136 | 4.7% |
| Local Government Employees | 322 | 11.2% |
| State Government Employees | 433 | 15.0% |
| Federal Government Employees | 20 | 0.7% |
| Unpaid Family Workers | 0 | 0.0% |
| Total | 2,884 | 100.0% |
Employment Status by Age in Merrydale
According to the labor force statistics for Merrydale, out of the total population over 16 years of age (6,414), 57.3% or 3,675 individuals are in the labor force, with 16.6% or 610 of them unemployed. The age group with the highest labor force participation rate is 25 to 29 years, with 100.0% or 349 individuals in the labor force. Within the labor force, the 16 to 19 years age range has the highest percentage of unemployed individuals, with 100.0% or 70 of them being unemployed.
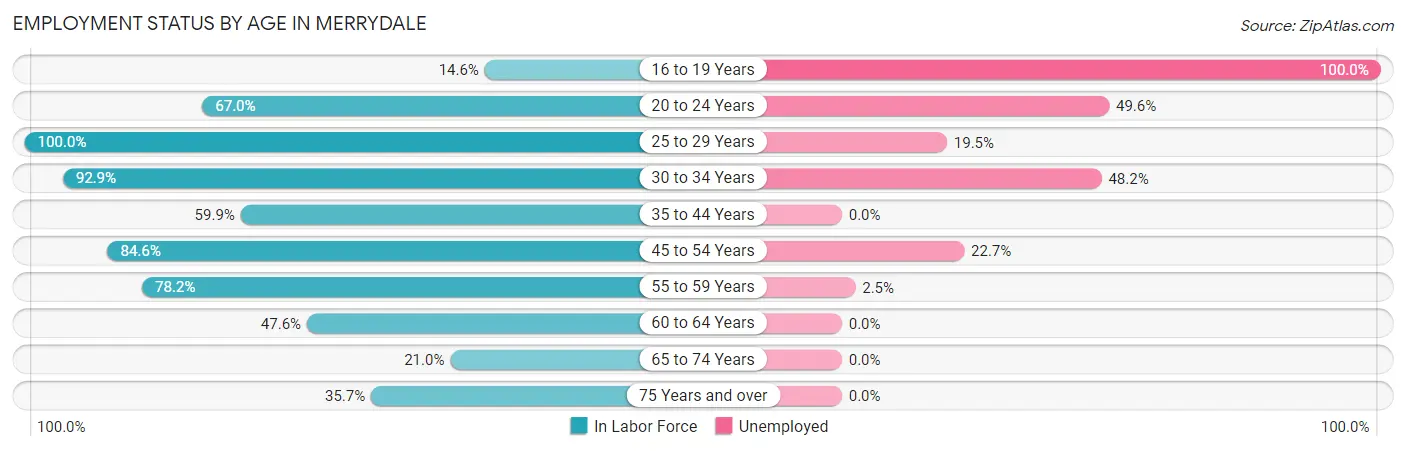
| Age Bracket | In Labor Force | Unemployed |
| 16 to 19 Years | 70 (14.6%) | 70 (100.0%) |
| 20 to 24 Years | 246 (67.0%) | 122 (49.6%) |
| 25 to 29 Years | 349 (100.0%) | 68 (19.5%) |
| 30 to 34 Years | 444 (92.9%) | 214 (48.2%) |
| 35 to 44 Years | 904 (59.9%) | 0 (0.0%) |
| 45 to 54 Years | 555 (84.6%) | 126 (22.7%) |
| 55 to 59 Years | 442 (78.2%) | 11 (2.5%) |
| 60 to 64 Years | 360 (47.6%) | 0 (0.0%) |
| 65 to 74 Years | 207 (21.0%) | 0 (0.0%) |
| 75 Years and over | 97 (35.7%) | 0 (0.0%) |
| Total | 3,675 (57.3%) | 610 (16.6%) |
Employment Status by Educational Attainment in Merrydale
According to labor force statistics for Merrydale, 70.8% of individuals (3,054) out of the total population between 25 and 64 years of age (4,313) are in the labor force, with 13.7% or 418 of them being unemployed. The group with the highest labor force participation rate are those with the educational attainment of bachelor's degree or higher, with 90.3% or 710 individuals in the labor force. Within the labor force, individuals with high school diploma education have the highest percentage of unemployment, with 18.0% or 200 of them being unemployed.
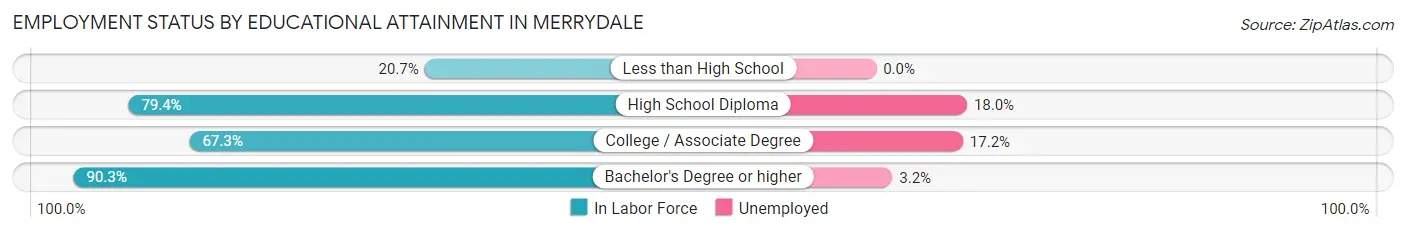
| Educational Attainment | In Labor Force | Unemployed |
| Less than High School | 89 (20.7%) | 0 (0.0%) |
| High School Diploma | 1,113 (79.4%) | 252 (18.0%) |
| College / Associate Degree | 1,141 (67.3%) | 292 (17.2%) |
| Bachelor's Degree or higher | 710 (90.3%) | 25 (3.2%) |
| Total | 3,054 (70.8%) | 591 (13.7%) |
Employment Occupations by Sex in Merrydale
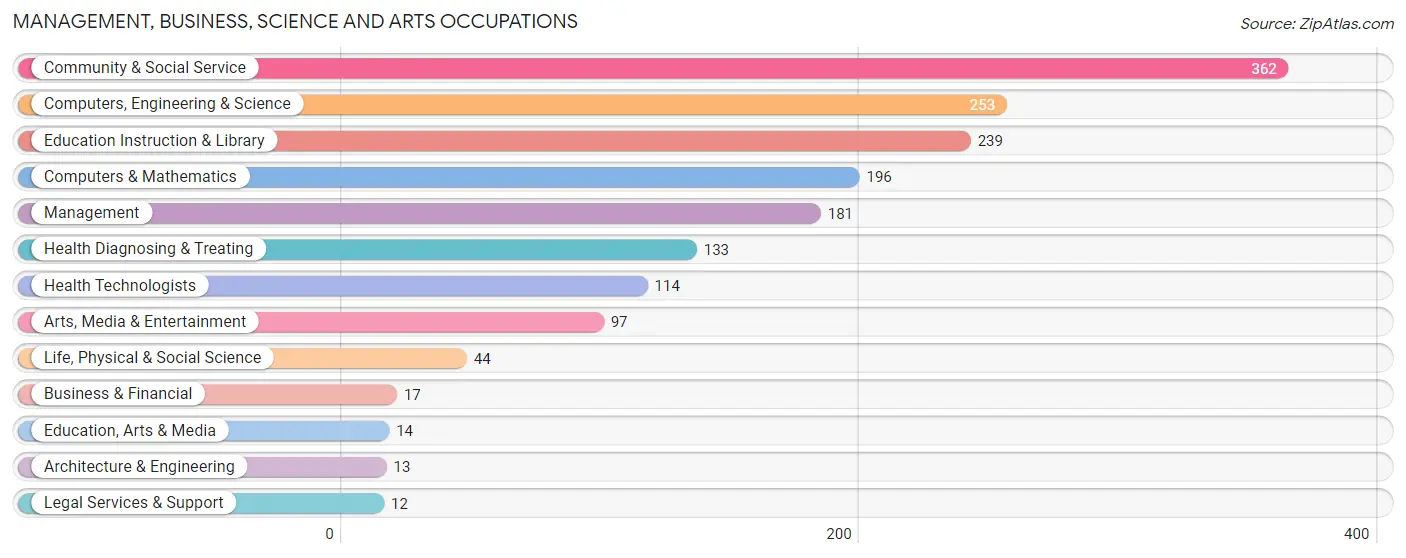
Management, Business, Science and Arts Occupations
The most common Management, Business, Science and Arts occupations in Merrydale are Community & Social Service (362 | 11.8%), Computers, Engineering & Science (253 | 8.3%), Education Instruction & Library (239 | 7.8%), Computers & Mathematics (196 | 6.4%), and Management (181 | 5.9%).
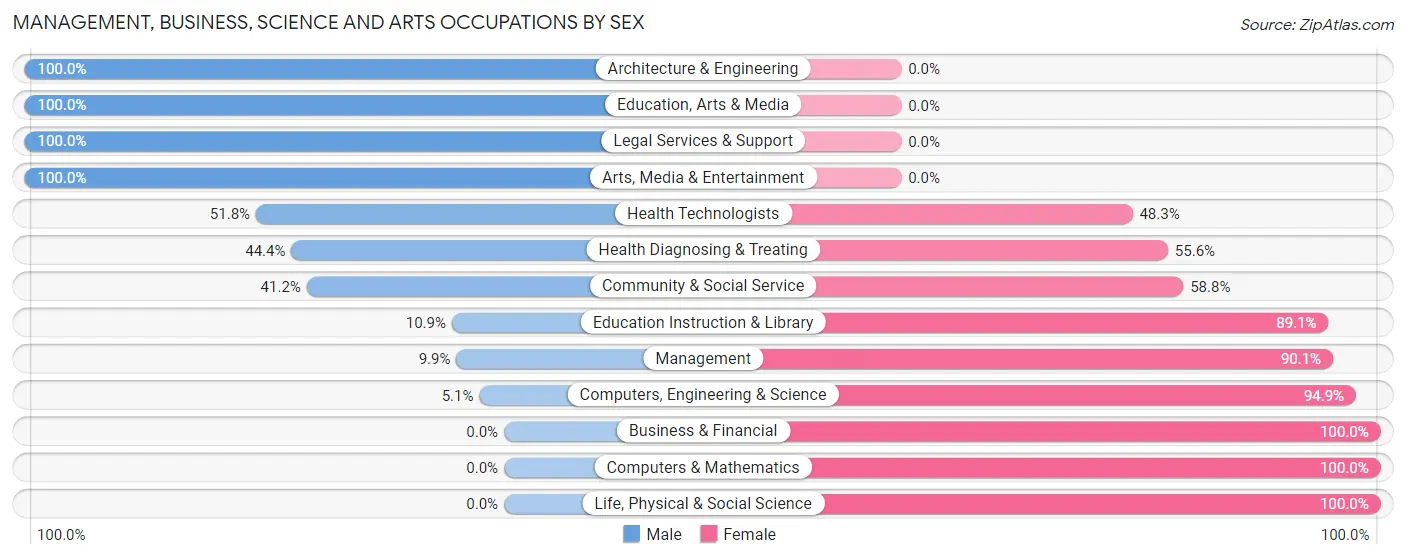
Management, Business, Science and Arts Occupations by Sex
Within the Management, Business, Science and Arts occupations in Merrydale, the most male-oriented occupations are Architecture & Engineering (100.0%), Education, Arts & Media (100.0%), and Legal Services & Support (100.0%), while the most female-oriented occupations are Business & Financial (100.0%), Computers & Mathematics (100.0%), and Life, Physical & Social Science (100.0%).
| Occupation | Male | Female |
| Management | 18 (9.9%) | 163 (90.1%) |
| Business & Financial | 0 (0.0%) | 17 (100.0%) |
| Computers, Engineering & Science | 13 (5.1%) | 240 (94.9%) |
| Computers & Mathematics | 0 (0.0%) | 196 (100.0%) |
| Architecture & Engineering | 13 (100.0%) | 0 (0.0%) |
| Life, Physical & Social Science | 0 (0.0%) | 44 (100.0%) |
| Community & Social Service | 149 (41.2%) | 213 (58.8%) |
| Education, Arts & Media | 14 (100.0%) | 0 (0.0%) |
| Legal Services & Support | 12 (100.0%) | 0 (0.0%) |
| Education Instruction & Library | 26 (10.9%) | 213 (89.1%) |
| Arts, Media & Entertainment | 97 (100.0%) | 0 (0.0%) |
| Health Diagnosing & Treating | 59 (44.4%) | 74 (55.6%) |
| Health Technologists | 59 (51.7%) | 55 (48.2%) |
| Total (Category) | 239 (25.3%) | 707 (74.7%) |
| Total (Overall) | 1,312 (42.8%) | 1,751 (57.2%) |
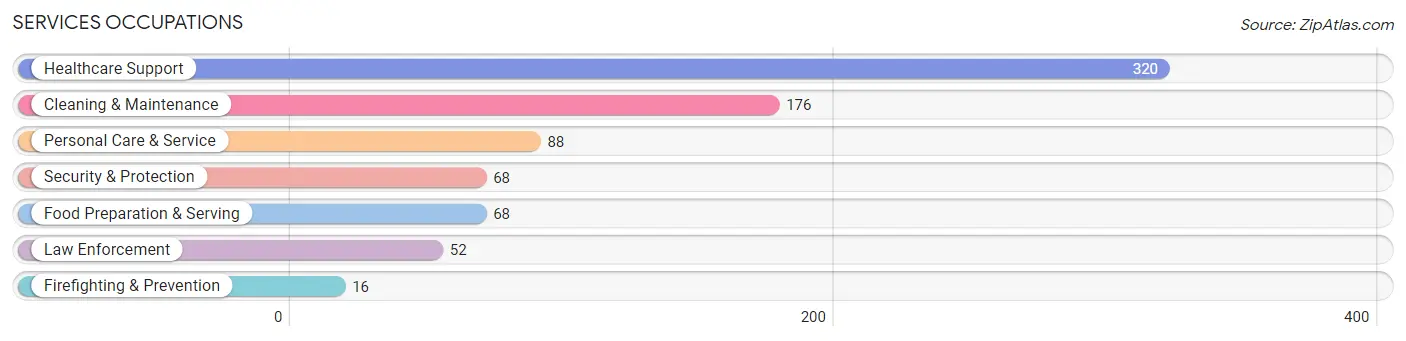
Services Occupations
The most common Services occupations in Merrydale are Healthcare Support (320 | 10.4%), Cleaning & Maintenance (176 | 5.8%), Personal Care & Service (88 | 2.9%), Security & Protection (68 | 2.2%), and Food Preparation & Serving (68 | 2.2%).
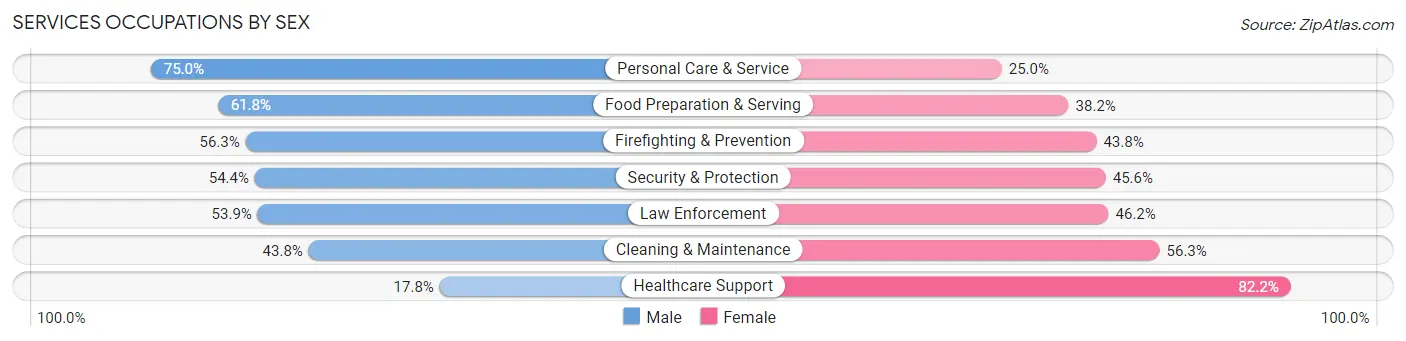
Services Occupations by Sex
Within the Services occupations in Merrydale, the most male-oriented occupations are Personal Care & Service (75.0%), Food Preparation & Serving (61.8%), and Firefighting & Prevention (56.2%), while the most female-oriented occupations are Healthcare Support (82.2%), Cleaning & Maintenance (56.2%), and Law Enforcement (46.2%).
| Occupation | Male | Female |
| Healthcare Support | 57 (17.8%) | 263 (82.2%) |
| Security & Protection | 37 (54.4%) | 31 (45.6%) |
| Firefighting & Prevention | 9 (56.2%) | 7 (43.8%) |
| Law Enforcement | 28 (53.8%) | 24 (46.2%) |
| Food Preparation & Serving | 42 (61.8%) | 26 (38.2%) |
| Cleaning & Maintenance | 77 (43.8%) | 99 (56.2%) |
| Personal Care & Service | 66 (75.0%) | 22 (25.0%) |
| Total (Category) | 279 (38.8%) | 441 (61.3%) |
| Total (Overall) | 1,312 (42.8%) | 1,751 (57.2%) |
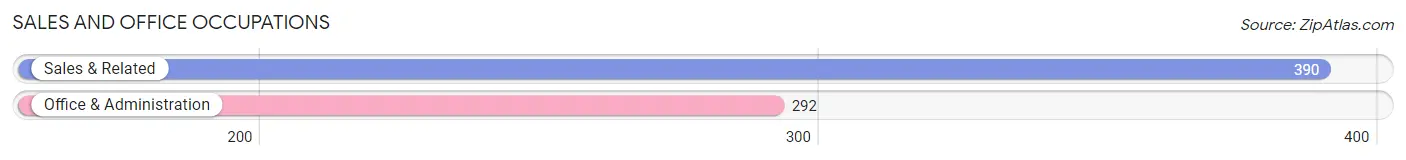
Sales and Office Occupations
The most common Sales and Office occupations in Merrydale are Sales & Related (390 | 12.7%), and Office & Administration (292 | 9.5%).
Sales and Office Occupations by Sex
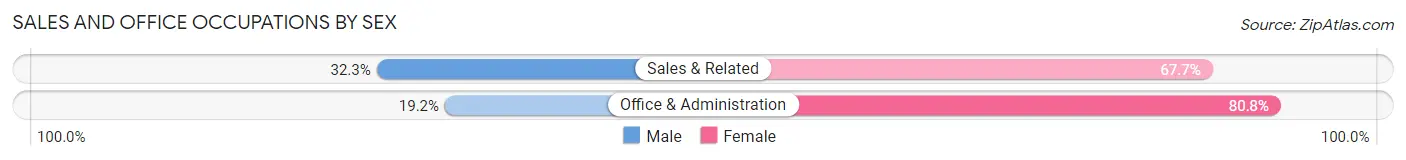
| Occupation | Male | Female |
| Sales & Related | 126 (32.3%) | 264 (67.7%) |
| Office & Administration | 56 (19.2%) | 236 (80.8%) |
| Total (Category) | 182 (26.7%) | 500 (73.3%) |
| Total (Overall) | 1,312 (42.8%) | 1,751 (57.2%) |
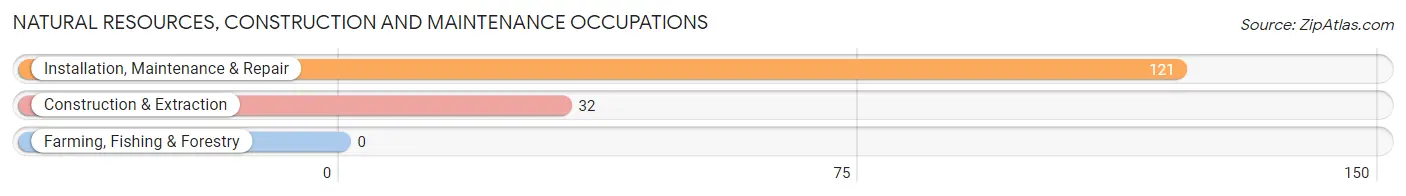
Natural Resources, Construction and Maintenance Occupations
The most common Natural Resources, Construction and Maintenance occupations in Merrydale are Installation, Maintenance & Repair (121 | 4.0%), and Construction & Extraction (32 | 1.0%).
Natural Resources, Construction and Maintenance Occupations by Sex
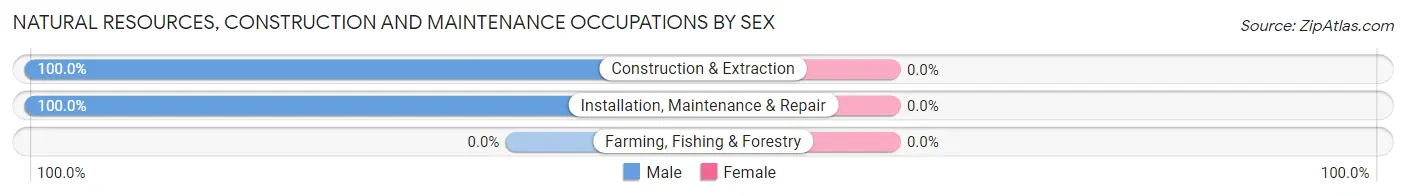
| Occupation | Male | Female |
| Farming, Fishing & Forestry | 0 (0.0%) | 0 (0.0%) |
| Construction & Extraction | 32 (100.0%) | 0 (0.0%) |
| Installation, Maintenance & Repair | 121 (100.0%) | 0 (0.0%) |
| Total (Category) | 153 (100.0%) | 0 (0.0%) |
| Total (Overall) | 1,312 (42.8%) | 1,751 (57.2%) |
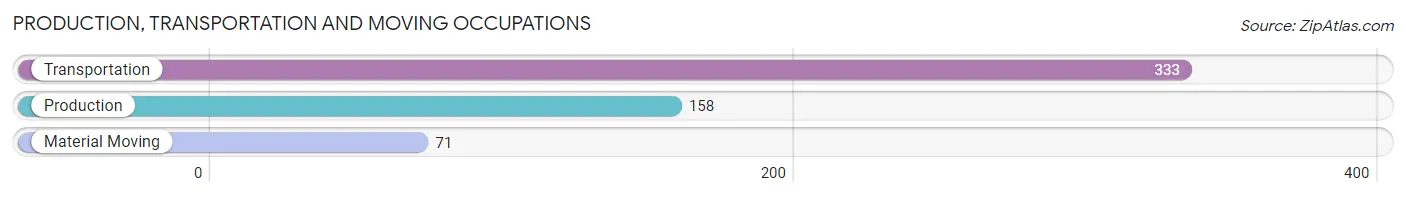
Production, Transportation and Moving Occupations
The most common Production, Transportation and Moving occupations in Merrydale are Transportation (333 | 10.9%), Production (158 | 5.2%), and Material Moving (71 | 2.3%).
Production, Transportation and Moving Occupations by Sex
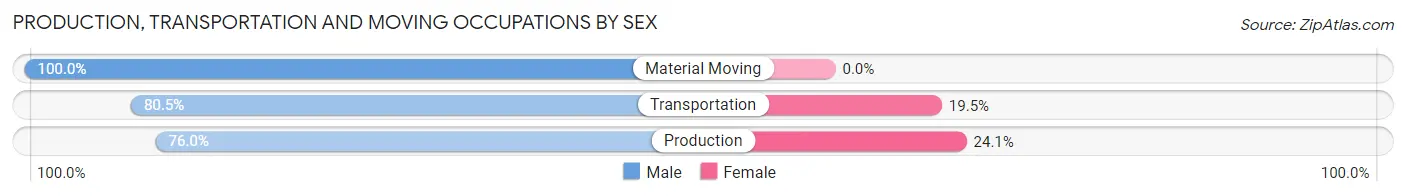
| Occupation | Male | Female |
| Production | 120 (75.9%) | 38 (24.0%) |
| Transportation | 268 (80.5%) | 65 (19.5%) |
| Material Moving | 71 (100.0%) | 0 (0.0%) |
| Total (Category) | 459 (81.7%) | 103 (18.3%) |
| Total (Overall) | 1,312 (42.8%) | 1,751 (57.2%) |
Employment Industries by Sex in Merrydale
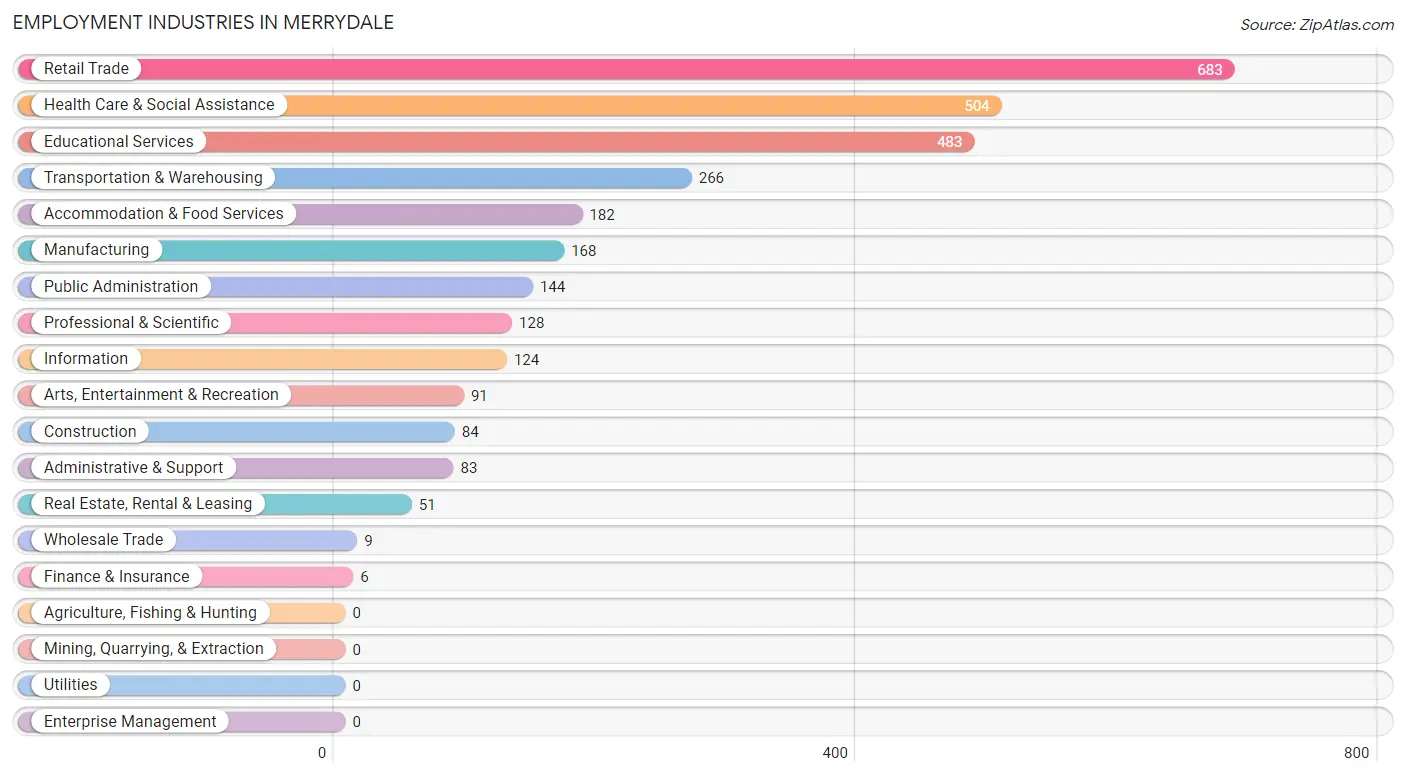
Employment Industries in Merrydale
The major employment industries in Merrydale include Retail Trade (683 | 22.3%), Health Care & Social Assistance (504 | 16.5%), Educational Services (483 | 15.8%), Transportation & Warehousing (266 | 8.7%), and Accommodation & Food Services (182 | 5.9%).
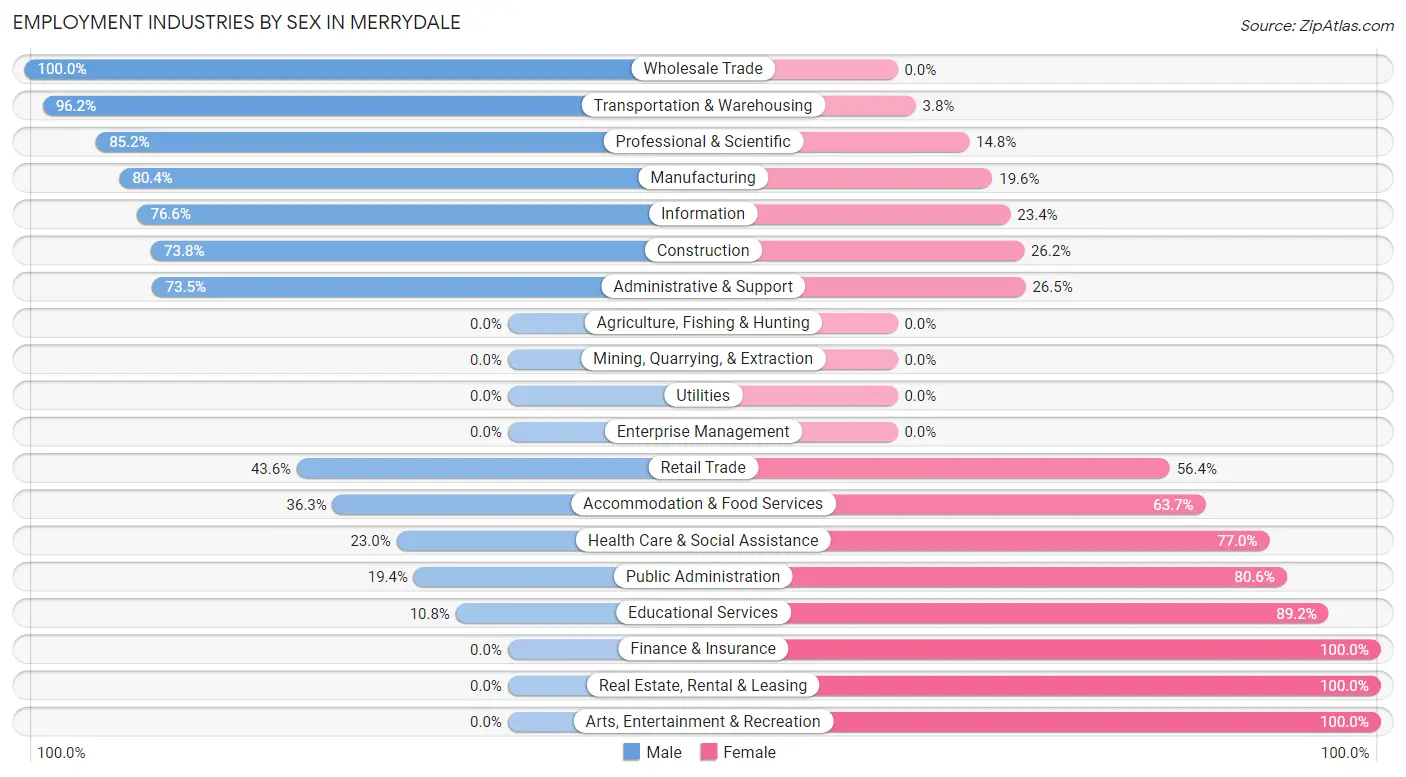
Employment Industries by Sex in Merrydale
The Merrydale industries that see more men than women are Wholesale Trade (100.0%), Transportation & Warehousing (96.2%), and Professional & Scientific (85.2%), whereas the industries that tend to have a higher number of women are Finance & Insurance (100.0%), Real Estate, Rental & Leasing (100.0%), and Arts, Entertainment & Recreation (100.0%).
| Industry | Male | Female |
| Agriculture, Fishing & Hunting | 0 (0.0%) | 0 (0.0%) |
| Mining, Quarrying, & Extraction | 0 (0.0%) | 0 (0.0%) |
| Construction | 62 (73.8%) | 22 (26.2%) |
| Manufacturing | 135 (80.4%) | 33 (19.6%) |
| Wholesale Trade | 9 (100.0%) | 0 (0.0%) |
| Retail Trade | 298 (43.6%) | 385 (56.4%) |
| Transportation & Warehousing | 256 (96.2%) | 10 (3.8%) |
| Utilities | 0 (0.0%) | 0 (0.0%) |
| Information | 95 (76.6%) | 29 (23.4%) |
| Finance & Insurance | 0 (0.0%) | 6 (100.0%) |
| Real Estate, Rental & Leasing | 0 (0.0%) | 51 (100.0%) |
| Professional & Scientific | 109 (85.2%) | 19 (14.8%) |
| Enterprise Management | 0 (0.0%) | 0 (0.0%) |
| Administrative & Support | 61 (73.5%) | 22 (26.5%) |
| Educational Services | 52 (10.8%) | 431 (89.2%) |
| Health Care & Social Assistance | 116 (23.0%) | 388 (77.0%) |
| Arts, Entertainment & Recreation | 0 (0.0%) | 91 (100.0%) |
| Accommodation & Food Services | 66 (36.3%) | 116 (63.7%) |
| Public Administration | 28 (19.4%) | 116 (80.6%) |
| Total | 1,312 (42.8%) | 1,751 (57.2%) |
Education in Merrydale
School Enrollment in Merrydale
The most common levels of schooling among the 2,511 students in Merrydale are middle school (623 | 24.8%), high school (548 | 21.8%), and nursery / preschool (453 | 18.0%).
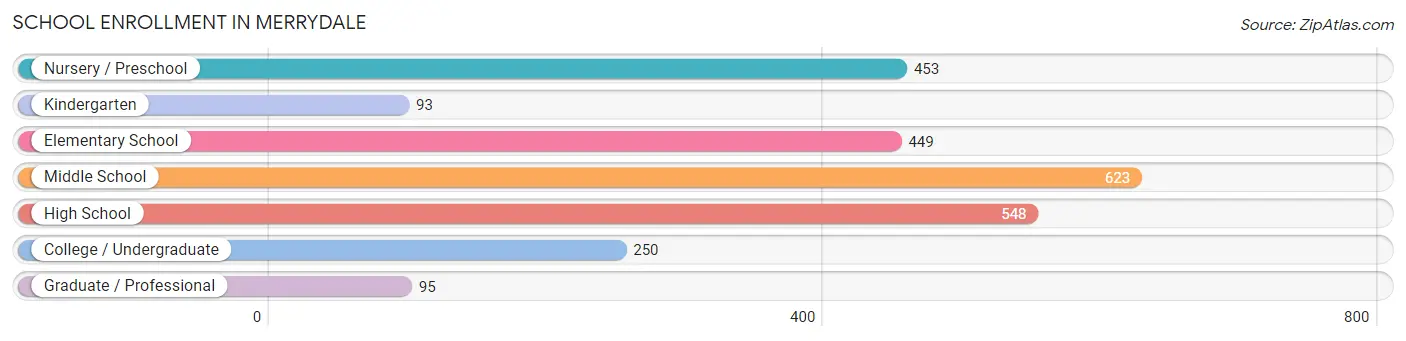
| School Level | # Students | % Students |
| Nursery / Preschool | 453 | 18.0% |
| Kindergarten | 93 | 3.7% |
| Elementary School | 449 | 17.9% |
| Middle School | 623 | 24.8% |
| High School | 548 | 21.8% |
| College / Undergraduate | 250 | 10.0% |
| Graduate / Professional | 95 | 3.8% |
| Total | 2,511 | 100.0% |
School Enrollment by Age by Funding Source in Merrydale
Out of a total of 2,511 students who are enrolled in schools in Merrydale, 269 (10.7%) attend a private institution, while the remaining 2,242 (89.3%) are enrolled in public schools. The age group of 35 years and over has the highest likelihood of being enrolled in private schools, with 34 (73.9% in the age bracket) enrolled. Conversely, the age group of 3 to 4 year olds has the lowest likelihood of being enrolled in a private school, with 233 (100.0% in the age bracket) attending a public institution.
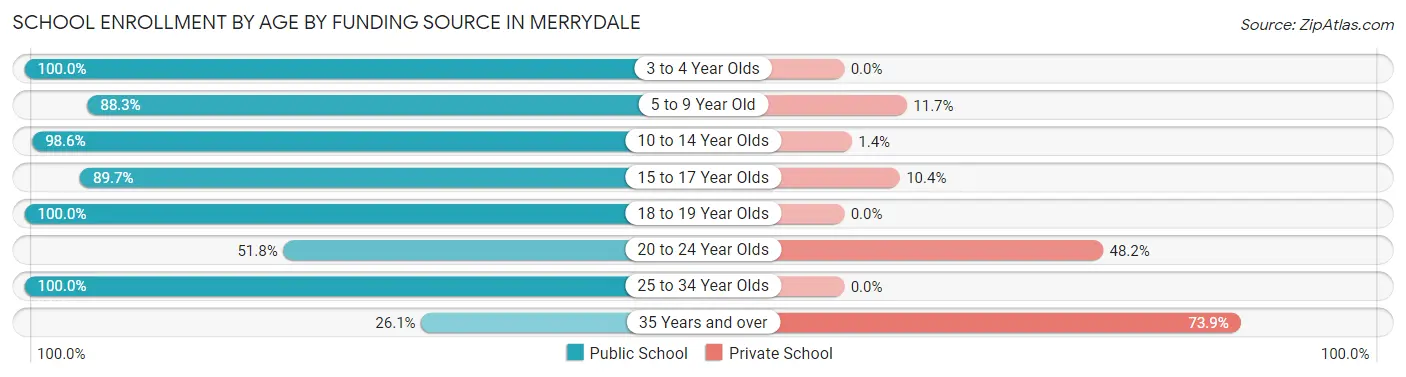
| Age Bracket | Public School | Private School |
| 3 to 4 Year Olds | 233 (100.0%) | 0 (0.0%) |
| 5 to 9 Year Old | 673 (88.3%) | 89 (11.7%) |
| 10 to 14 Year Olds | 621 (98.6%) | 9 (1.4%) |
| 15 to 17 Year Olds | 355 (89.6%) | 41 (10.3%) |
| 18 to 19 Year Olds | 145 (100.0%) | 0 (0.0%) |
| 20 to 24 Year Olds | 102 (51.8%) | 95 (48.2%) |
| 25 to 34 Year Olds | 102 (100.0%) | 0 (0.0%) |
| 35 Years and over | 12 (26.1%) | 34 (73.9%) |
| Total | 2,242 (89.3%) | 269 (10.7%) |
Educational Attainment by Field of Study in Merrydale
Education (338 | 30.9%), computers & mathematics (262 | 24.0%), business (184 | 16.8%), science & technology (82 | 7.5%), and arts & humanities (70 | 6.4%) are the most common fields of study among 1,093 individuals in Merrydale who have obtained a bachelor's degree or higher.
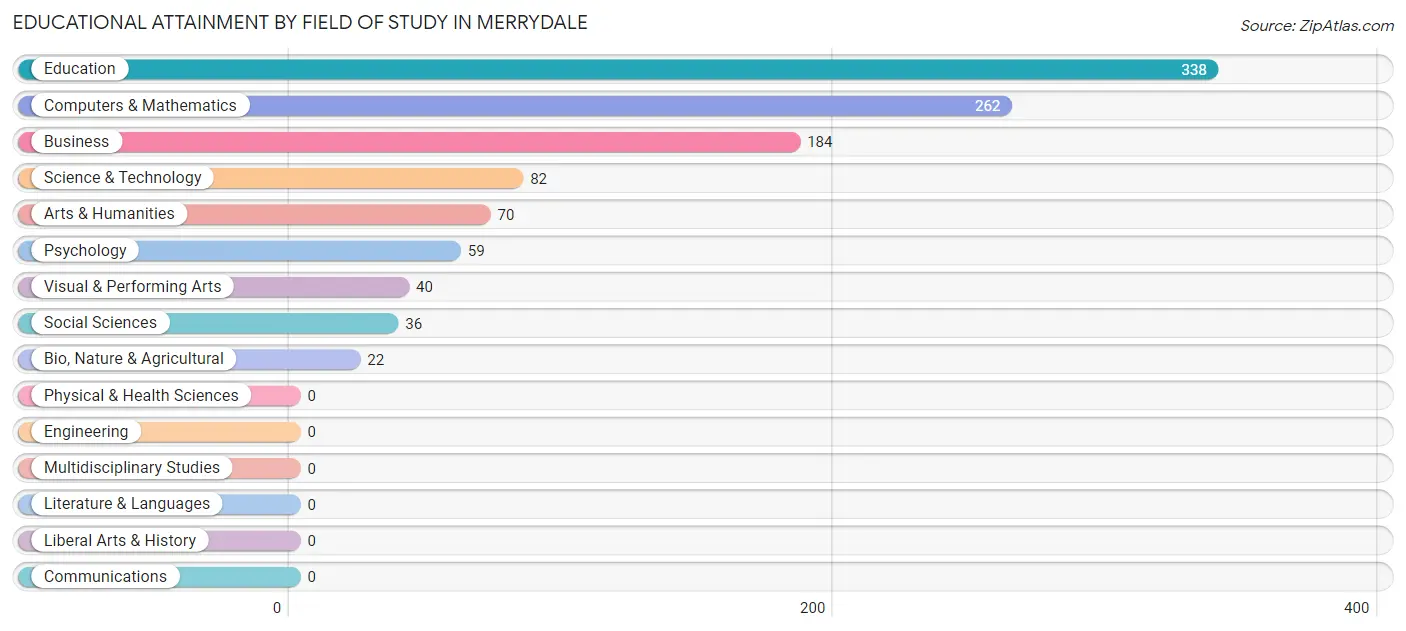
| Field of Study | # Graduates | % Graduates |
| Computers & Mathematics | 262 | 24.0% |
| Bio, Nature & Agricultural | 22 | 2.0% |
| Physical & Health Sciences | 0 | 0.0% |
| Psychology | 59 | 5.4% |
| Social Sciences | 36 | 3.3% |
| Engineering | 0 | 0.0% |
| Multidisciplinary Studies | 0 | 0.0% |
| Science & Technology | 82 | 7.5% |
| Business | 184 | 16.8% |
| Education | 338 | 30.9% |
| Literature & Languages | 0 | 0.0% |
| Liberal Arts & History | 0 | 0.0% |
| Visual & Performing Arts | 40 | 3.7% |
| Communications | 0 | 0.0% |
| Arts & Humanities | 70 | 6.4% |
| Total | 1,093 | 100.0% |
Transportation & Commute in Merrydale
Vehicle Availability by Sex in Merrydale
The most prevalent vehicle ownership categories in Merrydale are males with 2 vehicles (792, accounting for 65.8%) and females with 2 vehicles (671, making up 47.1%).
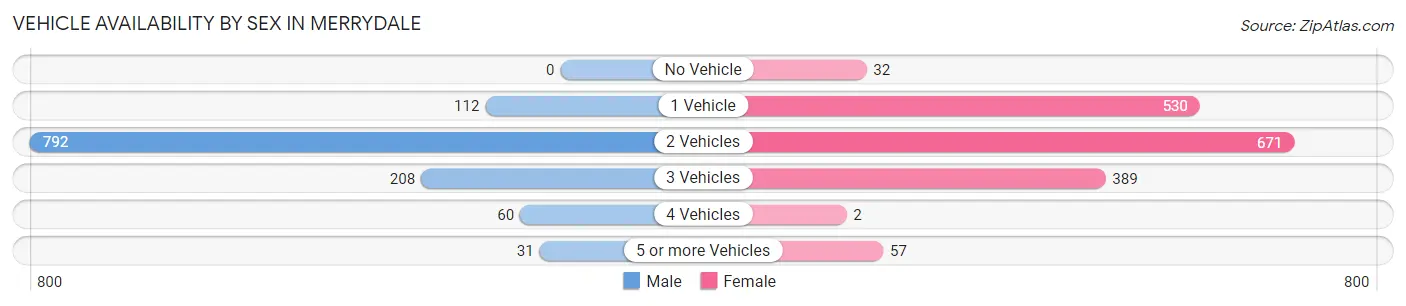
| Vehicles Available | Male | Female |
| No Vehicle | 0 (0.0%) | 32 (1.9%) |
| 1 Vehicle | 112 (9.3%) | 530 (31.5%) |
| 2 Vehicles | 792 (65.8%) | 671 (39.9%) |
| 3 Vehicles | 208 (17.3%) | 389 (23.1%) |
| 4 Vehicles | 60 (5.0%) | 2 (0.1%) |
| 5 or more Vehicles | 31 (2.6%) | 57 (3.4%) |
| Total | 1,203 (100.0%) | 1,681 (100.0%) |
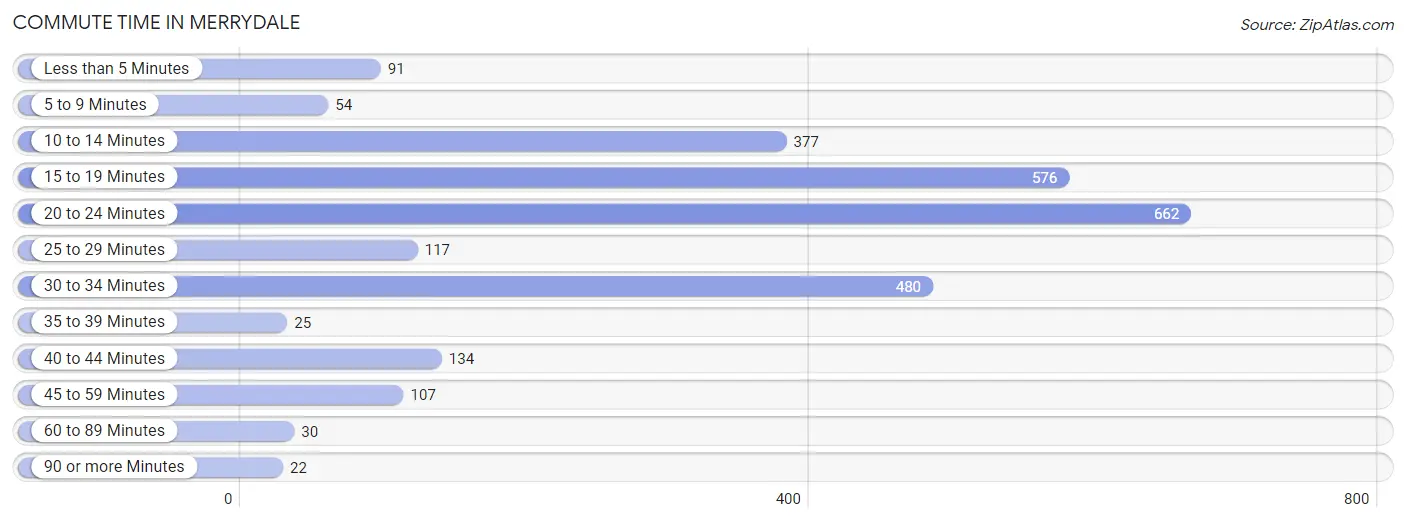
Commute Time in Merrydale
The most frequently occuring commute durations in Merrydale are 20 to 24 minutes (662 commuters, 24.7%), 15 to 19 minutes (576 commuters, 21.5%), and 30 to 34 minutes (480 commuters, 17.9%).
| Commute Time | # Commuters | % Commuters |
| Less than 5 Minutes | 91 | 3.4% |
| 5 to 9 Minutes | 54 | 2.0% |
| 10 to 14 Minutes | 377 | 14.1% |
| 15 to 19 Minutes | 576 | 21.5% |
| 20 to 24 Minutes | 662 | 24.7% |
| 25 to 29 Minutes | 117 | 4.4% |
| 30 to 34 Minutes | 480 | 17.9% |
| 35 to 39 Minutes | 25 | 0.9% |
| 40 to 44 Minutes | 134 | 5.0% |
| 45 to 59 Minutes | 107 | 4.0% |
| 60 to 89 Minutes | 30 | 1.1% |
| 90 or more Minutes | 22 | 0.8% |
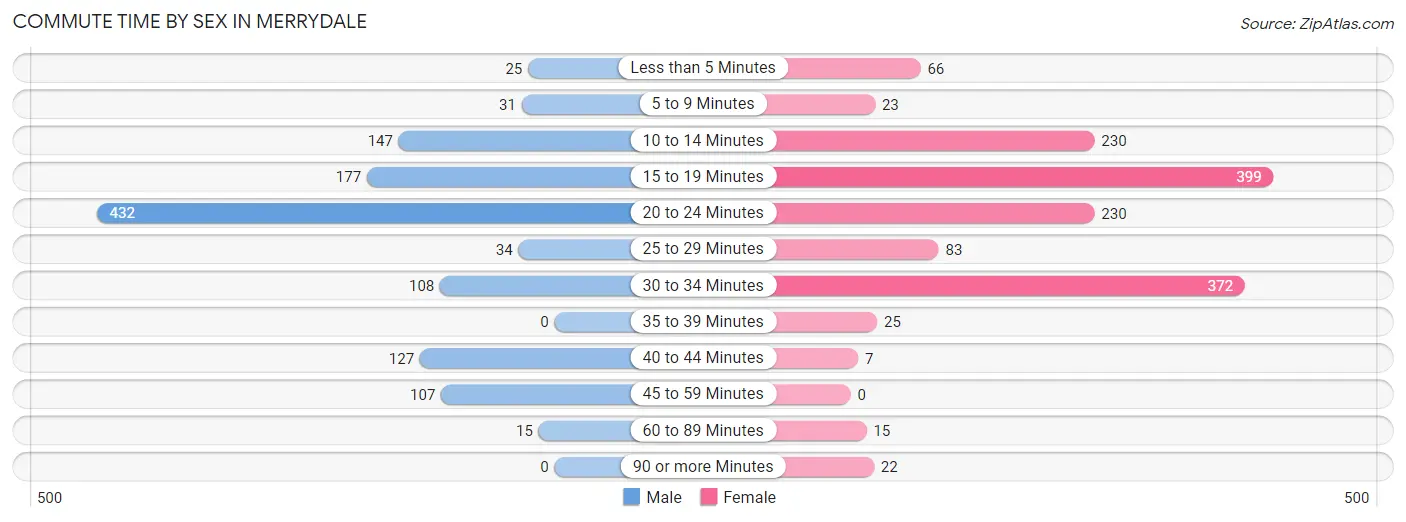
Commute Time by Sex in Merrydale
The most common commute times in Merrydale are 20 to 24 minutes (432 commuters, 35.9%) for males and 15 to 19 minutes (399 commuters, 27.1%) for females.
| Commute Time | Male | Female |
| Less than 5 Minutes | 25 (2.1%) | 66 (4.5%) |
| 5 to 9 Minutes | 31 (2.6%) | 23 (1.6%) |
| 10 to 14 Minutes | 147 (12.2%) | 230 (15.6%) |
| 15 to 19 Minutes | 177 (14.7%) | 399 (27.1%) |
| 20 to 24 Minutes | 432 (35.9%) | 230 (15.6%) |
| 25 to 29 Minutes | 34 (2.8%) | 83 (5.6%) |
| 30 to 34 Minutes | 108 (9.0%) | 372 (25.3%) |
| 35 to 39 Minutes | 0 (0.0%) | 25 (1.7%) |
| 40 to 44 Minutes | 127 (10.6%) | 7 (0.5%) |
| 45 to 59 Minutes | 107 (8.9%) | 0 (0.0%) |
| 60 to 89 Minutes | 15 (1.3%) | 15 (1.0%) |
| 90 or more Minutes | 0 (0.0%) | 22 (1.5%) |
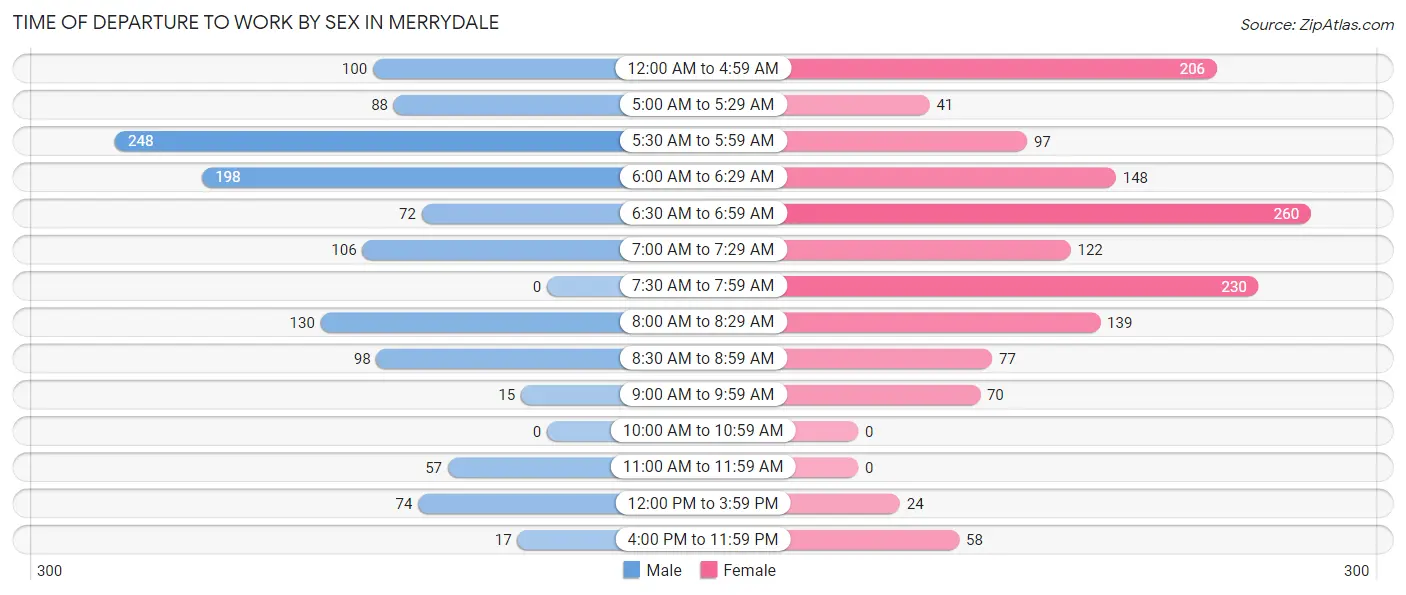
Time of Departure to Work by Sex in Merrydale
The most frequent times of departure to work in Merrydale are 5:30 AM to 5:59 AM (248, 20.6%) for males and 6:30 AM to 6:59 AM (260, 17.7%) for females.
| Time of Departure | Male | Female |
| 12:00 AM to 4:59 AM | 100 (8.3%) | 206 (14.0%) |
| 5:00 AM to 5:29 AM | 88 (7.3%) | 41 (2.8%) |
| 5:30 AM to 5:59 AM | 248 (20.6%) | 97 (6.6%) |
| 6:00 AM to 6:29 AM | 198 (16.5%) | 148 (10.1%) |
| 6:30 AM to 6:59 AM | 72 (6.0%) | 260 (17.7%) |
| 7:00 AM to 7:29 AM | 106 (8.8%) | 122 (8.3%) |
| 7:30 AM to 7:59 AM | 0 (0.0%) | 230 (15.6%) |
| 8:00 AM to 8:29 AM | 130 (10.8%) | 139 (9.4%) |
| 8:30 AM to 8:59 AM | 98 (8.2%) | 77 (5.2%) |
| 9:00 AM to 9:59 AM | 15 (1.3%) | 70 (4.8%) |
| 10:00 AM to 10:59 AM | 0 (0.0%) | 0 (0.0%) |
| 11:00 AM to 11:59 AM | 57 (4.7%) | 0 (0.0%) |
| 12:00 PM to 3:59 PM | 74 (6.1%) | 24 (1.6%) |
| 4:00 PM to 11:59 PM | 17 (1.4%) | 58 (3.9%) |
| Total | 1,203 (100.0%) | 1,472 (100.0%) |
Housing Occupancy in Merrydale
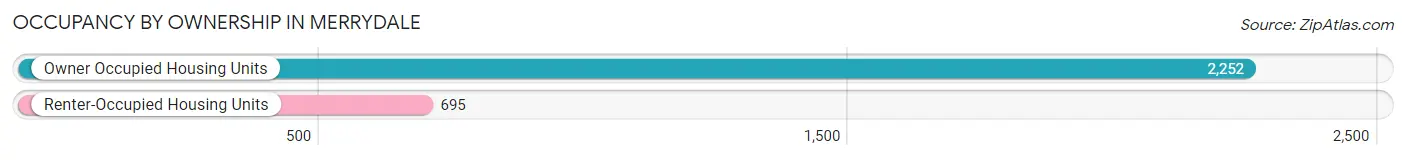
Occupancy by Ownership in Merrydale
Of the total 2,947 dwellings in Merrydale, owner-occupied units account for 2,252 (76.4%), while renter-occupied units make up 695 (23.6%).
| Occupancy | # Housing Units | % Housing Units |
| Owner Occupied Housing Units | 2,252 | 76.4% |
| Renter-Occupied Housing Units | 695 | 23.6% |
| Total Occupied Housing Units | 2,947 | 100.0% |
Occupancy by Household Size in Merrydale
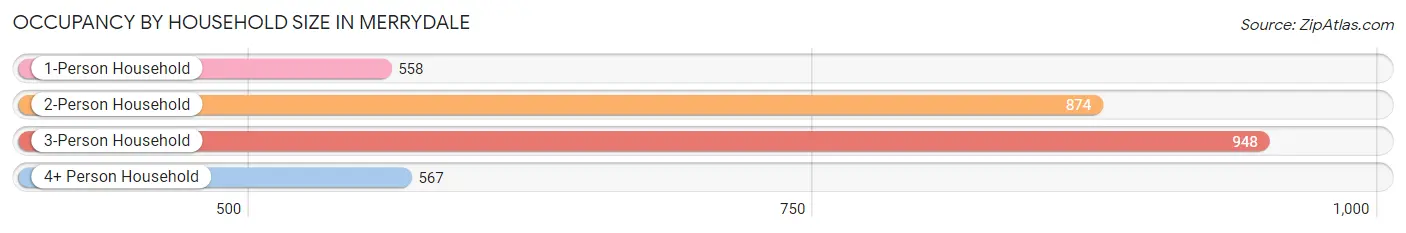
| Household Size | # Housing Units | % Housing Units |
| 1-Person Household | 558 | 18.9% |
| 2-Person Household | 874 | 29.7% |
| 3-Person Household | 948 | 32.2% |
| 4+ Person Household | 567 | 19.2% |
| Total Housing Units | 2,947 | 100.0% |
Occupancy by Ownership by Household Size in Merrydale
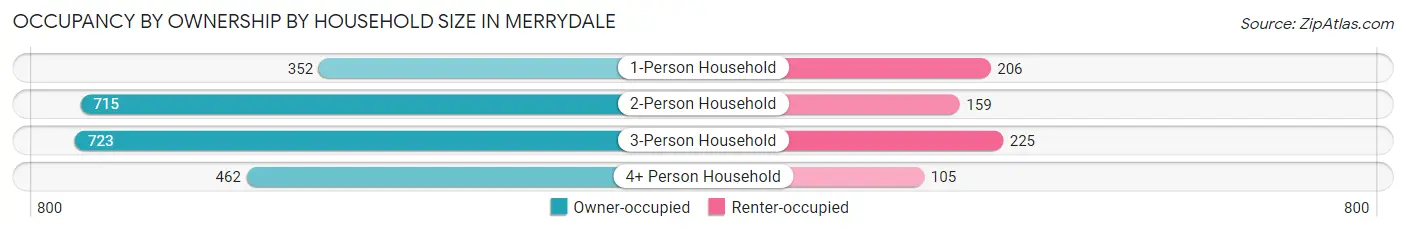
| Household Size | Owner-occupied | Renter-occupied |
| 1-Person Household | 352 (63.1%) | 206 (36.9%) |
| 2-Person Household | 715 (81.8%) | 159 (18.2%) |
| 3-Person Household | 723 (76.3%) | 225 (23.7%) |
| 4+ Person Household | 462 (81.5%) | 105 (18.5%) |
| Total Housing Units | 2,252 (76.4%) | 695 (23.6%) |
Occupancy by Educational Attainment in Merrydale
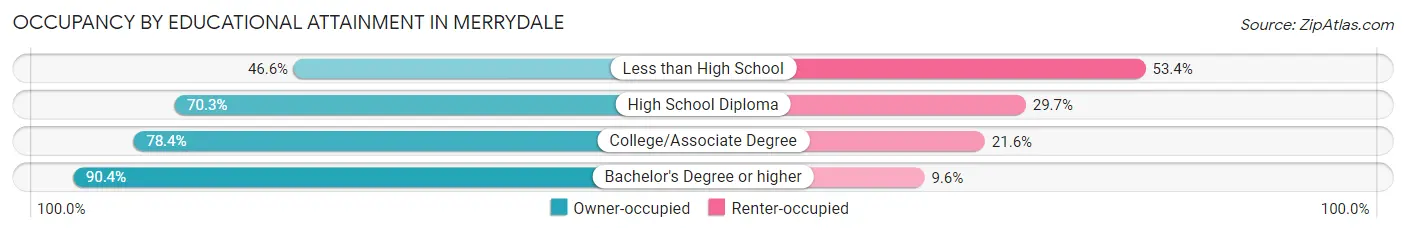
| Household Size | Owner-occupied | Renter-occupied |
| Less than High School | 96 (46.6%) | 110 (53.4%) |
| High School Diploma | 645 (70.3%) | 272 (29.7%) |
| College/Associate Degree | 906 (78.4%) | 249 (21.6%) |
| Bachelor's Degree or higher | 605 (90.4%) | 64 (9.6%) |
Occupancy by Age of Householder in Merrydale
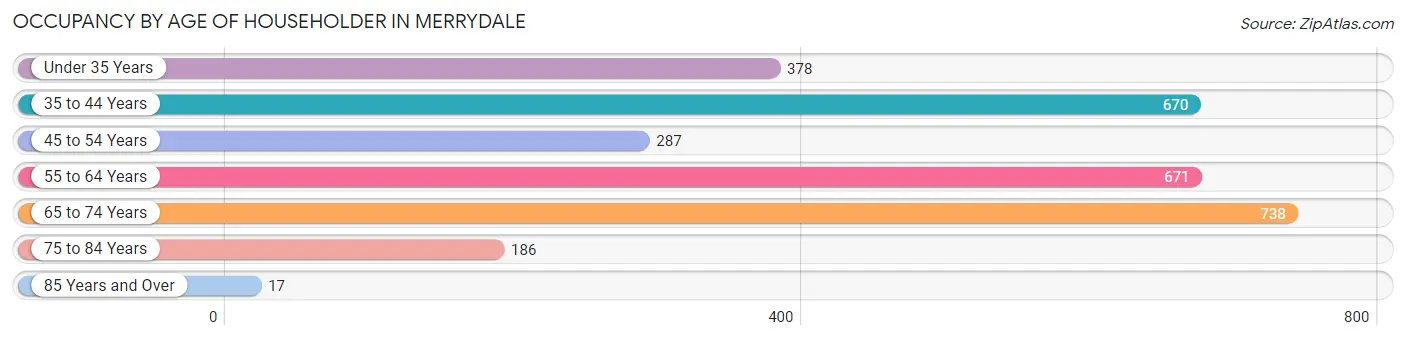
| Age Bracket | # Households | % Households |
| Under 35 Years | 378 | 12.8% |
| 35 to 44 Years | 670 | 22.7% |
| 45 to 54 Years | 287 | 9.7% |
| 55 to 64 Years | 671 | 22.8% |
| 65 to 74 Years | 738 | 25.0% |
| 75 to 84 Years | 186 | 6.3% |
| 85 Years and Over | 17 | 0.6% |
| Total | 2,947 | 100.0% |
Housing Finances in Merrydale
Median Income by Occupancy in Merrydale
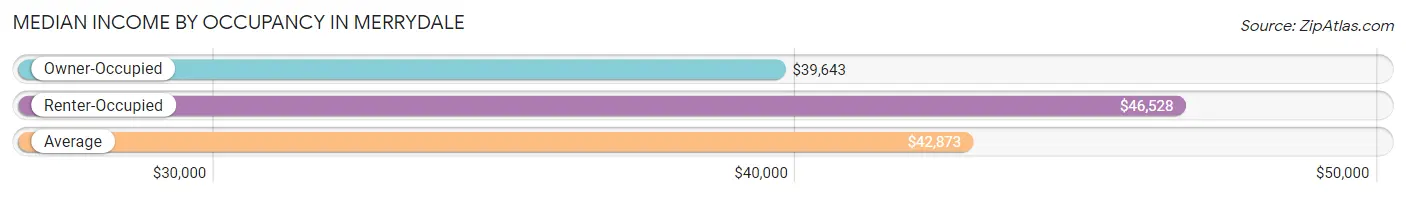
| Occupancy Type | # Households | Median Income |
| Owner-Occupied | 2,252 (76.4%) | $39,643 |
| Renter-Occupied | 695 (23.6%) | $46,528 |
| Average | 2,947 (100.0%) | $42,873 |
Occupancy by Householder Income Bracket in Merrydale
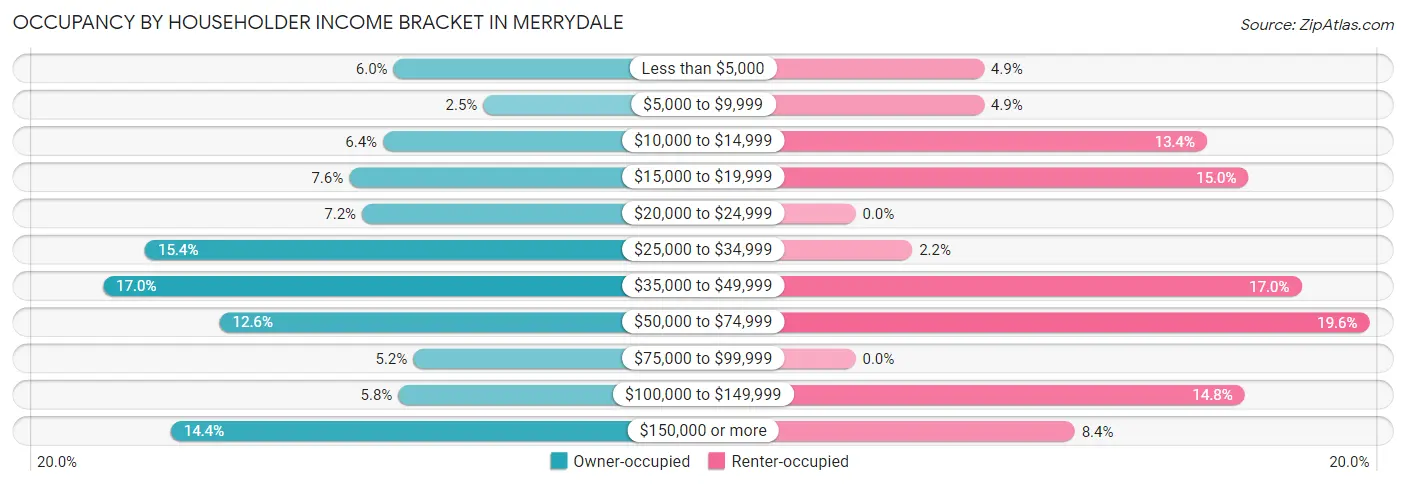
| Income Bracket | Owner-occupied | Renter-occupied |
| Less than $5,000 | 134 (5.9%) | 34 (4.9%) |
| $5,000 to $9,999 | 57 (2.5%) | 34 (4.9%) |
| $10,000 to $14,999 | 143 (6.4%) | 93 (13.4%) |
| $15,000 to $19,999 | 172 (7.6%) | 104 (15.0%) |
| $20,000 to $24,999 | 161 (7.1%) | 0 (0.0%) |
| $25,000 to $34,999 | 347 (15.4%) | 15 (2.2%) |
| $35,000 to $49,999 | 383 (17.0%) | 118 (17.0%) |
| $50,000 to $74,999 | 283 (12.6%) | 136 (19.6%) |
| $75,000 to $99,999 | 117 (5.2%) | 0 (0.0%) |
| $100,000 to $149,999 | 130 (5.8%) | 103 (14.8%) |
| $150,000 or more | 325 (14.4%) | 58 (8.4%) |
| Total | 2,252 (100.0%) | 695 (100.0%) |
Monthly Housing Cost Tiers in Merrydale
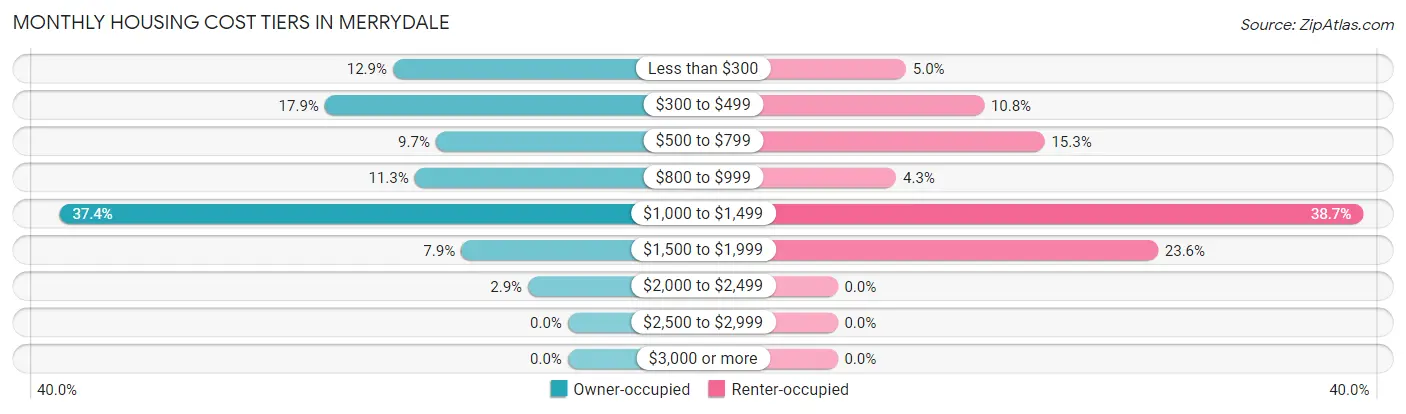
| Monthly Cost | Owner-occupied | Renter-occupied |
| Less than $300 | 290 (12.9%) | 35 (5.0%) |
| $300 to $499 | 403 (17.9%) | 75 (10.8%) |
| $500 to $799 | 219 (9.7%) | 106 (15.2%) |
| $800 to $999 | 254 (11.3%) | 30 (4.3%) |
| $1,000 to $1,499 | 843 (37.4%) | 269 (38.7%) |
| $1,500 to $1,999 | 177 (7.9%) | 164 (23.6%) |
| $2,000 to $2,499 | 66 (2.9%) | 0 (0.0%) |
| $2,500 to $2,999 | 0 (0.0%) | 0 (0.0%) |
| $3,000 or more | 0 (0.0%) | 0 (0.0%) |
| Total | 2,252 (100.0%) | 695 (100.0%) |
Physical Housing Characteristics in Merrydale
Housing Structures in Merrydale
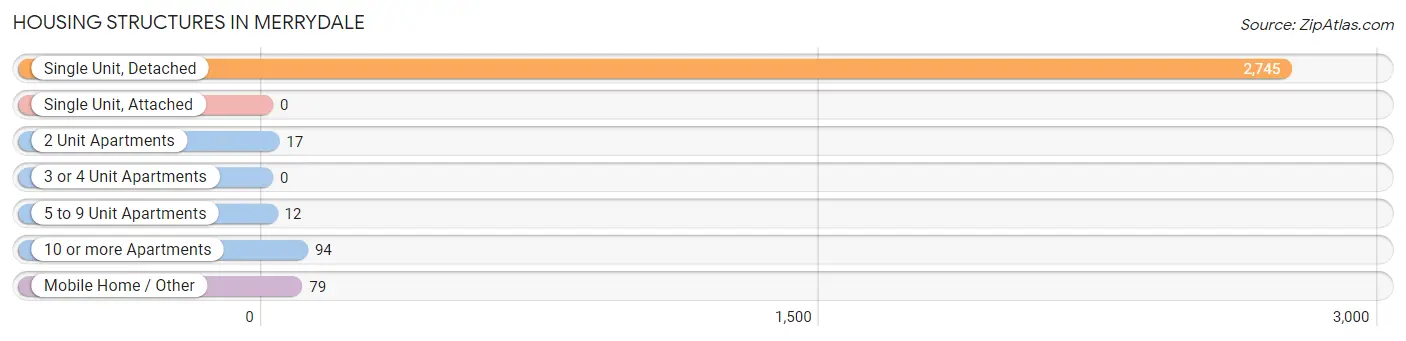
| Structure Type | # Housing Units | % Housing Units |
| Single Unit, Detached | 2,745 | 93.1% |
| Single Unit, Attached | 0 | 0.0% |
| 2 Unit Apartments | 17 | 0.6% |
| 3 or 4 Unit Apartments | 0 | 0.0% |
| 5 to 9 Unit Apartments | 12 | 0.4% |
| 10 or more Apartments | 94 | 3.2% |
| Mobile Home / Other | 79 | 2.7% |
| Total | 2,947 | 100.0% |
Housing Structures by Occupancy in Merrydale
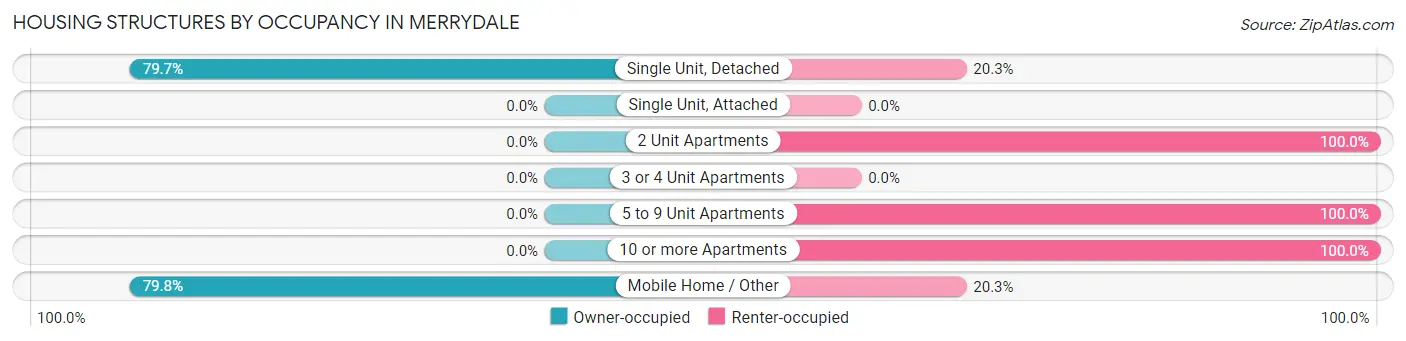
| Structure Type | Owner-occupied | Renter-occupied |
| Single Unit, Detached | 2,189 (79.7%) | 556 (20.3%) |
| Single Unit, Attached | 0 (0.0%) | 0 (0.0%) |
| 2 Unit Apartments | 0 (0.0%) | 17 (100.0%) |
| 3 or 4 Unit Apartments | 0 (0.0%) | 0 (0.0%) |
| 5 to 9 Unit Apartments | 0 (0.0%) | 12 (100.0%) |
| 10 or more Apartments | 0 (0.0%) | 94 (100.0%) |
| Mobile Home / Other | 63 (79.7%) | 16 (20.3%) |
| Total | 2,252 (76.4%) | 695 (23.6%) |
Housing Structures by Number of Rooms in Merrydale
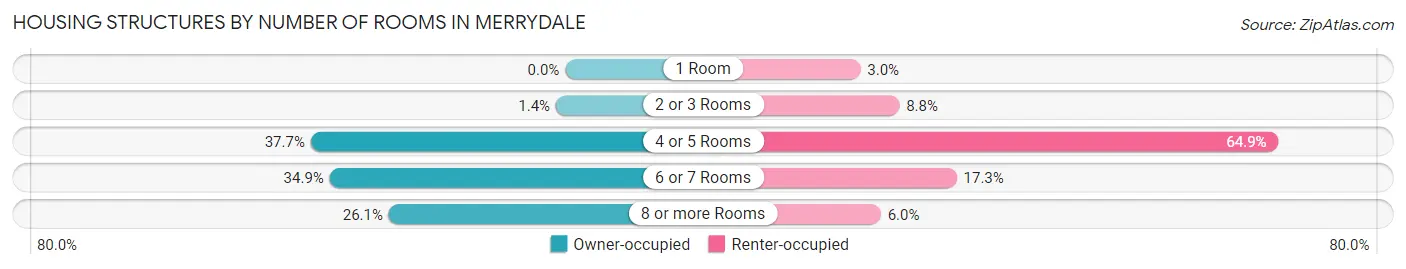
| Number of Rooms | Owner-occupied | Renter-occupied |
| 1 Room | 0 (0.0%) | 21 (3.0%) |
| 2 or 3 Rooms | 31 (1.4%) | 61 (8.8%) |
| 4 or 5 Rooms | 848 (37.7%) | 451 (64.9%) |
| 6 or 7 Rooms | 785 (34.9%) | 120 (17.3%) |
| 8 or more Rooms | 588 (26.1%) | 42 (6.0%) |
| Total | 2,252 (100.0%) | 695 (100.0%) |
Housing Structure by Heating Type in Merrydale
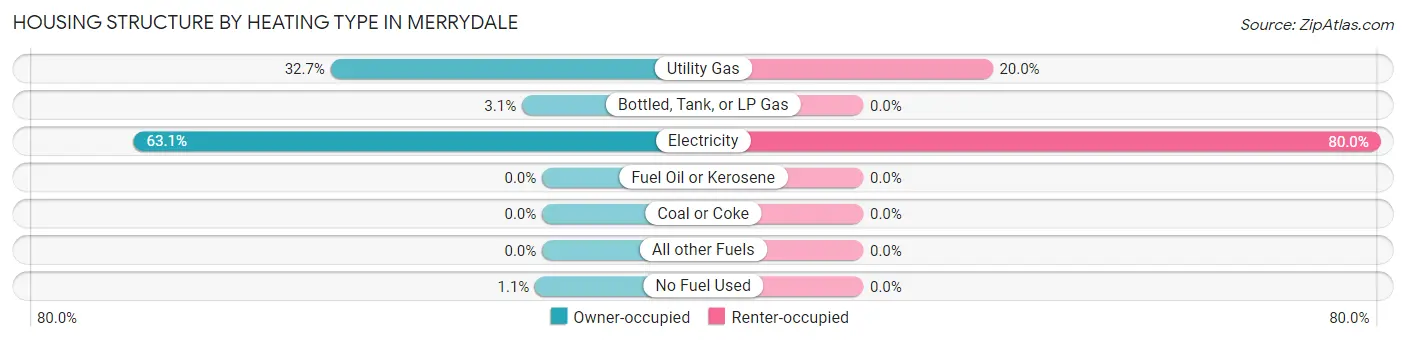
| Heating Type | Owner-occupied | Renter-occupied |
| Utility Gas | 736 (32.7%) | 139 (20.0%) |
| Bottled, Tank, or LP Gas | 70 (3.1%) | 0 (0.0%) |
| Electricity | 1,422 (63.1%) | 556 (80.0%) |
| Fuel Oil or Kerosene | 0 (0.0%) | 0 (0.0%) |
| Coal or Coke | 0 (0.0%) | 0 (0.0%) |
| All other Fuels | 0 (0.0%) | 0 (0.0%) |
| No Fuel Used | 24 (1.1%) | 0 (0.0%) |
| Total | 2,252 (100.0%) | 695 (100.0%) |
Household Vehicle Usage in Merrydale
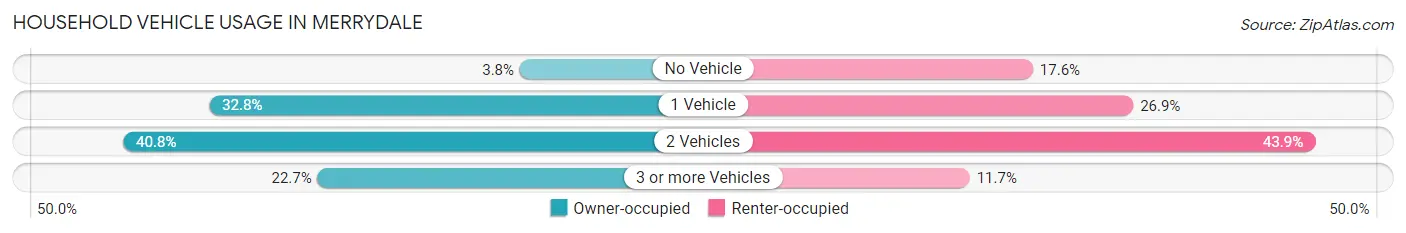
| Vehicles per Household | Owner-occupied | Renter-occupied |
| No Vehicle | 85 (3.8%) | 122 (17.5%) |
| 1 Vehicle | 738 (32.8%) | 187 (26.9%) |
| 2 Vehicles | 919 (40.8%) | 305 (43.9%) |
| 3 or more Vehicles | 510 (22.7%) | 81 (11.7%) |
| Total | 2,252 (100.0%) | 695 (100.0%) |
Real Estate & Mortgages in Merrydale
Real Estate and Mortgage Overview in Merrydale
| Characteristic | Without Mortgage | With Mortgage |
| Housing Units | 746 | 1,506 |
| Median Property Value | $115,100 | $120,700 |
| Median Household Income | - | - |
| Monthly Housing Costs | $318 | $0 |
| Real Estate Taxes | $199 | $125 |
Property Value by Mortgage Status in Merrydale
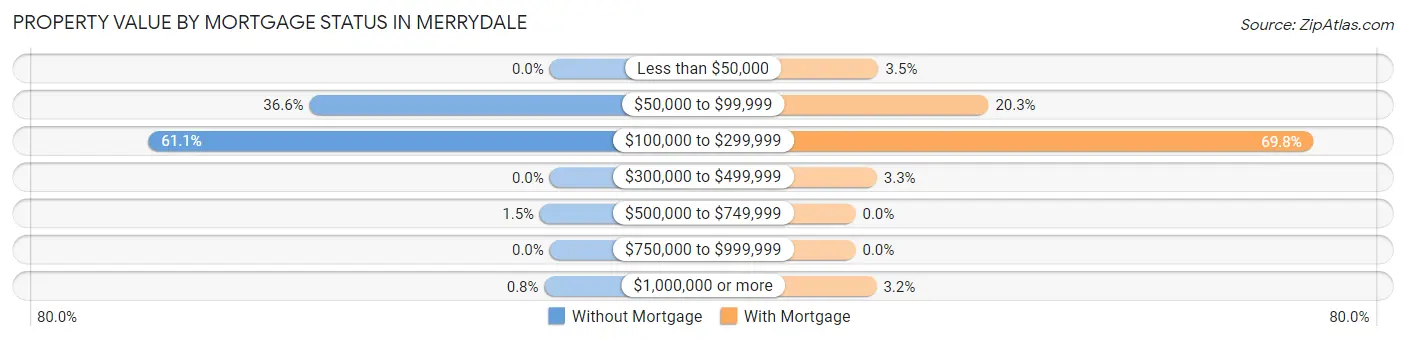
| Property Value | Without Mortgage | With Mortgage |
| Less than $50,000 | 0 (0.0%) | 53 (3.5%) |
| $50,000 to $99,999 | 273 (36.6%) | 305 (20.3%) |
| $100,000 to $299,999 | 456 (61.1%) | 1,051 (69.8%) |
| $300,000 to $499,999 | 0 (0.0%) | 49 (3.3%) |
| $500,000 to $749,999 | 11 (1.5%) | 0 (0.0%) |
| $750,000 to $999,999 | 0 (0.0%) | 0 (0.0%) |
| $1,000,000 or more | 6 (0.8%) | 48 (3.2%) |
| Total | 746 (100.0%) | 1,506 (100.0%) |
Household Income by Mortgage Status in Merrydale
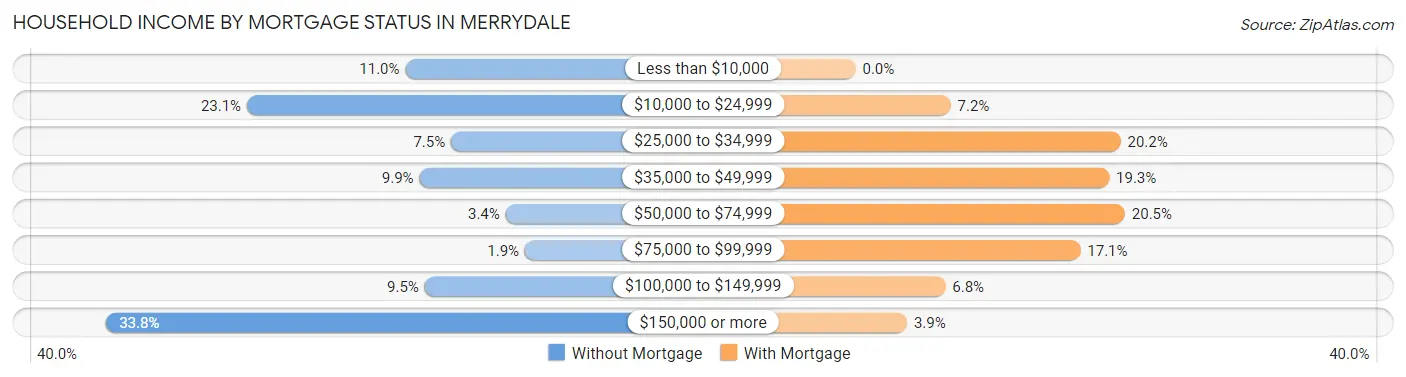
| Household Income | Without Mortgage | With Mortgage |
| Less than $10,000 | 82 (11.0%) | 0 (0.0%) |
| $10,000 to $24,999 | 172 (23.1%) | 109 (7.2%) |
| $25,000 to $34,999 | 56 (7.5%) | 304 (20.2%) |
| $35,000 to $49,999 | 74 (9.9%) | 291 (19.3%) |
| $50,000 to $74,999 | 25 (3.4%) | 309 (20.5%) |
| $75,000 to $99,999 | 14 (1.9%) | 258 (17.1%) |
| $100,000 to $149,999 | 71 (9.5%) | 103 (6.8%) |
| $150,000 or more | 252 (33.8%) | 59 (3.9%) |
| Total | 746 (100.0%) | 1,506 (100.0%) |
Property Value to Household Income Ratio in Merrydale
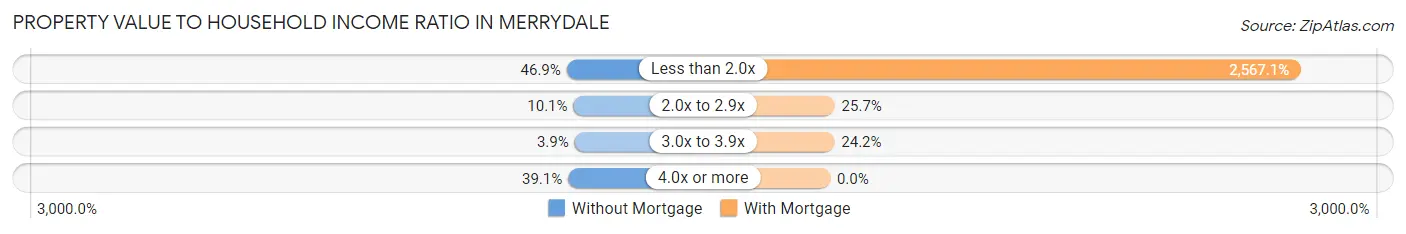
| Value-to-Income Ratio | Without Mortgage | With Mortgage |
| Less than 2.0x | 350 (46.9%) | 38,661 (2,567.1%) |
| 2.0x to 2.9x | 75 (10.1%) | 387 (25.7%) |
| 3.0x to 3.9x | 29 (3.9%) | 364 (24.2%) |
| 4.0x or more | 292 (39.1%) | 0 (0.0%) |
| Total | 746 (100.0%) | 1,506 (100.0%) |
Real Estate Taxes by Mortgage Status in Merrydale
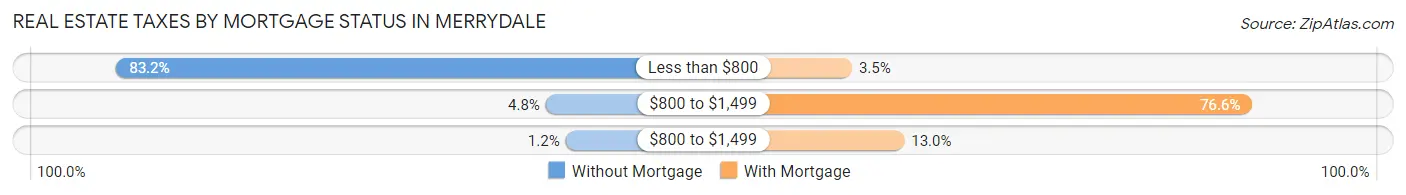
| Property Taxes | Without Mortgage | With Mortgage |
| Less than $800 | 621 (83.2%) | 52 (3.5%) |
| $800 to $1,499 | 36 (4.8%) | 1,153 (76.6%) |
| $800 to $1,499 | 9 (1.2%) | 196 (13.0%) |
| Total | 746 (100.0%) | 1,506 (100.0%) |
Health & Disability in Merrydale
Health Insurance Coverage by Age in Merrydale
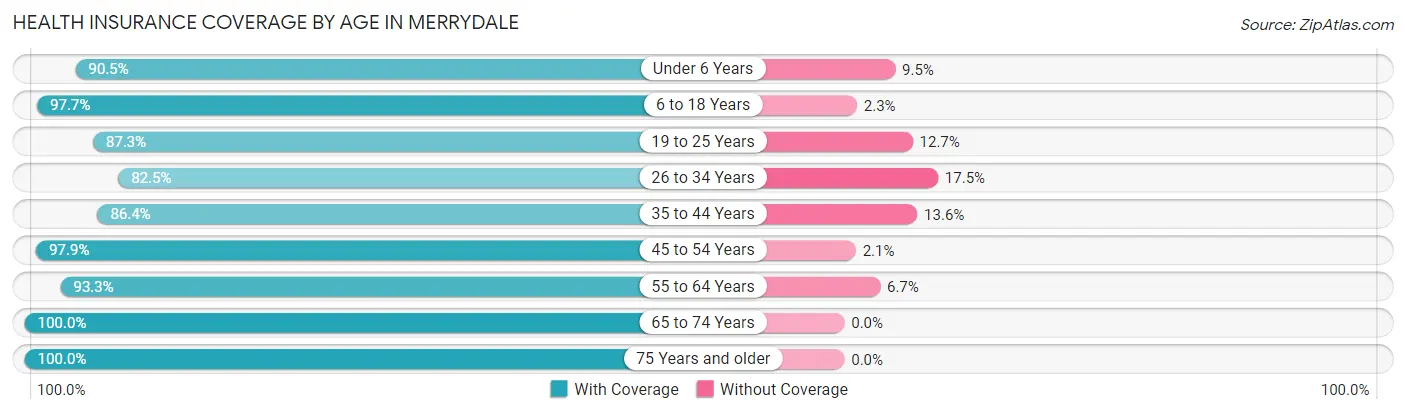
| Age Bracket | With Coverage | Without Coverage |
| Under 6 Years | 841 (90.5%) | 88 (9.5%) |
| 6 to 18 Years | 1,629 (97.7%) | 39 (2.3%) |
| 19 to 25 Years | 363 (87.3%) | 53 (12.7%) |
| 26 to 34 Years | 662 (82.5%) | 140 (17.5%) |
| 35 to 44 Years | 1,304 (86.4%) | 205 (13.6%) |
| 45 to 54 Years | 642 (97.9%) | 14 (2.1%) |
| 55 to 64 Years | 1,233 (93.3%) | 88 (6.7%) |
| 65 to 74 Years | 984 (100.0%) | 0 (0.0%) |
| 75 Years and older | 272 (100.0%) | 0 (0.0%) |
| Total | 7,930 (92.7%) | 627 (7.3%) |
Health Insurance Coverage by Citizenship Status in Merrydale
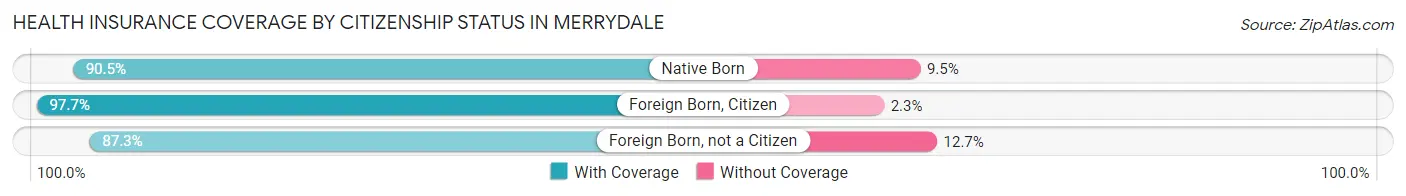
| Citizenship Status | With Coverage | Without Coverage |
| Native Born | 841 (90.5%) | 88 (9.5%) |
| Foreign Born, Citizen | 1,629 (97.7%) | 39 (2.3%) |
| Foreign Born, not a Citizen | 363 (87.3%) | 53 (12.7%) |
Health Insurance Coverage by Household Income in Merrydale
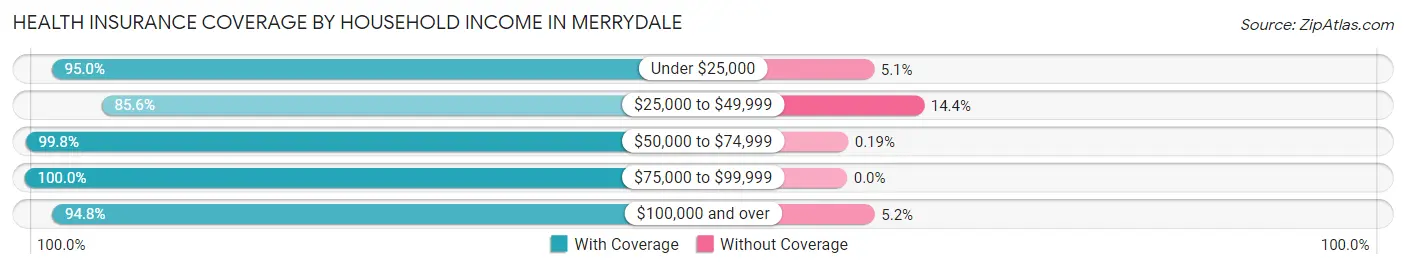
| Household Income | With Coverage | Without Coverage |
| Under $25,000 | 2,369 (95.0%) | 126 (5.1%) |
| $25,000 to $49,999 | 2,356 (85.6%) | 397 (14.4%) |
| $50,000 to $74,999 | 1,048 (99.8%) | 2 (0.2%) |
| $75,000 to $99,999 | 284 (100.0%) | 0 (0.0%) |
| $100,000 and over | 1,873 (94.8%) | 102 (5.2%) |
Public vs Private Health Insurance Coverage by Age in Merrydale
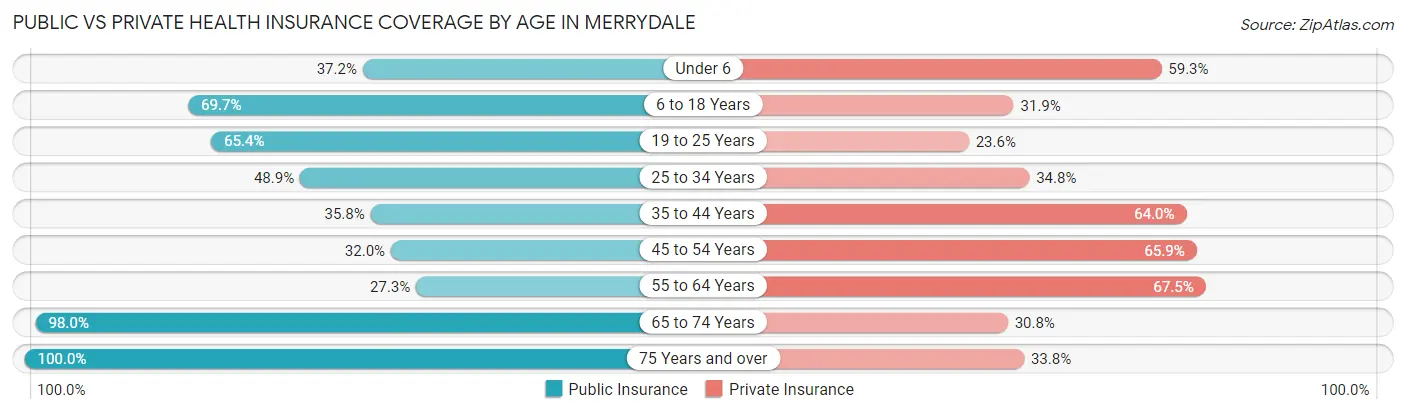
| Age Bracket | Public Insurance | Private Insurance |
| Under 6 | 346 (37.2%) | 551 (59.3%) |
| 6 to 18 Years | 1,162 (69.7%) | 532 (31.9%) |
| 19 to 25 Years | 272 (65.4%) | 98 (23.6%) |
| 25 to 34 Years | 392 (48.9%) | 279 (34.8%) |
| 35 to 44 Years | 540 (35.8%) | 965 (63.9%) |
| 45 to 54 Years | 210 (32.0%) | 432 (65.8%) |
| 55 to 64 Years | 361 (27.3%) | 892 (67.5%) |
| 65 to 74 Years | 964 (98.0%) | 303 (30.8%) |
| 75 Years and over | 272 (100.0%) | 92 (33.8%) |
| Total | 4,519 (52.8%) | 4,144 (48.4%) |
Disability Status by Sex by Age in Merrydale
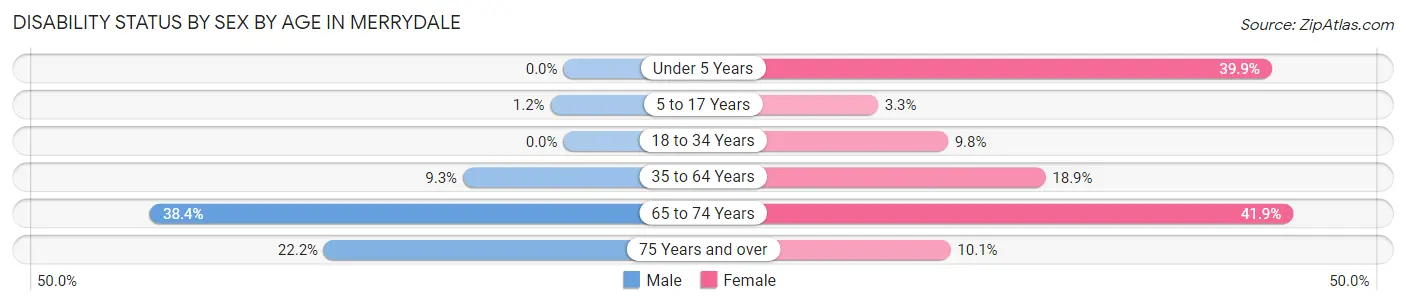
| Age Bracket | Male | Female |
| Under 5 Years | 0 (0.0%) | 144 (39.9%) |
| 5 to 17 Years | 10 (1.2%) | 33 (3.3%) |
| 18 to 34 Years | 0 (0.0%) | 70 (9.8%) |
| 35 to 64 Years | 135 (9.3%) | 385 (18.9%) |
| 65 to 74 Years | 153 (38.4%) | 245 (41.9%) |
| 75 Years and over | 34 (22.2%) | 12 (10.1%) |
Disability Class by Sex by Age in Merrydale
Disability Class: Hearing Difficulty
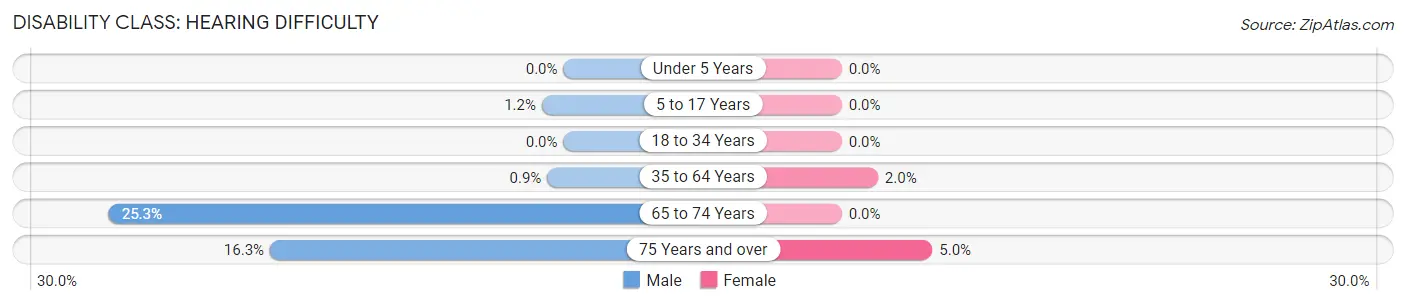
| Age Bracket | Male | Female |
| Under 5 Years | 0 (0.0%) | 0 (0.0%) |
| 5 to 17 Years | 10 (1.2%) | 0 (0.0%) |
| 18 to 34 Years | 0 (0.0%) | 0 (0.0%) |
| 35 to 64 Years | 13 (0.9%) | 41 (2.0%) |
| 65 to 74 Years | 101 (25.3%) | 0 (0.0%) |
| 75 Years and over | 25 (16.3%) | 6 (5.0%) |
Disability Class: Vision Difficulty
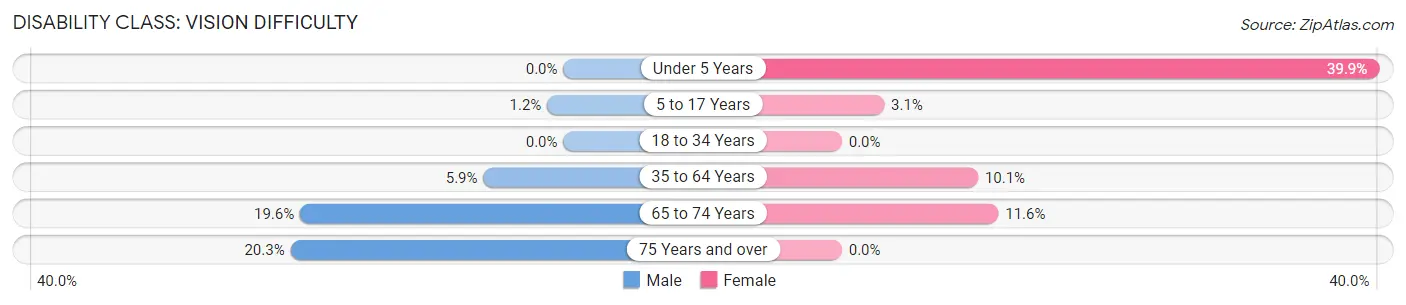
| Age Bracket | Male | Female |
| Under 5 Years | 0 (0.0%) | 144 (39.9%) |
| 5 to 17 Years | 10 (1.2%) | 31 (3.1%) |
| 18 to 34 Years | 0 (0.0%) | 0 (0.0%) |
| 35 to 64 Years | 86 (5.9%) | 206 (10.1%) |
| 65 to 74 Years | 78 (19.6%) | 68 (11.6%) |
| 75 Years and over | 31 (20.3%) | 0 (0.0%) |
Disability Class: Cognitive Difficulty
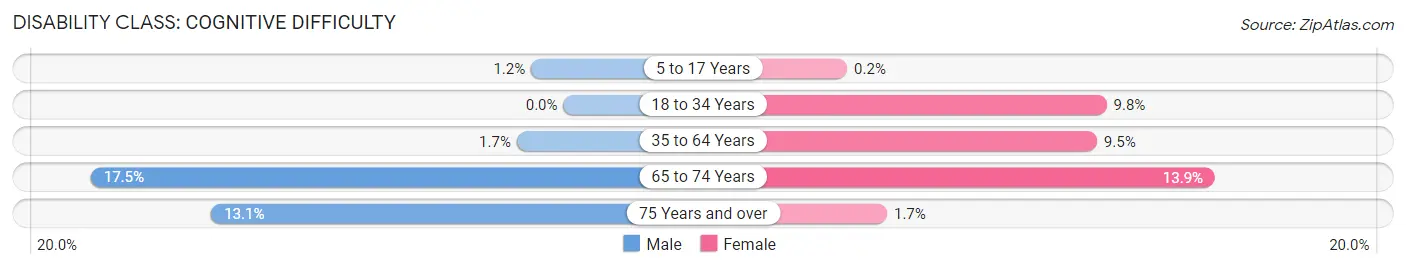
| Age Bracket | Male | Female |
| 5 to 17 Years | 10 (1.2%) | 2 (0.2%) |
| 18 to 34 Years | 0 (0.0%) | 70 (9.8%) |
| 35 to 64 Years | 25 (1.7%) | 193 (9.5%) |
| 65 to 74 Years | 70 (17.5%) | 81 (13.9%) |
| 75 Years and over | 20 (13.1%) | 2 (1.7%) |
Disability Class: Ambulatory Difficulty
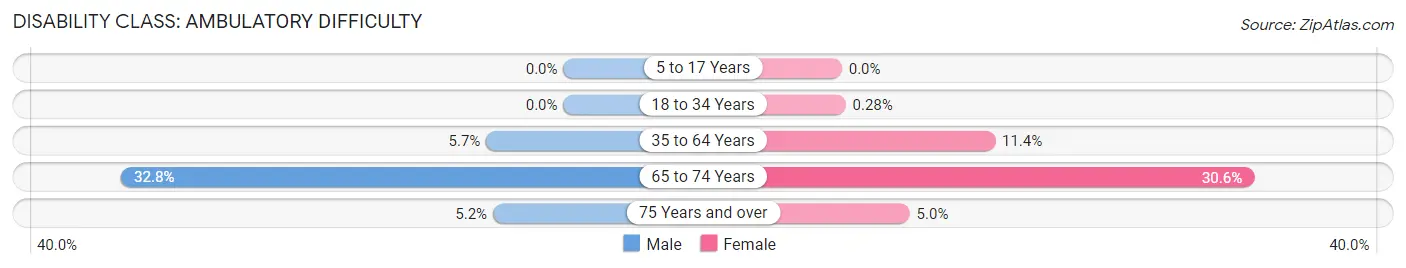
| Age Bracket | Male | Female |
| 5 to 17 Years | 0 (0.0%) | 0 (0.0%) |
| 18 to 34 Years | 0 (0.0%) | 2 (0.3%) |
| 35 to 64 Years | 83 (5.7%) | 232 (11.4%) |
| 65 to 74 Years | 131 (32.8%) | 179 (30.6%) |
| 75 Years and over | 8 (5.2%) | 6 (5.0%) |
Disability Class: Self-Care Difficulty
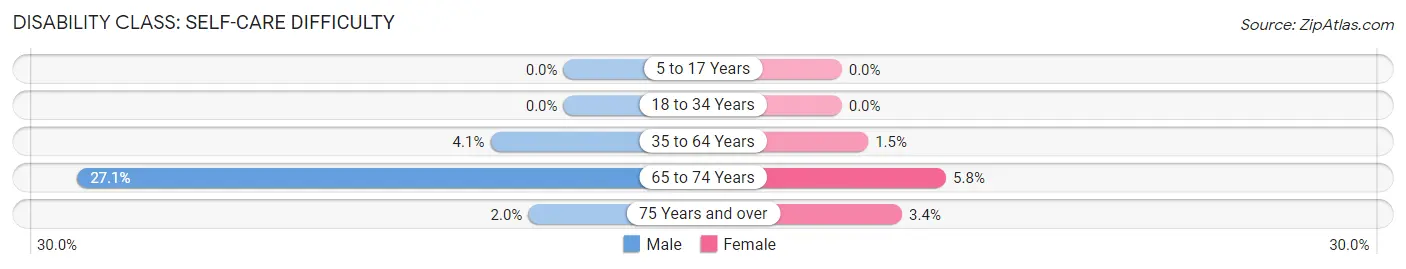
| Age Bracket | Male | Female |
| 5 to 17 Years | 0 (0.0%) | 0 (0.0%) |
| 18 to 34 Years | 0 (0.0%) | 0 (0.0%) |
| 35 to 64 Years | 59 (4.1%) | 30 (1.5%) |
| 65 to 74 Years | 108 (27.1%) | 34 (5.8%) |
| 75 Years and over | 3 (2.0%) | 4 (3.4%) |
Technology Access in Merrydale
Computing Device Access in Merrydale
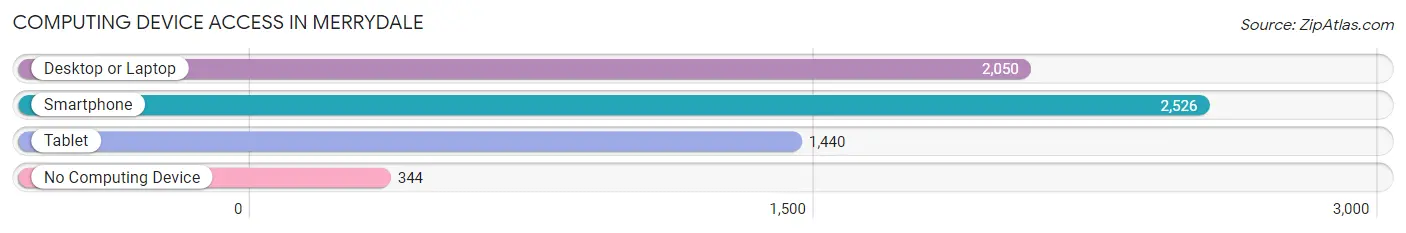
| Device Type | # Households | % Households |
| Desktop or Laptop | 2,050 | 69.6% |
| Smartphone | 2,526 | 85.7% |
| Tablet | 1,440 | 48.9% |
| No Computing Device | 344 | 11.7% |
| Total | 2,947 | 100.0% |
Internet Access in Merrydale
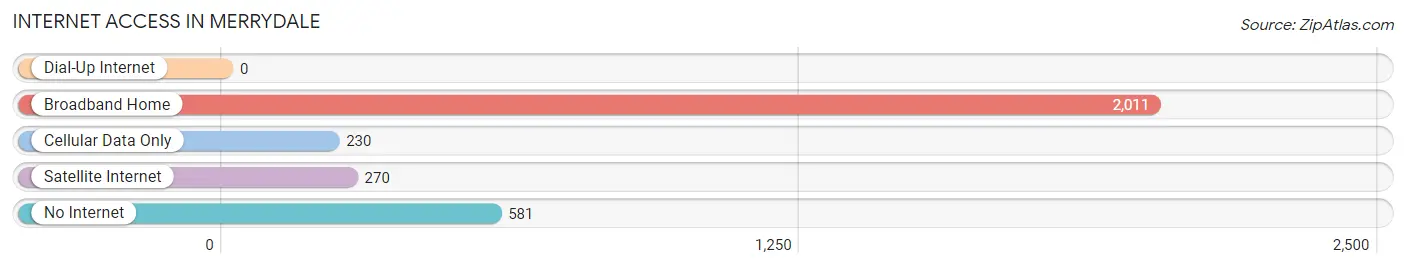
| Internet Type | # Households | % Households |
| Dial-Up Internet | 0 | 0.0% |
| Broadband Home | 2,011 | 68.2% |
| Cellular Data Only | 230 | 7.8% |
| Satellite Internet | 270 | 9.2% |
| No Internet | 581 | 19.7% |
| Total | 2,947 | 100.0% |
Merrydale Summary
Merrydale is a small unincorporated community located in East Baton Rouge Parish, Louisiana. It is situated approximately 10 miles north of Baton Rouge, the state capital. The population of Merrydale was estimated to be 1,845 in 2019.
History
Merrydale was founded in the early 1900s by a group of settlers from the nearby town of Denham Springs. The settlers were looking for a place to call home and found the area to be ideal for farming and raising livestock. The town was named after the Merry family, who were among the first settlers.
The town grew slowly but steadily over the years, and by the 1950s, it had become a thriving community. The town was home to several businesses, including a grocery store, a post office, a bank, and a few churches.
Geography
Merrydale is located in East Baton Rouge Parish, Louisiana. It is situated approximately 10 miles north of Baton Rouge, the state capital. The town is bordered by the Amite River to the east and the Tickfaw River to the west. The town is located in a rural area and is surrounded by farmland and wooded areas.
The climate in Merrydale is humid subtropical, with hot, humid summers and mild winters. The average annual temperature is around 70 degrees Fahrenheit. The average annual precipitation is around 50 inches.
Economy
Merrydale is a small, rural community with a limited economy. The town is home to several small businesses, including a grocery store, a post office, a bank, and a few churches. The town also has a few small manufacturing companies.
The town is also home to a few farms, which produce a variety of crops, including corn, soybeans, and cotton. The town also has a few small restaurants and bars.
Demographics
Merrydale is a small, rural community with a population of 1,845 in 2019. The town is predominantly white, with a small African American population. The median household income is around $45,000. The town has a high rate of poverty, with around 25% of the population living below the poverty line.
Conclusion
Merrydale is a small, rural community located in East Baton Rouge Parish, Louisiana. It is situated approximately 10 miles north of Baton Rouge, the state capital. The town has a population of 1,845 and is predominantly white, with a small African American population. The town has a limited economy, with a few small businesses, farms, and manufacturing companies. The town has a high rate of poverty, with around 25% of the population living below the poverty line.
Common Questions
What is Per Capita Income in Merrydale?
Per Capita income in Merrydale is $23,781.
What is the Median Family Income in Merrydale?
Median Family Income in Merrydale is $48,111.
What is the Median Household income in Merrydale?
Median Household Income in Merrydale is $42,873.
What is Income or Wage Gap in Merrydale?
Income or Wage Gap in Merrydale is 11.4%.
Women in Merrydale earn 88.6 cents for every dollar earned by a man.
What is Inequality or Gini Index in Merrydale?
Inequality or Gini Index in Merrydale is 0.52.
What is the Total Population of Merrydale?
Total Population of Merrydale is 8,557.
What is the Total Male Population of Merrydale?
Total Male Population of Merrydale is 3,754.
What is the Total Female Population of Merrydale?
Total Female Population of Merrydale is 4,803.
What is the Ratio of Males per 100 Females in Merrydale?
There are 78.16 Males per 100 Females in Merrydale.
What is the Ratio of Females per 100 Males in Merrydale?
There are 127.94 Females per 100 Males in Merrydale.
What is the Median Population Age in Merrydale?
Median Population Age in Merrydale is 39.1 Years.
What is the Average Family Size in Merrydale
Average Family Size in Merrydale is 3.3 People.
What is the Average Household Size in Merrydale
Average Household Size in Merrydale is 2.9 People.
How Large is the Labor Force in Merrydale?
There are 3,675 People in the Labor Forcein in Merrydale.
What is the Percentage of People in the Labor Force in Merrydale?
57.3% of People are in the Labor Force in Merrydale.
What is the Unemployment Rate in Merrydale?
Unemployment Rate in Merrydale is 16.6%.