Fort Polk South, LA Map & Demographics
Fort Polk South Map
Fort Polk South Overview
$25,474
PER CAPITA INCOME
$59,176
AVG FAMILY INCOME
$58,077
AVG HOUSEHOLD INCOME
37.2%
WAGE / INCOME GAP [ % ]
62.8¢/ $1
WAGE / INCOME GAP [ $ ]
0.40
INEQUALITY / GINI INDEX
8,327
TOTAL POPULATION
5,035
MALE POPULATION
3,292
FEMALE POPULATION
152.95
MALES / 100 FEMALES
65.38
FEMALES / 100 MALES
22.4
MEDIAN AGE
3.5
AVG FAMILY SIZE
3.0
AVG HOUSEHOLD SIZE
4,512
LABOR FORCE [ PEOPLE ]
78.7%
PERCENT IN LABOR FORCE
1.9%
UNEMPLOYMENT RATE
Income in Fort Polk South
Income Overview in Fort Polk South
Per Capita Income in Fort Polk South is $25,474, while median incomes of families and households are $59,176 and $58,077 respectively.
| Characteristic | Number | Measure |
| Per Capita Income | 8,327 | $25,474 |
| Median Family Income | 1,789 | $59,176 |
| Mean Family Income | 1,789 | $77,966 |
| Median Household Income | 2,268 | $58,077 |
| Mean Household Income | 2,268 | $75,217 |
| Income Deficit | 1,789 | $0 |
| Wage / Income Gap (%) | 8,327 | 37.21% |
| Wage / Income Gap ($) | 8,327 | 62.79¢ per $1 |
| Gini / Inequality Index | 8,327 | 0.40 |
Earnings by Sex in Fort Polk South
Average Earnings in Fort Polk South are $31,286, $35,024 for men and $21,990 for women, a difference of 37.2%.
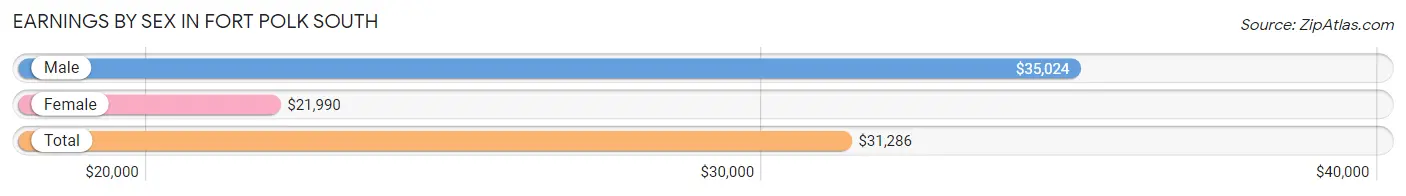
| Sex | Number | Average Earnings |
| Male | 3,536 (76.6%) | $35,024 |
| Female | 1,081 (23.4%) | $21,990 |
| Total | 4,617 (100.0%) | $31,286 |
Earnings by Sex by Income Bracket in Fort Polk South
The most common earnings brackets in Fort Polk South are $25,000 to $29,999 for men (564 | 16.0%) and $25,000 to $29,999 for women (143 | 13.2%).
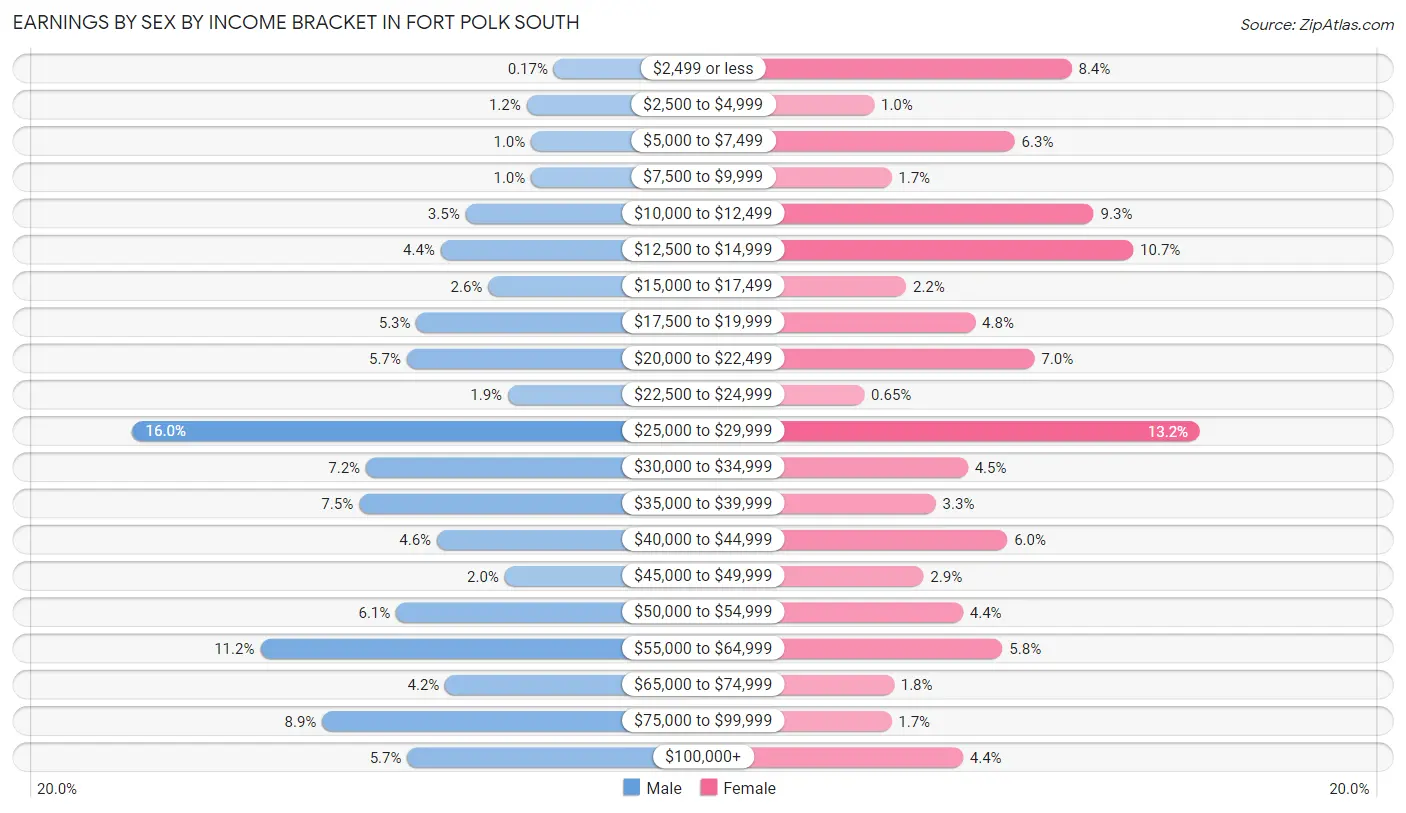
| Income | Male | Female |
| $2,499 or less | 6 (0.2%) | 91 (8.4%) |
| $2,500 to $4,999 | 42 (1.2%) | 11 (1.0%) |
| $5,000 to $7,499 | 36 (1.0%) | 68 (6.3%) |
| $7,500 to $9,999 | 36 (1.0%) | 18 (1.7%) |
| $10,000 to $12,499 | 123 (3.5%) | 100 (9.2%) |
| $12,500 to $14,999 | 156 (4.4%) | 116 (10.7%) |
| $15,000 to $17,499 | 93 (2.6%) | 24 (2.2%) |
| $17,500 to $19,999 | 188 (5.3%) | 52 (4.8%) |
| $20,000 to $22,499 | 201 (5.7%) | 76 (7.0%) |
| $22,500 to $24,999 | 67 (1.9%) | 7 (0.6%) |
| $25,000 to $29,999 | 564 (16.0%) | 143 (13.2%) |
| $30,000 to $34,999 | 255 (7.2%) | 49 (4.5%) |
| $35,000 to $39,999 | 264 (7.5%) | 36 (3.3%) |
| $40,000 to $44,999 | 161 (4.5%) | 65 (6.0%) |
| $45,000 to $49,999 | 71 (2.0%) | 31 (2.9%) |
| $50,000 to $54,999 | 215 (6.1%) | 47 (4.3%) |
| $55,000 to $64,999 | 395 (11.2%) | 63 (5.8%) |
| $65,000 to $74,999 | 150 (4.2%) | 19 (1.8%) |
| $75,000 to $99,999 | 313 (8.8%) | 18 (1.7%) |
| $100,000+ | 200 (5.7%) | 47 (4.3%) |
| Total | 3,536 (100.0%) | 1,081 (100.0%) |
Earnings by Sex by Educational Attainment in Fort Polk South
Average earnings in Fort Polk South are $55,388 for men and $28,358 for women, a difference of 48.8%. Men with an educational attainment of graduate degree enjoy the highest average annual earnings of $101,181, while those with high school diploma education earn the least with $36,938. Women with an educational attainment of college or associate's degree earn the most with the average annual earnings of $43,047, while those with graduate degree education have the smallest earnings of $21,458.
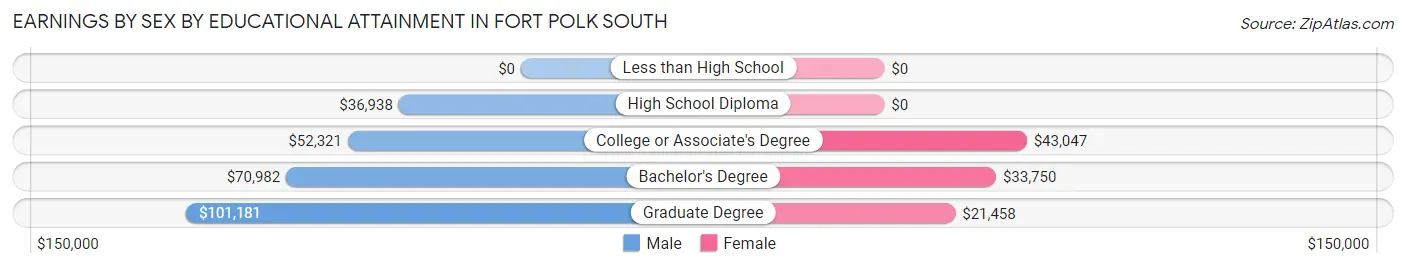
| Educational Attainment | Male Income | Female Income |
| Less than High School | - | - |
| High School Diploma | $36,938 | $0 |
| College or Associate's Degree | $52,321 | $43,047 |
| Bachelor's Degree | $70,982 | $33,750 |
| Graduate Degree | $101,181 | $21,458 |
| Total | $55,388 | $28,358 |
Family Income in Fort Polk South
Family Income Brackets in Fort Polk South
According to the Fort Polk South family income data, there are 458 families falling into the $50,000 to $74,999 income range, which is the most common income bracket and makes up 25.6% of all families. Conversely, the less than $10,000 income bracket is the least frequent group with only 2 families (0.1%) belonging to this category.
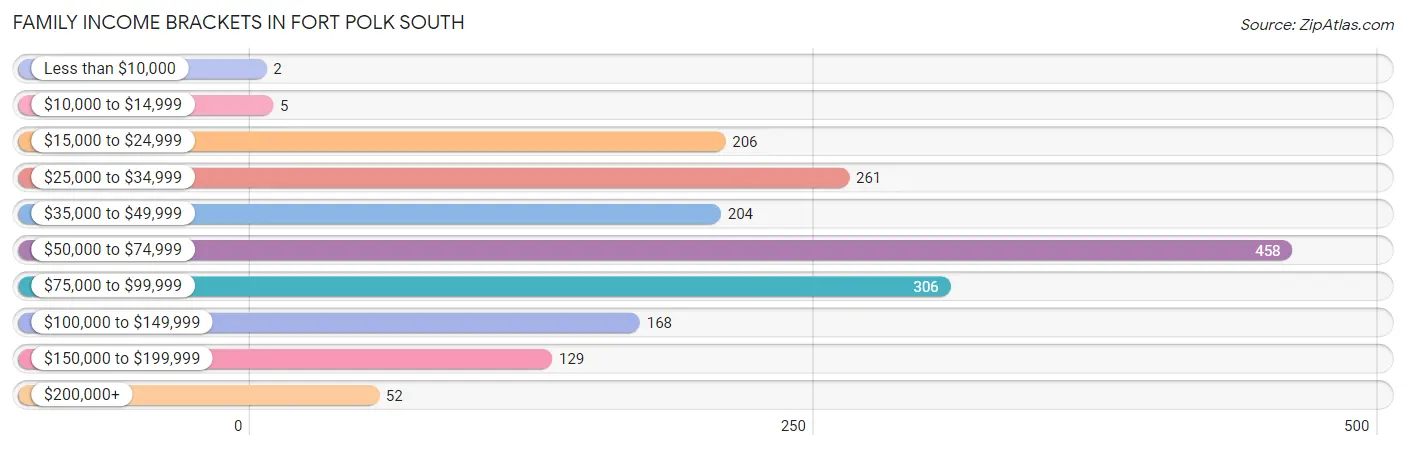
| Income Bracket | # Families | % Families |
| Less than $10,000 | 2 | 0.1% |
| $10,000 to $14,999 | 5 | 0.3% |
| $15,000 to $24,999 | 206 | 11.5% |
| $25,000 to $34,999 | 261 | 14.6% |
| $35,000 to $49,999 | 204 | 11.4% |
| $50,000 to $74,999 | 458 | 25.6% |
| $75,000 to $99,999 | 306 | 17.1% |
| $100,000 to $149,999 | 168 | 9.4% |
| $150,000 to $199,999 | 129 | 7.2% |
| $200,000+ | 52 | 2.9% |
Family Income by Famaliy Size in Fort Polk South
4-person families (367 | 20.5%) account for the highest median family income in Fort Polk South with $66,979 per family, while 2-person families (508 | 28.4%) have the highest median income of $25,090 per family member.
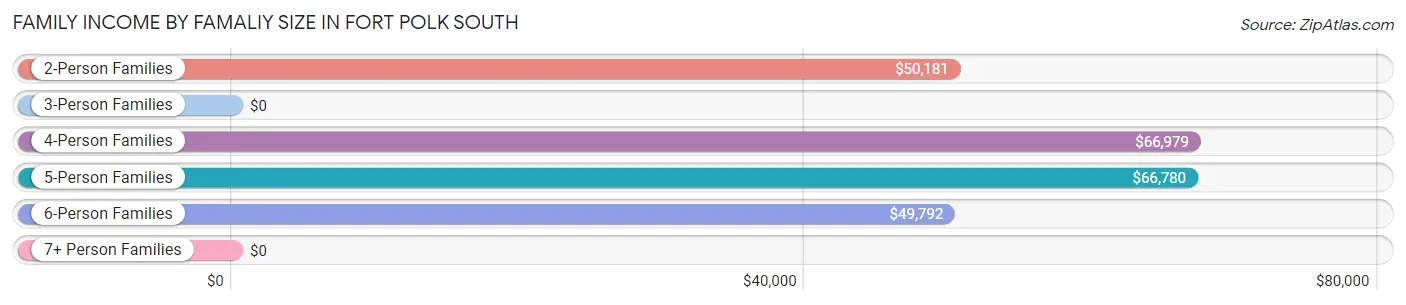
| Income Bracket | # Families | Median Income |
| 2-Person Families | 508 (28.4%) | $50,181 |
| 3-Person Families | 249 (13.9%) | $0 |
| 4-Person Families | 367 (20.5%) | $66,979 |
| 5-Person Families | 514 (28.7%) | $66,780 |
| 6-Person Families | 130 (7.3%) | $49,792 |
| 7+ Person Families | 21 (1.2%) | $0 |
| Total | 1,789 (100.0%) | $59,176 |
Family Income by Number of Earners in Fort Polk South
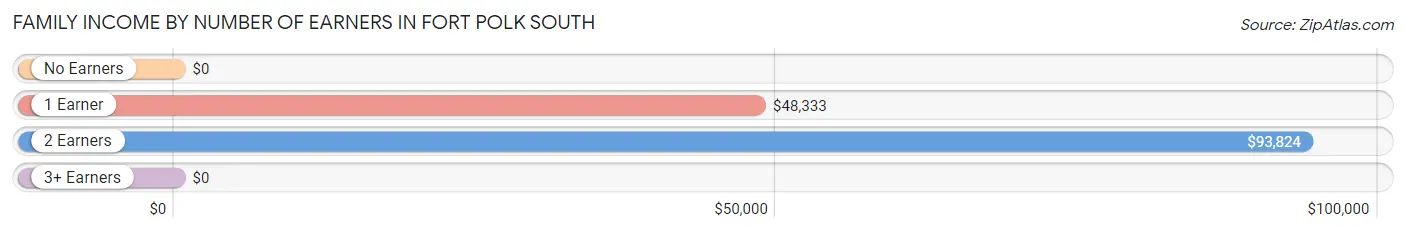
| Number of Earners | # Families | Median Income |
| No Earners | 0 (0.0%) | $0 |
| 1 Earner | 1,016 (56.8%) | $48,333 |
| 2 Earners | 768 (42.9%) | $93,824 |
| 3+ Earners | 5 (0.3%) | $0 |
| Total | 1,789 (100.0%) | $59,176 |
Household Income in Fort Polk South
Household Income Brackets in Fort Polk South
With 685 households falling in the category, the $50,000 to $74,999 income range is the most frequent in Fort Polk South, accounting for 30.2% of all households. In contrast, only 18 households (0.8%) fall into the less than $10,000 income bracket, making it the least populous group.
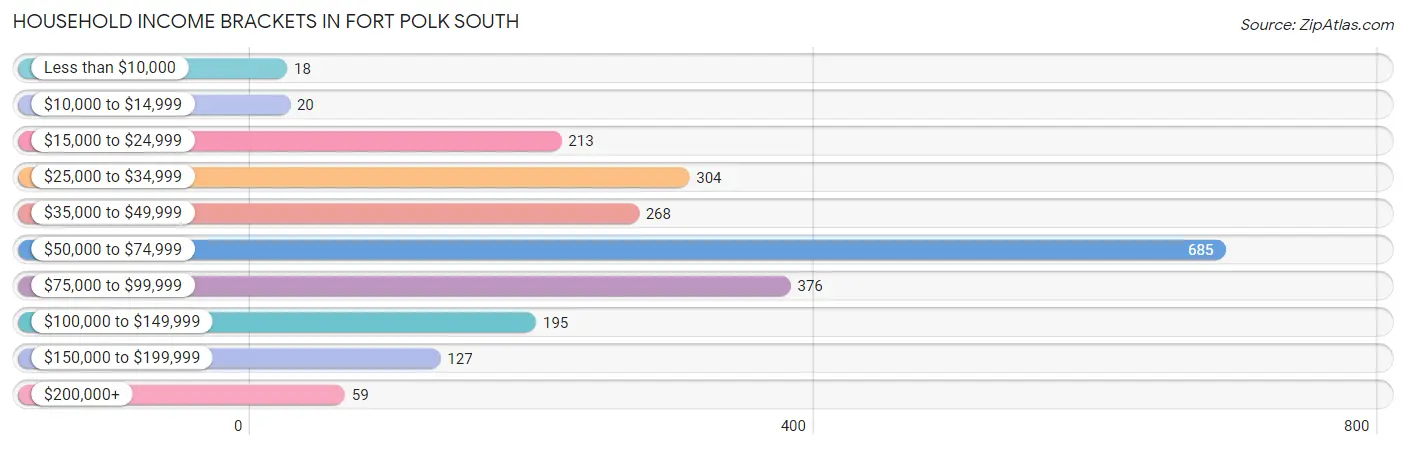
| Income Bracket | # Households | % Households |
| Less than $10,000 | 18 | 0.8% |
| $10,000 to $14,999 | 20 | 0.9% |
| $15,000 to $24,999 | 213 | 9.4% |
| $25,000 to $34,999 | 304 | 13.4% |
| $35,000 to $49,999 | 268 | 11.8% |
| $50,000 to $74,999 | 685 | 30.2% |
| $75,000 to $99,999 | 376 | 16.6% |
| $100,000 to $149,999 | 195 | 8.6% |
| $150,000 to $199,999 | 127 | 5.6% |
| $200,000+ | 59 | 2.6% |
Household Income by Householder Age in Fort Polk South
The median household income in Fort Polk South is $58,077, with the highest median household income of $81,389 found in the 45 to 64 years age bracket for the primary householder. A total of 172 households (7.6%) fall into this category. Meanwhile, the 65+ years age bracket for the primary householder has the lowest median household income of $0, with 9 households (0.4%) in this group.
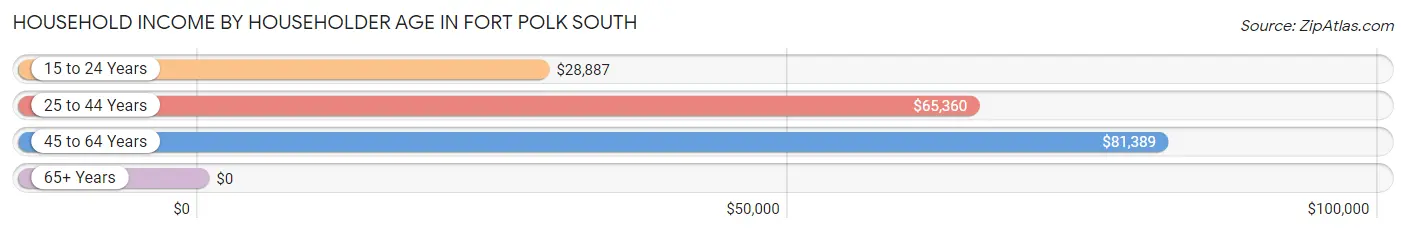
| Income Bracket | # Households | Median Income |
| 15 to 24 Years | 445 (19.6%) | $28,887 |
| 25 to 44 Years | 1,642 (72.4%) | $65,360 |
| 45 to 64 Years | 172 (7.6%) | $81,389 |
| 65+ Years | 9 (0.4%) | $0 |
| Total | 2,268 (100.0%) | $58,077 |
Poverty in Fort Polk South
Income Below Poverty by Sex and Age in Fort Polk South
With 16.8% poverty level for males and 18.7% for females among the residents of Fort Polk South, 65 to 74 year old males and 6 to 11 year old females are the most vulnerable to poverty, with 11 males (100.0%) and 161 females (31.7%) in their respective age groups living below the poverty level.
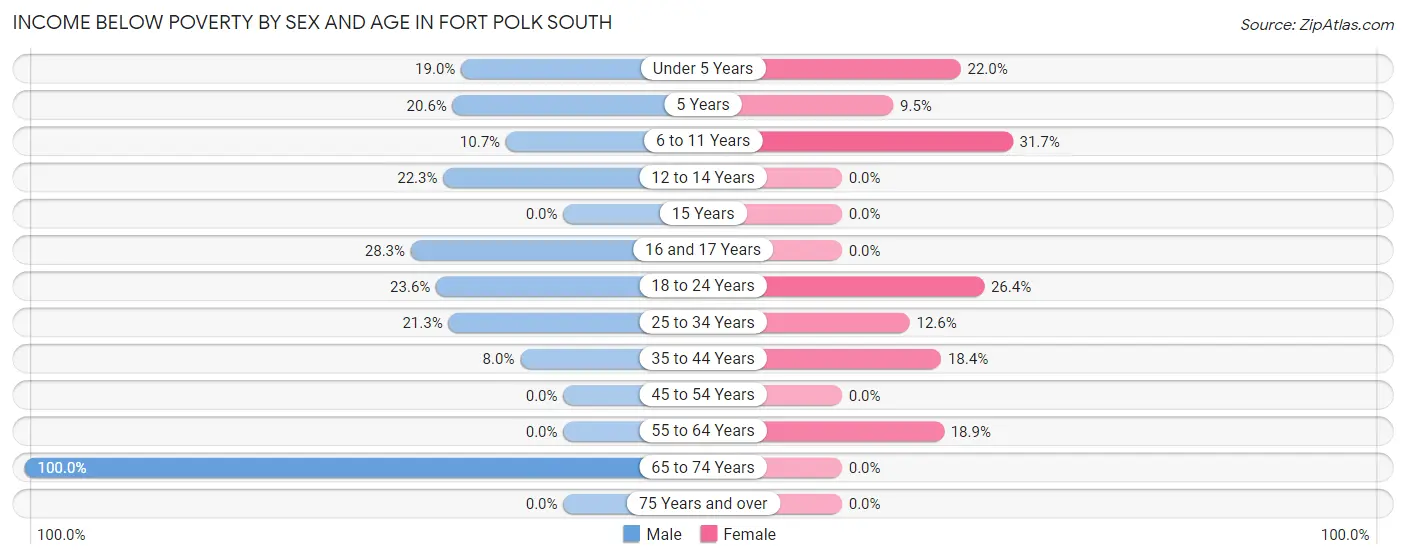
| Age Bracket | Male | Female |
| Under 5 Years | 107 (19.0%) | 106 (22.0%) |
| 5 Years | 15 (20.5%) | 4 (9.5%) |
| 6 to 11 Years | 52 (10.7%) | 161 (31.7%) |
| 12 to 14 Years | 37 (22.3%) | 0 (0.0%) |
| 15 Years | 0 (0.0%) | 0 (0.0%) |
| 16 and 17 Years | 30 (28.3%) | 0 (0.0%) |
| 18 to 24 Years | 98 (23.6%) | 123 (26.4%) |
| 25 to 34 Years | 217 (21.3%) | 87 (12.6%) |
| 35 to 44 Years | 54 (8.0%) | 88 (18.4%) |
| 45 to 54 Years | 0 (0.0%) | 0 (0.0%) |
| 55 to 64 Years | 0 (0.0%) | 7 (18.9%) |
| 65 to 74 Years | 11 (100.0%) | 0 (0.0%) |
| 75 Years and over | 0 (0.0%) | 0 (0.0%) |
| Total | 621 (16.8%) | 576 (18.7%) |
Income Above Poverty by Sex and Age in Fort Polk South
According to the poverty statistics in Fort Polk South, males aged 15 years and females aged 12 to 14 years are the age groups that are most secure financially, with 100.0% of males and 100.0% of females in these age groups living above the poverty line.
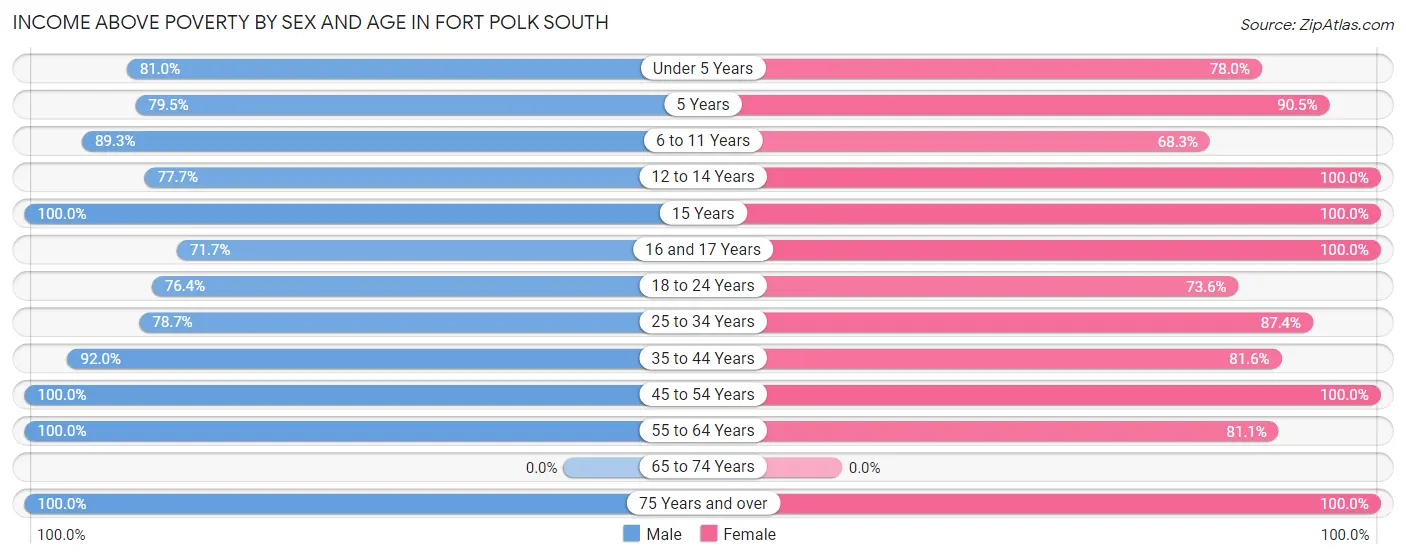
| Age Bracket | Male | Female |
| Under 5 Years | 457 (81.0%) | 375 (78.0%) |
| 5 Years | 58 (79.4%) | 38 (90.5%) |
| 6 to 11 Years | 436 (89.3%) | 347 (68.3%) |
| 12 to 14 Years | 129 (77.7%) | 229 (100.0%) |
| 15 Years | 20 (100.0%) | 23 (100.0%) |
| 16 and 17 Years | 76 (71.7%) | 47 (100.0%) |
| 18 to 24 Years | 317 (76.4%) | 343 (73.6%) |
| 25 to 34 Years | 801 (78.7%) | 605 (87.4%) |
| 35 to 44 Years | 621 (92.0%) | 390 (81.6%) |
| 45 to 54 Years | 113 (100.0%) | 75 (100.0%) |
| 55 to 64 Years | 35 (100.0%) | 30 (81.1%) |
| 65 to 74 Years | 0 (0.0%) | 0 (0.0%) |
| 75 Years and over | 9 (100.0%) | 9 (100.0%) |
| Total | 3,072 (83.2%) | 2,511 (81.3%) |
Income Below Poverty Among Married-Couple Families in Fort Polk South
The poverty statistics for married-couple families in Fort Polk South show that 20.4% or 345 of the total 1,690 families live below the poverty line. Families with 3 or 4 children have the highest poverty rate of 24.4%, comprising of 156 families. On the other hand, families with no children have the lowest poverty rate of 16.1%, which includes 66 families.
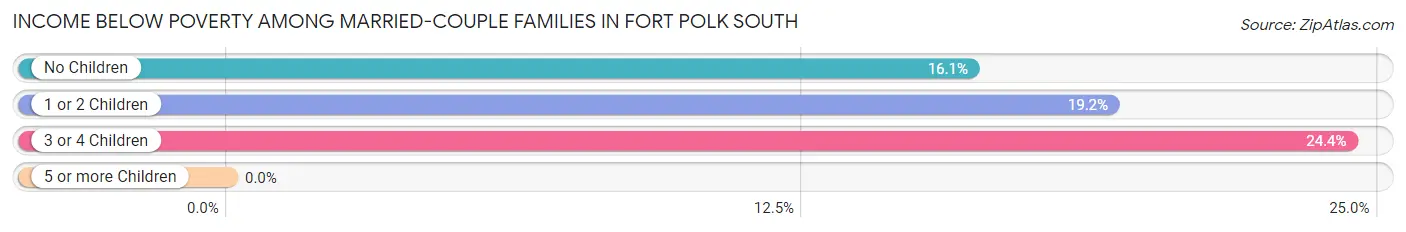
| Children | Above Poverty | Below Poverty |
| No Children | 343 (83.9%) | 66 (16.1%) |
| 1 or 2 Children | 518 (80.8%) | 123 (19.2%) |
| 3 or 4 Children | 484 (75.6%) | 156 (24.4%) |
| 5 or more Children | 0 (0.0%) | 0 (0.0%) |
| Total | 1,345 (79.6%) | 345 (20.4%) |
Income Below Poverty Among Single-Parent Households in Fort Polk South
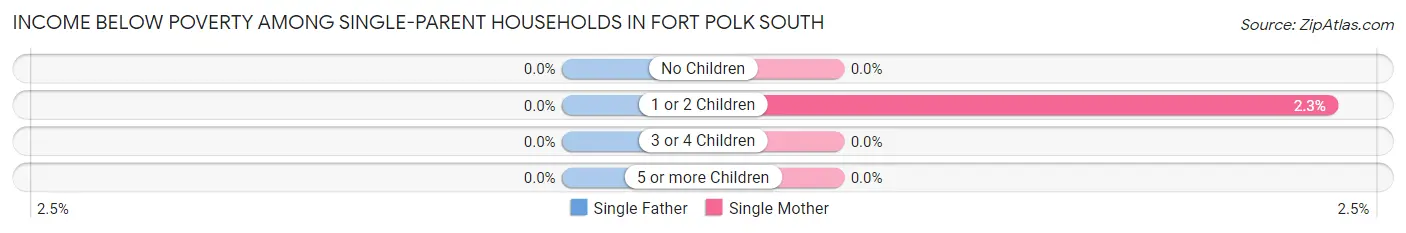
| Children | Single Father | Single Mother |
| No Children | 0 (0.0%) | 0 (0.0%) |
| 1 or 2 Children | 0 (0.0%) | 2 (2.3%) |
| 3 or 4 Children | 0 (0.0%) | 0 (0.0%) |
| 5 or more Children | 0 (0.0%) | 0 (0.0%) |
| Total | 0 (0.0%) | 2 (2.3%) |
Income Below Poverty Among Married-Couple vs Single-Parent Households in Fort Polk South
The poverty data for Fort Polk South shows that 345 of the married-couple family households (20.4%) and 2 of the single-parent households (2.0%) are living below the poverty level. Within the married-couple family households, those with 3 or 4 children have the highest poverty rate, with 156 households (24.4%) falling below the poverty line. Among the single-parent households, those with 1 or 2 children have the highest poverty rate, with 2 household (2.1%) living below poverty.
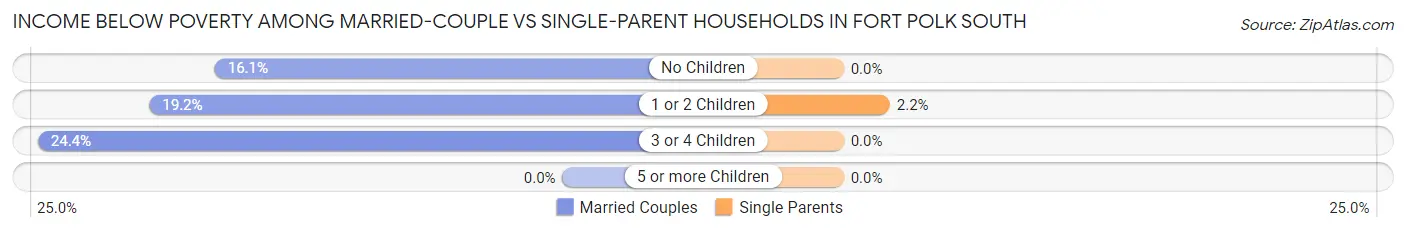
| Children | Married-Couple Families | Single-Parent Households |
| No Children | 66 (16.1%) | 0 (0.0%) |
| 1 or 2 Children | 123 (19.2%) | 2 (2.1%) |
| 3 or 4 Children | 156 (24.4%) | 0 (0.0%) |
| 5 or more Children | 0 (0.0%) | 0 (0.0%) |
| Total | 345 (20.4%) | 2 (2.0%) |
Race in Fort Polk South
The most populous races in Fort Polk South are White / Caucasian (5,016 | 60.2%), Hispanic or Latino (1,739 | 20.9%), and Black / African American (1,569 | 18.8%).
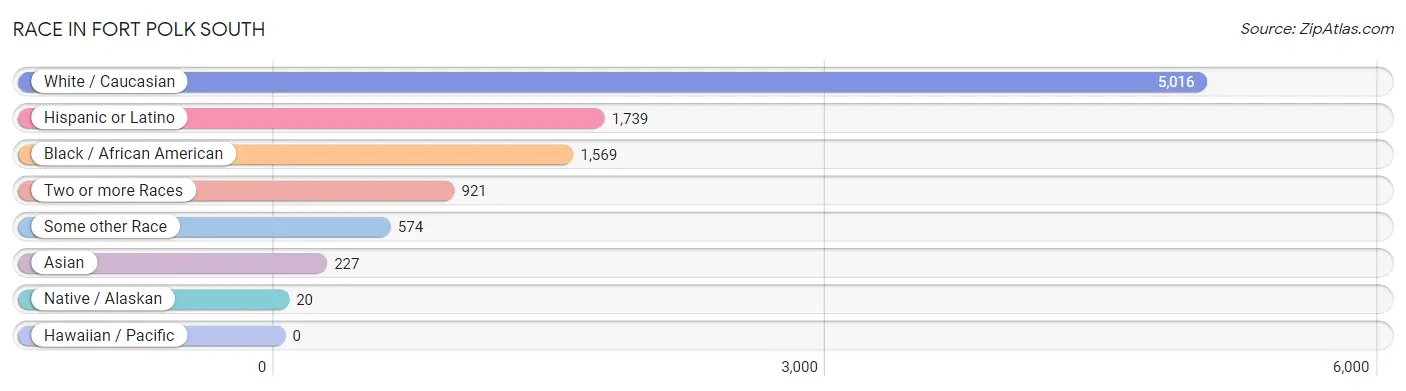
| Race | # Population | % Population |
| Asian | 227 | 2.7% |
| Black / African American | 1,569 | 18.8% |
| Hawaiian / Pacific | 0 | 0.0% |
| Hispanic or Latino | 1,739 | 20.9% |
| Native / Alaskan | 20 | 0.2% |
| White / Caucasian | 5,016 | 60.2% |
| Two or more Races | 921 | 11.1% |
| Some other Race | 574 | 6.9% |
| Total | 8,327 | 100.0% |
Ancestry in Fort Polk South
The most populous ancestries reported in Fort Polk South are Mexican (1,044 | 12.5%), American (998 | 12.0%), Puerto Rican (562 | 6.8%), German (385 | 4.6%), and English (351 | 4.2%), together accounting for 40.1% of all Fort Polk South residents.
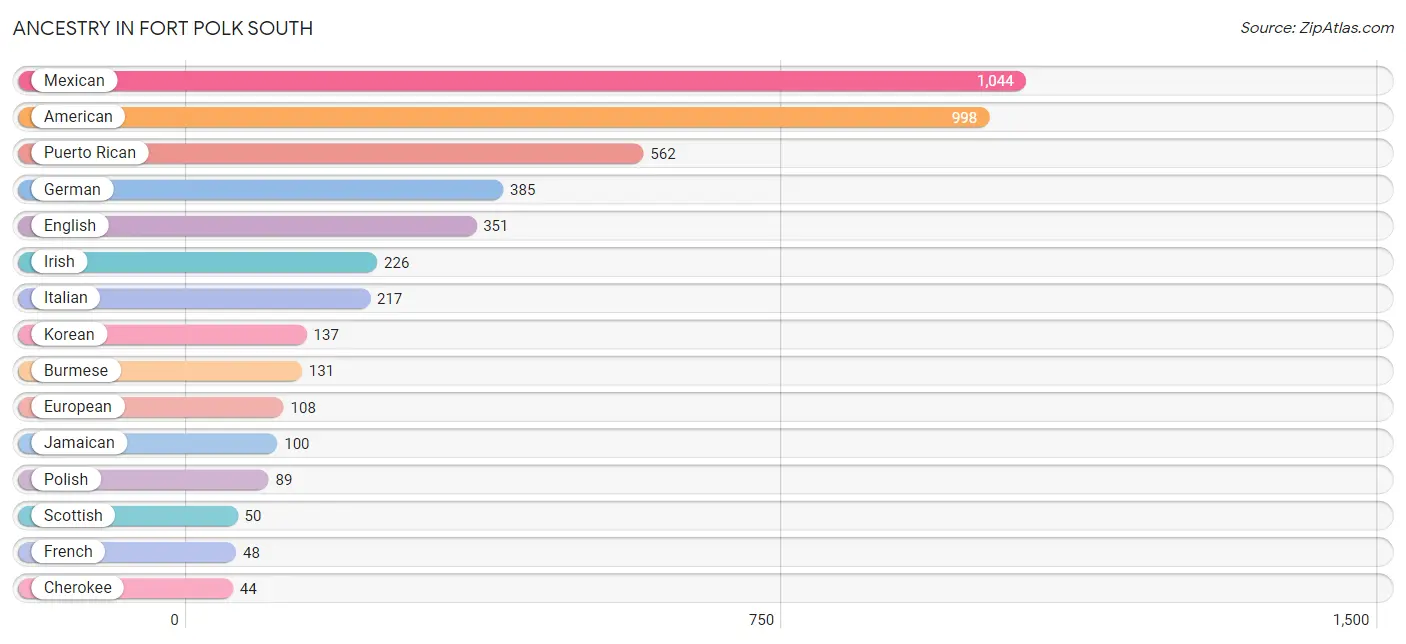
| Ancestry | # Population | % Population |
| African | 36 | 0.4% |
| American | 998 | 12.0% |
| Arab | 7 | 0.1% |
| Armenian | 10 | 0.1% |
| Assyrian / Chaldean / Syriac | 4 | 0.1% |
| Bhutanese | 31 | 0.4% |
| British | 34 | 0.4% |
| Burmese | 131 | 1.6% |
| Cajun | 31 | 0.4% |
| Canadian | 6 | 0.1% |
| Central American | 35 | 0.4% |
| Cherokee | 44 | 0.5% |
| Choctaw | 12 | 0.1% |
| Cuban | 33 | 0.4% |
| Czech | 26 | 0.3% |
| Danish | 14 | 0.2% |
| Dutch | 22 | 0.3% |
| Eastern European | 15 | 0.2% |
| Ecuadorian | 8 | 0.1% |
| English | 351 | 4.2% |
| European | 108 | 1.3% |
| French | 48 | 0.6% |
| French Canadian | 19 | 0.2% |
| German | 385 | 4.6% |
| Guamanian / Chamorro | 17 | 0.2% |
| Honduran | 27 | 0.3% |
| Hungarian | 9 | 0.1% |
| Indian (Asian) | 24 | 0.3% |
| Iranian | 20 | 0.2% |
| Irish | 226 | 2.7% |
| Iroquois | 6 | 0.1% |
| Israeli | 29 | 0.4% |
| Italian | 217 | 2.6% |
| Jamaican | 100 | 1.2% |
| Korean | 137 | 1.7% |
| Lumbee | 4 | 0.1% |
| Mexican | 1,044 | 12.5% |
| Panamanian | 8 | 0.1% |
| Polish | 89 | 1.1% |
| Puerto Rican | 562 | 6.8% |
| Romanian | 20 | 0.2% |
| Russian | 13 | 0.2% |
| Samoan | 22 | 0.3% |
| Scandinavian | 14 | 0.2% |
| Scottish | 50 | 0.6% |
| South American | 17 | 0.2% |
| Subsaharan African | 36 | 0.4% |
| Swedish | 17 | 0.2% |
| Swiss | 8 | 0.1% |
| Thai | 21 | 0.3% |
| Venezuelan | 9 | 0.1% | View All 51 Rows |
Immigrants in Fort Polk South
The most numerous immigrant groups reported in Fort Polk South came from Latin America (260 | 3.1%), Central America (193 | 2.3%), Mexico (193 | 2.3%), Asia (176 | 2.1%), and South Central Asia (83 | 1.0%), together accounting for 10.9% of all Fort Polk South residents.
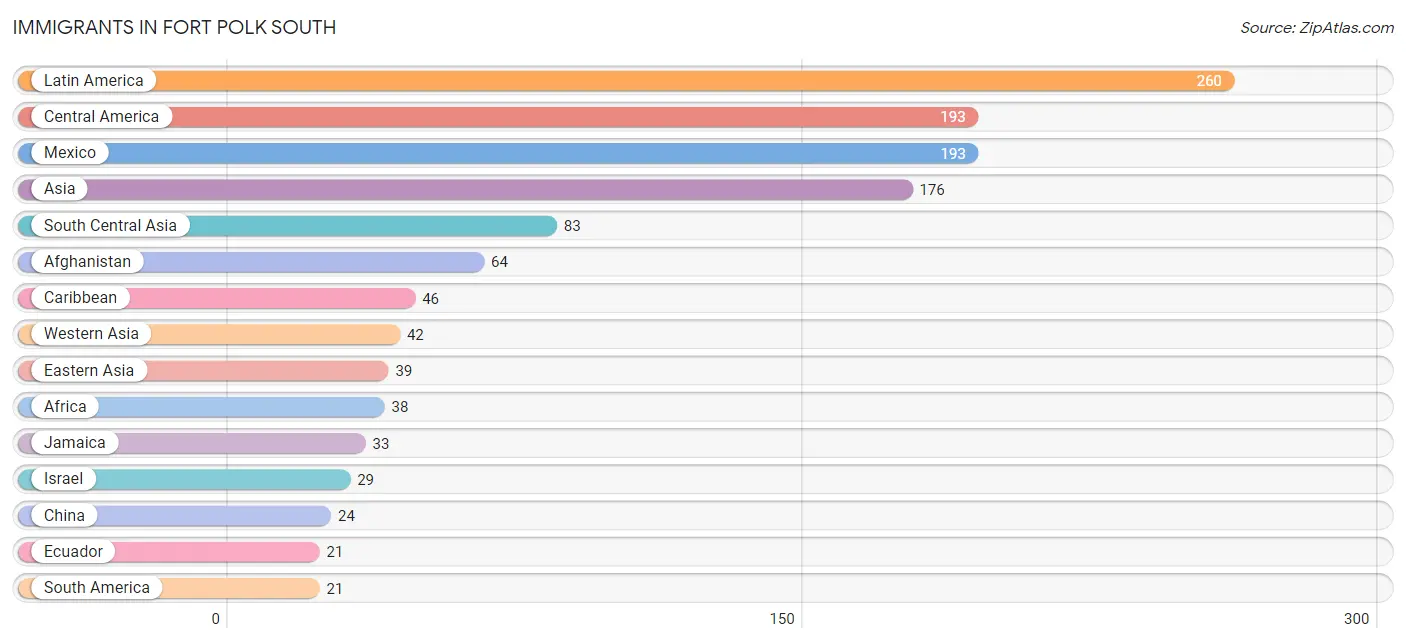
| Immigration Origin | # Population | % Population |
| Afghanistan | 64 | 0.8% |
| Africa | 38 | 0.5% |
| Asia | 176 | 2.1% |
| Caribbean | 46 | 0.5% |
| Central America | 193 | 2.3% |
| China | 24 | 0.3% |
| Cuba | 13 | 0.2% |
| Eastern Asia | 39 | 0.5% |
| Eastern Europe | 9 | 0.1% |
| Ecuador | 21 | 0.3% |
| Europe | 11 | 0.1% |
| Hong Kong | 19 | 0.2% |
| India | 15 | 0.2% |
| Iran | 4 | 0.1% |
| Israel | 29 | 0.4% |
| Italy | 2 | 0.0% |
| Jamaica | 33 | 0.4% |
| Japan | 10 | 0.1% |
| Korea | 5 | 0.1% |
| Latin America | 260 | 3.1% |
| Mexico | 193 | 2.3% |
| Northern Africa | 7 | 0.1% |
| Philippines | 12 | 0.1% |
| South America | 21 | 0.3% |
| South Central Asia | 83 | 1.0% |
| South Eastern Asia | 12 | 0.1% |
| Southern Europe | 2 | 0.0% |
| Ukraine | 9 | 0.1% |
| Western Asia | 42 | 0.5% | View All 29 Rows |
Sex and Age in Fort Polk South
Sex and Age in Fort Polk South
The most populous age groups in Fort Polk South are 20 to 24 Years (1,136 | 22.6%) for men and 20 to 24 Years (533 | 16.2%) for women.
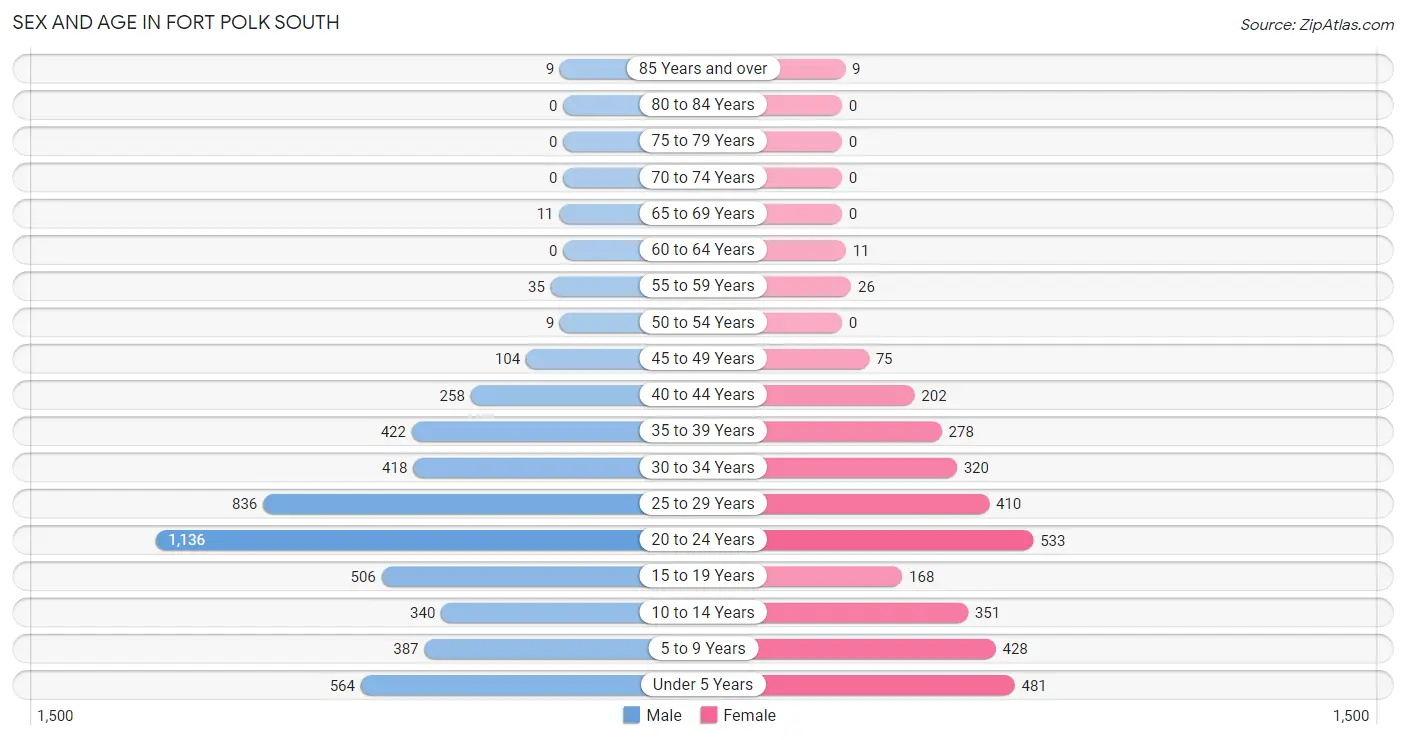
| Age Bracket | Male | Female |
| Under 5 Years | 564 (11.2%) | 481 (14.6%) |
| 5 to 9 Years | 387 (7.7%) | 428 (13.0%) |
| 10 to 14 Years | 340 (6.8%) | 351 (10.7%) |
| 15 to 19 Years | 506 (10.1%) | 168 (5.1%) |
| 20 to 24 Years | 1,136 (22.6%) | 533 (16.2%) |
| 25 to 29 Years | 836 (16.6%) | 410 (12.4%) |
| 30 to 34 Years | 418 (8.3%) | 320 (9.7%) |
| 35 to 39 Years | 422 (8.4%) | 278 (8.4%) |
| 40 to 44 Years | 258 (5.1%) | 202 (6.1%) |
| 45 to 49 Years | 104 (2.1%) | 75 (2.3%) |
| 50 to 54 Years | 9 (0.2%) | 0 (0.0%) |
| 55 to 59 Years | 35 (0.7%) | 26 (0.8%) |
| 60 to 64 Years | 0 (0.0%) | 11 (0.3%) |
| 65 to 69 Years | 11 (0.2%) | 0 (0.0%) |
| 70 to 74 Years | 0 (0.0%) | 0 (0.0%) |
| 75 to 79 Years | 0 (0.0%) | 0 (0.0%) |
| 80 to 84 Years | 0 (0.0%) | 0 (0.0%) |
| 85 Years and over | 9 (0.2%) | 9 (0.3%) |
| Total | 5,035 (100.0%) | 3,292 (100.0%) |
Families and Households in Fort Polk South
Median Family Size in Fort Polk South
The median family size in Fort Polk South is 3.47 persons per family, with married-couple families (1,690 | 94.5%) accounting for the largest median family size of 3.55 persons per family. On the other hand, single male/father families (12 | 0.7%) represent the smallest median family size with 2.00 persons per family.
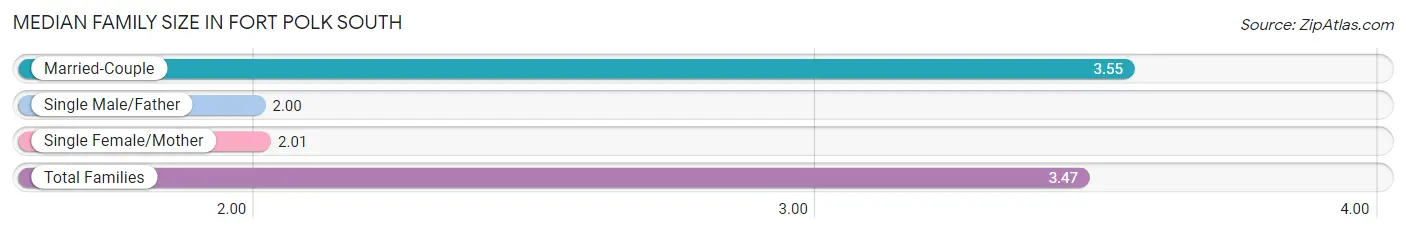
| Family Type | # Families | Family Size |
| Married-Couple | 1,690 (94.5%) | 3.55 |
| Single Male/Father | 12 (0.7%) | 2.00 |
| Single Female/Mother | 87 (4.9%) | 2.01 |
| Total Families | 1,789 (100.0%) | 3.47 |
Median Household Size in Fort Polk South
The median household size in Fort Polk South is 2.99 persons per household, with married-couple households (1,690 | 74.5%) accounting for the largest median household size of 3.55 persons per household. non-family households (479 | 21.1%) represent the smallest median household size with 1.21 persons per household.
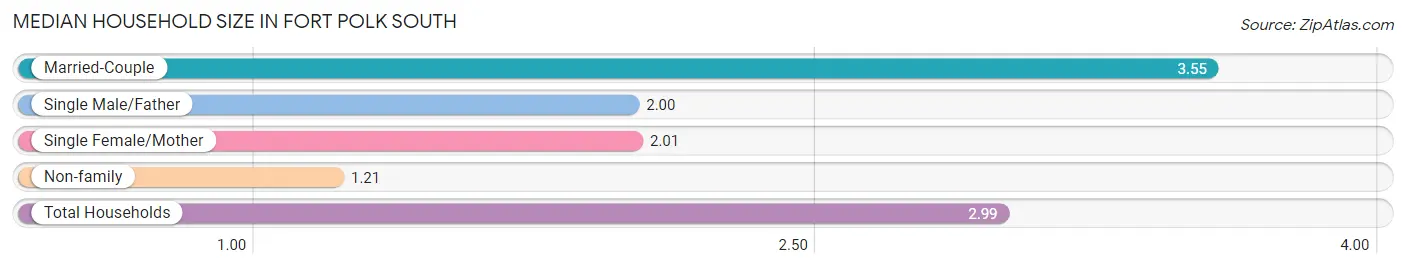
| Household Type | # Households | Household Size |
| Married-Couple | 1,690 (74.5%) | 3.55 |
| Single Male/Father | 12 (0.5%) | 2.00 |
| Single Female/Mother | 87 (3.8%) | 2.01 |
| Non-family | 479 (21.1%) | 1.21 |
| Total Households | 2,268 (100.0%) | 2.99 |
Household Size by Marriage Status in Fort Polk South
Out of a total of 2,268 households in Fort Polk South, 1,789 (78.9%) are family households, while 479 (21.1%) are nonfamily households. The most numerous type of family households are 5-person households, comprising 514, and the most common type of nonfamily households are 1-person households, comprising 425.
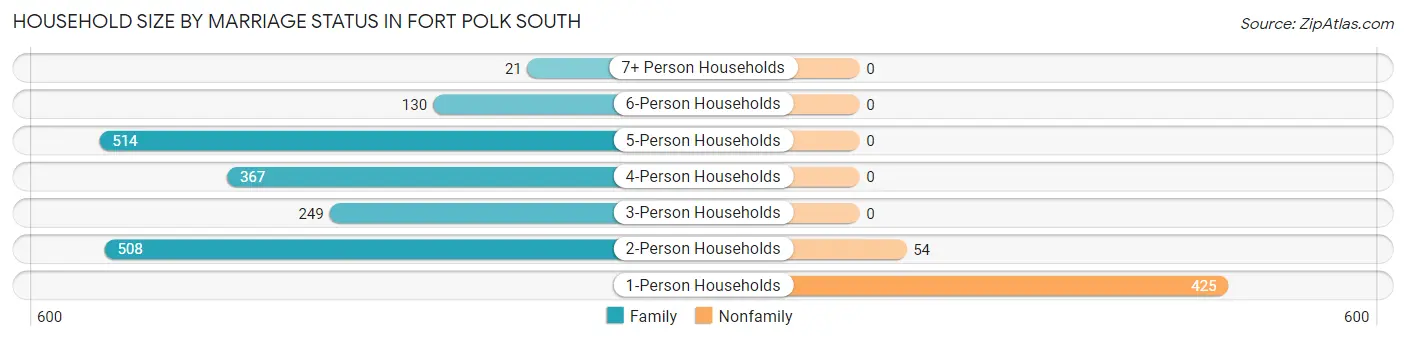
| Household Size | Family Households | Nonfamily Households |
| 1-Person Households | - | 425 (18.7%) |
| 2-Person Households | 508 (22.4%) | 54 (2.4%) |
| 3-Person Households | 249 (11.0%) | 0 (0.0%) |
| 4-Person Households | 367 (16.2%) | 0 (0.0%) |
| 5-Person Households | 514 (22.7%) | 0 (0.0%) |
| 6-Person Households | 130 (5.7%) | 0 (0.0%) |
| 7+ Person Households | 21 (0.9%) | 0 (0.0%) |
| Total | 1,789 (78.9%) | 479 (21.1%) |
Female Fertility in Fort Polk South
Fertility by Age in Fort Polk South
Average fertility rate in Fort Polk South is 109.0 births per 1,000 women. Women in the age bracket of 35 to 50 years have the highest fertility rate with 126.0 births per 1,000 women. Women in the age bracket of 20 to 34 years acount for 67.7% of all women with births.
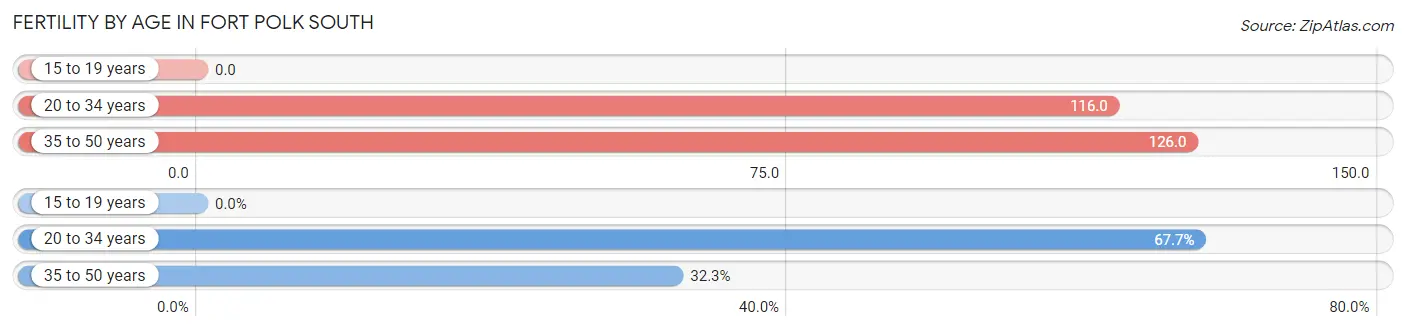
| Age Bracket | Women with Births | Births / 1,000 Women |
| 15 to 19 years | 0 (0.0%) | 0.0 |
| 20 to 34 years | 147 (67.7%) | 116.0 |
| 35 to 50 years | 70 (32.3%) | 126.0 |
| Total | 217 (100.0%) | 109.0 |
Fertility by Age by Marriage Status in Fort Polk South
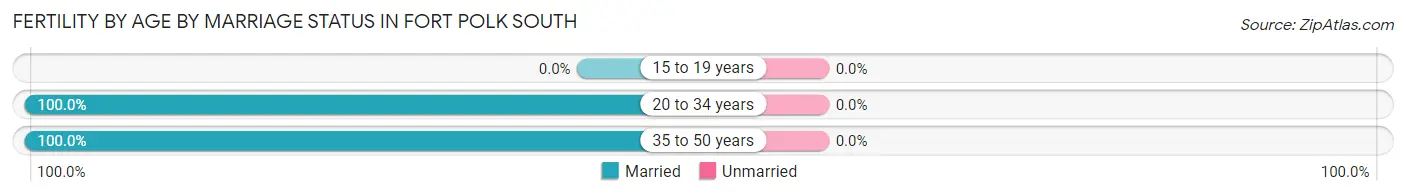
| Age Bracket | Married | Unmarried |
| 15 to 19 years | 0 (0.0%) | 0 (0.0%) |
| 20 to 34 years | 147 (100.0%) | 0 (0.0%) |
| 35 to 50 years | 70 (100.0%) | 0 (0.0%) |
| Total | 217 (100.0%) | 0 (0.0%) |
Fertility by Education in Fort Polk South
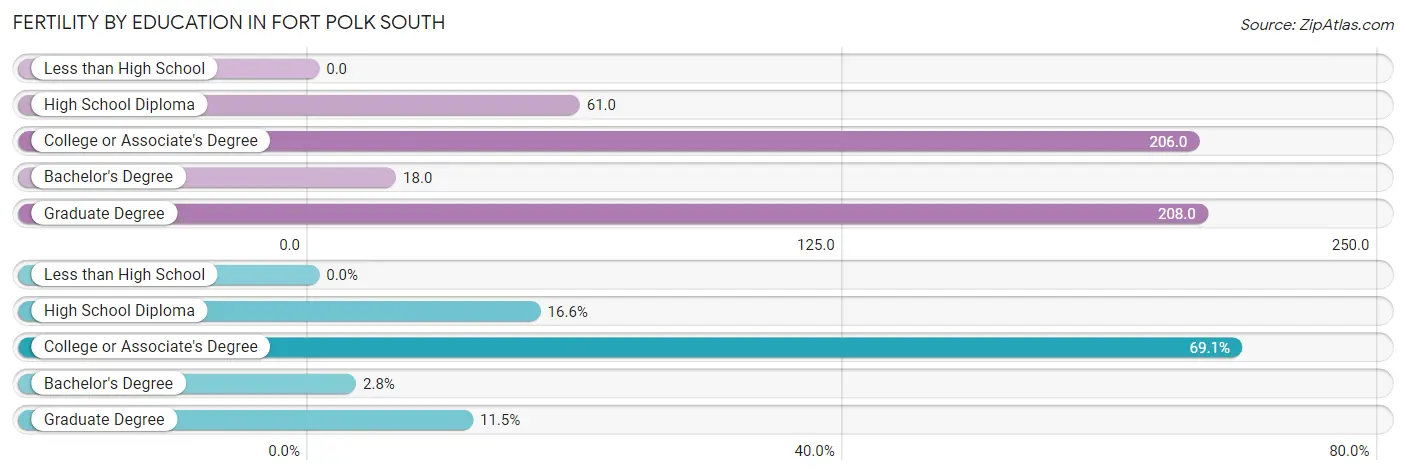
| Educational Attainment | Women with Births | Births / 1,000 Women |
| Less than High School | 0 (0.0%) | 0.0 |
| High School Diploma | 36 (16.6%) | 61.0 |
| College or Associate's Degree | 150 (69.1%) | 206.0 |
| Bachelor's Degree | 6 (2.8%) | 18.0 |
| Graduate Degree | 25 (11.5%) | 208.0 |
| Total | 217 (100.0%) | 109.0 |
Fertility by Education by Marriage Status in Fort Polk South
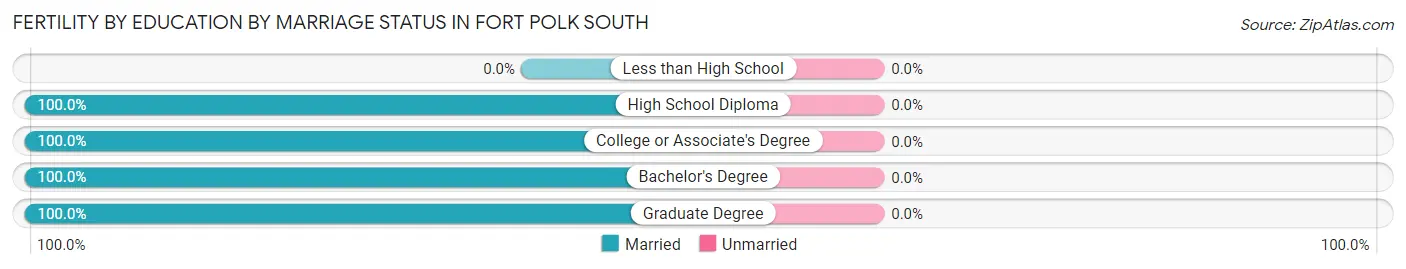
| Educational Attainment | Married | Unmarried |
| Less than High School | 0 (0.0%) | 0 (0.0%) |
| High School Diploma | 36 (100.0%) | 0 (0.0%) |
| College or Associate's Degree | 150 (100.0%) | 0 (0.0%) |
| Bachelor's Degree | 6 (100.0%) | 0 (0.0%) |
| Graduate Degree | 25 (100.0%) | 0 (0.0%) |
| Total | 217 (100.0%) | 0 (0.0%) |
Employment Characteristics in Fort Polk South
Employment by Class of Employer in Fort Polk South
Among the 4,446 employed individuals in Fort Polk South, federal government employees (3,528 | 79.3%), private company employees (782 | 17.6%), and not-for-profit organizations (55 | 1.2%) make up the most common classes of employment.
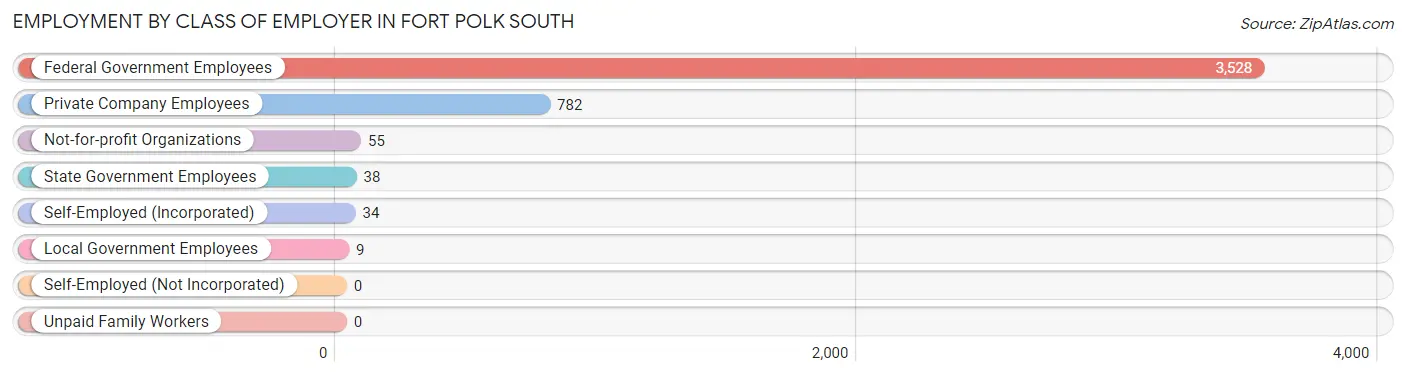
| Employer Class | # Employees | % Employees |
| Private Company Employees | 782 | 17.6% |
| Self-Employed (Incorporated) | 34 | 0.8% |
| Self-Employed (Not Incorporated) | 0 | 0.0% |
| Not-for-profit Organizations | 55 | 1.2% |
| Local Government Employees | 9 | 0.2% |
| State Government Employees | 38 | 0.9% |
| Federal Government Employees | 3,528 | 79.3% |
| Unpaid Family Workers | 0 | 0.0% |
| Total | 4,446 | 100.0% |
Employment Status by Age in Fort Polk South
According to the labor force statistics for Fort Polk South, out of the total population over 16 years of age (5,733), 78.7% or 4,512 individuals are in the labor force, with 1.9% or 86 of them unemployed. The age group with the highest labor force participation rate is 60 to 64 years, with 100.0% or 11 individuals in the labor force. Within the labor force, the 55 to 59 years age range has the highest percentage of unemployed individuals, with 25.0% or 14 of them being unemployed.
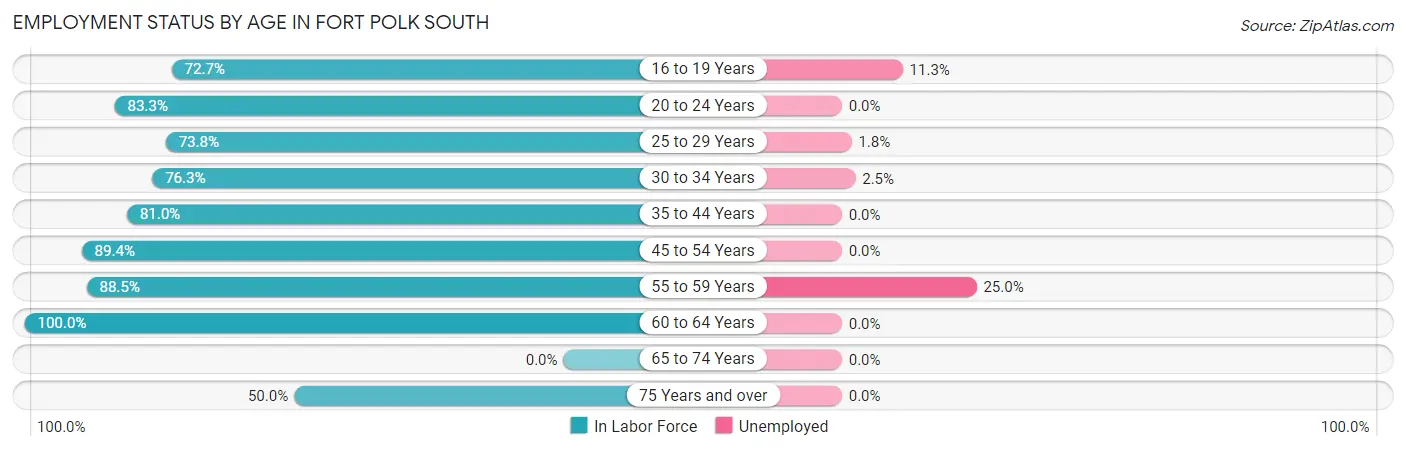
| Age Bracket | In Labor Force | Unemployed |
| 16 to 19 Years | 459 (72.7%) | 52 (11.3%) |
| 20 to 24 Years | 1,390 (83.3%) | 0 (0.0%) |
| 25 to 29 Years | 920 (73.8%) | 17 (1.8%) |
| 30 to 34 Years | 563 (76.3%) | 14 (2.5%) |
| 35 to 44 Years | 940 (81.0%) | 0 (0.0%) |
| 45 to 54 Years | 168 (89.4%) | 0 (0.0%) |
| 55 to 59 Years | 54 (88.5%) | 14 (25.0%) |
| 60 to 64 Years | 11 (100.0%) | 0 (0.0%) |
| 65 to 74 Years | 0 (0.0%) | 0 (0.0%) |
| 75 Years and over | 9 (50.0%) | 0 (0.0%) |
| Total | 4,512 (78.7%) | 86 (1.9%) |
Employment Status by Educational Attainment in Fort Polk South
According to labor force statistics for Fort Polk South, 78.0% of individuals (2,655) out of the total population between 25 and 64 years of age (3,404) are in the labor force, with 1.3% or 35 of them being unemployed. The group with the highest labor force participation rate are those with the educational attainment of bachelor's degree or higher, with 86.3% or 791 individuals in the labor force. Within the labor force, individuals with college / associate degree education have the highest percentage of unemployment, with 2.5% or 32 of them being unemployed.
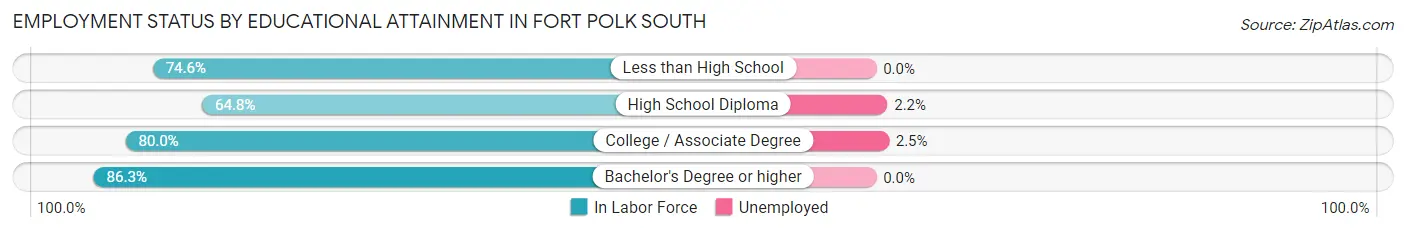
| Educational Attainment | In Labor Force | Unemployed |
| Less than High School | 100 (74.6%) | 0 (0.0%) |
| High School Diploma | 499 (64.8%) | 17 (2.2%) |
| College / Associate Degree | 1,266 (80.0%) | 40 (2.5%) |
| Bachelor's Degree or higher | 791 (86.3%) | 0 (0.0%) |
| Total | 2,655 (78.0%) | 44 (1.3%) |
Employment Occupations by Sex in Fort Polk South
Management, Business, Science and Arts Occupations
The most common Management, Business, Science and Arts occupations in Fort Polk South are Computers, Engineering & Science (129 | 10.8%), Management (126 | 10.5%), Business & Financial (68 | 5.7%), Architecture & Engineering (67 | 5.6%), and Health Diagnosing & Treating (62 | 5.2%).
Management, Business, Science and Arts Occupations by Sex
Within the Management, Business, Science and Arts occupations in Fort Polk South, the most male-oriented occupations are Life, Physical & Social Science (100.0%), Computers & Mathematics (85.7%), and Computers, Engineering & Science (83.7%), while the most female-oriented occupations are Business & Financial (100.0%), Education, Arts & Media (100.0%), and Legal Services & Support (100.0%).
| Occupation | Male | Female |
| Management | 52 (41.3%) | 74 (58.7%) |
| Business & Financial | 0 (0.0%) | 68 (100.0%) |
| Computers, Engineering & Science | 108 (83.7%) | 21 (16.3%) |
| Computers & Mathematics | 42 (85.7%) | 7 (14.3%) |
| Architecture & Engineering | 53 (79.1%) | 14 (20.9%) |
| Life, Physical & Social Science | 13 (100.0%) | 0 (0.0%) |
| Community & Social Service | 2 (4.2%) | 46 (95.8%) |
| Education, Arts & Media | 0 (0.0%) | 3 (100.0%) |
| Legal Services & Support | 0 (0.0%) | 5 (100.0%) |
| Education Instruction & Library | 2 (6.9%) | 27 (93.1%) |
| Arts, Media & Entertainment | 0 (0.0%) | 11 (100.0%) |
| Health Diagnosing & Treating | 6 (9.7%) | 56 (90.3%) |
| Health Technologists | 0 (0.0%) | 39 (100.0%) |
| Total (Category) | 168 (38.8%) | 265 (61.2%) |
| Total (Overall) | 553 (46.2%) | 643 (53.8%) |
Services Occupations
The most common Services occupations in Fort Polk South are Healthcare Support (98 | 8.2%), Security & Protection (50 | 4.2%), Cleaning & Maintenance (45 | 3.8%), Food Preparation & Serving (42 | 3.5%), and Law Enforcement (34 | 2.8%).
Services Occupations by Sex
Within the Services occupations in Fort Polk South, the most male-oriented occupations are Security & Protection (100.0%), Firefighting & Prevention (100.0%), and Law Enforcement (100.0%), while the most female-oriented occupations are Cleaning & Maintenance (100.0%), Personal Care & Service (100.0%), and Healthcare Support (86.7%).
| Occupation | Male | Female |
| Healthcare Support | 13 (13.3%) | 85 (86.7%) |
| Security & Protection | 50 (100.0%) | 0 (0.0%) |
| Firefighting & Prevention | 16 (100.0%) | 0 (0.0%) |
| Law Enforcement | 34 (100.0%) | 0 (0.0%) |
| Food Preparation & Serving | 8 (19.1%) | 34 (80.9%) |
| Cleaning & Maintenance | 0 (0.0%) | 45 (100.0%) |
| Personal Care & Service | 0 (0.0%) | 16 (100.0%) |
| Total (Category) | 71 (28.3%) | 180 (71.7%) |
| Total (Overall) | 553 (46.2%) | 643 (53.8%) |
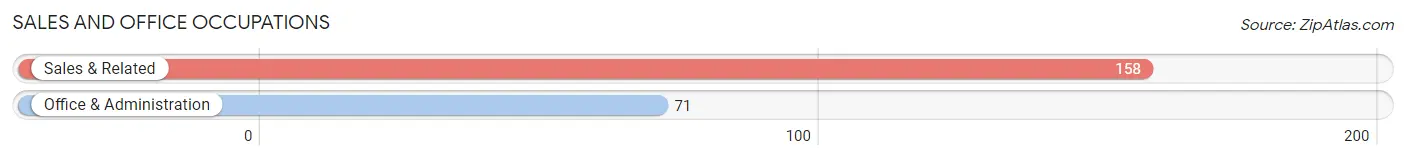
Sales and Office Occupations
The most common Sales and Office occupations in Fort Polk South are Sales & Related (158 | 13.2%), and Office & Administration (71 | 5.9%).
Sales and Office Occupations by Sex
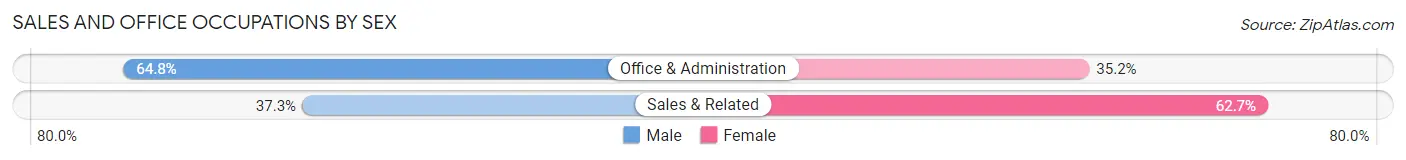
| Occupation | Male | Female |
| Sales & Related | 59 (37.3%) | 99 (62.7%) |
| Office & Administration | 46 (64.8%) | 25 (35.2%) |
| Total (Category) | 105 (45.9%) | 124 (54.1%) |
| Total (Overall) | 553 (46.2%) | 643 (53.8%) |
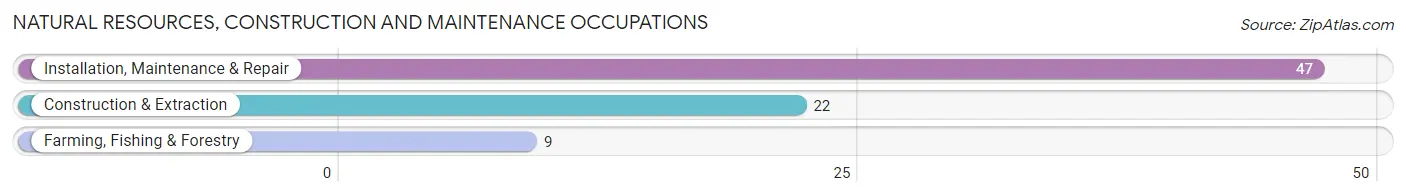
Natural Resources, Construction and Maintenance Occupations
The most common Natural Resources, Construction and Maintenance occupations in Fort Polk South are Installation, Maintenance & Repair (47 | 3.9%), Construction & Extraction (22 | 1.8%), and Farming, Fishing & Forestry (9 | 0.7%).
Natural Resources, Construction and Maintenance Occupations by Sex
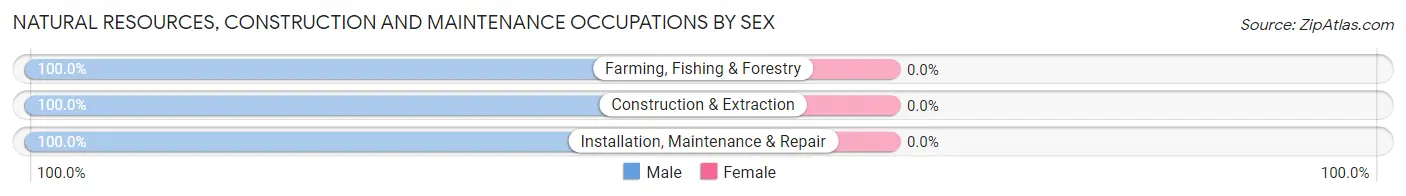
| Occupation | Male | Female |
| Farming, Fishing & Forestry | 9 (100.0%) | 0 (0.0%) |
| Construction & Extraction | 22 (100.0%) | 0 (0.0%) |
| Installation, Maintenance & Repair | 47 (100.0%) | 0 (0.0%) |
| Total (Category) | 78 (100.0%) | 0 (0.0%) |
| Total (Overall) | 553 (46.2%) | 643 (53.8%) |
Production, Transportation and Moving Occupations
The most common Production, Transportation and Moving occupations in Fort Polk South are Material Moving (114 | 9.5%), and Transportation (91 | 7.6%).
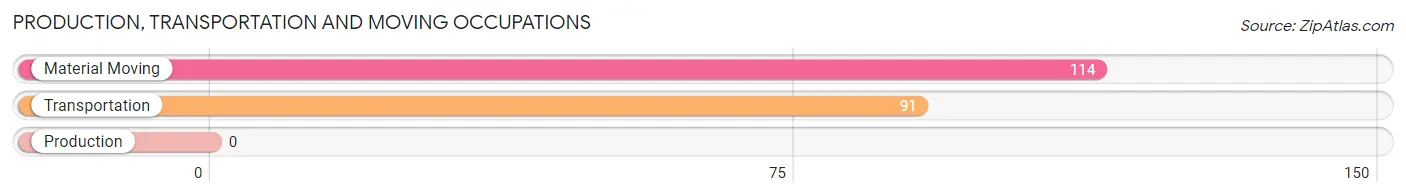
Production, Transportation and Moving Occupations by Sex
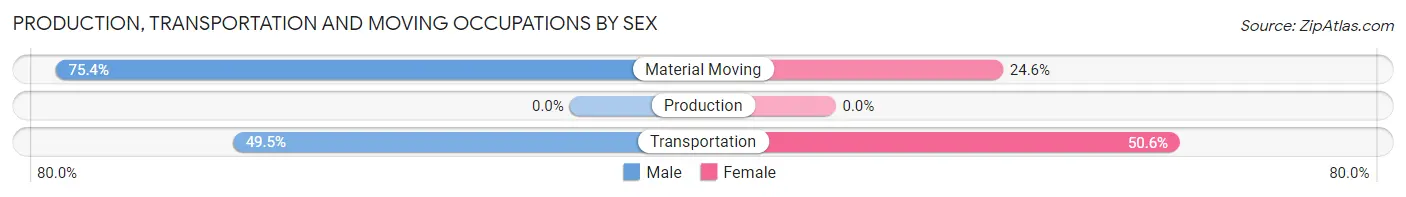
| Occupation | Male | Female |
| Production | 0 (0.0%) | 0 (0.0%) |
| Transportation | 45 (49.4%) | 46 (50.5%) |
| Material Moving | 86 (75.4%) | 28 (24.6%) |
| Total (Category) | 131 (63.9%) | 74 (36.1%) |
| Total (Overall) | 553 (46.2%) | 643 (53.8%) |
Employment Industries by Sex in Fort Polk South
Employment Industries in Fort Polk South
The major employment industries in Fort Polk South include Retail Trade (304 | 25.4%), Public Administration (205 | 17.1%), Professional & Scientific (151 | 12.6%), Accommodation & Food Services (143 | 12.0%), and Health Care & Social Assistance (115 | 9.6%).
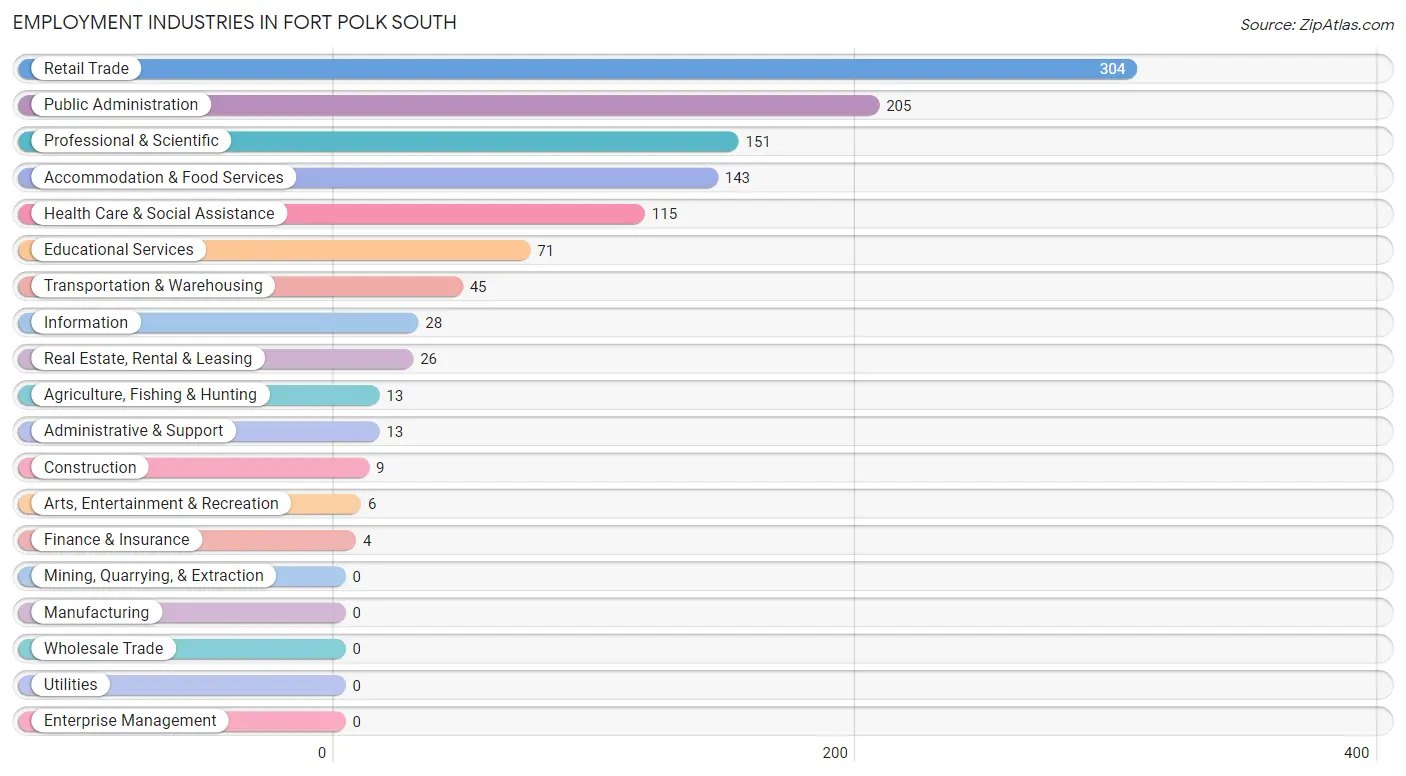
Employment Industries by Sex in Fort Polk South
The Fort Polk South industries that see more men than women are Construction (100.0%), Transportation & Warehousing (100.0%), and Public Administration (91.2%), whereas the industries that tend to have a higher number of women are Finance & Insurance (100.0%), Real Estate, Rental & Leasing (100.0%), and Administrative & Support (100.0%).
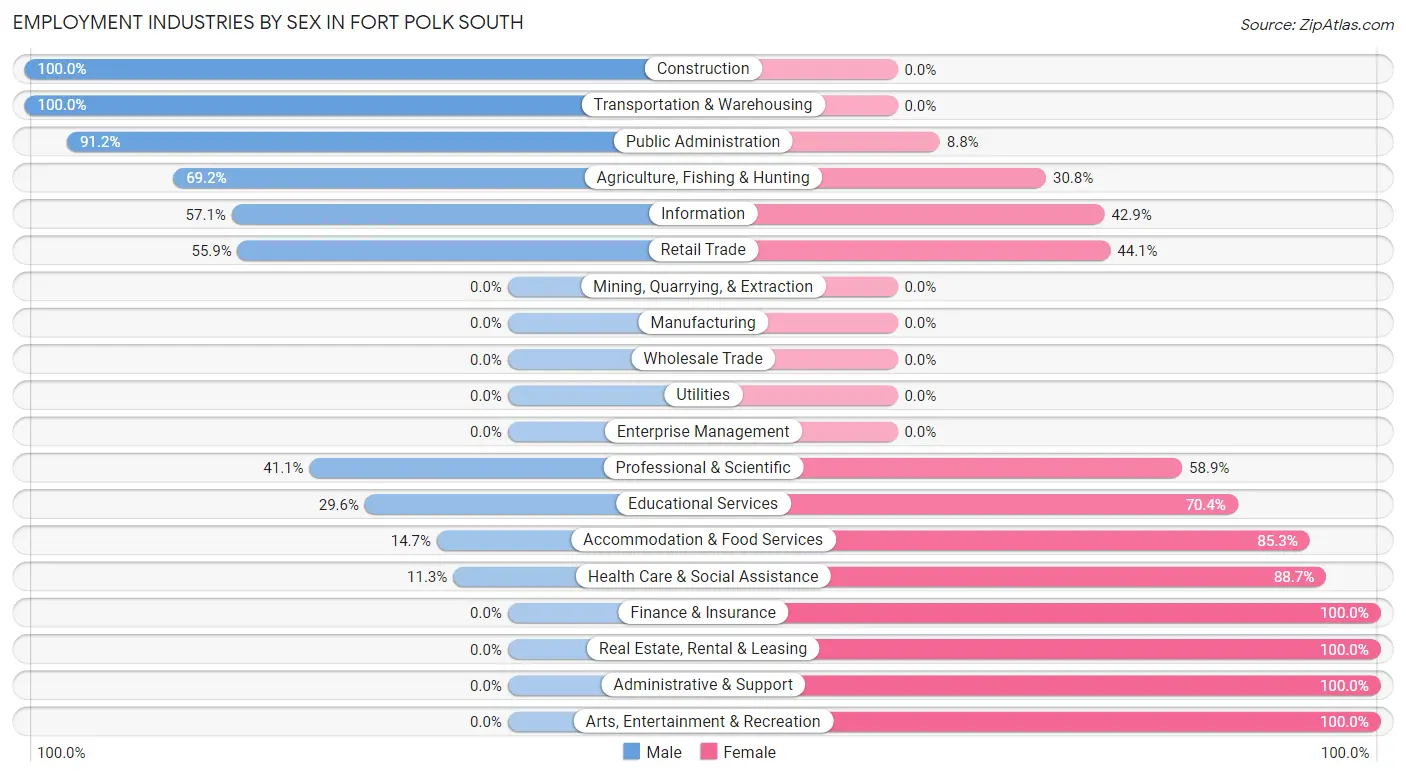
| Industry | Male | Female |
| Agriculture, Fishing & Hunting | 9 (69.2%) | 4 (30.8%) |
| Mining, Quarrying, & Extraction | 0 (0.0%) | 0 (0.0%) |
| Construction | 9 (100.0%) | 0 (0.0%) |
| Manufacturing | 0 (0.0%) | 0 (0.0%) |
| Wholesale Trade | 0 (0.0%) | 0 (0.0%) |
| Retail Trade | 170 (55.9%) | 134 (44.1%) |
| Transportation & Warehousing | 45 (100.0%) | 0 (0.0%) |
| Utilities | 0 (0.0%) | 0 (0.0%) |
| Information | 16 (57.1%) | 12 (42.9%) |
| Finance & Insurance | 0 (0.0%) | 4 (100.0%) |
| Real Estate, Rental & Leasing | 0 (0.0%) | 26 (100.0%) |
| Professional & Scientific | 62 (41.1%) | 89 (58.9%) |
| Enterprise Management | 0 (0.0%) | 0 (0.0%) |
| Administrative & Support | 0 (0.0%) | 13 (100.0%) |
| Educational Services | 21 (29.6%) | 50 (70.4%) |
| Health Care & Social Assistance | 13 (11.3%) | 102 (88.7%) |
| Arts, Entertainment & Recreation | 0 (0.0%) | 6 (100.0%) |
| Accommodation & Food Services | 21 (14.7%) | 122 (85.3%) |
| Public Administration | 187 (91.2%) | 18 (8.8%) |
| Total | 553 (46.2%) | 643 (53.8%) |
Education in Fort Polk South
School Enrollment in Fort Polk South
The most common levels of schooling among the 2,565 students in Fort Polk South are elementary school (700 | 27.3%), college / undergraduate (598 | 23.3%), and middle school (531 | 20.7%).
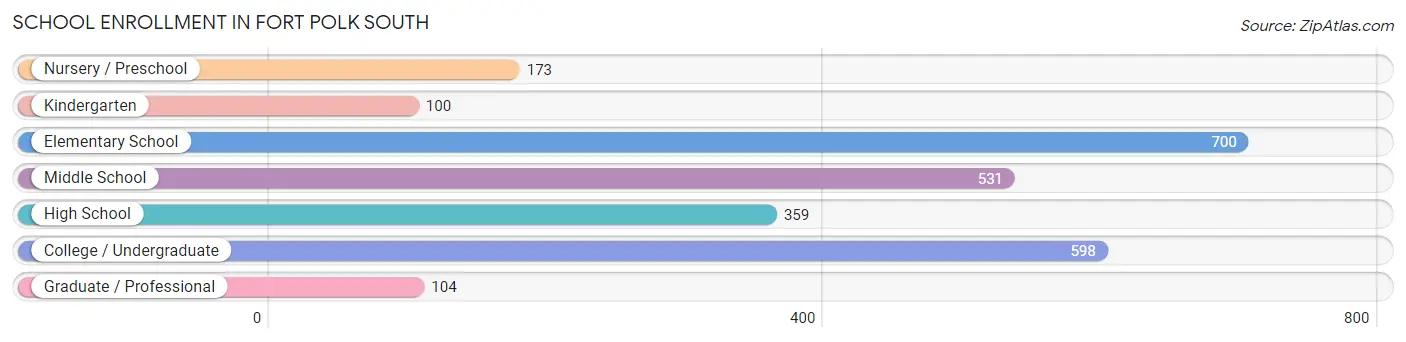
| School Level | # Students | % Students |
| Nursery / Preschool | 173 | 6.7% |
| Kindergarten | 100 | 3.9% |
| Elementary School | 700 | 27.3% |
| Middle School | 531 | 20.7% |
| High School | 359 | 14.0% |
| College / Undergraduate | 598 | 23.3% |
| Graduate / Professional | 104 | 4.1% |
| Total | 2,565 | 100.0% |
School Enrollment by Age by Funding Source in Fort Polk South
Out of a total of 2,565 students who are enrolled in schools in Fort Polk South, 354 (13.8%) attend a private institution, while the remaining 2,211 (86.2%) are enrolled in public schools. The age group of 35 years and over has the highest likelihood of being enrolled in private schools, with 27 (27.3% in the age bracket) enrolled. Conversely, the age group of 18 to 19 year olds has the lowest likelihood of being enrolled in a private school, with 117 (98.3% in the age bracket) attending a public institution.
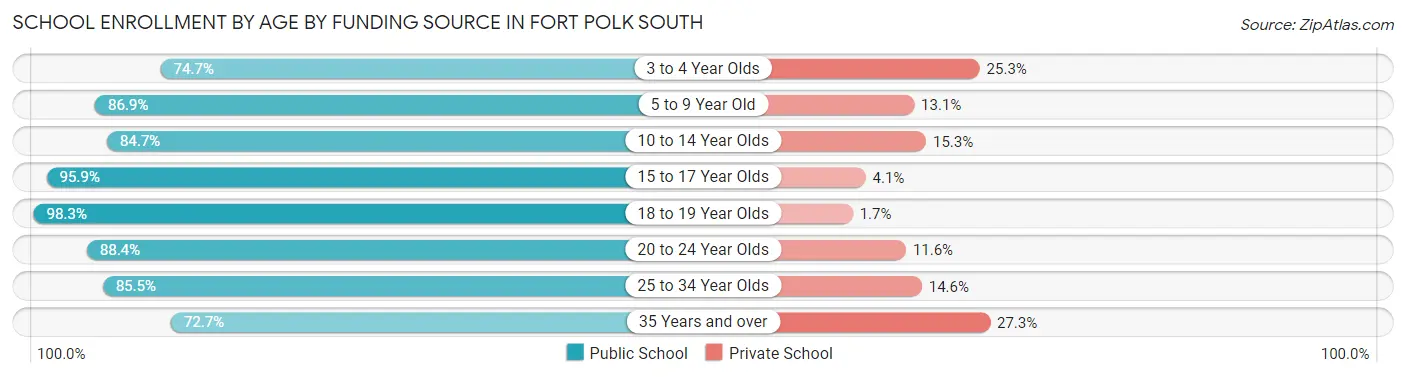
| Age Bracket | Public School | Private School |
| 3 to 4 Year Olds | 112 (74.7%) | 38 (25.3%) |
| 5 to 9 Year Old | 688 (86.9%) | 104 (13.1%) |
| 10 to 14 Year Olds | 585 (84.7%) | 106 (15.3%) |
| 15 to 17 Year Olds | 188 (95.9%) | 8 (4.1%) |
| 18 to 19 Year Olds | 117 (98.3%) | 2 (1.7%) |
| 20 to 24 Year Olds | 221 (88.4%) | 29 (11.6%) |
| 25 to 34 Year Olds | 229 (85.5%) | 39 (14.5%) |
| 35 Years and over | 72 (72.7%) | 27 (27.3%) |
| Total | 2,211 (86.2%) | 354 (13.8%) |
Educational Attainment by Field of Study in Fort Polk South
Social sciences (181 | 17.8%), business (140 | 13.8%), arts & humanities (135 | 13.3%), multidisciplinary studies (93 | 9.2%), and communications (88 | 8.7%) are the most common fields of study among 1,014 individuals in Fort Polk South who have obtained a bachelor's degree or higher.
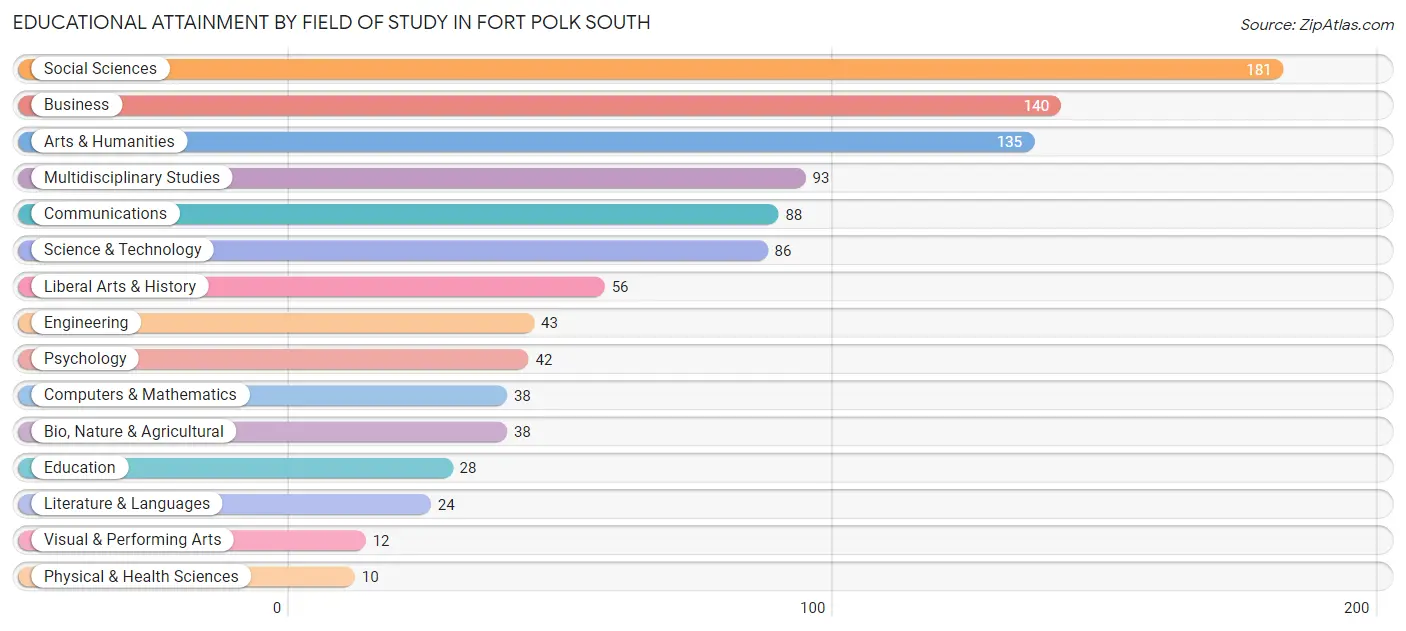
| Field of Study | # Graduates | % Graduates |
| Computers & Mathematics | 38 | 3.7% |
| Bio, Nature & Agricultural | 38 | 3.7% |
| Physical & Health Sciences | 10 | 1.0% |
| Psychology | 42 | 4.1% |
| Social Sciences | 181 | 17.8% |
| Engineering | 43 | 4.2% |
| Multidisciplinary Studies | 93 | 9.2% |
| Science & Technology | 86 | 8.5% |
| Business | 140 | 13.8% |
| Education | 28 | 2.8% |
| Literature & Languages | 24 | 2.4% |
| Liberal Arts & History | 56 | 5.5% |
| Visual & Performing Arts | 12 | 1.2% |
| Communications | 88 | 8.7% |
| Arts & Humanities | 135 | 13.3% |
| Total | 1,014 | 100.0% |
Transportation & Commute in Fort Polk South
Vehicle Availability by Sex in Fort Polk South
The most prevalent vehicle ownership categories in Fort Polk South are males with 2 vehicles (1,408, accounting for 64.1%) and females with 2 vehicles (439, making up 187.7%).
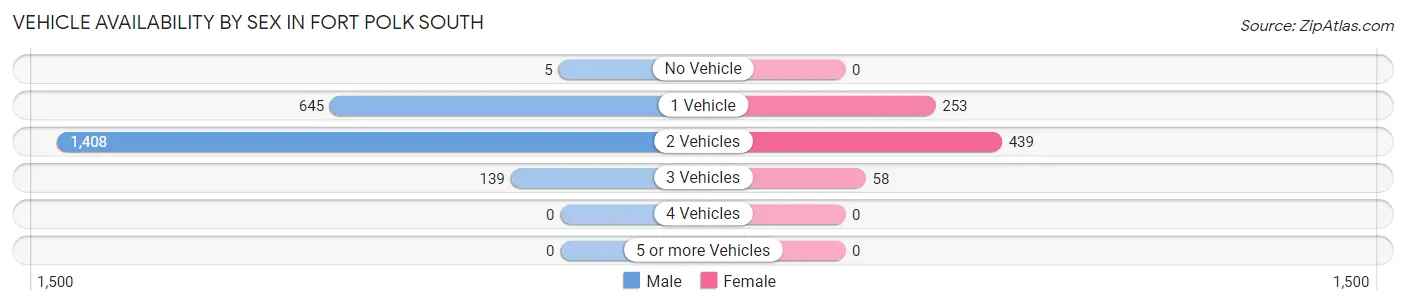
| Vehicles Available | Male | Female |
| No Vehicle | 5 (0.2%) | 0 (0.0%) |
| 1 Vehicle | 645 (29.4%) | 253 (33.7%) |
| 2 Vehicles | 1,408 (64.1%) | 439 (58.5%) |
| 3 Vehicles | 139 (6.3%) | 58 (7.7%) |
| 4 Vehicles | 0 (0.0%) | 0 (0.0%) |
| 5 or more Vehicles | 0 (0.0%) | 0 (0.0%) |
| Total | 2,197 (100.0%) | 750 (100.0%) |
Commute Time in Fort Polk South
The most frequently occuring commute durations in Fort Polk South are 5 to 9 minutes (1,410 commuters, 37.2%), 10 to 14 minutes (1,023 commuters, 27.0%), and 15 to 19 minutes (652 commuters, 17.2%).
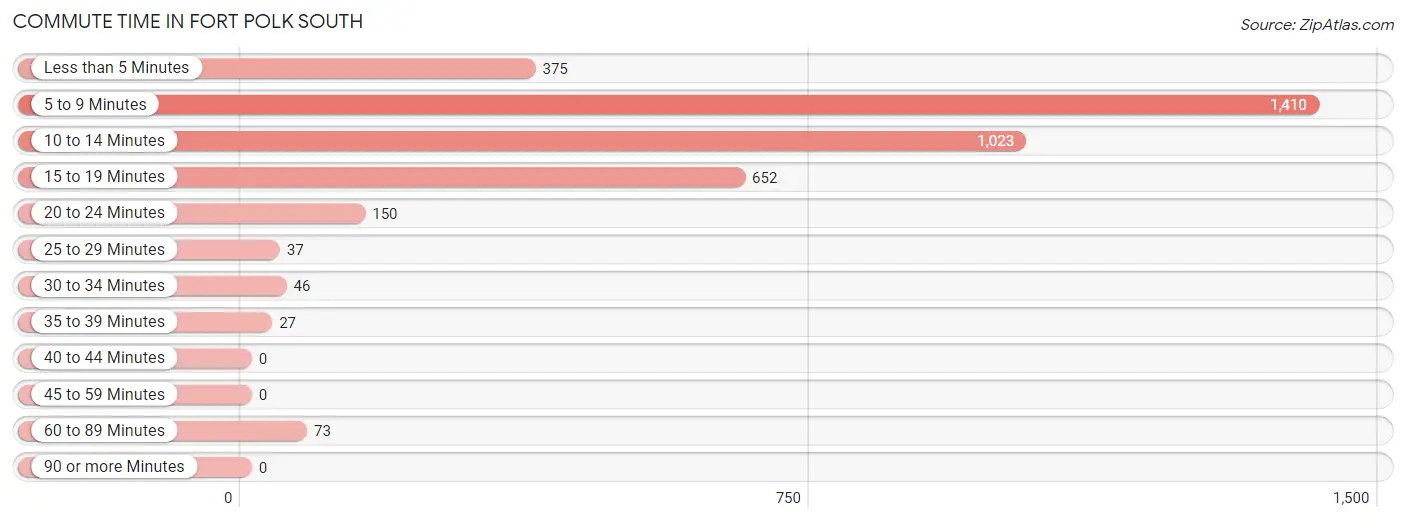
| Commute Time | # Commuters | % Commuters |
| Less than 5 Minutes | 375 | 9.9% |
| 5 to 9 Minutes | 1,410 | 37.2% |
| 10 to 14 Minutes | 1,023 | 27.0% |
| 15 to 19 Minutes | 652 | 17.2% |
| 20 to 24 Minutes | 150 | 4.0% |
| 25 to 29 Minutes | 37 | 1.0% |
| 30 to 34 Minutes | 46 | 1.2% |
| 35 to 39 Minutes | 27 | 0.7% |
| 40 to 44 Minutes | 0 | 0.0% |
| 45 to 59 Minutes | 0 | 0.0% |
| 60 to 89 Minutes | 73 | 1.9% |
| 90 or more Minutes | 0 | 0.0% |
Commute Time by Sex in Fort Polk South
The most common commute times in Fort Polk South are 5 to 9 minutes (1,221 commuters, 40.4%) for males and 5 to 9 minutes (189 commuters, 24.5%) for females.
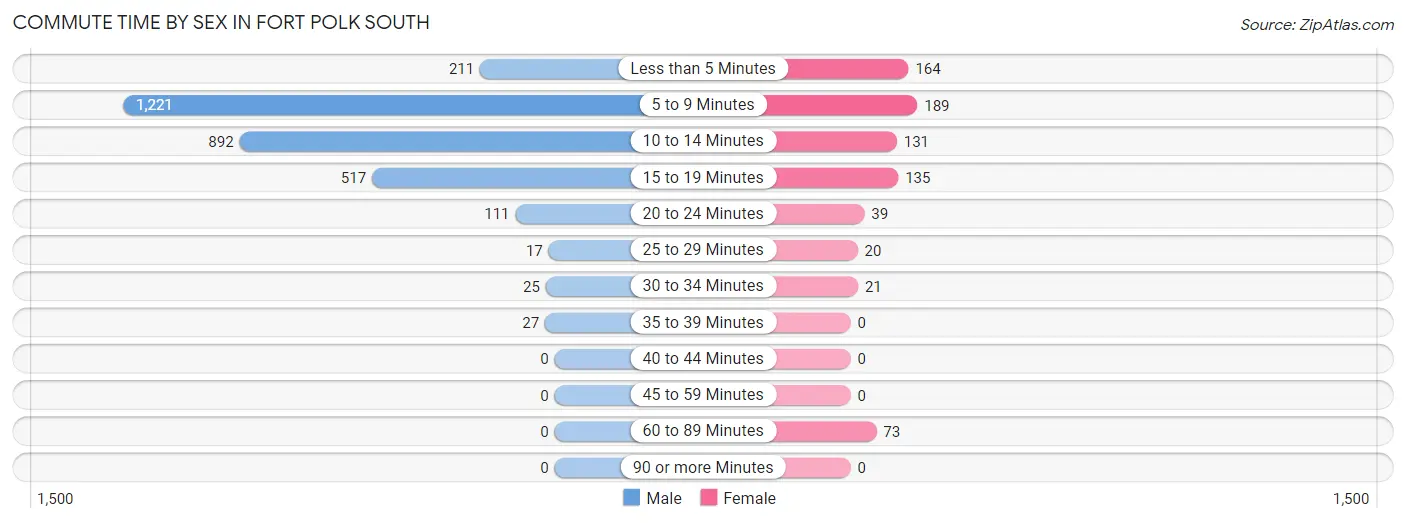
| Commute Time | Male | Female |
| Less than 5 Minutes | 211 (7.0%) | 164 (21.2%) |
| 5 to 9 Minutes | 1,221 (40.4%) | 189 (24.5%) |
| 10 to 14 Minutes | 892 (29.5%) | 131 (17.0%) |
| 15 to 19 Minutes | 517 (17.1%) | 135 (17.5%) |
| 20 to 24 Minutes | 111 (3.7%) | 39 (5.1%) |
| 25 to 29 Minutes | 17 (0.6%) | 20 (2.6%) |
| 30 to 34 Minutes | 25 (0.8%) | 21 (2.7%) |
| 35 to 39 Minutes | 27 (0.9%) | 0 (0.0%) |
| 40 to 44 Minutes | 0 (0.0%) | 0 (0.0%) |
| 45 to 59 Minutes | 0 (0.0%) | 0 (0.0%) |
| 60 to 89 Minutes | 0 (0.0%) | 73 (9.5%) |
| 90 or more Minutes | 0 (0.0%) | 0 (0.0%) |
Time of Departure to Work by Sex in Fort Polk South
The most frequent times of departure to work in Fort Polk South are 6:00 AM to 6:29 AM (775, 25.7%) for males and 6:00 AM to 6:29 AM (167, 21.6%) for females.
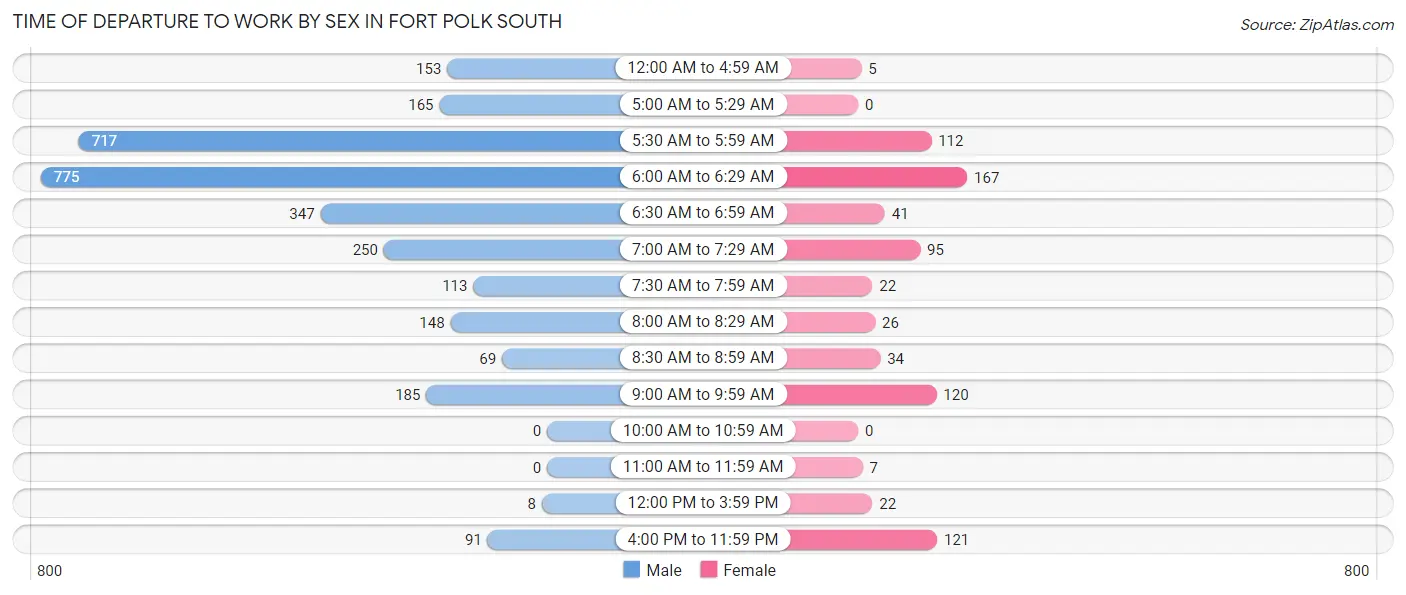
| Time of Departure | Male | Female |
| 12:00 AM to 4:59 AM | 153 (5.1%) | 5 (0.6%) |
| 5:00 AM to 5:29 AM | 165 (5.5%) | 0 (0.0%) |
| 5:30 AM to 5:59 AM | 717 (23.7%) | 112 (14.5%) |
| 6:00 AM to 6:29 AM | 775 (25.7%) | 167 (21.6%) |
| 6:30 AM to 6:59 AM | 347 (11.5%) | 41 (5.3%) |
| 7:00 AM to 7:29 AM | 250 (8.3%) | 95 (12.3%) |
| 7:30 AM to 7:59 AM | 113 (3.7%) | 22 (2.9%) |
| 8:00 AM to 8:29 AM | 148 (4.9%) | 26 (3.4%) |
| 8:30 AM to 8:59 AM | 69 (2.3%) | 34 (4.4%) |
| 9:00 AM to 9:59 AM | 185 (6.1%) | 120 (15.5%) |
| 10:00 AM to 10:59 AM | 0 (0.0%) | 0 (0.0%) |
| 11:00 AM to 11:59 AM | 0 (0.0%) | 7 (0.9%) |
| 12:00 PM to 3:59 PM | 8 (0.3%) | 22 (2.9%) |
| 4:00 PM to 11:59 PM | 91 (3.0%) | 121 (15.7%) |
| Total | 3,021 (100.0%) | 772 (100.0%) |
Housing Occupancy in Fort Polk South
Occupancy by Ownership in Fort Polk South
Of the total 2,268 dwellings in Fort Polk South, owner-occupied units account for 0 (0.0%), while renter-occupied units make up 2,268 (100.0%).
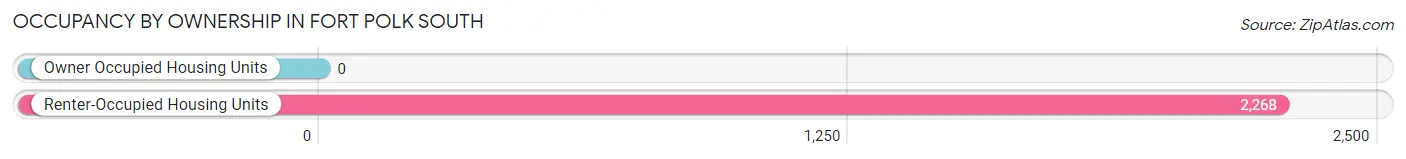
| Occupancy | # Housing Units | % Housing Units |
| Owner Occupied Housing Units | 0 | 0.0% |
| Renter-Occupied Housing Units | 2,268 | 100.0% |
| Total Occupied Housing Units | 2,268 | 100.0% |
Occupancy by Household Size in Fort Polk South
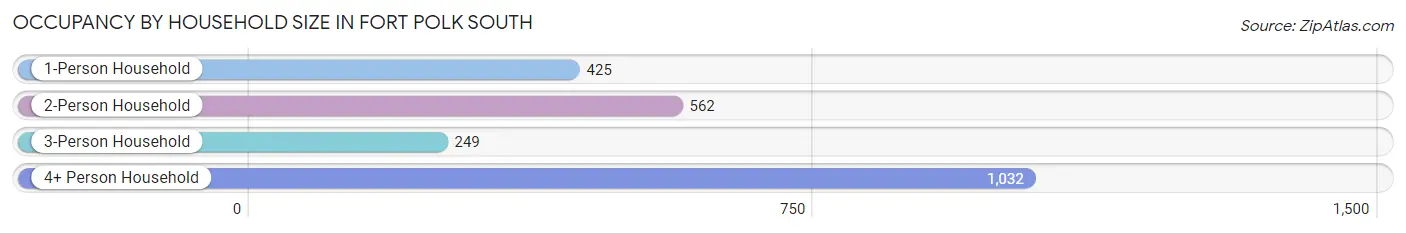
| Household Size | # Housing Units | % Housing Units |
| 1-Person Household | 425 | 18.7% |
| 2-Person Household | 562 | 24.8% |
| 3-Person Household | 249 | 11.0% |
| 4+ Person Household | 1,032 | 45.5% |
| Total Housing Units | 2,268 | 100.0% |
Occupancy by Ownership by Household Size in Fort Polk South
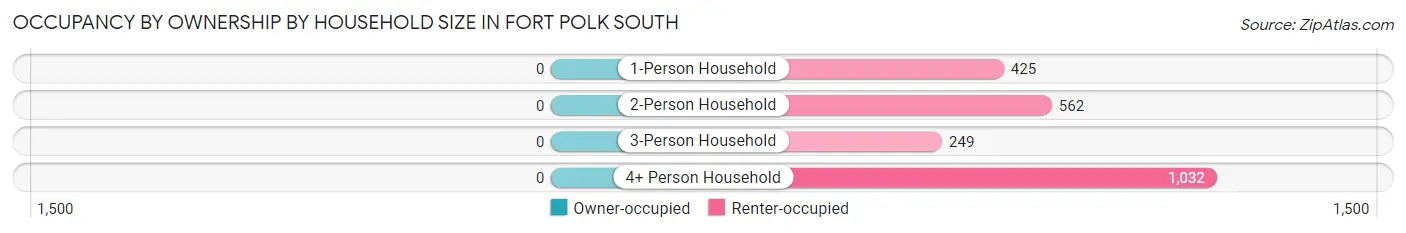
| Household Size | Owner-occupied | Renter-occupied |
| 1-Person Household | 0 (0.0%) | 425 (100.0%) |
| 2-Person Household | 0 (0.0%) | 562 (100.0%) |
| 3-Person Household | 0 (0.0%) | 249 (100.0%) |
| 4+ Person Household | 0 (0.0%) | 1,032 (100.0%) |
| Total Housing Units | 0 (0.0%) | 2,268 (100.0%) |
Occupancy by Educational Attainment in Fort Polk South
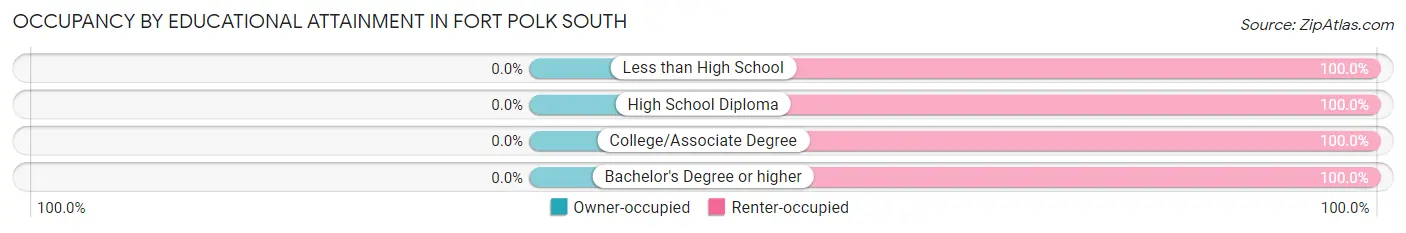
| Household Size | Owner-occupied | Renter-occupied |
| Less than High School | 0 (0.0%) | 9 (100.0%) |
| High School Diploma | 0 (0.0%) | 601 (100.0%) |
| College/Associate Degree | 0 (0.0%) | 1,156 (100.0%) |
| Bachelor's Degree or higher | 0 (0.0%) | 502 (100.0%) |
Occupancy by Age of Householder in Fort Polk South
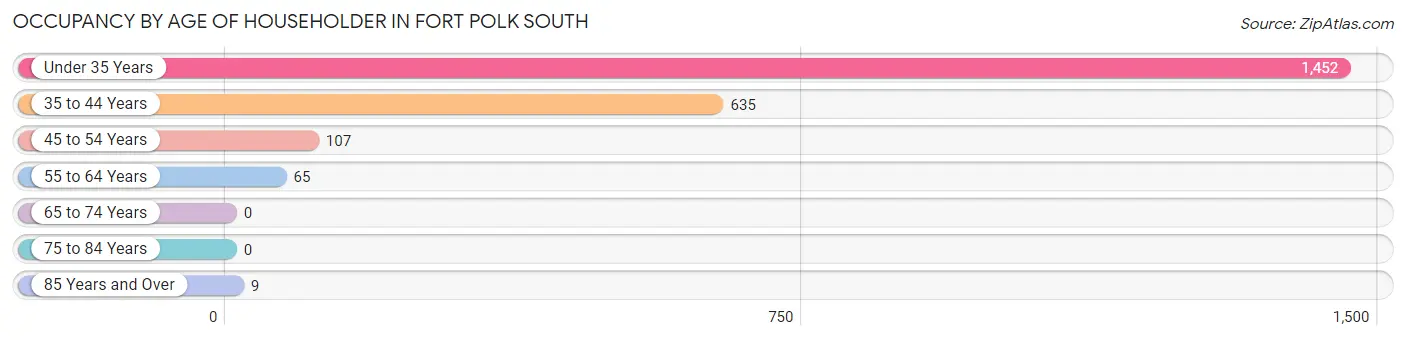
| Age Bracket | # Households | % Households |
| Under 35 Years | 1,452 | 64.0% |
| 35 to 44 Years | 635 | 28.0% |
| 45 to 54 Years | 107 | 4.7% |
| 55 to 64 Years | 65 | 2.9% |
| 65 to 74 Years | 0 | 0.0% |
| 75 to 84 Years | 0 | 0.0% |
| 85 Years and Over | 9 | 0.4% |
| Total | 2,268 | 100.0% |
Housing Finances in Fort Polk South
Median Income by Occupancy in Fort Polk South
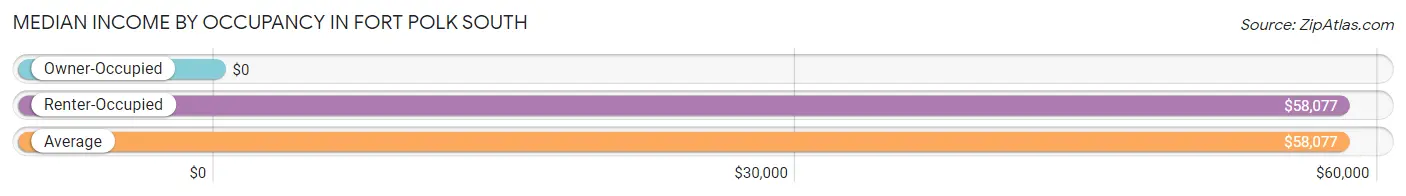
| Occupancy Type | # Households | Median Income |
| Owner-Occupied | 0 (0.0%) | $0 |
| Renter-Occupied | 2,268 (100.0%) | $58,077 |
| Average | 2,268 (100.0%) | $58,077 |
Occupancy by Householder Income Bracket in Fort Polk South
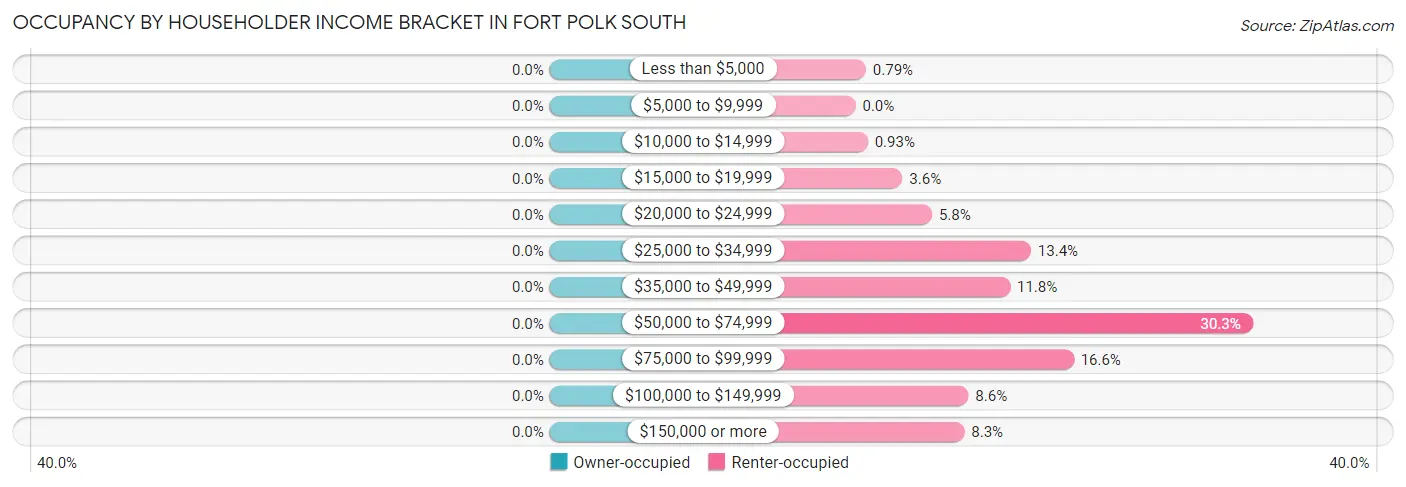
| Income Bracket | Owner-occupied | Renter-occupied |
| Less than $5,000 | 0 (0.0%) | 18 (0.8%) |
| $5,000 to $9,999 | 0 (0.0%) | 0 (0.0%) |
| $10,000 to $14,999 | 0 (0.0%) | 21 (0.9%) |
| $15,000 to $19,999 | 0 (0.0%) | 81 (3.6%) |
| $20,000 to $24,999 | 0 (0.0%) | 132 (5.8%) |
| $25,000 to $34,999 | 0 (0.0%) | 303 (13.4%) |
| $35,000 to $49,999 | 0 (0.0%) | 267 (11.8%) |
| $50,000 to $74,999 | 0 (0.0%) | 686 (30.2%) |
| $75,000 to $99,999 | 0 (0.0%) | 377 (16.6%) |
| $100,000 to $149,999 | 0 (0.0%) | 195 (8.6%) |
| $150,000 or more | 0 (0.0%) | 188 (8.3%) |
| Total | 0 (0.0%) | 2,268 (100.0%) |
Monthly Housing Cost Tiers in Fort Polk South
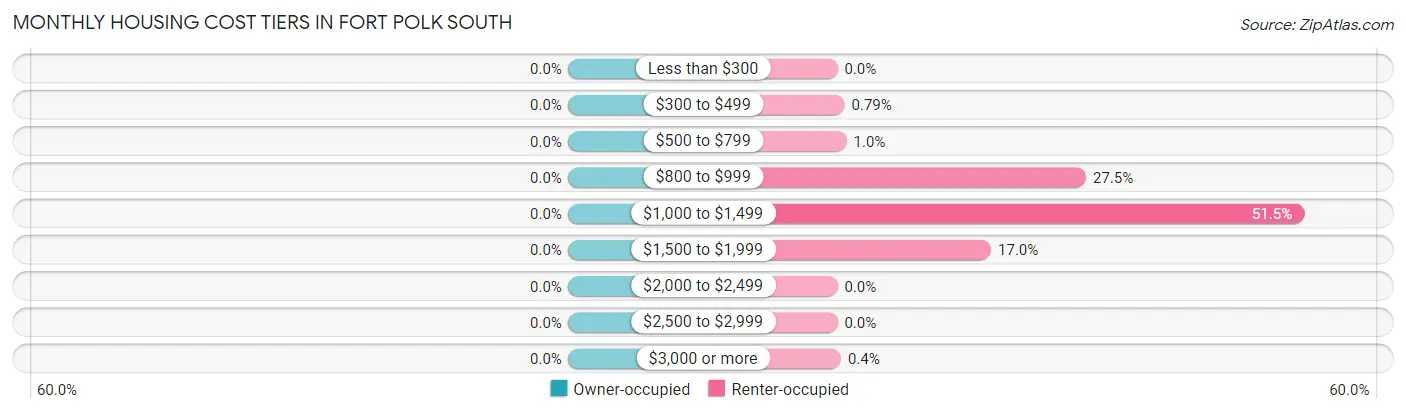
| Monthly Cost | Owner-occupied | Renter-occupied |
| Less than $300 | 0 (0.0%) | 0 (0.0%) |
| $300 to $499 | 0 (0.0%) | 18 (0.8%) |
| $500 to $799 | 0 (0.0%) | 23 (1.0%) |
| $800 to $999 | 0 (0.0%) | 623 (27.5%) |
| $1,000 to $1,499 | 0 (0.0%) | 1,169 (51.5%) |
| $1,500 to $1,999 | 0 (0.0%) | 385 (17.0%) |
| $2,000 to $2,499 | 0 (0.0%) | 0 (0.0%) |
| $2,500 to $2,999 | 0 (0.0%) | 0 (0.0%) |
| $3,000 or more | 0 (0.0%) | 9 (0.4%) |
| Total | 0 (0.0%) | 2,268 (100.0%) |
Physical Housing Characteristics in Fort Polk South
Housing Structures in Fort Polk South
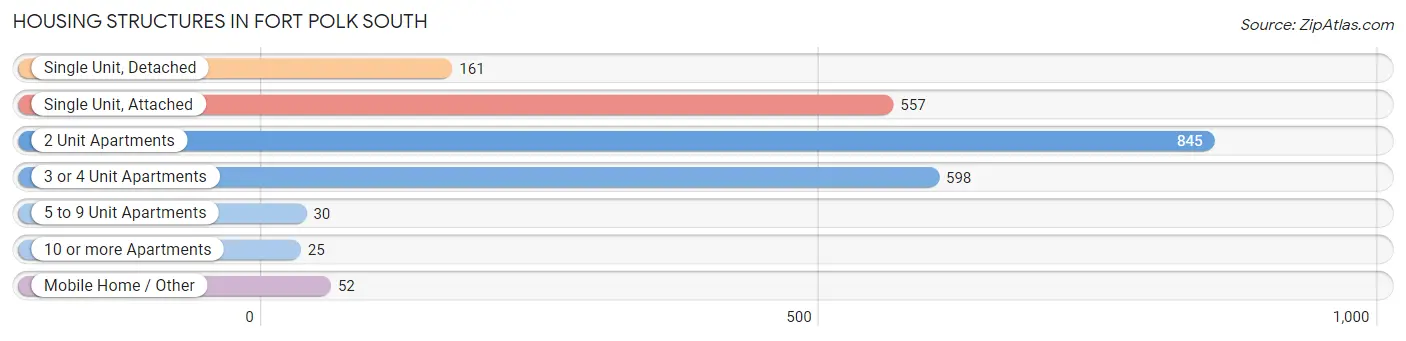
| Structure Type | # Housing Units | % Housing Units |
| Single Unit, Detached | 161 | 7.1% |
| Single Unit, Attached | 557 | 24.6% |
| 2 Unit Apartments | 845 | 37.3% |
| 3 or 4 Unit Apartments | 598 | 26.4% |
| 5 to 9 Unit Apartments | 30 | 1.3% |
| 10 or more Apartments | 25 | 1.1% |
| Mobile Home / Other | 52 | 2.3% |
| Total | 2,268 | 100.0% |
Housing Structures by Occupancy in Fort Polk South
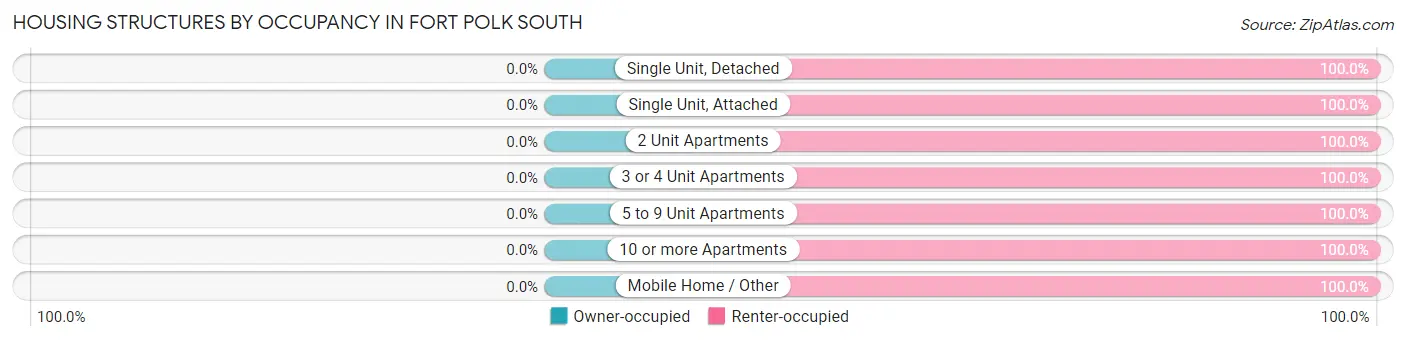
| Structure Type | Owner-occupied | Renter-occupied |
| Single Unit, Detached | 0 (0.0%) | 161 (100.0%) |
| Single Unit, Attached | 0 (0.0%) | 557 (100.0%) |
| 2 Unit Apartments | 0 (0.0%) | 845 (100.0%) |
| 3 or 4 Unit Apartments | 0 (0.0%) | 598 (100.0%) |
| 5 to 9 Unit Apartments | 0 (0.0%) | 30 (100.0%) |
| 10 or more Apartments | 0 (0.0%) | 25 (100.0%) |
| Mobile Home / Other | 0 (0.0%) | 52 (100.0%) |
| Total | 0 (0.0%) | 2,268 (100.0%) |
Housing Structures by Number of Rooms in Fort Polk South
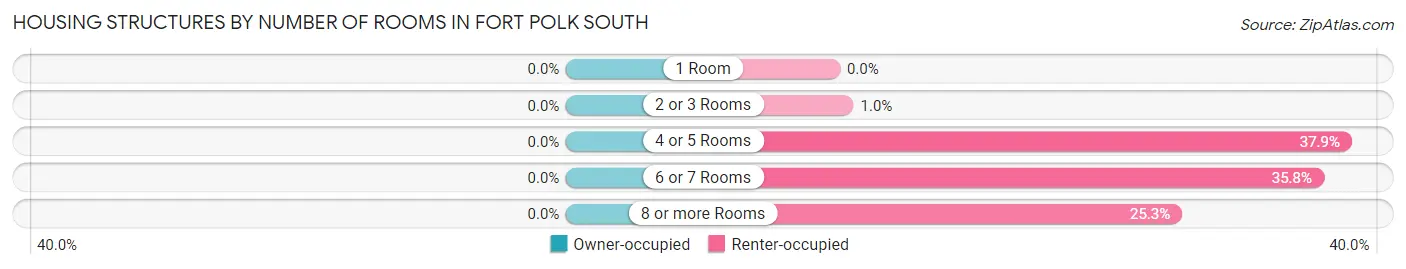
| Number of Rooms | Owner-occupied | Renter-occupied |
| 1 Room | 0 (0.0%) | 0 (0.0%) |
| 2 or 3 Rooms | 0 (0.0%) | 23 (1.0%) |
| 4 or 5 Rooms | 0 (0.0%) | 859 (37.9%) |
| 6 or 7 Rooms | 0 (0.0%) | 812 (35.8%) |
| 8 or more Rooms | 0 (0.0%) | 574 (25.3%) |
| Total | 0 (0.0%) | 2,268 (100.0%) |
Housing Structure by Heating Type in Fort Polk South
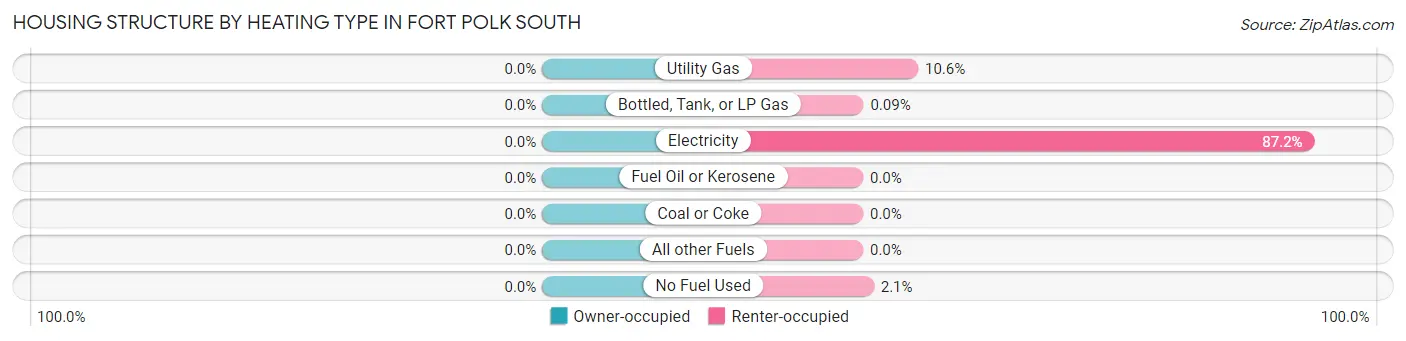
| Heating Type | Owner-occupied | Renter-occupied |
| Utility Gas | 0 (0.0%) | 241 (10.6%) |
| Bottled, Tank, or LP Gas | 0 (0.0%) | 2 (0.1%) |
| Electricity | 0 (0.0%) | 1,978 (87.2%) |
| Fuel Oil or Kerosene | 0 (0.0%) | 0 (0.0%) |
| Coal or Coke | 0 (0.0%) | 0 (0.0%) |
| All other Fuels | 0 (0.0%) | 0 (0.0%) |
| No Fuel Used | 0 (0.0%) | 47 (2.1%) |
| Total | 0 (0.0%) | 2,268 (100.0%) |
Household Vehicle Usage in Fort Polk South
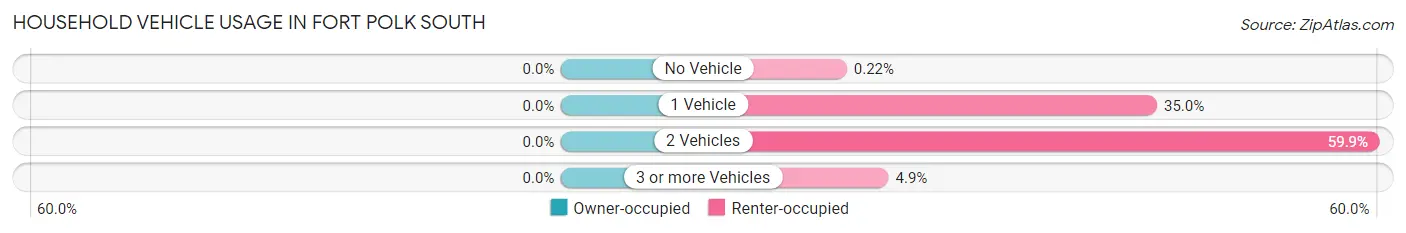
| Vehicles per Household | Owner-occupied | Renter-occupied |
| No Vehicle | 0 (0.0%) | 5 (0.2%) |
| 1 Vehicle | 0 (0.0%) | 793 (35.0%) |
| 2 Vehicles | 0 (0.0%) | 1,359 (59.9%) |
| 3 or more Vehicles | 0 (0.0%) | 111 (4.9%) |
| Total | 0 (0.0%) | 2,268 (100.0%) |
Real Estate & Mortgages in Fort Polk South
Real Estate and Mortgage Overview in Fort Polk South
| Characteristic | Without Mortgage | With Mortgage |
| Housing Units | 0 | 0 |
| Median Property Value | - | - |
| Median Household Income | - | - |
| Monthly Housing Costs | - | - |
| Real Estate Taxes | - | - |
Property Value by Mortgage Status in Fort Polk South
| Property Value | Without Mortgage | With Mortgage |
| Less than $50,000 | 0 (0.0%) | 0 (0.0%) |
| $50,000 to $99,999 | 0 (0.0%) | 0 (0.0%) |
| $100,000 to $299,999 | 0 (0.0%) | 0 (0.0%) |
| $300,000 to $499,999 | 0 (0.0%) | 0 (0.0%) |
| $500,000 to $749,999 | 0 (0.0%) | 0 (0.0%) |
| $750,000 to $999,999 | 0 (0.0%) | 0 (0.0%) |
| $1,000,000 or more | 0 (0.0%) | 0 (0.0%) |
| Total | 0 (0.0%) | 0 (0.0%) |
Household Income by Mortgage Status in Fort Polk South
| Household Income | Without Mortgage | With Mortgage |
| Less than $10,000 | 0 (0.0%) | 0 (0.0%) |
| $10,000 to $24,999 | 0 (0.0%) | 0 (0.0%) |
| $25,000 to $34,999 | 0 (0.0%) | 0 (0.0%) |
| $35,000 to $49,999 | 0 (0.0%) | 0 (0.0%) |
| $50,000 to $74,999 | 0 (0.0%) | 0 (0.0%) |
| $75,000 to $99,999 | 0 (0.0%) | 0 (0.0%) |
| $100,000 to $149,999 | 0 (0.0%) | 0 (0.0%) |
| $150,000 or more | 0 (0.0%) | 0 (0.0%) |
| Total | 0 (0.0%) | 0 (0.0%) |
Property Value to Household Income Ratio in Fort Polk South
| Value-to-Income Ratio | Without Mortgage | With Mortgage |
| Less than 2.0x | 0 (0.0%) | 0 (0.0%) |
| 2.0x to 2.9x | 0 (0.0%) | 0 (0.0%) |
| 3.0x to 3.9x | 0 (0.0%) | 0 (0.0%) |
| 4.0x or more | 0 (0.0%) | 0 (0.0%) |
| Total | 0 (0.0%) | 0 (0.0%) |
Real Estate Taxes by Mortgage Status in Fort Polk South
| Property Taxes | Without Mortgage | With Mortgage |
| Less than $800 | 0 (0.0%) | 0 (0.0%) |
| $800 to $1,499 | 0 (0.0%) | 0 (0.0%) |
| $800 to $1,499 | 0 (0.0%) | 0 (0.0%) |
| Total | 0 (0.0%) | 0 (0.0%) |
Health & Disability in Fort Polk South
Health Insurance Coverage by Age in Fort Polk South
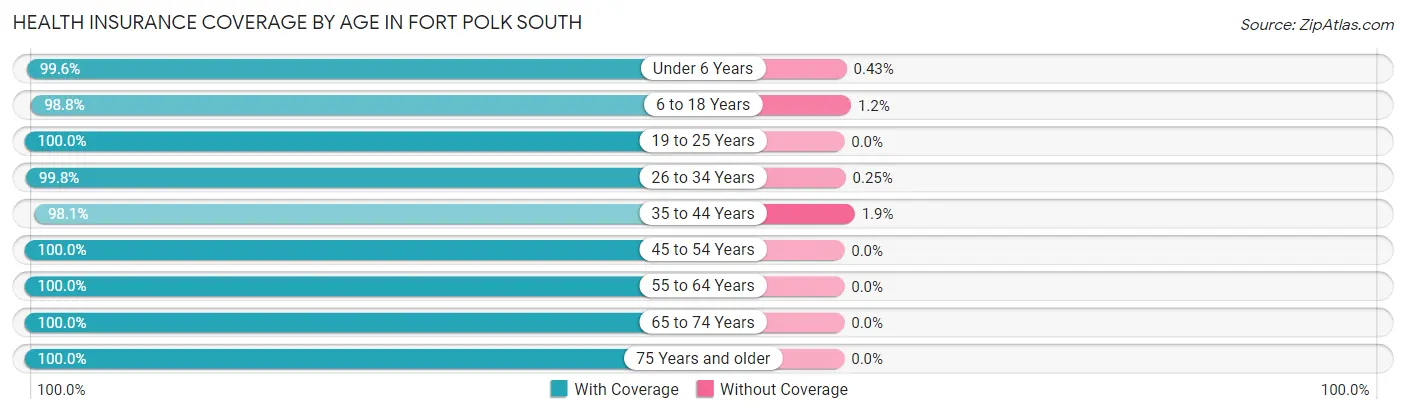
| Age Bracket | With Coverage | Without Coverage |
| Under 6 Years | 1,155 (99.6%) | 5 (0.4%) |
| 6 to 18 Years | 1,594 (98.8%) | 20 (1.2%) |
| 19 to 25 Years | 541 (100.0%) | 0 (0.0%) |
| 26 to 34 Years | 786 (99.8%) | 2 (0.3%) |
| 35 to 44 Years | 656 (98.1%) | 13 (1.9%) |
| 45 to 54 Years | 102 (100.0%) | 0 (0.0%) |
| 55 to 64 Years | 34 (100.0%) | 0 (0.0%) |
| 65 to 74 Years | 11 (100.0%) | 0 (0.0%) |
| 75 Years and older | 18 (100.0%) | 0 (0.0%) |
| Total | 4,897 (99.2%) | 40 (0.8%) |
Health Insurance Coverage by Citizenship Status in Fort Polk South
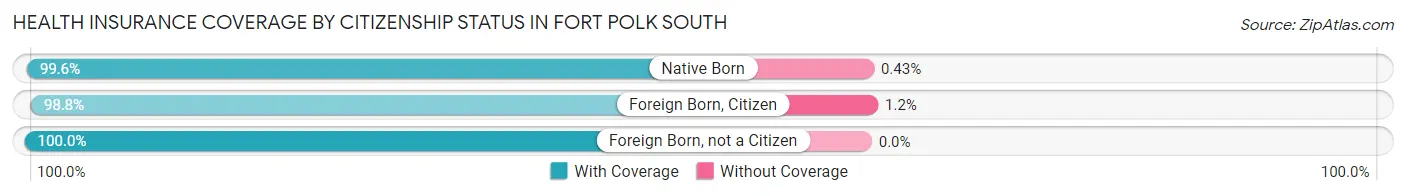
| Citizenship Status | With Coverage | Without Coverage |
| Native Born | 1,155 (99.6%) | 5 (0.4%) |
| Foreign Born, Citizen | 1,594 (98.8%) | 20 (1.2%) |
| Foreign Born, not a Citizen | 541 (100.0%) | 0 (0.0%) |
Health Insurance Coverage by Household Income in Fort Polk South
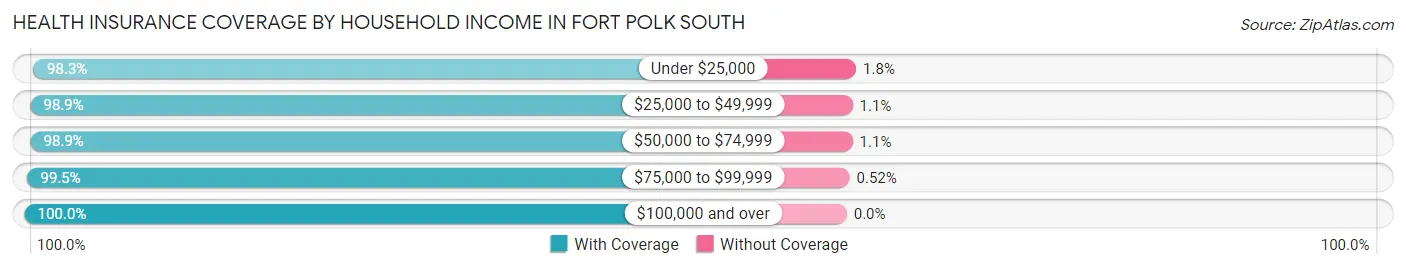
| Household Income | With Coverage | Without Coverage |
| Under $25,000 | 392 (98.3%) | 7 (1.8%) |
| $25,000 to $49,999 | 1,371 (98.9%) | 15 (1.1%) |
| $50,000 to $74,999 | 1,082 (98.9%) | 12 (1.1%) |
| $75,000 to $99,999 | 1,149 (99.5%) | 6 (0.5%) |
| $100,000 and over | 903 (100.0%) | 0 (0.0%) |
Public vs Private Health Insurance Coverage by Age in Fort Polk South
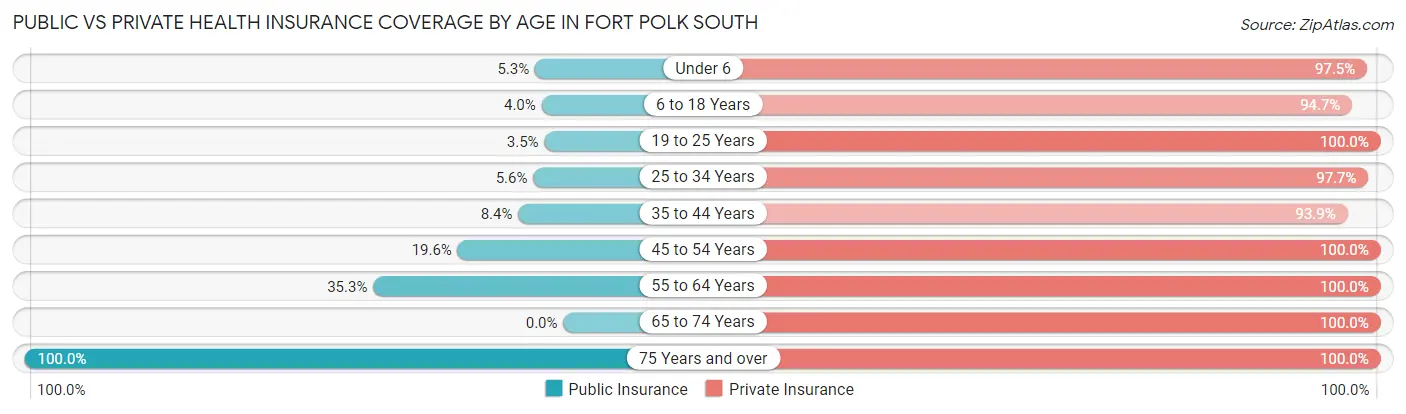
| Age Bracket | Public Insurance | Private Insurance |
| Under 6 | 61 (5.3%) | 1,131 (97.5%) |
| 6 to 18 Years | 65 (4.0%) | 1,529 (94.7%) |
| 19 to 25 Years | 19 (3.5%) | 541 (100.0%) |
| 25 to 34 Years | 44 (5.6%) | 770 (97.7%) |
| 35 to 44 Years | 56 (8.4%) | 628 (93.9%) |
| 45 to 54 Years | 20 (19.6%) | 102 (100.0%) |
| 55 to 64 Years | 12 (35.3%) | 34 (100.0%) |
| 65 to 74 Years | 0 (0.0%) | 11 (100.0%) |
| 75 Years and over | 18 (100.0%) | 18 (100.0%) |
| Total | 295 (6.0%) | 4,764 (96.5%) |
Disability Status by Sex by Age in Fort Polk South
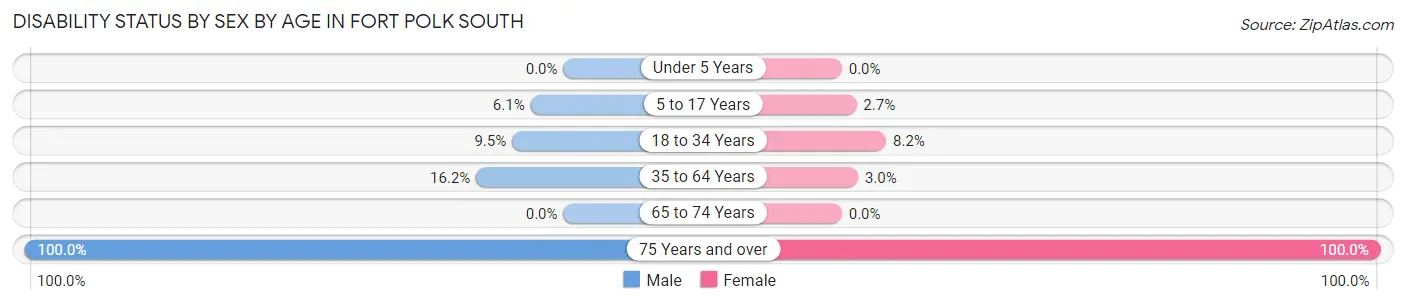
| Age Bracket | Male | Female |
| Under 5 Years | 0 (0.0%) | 0 (0.0%) |
| 5 to 17 Years | 52 (6.1%) | 23 (2.7%) |
| 18 to 34 Years | 26 (9.5%) | 89 (8.2%) |
| 35 to 64 Years | 44 (16.2%) | 16 (3.0%) |
| 65 to 74 Years | 0 (0.0%) | 0 (0.0%) |
| 75 Years and over | 9 (100.0%) | 9 (100.0%) |
Disability Class by Sex by Age in Fort Polk South
Disability Class: Hearing Difficulty
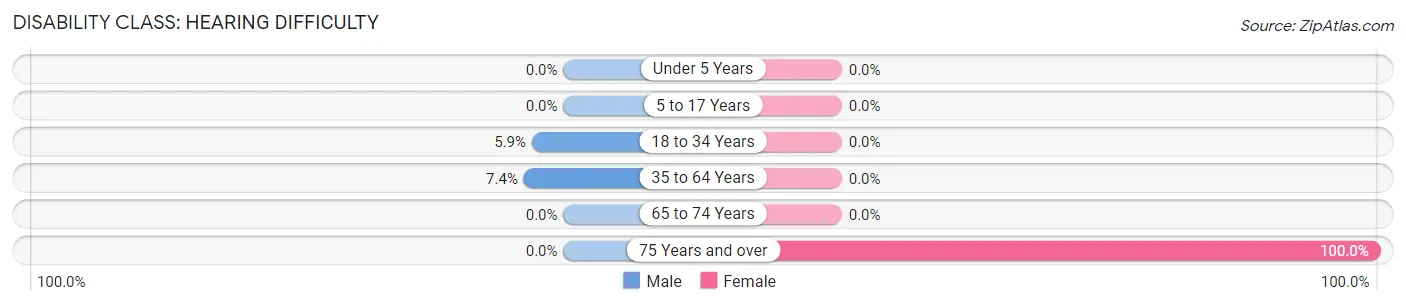
| Age Bracket | Male | Female |
| Under 5 Years | 0 (0.0%) | 0 (0.0%) |
| 5 to 17 Years | 0 (0.0%) | 0 (0.0%) |
| 18 to 34 Years | 16 (5.9%) | 0 (0.0%) |
| 35 to 64 Years | 20 (7.3%) | 0 (0.0%) |
| 65 to 74 Years | 0 (0.0%) | 0 (0.0%) |
| 75 Years and over | 0 (0.0%) | 9 (100.0%) |
Disability Class: Vision Difficulty
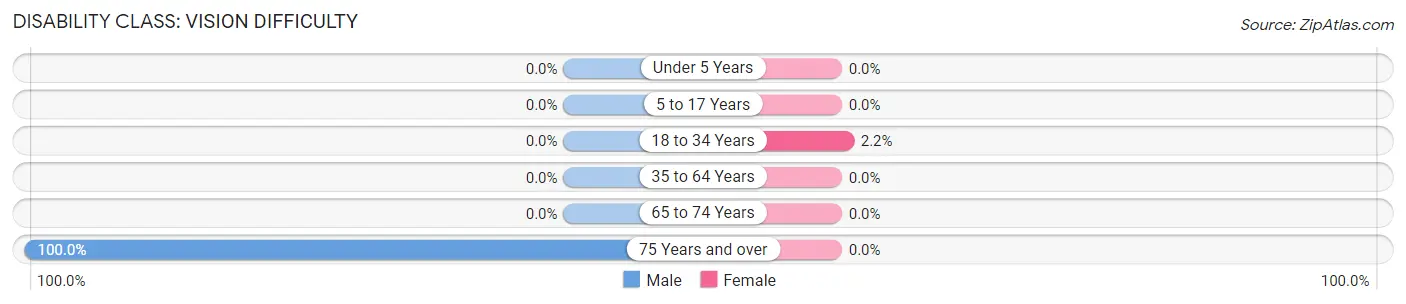
| Age Bracket | Male | Female |
| Under 5 Years | 0 (0.0%) | 0 (0.0%) |
| 5 to 17 Years | 0 (0.0%) | 0 (0.0%) |
| 18 to 34 Years | 0 (0.0%) | 24 (2.2%) |
| 35 to 64 Years | 0 (0.0%) | 0 (0.0%) |
| 65 to 74 Years | 0 (0.0%) | 0 (0.0%) |
| 75 Years and over | 9 (100.0%) | 0 (0.0%) |
Disability Class: Cognitive Difficulty
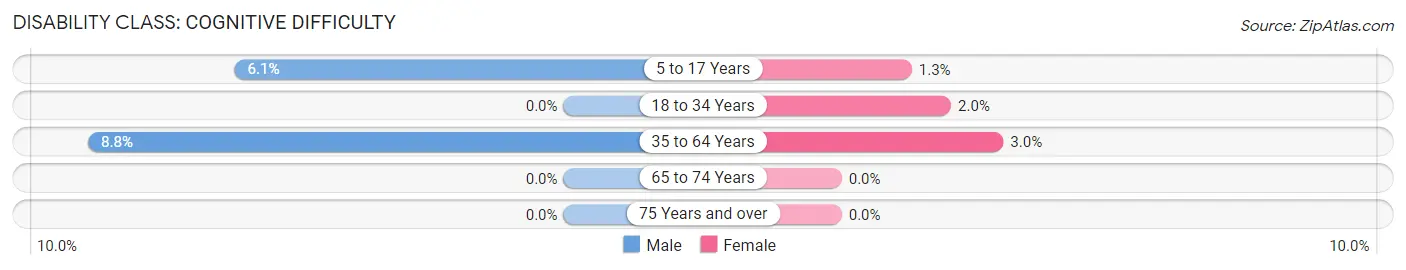
| Age Bracket | Male | Female |
| 5 to 17 Years | 52 (6.1%) | 11 (1.3%) |
| 18 to 34 Years | 0 (0.0%) | 22 (2.0%) |
| 35 to 64 Years | 24 (8.8%) | 16 (3.0%) |
| 65 to 74 Years | 0 (0.0%) | 0 (0.0%) |
| 75 Years and over | 0 (0.0%) | 0 (0.0%) |
Disability Class: Ambulatory Difficulty
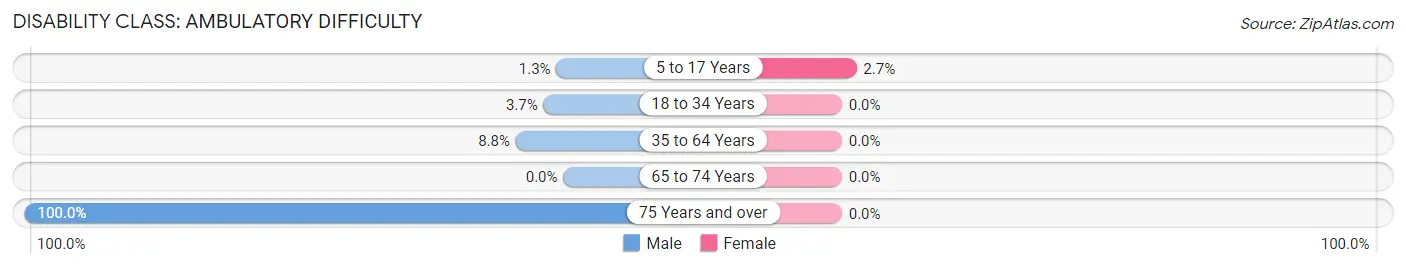
| Age Bracket | Male | Female |
| 5 to 17 Years | 11 (1.3%) | 23 (2.7%) |
| 18 to 34 Years | 10 (3.7%) | 0 (0.0%) |
| 35 to 64 Years | 24 (8.8%) | 0 (0.0%) |
| 65 to 74 Years | 0 (0.0%) | 0 (0.0%) |
| 75 Years and over | 9 (100.0%) | 0 (0.0%) |
Disability Class: Self-Care Difficulty
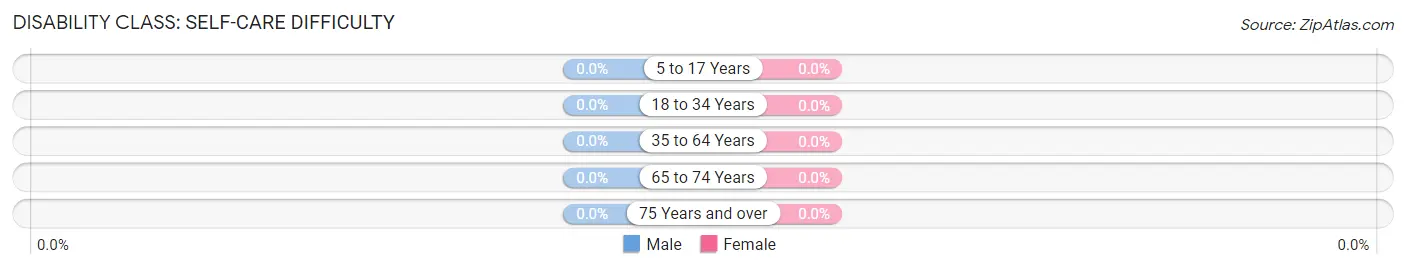
| Age Bracket | Male | Female |
| 5 to 17 Years | 0 (0.0%) | 0 (0.0%) |
| 18 to 34 Years | 0 (0.0%) | 0 (0.0%) |
| 35 to 64 Years | 0 (0.0%) | 0 (0.0%) |
| 65 to 74 Years | 0 (0.0%) | 0 (0.0%) |
| 75 Years and over | 0 (0.0%) | 0 (0.0%) |
Technology Access in Fort Polk South
Computing Device Access in Fort Polk South
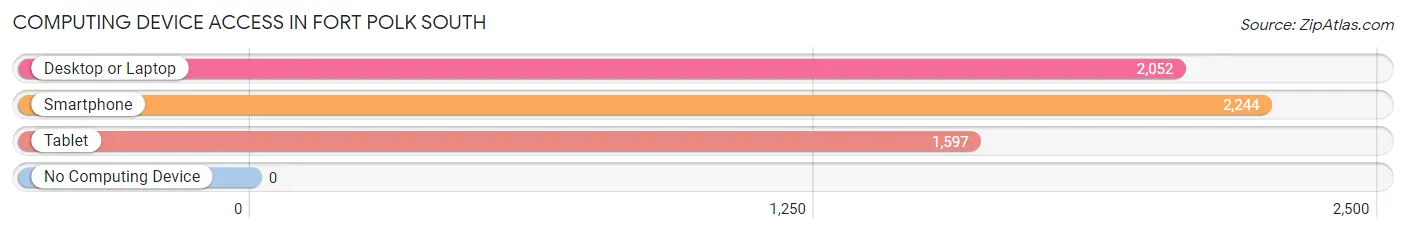
| Device Type | # Households | % Households |
| Desktop or Laptop | 2,052 | 90.5% |
| Smartphone | 2,244 | 98.9% |
| Tablet | 1,597 | 70.4% |
| No Computing Device | 0 | 0.0% |
| Total | 2,268 | 100.0% |
Internet Access in Fort Polk South
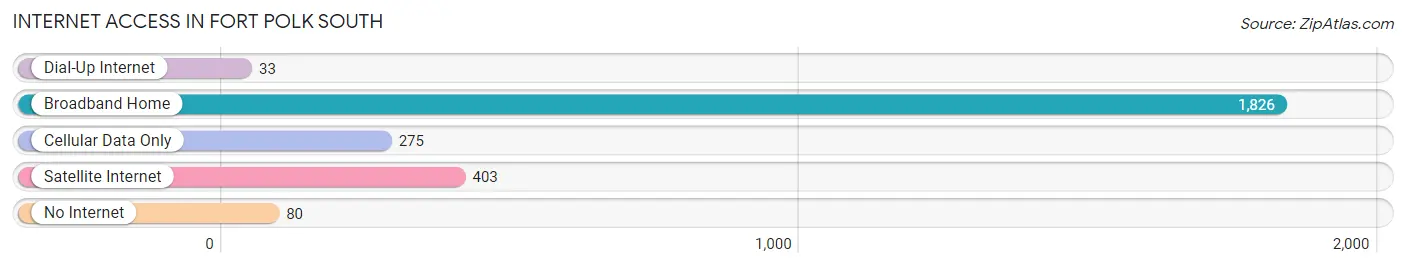
| Internet Type | # Households | % Households |
| Dial-Up Internet | 33 | 1.5% |
| Broadband Home | 1,826 | 80.5% |
| Cellular Data Only | 275 | 12.1% |
| Satellite Internet | 403 | 17.8% |
| No Internet | 80 | 3.5% |
| Total | 2,268 | 100.0% |
Fort Polk South Summary
Introduction
Fort Polk South, Louisiana is a small town located in the central part of the state. It is situated in the heart of the Kisatchie National Forest and is home to the Joint Readiness Training Center (JRTC) and Fort Polk, a United States Army installation. The town has a population of approximately 8,000 people and is known for its rich history, diverse geography, and vibrant economy. This paper will explore the history, geography, economy, and demographics of Fort Polk South, Louisiana in 2000 words.
History
Fort Polk South, Louisiana was established in 1941 as a United States Army installation. The town was named after General Leonidas Polk, a Confederate general who was killed in the Battle of Pine Mountain during the Civil War. The installation was initially used as a training center for soldiers during World War II and was later used as a staging area for the Vietnam War. In the 1970s, the installation was converted into a training center for the Army's Rapid Deployment Force.
In the 1980s, the installation was renamed the Joint Readiness Training Center (JRTC) and Fort Polk and became the primary training center for the Army's light infantry forces. The JRTC and Fort Polk is now the largest training center in the United States and is home to the Army's Airborne, Air Assault, and Ranger schools.
Geography
Fort Polk South, Louisiana is located in the central part of the state, approximately 80 miles east of Shreveport. The town is situated in the heart of the Kisatchie National Forest and is surrounded by rolling hills, pine forests, and wetlands. The town is located at an elevation of approximately 200 feet and has a humid subtropical climate with hot summers and mild winters.
The town is home to the Joint Readiness Training Center (JRTC) and Fort Polk, a United States Army installation. The installation covers approximately 200,000 acres and is home to the Army's Airborne, Air Assault, and Ranger schools. The installation also includes a number of training ranges, a firing range, and a parachute drop zone.
Economy
Fort Polk South, Louisiana has a vibrant economy that is largely driven by the Joint Readiness Training Center (JRTC) and Fort Polk. The installation is the largest employer in the town and provides jobs for approximately 8,000 people. The installation also provides a number of services to the local community, including medical care, housing, and recreational activities.
In addition to the JRTC and Fort Polk, the town is home to a number of small businesses, including restaurants, retail stores, and service providers. The town is also home to a number of manufacturing companies, including a paper mill and a furniture factory.
Demographics
As of the 2010 census, Fort Polk South, Louisiana had a population of 8,000 people. The town is predominantly white, with approximately 75% of the population identifying as white. The town also has a small African American population, with approximately 15% of the population identifying as African American. The town also has a small Hispanic population, with approximately 5% of the population identifying as Hispanic.
Conclusion
Fort Polk South, Louisiana is a small town located in the central part of the state. It is situated in the heart of the Kisatchie National Forest and is home to the Joint Readiness Training Center (JRTC) and Fort Polk, a United States Army installation. The town has a population of approximately 8,000 people and is known for its rich history, diverse geography, and vibrant economy. This paper has explored the history, geography, economy, and demographics of Fort Polk South, Louisiana in 2000 words.
Common Questions
What is Per Capita Income in Fort Polk South?
Per Capita income in Fort Polk South is $25,474.
What is the Median Family Income in Fort Polk South?
Median Family Income in Fort Polk South is $59,176.
What is the Median Household income in Fort Polk South?
Median Household Income in Fort Polk South is $58,077.
What is Income or Wage Gap in Fort Polk South?
Income or Wage Gap in Fort Polk South is 37.2%.
Women in Fort Polk South earn 62.8 cents for every dollar earned by a man.
What is Inequality or Gini Index in Fort Polk South?
Inequality or Gini Index in Fort Polk South is 0.40.
What is the Total Population of Fort Polk South?
Total Population of Fort Polk South is 8,327.
What is the Total Male Population of Fort Polk South?
Total Male Population of Fort Polk South is 5,035.
What is the Total Female Population of Fort Polk South?
Total Female Population of Fort Polk South is 3,292.
What is the Ratio of Males per 100 Females in Fort Polk South?
There are 152.95 Males per 100 Females in Fort Polk South.
What is the Ratio of Females per 100 Males in Fort Polk South?
There are 65.38 Females per 100 Males in Fort Polk South.
What is the Median Population Age in Fort Polk South?
Median Population Age in Fort Polk South is 22.4 Years.
What is the Average Family Size in Fort Polk South
Average Family Size in Fort Polk South is 3.5 People.
What is the Average Household Size in Fort Polk South
Average Household Size in Fort Polk South is 3.0 People.
How Large is the Labor Force in Fort Polk South?
There are 4,512 People in the Labor Forcein in Fort Polk South.
What is the Percentage of People in the Labor Force in Fort Polk South?
78.7% of People are in the Labor Force in Fort Polk South.
What is the Unemployment Rate in Fort Polk South?
Unemployment Rate in Fort Polk South is 1.9%.