Brownfields, LA Map & Demographics
Brownfields Map
Brownfields Overview
$22,437
PER CAPITA INCOME
$68,189
AVG FAMILY INCOME
$44,401
AVG HOUSEHOLD INCOME
34.8%
WAGE / INCOME GAP [ % ]
65.2¢/ $1
WAGE / INCOME GAP [ $ ]
$8,831
FAMILY INCOME DEFICIT
0.43
INEQUALITY / GINI INDEX
5,358
TOTAL POPULATION
2,103
MALE POPULATION
3,255
FEMALE POPULATION
64.61
MALES / 100 FEMALES
154.78
FEMALES / 100 MALES
36.6
MEDIAN AGE
3.9
AVG FAMILY SIZE
2.9
AVG HOUSEHOLD SIZE
2,776
LABOR FORCE [ PEOPLE ]
64.3%
PERCENT IN LABOR FORCE
7.6%
UNEMPLOYMENT RATE
Income in Brownfields
Income Overview in Brownfields
Per Capita Income in Brownfields is $22,437, while median incomes of families and households are $68,189 and $44,401 respectively.
| Characteristic | Number | Measure |
| Per Capita Income | 5,358 | $22,437 |
| Median Family Income | 1,125 | $68,189 |
| Mean Family Income | 1,125 | $70,671 |
| Median Household Income | 1,831 | $44,401 |
| Mean Household Income | 1,831 | $60,280 |
| Income Deficit | 1,125 | $8,831 |
| Wage / Income Gap (%) | 5,358 | 34.76% |
| Wage / Income Gap ($) | 5,358 | 65.24¢ per $1 |
| Gini / Inequality Index | 5,358 | 0.43 |
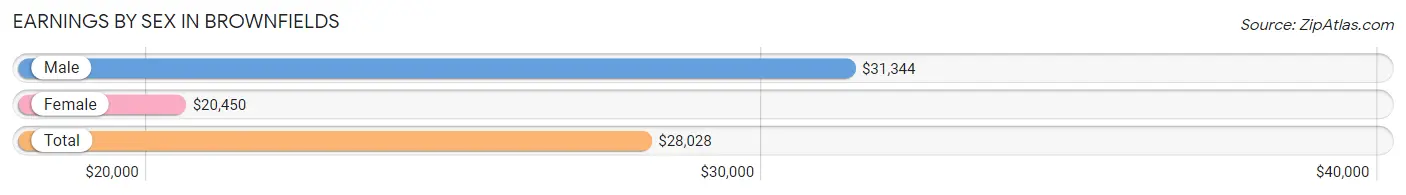
Earnings by Sex in Brownfields
Average Earnings in Brownfields are $28,028, $31,344 for men and $20,450 for women, a difference of 34.8%.
| Sex | Number | Average Earnings |
| Male | 1,244 (43.7%) | $31,344 |
| Female | 1,600 (56.3%) | $20,450 |
| Total | 2,844 (100.0%) | $28,028 |
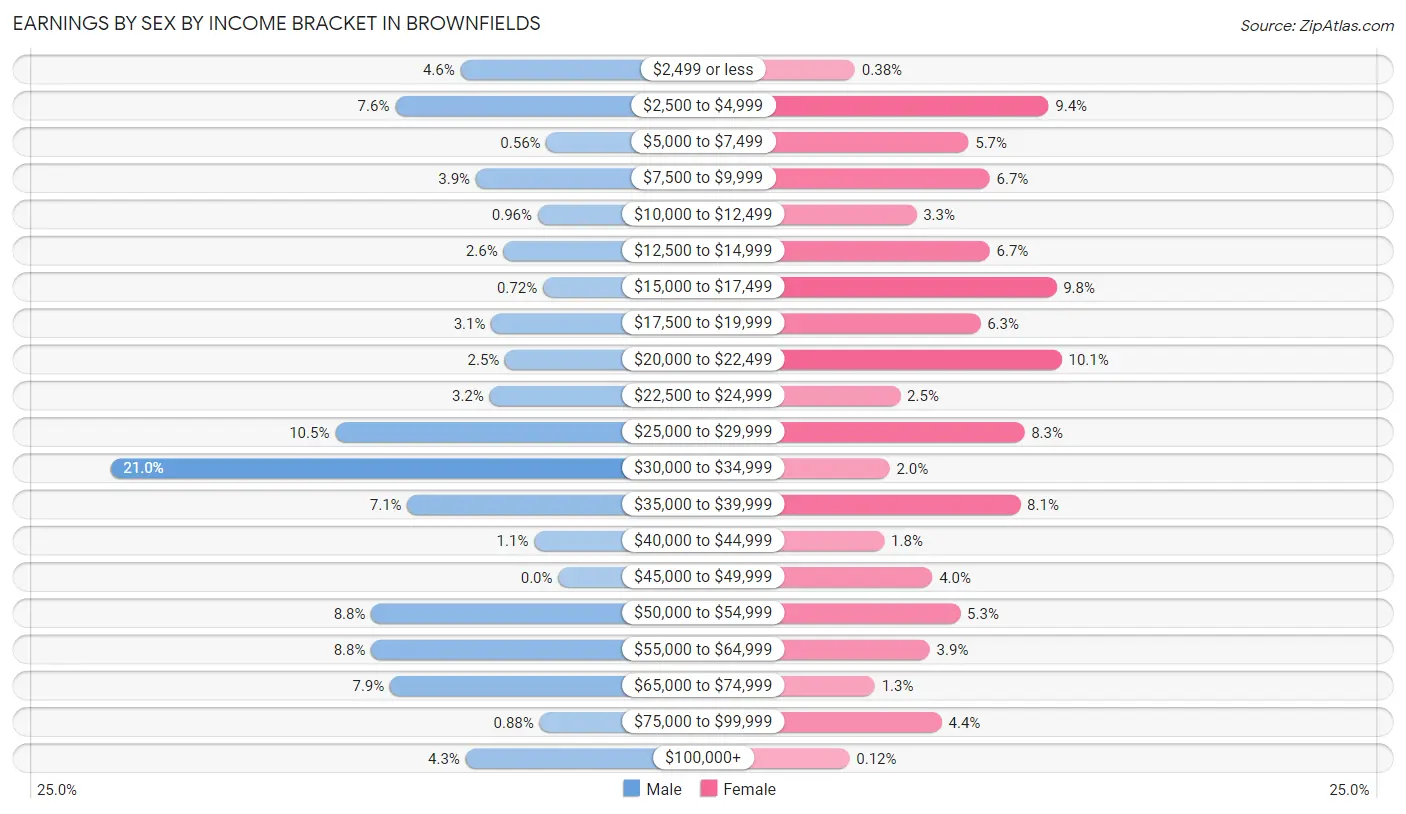
Earnings by Sex by Income Bracket in Brownfields
The most common earnings brackets in Brownfields are $30,000 to $34,999 for men (261 | 21.0%) and $20,000 to $22,499 for women (161 | 10.1%).
| Income | Male | Female |
| $2,499 or less | 57 (4.6%) | 6 (0.4%) |
| $2,500 to $4,999 | 95 (7.6%) | 151 (9.4%) |
| $5,000 to $7,499 | 7 (0.6%) | 91 (5.7%) |
| $7,500 to $9,999 | 48 (3.9%) | 107 (6.7%) |
| $10,000 to $12,499 | 12 (1.0%) | 52 (3.3%) |
| $12,500 to $14,999 | 32 (2.6%) | 107 (6.7%) |
| $15,000 to $17,499 | 9 (0.7%) | 157 (9.8%) |
| $17,500 to $19,999 | 39 (3.1%) | 100 (6.2%) |
| $20,000 to $22,499 | 31 (2.5%) | 161 (10.1%) |
| $22,500 to $24,999 | 40 (3.2%) | 40 (2.5%) |
| $25,000 to $29,999 | 130 (10.4%) | 133 (8.3%) |
| $30,000 to $34,999 | 261 (21.0%) | 32 (2.0%) |
| $35,000 to $39,999 | 88 (7.1%) | 130 (8.1%) |
| $40,000 to $44,999 | 14 (1.1%) | 28 (1.8%) |
| $45,000 to $49,999 | 0 (0.0%) | 64 (4.0%) |
| $50,000 to $54,999 | 109 (8.8%) | 85 (5.3%) |
| $55,000 to $64,999 | 109 (8.8%) | 62 (3.9%) |
| $65,000 to $74,999 | 98 (7.9%) | 21 (1.3%) |
| $75,000 to $99,999 | 11 (0.9%) | 71 (4.4%) |
| $100,000+ | 54 (4.3%) | 2 (0.1%) |
| Total | 1,244 (100.0%) | 1,600 (100.0%) |
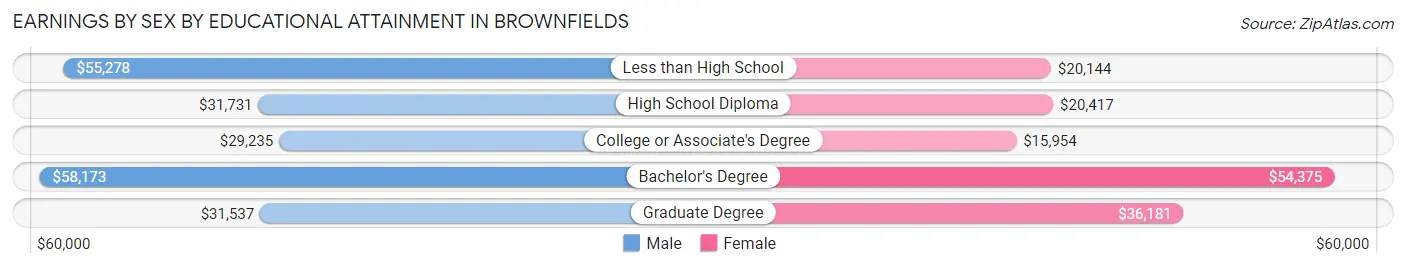
Earnings by Sex by Educational Attainment in Brownfields
Average earnings in Brownfields are $33,235 for men and $20,582 for women, a difference of 38.1%. Men with an educational attainment of bachelor's degree enjoy the highest average annual earnings of $58,173, while those with college or associate's degree education earn the least with $29,235. Women with an educational attainment of bachelor's degree earn the most with the average annual earnings of $54,375, while those with college or associate's degree education have the smallest earnings of $15,954.
| Educational Attainment | Male Income | Female Income |
| Less than High School | $55,278 | $20,144 |
| High School Diploma | $31,731 | $20,417 |
| College or Associate's Degree | $29,235 | $15,954 |
| Bachelor's Degree | $58,173 | $54,375 |
| Graduate Degree | $31,537 | $36,181 |
| Total | $33,235 | $20,582 |
Family Income in Brownfields
Family Income Brackets in Brownfields
According to the Brownfields family income data, there are 202 families falling into the $100,000 to $149,999 income range, which is the most common income bracket and makes up 18.0% of all families.
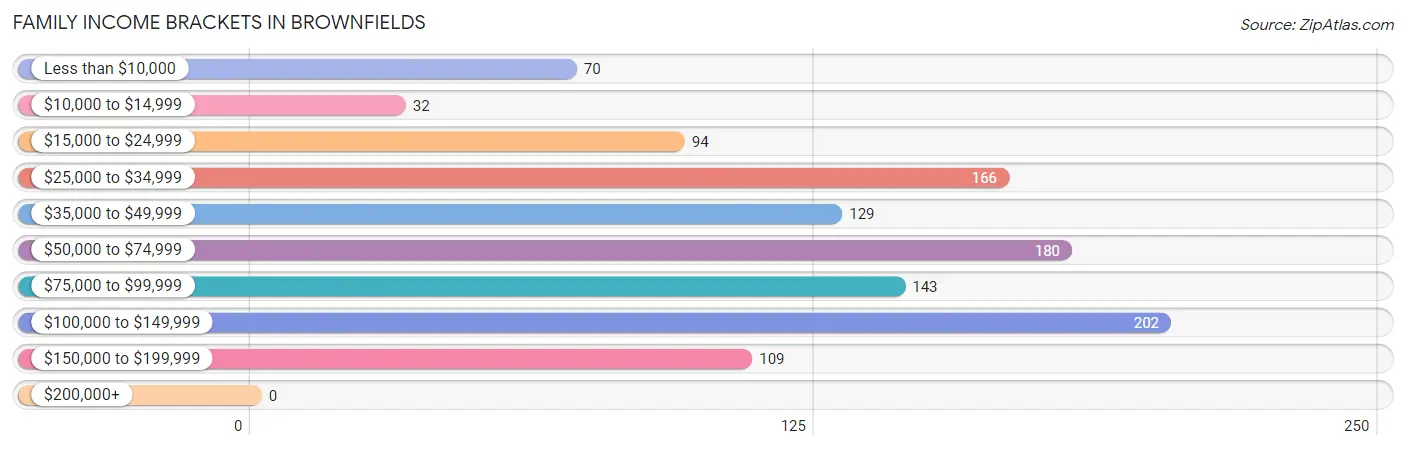
| Income Bracket | # Families | % Families |
| Less than $10,000 | 70 | 6.2% |
| $10,000 to $14,999 | 32 | 2.8% |
| $15,000 to $24,999 | 94 | 8.4% |
| $25,000 to $34,999 | 166 | 14.8% |
| $35,000 to $49,999 | 129 | 11.5% |
| $50,000 to $74,999 | 180 | 16.0% |
| $75,000 to $99,999 | 143 | 12.7% |
| $100,000 to $149,999 | 202 | 18.0% |
| $150,000 to $199,999 | 109 | 9.7% |
| $200,000+ | 0 | 0.0% |
Family Income by Famaliy Size in Brownfields
2-person families (505 | 44.9%) account for the highest median family income in Brownfields with $67,512 per family, while 2-person families (505 | 44.9%) have the highest median income of $33,756 per family member.
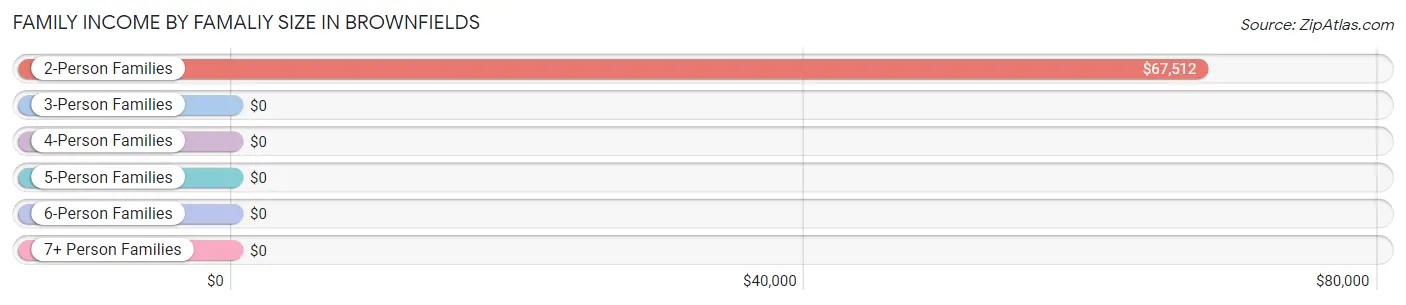
| Income Bracket | # Families | Median Income |
| 2-Person Families | 505 (44.9%) | $67,512 |
| 3-Person Families | 197 (17.5%) | $0 |
| 4-Person Families | 182 (16.2%) | $0 |
| 5-Person Families | 185 (16.4%) | $0 |
| 6-Person Families | 0 (0.0%) | $0 |
| 7+ Person Families | 56 (5.0%) | $0 |
| Total | 1,125 (100.0%) | $68,189 |
Family Income by Number of Earners in Brownfields
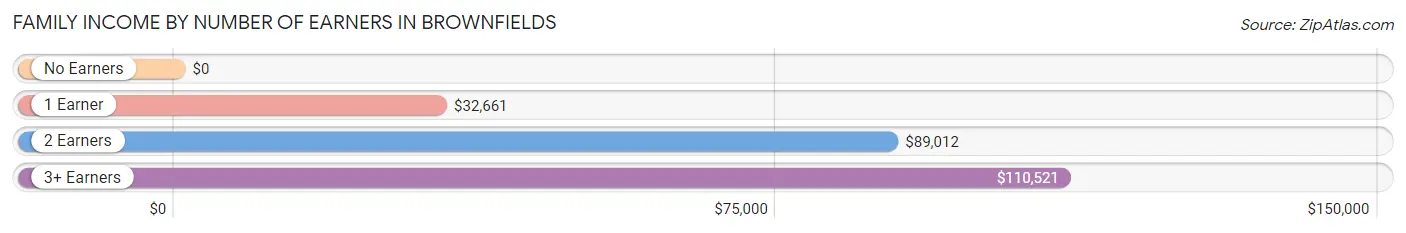
| Number of Earners | # Families | Median Income |
| No Earners | 156 (13.9%) | $0 |
| 1 Earner | 462 (41.1%) | $32,661 |
| 2 Earners | 334 (29.7%) | $89,012 |
| 3+ Earners | 173 (15.4%) | $110,521 |
| Total | 1,125 (100.0%) | $68,189 |
Household Income in Brownfields
Household Income Brackets in Brownfields
With 276 households falling in the category, the $25,000 to $34,999 income range is the most frequent in Brownfields, accounting for 15.1% of all households.
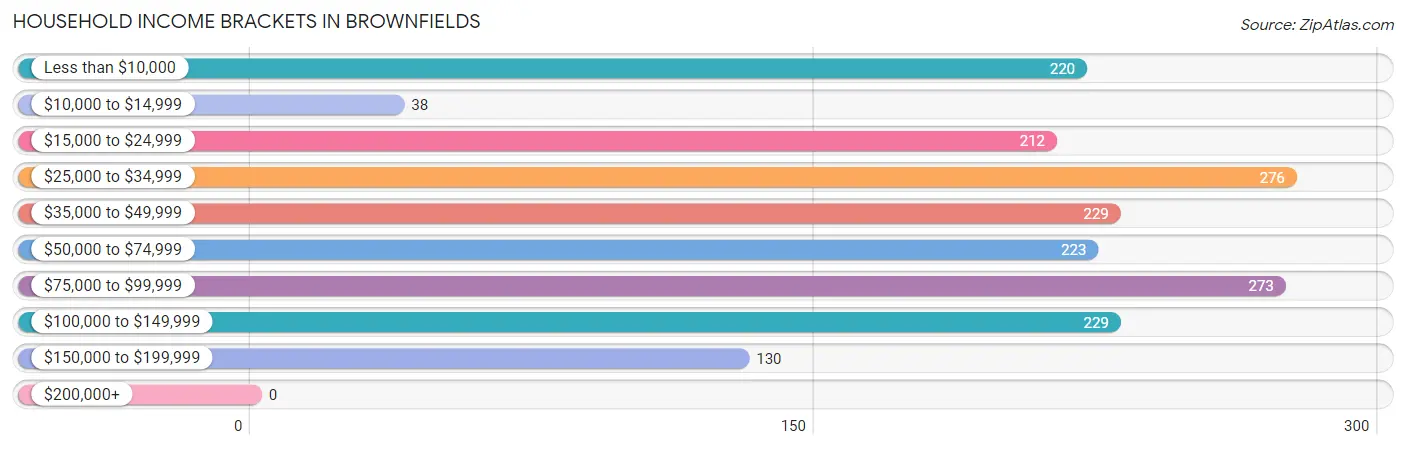
| Income Bracket | # Households | % Households |
| Less than $10,000 | 220 | 12.0% |
| $10,000 to $14,999 | 38 | 2.1% |
| $15,000 to $24,999 | 212 | 11.6% |
| $25,000 to $34,999 | 276 | 15.1% |
| $35,000 to $49,999 | 229 | 12.5% |
| $50,000 to $74,999 | 223 | 12.2% |
| $75,000 to $99,999 | 273 | 14.9% |
| $100,000 to $149,999 | 229 | 12.5% |
| $150,000 to $199,999 | 130 | 7.1% |
| $200,000+ | 0 | 0.0% |
Household Income by Householder Age in Brownfields
The median household income in Brownfields is $44,401, with the highest median household income of $67,618 found in the 25 to 44 years age bracket for the primary householder. A total of 577 households (31.5%) fall into this category.
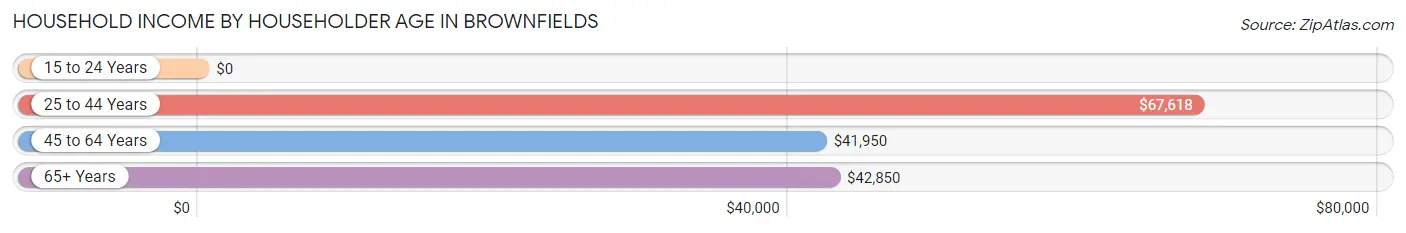
| Income Bracket | # Households | Median Income |
| 15 to 24 Years | 0 (0.0%) | $0 |
| 25 to 44 Years | 577 (31.5%) | $67,618 |
| 45 to 64 Years | 895 (48.9%) | $41,950 |
| 65+ Years | 359 (19.6%) | $42,850 |
| Total | 1,831 (100.0%) | $44,401 |
Poverty in Brownfields
Income Below Poverty by Sex and Age in Brownfields
With 17.5% poverty level for males and 29.3% for females among the residents of Brownfields, under 5 year old males and 5 year old females are the most vulnerable to poverty, with 36 males (81.8%) and 88 females (80.0%) in their respective age groups living below the poverty level.
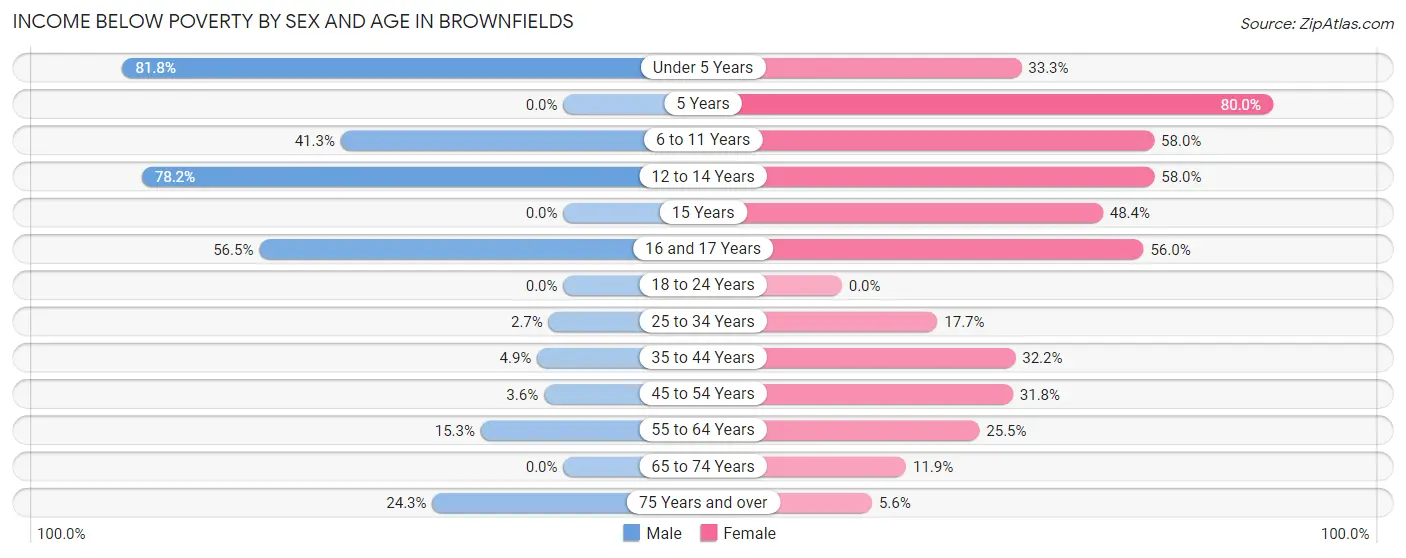
| Age Bracket | Male | Female |
| Under 5 Years | 36 (81.8%) | 34 (33.3%) |
| 5 Years | 0 (0.0%) | 88 (80.0%) |
| 6 to 11 Years | 50 (41.3%) | 178 (58.0%) |
| 12 to 14 Years | 115 (78.2%) | 76 (58.0%) |
| 15 Years | 0 (0.0%) | 31 (48.4%) |
| 16 and 17 Years | 35 (56.5%) | 28 (56.0%) |
| 18 to 24 Years | 0 (0.0%) | 0 (0.0%) |
| 25 to 34 Years | 9 (2.7%) | 91 (17.7%) |
| 35 to 44 Years | 12 (4.9%) | 123 (32.2%) |
| 45 to 54 Years | 7 (3.6%) | 127 (31.8%) |
| 55 to 64 Years | 61 (15.3%) | 120 (25.5%) |
| 65 to 74 Years | 0 (0.0%) | 34 (11.9%) |
| 75 Years and over | 35 (24.3%) | 7 (5.6%) |
| Total | 360 (17.5%) | 937 (29.3%) |
Income Above Poverty by Sex and Age in Brownfields
According to the poverty statistics in Brownfields, males aged 18 to 24 years and females aged 18 to 24 years are the age groups that are most secure financially, with 100.0% of males and 100.0% of females in these age groups living above the poverty line.
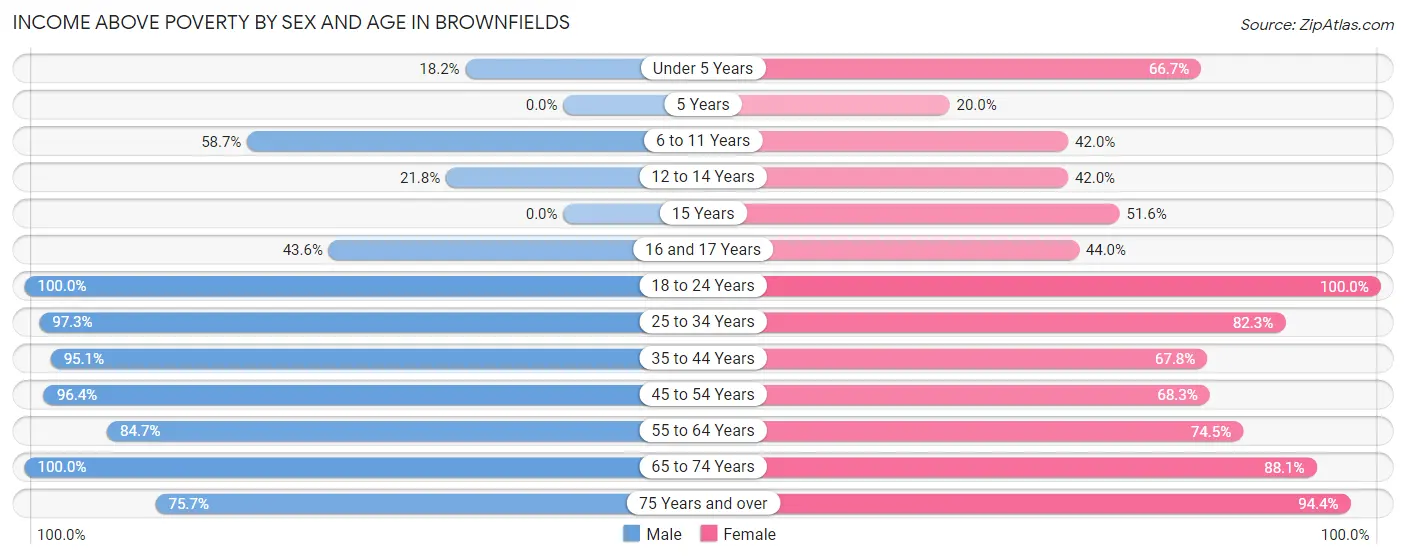
| Age Bracket | Male | Female |
| Under 5 Years | 8 (18.2%) | 68 (66.7%) |
| 5 Years | 0 (0.0%) | 22 (20.0%) |
| 6 to 11 Years | 71 (58.7%) | 129 (42.0%) |
| 12 to 14 Years | 32 (21.8%) | 55 (42.0%) |
| 15 Years | 0 (0.0%) | 33 (51.6%) |
| 16 and 17 Years | 27 (43.5%) | 22 (44.0%) |
| 18 to 24 Years | 281 (100.0%) | 256 (100.0%) |
| 25 to 34 Years | 321 (97.3%) | 422 (82.3%) |
| 35 to 44 Years | 235 (95.1%) | 259 (67.8%) |
| 45 to 54 Years | 188 (96.4%) | 273 (68.2%) |
| 55 to 64 Years | 337 (84.7%) | 350 (74.5%) |
| 65 to 74 Years | 82 (100.0%) | 251 (88.1%) |
| 75 Years and over | 109 (75.7%) | 118 (94.4%) |
| Total | 1,691 (82.5%) | 2,258 (70.7%) |
Income Below Poverty Among Married-Couple Families in Brownfields
The poverty statistics for married-couple families in Brownfields show that 10.7% or 69 of the total 643 families live below the poverty line. Families with 1 or 2 children have the highest poverty rate of 17.6%, comprising of 34 families. On the other hand, families with no children have the lowest poverty rate of 7.8%, which includes 35 families.
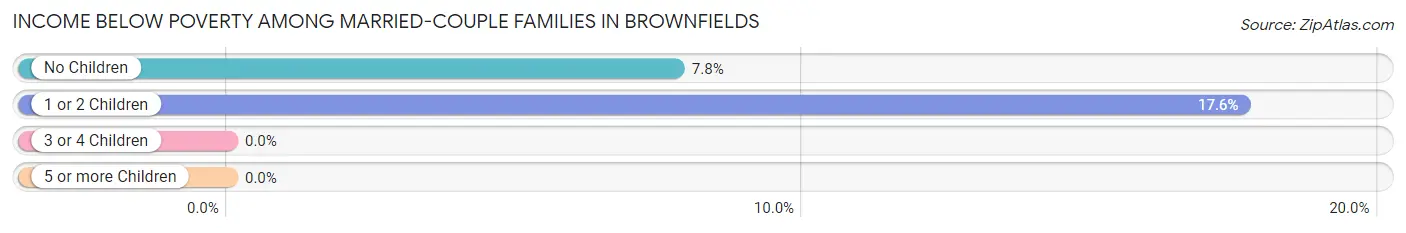
| Children | Above Poverty | Below Poverty |
| No Children | 415 (92.2%) | 35 (7.8%) |
| 1 or 2 Children | 159 (82.4%) | 34 (17.6%) |
| 3 or 4 Children | 0 (0.0%) | 0 (0.0%) |
| 5 or more Children | 0 (0.0%) | 0 (0.0%) |
| Total | 574 (89.3%) | 69 (10.7%) |
Income Below Poverty Among Single-Parent Households in Brownfields
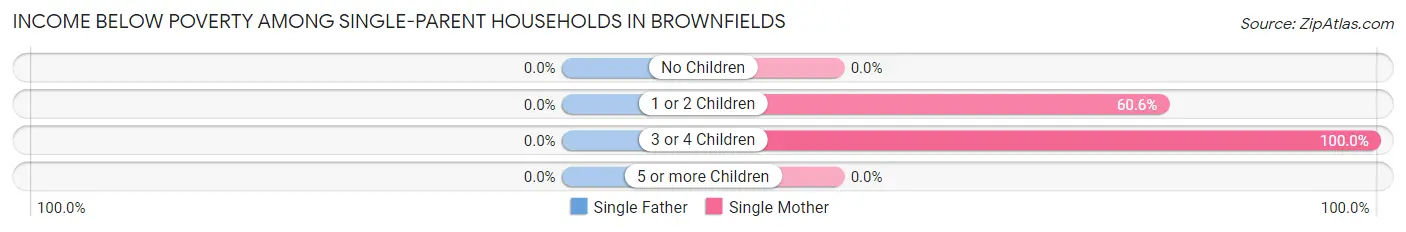
| Children | Single Father | Single Mother |
| No Children | 0 (0.0%) | 0 (0.0%) |
| 1 or 2 Children | 0 (0.0%) | 40 (60.6%) |
| 3 or 4 Children | 0 (0.0%) | 147 (100.0%) |
| 5 or more Children | 0 (0.0%) | 0 (0.0%) |
| Total | 0 (0.0%) | 187 (44.6%) |
Income Below Poverty Among Married-Couple vs Single-Parent Households in Brownfields
The poverty data for Brownfields shows that 69 of the married-couple family households (10.7%) and 187 of the single-parent households (38.8%) are living below the poverty level. Within the married-couple family households, those with 1 or 2 children have the highest poverty rate, with 34 households (17.6%) falling below the poverty line. Among the single-parent households, those with 3 or 4 children have the highest poverty rate, with 147 household (83.1%) living below poverty.
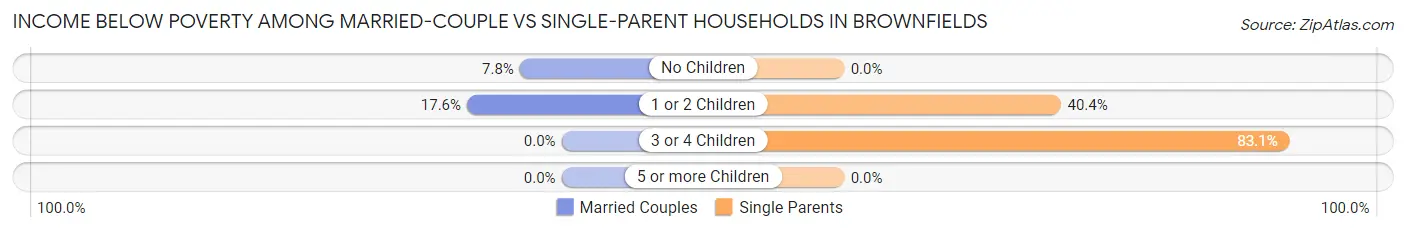
| Children | Married-Couple Families | Single-Parent Households |
| No Children | 35 (7.8%) | 0 (0.0%) |
| 1 or 2 Children | 34 (17.6%) | 40 (40.4%) |
| 3 or 4 Children | 0 (0.0%) | 147 (83.1%) |
| 5 or more Children | 0 (0.0%) | 0 (0.0%) |
| Total | 69 (10.7%) | 187 (38.8%) |
Race in Brownfields
The most populous races in Brownfields are Black / African American (4,262 | 79.5%), White / Caucasian (987 | 18.4%), and Two or more Races (102 | 1.9%).
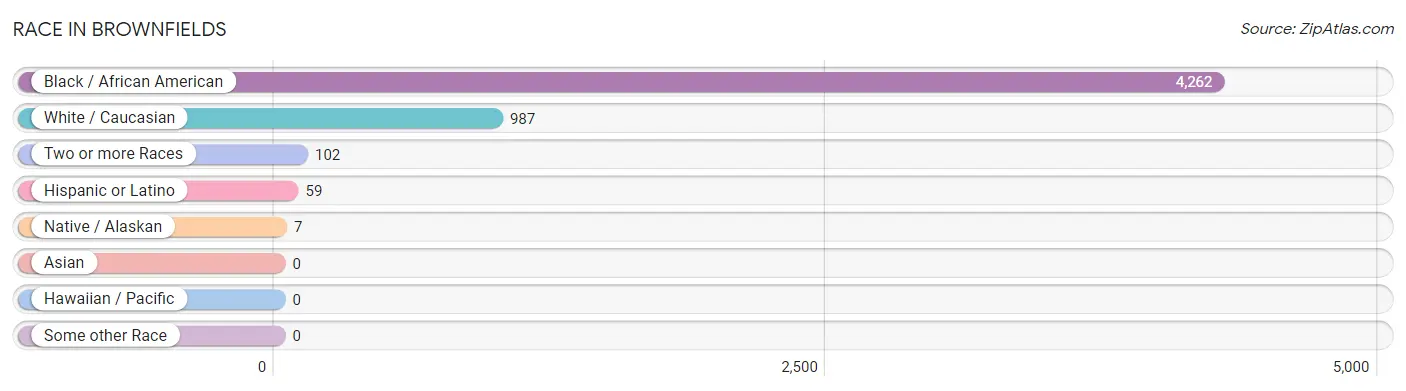
| Race | # Population | % Population |
| Asian | 0 | 0.0% |
| Black / African American | 4,262 | 79.5% |
| Hawaiian / Pacific | 0 | 0.0% |
| Hispanic or Latino | 59 | 1.1% |
| Native / Alaskan | 7 | 0.1% |
| White / Caucasian | 987 | 18.4% |
| Two or more Races | 102 | 1.9% |
| Some other Race | 0 | 0.0% |
| Total | 5,358 | 100.0% |
Ancestry in Brownfields
The most populous ancestries reported in Brownfields are French (208 | 3.9%), American (100 | 1.9%), English (72 | 1.3%), European (65 | 1.2%), and Central American (59 | 1.1%), together accounting for 9.4% of all Brownfields residents.
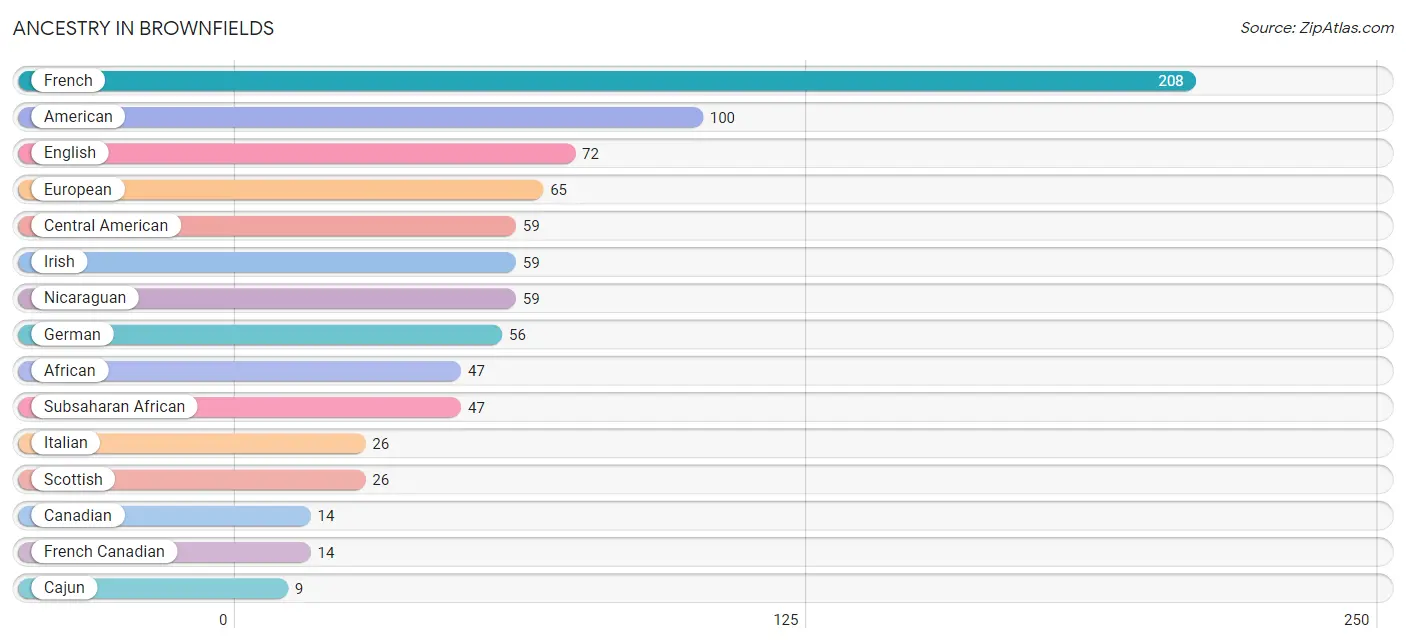
| Ancestry | # Population | % Population |
| African | 47 | 0.9% |
| American | 100 | 1.9% |
| Cajun | 9 | 0.2% |
| Canadian | 14 | 0.3% |
| Central American | 59 | 1.1% |
| Choctaw | 2 | 0.0% |
| English | 72 | 1.3% |
| European | 65 | 1.2% |
| French | 208 | 3.9% |
| French Canadian | 14 | 0.3% |
| German | 56 | 1.1% |
| Irish | 59 | 1.1% |
| Italian | 26 | 0.5% |
| Nicaraguan | 59 | 1.1% |
| Scottish | 26 | 0.5% |
| Subsaharan African | 47 | 0.9% | View All 16 Rows |
Immigrants in Brownfields
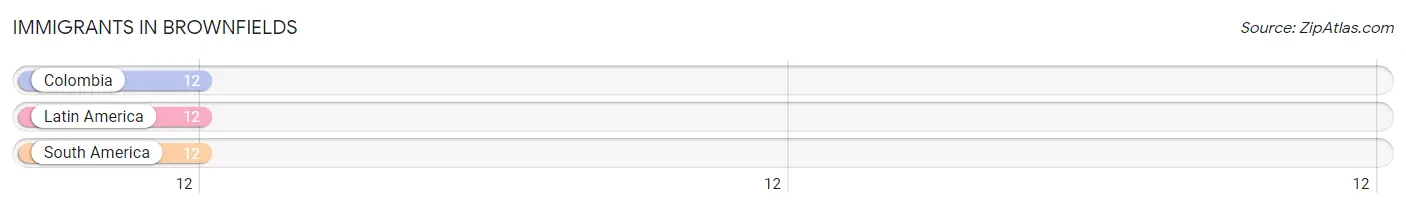
The most numerous immigrant groups reported in Brownfields came from Colombia (12 | 0.2%), Latin America (12 | 0.2%), and South America (12 | 0.2%), together accounting for 0.7% of all Brownfields residents.
| Immigration Origin | # Population | % Population |
| Colombia | 12 | 0.2% |
| Latin America | 12 | 0.2% |
| South America | 12 | 0.2% | View All 3 Rows |
Sex and Age in Brownfields
Sex and Age in Brownfields
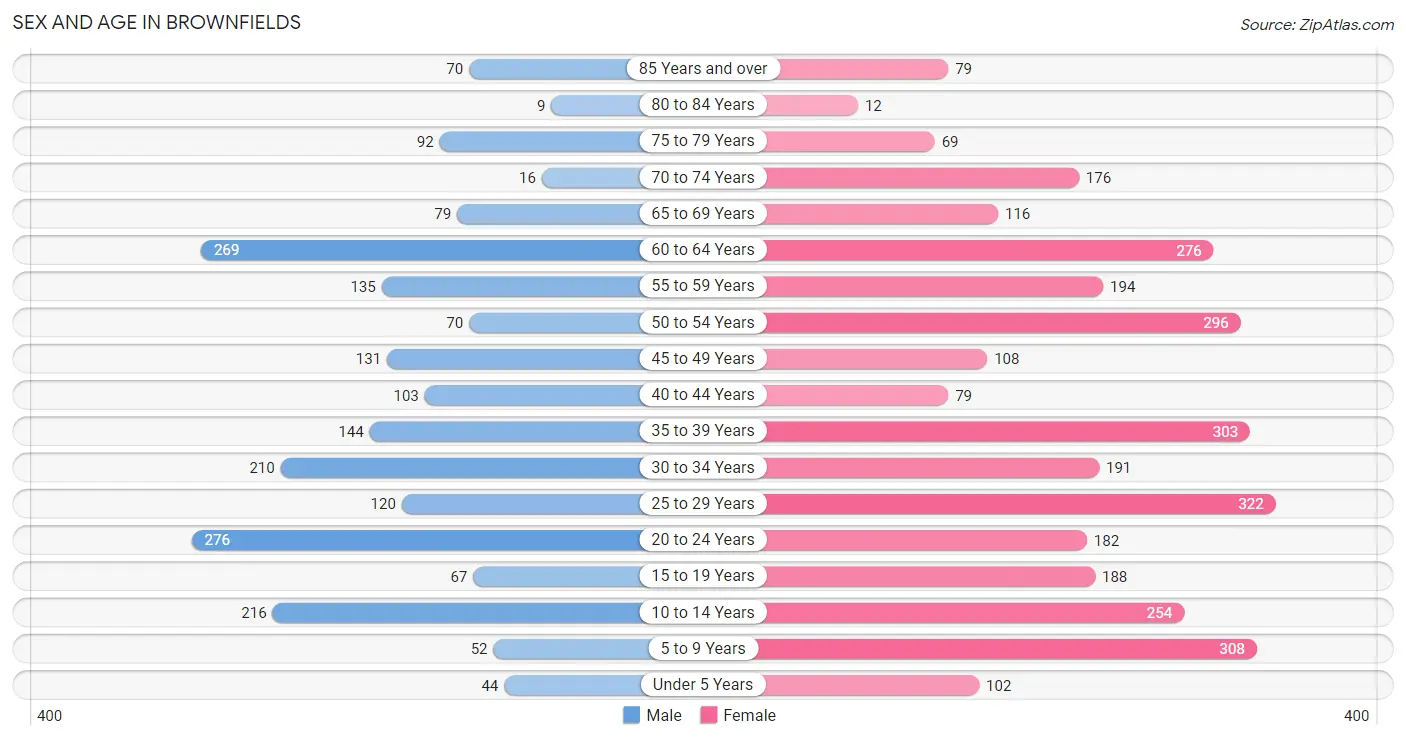
The most populous age groups in Brownfields are 20 to 24 Years (276 | 13.1%) for men and 25 to 29 Years (322 | 9.9%) for women.
| Age Bracket | Male | Female |
| Under 5 Years | 44 (2.1%) | 102 (3.1%) |
| 5 to 9 Years | 52 (2.5%) | 308 (9.5%) |
| 10 to 14 Years | 216 (10.3%) | 254 (7.8%) |
| 15 to 19 Years | 67 (3.2%) | 188 (5.8%) |
| 20 to 24 Years | 276 (13.1%) | 182 (5.6%) |
| 25 to 29 Years | 120 (5.7%) | 322 (9.9%) |
| 30 to 34 Years | 210 (10.0%) | 191 (5.9%) |
| 35 to 39 Years | 144 (6.9%) | 303 (9.3%) |
| 40 to 44 Years | 103 (4.9%) | 79 (2.4%) |
| 45 to 49 Years | 131 (6.2%) | 108 (3.3%) |
| 50 to 54 Years | 70 (3.3%) | 296 (9.1%) |
| 55 to 59 Years | 135 (6.4%) | 194 (6.0%) |
| 60 to 64 Years | 269 (12.8%) | 276 (8.5%) |
| 65 to 69 Years | 79 (3.8%) | 116 (3.6%) |
| 70 to 74 Years | 16 (0.8%) | 176 (5.4%) |
| 75 to 79 Years | 92 (4.4%) | 69 (2.1%) |
| 80 to 84 Years | 9 (0.4%) | 12 (0.4%) |
| 85 Years and over | 70 (3.3%) | 79 (2.4%) |
| Total | 2,103 (100.0%) | 3,255 (100.0%) |
Families and Households in Brownfields
Median Family Size in Brownfields
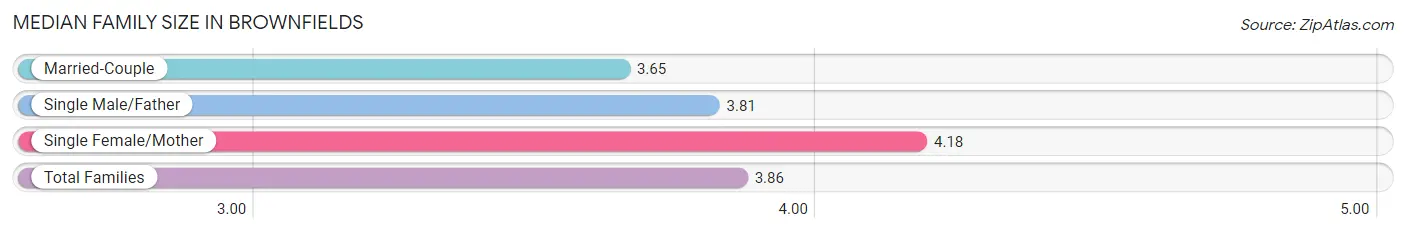
The median family size in Brownfields is 3.86 persons per family, with single female/mother families (419 | 37.2%) accounting for the largest median family size of 4.18 persons per family. On the other hand, married-couple families (643 | 57.2%) represent the smallest median family size with 3.65 persons per family.
| Family Type | # Families | Family Size |
| Married-Couple | 643 (57.2%) | 3.65 |
| Single Male/Father | 63 (5.6%) | 3.81 |
| Single Female/Mother | 419 (37.2%) | 4.18 |
| Total Families | 1,125 (100.0%) | 3.86 |
Median Household Size in Brownfields
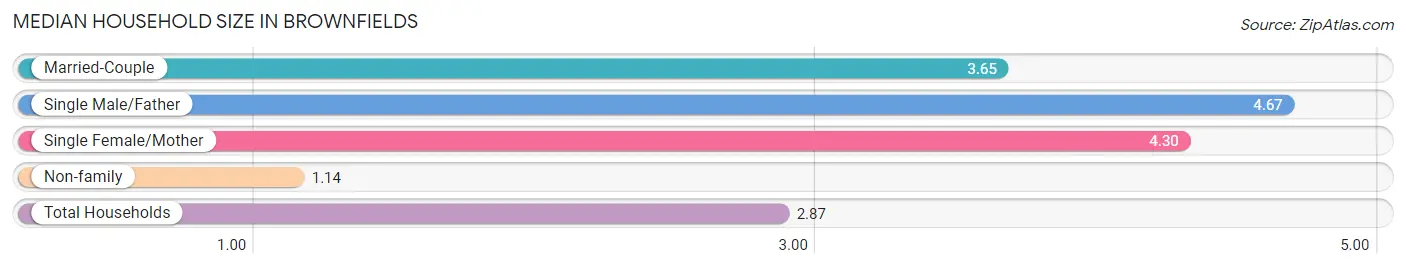
The median household size in Brownfields is 2.87 persons per household, with single male/father households (63 | 3.4%) accounting for the largest median household size of 4.67 persons per household. non-family households (706 | 38.6%) represent the smallest median household size with 1.14 persons per household.
| Household Type | # Households | Household Size |
| Married-Couple | 643 (35.1%) | 3.65 |
| Single Male/Father | 63 (3.4%) | 4.67 |
| Single Female/Mother | 419 (22.9%) | 4.30 |
| Non-family | 706 (38.6%) | 1.14 |
| Total Households | 1,831 (100.0%) | 2.87 |
Household Size by Marriage Status in Brownfields
Out of a total of 1,831 households in Brownfields, 1,125 (61.4%) are family households, while 706 (38.6%) are nonfamily households. The most numerous type of family households are 2-person households, comprising 499, and the most common type of nonfamily households are 1-person households, comprising 627.
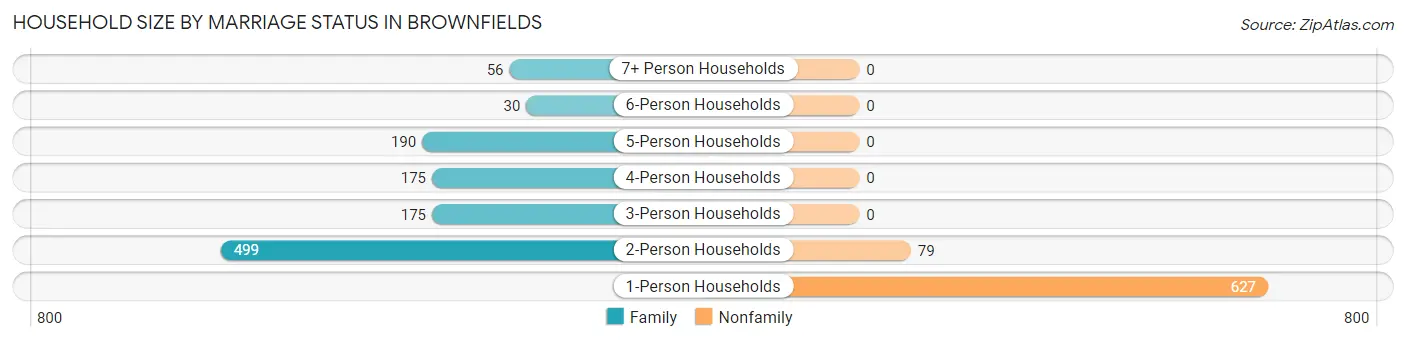
| Household Size | Family Households | Nonfamily Households |
| 1-Person Households | - | 627 (34.2%) |
| 2-Person Households | 499 (27.3%) | 79 (4.3%) |
| 3-Person Households | 175 (9.6%) | 0 (0.0%) |
| 4-Person Households | 175 (9.6%) | 0 (0.0%) |
| 5-Person Households | 190 (10.4%) | 0 (0.0%) |
| 6-Person Households | 30 (1.6%) | 0 (0.0%) |
| 7+ Person Households | 56 (3.1%) | 0 (0.0%) |
| Total | 1,125 (61.4%) | 706 (38.6%) |
Female Fertility in Brownfields
Fertility by Age in Brownfields
Average fertility rate in Brownfields is 30.0 births per 1,000 women. Women in the age bracket of 35 to 50 years have the highest fertility rate with 54.0 births per 1,000 women. Women in the age bracket of 35 to 50 years acount for 72.7% of all women with births.
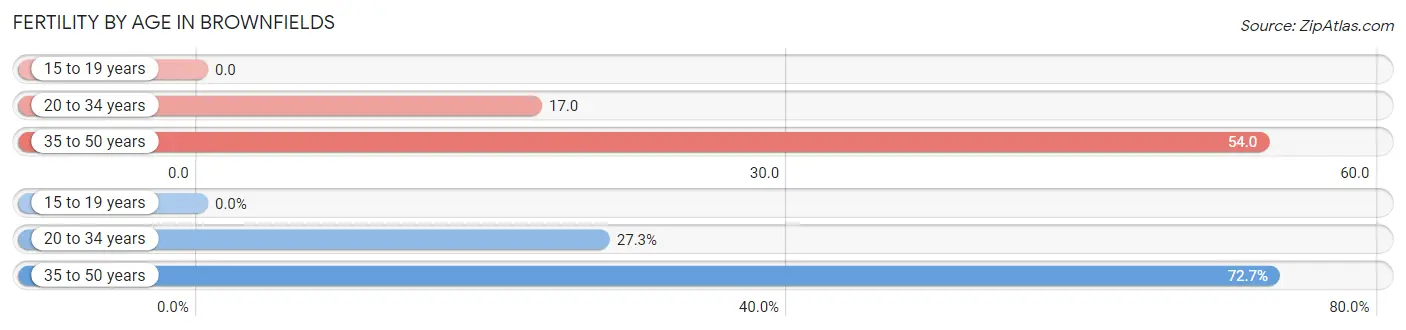
| Age Bracket | Women with Births | Births / 1,000 Women |
| 15 to 19 years | 0 (0.0%) | 0.0 |
| 20 to 34 years | 12 (27.3%) | 17.0 |
| 35 to 50 years | 32 (72.7%) | 54.0 |
| Total | 44 (100.0%) | 30.0 |
Fertility by Age by Marriage Status in Brownfields
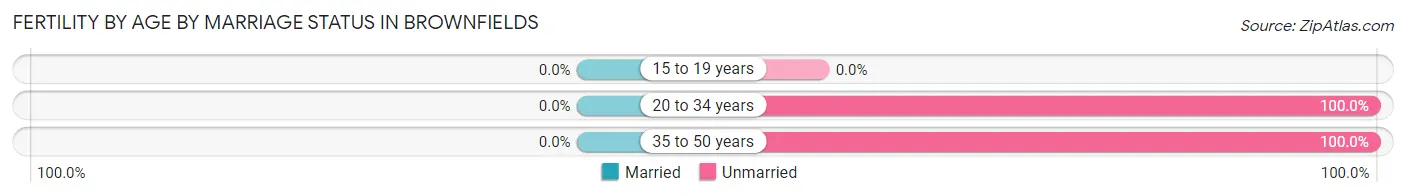
| Age Bracket | Married | Unmarried |
| 15 to 19 years | 0 (0.0%) | 0 (0.0%) |
| 20 to 34 years | 0 (0.0%) | 12 (100.0%) |
| 35 to 50 years | 0 (0.0%) | 32 (100.0%) |
| Total | 0 (0.0%) | 44 (100.0%) |
Fertility by Education in Brownfields
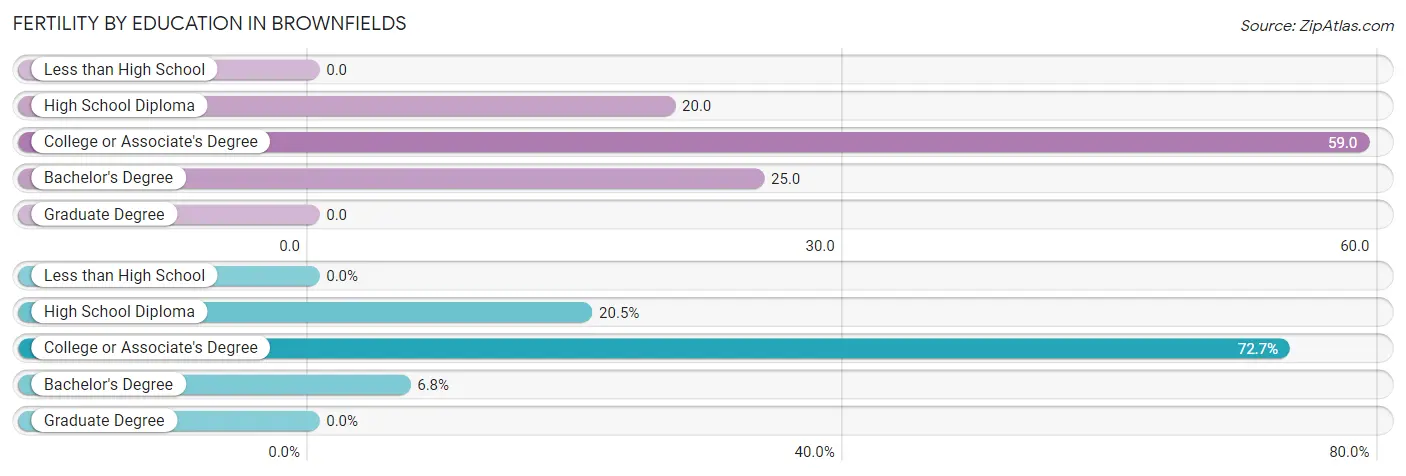
| Educational Attainment | Women with Births | Births / 1,000 Women |
| Less than High School | 0 (0.0%) | 0.0 |
| High School Diploma | 9 (20.4%) | 20.0 |
| College or Associate's Degree | 32 (72.7%) | 59.0 |
| Bachelor's Degree | 3 (6.8%) | 25.0 |
| Graduate Degree | 0 (0.0%) | 0.0 |
| Total | 44 (100.0%) | 30.0 |
Fertility by Education by Marriage Status in Brownfields
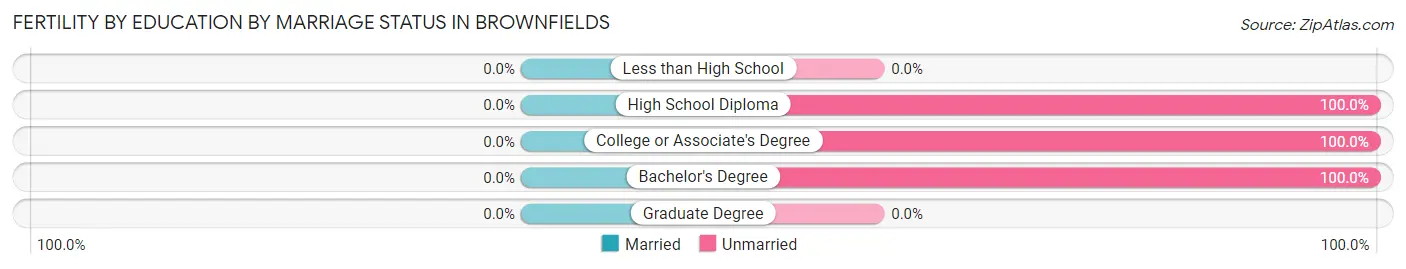
| Educational Attainment | Married | Unmarried |
| Less than High School | 0 (0.0%) | 0 (0.0%) |
| High School Diploma | 0 (0.0%) | 9 (100.0%) |
| College or Associate's Degree | 0 (0.0%) | 32 (100.0%) |
| Bachelor's Degree | 0 (0.0%) | 3 (100.0%) |
| Graduate Degree | 0 (0.0%) | 0 (0.0%) |
| Total | 0 (0.0%) | 44 (100.0%) |
Employment Characteristics in Brownfields
Employment by Class of Employer in Brownfields
Among the 2,563 employed individuals in Brownfields, private company employees (1,629 | 63.6%), not-for-profit organizations (303 | 11.8%), and local government employees (264 | 10.3%) make up the most common classes of employment.
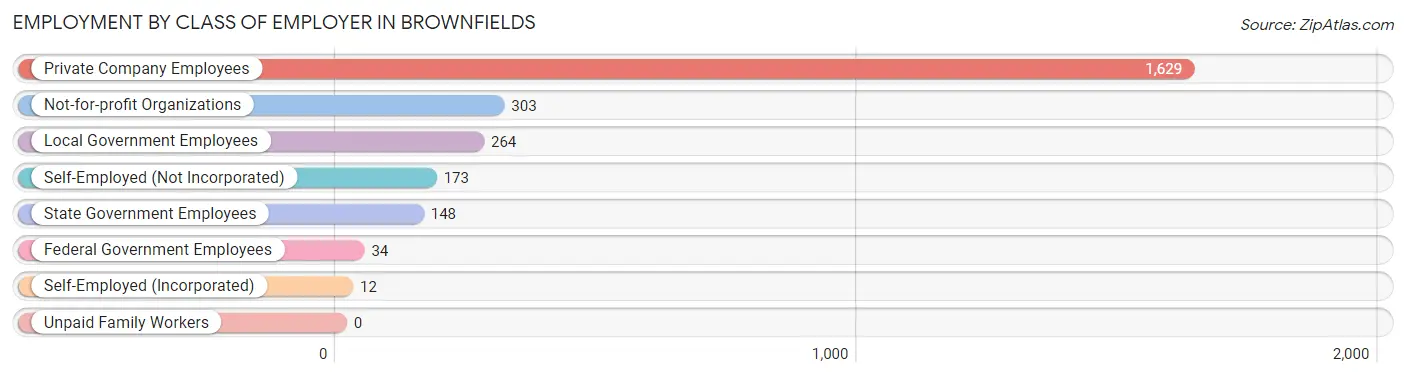
| Employer Class | # Employees | % Employees |
| Private Company Employees | 1,629 | 63.6% |
| Self-Employed (Incorporated) | 12 | 0.5% |
| Self-Employed (Not Incorporated) | 173 | 6.8% |
| Not-for-profit Organizations | 303 | 11.8% |
| Local Government Employees | 264 | 10.3% |
| State Government Employees | 148 | 5.8% |
| Federal Government Employees | 34 | 1.3% |
| Unpaid Family Workers | 0 | 0.0% |
| Total | 2,563 | 100.0% |
Employment Status by Age in Brownfields
According to the labor force statistics for Brownfields, out of the total population over 16 years of age (4,318), 64.3% or 2,776 individuals are in the labor force, with 7.6% or 211 of them unemployed. The age group with the highest labor force participation rate is 45 to 54 years, with 89.8% or 543 individuals in the labor force. Within the labor force, the 45 to 54 years age range has the highest percentage of unemployed individuals, with 19.5% or 106 of them being unemployed.
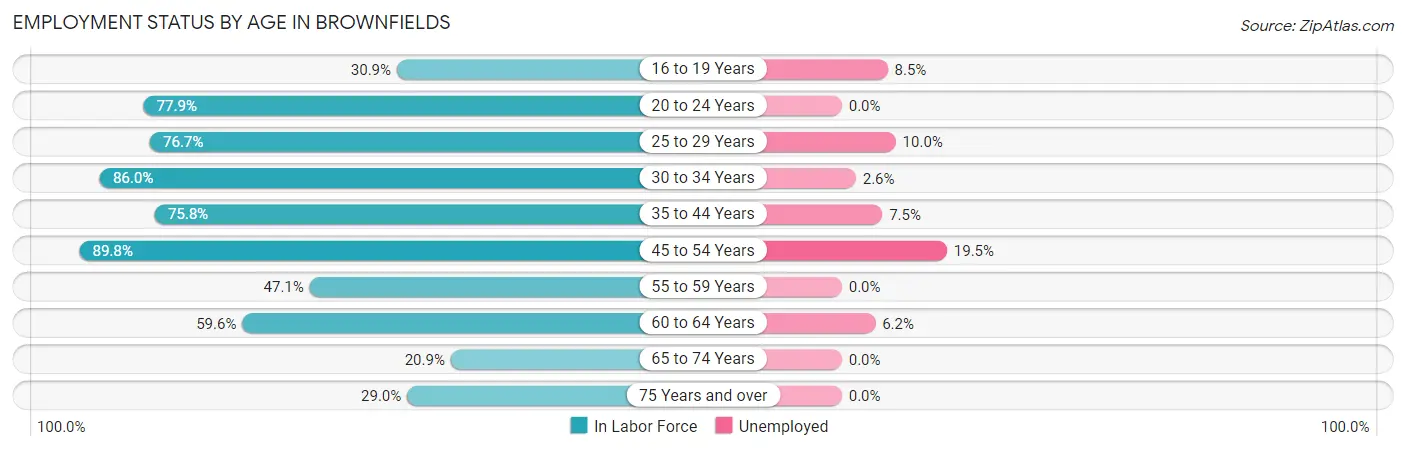
| Age Bracket | In Labor Force | Unemployed |
| 16 to 19 Years | 59 (30.9%) | 5 (8.5%) |
| 20 to 24 Years | 357 (77.9%) | 0 (0.0%) |
| 25 to 29 Years | 339 (76.7%) | 34 (10.0%) |
| 30 to 34 Years | 345 (86.0%) | 9 (2.6%) |
| 35 to 44 Years | 477 (75.8%) | 36 (7.5%) |
| 45 to 54 Years | 543 (89.8%) | 106 (19.5%) |
| 55 to 59 Years | 155 (47.1%) | 0 (0.0%) |
| 60 to 64 Years | 325 (59.6%) | 20 (6.2%) |
| 65 to 74 Years | 81 (20.9%) | 0 (0.0%) |
| 75 Years and over | 96 (29.0%) | 0 (0.0%) |
| Total | 2,776 (64.3%) | 211 (7.6%) |
Employment Status by Educational Attainment in Brownfields
According to labor force statistics for Brownfields, 74.0% of individuals (2,184) out of the total population between 25 and 64 years of age (2,951) are in the labor force, with 9.4% or 205 of them being unemployed. The group with the highest labor force participation rate are those with the educational attainment of bachelor's degree or higher, with 93.4% or 523 individuals in the labor force. Within the labor force, individuals with college / associate degree education have the highest percentage of unemployment, with 18.0% or 124 of them being unemployed.
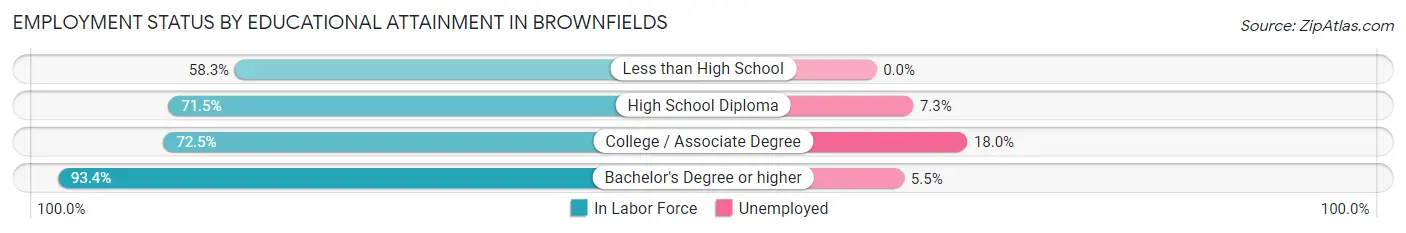
| Educational Attainment | In Labor Force | Unemployed |
| Less than High School | 254 (58.3%) | 0 (0.0%) |
| High School Diploma | 717 (71.5%) | 73 (7.3%) |
| College / Associate Degree | 690 (72.5%) | 171 (18.0%) |
| Bachelor's Degree or higher | 523 (93.4%) | 31 (5.5%) |
| Total | 2,184 (74.0%) | 277 (9.4%) |
Employment Occupations by Sex in Brownfields
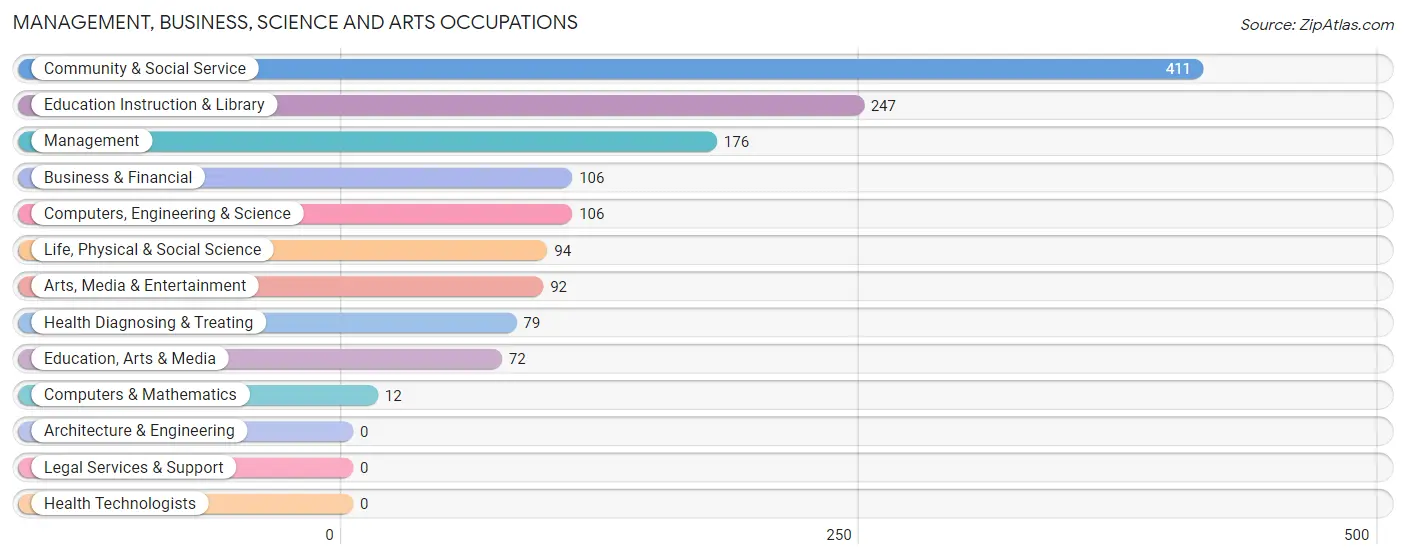
Management, Business, Science and Arts Occupations
The most common Management, Business, Science and Arts occupations in Brownfields are Community & Social Service (411 | 16.0%), Education Instruction & Library (247 | 9.6%), Management (176 | 6.9%), Business & Financial (106 | 4.1%), and Computers, Engineering & Science (106 | 4.1%).
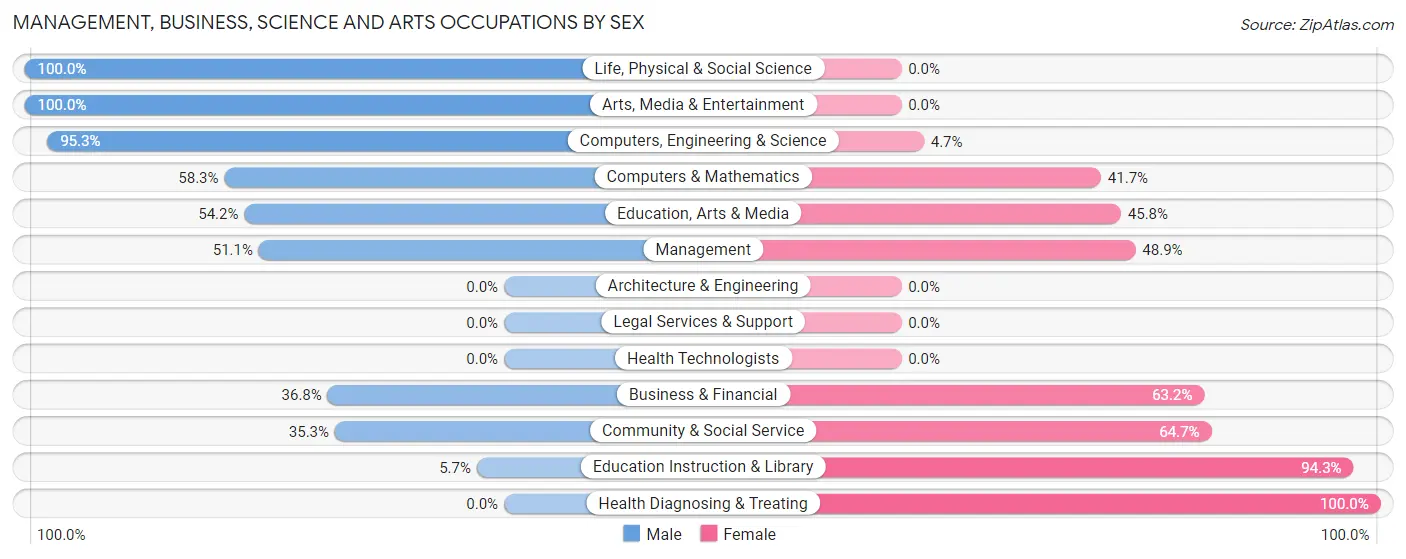
Management, Business, Science and Arts Occupations by Sex
Within the Management, Business, Science and Arts occupations in Brownfields, the most male-oriented occupations are Life, Physical & Social Science (100.0%), Arts, Media & Entertainment (100.0%), and Computers, Engineering & Science (95.3%), while the most female-oriented occupations are Health Diagnosing & Treating (100.0%), Education Instruction & Library (94.3%), and Community & Social Service (64.7%).
| Occupation | Male | Female |
| Management | 90 (51.1%) | 86 (48.9%) |
| Business & Financial | 39 (36.8%) | 67 (63.2%) |
| Computers, Engineering & Science | 101 (95.3%) | 5 (4.7%) |
| Computers & Mathematics | 7 (58.3%) | 5 (41.7%) |
| Architecture & Engineering | 0 (0.0%) | 0 (0.0%) |
| Life, Physical & Social Science | 94 (100.0%) | 0 (0.0%) |
| Community & Social Service | 145 (35.3%) | 266 (64.7%) |
| Education, Arts & Media | 39 (54.2%) | 33 (45.8%) |
| Legal Services & Support | 0 (0.0%) | 0 (0.0%) |
| Education Instruction & Library | 14 (5.7%) | 233 (94.3%) |
| Arts, Media & Entertainment | 92 (100.0%) | 0 (0.0%) |
| Health Diagnosing & Treating | 0 (0.0%) | 79 (100.0%) |
| Health Technologists | 0 (0.0%) | 0 (0.0%) |
| Total (Category) | 375 (42.7%) | 503 (57.3%) |
| Total (Overall) | 1,109 (43.2%) | 1,458 (56.8%) |
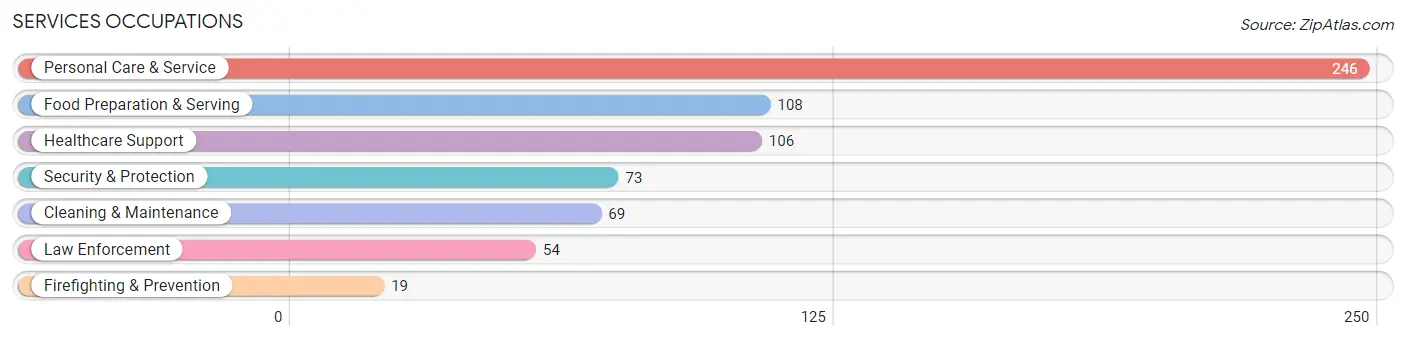
Services Occupations
The most common Services occupations in Brownfields are Personal Care & Service (246 | 9.6%), Food Preparation & Serving (108 | 4.2%), Healthcare Support (106 | 4.1%), Security & Protection (73 | 2.8%), and Cleaning & Maintenance (69 | 2.7%).
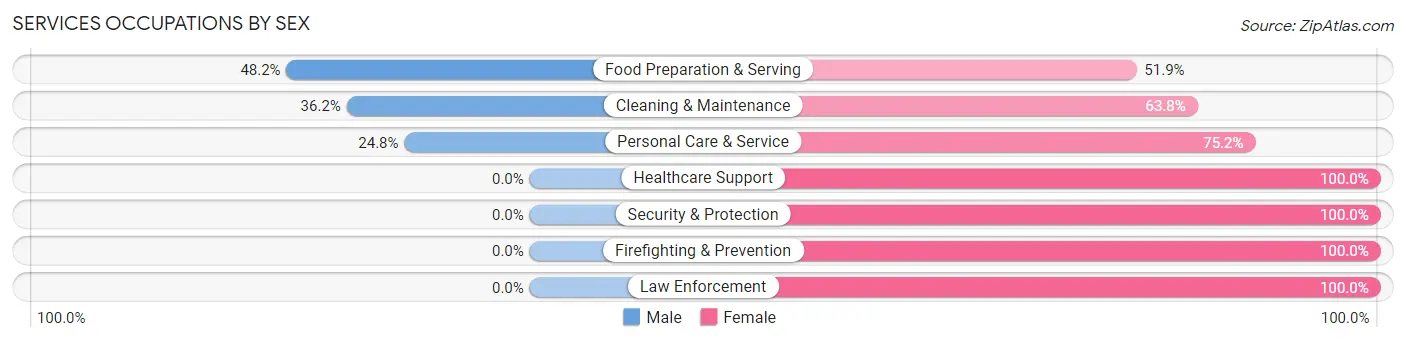
Services Occupations by Sex
Within the Services occupations in Brownfields, the most male-oriented occupations are Food Preparation & Serving (48.1%), Cleaning & Maintenance (36.2%), and Personal Care & Service (24.8%), while the most female-oriented occupations are Healthcare Support (100.0%), Security & Protection (100.0%), and Firefighting & Prevention (100.0%).
| Occupation | Male | Female |
| Healthcare Support | 0 (0.0%) | 106 (100.0%) |
| Security & Protection | 0 (0.0%) | 73 (100.0%) |
| Firefighting & Prevention | 0 (0.0%) | 19 (100.0%) |
| Law Enforcement | 0 (0.0%) | 54 (100.0%) |
| Food Preparation & Serving | 52 (48.1%) | 56 (51.8%) |
| Cleaning & Maintenance | 25 (36.2%) | 44 (63.8%) |
| Personal Care & Service | 61 (24.8%) | 185 (75.2%) |
| Total (Category) | 138 (22.9%) | 464 (77.1%) |
| Total (Overall) | 1,109 (43.2%) | 1,458 (56.8%) |
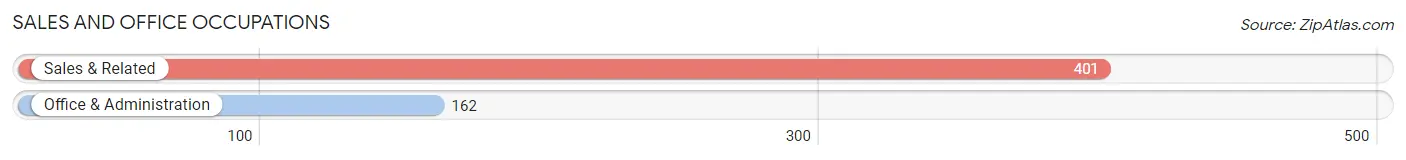
Sales and Office Occupations
The most common Sales and Office occupations in Brownfields are Sales & Related (401 | 15.6%), and Office & Administration (162 | 6.3%).
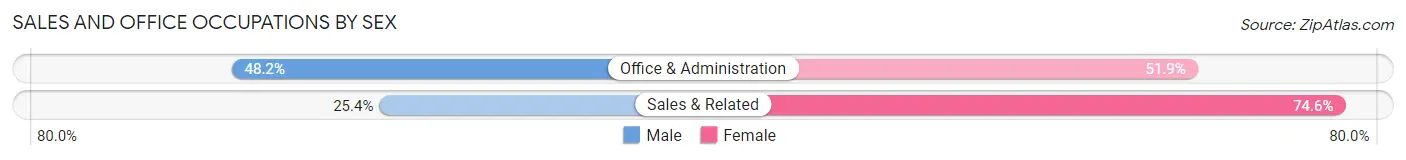
Sales and Office Occupations by Sex
| Occupation | Male | Female |
| Sales & Related | 102 (25.4%) | 299 (74.6%) |
| Office & Administration | 78 (48.1%) | 84 (51.8%) |
| Total (Category) | 180 (32.0%) | 383 (68.0%) |
| Total (Overall) | 1,109 (43.2%) | 1,458 (56.8%) |
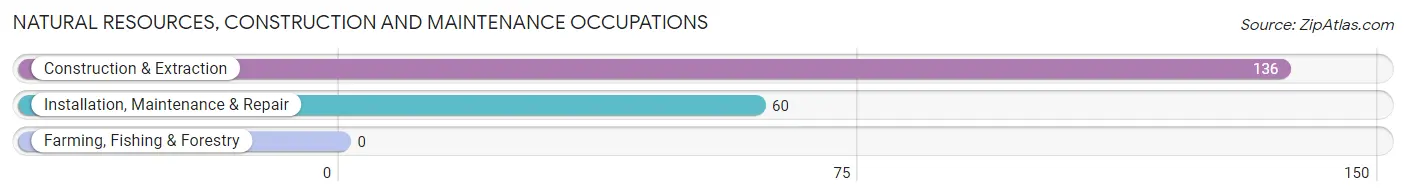
Natural Resources, Construction and Maintenance Occupations
The most common Natural Resources, Construction and Maintenance occupations in Brownfields are Construction & Extraction (136 | 5.3%), and Installation, Maintenance & Repair (60 | 2.3%).
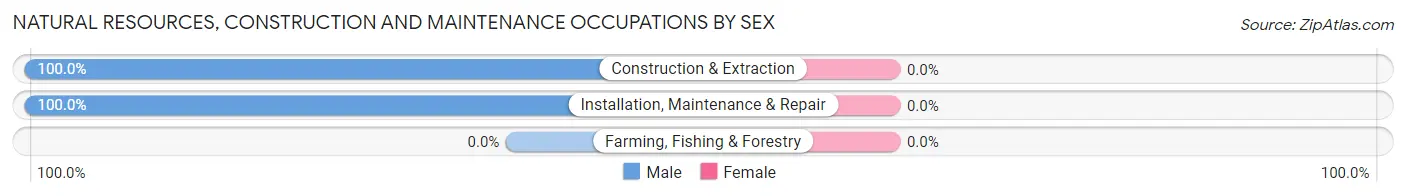
Natural Resources, Construction and Maintenance Occupations by Sex
| Occupation | Male | Female |
| Farming, Fishing & Forestry | 0 (0.0%) | 0 (0.0%) |
| Construction & Extraction | 136 (100.0%) | 0 (0.0%) |
| Installation, Maintenance & Repair | 60 (100.0%) | 0 (0.0%) |
| Total (Category) | 196 (100.0%) | 0 (0.0%) |
| Total (Overall) | 1,109 (43.2%) | 1,458 (56.8%) |
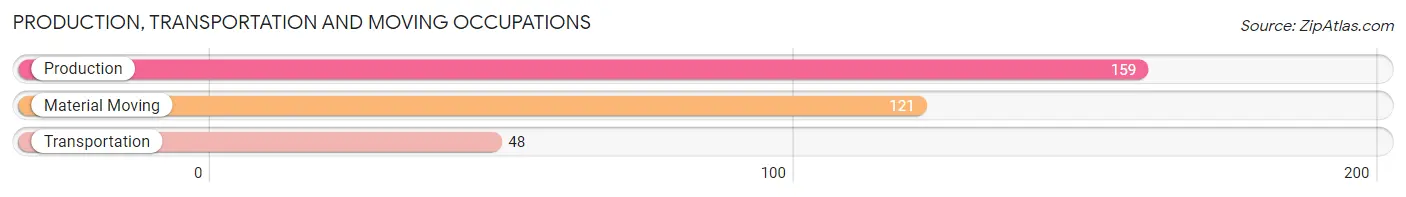
Production, Transportation and Moving Occupations
The most common Production, Transportation and Moving occupations in Brownfields are Production (159 | 6.2%), Material Moving (121 | 4.7%), and Transportation (48 | 1.9%).
Production, Transportation and Moving Occupations by Sex
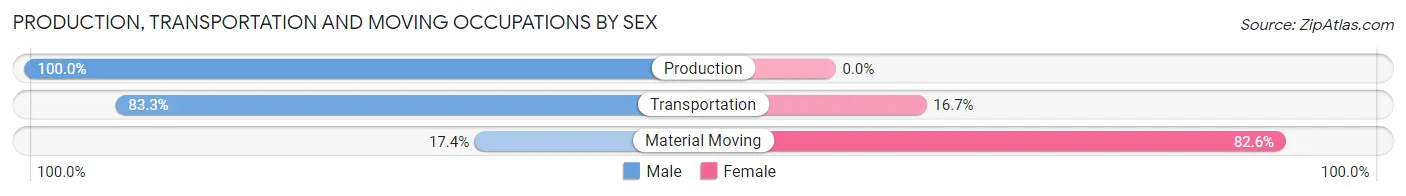
| Occupation | Male | Female |
| Production | 159 (100.0%) | 0 (0.0%) |
| Transportation | 40 (83.3%) | 8 (16.7%) |
| Material Moving | 21 (17.4%) | 100 (82.6%) |
| Total (Category) | 220 (67.1%) | 108 (32.9%) |
| Total (Overall) | 1,109 (43.2%) | 1,458 (56.8%) |
Employment Industries by Sex in Brownfields
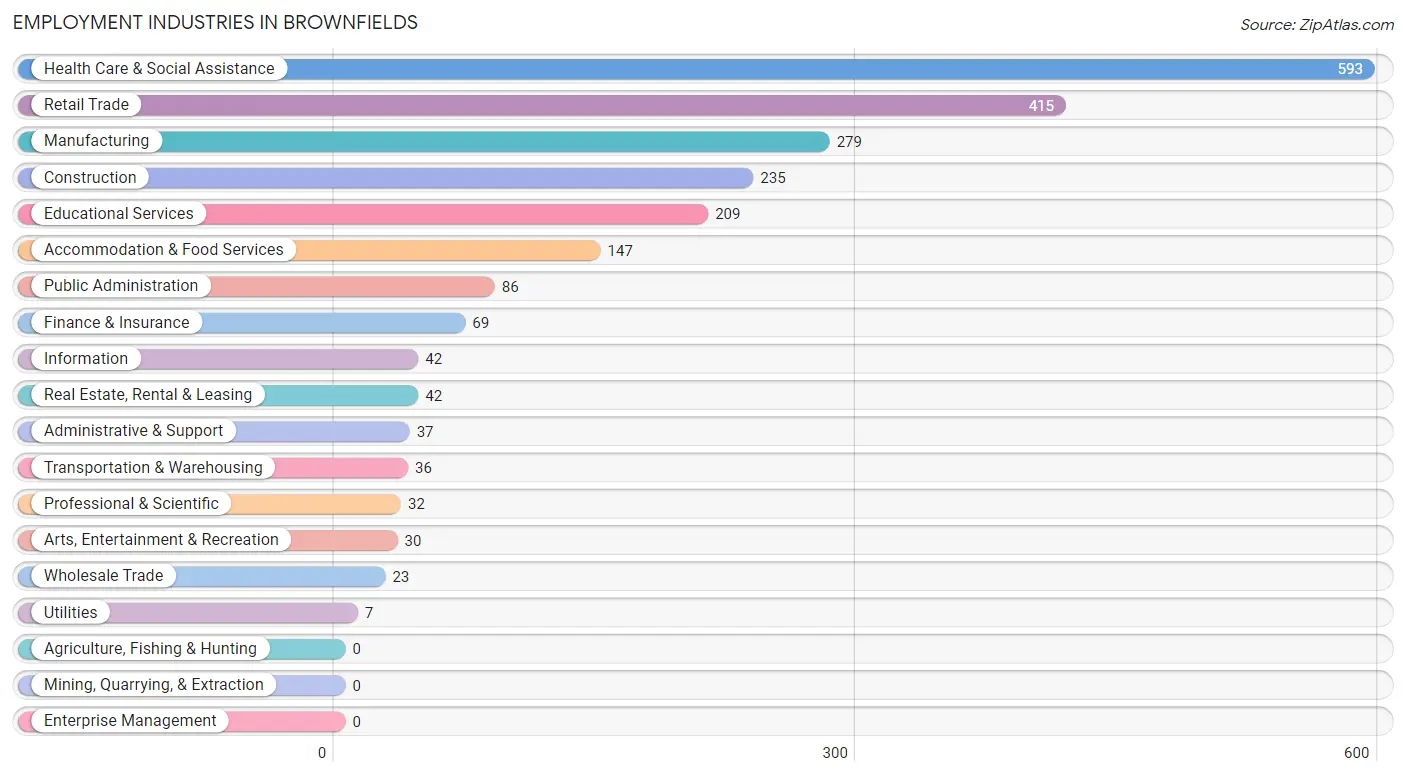
Employment Industries in Brownfields
The major employment industries in Brownfields include Health Care & Social Assistance (593 | 23.1%), Retail Trade (415 | 16.2%), Manufacturing (279 | 10.9%), Construction (235 | 9.1%), and Educational Services (209 | 8.1%).
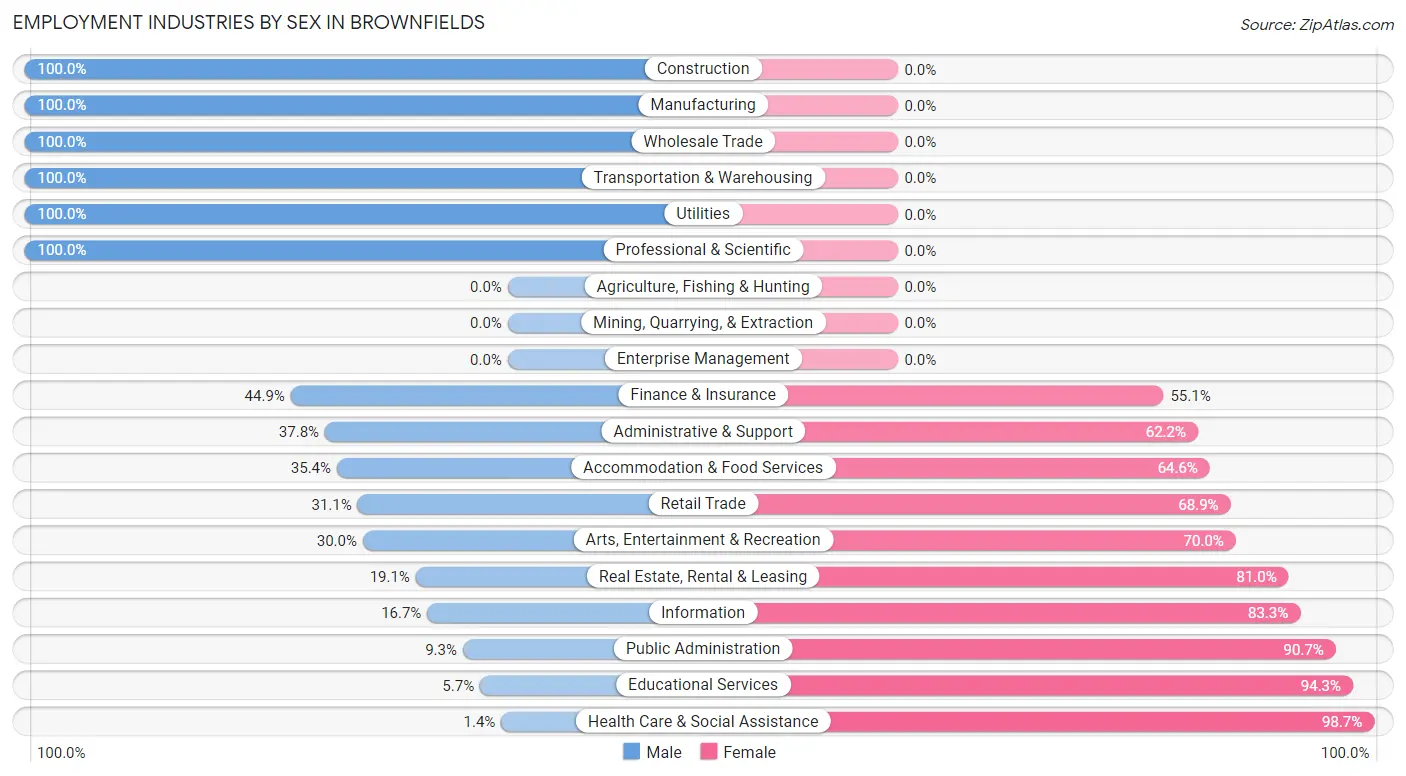
Employment Industries by Sex in Brownfields
The Brownfields industries that see more men than women are Construction (100.0%), Manufacturing (100.0%), and Wholesale Trade (100.0%), whereas the industries that tend to have a higher number of women are Health Care & Social Assistance (98.7%), Educational Services (94.3%), and Public Administration (90.7%).
| Industry | Male | Female |
| Agriculture, Fishing & Hunting | 0 (0.0%) | 0 (0.0%) |
| Mining, Quarrying, & Extraction | 0 (0.0%) | 0 (0.0%) |
| Construction | 235 (100.0%) | 0 (0.0%) |
| Manufacturing | 279 (100.0%) | 0 (0.0%) |
| Wholesale Trade | 23 (100.0%) | 0 (0.0%) |
| Retail Trade | 129 (31.1%) | 286 (68.9%) |
| Transportation & Warehousing | 36 (100.0%) | 0 (0.0%) |
| Utilities | 7 (100.0%) | 0 (0.0%) |
| Information | 7 (16.7%) | 35 (83.3%) |
| Finance & Insurance | 31 (44.9%) | 38 (55.1%) |
| Real Estate, Rental & Leasing | 8 (19.1%) | 34 (80.9%) |
| Professional & Scientific | 32 (100.0%) | 0 (0.0%) |
| Enterprise Management | 0 (0.0%) | 0 (0.0%) |
| Administrative & Support | 14 (37.8%) | 23 (62.2%) |
| Educational Services | 12 (5.7%) | 197 (94.3%) |
| Health Care & Social Assistance | 8 (1.3%) | 585 (98.7%) |
| Arts, Entertainment & Recreation | 9 (30.0%) | 21 (70.0%) |
| Accommodation & Food Services | 52 (35.4%) | 95 (64.6%) |
| Public Administration | 8 (9.3%) | 78 (90.7%) |
| Total | 1,109 (43.2%) | 1,458 (56.8%) |
Education in Brownfields
School Enrollment in Brownfields
The most common levels of schooling among the 1,374 students in Brownfields are middle school (391 | 28.5%), high school (300 | 21.8%), and elementary school (250 | 18.2%).
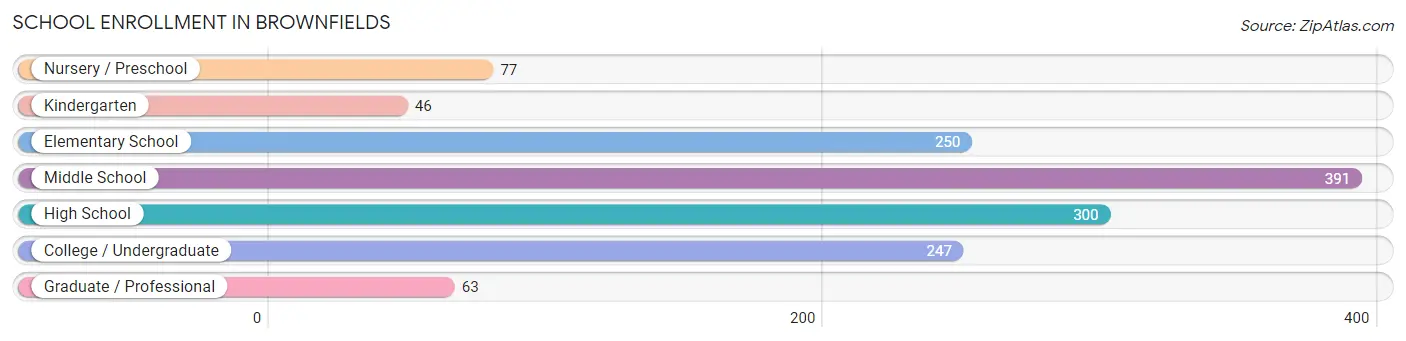
| School Level | # Students | % Students |
| Nursery / Preschool | 77 | 5.6% |
| Kindergarten | 46 | 3.4% |
| Elementary School | 250 | 18.2% |
| Middle School | 391 | 28.5% |
| High School | 300 | 21.8% |
| College / Undergraduate | 247 | 18.0% |
| Graduate / Professional | 63 | 4.6% |
| Total | 1,374 | 100.0% |
School Enrollment by Age by Funding Source in Brownfields
Out of a total of 1,374 students who are enrolled in schools in Brownfields, 315 (22.9%) attend a private institution, while the remaining 1,059 (77.1%) are enrolled in public schools. The age group of 3 to 4 year olds has the highest likelihood of being enrolled in private schools, with 34 (97.1% in the age bracket) enrolled. Conversely, the age group of 18 to 19 year olds has the lowest likelihood of being enrolled in a private school, with 79 (100.0% in the age bracket) attending a public institution.
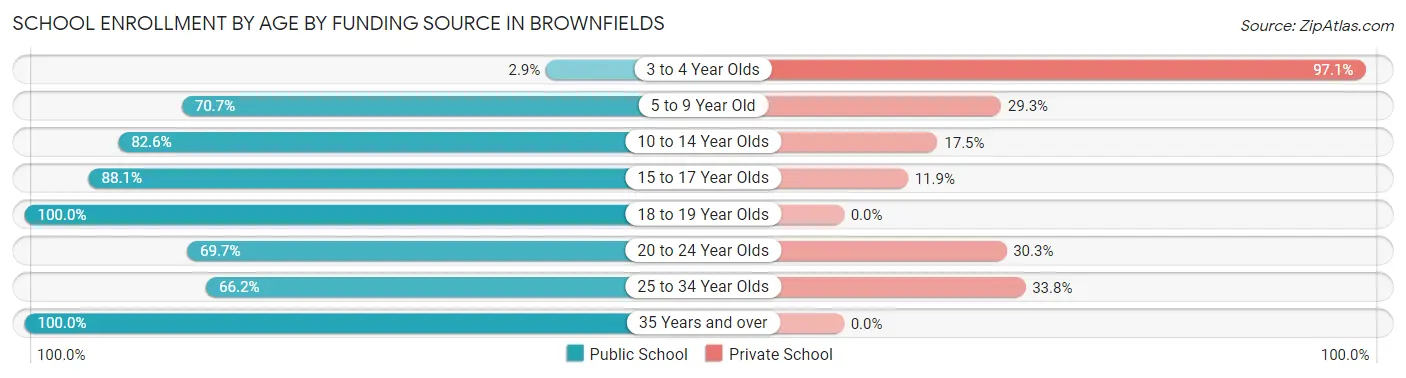
| Age Bracket | Public School | Private School |
| 3 to 4 Year Olds | 1 (2.9%) | 34 (97.1%) |
| 5 to 9 Year Old | 239 (70.7%) | 99 (29.3%) |
| 10 to 14 Year Olds | 388 (82.6%) | 82 (17.4%) |
| 15 to 17 Year Olds | 155 (88.1%) | 21 (11.9%) |
| 18 to 19 Year Olds | 79 (100.0%) | 0 (0.0%) |
| 20 to 24 Year Olds | 76 (69.7%) | 33 (30.3%) |
| 25 to 34 Year Olds | 90 (66.2%) | 46 (33.8%) |
| 35 Years and over | 31 (100.0%) | 0 (0.0%) |
| Total | 1,059 (77.1%) | 315 (22.9%) |
Educational Attainment by Field of Study in Brownfields
Education (197 | 27.1%), science & technology (145 | 20.0%), business (126 | 17.4%), bio, nature & agricultural (95 | 13.1%), and psychology (44 | 6.1%) are the most common fields of study among 726 individuals in Brownfields who have obtained a bachelor's degree or higher.
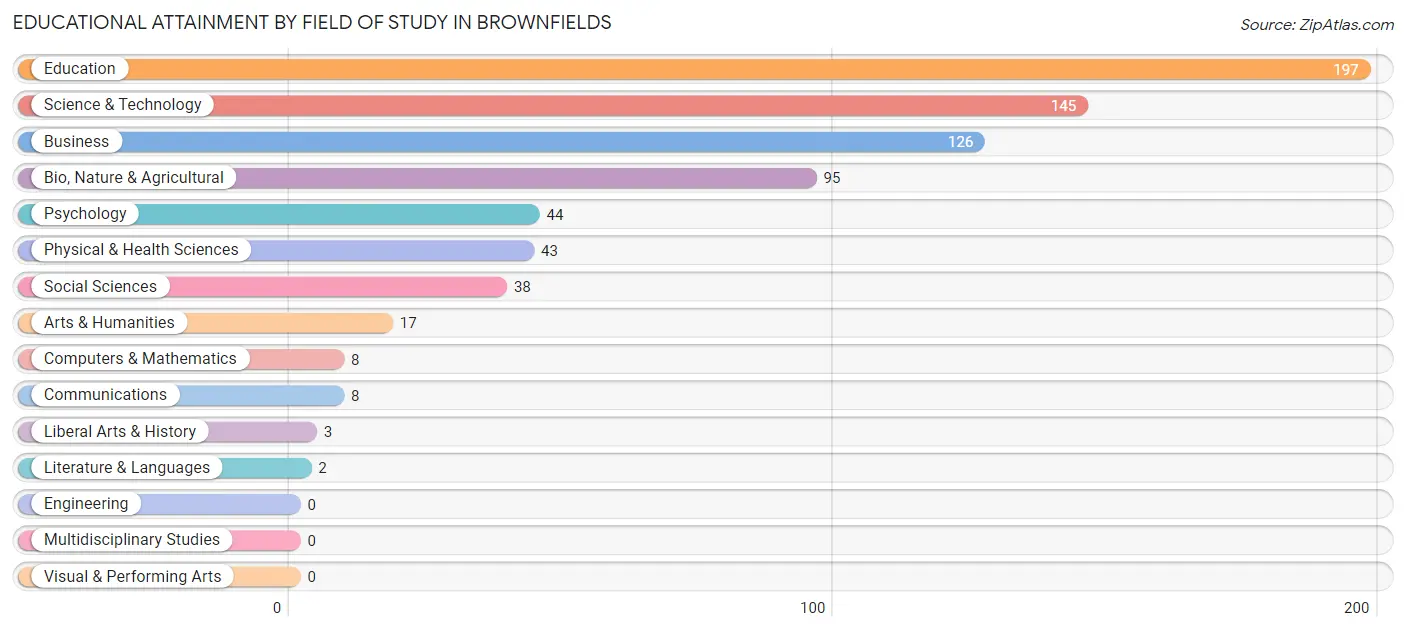
| Field of Study | # Graduates | % Graduates |
| Computers & Mathematics | 8 | 1.1% |
| Bio, Nature & Agricultural | 95 | 13.1% |
| Physical & Health Sciences | 43 | 5.9% |
| Psychology | 44 | 6.1% |
| Social Sciences | 38 | 5.2% |
| Engineering | 0 | 0.0% |
| Multidisciplinary Studies | 0 | 0.0% |
| Science & Technology | 145 | 20.0% |
| Business | 126 | 17.4% |
| Education | 197 | 27.1% |
| Literature & Languages | 2 | 0.3% |
| Liberal Arts & History | 3 | 0.4% |
| Visual & Performing Arts | 0 | 0.0% |
| Communications | 8 | 1.1% |
| Arts & Humanities | 17 | 2.3% |
| Total | 726 | 100.0% |
Transportation & Commute in Brownfields
Vehicle Availability by Sex in Brownfields
The most prevalent vehicle ownership categories in Brownfields are males with 2 vehicles (462, accounting for 41.7%) and females with 2 vehicles (456, making up 31.8%).
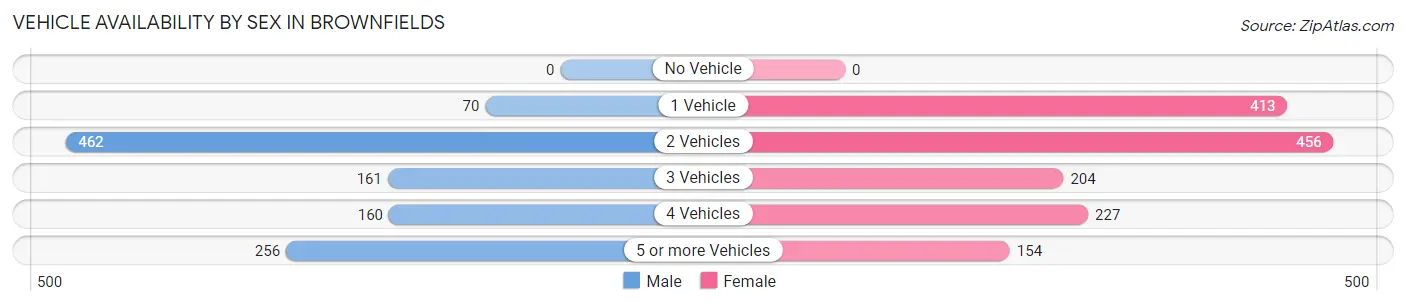
| Vehicles Available | Male | Female |
| No Vehicle | 0 (0.0%) | 0 (0.0%) |
| 1 Vehicle | 70 (6.3%) | 413 (28.4%) |
| 2 Vehicles | 462 (41.7%) | 456 (31.4%) |
| 3 Vehicles | 161 (14.5%) | 204 (14.0%) |
| 4 Vehicles | 160 (14.4%) | 227 (15.6%) |
| 5 or more Vehicles | 256 (23.1%) | 154 (10.6%) |
| Total | 1,109 (100.0%) | 1,454 (100.0%) |
Commute Time in Brownfields
The most frequently occuring commute durations in Brownfields are 30 to 34 minutes (469 commuters, 18.3%), 15 to 19 minutes (456 commuters, 17.8%), and 10 to 14 minutes (414 commuters, 16.2%).
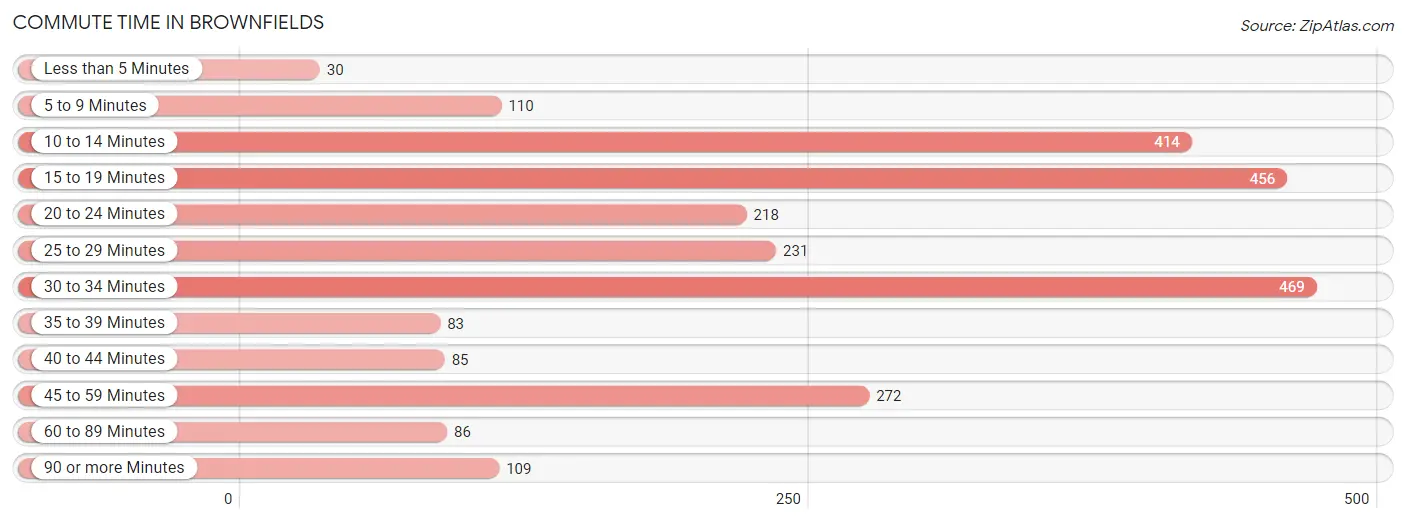
| Commute Time | # Commuters | % Commuters |
| Less than 5 Minutes | 30 | 1.2% |
| 5 to 9 Minutes | 110 | 4.3% |
| 10 to 14 Minutes | 414 | 16.2% |
| 15 to 19 Minutes | 456 | 17.8% |
| 20 to 24 Minutes | 218 | 8.5% |
| 25 to 29 Minutes | 231 | 9.0% |
| 30 to 34 Minutes | 469 | 18.3% |
| 35 to 39 Minutes | 83 | 3.2% |
| 40 to 44 Minutes | 85 | 3.3% |
| 45 to 59 Minutes | 272 | 10.6% |
| 60 to 89 Minutes | 86 | 3.4% |
| 90 or more Minutes | 109 | 4.3% |
Commute Time by Sex in Brownfields
The most common commute times in Brownfields are 10 to 14 minutes (181 commuters, 16.3%) for males and 30 to 34 minutes (350 commuters, 24.1%) for females.
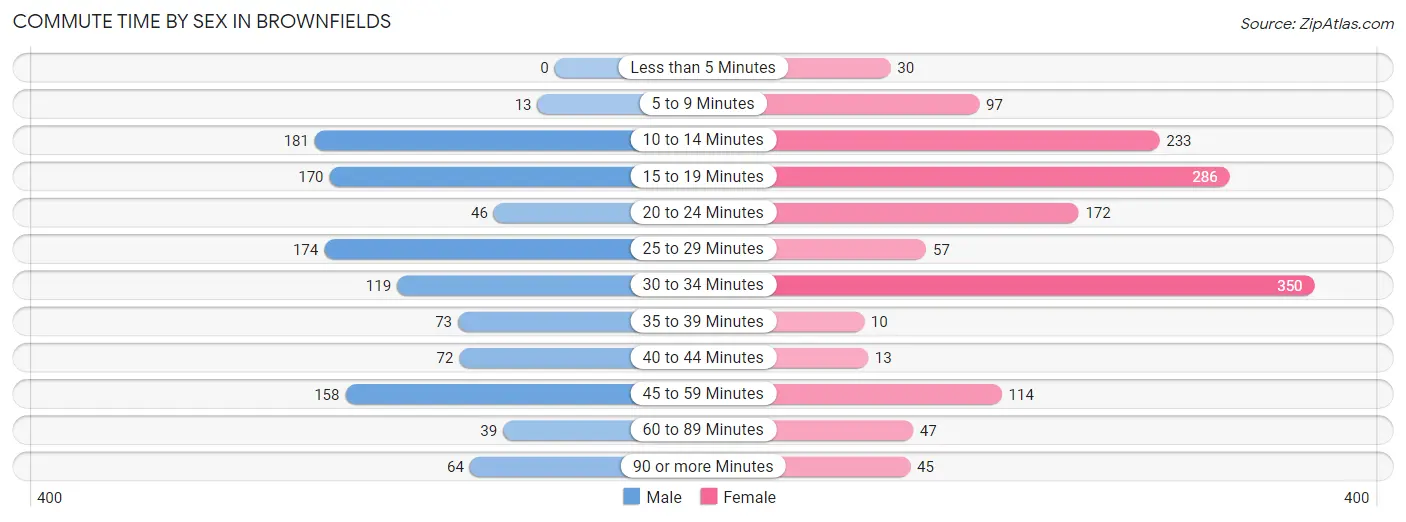
| Commute Time | Male | Female |
| Less than 5 Minutes | 0 (0.0%) | 30 (2.1%) |
| 5 to 9 Minutes | 13 (1.2%) | 97 (6.7%) |
| 10 to 14 Minutes | 181 (16.3%) | 233 (16.0%) |
| 15 to 19 Minutes | 170 (15.3%) | 286 (19.7%) |
| 20 to 24 Minutes | 46 (4.2%) | 172 (11.8%) |
| 25 to 29 Minutes | 174 (15.7%) | 57 (3.9%) |
| 30 to 34 Minutes | 119 (10.7%) | 350 (24.1%) |
| 35 to 39 Minutes | 73 (6.6%) | 10 (0.7%) |
| 40 to 44 Minutes | 72 (6.5%) | 13 (0.9%) |
| 45 to 59 Minutes | 158 (14.2%) | 114 (7.8%) |
| 60 to 89 Minutes | 39 (3.5%) | 47 (3.2%) |
| 90 or more Minutes | 64 (5.8%) | 45 (3.1%) |
Time of Departure to Work by Sex in Brownfields
The most frequent times of departure to work in Brownfields are 12:00 AM to 4:59 AM (195, 17.6%) for males and 6:30 AM to 6:59 AM (354, 24.3%) for females.
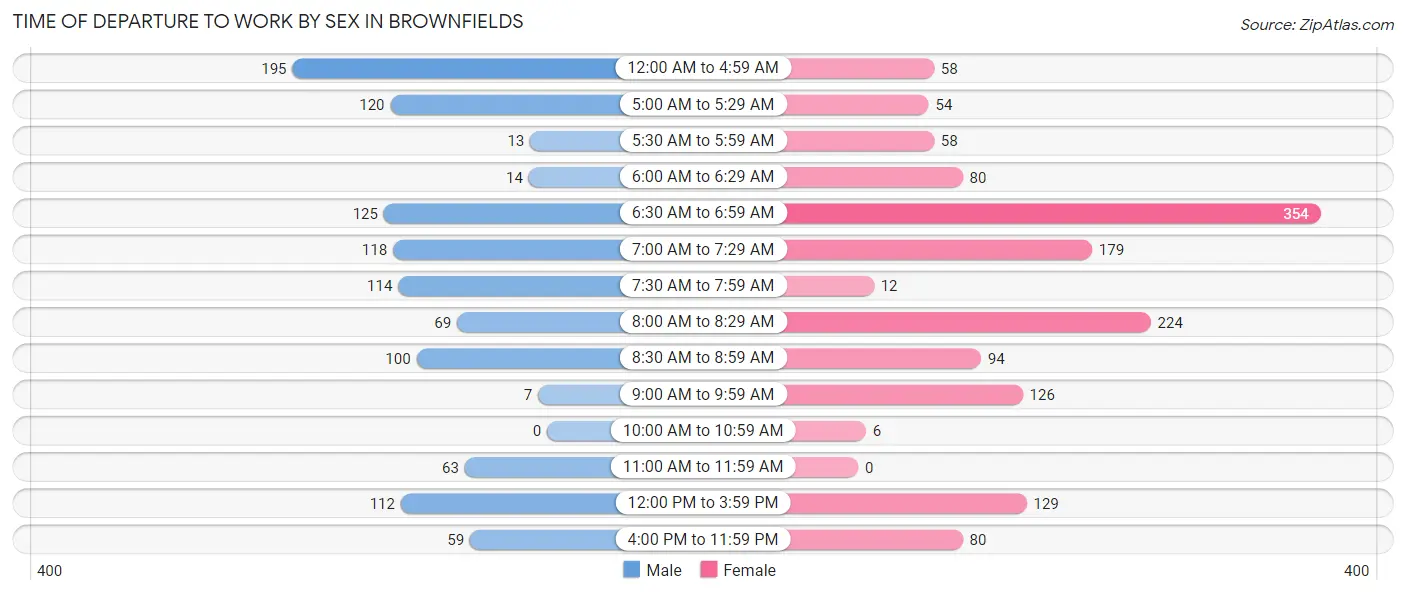
| Time of Departure | Male | Female |
| 12:00 AM to 4:59 AM | 195 (17.6%) | 58 (4.0%) |
| 5:00 AM to 5:29 AM | 120 (10.8%) | 54 (3.7%) |
| 5:30 AM to 5:59 AM | 13 (1.2%) | 58 (4.0%) |
| 6:00 AM to 6:29 AM | 14 (1.3%) | 80 (5.5%) |
| 6:30 AM to 6:59 AM | 125 (11.3%) | 354 (24.3%) |
| 7:00 AM to 7:29 AM | 118 (10.6%) | 179 (12.3%) |
| 7:30 AM to 7:59 AM | 114 (10.3%) | 12 (0.8%) |
| 8:00 AM to 8:29 AM | 69 (6.2%) | 224 (15.4%) |
| 8:30 AM to 8:59 AM | 100 (9.0%) | 94 (6.5%) |
| 9:00 AM to 9:59 AM | 7 (0.6%) | 126 (8.7%) |
| 10:00 AM to 10:59 AM | 0 (0.0%) | 6 (0.4%) |
| 11:00 AM to 11:59 AM | 63 (5.7%) | 0 (0.0%) |
| 12:00 PM to 3:59 PM | 112 (10.1%) | 129 (8.9%) |
| 4:00 PM to 11:59 PM | 59 (5.3%) | 80 (5.5%) |
| Total | 1,109 (100.0%) | 1,454 (100.0%) |
Housing Occupancy in Brownfields
Occupancy by Ownership in Brownfields
Of the total 1,831 dwellings in Brownfields, owner-occupied units account for 1,259 (68.8%), while renter-occupied units make up 572 (31.2%).
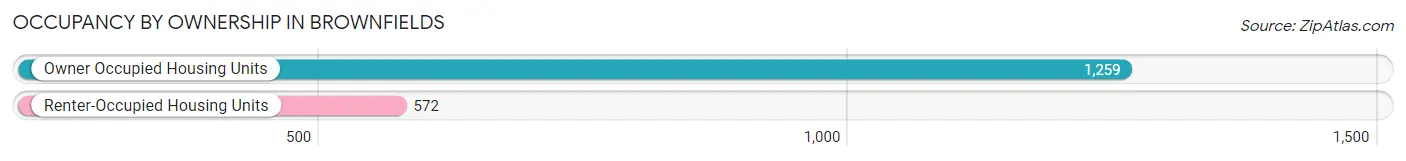
| Occupancy | # Housing Units | % Housing Units |
| Owner Occupied Housing Units | 1,259 | 68.8% |
| Renter-Occupied Housing Units | 572 | 31.2% |
| Total Occupied Housing Units | 1,831 | 100.0% |
Occupancy by Household Size in Brownfields
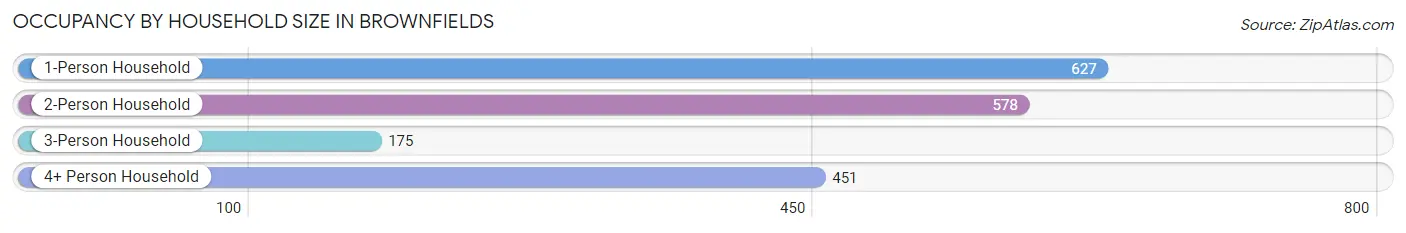
| Household Size | # Housing Units | % Housing Units |
| 1-Person Household | 627 | 34.2% |
| 2-Person Household | 578 | 31.6% |
| 3-Person Household | 175 | 9.6% |
| 4+ Person Household | 451 | 24.6% |
| Total Housing Units | 1,831 | 100.0% |
Occupancy by Ownership by Household Size in Brownfields
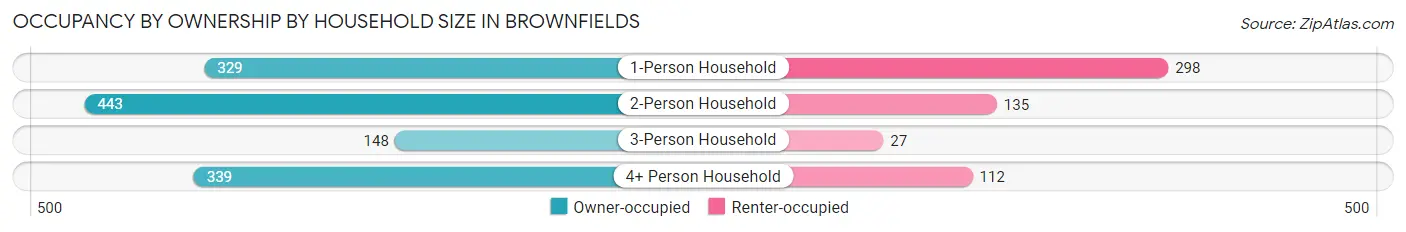
| Household Size | Owner-occupied | Renter-occupied |
| 1-Person Household | 329 (52.5%) | 298 (47.5%) |
| 2-Person Household | 443 (76.6%) | 135 (23.4%) |
| 3-Person Household | 148 (84.6%) | 27 (15.4%) |
| 4+ Person Household | 339 (75.2%) | 112 (24.8%) |
| Total Housing Units | 1,259 (68.8%) | 572 (31.2%) |
Occupancy by Educational Attainment in Brownfields
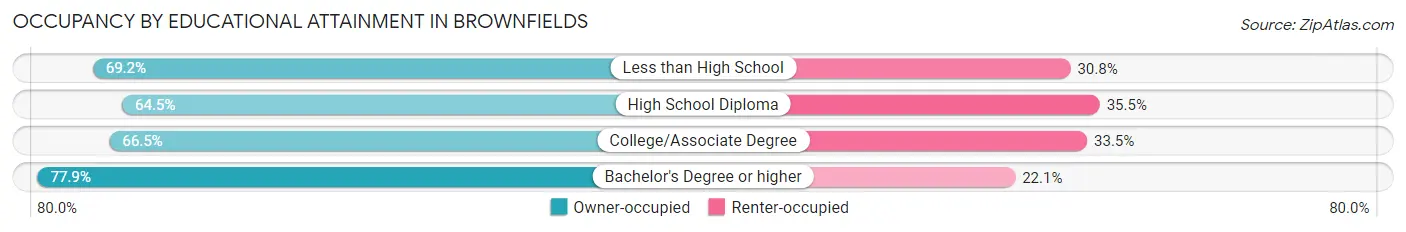
| Household Size | Owner-occupied | Renter-occupied |
| Less than High School | 110 (69.2%) | 49 (30.8%) |
| High School Diploma | 324 (64.5%) | 178 (35.5%) |
| College/Associate Degree | 507 (66.5%) | 255 (33.5%) |
| Bachelor's Degree or higher | 318 (77.9%) | 90 (22.1%) |
Occupancy by Age of Householder in Brownfields
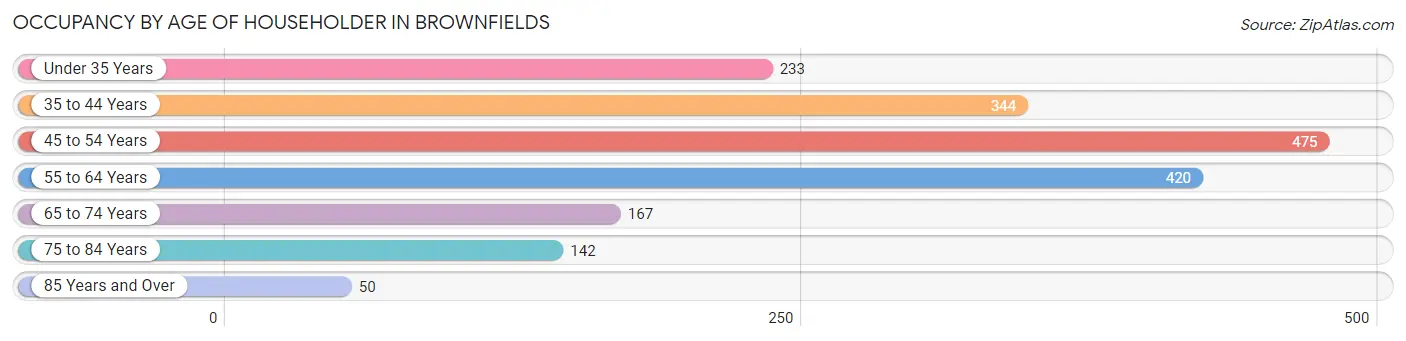
| Age Bracket | # Households | % Households |
| Under 35 Years | 233 | 12.7% |
| 35 to 44 Years | 344 | 18.8% |
| 45 to 54 Years | 475 | 25.9% |
| 55 to 64 Years | 420 | 22.9% |
| 65 to 74 Years | 167 | 9.1% |
| 75 to 84 Years | 142 | 7.8% |
| 85 Years and Over | 50 | 2.7% |
| Total | 1,831 | 100.0% |
Housing Finances in Brownfields
Median Income by Occupancy in Brownfields
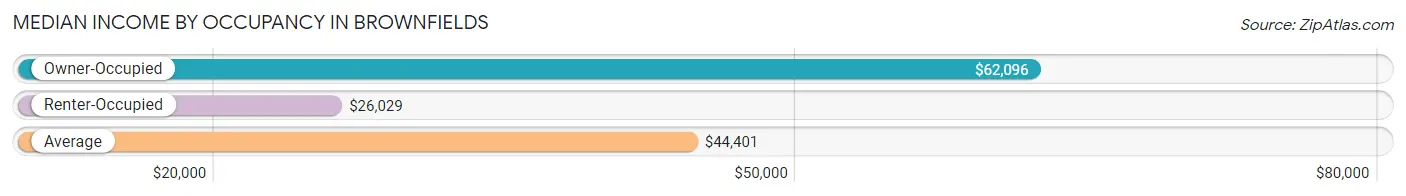
| Occupancy Type | # Households | Median Income |
| Owner-Occupied | 1,259 (68.8%) | $62,096 |
| Renter-Occupied | 572 (31.2%) | $26,029 |
| Average | 1,831 (100.0%) | $44,401 |
Occupancy by Householder Income Bracket in Brownfields
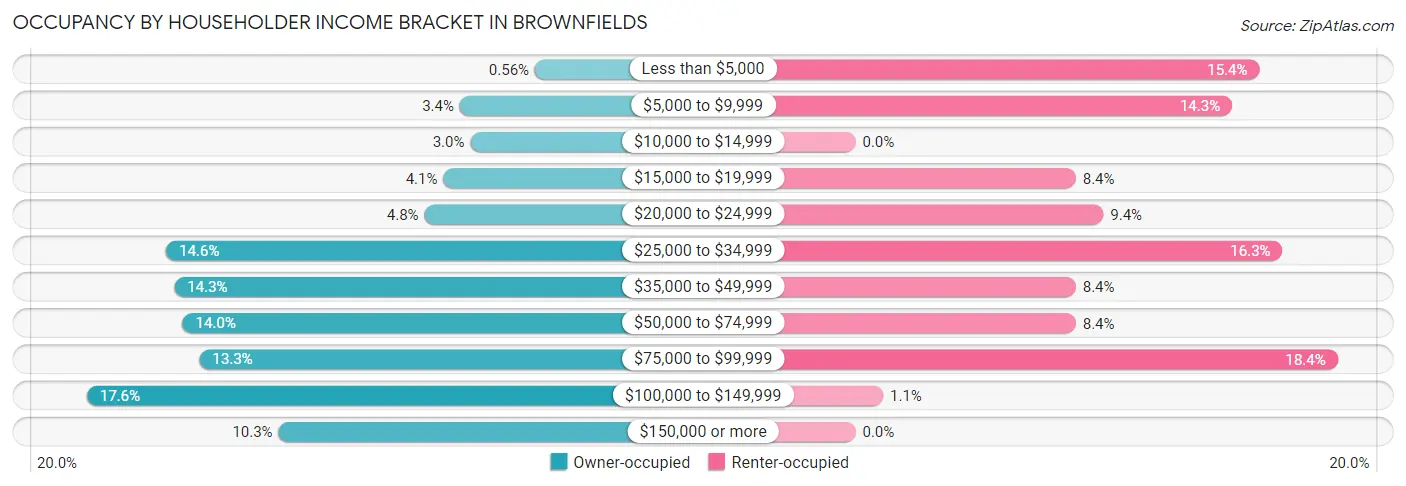
| Income Bracket | Owner-occupied | Renter-occupied |
| Less than $5,000 | 7 (0.6%) | 88 (15.4%) |
| $5,000 to $9,999 | 43 (3.4%) | 82 (14.3%) |
| $10,000 to $14,999 | 38 (3.0%) | 0 (0.0%) |
| $15,000 to $19,999 | 51 (4.1%) | 48 (8.4%) |
| $20,000 to $24,999 | 60 (4.8%) | 54 (9.4%) |
| $25,000 to $34,999 | 184 (14.6%) | 93 (16.3%) |
| $35,000 to $49,999 | 180 (14.3%) | 48 (8.4%) |
| $50,000 to $74,999 | 176 (14.0%) | 48 (8.4%) |
| $75,000 to $99,999 | 168 (13.3%) | 105 (18.4%) |
| $100,000 to $149,999 | 222 (17.6%) | 6 (1.1%) |
| $150,000 or more | 130 (10.3%) | 0 (0.0%) |
| Total | 1,259 (100.0%) | 572 (100.0%) |
Monthly Housing Cost Tiers in Brownfields
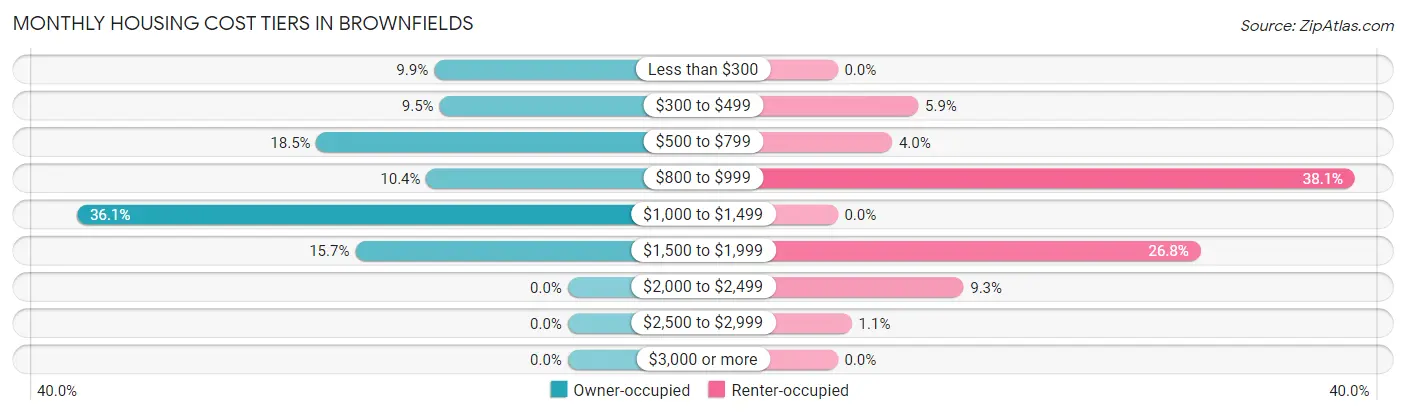
| Monthly Cost | Owner-occupied | Renter-occupied |
| Less than $300 | 124 (9.9%) | 0 (0.0%) |
| $300 to $499 | 119 (9.5%) | 34 (5.9%) |
| $500 to $799 | 233 (18.5%) | 23 (4.0%) |
| $800 to $999 | 131 (10.4%) | 218 (38.1%) |
| $1,000 to $1,499 | 455 (36.1%) | 0 (0.0%) |
| $1,500 to $1,999 | 197 (15.7%) | 153 (26.8%) |
| $2,000 to $2,499 | 0 (0.0%) | 53 (9.3%) |
| $2,500 to $2,999 | 0 (0.0%) | 6 (1.1%) |
| $3,000 or more | 0 (0.0%) | 0 (0.0%) |
| Total | 1,259 (100.0%) | 572 (100.0%) |
Physical Housing Characteristics in Brownfields
Housing Structures in Brownfields
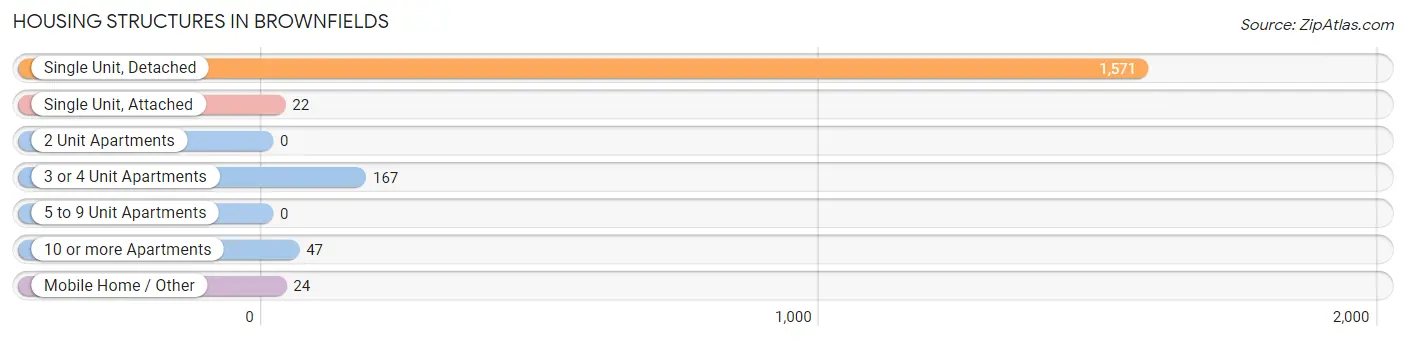
| Structure Type | # Housing Units | % Housing Units |
| Single Unit, Detached | 1,571 | 85.8% |
| Single Unit, Attached | 22 | 1.2% |
| 2 Unit Apartments | 0 | 0.0% |
| 3 or 4 Unit Apartments | 167 | 9.1% |
| 5 to 9 Unit Apartments | 0 | 0.0% |
| 10 or more Apartments | 47 | 2.6% |
| Mobile Home / Other | 24 | 1.3% |
| Total | 1,831 | 100.0% |
Housing Structures by Occupancy in Brownfields
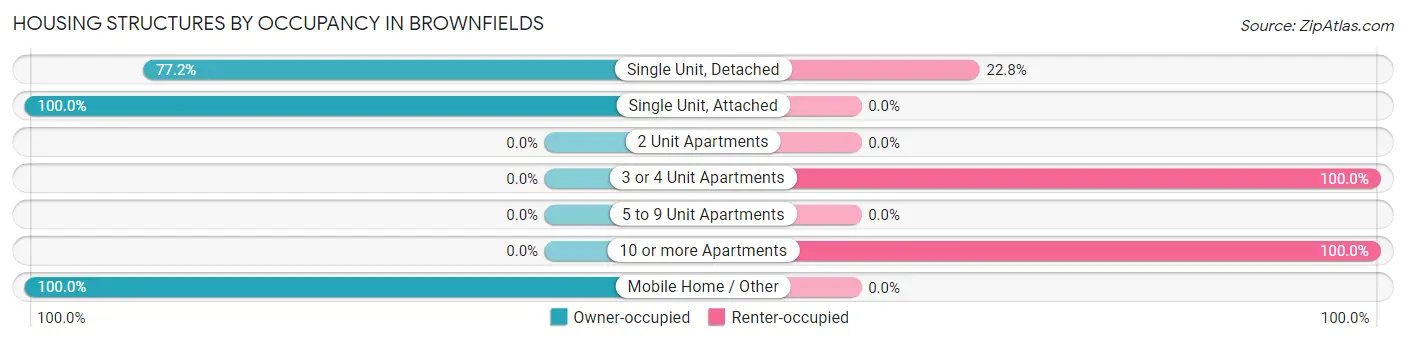
| Structure Type | Owner-occupied | Renter-occupied |
| Single Unit, Detached | 1,213 (77.2%) | 358 (22.8%) |
| Single Unit, Attached | 22 (100.0%) | 0 (0.0%) |
| 2 Unit Apartments | 0 (0.0%) | 0 (0.0%) |
| 3 or 4 Unit Apartments | 0 (0.0%) | 167 (100.0%) |
| 5 to 9 Unit Apartments | 0 (0.0%) | 0 (0.0%) |
| 10 or more Apartments | 0 (0.0%) | 47 (100.0%) |
| Mobile Home / Other | 24 (100.0%) | 0 (0.0%) |
| Total | 1,259 (68.8%) | 572 (31.2%) |
Housing Structures by Number of Rooms in Brownfields
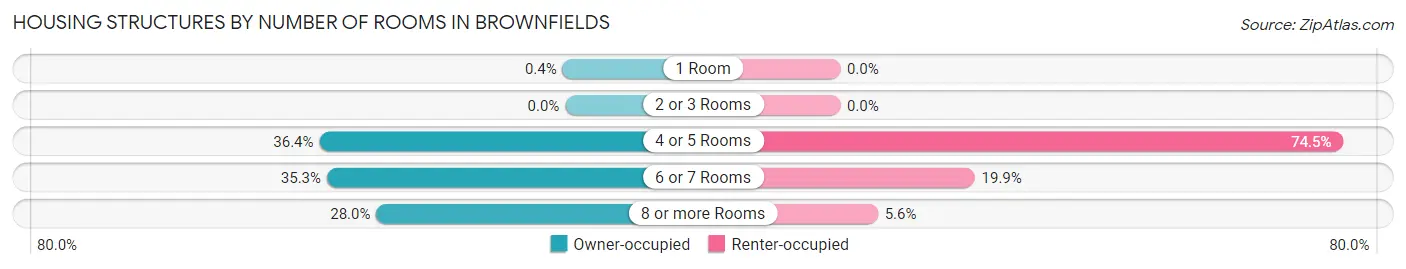
| Number of Rooms | Owner-occupied | Renter-occupied |
| 1 Room | 5 (0.4%) | 0 (0.0%) |
| 2 or 3 Rooms | 0 (0.0%) | 0 (0.0%) |
| 4 or 5 Rooms | 458 (36.4%) | 426 (74.5%) |
| 6 or 7 Rooms | 444 (35.3%) | 114 (19.9%) |
| 8 or more Rooms | 352 (28.0%) | 32 (5.6%) |
| Total | 1,259 (100.0%) | 572 (100.0%) |
Housing Structure by Heating Type in Brownfields
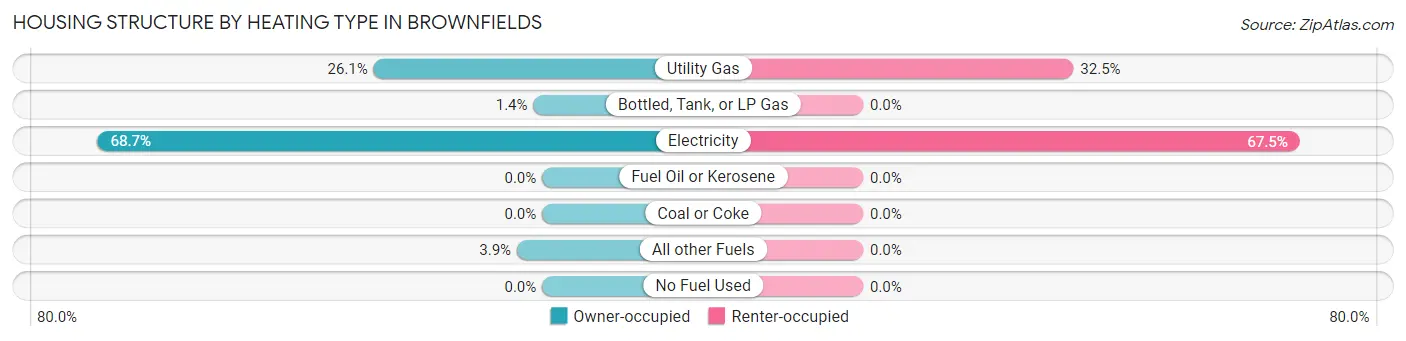
| Heating Type | Owner-occupied | Renter-occupied |
| Utility Gas | 328 (26.1%) | 186 (32.5%) |
| Bottled, Tank, or LP Gas | 17 (1.3%) | 0 (0.0%) |
| Electricity | 865 (68.7%) | 386 (67.5%) |
| Fuel Oil or Kerosene | 0 (0.0%) | 0 (0.0%) |
| Coal or Coke | 0 (0.0%) | 0 (0.0%) |
| All other Fuels | 49 (3.9%) | 0 (0.0%) |
| No Fuel Used | 0 (0.0%) | 0 (0.0%) |
| Total | 1,259 (100.0%) | 572 (100.0%) |
Household Vehicle Usage in Brownfields
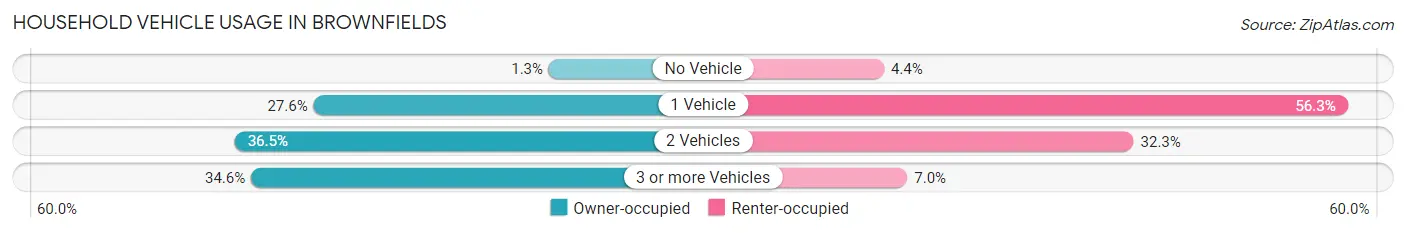
| Vehicles per Household | Owner-occupied | Renter-occupied |
| No Vehicle | 16 (1.3%) | 25 (4.4%) |
| 1 Vehicle | 348 (27.6%) | 322 (56.3%) |
| 2 Vehicles | 459 (36.5%) | 185 (32.3%) |
| 3 or more Vehicles | 436 (34.6%) | 40 (7.0%) |
| Total | 1,259 (100.0%) | 572 (100.0%) |
Real Estate & Mortgages in Brownfields
Real Estate and Mortgage Overview in Brownfields
| Characteristic | Without Mortgage | With Mortgage |
| Housing Units | 436 | 823 |
| Median Property Value | $164,800 | $161,500 |
| Median Household Income | $38,864 | $77 |
| Monthly Housing Costs | $443 | $0 |
| Real Estate Taxes | $526 | $110 |
Property Value by Mortgage Status in Brownfields
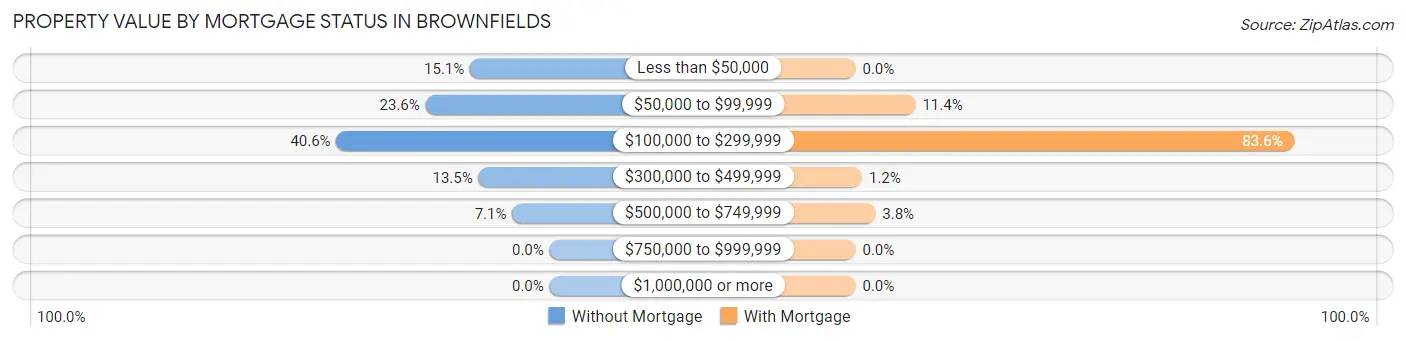
| Property Value | Without Mortgage | With Mortgage |
| Less than $50,000 | 66 (15.1%) | 0 (0.0%) |
| $50,000 to $99,999 | 103 (23.6%) | 94 (11.4%) |
| $100,000 to $299,999 | 177 (40.6%) | 688 (83.6%) |
| $300,000 to $499,999 | 59 (13.5%) | 10 (1.2%) |
| $500,000 to $749,999 | 31 (7.1%) | 31 (3.8%) |
| $750,000 to $999,999 | 0 (0.0%) | 0 (0.0%) |
| $1,000,000 or more | 0 (0.0%) | 0 (0.0%) |
| Total | 436 (100.0%) | 823 (100.0%) |
Household Income by Mortgage Status in Brownfields
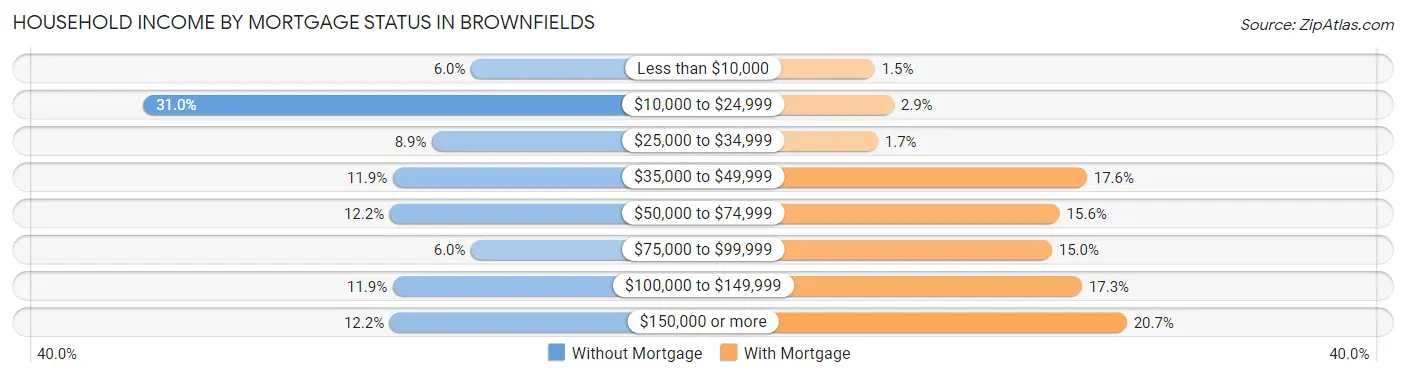
| Household Income | Without Mortgage | With Mortgage |
| Less than $10,000 | 26 (6.0%) | 12 (1.5%) |
| $10,000 to $24,999 | 135 (31.0%) | 24 (2.9%) |
| $25,000 to $34,999 | 39 (8.9%) | 14 (1.7%) |
| $35,000 to $49,999 | 52 (11.9%) | 145 (17.6%) |
| $50,000 to $74,999 | 53 (12.2%) | 128 (15.5%) |
| $75,000 to $99,999 | 26 (6.0%) | 123 (14.9%) |
| $100,000 to $149,999 | 52 (11.9%) | 142 (17.2%) |
| $150,000 or more | 53 (12.2%) | 170 (20.7%) |
| Total | 436 (100.0%) | 823 (100.0%) |
Property Value to Household Income Ratio in Brownfields
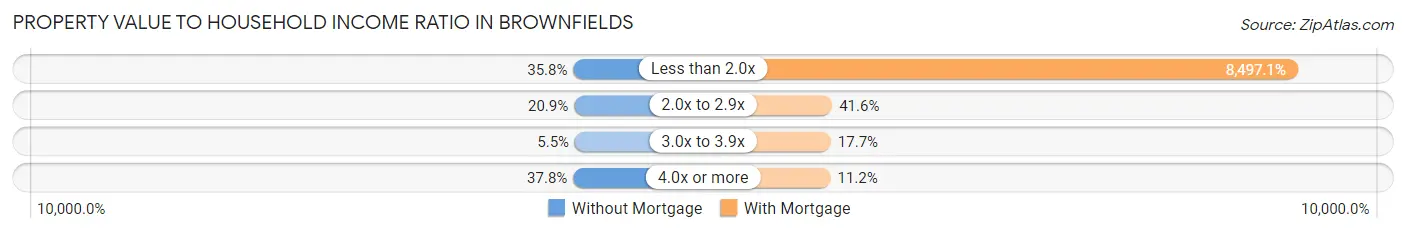
| Value-to-Income Ratio | Without Mortgage | With Mortgage |
| Less than 2.0x | 156 (35.8%) | 69,931 (8,497.1%) |
| 2.0x to 2.9x | 91 (20.9%) | 342 (41.6%) |
| 3.0x to 3.9x | 24 (5.5%) | 146 (17.7%) |
| 4.0x or more | 165 (37.8%) | 92 (11.2%) |
| Total | 436 (100.0%) | 823 (100.0%) |
Real Estate Taxes by Mortgage Status in Brownfields
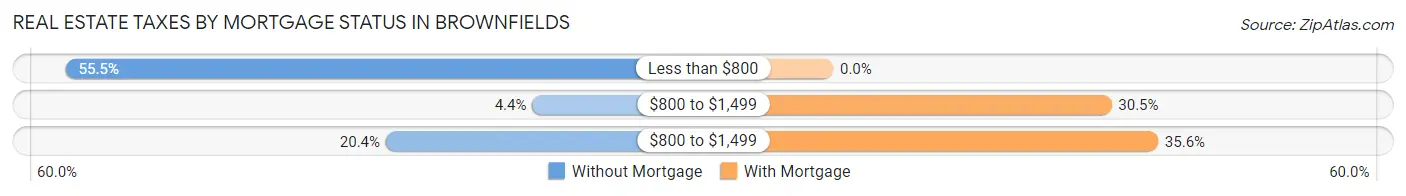
| Property Taxes | Without Mortgage | With Mortgage |
| Less than $800 | 242 (55.5%) | 0 (0.0%) |
| $800 to $1,499 | 19 (4.4%) | 251 (30.5%) |
| $800 to $1,499 | 89 (20.4%) | 293 (35.6%) |
| Total | 436 (100.0%) | 823 (100.0%) |
Health & Disability in Brownfields
Health Insurance Coverage by Age in Brownfields
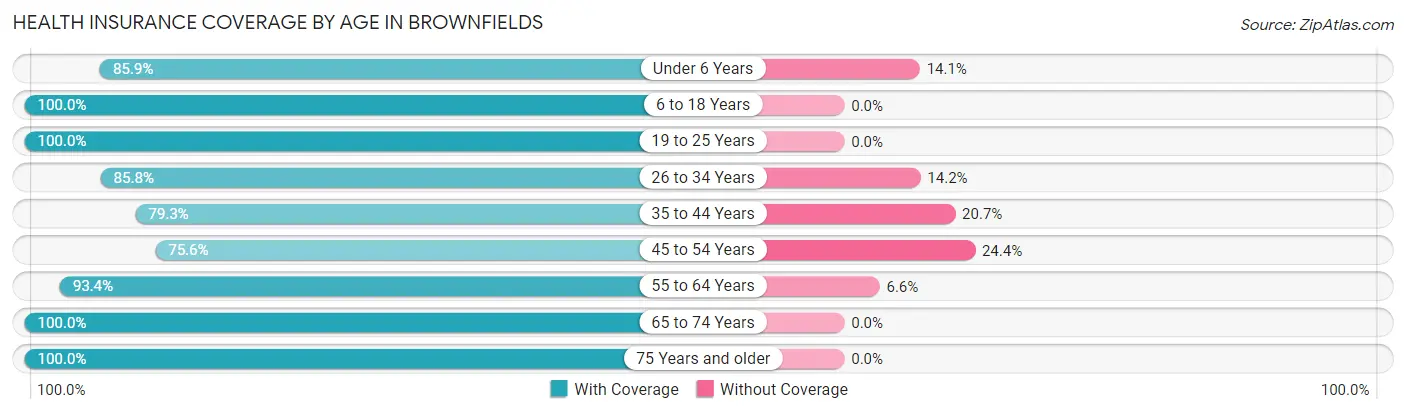
| Age Bracket | With Coverage | Without Coverage |
| Under 6 Years | 220 (85.9%) | 36 (14.1%) |
| 6 to 18 Years | 942 (100.0%) | 0 (0.0%) |
| 19 to 25 Years | 615 (100.0%) | 0 (0.0%) |
| 26 to 34 Years | 617 (85.8%) | 102 (14.2%) |
| 35 to 44 Years | 499 (79.3%) | 130 (20.7%) |
| 45 to 54 Years | 450 (75.6%) | 145 (24.4%) |
| 55 to 64 Years | 811 (93.4%) | 57 (6.6%) |
| 65 to 74 Years | 367 (100.0%) | 0 (0.0%) |
| 75 Years and older | 269 (100.0%) | 0 (0.0%) |
| Total | 4,790 (91.1%) | 470 (8.9%) |
Health Insurance Coverage by Citizenship Status in Brownfields
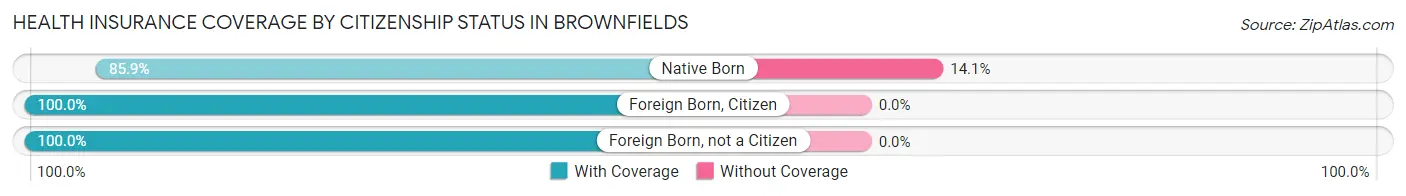
| Citizenship Status | With Coverage | Without Coverage |
| Native Born | 220 (85.9%) | 36 (14.1%) |
| Foreign Born, Citizen | 942 (100.0%) | 0 (0.0%) |
| Foreign Born, not a Citizen | 615 (100.0%) | 0 (0.0%) |
Health Insurance Coverage by Household Income in Brownfields
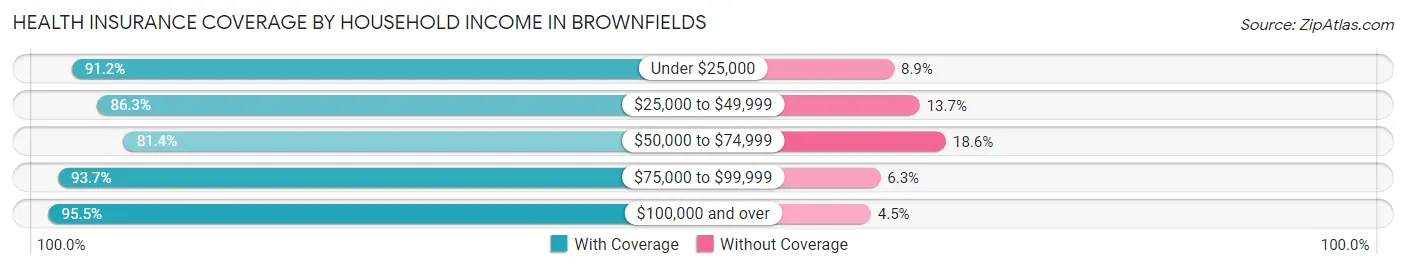
| Household Income | With Coverage | Without Coverage |
| Under $25,000 | 834 (91.1%) | 81 (8.8%) |
| $25,000 to $49,999 | 1,143 (86.3%) | 181 (13.7%) |
| $50,000 to $74,999 | 311 (81.4%) | 71 (18.6%) |
| $75,000 to $99,999 | 985 (93.7%) | 66 (6.3%) |
| $100,000 and over | 1,505 (95.5%) | 71 (4.5%) |
Public vs Private Health Insurance Coverage by Age in Brownfields
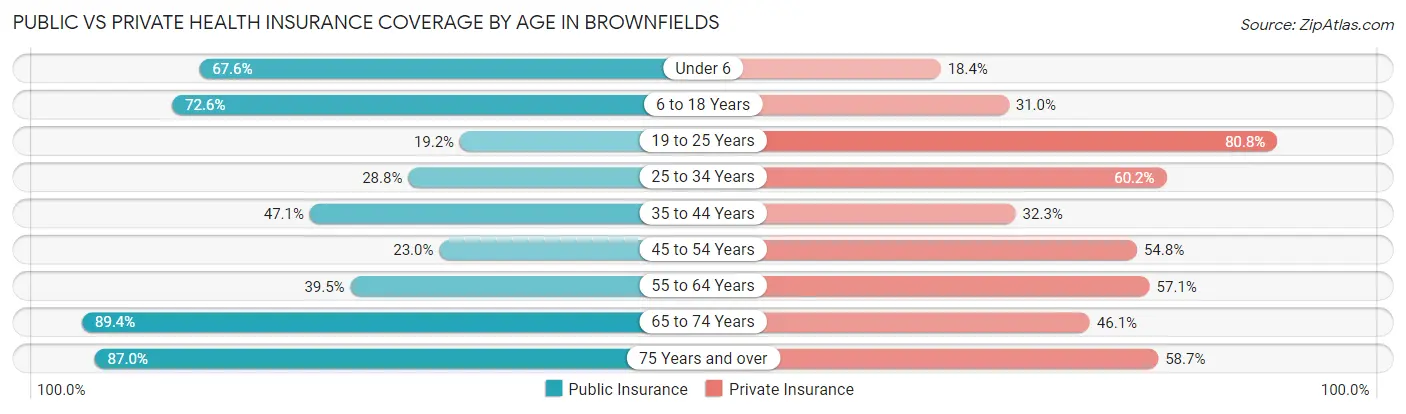
| Age Bracket | Public Insurance | Private Insurance |
| Under 6 | 173 (67.6%) | 47 (18.4%) |
| 6 to 18 Years | 684 (72.6%) | 292 (31.0%) |
| 19 to 25 Years | 118 (19.2%) | 497 (80.8%) |
| 25 to 34 Years | 207 (28.8%) | 433 (60.2%) |
| 35 to 44 Years | 296 (47.1%) | 203 (32.3%) |
| 45 to 54 Years | 137 (23.0%) | 326 (54.8%) |
| 55 to 64 Years | 343 (39.5%) | 496 (57.1%) |
| 65 to 74 Years | 328 (89.4%) | 169 (46.1%) |
| 75 Years and over | 234 (87.0%) | 158 (58.7%) |
| Total | 2,520 (47.9%) | 2,621 (49.8%) |
Disability Status by Sex by Age in Brownfields
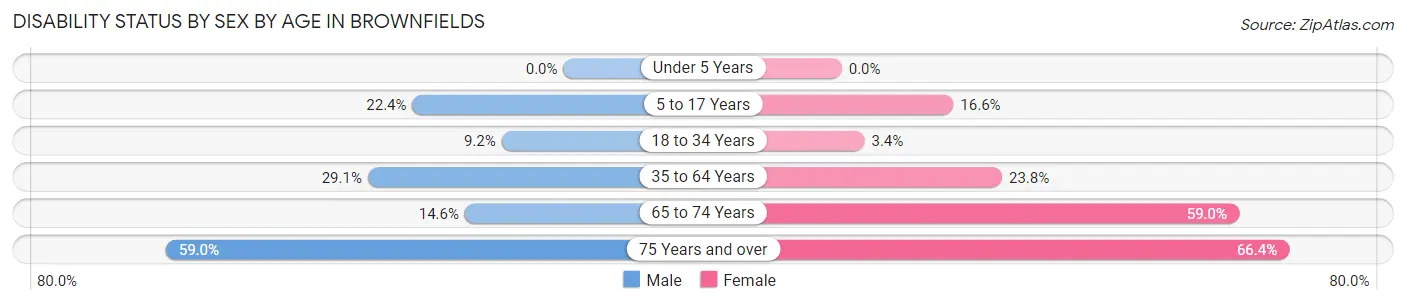
| Age Bracket | Male | Female |
| Under 5 Years | 0 (0.0%) | 0 (0.0%) |
| 5 to 17 Years | 74 (22.4%) | 112 (16.6%) |
| 18 to 34 Years | 56 (9.2%) | 26 (3.4%) |
| 35 to 64 Years | 244 (29.0%) | 298 (23.8%) |
| 65 to 74 Years | 12 (14.6%) | 168 (59.0%) |
| 75 Years and over | 85 (59.0%) | 83 (66.4%) |
Disability Class by Sex by Age in Brownfields
Disability Class: Hearing Difficulty
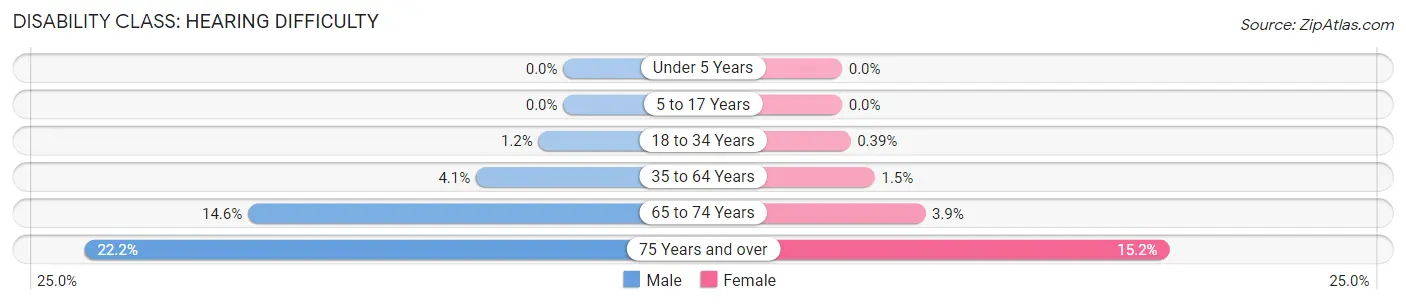
| Age Bracket | Male | Female |
| Under 5 Years | 0 (0.0%) | 0 (0.0%) |
| 5 to 17 Years | 0 (0.0%) | 0 (0.0%) |
| 18 to 34 Years | 7 (1.1%) | 3 (0.4%) |
| 35 to 64 Years | 34 (4.1%) | 19 (1.5%) |
| 65 to 74 Years | 12 (14.6%) | 11 (3.9%) |
| 75 Years and over | 32 (22.2%) | 19 (15.2%) |
Disability Class: Vision Difficulty
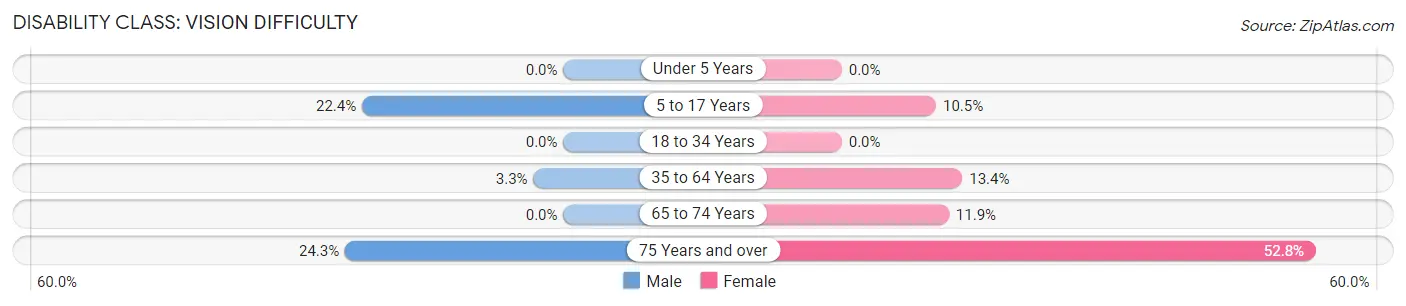
| Age Bracket | Male | Female |
| Under 5 Years | 0 (0.0%) | 0 (0.0%) |
| 5 to 17 Years | 74 (22.4%) | 71 (10.5%) |
| 18 to 34 Years | 0 (0.0%) | 0 (0.0%) |
| 35 to 64 Years | 28 (3.3%) | 168 (13.4%) |
| 65 to 74 Years | 0 (0.0%) | 34 (11.9%) |
| 75 Years and over | 35 (24.3%) | 66 (52.8%) |
Disability Class: Cognitive Difficulty
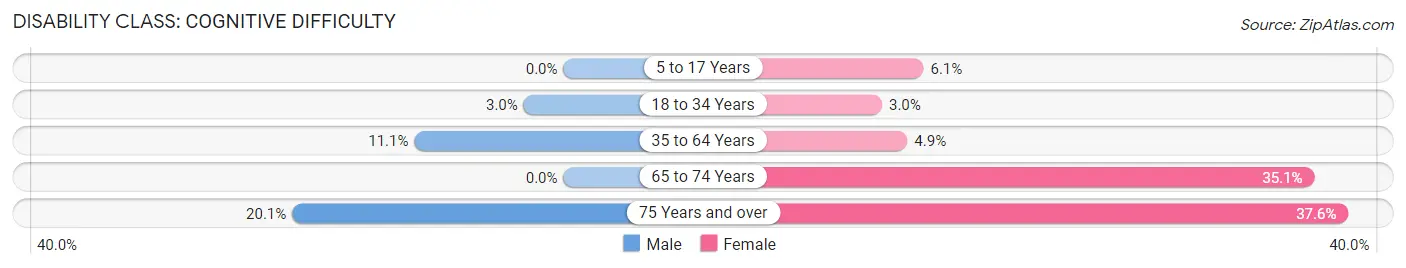
| Age Bracket | Male | Female |
| 5 to 17 Years | 0 (0.0%) | 41 (6.1%) |
| 18 to 34 Years | 18 (2.9%) | 23 (3.0%) |
| 35 to 64 Years | 93 (11.1%) | 61 (4.9%) |
| 65 to 74 Years | 0 (0.0%) | 100 (35.1%) |
| 75 Years and over | 29 (20.1%) | 47 (37.6%) |
Disability Class: Ambulatory Difficulty
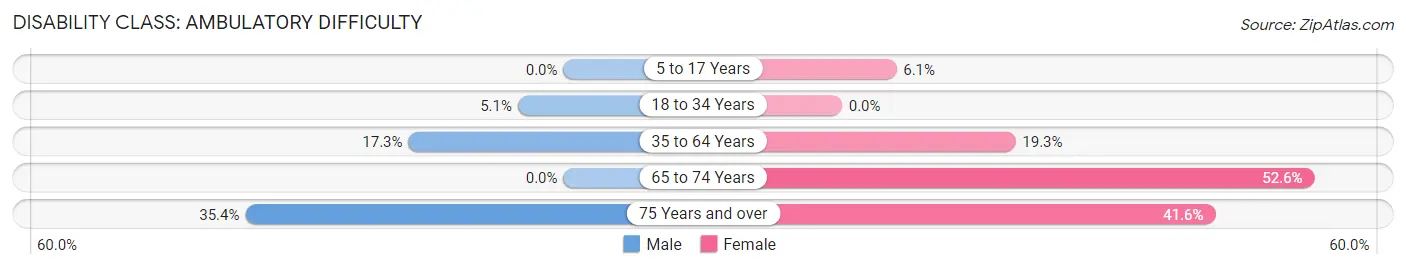
| Age Bracket | Male | Female |
| 5 to 17 Years | 0 (0.0%) | 41 (6.1%) |
| 18 to 34 Years | 31 (5.1%) | 0 (0.0%) |
| 35 to 64 Years | 145 (17.3%) | 242 (19.3%) |
| 65 to 74 Years | 0 (0.0%) | 150 (52.6%) |
| 75 Years and over | 51 (35.4%) | 52 (41.6%) |
Disability Class: Self-Care Difficulty
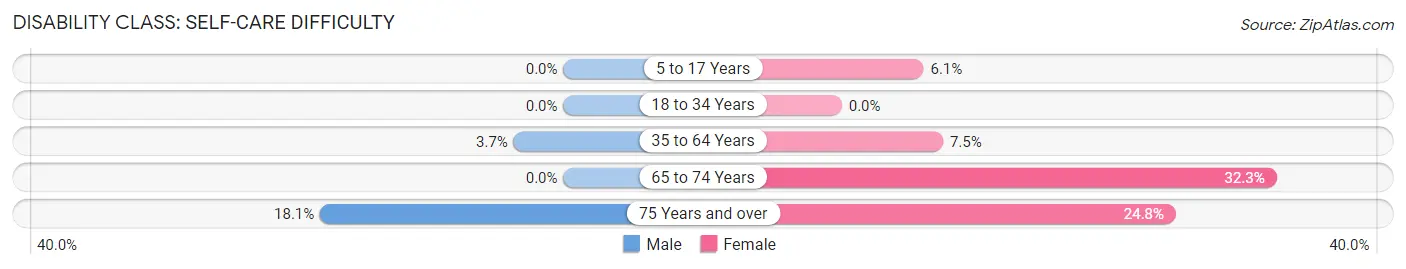
| Age Bracket | Male | Female |
| 5 to 17 Years | 0 (0.0%) | 41 (6.1%) |
| 18 to 34 Years | 0 (0.0%) | 0 (0.0%) |
| 35 to 64 Years | 31 (3.7%) | 94 (7.5%) |
| 65 to 74 Years | 0 (0.0%) | 92 (32.3%) |
| 75 Years and over | 26 (18.1%) | 31 (24.8%) |
Technology Access in Brownfields
Computing Device Access in Brownfields

| Device Type | # Households | % Households |
| Desktop or Laptop | 1,445 | 78.9% |
| Smartphone | 1,634 | 89.2% |
| Tablet | 1,141 | 62.3% |
| No Computing Device | 124 | 6.8% |
| Total | 1,831 | 100.0% |
Internet Access in Brownfields
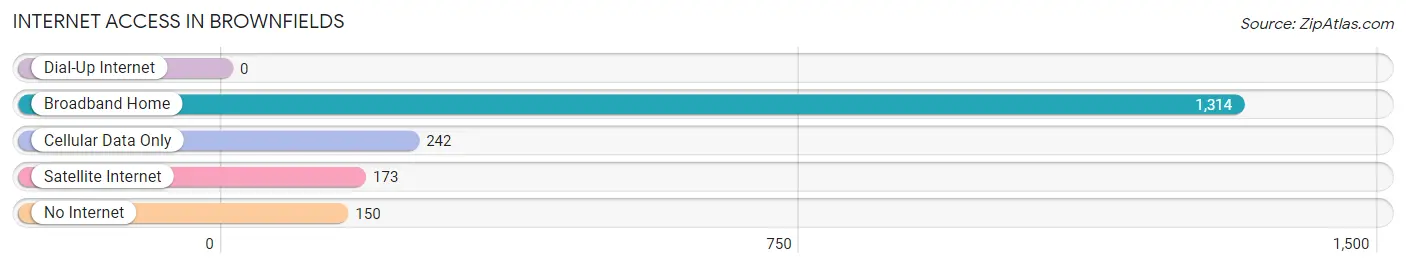
| Internet Type | # Households | % Households |
| Dial-Up Internet | 0 | 0.0% |
| Broadband Home | 1,314 | 71.8% |
| Cellular Data Only | 242 | 13.2% |
| Satellite Internet | 173 | 9.5% |
| No Internet | 150 | 8.2% |
| Total | 1,831 | 100.0% |
Brownfields Summary
Brownfields is a small town located in the state of Louisiana, in the United States of America. It is situated in the northern part of the state, in the parish of Natchitoches. The town has a population of approximately 1,000 people, and is located about 30 miles from the city of Shreveport.
History
Brownfields was founded in 1845 by a group of settlers from the nearby town of Natchitoches. The town was named after the Brown family, who were among the first settlers. The town was originally a small farming community, and the main crops grown were cotton, corn, and sugar cane. The town grew slowly over the years, and by the early 1900s, it had become a small but thriving community.
In the early 1900s, the town was home to a number of businesses, including a general store, a blacksmith shop, and a cotton gin. The town also had a school, a post office, and a few churches. In the 1920s, the town began to experience a period of growth, as more people moved to the area. This growth was largely due to the discovery of oil in the area, which led to an influx of new businesses and residents.
Geography
Brownfields is located in the northern part of Louisiana, in the parish of Natchitoches. The town is situated on the banks of the Red River, which is a major tributary of the Mississippi River. The town is surrounded by a number of small towns and villages, including Natchitoches, Robeline, and Provencal. The town is located about 30 miles from the city of Shreveport, and is accessible by road and rail.
Economy
The economy of Brownfields is largely based on agriculture and oil production. The town is home to a number of farms, which produce a variety of crops, including cotton, corn, and sugar cane. The town is also home to a number of oil wells, which produce a significant amount of oil for the local economy. In addition to these industries, the town is also home to a number of small businesses, including restaurants, stores, and other services.
Demographics
As of the 2010 census, the population of Brownfields was 1,000 people. The town is predominantly white, with a small African American population. The median household income in the town is $35,000, and the median age is 37 years. The town has a high rate of poverty, with approximately 25% of the population living below the poverty line.
Conclusion
Brownfields is a small town located in the northern part of Louisiana. The town has a population of approximately 1,000 people, and is largely based on agriculture and oil production. The town is predominantly white, with a small African American population. The town has a high rate of poverty, and the median household income is $35,000. Despite its small size, Brownfields is an important part of the local economy, and is home to a number of businesses and services.
Common Questions
What is Per Capita Income in Brownfields?
Per Capita income in Brownfields is $22,437.
What is the Median Family Income in Brownfields?
Median Family Income in Brownfields is $68,189.
What is the Median Household income in Brownfields?
Median Household Income in Brownfields is $44,401.
What is Income or Wage Gap in Brownfields?
Income or Wage Gap in Brownfields is 34.8%.
Women in Brownfields earn 65.2 cents for every dollar earned by a man.
What is Family Income Deficit in Brownfields?
Family Income Deficit in Brownfields is $8,831.
Families that are below poverty line in Brownfields earn $8,831 less on average than the poverty threshold level.
What is Inequality or Gini Index in Brownfields?
Inequality or Gini Index in Brownfields is 0.43.
What is the Total Population of Brownfields?
Total Population of Brownfields is 5,358.
What is the Total Male Population of Brownfields?
Total Male Population of Brownfields is 2,103.
What is the Total Female Population of Brownfields?
Total Female Population of Brownfields is 3,255.
What is the Ratio of Males per 100 Females in Brownfields?
There are 64.61 Males per 100 Females in Brownfields.
What is the Ratio of Females per 100 Males in Brownfields?
There are 154.78 Females per 100 Males in Brownfields.
What is the Median Population Age in Brownfields?
Median Population Age in Brownfields is 36.6 Years.
What is the Average Family Size in Brownfields
Average Family Size in Brownfields is 3.9 People.
What is the Average Household Size in Brownfields
Average Household Size in Brownfields is 2.9 People.
How Large is the Labor Force in Brownfields?
There are 2,776 People in the Labor Forcein in Brownfields.
What is the Percentage of People in the Labor Force in Brownfields?
64.3% of People are in the Labor Force in Brownfields.
What is the Unemployment Rate in Brownfields?
Unemployment Rate in Brownfields is 7.6%.