Labadieville, LA Map & Demographics
Labadieville Map
Labadieville Overview
$31,523
PER CAPITA INCOME
$72,143
AVG FAMILY INCOME
$55,250
AVG HOUSEHOLD INCOME
14.2%
WAGE / INCOME GAP [ % ]
85.8¢/ $1
WAGE / INCOME GAP [ $ ]
0.38
INEQUALITY / GINI INDEX
1,546
TOTAL POPULATION
748
MALE POPULATION
798
FEMALE POPULATION
93.73
MALES / 100 FEMALES
106.68
FEMALES / 100 MALES
46.3
MEDIAN AGE
3.0
AVG FAMILY SIZE
2.3
AVG HOUSEHOLD SIZE
731
LABOR FORCE [ PEOPLE ]
56.1%
PERCENT IN LABOR FORCE
12.7%
UNEMPLOYMENT RATE
Labadieville Zip Codes
Labadieville Area Codes
Income in Labadieville
Income Overview in Labadieville
Per Capita Income in Labadieville is $31,523, while median incomes of families and households are $72,143 and $55,250 respectively.
| Characteristic | Number | Measure |
| Per Capita Income | 1,546 | $31,523 |
| Median Family Income | 404 | $72,143 |
| Mean Family Income | 404 | $87,330 |
| Median Household Income | 683 | $55,250 |
| Mean Household Income | 683 | $72,422 |
| Income Deficit | 404 | $0 |
| Wage / Income Gap (%) | 1,546 | 14.16% |
| Wage / Income Gap ($) | 1,546 | 85.84¢ per $1 |
| Gini / Inequality Index | 1,546 | 0.38 |
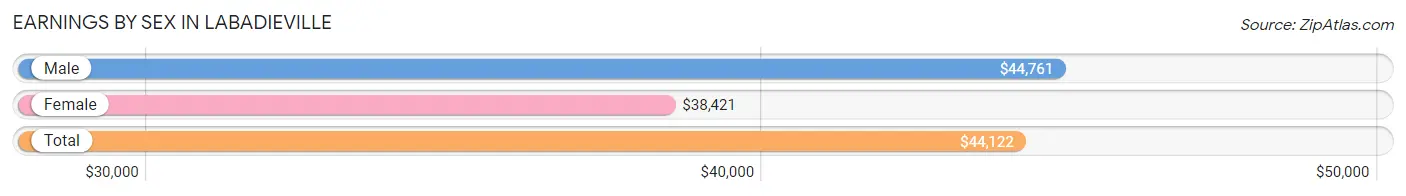
Earnings by Sex in Labadieville
Average Earnings in Labadieville are $44,122, $44,761 for men and $38,421 for women, a difference of 14.2%.
| Sex | Number | Average Earnings |
| Male | 407 (55.7%) | $44,761 |
| Female | 324 (44.3%) | $38,421 |
| Total | 731 (100.0%) | $44,122 |
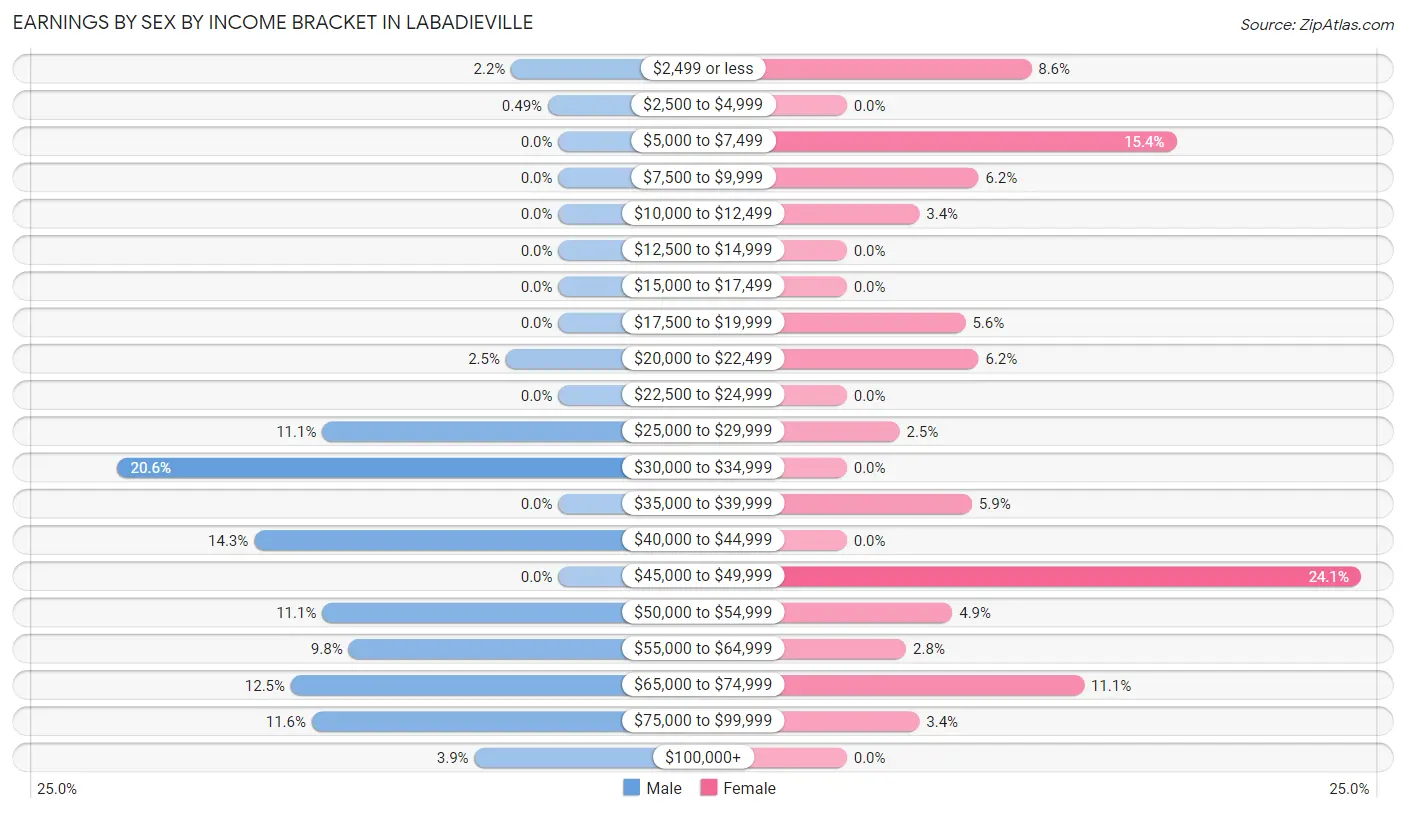
Earnings by Sex by Income Bracket in Labadieville
The most common earnings brackets in Labadieville are $30,000 to $34,999 for men (84 | 20.6%) and $45,000 to $49,999 for women (78 | 24.1%).
| Income | Male | Female |
| $2,499 or less | 9 (2.2%) | 28 (8.6%) |
| $2,500 to $4,999 | 2 (0.5%) | 0 (0.0%) |
| $5,000 to $7,499 | 0 (0.0%) | 50 (15.4%) |
| $7,500 to $9,999 | 0 (0.0%) | 20 (6.2%) |
| $10,000 to $12,499 | 0 (0.0%) | 11 (3.4%) |
| $12,500 to $14,999 | 0 (0.0%) | 0 (0.0%) |
| $15,000 to $17,499 | 0 (0.0%) | 0 (0.0%) |
| $17,500 to $19,999 | 0 (0.0%) | 18 (5.6%) |
| $20,000 to $22,499 | 10 (2.5%) | 20 (6.2%) |
| $22,500 to $24,999 | 0 (0.0%) | 0 (0.0%) |
| $25,000 to $29,999 | 45 (11.1%) | 8 (2.5%) |
| $30,000 to $34,999 | 84 (20.6%) | 0 (0.0%) |
| $35,000 to $39,999 | 0 (0.0%) | 19 (5.9%) |
| $40,000 to $44,999 | 58 (14.2%) | 0 (0.0%) |
| $45,000 to $49,999 | 0 (0.0%) | 78 (24.1%) |
| $50,000 to $54,999 | 45 (11.1%) | 16 (4.9%) |
| $55,000 to $64,999 | 40 (9.8%) | 9 (2.8%) |
| $65,000 to $74,999 | 51 (12.5%) | 36 (11.1%) |
| $75,000 to $99,999 | 47 (11.6%) | 11 (3.4%) |
| $100,000+ | 16 (3.9%) | 0 (0.0%) |
| Total | 407 (100.0%) | 324 (100.0%) |
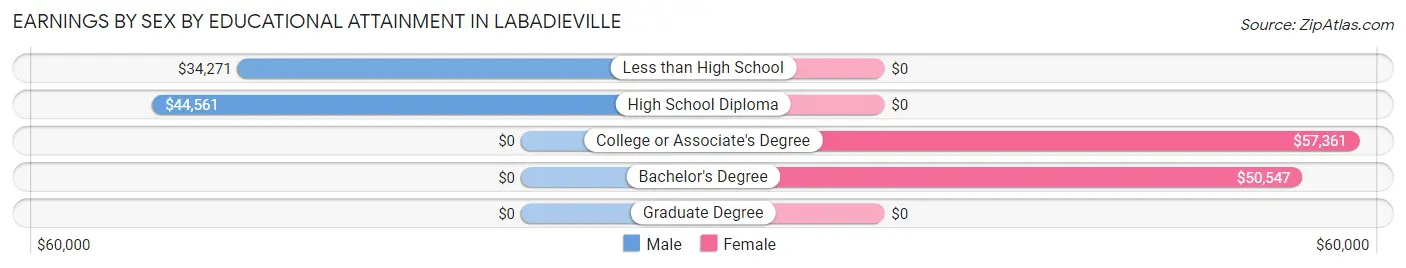
Earnings by Sex by Educational Attainment in Labadieville
Average earnings in Labadieville are $44,628 for men and $45,846 for women, a difference of 2.7%. Men with an educational attainment of high school diploma enjoy the highest average annual earnings of $44,561, while those with less than high school education earn the least with $34,271. Women with an educational attainment of college or associate's degree earn the most with the average annual earnings of $57,361, while those with bachelor's degree education have the smallest earnings of $50,547.
| Educational Attainment | Male Income | Female Income |
| Less than High School | $34,271 | $0 |
| High School Diploma | $44,561 | $0 |
| College or Associate's Degree | - | - |
| Bachelor's Degree | - | - |
| Graduate Degree | - | - |
| Total | $44,628 | $45,846 |
Family Income in Labadieville
Family Income Brackets in Labadieville
According to the Labadieville family income data, there are 151 families falling into the $100,000 to $149,999 income range, which is the most common income bracket and makes up 37.4% of all families.
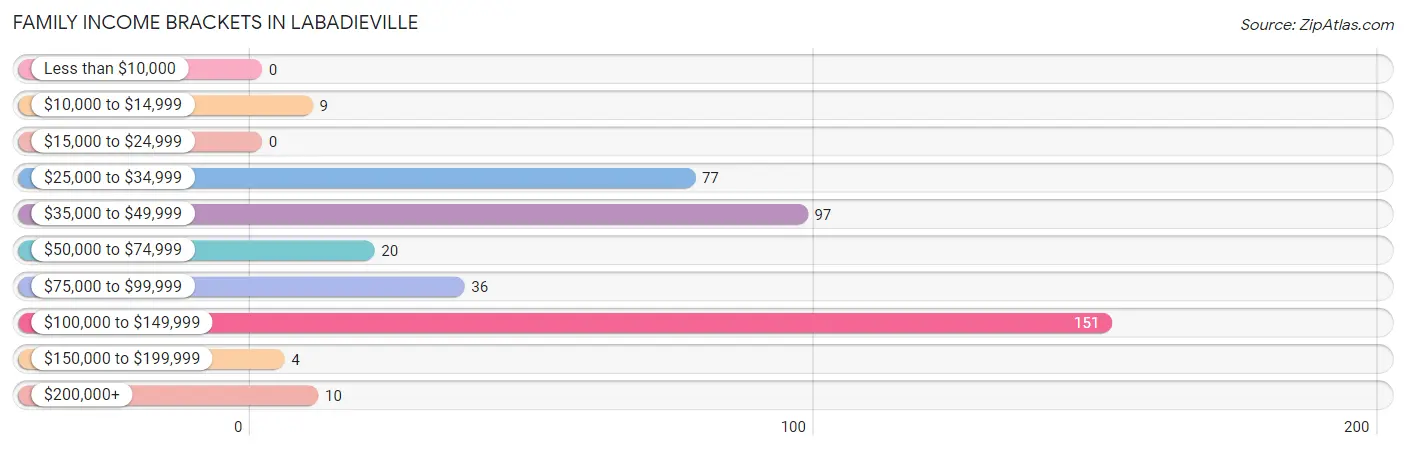
| Income Bracket | # Families | % Families |
| Less than $10,000 | 0 | 0.0% |
| $10,000 to $14,999 | 9 | 2.2% |
| $15,000 to $24,999 | 0 | 0.0% |
| $25,000 to $34,999 | 77 | 19.1% |
| $35,000 to $49,999 | 97 | 24.0% |
| $50,000 to $74,999 | 20 | 5.0% |
| $75,000 to $99,999 | 36 | 8.9% |
| $100,000 to $149,999 | 151 | 37.4% |
| $150,000 to $199,999 | 4 | 1.0% |
| $200,000+ | 10 | 2.5% |
Family Income by Famaliy Size in Labadieville
4-person families (166 | 41.1%) account for the highest median family income in Labadieville with $133,104 per family, while 4-person families (166 | 41.1%) have the highest median income of $33,276 per family member.
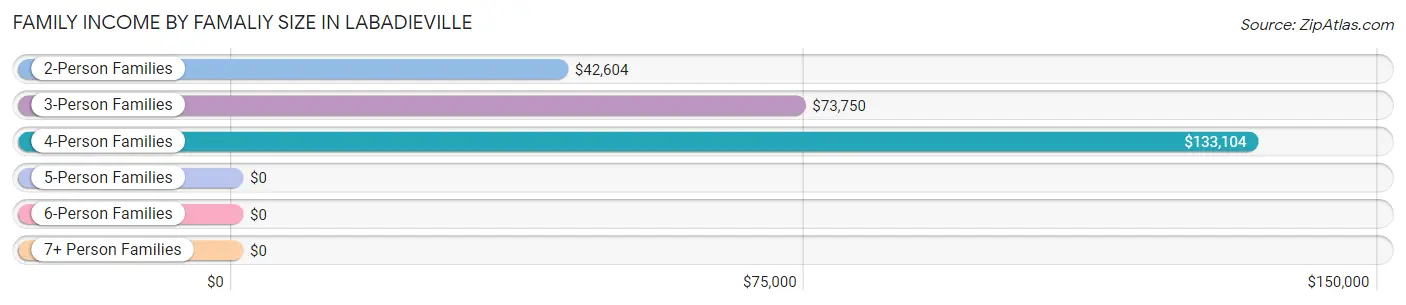
| Income Bracket | # Families | Median Income |
| 2-Person Families | 153 (37.9%) | $42,604 |
| 3-Person Families | 60 (14.8%) | $73,750 |
| 4-Person Families | 166 (41.1%) | $133,104 |
| 5-Person Families | 25 (6.2%) | $0 |
| 6-Person Families | 0 (0.0%) | $0 |
| 7+ Person Families | 0 (0.0%) | $0 |
| Total | 404 (100.0%) | $72,143 |
Family Income by Number of Earners in Labadieville
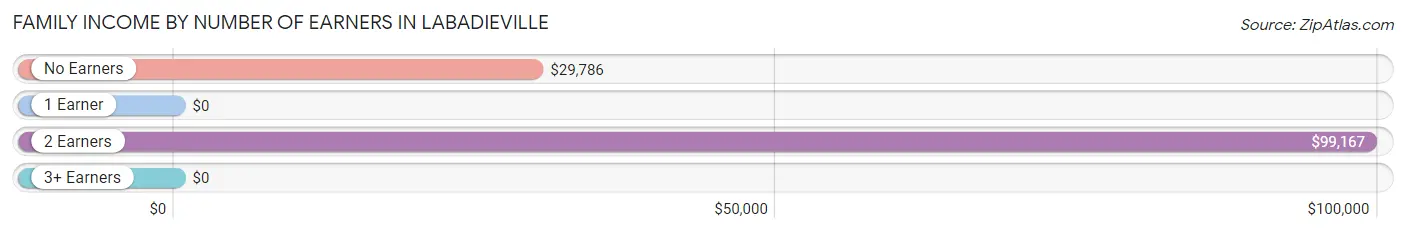
| Number of Earners | # Families | Median Income |
| No Earners | 82 (20.3%) | $29,786 |
| 1 Earner | 179 (44.3%) | $0 |
| 2 Earners | 118 (29.2%) | $99,167 |
| 3+ Earners | 25 (6.2%) | $0 |
| Total | 404 (100.0%) | $72,143 |
Household Income in Labadieville
Household Income Brackets in Labadieville
With 162 households falling in the category, the $25,000 to $34,999 income range is the most frequent in Labadieville, accounting for 23.7% of all households. In contrast, only 4 households (0.6%) fall into the $150,000 to $199,999 income bracket, making it the least populous group.
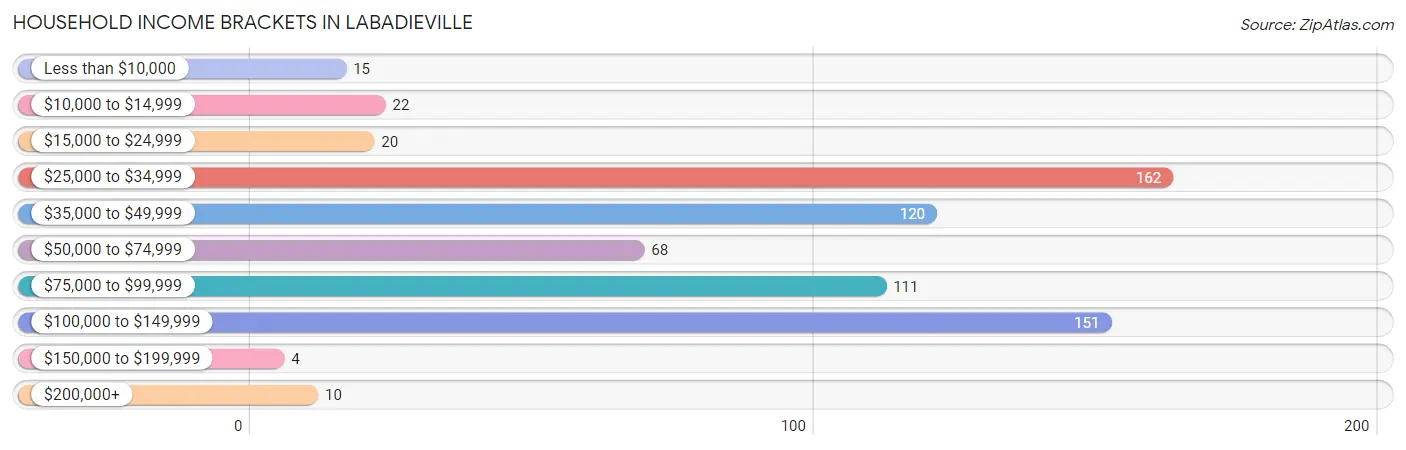
| Income Bracket | # Households | % Households |
| Less than $10,000 | 15 | 2.2% |
| $10,000 to $14,999 | 22 | 3.2% |
| $15,000 to $24,999 | 20 | 2.9% |
| $25,000 to $34,999 | 162 | 23.7% |
| $35,000 to $49,999 | 120 | 17.6% |
| $50,000 to $74,999 | 68 | 10.0% |
| $75,000 to $99,999 | 111 | 16.3% |
| $100,000 to $149,999 | 151 | 22.1% |
| $150,000 to $199,999 | 4 | 0.6% |
| $200,000+ | 10 | 1.5% |
Household Income by Householder Age in Labadieville
The median household income in Labadieville is $55,250, with the highest median household income of $96,711 found in the 45 to 64 years age bracket for the primary householder. A total of 298 households (43.6%) fall into this category. Meanwhile, the 15 to 24 years age bracket for the primary householder has the lowest median household income of $0, with 25 households (3.7%) in this group.
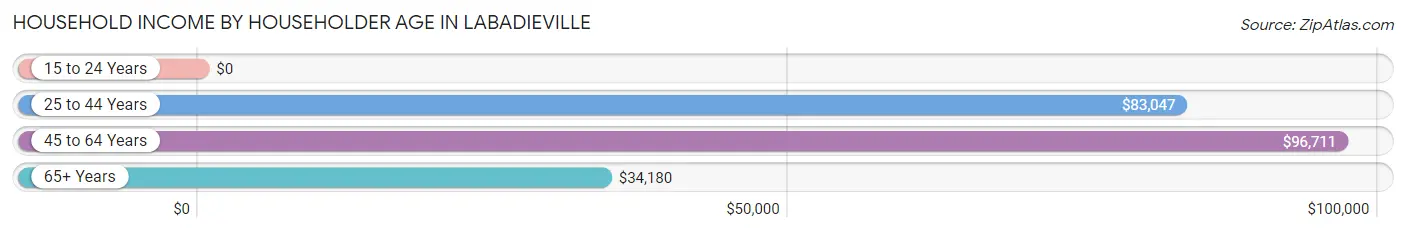
| Income Bracket | # Households | Median Income |
| 15 to 24 Years | 25 (3.7%) | $0 |
| 25 to 44 Years | 173 (25.3%) | $83,047 |
| 45 to 64 Years | 298 (43.6%) | $96,711 |
| 65+ Years | 187 (27.4%) | $34,180 |
| Total | 683 (100.0%) | $55,250 |
Poverty in Labadieville
Income Below Poverty by Sex and Age in Labadieville
With 1.2% poverty level for males and 7.9% for females among the residents of Labadieville, 65 to 74 year old males and 65 to 74 year old females are the most vulnerable to poverty, with 9 males (8.3%) and 23 females (22.8%) in their respective age groups living below the poverty level.
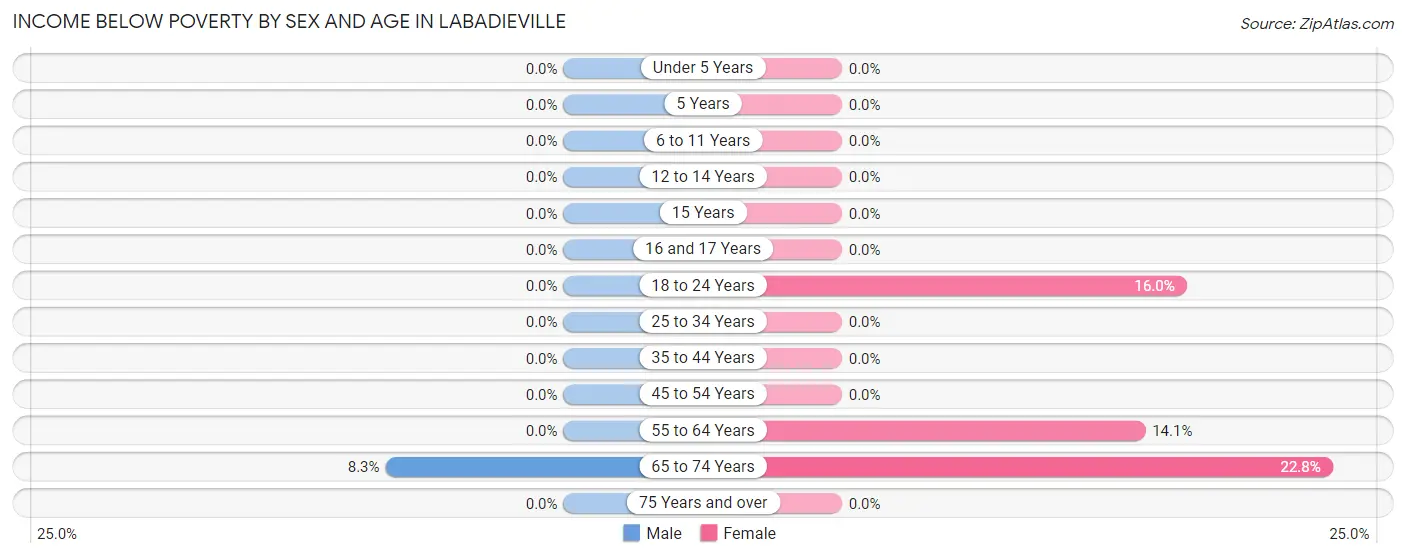
| Age Bracket | Male | Female |
| Under 5 Years | 0 (0.0%) | 0 (0.0%) |
| 5 Years | 0 (0.0%) | 0 (0.0%) |
| 6 to 11 Years | 0 (0.0%) | 0 (0.0%) |
| 12 to 14 Years | 0 (0.0%) | 0 (0.0%) |
| 15 Years | 0 (0.0%) | 0 (0.0%) |
| 16 and 17 Years | 0 (0.0%) | 0 (0.0%) |
| 18 to 24 Years | 0 (0.0%) | 20 (16.0%) |
| 25 to 34 Years | 0 (0.0%) | 0 (0.0%) |
| 35 to 44 Years | 0 (0.0%) | 0 (0.0%) |
| 45 to 54 Years | 0 (0.0%) | 0 (0.0%) |
| 55 to 64 Years | 0 (0.0%) | 20 (14.1%) |
| 65 to 74 Years | 9 (8.3%) | 23 (22.8%) |
| 75 Years and over | 0 (0.0%) | 0 (0.0%) |
| Total | 9 (1.2%) | 63 (7.9%) |
Income Above Poverty by Sex and Age in Labadieville
According to the poverty statistics in Labadieville, males aged under 5 years and females aged under 5 years are the age groups that are most secure financially, with 100.0% of males and 100.0% of females in these age groups living above the poverty line.
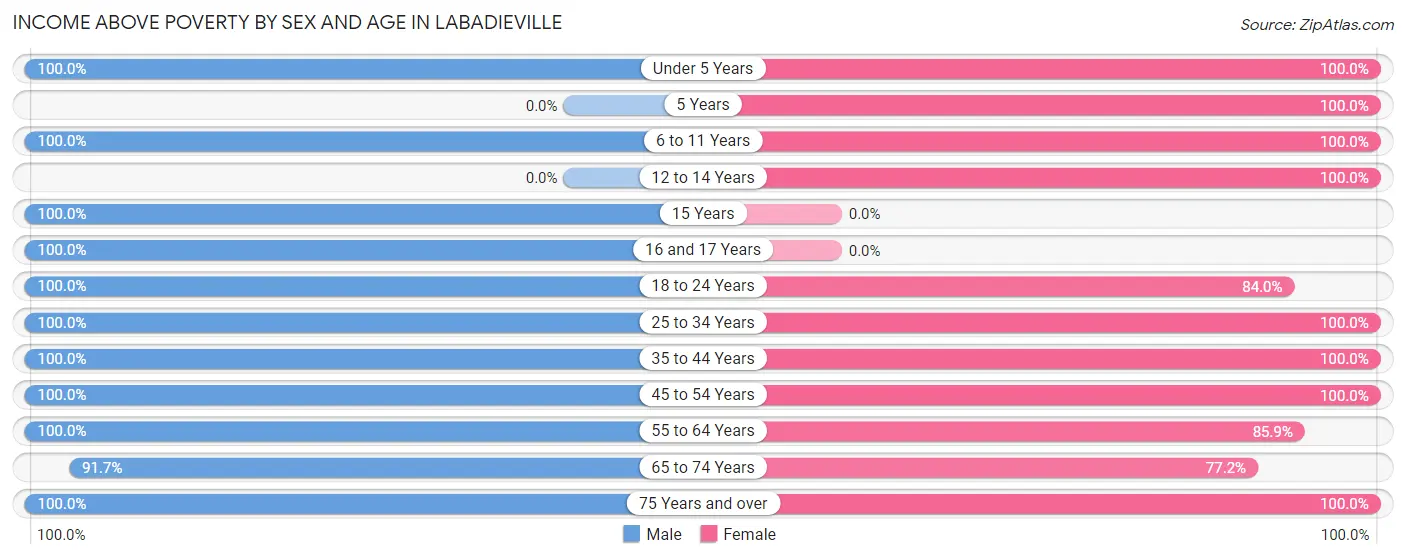
| Age Bracket | Male | Female |
| Under 5 Years | 17 (100.0%) | 16 (100.0%) |
| 5 Years | 0 (0.0%) | 7 (100.0%) |
| 6 to 11 Years | 35 (100.0%) | 21 (100.0%) |
| 12 to 14 Years | 0 (0.0%) | 107 (100.0%) |
| 15 Years | 40 (100.0%) | 0 (0.0%) |
| 16 and 17 Years | 9 (100.0%) | 0 (0.0%) |
| 18 to 24 Years | 36 (100.0%) | 105 (84.0%) |
| 25 to 34 Years | 135 (100.0%) | 101 (100.0%) |
| 35 to 44 Years | 47 (100.0%) | 46 (100.0%) |
| 45 to 54 Years | 188 (100.0%) | 71 (100.0%) |
| 55 to 64 Years | 91 (100.0%) | 122 (85.9%) |
| 65 to 74 Years | 100 (91.7%) | 78 (77.2%) |
| 75 Years and over | 41 (100.0%) | 61 (100.0%) |
| Total | 739 (98.8%) | 735 (92.1%) |
Income Below Poverty Among Married-Couple Families in Labadieville
The poverty statistics for married-couple families in Labadieville show that 2.7% or 9 of the total 334 families live below the poverty line. Families with no children have the highest poverty rate of 5.2%, comprising of 9 families. On the other hand, families with 1 or 2 children have the lowest poverty rate of 0.0%, which includes 0 families.
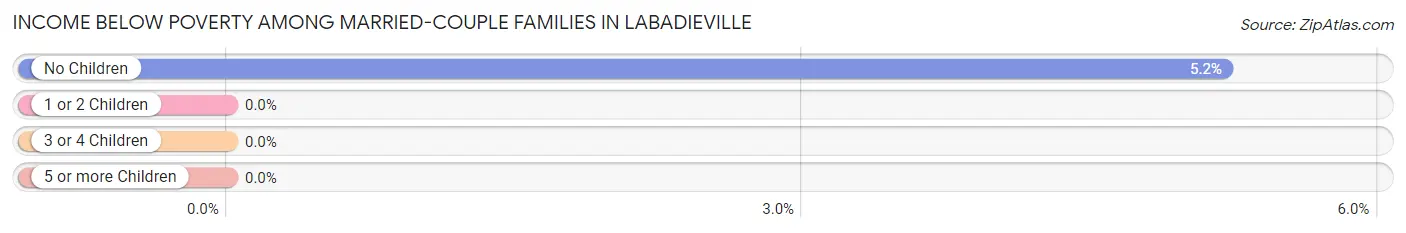
| Children | Above Poverty | Below Poverty |
| No Children | 164 (94.8%) | 9 (5.2%) |
| 1 or 2 Children | 145 (100.0%) | 0 (0.0%) |
| 3 or 4 Children | 16 (100.0%) | 0 (0.0%) |
| 5 or more Children | 0 (0.0%) | 0 (0.0%) |
| Total | 325 (97.3%) | 9 (2.7%) |
Income Below Poverty Among Single-Parent Households in Labadieville

| Children | Single Father | Single Mother |
| No Children | 0 (0.0%) | 0 (0.0%) |
| 1 or 2 Children | 0 (0.0%) | 0 (0.0%) |
| 3 or 4 Children | 0 (0.0%) | 0 (0.0%) |
| 5 or more Children | 0 (0.0%) | 0 (0.0%) |
| Total | 0 (0.0%) | 0 (0.0%) |
Income Below Poverty Among Married-Couple vs Single-Parent Households in Labadieville
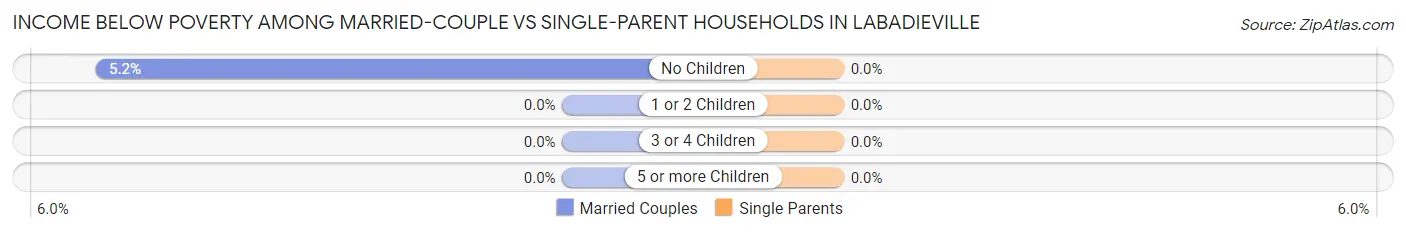
| Children | Married-Couple Families | Single-Parent Households |
| No Children | 9 (5.2%) | 0 (0.0%) |
| 1 or 2 Children | 0 (0.0%) | 0 (0.0%) |
| 3 or 4 Children | 0 (0.0%) | 0 (0.0%) |
| 5 or more Children | 0 (0.0%) | 0 (0.0%) |
| Total | 9 (2.7%) | 0 (0.0%) |
Race in Labadieville
The most populous races in Labadieville are White / Caucasian (1,250 | 80.8%), Two or more Races (240 | 15.5%), and Hispanic or Latino (189 | 12.2%).
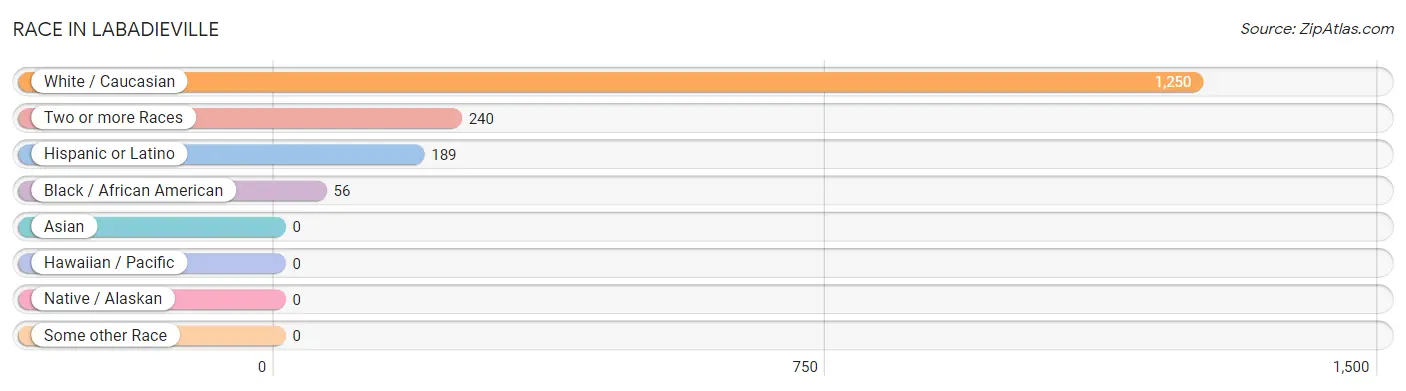
| Race | # Population | % Population |
| Asian | 0 | 0.0% |
| Black / African American | 56 | 3.6% |
| Hawaiian / Pacific | 0 | 0.0% |
| Hispanic or Latino | 189 | 12.2% |
| Native / Alaskan | 0 | 0.0% |
| White / Caucasian | 1,250 | 80.8% |
| Two or more Races | 240 | 15.5% |
| Some other Race | 0 | 0.0% |
| Total | 1,546 | 100.0% |
Ancestry in Labadieville
The most populous ancestries reported in Labadieville are American (217 | 14.0%), Korean (189 | 12.2%), Spanish (189 | 12.2%), Arab (153 | 9.9%), and French (139 | 9.0%), together accounting for 57.4% of all Labadieville residents.
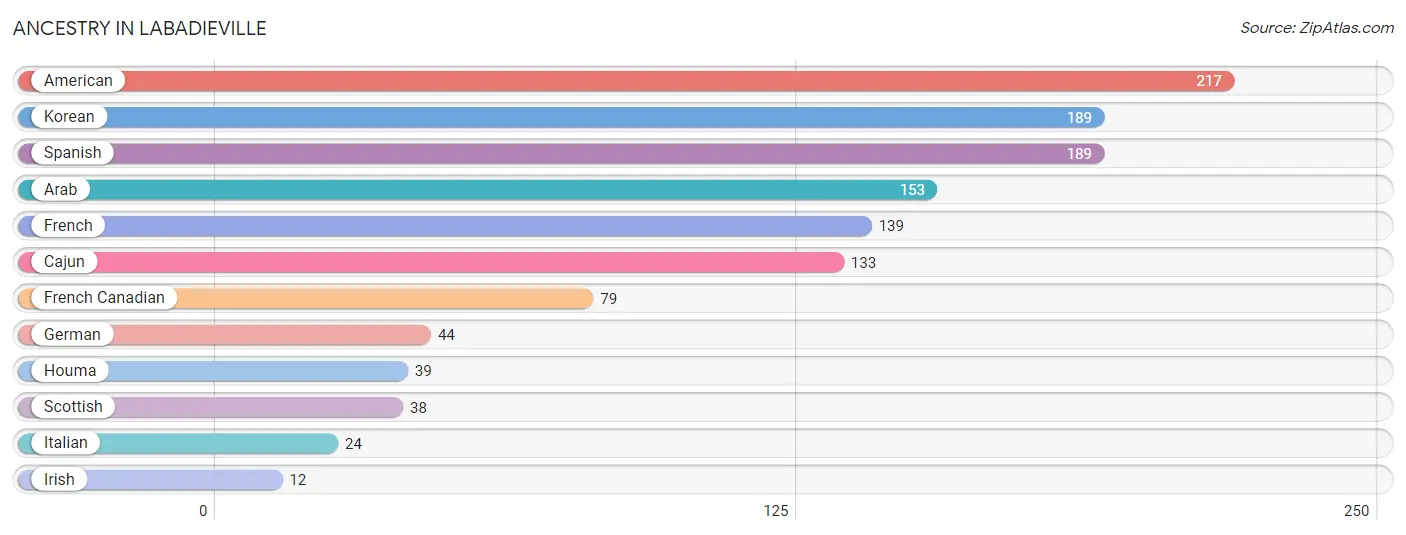
| Ancestry | # Population | % Population |
| American | 217 | 14.0% |
| Arab | 153 | 9.9% |
| Cajun | 133 | 8.6% |
| French | 139 | 9.0% |
| French Canadian | 79 | 5.1% |
| German | 44 | 2.9% |
| Houma | 39 | 2.5% |
| Irish | 12 | 0.8% |
| Italian | 24 | 1.5% |
| Korean | 189 | 12.2% |
| Scottish | 38 | 2.5% |
| Spanish | 189 | 12.2% | View All 12 Rows |
Immigrants in Labadieville
The most numerous immigrant groups reported in Labadieville came from Asia (153 | 9.9%), Western Asia (153 | 9.9%), and Yemen (153 | 9.9%), together accounting for 29.7% of all Labadieville residents.
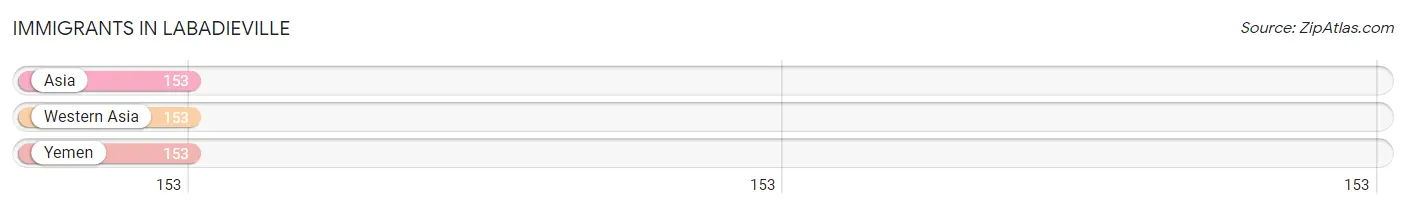
| Immigration Origin | # Population | % Population |
| Asia | 153 | 9.9% |
| Western Asia | 153 | 9.9% |
| Yemen | 153 | 9.9% | View All 3 Rows |
Sex and Age in Labadieville
Sex and Age in Labadieville
The most populous age groups in Labadieville are 45 to 49 Years (133 | 17.8%) for men and 55 to 59 Years (115 | 14.4%) for women.
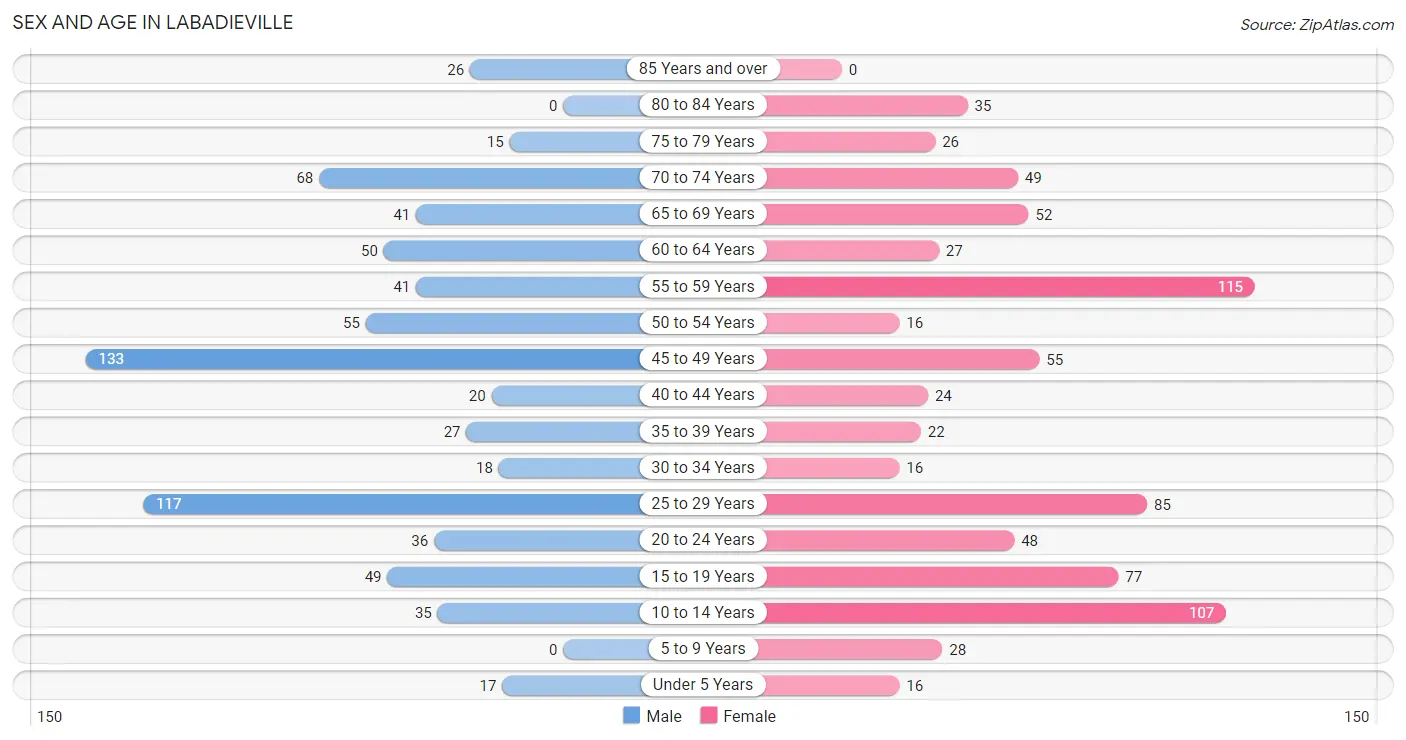
| Age Bracket | Male | Female |
| Under 5 Years | 17 (2.3%) | 16 (2.0%) |
| 5 to 9 Years | 0 (0.0%) | 28 (3.5%) |
| 10 to 14 Years | 35 (4.7%) | 107 (13.4%) |
| 15 to 19 Years | 49 (6.6%) | 77 (9.7%) |
| 20 to 24 Years | 36 (4.8%) | 48 (6.0%) |
| 25 to 29 Years | 117 (15.6%) | 85 (10.6%) |
| 30 to 34 Years | 18 (2.4%) | 16 (2.0%) |
| 35 to 39 Years | 27 (3.6%) | 22 (2.8%) |
| 40 to 44 Years | 20 (2.7%) | 24 (3.0%) |
| 45 to 49 Years | 133 (17.8%) | 55 (6.9%) |
| 50 to 54 Years | 55 (7.3%) | 16 (2.0%) |
| 55 to 59 Years | 41 (5.5%) | 115 (14.4%) |
| 60 to 64 Years | 50 (6.7%) | 27 (3.4%) |
| 65 to 69 Years | 41 (5.5%) | 52 (6.5%) |
| 70 to 74 Years | 68 (9.1%) | 49 (6.1%) |
| 75 to 79 Years | 15 (2.0%) | 26 (3.3%) |
| 80 to 84 Years | 0 (0.0%) | 35 (4.4%) |
| 85 Years and over | 26 (3.5%) | 0 (0.0%) |
| Total | 748 (100.0%) | 798 (100.0%) |
Families and Households in Labadieville
Median Family Size in Labadieville
The median family size in Labadieville is 2.99 persons per family, with single female/mother families (27 | 6.7%) accounting for the largest median family size of 5.3 persons per family. On the other hand, married-couple families (334 | 82.7%) represent the smallest median family size with 2.61 persons per family.
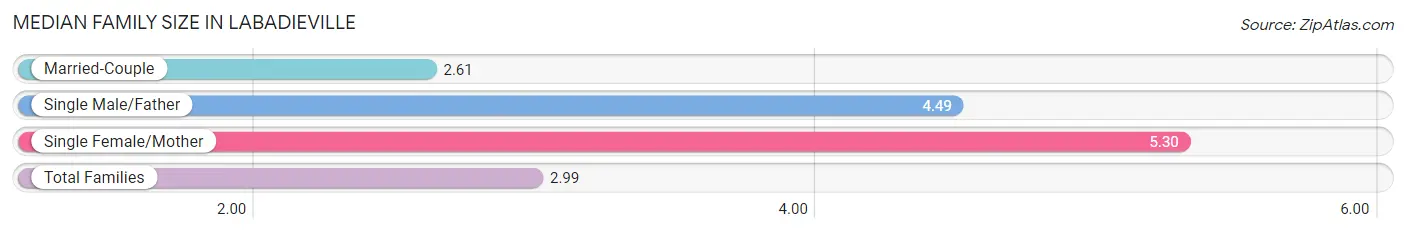
| Family Type | # Families | Family Size |
| Married-Couple | 334 (82.7%) | 2.61 |
| Single Male/Father | 43 (10.6%) | 4.49 |
| Single Female/Mother | 27 (6.7%) | 5.30 |
| Total Families | 404 (100.0%) | 2.99 |
Median Household Size in Labadieville
The median household size in Labadieville is 2.26 persons per household, with single female/mother households (27 | 4.0%) accounting for the largest median household size of 5.3 persons per household. non-family households (279 | 40.8%) represent the smallest median household size with 1.22 persons per household.
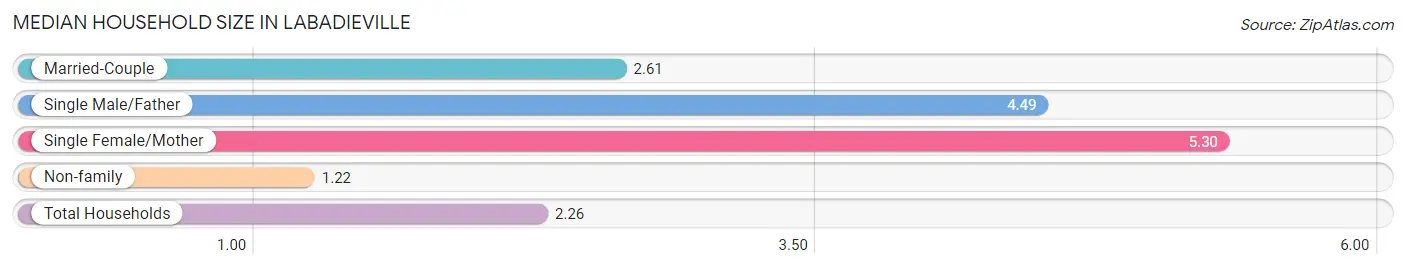
| Household Type | # Households | Household Size |
| Married-Couple | 334 (48.9%) | 2.61 |
| Single Male/Father | 43 (6.3%) | 4.49 |
| Single Female/Mother | 27 (4.0%) | 5.30 |
| Non-family | 279 (40.8%) | 1.22 |
| Total Households | 683 (100.0%) | 2.26 |
Household Size by Marriage Status in Labadieville
Out of a total of 683 households in Labadieville, 404 (59.2%) are family households, while 279 (40.8%) are nonfamily households. The most numerous type of family households are 4-person households, comprising 166, and the most common type of nonfamily households are 1-person households, comprising 229.
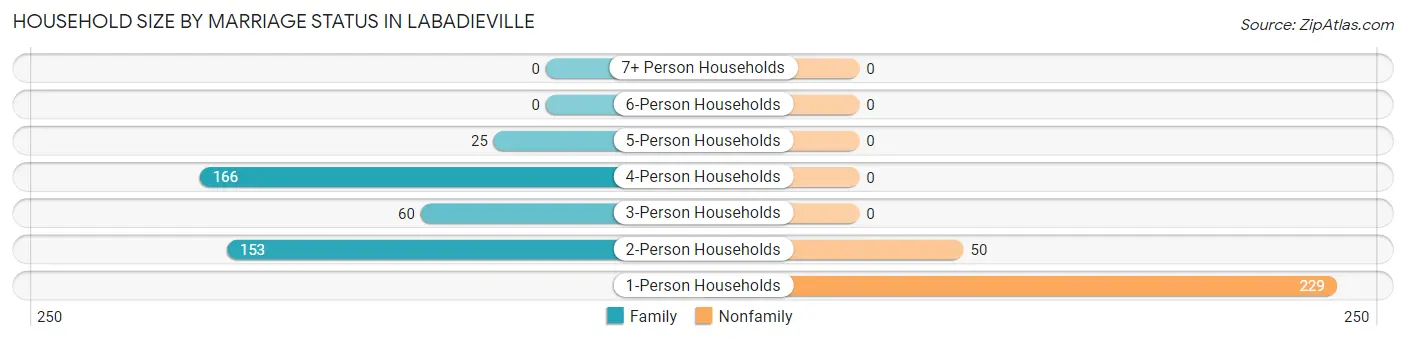
| Household Size | Family Households | Nonfamily Households |
| 1-Person Households | - | 229 (33.5%) |
| 2-Person Households | 153 (22.4%) | 50 (7.3%) |
| 3-Person Households | 60 (8.8%) | 0 (0.0%) |
| 4-Person Households | 166 (24.3%) | 0 (0.0%) |
| 5-Person Households | 25 (3.7%) | 0 (0.0%) |
| 6-Person Households | 0 (0.0%) | 0 (0.0%) |
| 7+ Person Households | 0 (0.0%) | 0 (0.0%) |
| Total | 404 (59.2%) | 279 (40.8%) |
Female Fertility in Labadieville
Fertility by Age in Labadieville
| Age Bracket | Women with Births | Births / 1,000 Women |
| 15 to 19 years | 0 (0.0%) | 0.0 |
| 20 to 34 years | 0 (0.0%) | 0.0 |
| 35 to 50 years | 0 (0.0%) | 0.0 |
| Total | 0 (0.0%) | 0.0 |
Fertility by Age by Marriage Status in Labadieville
| Age Bracket | Married | Unmarried |
| 15 to 19 years | 0 (0.0%) | 0 (0.0%) |
| 20 to 34 years | 0 (0.0%) | 0 (0.0%) |
| 35 to 50 years | 0 (0.0%) | 0 (0.0%) |
| Total | 0 (0.0%) | 0 (0.0%) |
Fertility by Education in Labadieville
| Educational Attainment | Women with Births | Births / 1,000 Women |
| Less than High School | 0 (0.0%) | 0.0 |
| High School Diploma | 0 (0.0%) | 0.0 |
| College or Associate's Degree | 0 (0.0%) | 0.0 |
| Bachelor's Degree | 0 (0.0%) | 0.0 |
| Graduate Degree | 0 (0.0%) | 0.0 |
| Total | 0 (0.0%) | 0.0 |
Fertility by Education by Marriage Status in Labadieville
| Educational Attainment | Married | Unmarried |
| Less than High School | 0 (0.0%) | 0 (0.0%) |
| High School Diploma | 0 (0.0%) | 0 (0.0%) |
| College or Associate's Degree | 0 (0.0%) | 0 (0.0%) |
| Bachelor's Degree | 0 (0.0%) | 0 (0.0%) |
| Graduate Degree | 0 (0.0%) | 0 (0.0%) |
| Total | 0 (0.0%) | 0 (0.0%) |
Employment Characteristics in Labadieville
Employment by Class of Employer in Labadieville
Among the 640 employed individuals in Labadieville, private company employees (422 | 65.9%), federal government employees (56 | 8.7%), and state government employees (54 | 8.4%) make up the most common classes of employment.
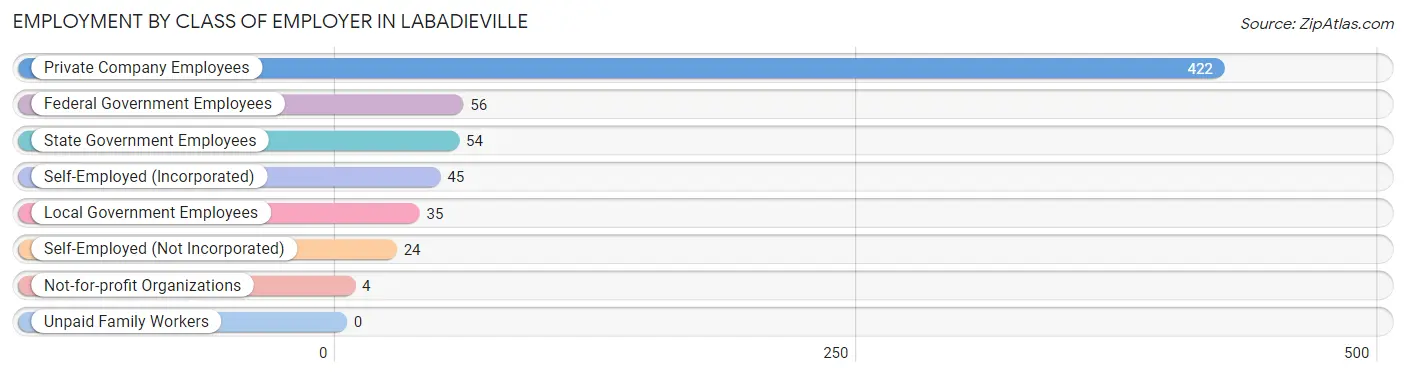
| Employer Class | # Employees | % Employees |
| Private Company Employees | 422 | 65.9% |
| Self-Employed (Incorporated) | 45 | 7.0% |
| Self-Employed (Not Incorporated) | 24 | 3.7% |
| Not-for-profit Organizations | 4 | 0.6% |
| Local Government Employees | 35 | 5.5% |
| State Government Employees | 54 | 8.4% |
| Federal Government Employees | 56 | 8.7% |
| Unpaid Family Workers | 0 | 0.0% |
| Total | 640 | 100.0% |
Employment Status by Age in Labadieville
According to the labor force statistics for Labadieville, out of the total population over 16 years of age (1,303), 56.1% or 731 individuals are in the labor force, with 12.7% or 93 of them unemployed. The age group with the highest labor force participation rate is 20 to 24 years, with 100.0% or 84 individuals in the labor force. Within the labor force, the 45 to 54 years age range has the highest percentage of unemployed individuals, with 24.0% or 58 of them being unemployed.
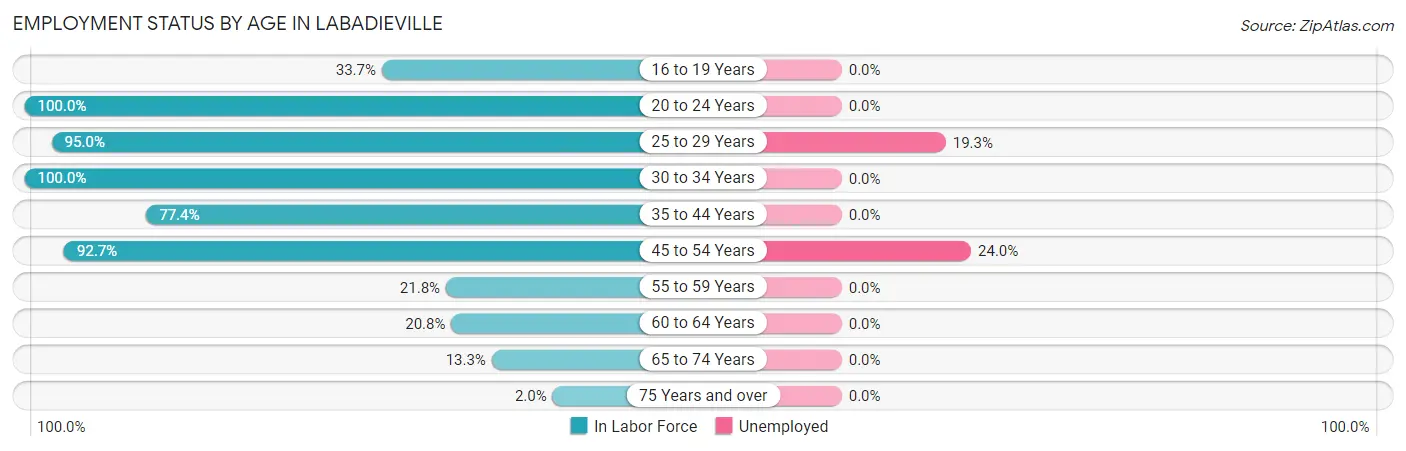
| Age Bracket | In Labor Force | Unemployed |
| 16 to 19 Years | 29 (33.7%) | 0 (0.0%) |
| 20 to 24 Years | 84 (100.0%) | 0 (0.0%) |
| 25 to 29 Years | 192 (95.0%) | 37 (19.3%) |
| 30 to 34 Years | 34 (100.0%) | 0 (0.0%) |
| 35 to 44 Years | 72 (77.4%) | 0 (0.0%) |
| 45 to 54 Years | 240 (92.7%) | 58 (24.0%) |
| 55 to 59 Years | 34 (21.8%) | 0 (0.0%) |
| 60 to 64 Years | 16 (20.8%) | 0 (0.0%) |
| 65 to 74 Years | 28 (13.3%) | 0 (0.0%) |
| 75 Years and over | 2 (2.0%) | 0 (0.0%) |
| Total | 731 (56.1%) | 93 (12.7%) |
Employment Status by Educational Attainment in Labadieville
According to labor force statistics for Labadieville, 71.6% of individuals (588) out of the total population between 25 and 64 years of age (821) are in the labor force, with 15.9% or 93 of them being unemployed. The group with the highest labor force participation rate are those with the educational attainment of bachelor's degree or higher, with 100.0% or 86 individuals in the labor force. Within the labor force, individuals with less than high school education have the highest percentage of unemployment, with 34.2% or 54 of them being unemployed.
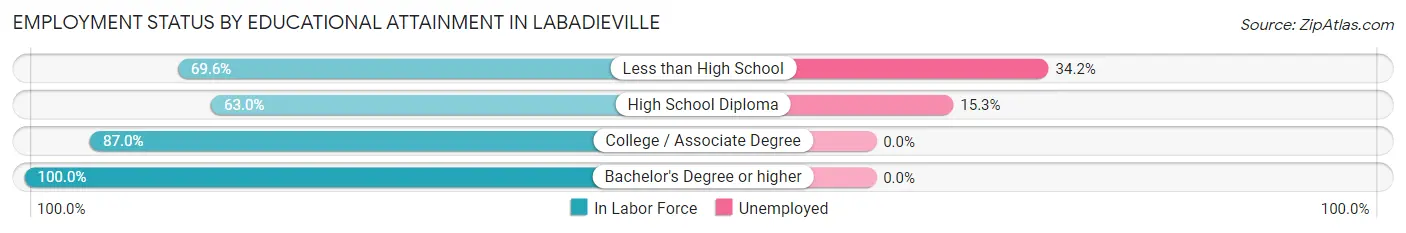
| Educational Attainment | In Labor Force | Unemployed |
| Less than High School | 158 (69.6%) | 78 (34.2%) |
| High School Diploma | 257 (63.0%) | 62 (15.3%) |
| College / Associate Degree | 87 (87.0%) | 0 (0.0%) |
| Bachelor's Degree or higher | 86 (100.0%) | 0 (0.0%) |
| Total | 588 (71.6%) | 131 (15.9%) |
Employment Occupations by Sex in Labadieville
Management, Business, Science and Arts Occupations
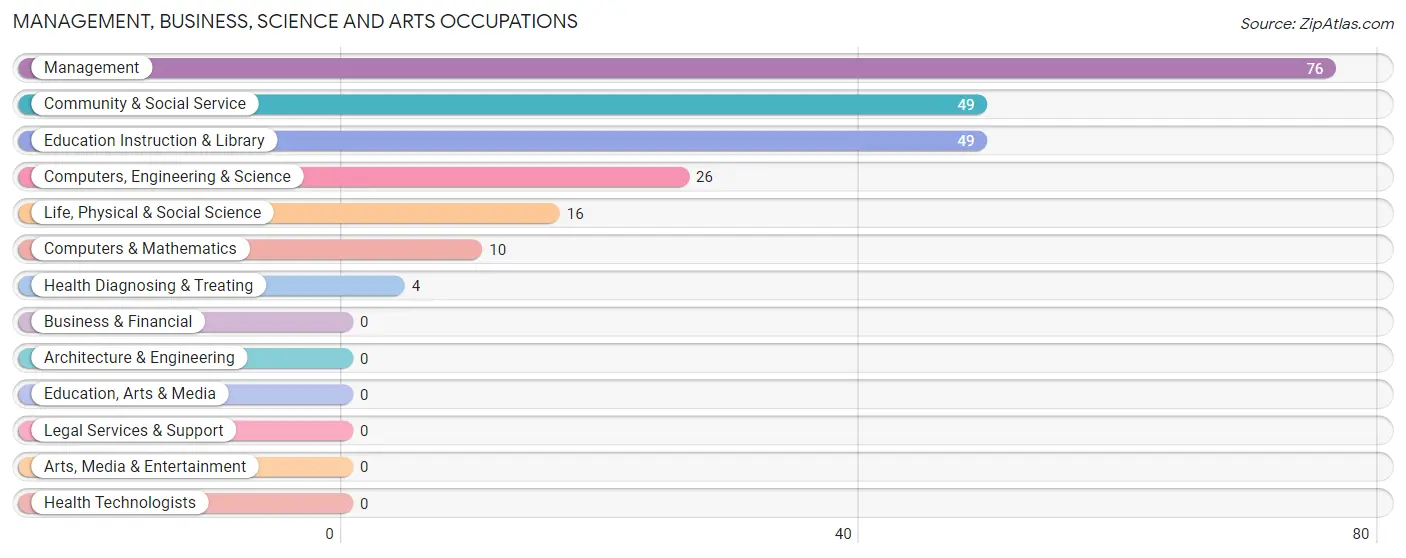
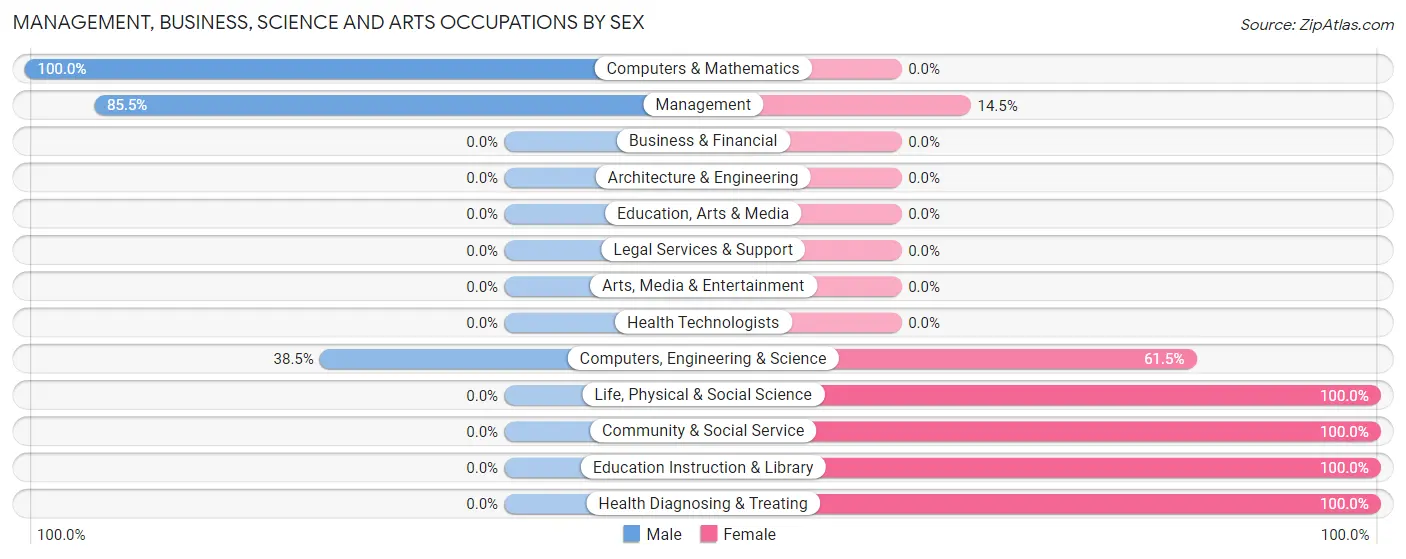
The most common Management, Business, Science and Arts occupations in Labadieville are Management (76 | 12.2%), Community & Social Service (49 | 7.8%), Education Instruction & Library (49 | 7.8%), Computers, Engineering & Science (26 | 4.2%), and Life, Physical & Social Science (16 | 2.6%).
Management, Business, Science and Arts Occupations by Sex
Within the Management, Business, Science and Arts occupations in Labadieville, the most male-oriented occupations are Computers & Mathematics (100.0%), Management (85.5%), and Computers, Engineering & Science (38.5%), while the most female-oriented occupations are Life, Physical & Social Science (100.0%), Community & Social Service (100.0%), and Education Instruction & Library (100.0%).
| Occupation | Male | Female |
| Management | 65 (85.5%) | 11 (14.5%) |
| Business & Financial | 0 (0.0%) | 0 (0.0%) |
| Computers, Engineering & Science | 10 (38.5%) | 16 (61.5%) |
| Computers & Mathematics | 10 (100.0%) | 0 (0.0%) |
| Architecture & Engineering | 0 (0.0%) | 0 (0.0%) |
| Life, Physical & Social Science | 0 (0.0%) | 16 (100.0%) |
| Community & Social Service | 0 (0.0%) | 49 (100.0%) |
| Education, Arts & Media | 0 (0.0%) | 0 (0.0%) |
| Legal Services & Support | 0 (0.0%) | 0 (0.0%) |
| Education Instruction & Library | 0 (0.0%) | 49 (100.0%) |
| Arts, Media & Entertainment | 0 (0.0%) | 0 (0.0%) |
| Health Diagnosing & Treating | 0 (0.0%) | 4 (100.0%) |
| Health Technologists | 0 (0.0%) | 0 (0.0%) |
| Total (Category) | 75 (48.4%) | 80 (51.6%) |
| Total (Overall) | 301 (48.2%) | 324 (51.8%) |
Services Occupations
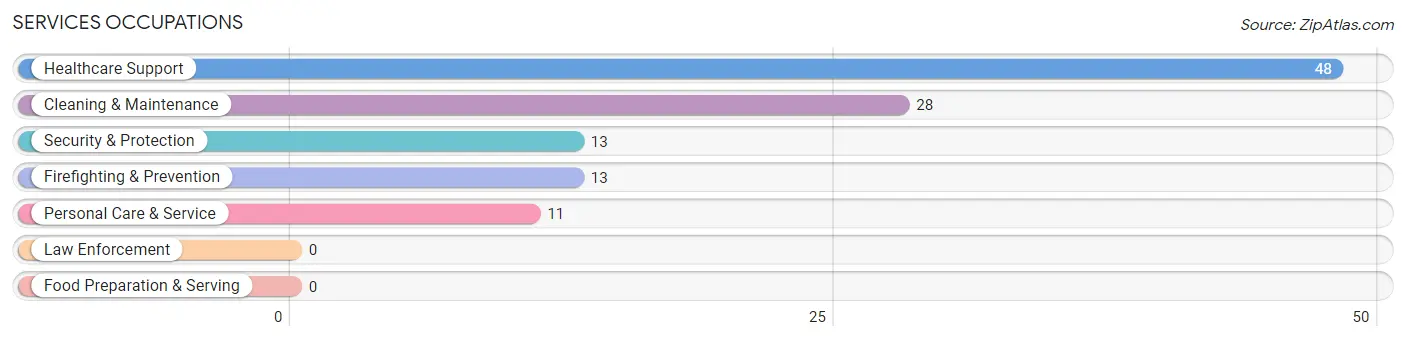
The most common Services occupations in Labadieville are Healthcare Support (48 | 7.7%), Cleaning & Maintenance (28 | 4.5%), Security & Protection (13 | 2.1%), Firefighting & Prevention (13 | 2.1%), and Personal Care & Service (11 | 1.8%).
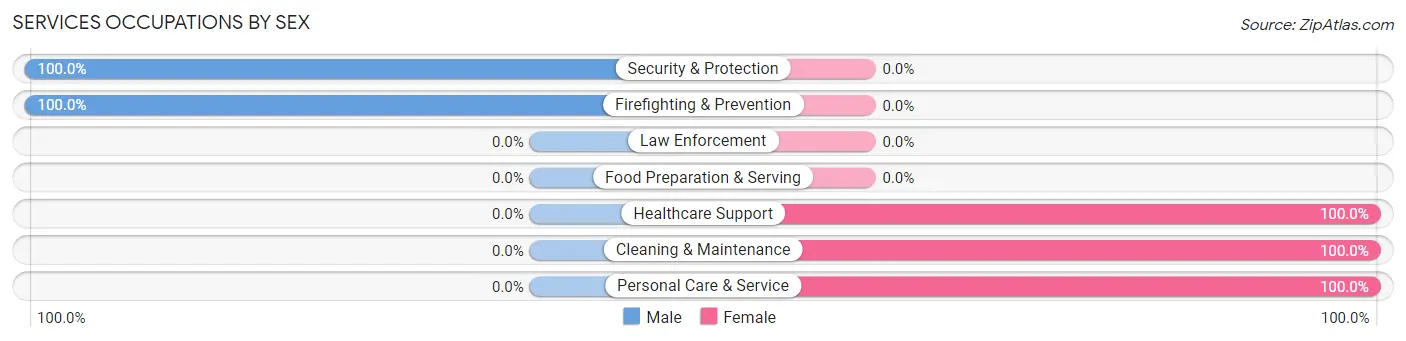
Services Occupations by Sex
Within the Services occupations in Labadieville, the most male-oriented occupations are Security & Protection (100.0%), and Firefighting & Prevention (100.0%), while the most female-oriented occupations are Healthcare Support (100.0%), Cleaning & Maintenance (100.0%), and Personal Care & Service (100.0%).
| Occupation | Male | Female |
| Healthcare Support | 0 (0.0%) | 48 (100.0%) |
| Security & Protection | 13 (100.0%) | 0 (0.0%) |
| Firefighting & Prevention | 13 (100.0%) | 0 (0.0%) |
| Law Enforcement | 0 (0.0%) | 0 (0.0%) |
| Food Preparation & Serving | 0 (0.0%) | 0 (0.0%) |
| Cleaning & Maintenance | 0 (0.0%) | 28 (100.0%) |
| Personal Care & Service | 0 (0.0%) | 11 (100.0%) |
| Total (Category) | 13 (13.0%) | 87 (87.0%) |
| Total (Overall) | 301 (48.2%) | 324 (51.8%) |
Sales and Office Occupations
The most common Sales and Office occupations in Labadieville are Office & Administration (156 | 25.0%), and Sales & Related (118 | 18.9%).

Sales and Office Occupations by Sex

| Occupation | Male | Female |
| Sales & Related | 89 (75.4%) | 29 (24.6%) |
| Office & Administration | 28 (17.9%) | 128 (82.1%) |
| Total (Category) | 117 (42.7%) | 157 (57.3%) |
| Total (Overall) | 301 (48.2%) | 324 (51.8%) |
Natural Resources, Construction and Maintenance Occupations
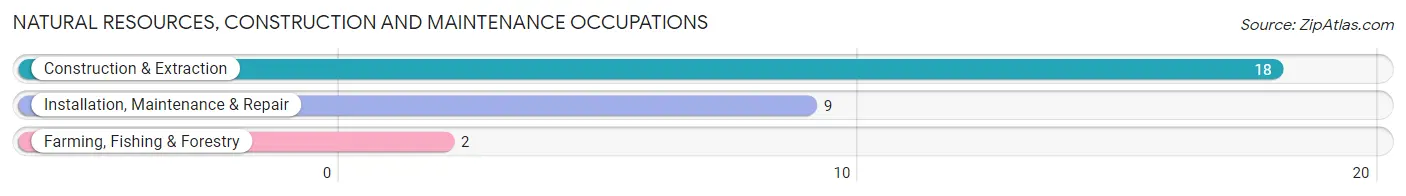
The most common Natural Resources, Construction and Maintenance occupations in Labadieville are Construction & Extraction (18 | 2.9%), Installation, Maintenance & Repair (9 | 1.4%), and Farming, Fishing & Forestry (2 | 0.3%).
Natural Resources, Construction and Maintenance Occupations by Sex
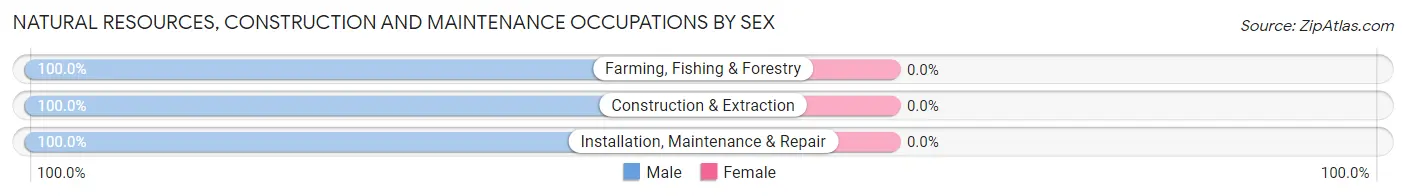
| Occupation | Male | Female |
| Farming, Fishing & Forestry | 2 (100.0%) | 0 (0.0%) |
| Construction & Extraction | 18 (100.0%) | 0 (0.0%) |
| Installation, Maintenance & Repair | 9 (100.0%) | 0 (0.0%) |
| Total (Category) | 29 (100.0%) | 0 (0.0%) |
| Total (Overall) | 301 (48.2%) | 324 (51.8%) |
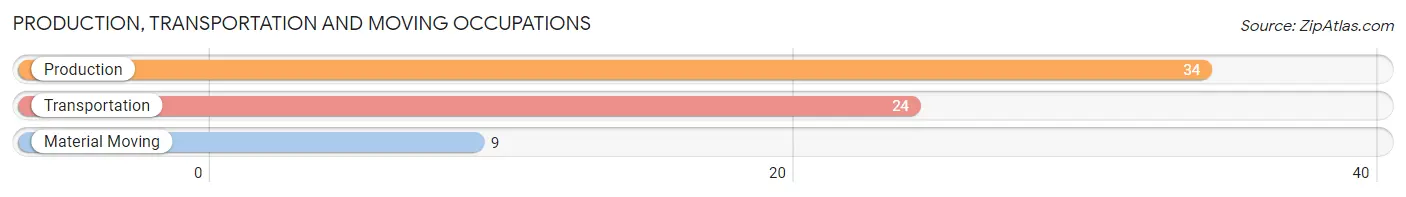
Production, Transportation and Moving Occupations
The most common Production, Transportation and Moving occupations in Labadieville are Production (34 | 5.4%), Transportation (24 | 3.8%), and Material Moving (9 | 1.4%).
Production, Transportation and Moving Occupations by Sex
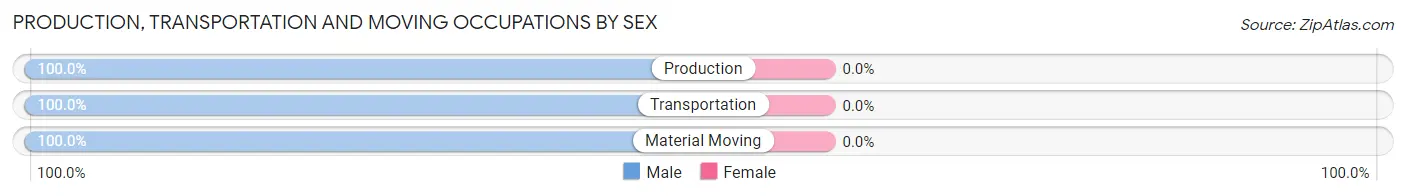
| Occupation | Male | Female |
| Production | 34 (100.0%) | 0 (0.0%) |
| Transportation | 24 (100.0%) | 0 (0.0%) |
| Material Moving | 9 (100.0%) | 0 (0.0%) |
| Total (Category) | 67 (100.0%) | 0 (0.0%) |
| Total (Overall) | 301 (48.2%) | 324 (51.8%) |
Employment Industries by Sex in Labadieville
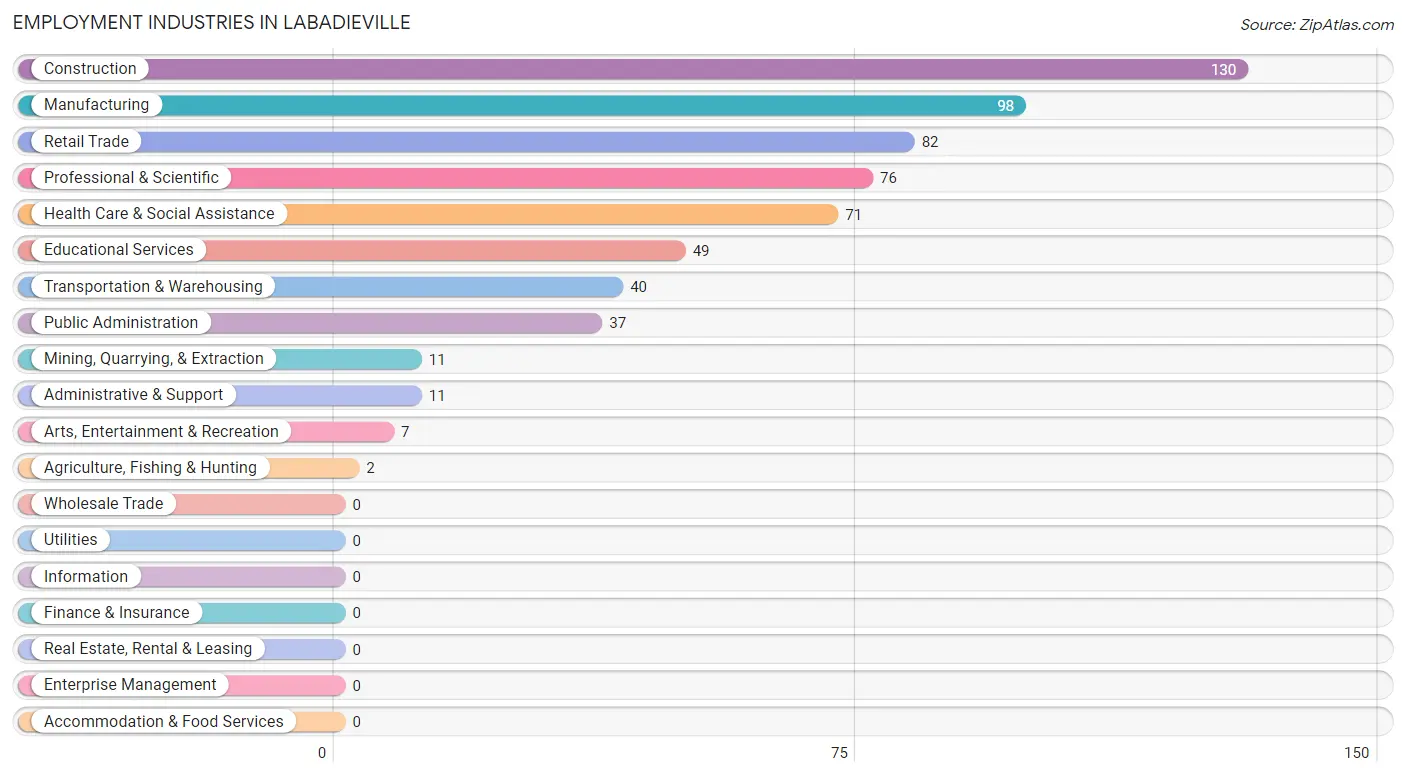
Employment Industries in Labadieville
The major employment industries in Labadieville include Construction (130 | 20.8%), Manufacturing (98 | 15.7%), Retail Trade (82 | 13.1%), Professional & Scientific (76 | 12.2%), and Health Care & Social Assistance (71 | 11.4%).
Employment Industries by Sex in Labadieville
The Labadieville industries that see more men than women are Agriculture, Fishing & Hunting (100.0%), Administrative & Support (100.0%), and Professional & Scientific (78.9%), whereas the industries that tend to have a higher number of women are Mining, Quarrying, & Extraction (100.0%), Educational Services (100.0%), and Health Care & Social Assistance (100.0%).
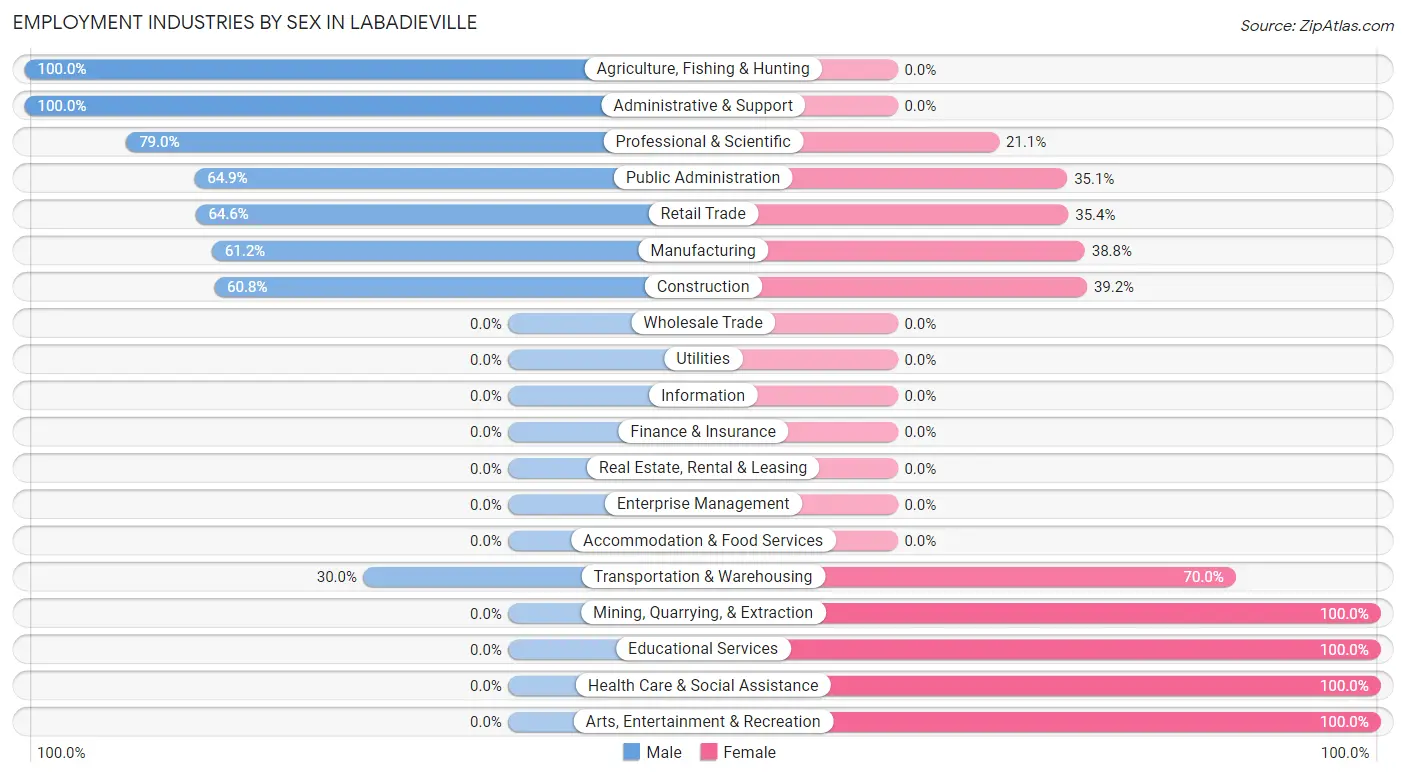
| Industry | Male | Female |
| Agriculture, Fishing & Hunting | 2 (100.0%) | 0 (0.0%) |
| Mining, Quarrying, & Extraction | 0 (0.0%) | 11 (100.0%) |
| Construction | 79 (60.8%) | 51 (39.2%) |
| Manufacturing | 60 (61.2%) | 38 (38.8%) |
| Wholesale Trade | 0 (0.0%) | 0 (0.0%) |
| Retail Trade | 53 (64.6%) | 29 (35.4%) |
| Transportation & Warehousing | 12 (30.0%) | 28 (70.0%) |
| Utilities | 0 (0.0%) | 0 (0.0%) |
| Information | 0 (0.0%) | 0 (0.0%) |
| Finance & Insurance | 0 (0.0%) | 0 (0.0%) |
| Real Estate, Rental & Leasing | 0 (0.0%) | 0 (0.0%) |
| Professional & Scientific | 60 (78.9%) | 16 (21.0%) |
| Enterprise Management | 0 (0.0%) | 0 (0.0%) |
| Administrative & Support | 11 (100.0%) | 0 (0.0%) |
| Educational Services | 0 (0.0%) | 49 (100.0%) |
| Health Care & Social Assistance | 0 (0.0%) | 71 (100.0%) |
| Arts, Entertainment & Recreation | 0 (0.0%) | 7 (100.0%) |
| Accommodation & Food Services | 0 (0.0%) | 0 (0.0%) |
| Public Administration | 24 (64.9%) | 13 (35.1%) |
| Total | 301 (48.2%) | 324 (51.8%) |
Education in Labadieville
School Enrollment in Labadieville
The most common levels of schooling among the 283 students in Labadieville are middle school (136 | 48.1%), high school (74 | 26.2%), and college / undergraduate (39 | 13.8%).
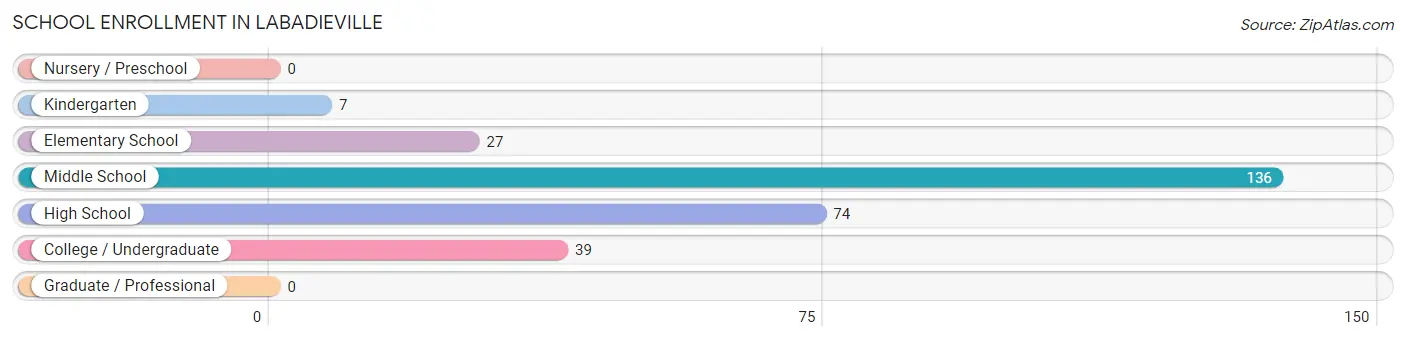
| School Level | # Students | % Students |
| Nursery / Preschool | 0 | 0.0% |
| Kindergarten | 7 | 2.5% |
| Elementary School | 27 | 9.5% |
| Middle School | 136 | 48.1% |
| High School | 74 | 26.2% |
| College / Undergraduate | 39 | 13.8% |
| Graduate / Professional | 0 | 0.0% |
| Total | 283 | 100.0% |
School Enrollment by Age by Funding Source in Labadieville
Out of a total of 283 students who are enrolled in schools in Labadieville, 23 (8.1%) attend a private institution, while the remaining 260 (91.9%) are enrolled in public schools. The age group of 5 to 9 year old has the highest likelihood of being enrolled in private schools, with 17 (60.7% in the age bracket) enrolled. Conversely, the age group of 15 to 17 year olds has the lowest likelihood of being enrolled in a private school, with 17 (100.0% in the age bracket) attending a public institution.
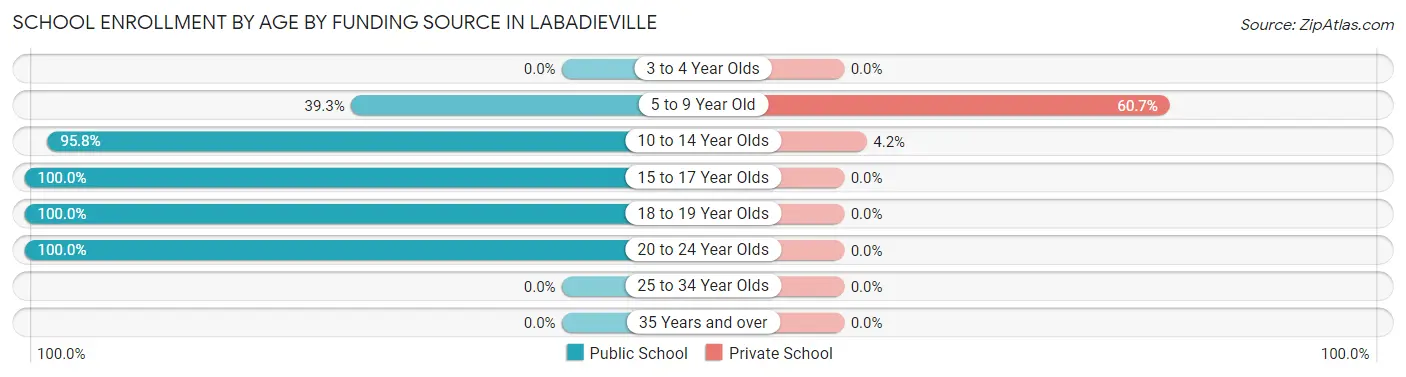
| Age Bracket | Public School | Private School |
| 3 to 4 Year Olds | 0 (0.0%) | 0 (0.0%) |
| 5 to 9 Year Old | 11 (39.3%) | 17 (60.7%) |
| 10 to 14 Year Olds | 136 (95.8%) | 6 (4.2%) |
| 15 to 17 Year Olds | 17 (100.0%) | 0 (0.0%) |
| 18 to 19 Year Olds | 57 (100.0%) | 0 (0.0%) |
| 20 to 24 Year Olds | 39 (100.0%) | 0 (0.0%) |
| 25 to 34 Year Olds | 0 (0.0%) | 0 (0.0%) |
| 35 Years and over | 0 (0.0%) | 0 (0.0%) |
| Total | 260 (91.9%) | 23 (8.1%) |
Educational Attainment by Field of Study in Labadieville
Business (29 | 33.7%), education (27 | 31.4%), communications (16 | 18.6%), and science & technology (14 | 16.3%) are the most common fields of study among 86 individuals in Labadieville who have obtained a bachelor's degree or higher.
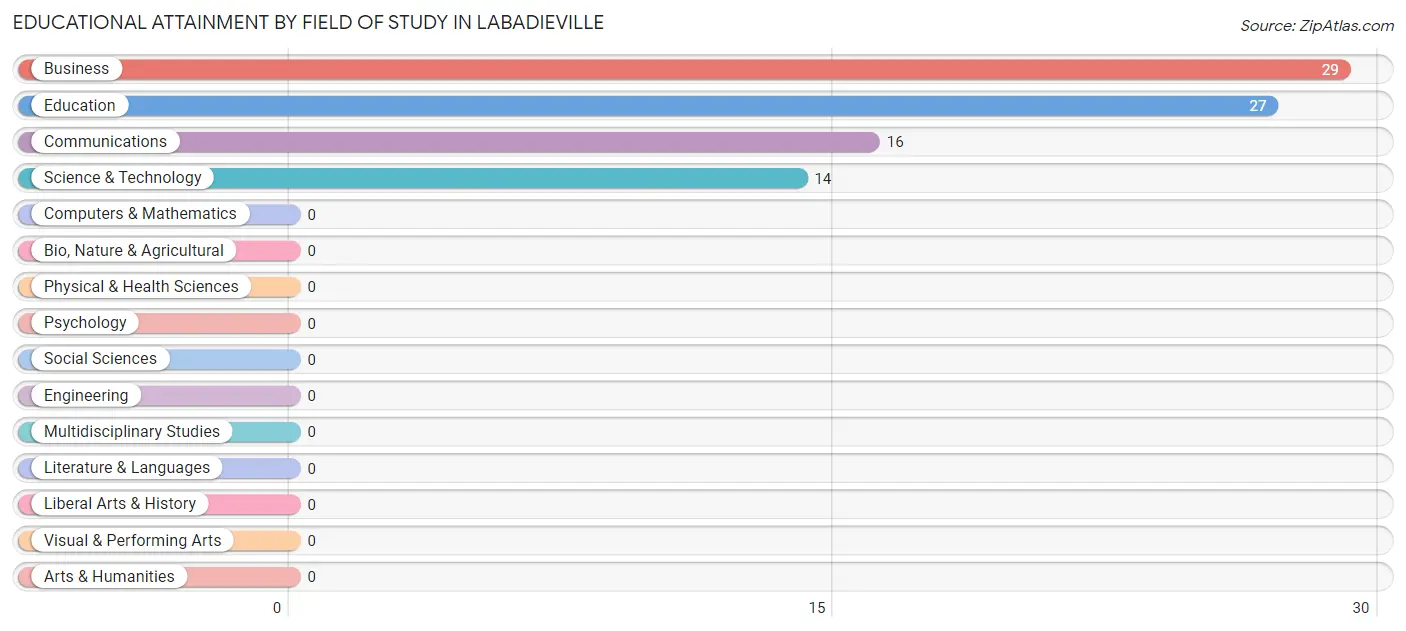
| Field of Study | # Graduates | % Graduates |
| Computers & Mathematics | 0 | 0.0% |
| Bio, Nature & Agricultural | 0 | 0.0% |
| Physical & Health Sciences | 0 | 0.0% |
| Psychology | 0 | 0.0% |
| Social Sciences | 0 | 0.0% |
| Engineering | 0 | 0.0% |
| Multidisciplinary Studies | 0 | 0.0% |
| Science & Technology | 14 | 16.3% |
| Business | 29 | 33.7% |
| Education | 27 | 31.4% |
| Literature & Languages | 0 | 0.0% |
| Liberal Arts & History | 0 | 0.0% |
| Visual & Performing Arts | 0 | 0.0% |
| Communications | 16 | 18.6% |
| Arts & Humanities | 0 | 0.0% |
| Total | 86 | 100.0% |
Transportation & Commute in Labadieville
Vehicle Availability by Sex in Labadieville
The most prevalent vehicle ownership categories in Labadieville are males with 2 vehicles (155, accounting for 49.0%) and females with 2 vehicles (163, making up 47.8%).
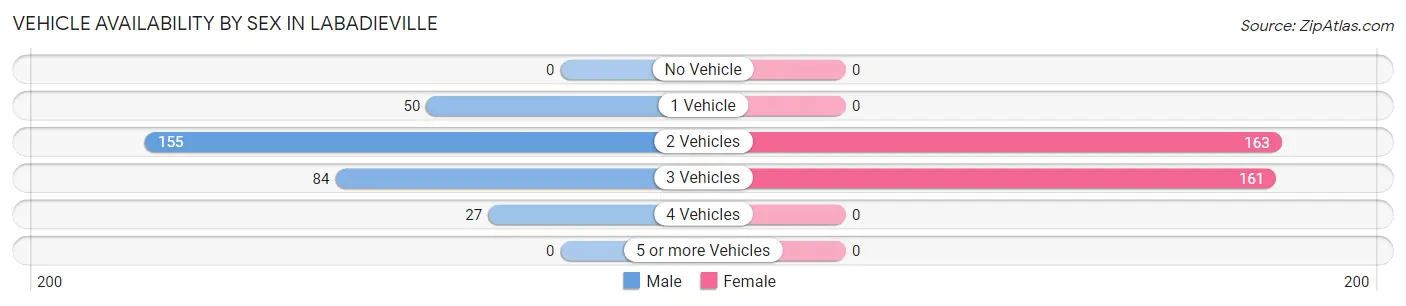
| Vehicles Available | Male | Female |
| No Vehicle | 0 (0.0%) | 0 (0.0%) |
| 1 Vehicle | 50 (15.8%) | 0 (0.0%) |
| 2 Vehicles | 155 (49.0%) | 163 (50.3%) |
| 3 Vehicles | 84 (26.6%) | 161 (49.7%) |
| 4 Vehicles | 27 (8.5%) | 0 (0.0%) |
| 5 or more Vehicles | 0 (0.0%) | 0 (0.0%) |
| Total | 316 (100.0%) | 324 (100.0%) |
Commute Time in Labadieville
The most frequently occuring commute durations in Labadieville are 10 to 14 minutes (134 commuters, 21.3%), 45 to 59 minutes (109 commuters, 17.3%), and 35 to 39 minutes (87 commuters, 13.8%).
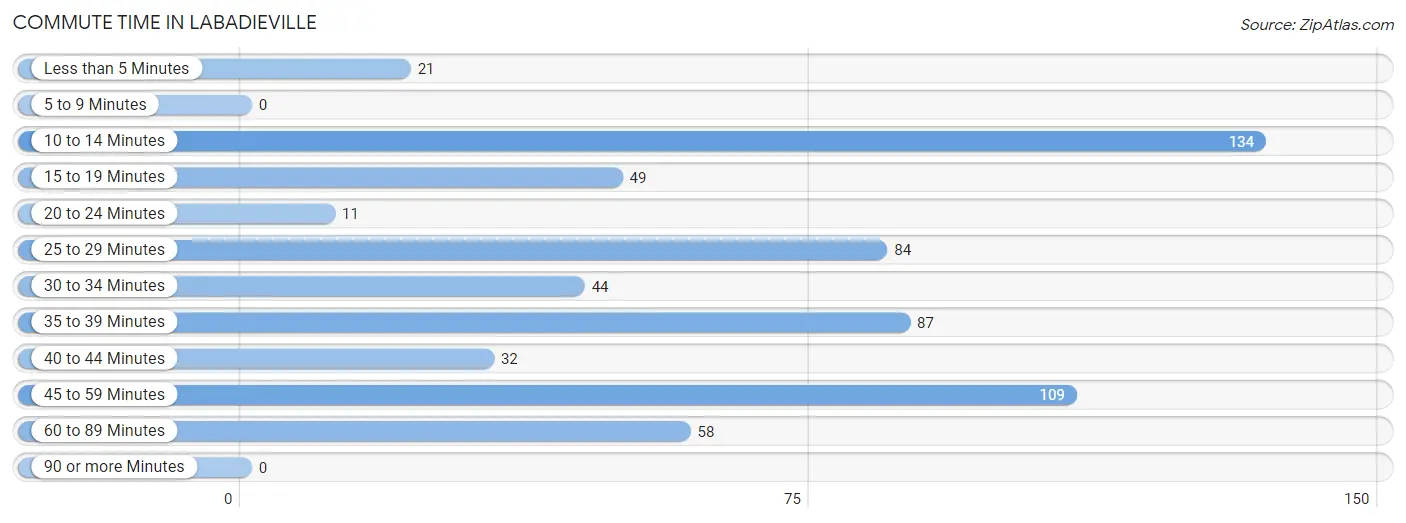
| Commute Time | # Commuters | % Commuters |
| Less than 5 Minutes | 21 | 3.3% |
| 5 to 9 Minutes | 0 | 0.0% |
| 10 to 14 Minutes | 134 | 21.3% |
| 15 to 19 Minutes | 49 | 7.8% |
| 20 to 24 Minutes | 11 | 1.8% |
| 25 to 29 Minutes | 84 | 13.4% |
| 30 to 34 Minutes | 44 | 7.0% |
| 35 to 39 Minutes | 87 | 13.8% |
| 40 to 44 Minutes | 32 | 5.1% |
| 45 to 59 Minutes | 109 | 17.3% |
| 60 to 89 Minutes | 58 | 9.2% |
| 90 or more Minutes | 0 | 0.0% |
Commute Time by Sex in Labadieville
The most common commute times in Labadieville are 45 to 59 minutes (90 commuters, 28.5%) for males and 10 to 14 minutes (76 commuters, 24.3%) for females.
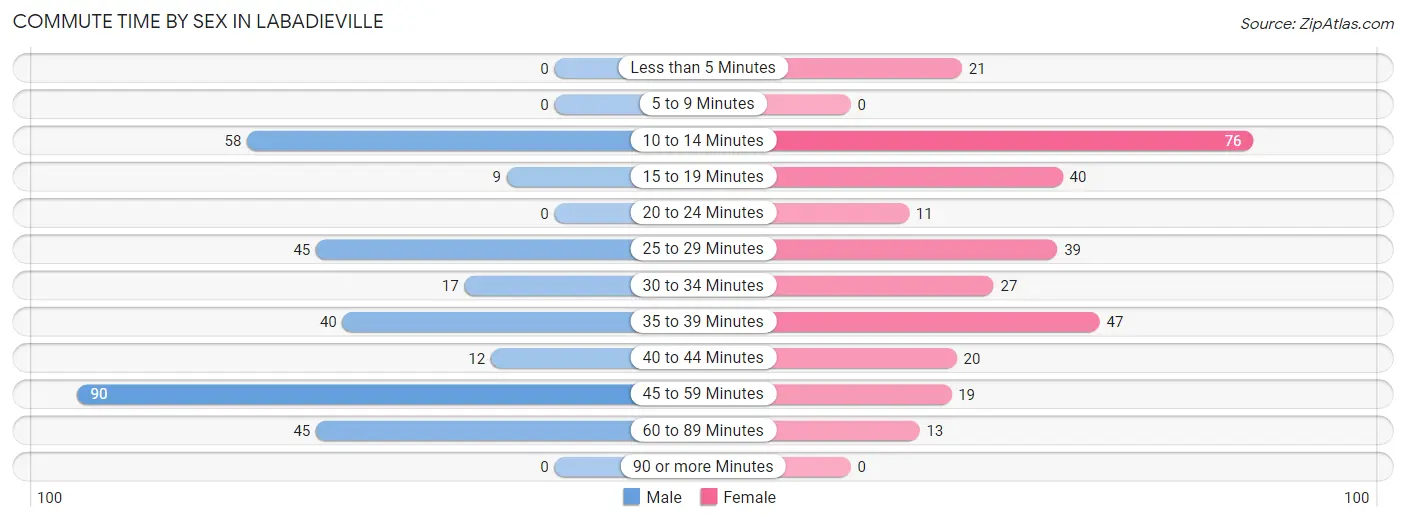
| Commute Time | Male | Female |
| Less than 5 Minutes | 0 (0.0%) | 21 (6.7%) |
| 5 to 9 Minutes | 0 (0.0%) | 0 (0.0%) |
| 10 to 14 Minutes | 58 (18.3%) | 76 (24.3%) |
| 15 to 19 Minutes | 9 (2.9%) | 40 (12.8%) |
| 20 to 24 Minutes | 0 (0.0%) | 11 (3.5%) |
| 25 to 29 Minutes | 45 (14.2%) | 39 (12.5%) |
| 30 to 34 Minutes | 17 (5.4%) | 27 (8.6%) |
| 35 to 39 Minutes | 40 (12.7%) | 47 (15.0%) |
| 40 to 44 Minutes | 12 (3.8%) | 20 (6.4%) |
| 45 to 59 Minutes | 90 (28.5%) | 19 (6.1%) |
| 60 to 89 Minutes | 45 (14.2%) | 13 (4.2%) |
| 90 or more Minutes | 0 (0.0%) | 0 (0.0%) |
Time of Departure to Work by Sex in Labadieville
The most frequent times of departure to work in Labadieville are 12:00 AM to 4:59 AM (133, 42.1%) for males and 7:00 AM to 7:29 AM (152, 48.6%) for females.
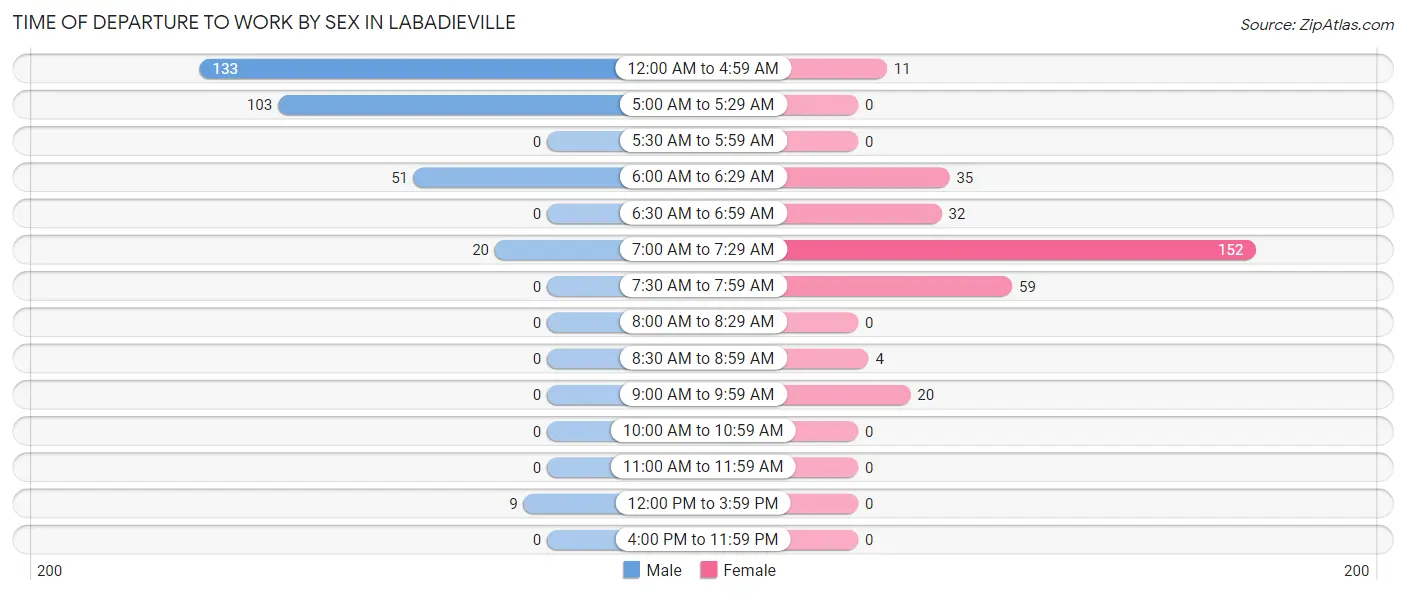
| Time of Departure | Male | Female |
| 12:00 AM to 4:59 AM | 133 (42.1%) | 11 (3.5%) |
| 5:00 AM to 5:29 AM | 103 (32.6%) | 0 (0.0%) |
| 5:30 AM to 5:59 AM | 0 (0.0%) | 0 (0.0%) |
| 6:00 AM to 6:29 AM | 51 (16.1%) | 35 (11.2%) |
| 6:30 AM to 6:59 AM | 0 (0.0%) | 32 (10.2%) |
| 7:00 AM to 7:29 AM | 20 (6.3%) | 152 (48.6%) |
| 7:30 AM to 7:59 AM | 0 (0.0%) | 59 (18.9%) |
| 8:00 AM to 8:29 AM | 0 (0.0%) | 0 (0.0%) |
| 8:30 AM to 8:59 AM | 0 (0.0%) | 4 (1.3%) |
| 9:00 AM to 9:59 AM | 0 (0.0%) | 20 (6.4%) |
| 10:00 AM to 10:59 AM | 0 (0.0%) | 0 (0.0%) |
| 11:00 AM to 11:59 AM | 0 (0.0%) | 0 (0.0%) |
| 12:00 PM to 3:59 PM | 9 (2.9%) | 0 (0.0%) |
| 4:00 PM to 11:59 PM | 0 (0.0%) | 0 (0.0%) |
| Total | 316 (100.0%) | 313 (100.0%) |
Housing Occupancy in Labadieville
Occupancy by Ownership in Labadieville
Of the total 683 dwellings in Labadieville, owner-occupied units account for 590 (86.4%), while renter-occupied units make up 93 (13.6%).
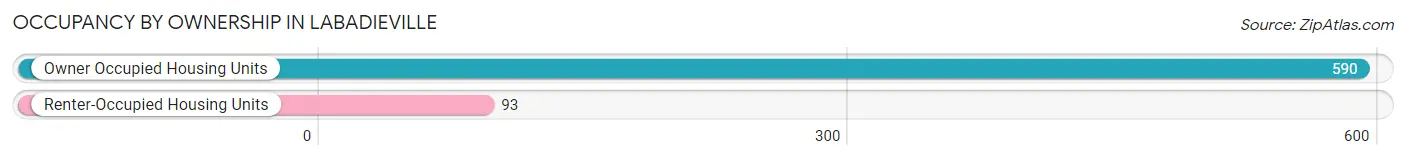
| Occupancy | # Housing Units | % Housing Units |
| Owner Occupied Housing Units | 590 | 86.4% |
| Renter-Occupied Housing Units | 93 | 13.6% |
| Total Occupied Housing Units | 683 | 100.0% |
Occupancy by Household Size in Labadieville
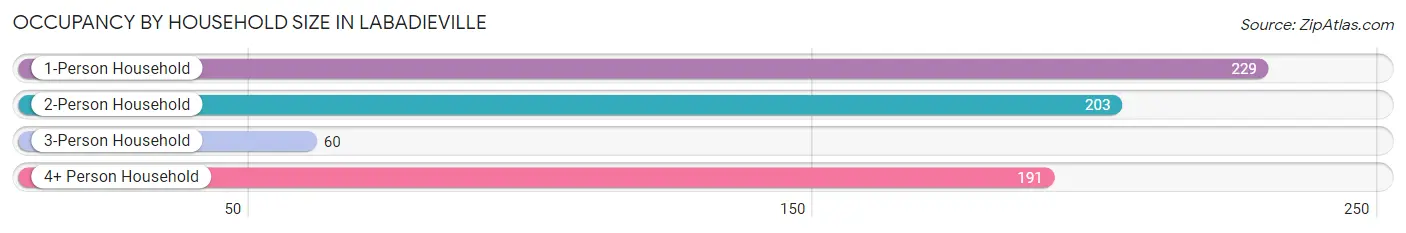
| Household Size | # Housing Units | % Housing Units |
| 1-Person Household | 229 | 33.5% |
| 2-Person Household | 203 | 29.7% |
| 3-Person Household | 60 | 8.8% |
| 4+ Person Household | 191 | 28.0% |
| Total Housing Units | 683 | 100.0% |
Occupancy by Ownership by Household Size in Labadieville
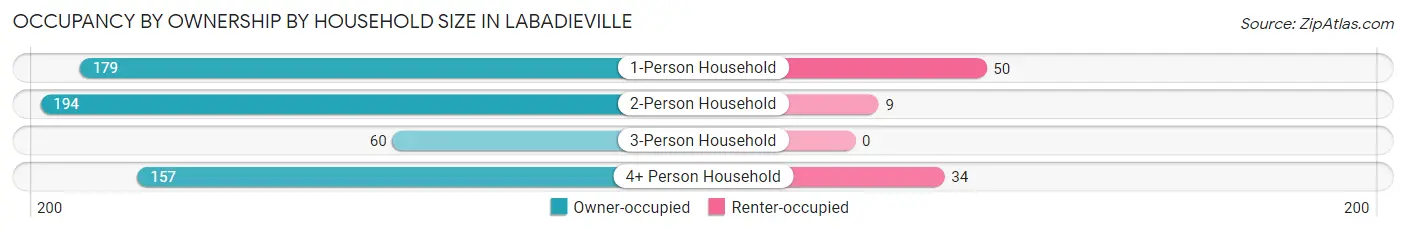
| Household Size | Owner-occupied | Renter-occupied |
| 1-Person Household | 179 (78.2%) | 50 (21.8%) |
| 2-Person Household | 194 (95.6%) | 9 (4.4%) |
| 3-Person Household | 60 (100.0%) | 0 (0.0%) |
| 4+ Person Household | 157 (82.2%) | 34 (17.8%) |
| Total Housing Units | 590 (86.4%) | 93 (13.6%) |
Occupancy by Educational Attainment in Labadieville
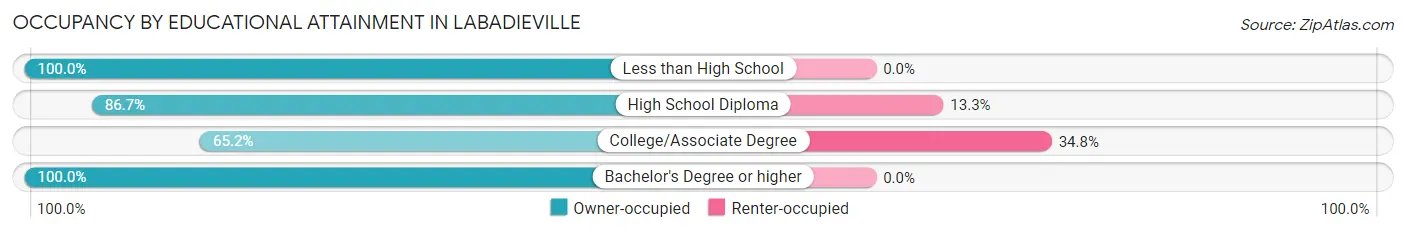
| Household Size | Owner-occupied | Renter-occupied |
| Less than High School | 163 (100.0%) | 0 (0.0%) |
| High School Diploma | 299 (86.7%) | 46 (13.3%) |
| College/Associate Degree | 88 (65.2%) | 47 (34.8%) |
| Bachelor's Degree or higher | 40 (100.0%) | 0 (0.0%) |
Occupancy by Age of Householder in Labadieville
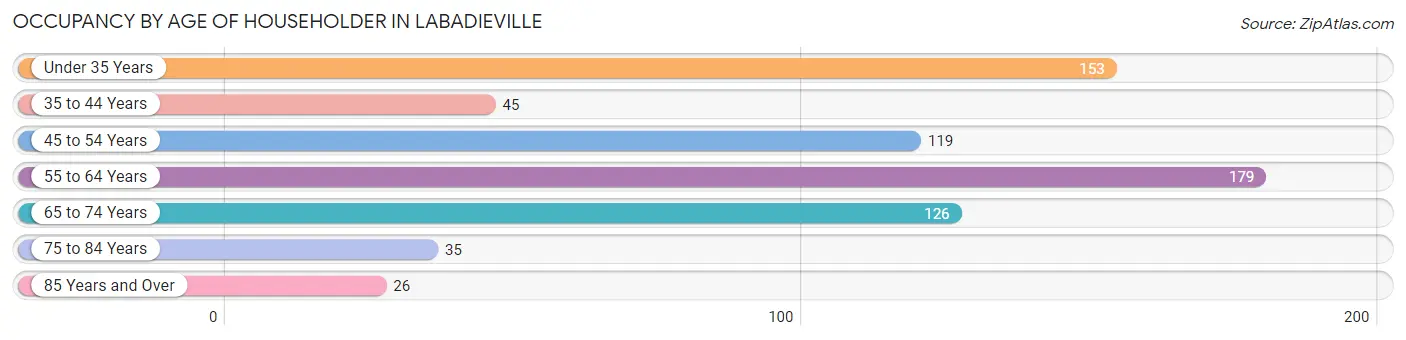
| Age Bracket | # Households | % Households |
| Under 35 Years | 153 | 22.4% |
| 35 to 44 Years | 45 | 6.6% |
| 45 to 54 Years | 119 | 17.4% |
| 55 to 64 Years | 179 | 26.2% |
| 65 to 74 Years | 126 | 18.4% |
| 75 to 84 Years | 35 | 5.1% |
| 85 Years and Over | 26 | 3.8% |
| Total | 683 | 100.0% |
Housing Finances in Labadieville
Median Income by Occupancy in Labadieville
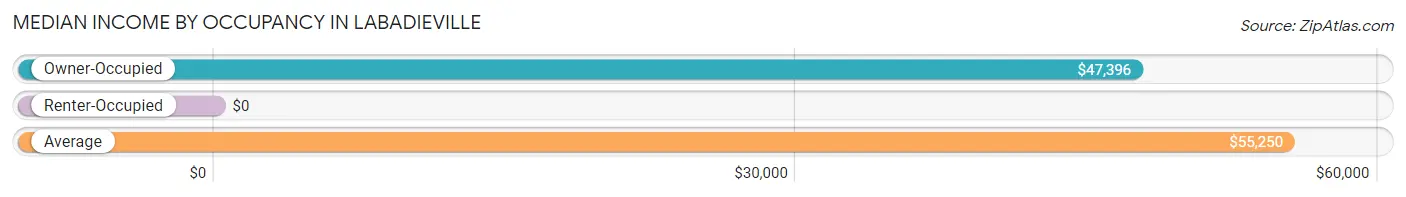
| Occupancy Type | # Households | Median Income |
| Owner-Occupied | 590 (86.4%) | $47,396 |
| Renter-Occupied | 93 (13.6%) | $0 |
| Average | 683 (100.0%) | $55,250 |
Occupancy by Householder Income Bracket in Labadieville
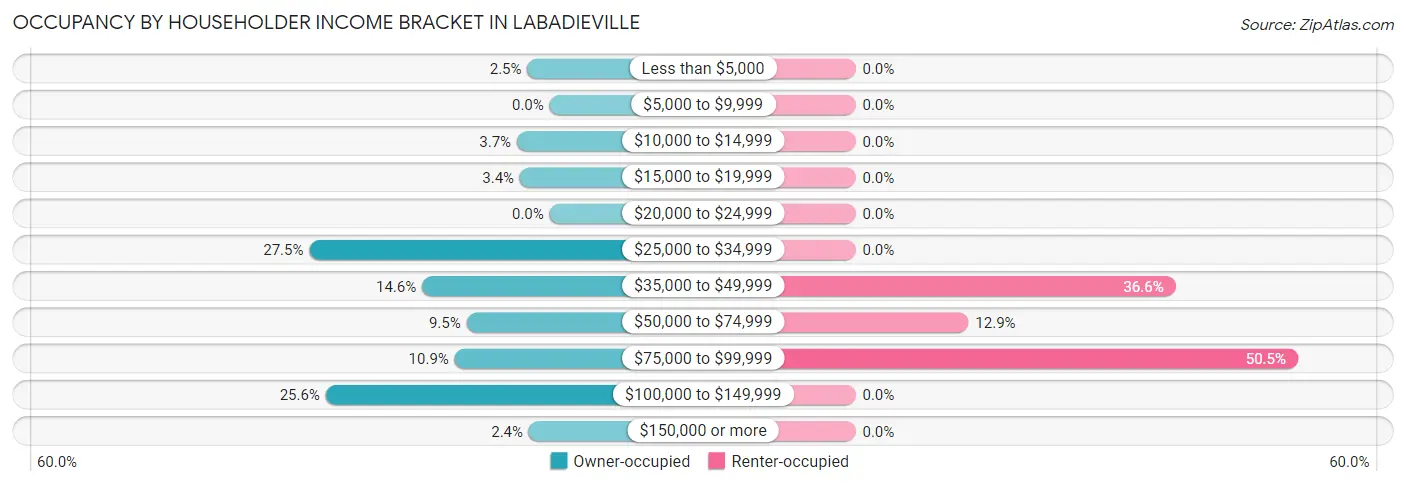
| Income Bracket | Owner-occupied | Renter-occupied |
| Less than $5,000 | 15 (2.5%) | 0 (0.0%) |
| $5,000 to $9,999 | 0 (0.0%) | 0 (0.0%) |
| $10,000 to $14,999 | 22 (3.7%) | 0 (0.0%) |
| $15,000 to $19,999 | 20 (3.4%) | 0 (0.0%) |
| $20,000 to $24,999 | 0 (0.0%) | 0 (0.0%) |
| $25,000 to $34,999 | 162 (27.5%) | 0 (0.0%) |
| $35,000 to $49,999 | 86 (14.6%) | 34 (36.6%) |
| $50,000 to $74,999 | 56 (9.5%) | 12 (12.9%) |
| $75,000 to $99,999 | 64 (10.8%) | 47 (50.5%) |
| $100,000 to $149,999 | 151 (25.6%) | 0 (0.0%) |
| $150,000 or more | 14 (2.4%) | 0 (0.0%) |
| Total | 590 (100.0%) | 93 (100.0%) |
Monthly Housing Cost Tiers in Labadieville
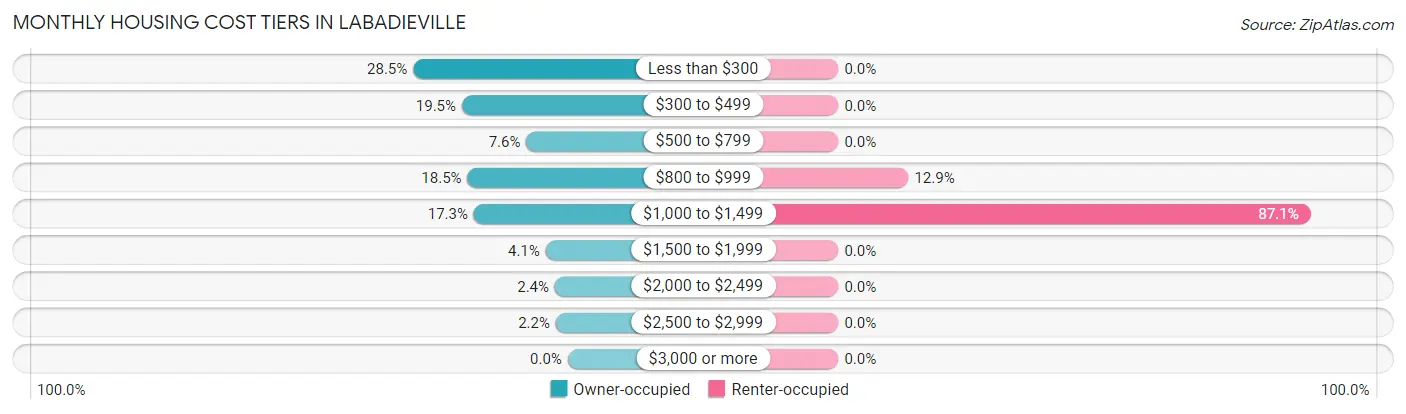
| Monthly Cost | Owner-occupied | Renter-occupied |
| Less than $300 | 168 (28.5%) | 0 (0.0%) |
| $300 to $499 | 115 (19.5%) | 0 (0.0%) |
| $500 to $799 | 45 (7.6%) | 0 (0.0%) |
| $800 to $999 | 109 (18.5%) | 12 (12.9%) |
| $1,000 to $1,499 | 102 (17.3%) | 81 (87.1%) |
| $1,500 to $1,999 | 24 (4.1%) | 0 (0.0%) |
| $2,000 to $2,499 | 14 (2.4%) | 0 (0.0%) |
| $2,500 to $2,999 | 13 (2.2%) | 0 (0.0%) |
| $3,000 or more | 0 (0.0%) | 0 (0.0%) |
| Total | 590 (100.0%) | 93 (100.0%) |
Physical Housing Characteristics in Labadieville
Housing Structures in Labadieville
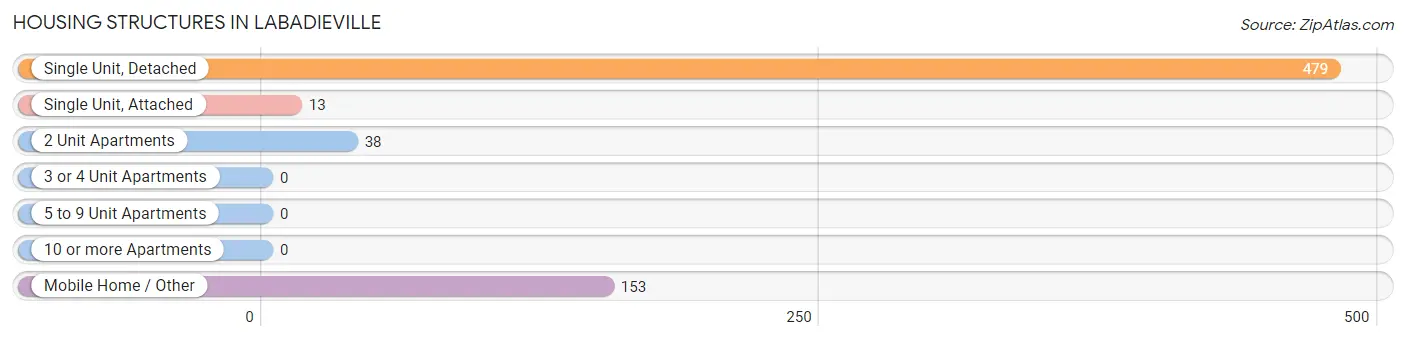
| Structure Type | # Housing Units | % Housing Units |
| Single Unit, Detached | 479 | 70.1% |
| Single Unit, Attached | 13 | 1.9% |
| 2 Unit Apartments | 38 | 5.6% |
| 3 or 4 Unit Apartments | 0 | 0.0% |
| 5 to 9 Unit Apartments | 0 | 0.0% |
| 10 or more Apartments | 0 | 0.0% |
| Mobile Home / Other | 153 | 22.4% |
| Total | 683 | 100.0% |
Housing Structures by Occupancy in Labadieville
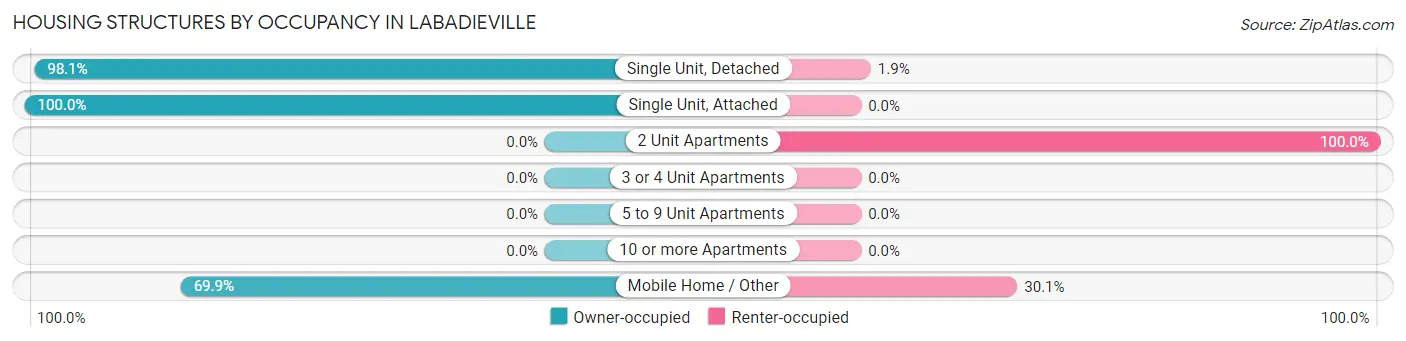
| Structure Type | Owner-occupied | Renter-occupied |
| Single Unit, Detached | 470 (98.1%) | 9 (1.9%) |
| Single Unit, Attached | 13 (100.0%) | 0 (0.0%) |
| 2 Unit Apartments | 0 (0.0%) | 38 (100.0%) |
| 3 or 4 Unit Apartments | 0 (0.0%) | 0 (0.0%) |
| 5 to 9 Unit Apartments | 0 (0.0%) | 0 (0.0%) |
| 10 or more Apartments | 0 (0.0%) | 0 (0.0%) |
| Mobile Home / Other | 107 (69.9%) | 46 (30.1%) |
| Total | 590 (86.4%) | 93 (13.6%) |
Housing Structures by Number of Rooms in Labadieville
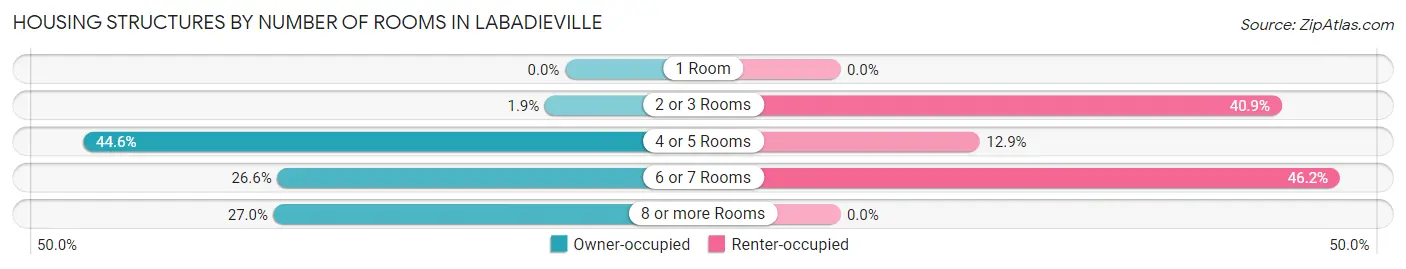
| Number of Rooms | Owner-occupied | Renter-occupied |
| 1 Room | 0 (0.0%) | 0 (0.0%) |
| 2 or 3 Rooms | 11 (1.9%) | 38 (40.9%) |
| 4 or 5 Rooms | 263 (44.6%) | 12 (12.9%) |
| 6 or 7 Rooms | 157 (26.6%) | 43 (46.2%) |
| 8 or more Rooms | 159 (27.0%) | 0 (0.0%) |
| Total | 590 (100.0%) | 93 (100.0%) |
Housing Structure by Heating Type in Labadieville
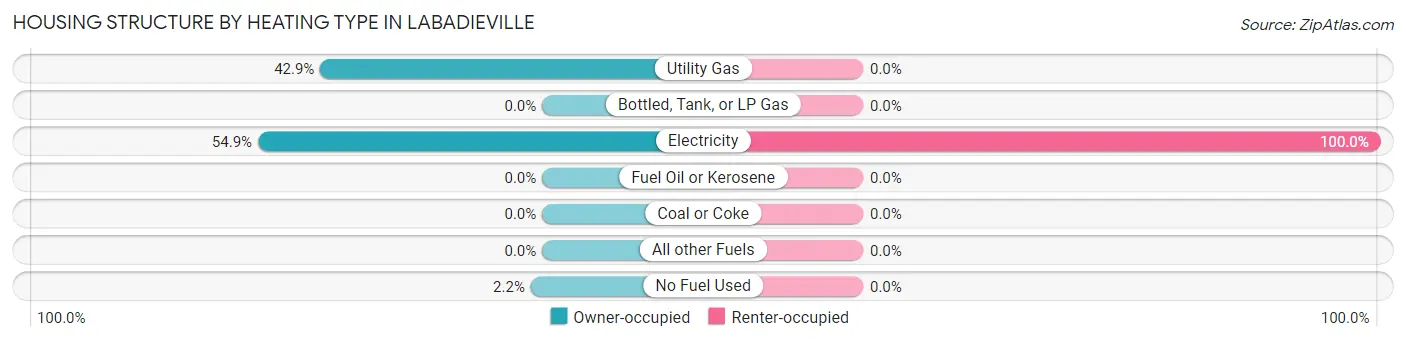
| Heating Type | Owner-occupied | Renter-occupied |
| Utility Gas | 253 (42.9%) | 0 (0.0%) |
| Bottled, Tank, or LP Gas | 0 (0.0%) | 0 (0.0%) |
| Electricity | 324 (54.9%) | 93 (100.0%) |
| Fuel Oil or Kerosene | 0 (0.0%) | 0 (0.0%) |
| Coal or Coke | 0 (0.0%) | 0 (0.0%) |
| All other Fuels | 0 (0.0%) | 0 (0.0%) |
| No Fuel Used | 13 (2.2%) | 0 (0.0%) |
| Total | 590 (100.0%) | 93 (100.0%) |
Household Vehicle Usage in Labadieville
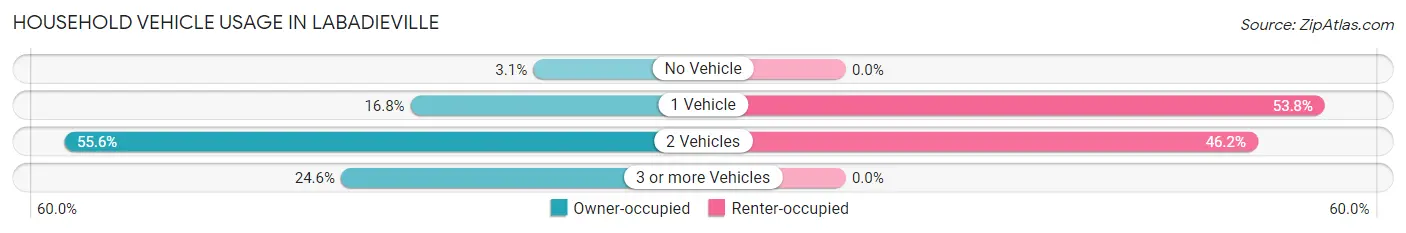
| Vehicles per Household | Owner-occupied | Renter-occupied |
| No Vehicle | 18 (3.0%) | 0 (0.0%) |
| 1 Vehicle | 99 (16.8%) | 50 (53.8%) |
| 2 Vehicles | 328 (55.6%) | 43 (46.2%) |
| 3 or more Vehicles | 145 (24.6%) | 0 (0.0%) |
| Total | 590 (100.0%) | 93 (100.0%) |
Real Estate & Mortgages in Labadieville
Real Estate and Mortgage Overview in Labadieville
| Characteristic | Without Mortgage | With Mortgage |
| Housing Units | 282 | 308 |
| Median Property Value | $100,000 | $235,300 |
| Median Household Income | $34,401 | $14 |
| Monthly Housing Costs | $286 | $0 |
| Real Estate Taxes | $199 | $14 |
Property Value by Mortgage Status in Labadieville
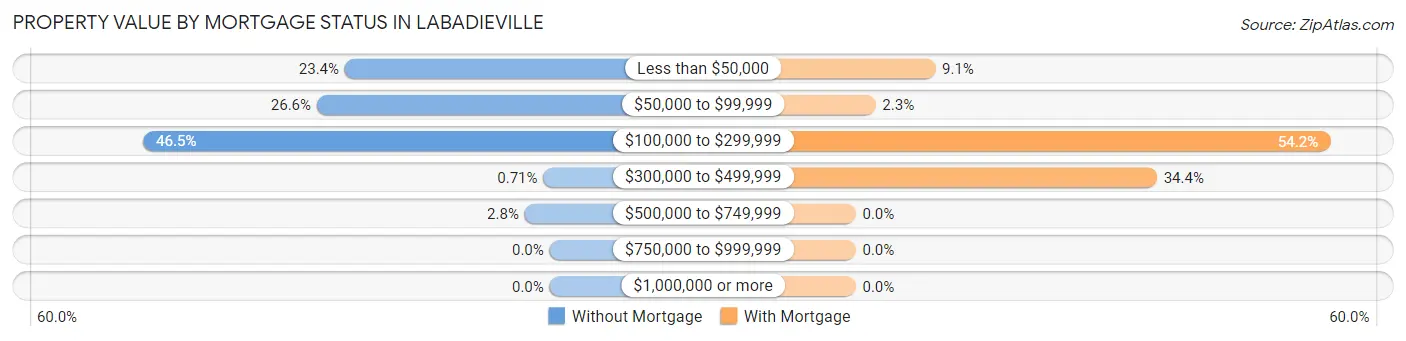
| Property Value | Without Mortgage | With Mortgage |
| Less than $50,000 | 66 (23.4%) | 28 (9.1%) |
| $50,000 to $99,999 | 75 (26.6%) | 7 (2.3%) |
| $100,000 to $299,999 | 131 (46.5%) | 167 (54.2%) |
| $300,000 to $499,999 | 2 (0.7%) | 106 (34.4%) |
| $500,000 to $749,999 | 8 (2.8%) | 0 (0.0%) |
| $750,000 to $999,999 | 0 (0.0%) | 0 (0.0%) |
| $1,000,000 or more | 0 (0.0%) | 0 (0.0%) |
| Total | 282 (100.0%) | 308 (100.0%) |
Household Income by Mortgage Status in Labadieville
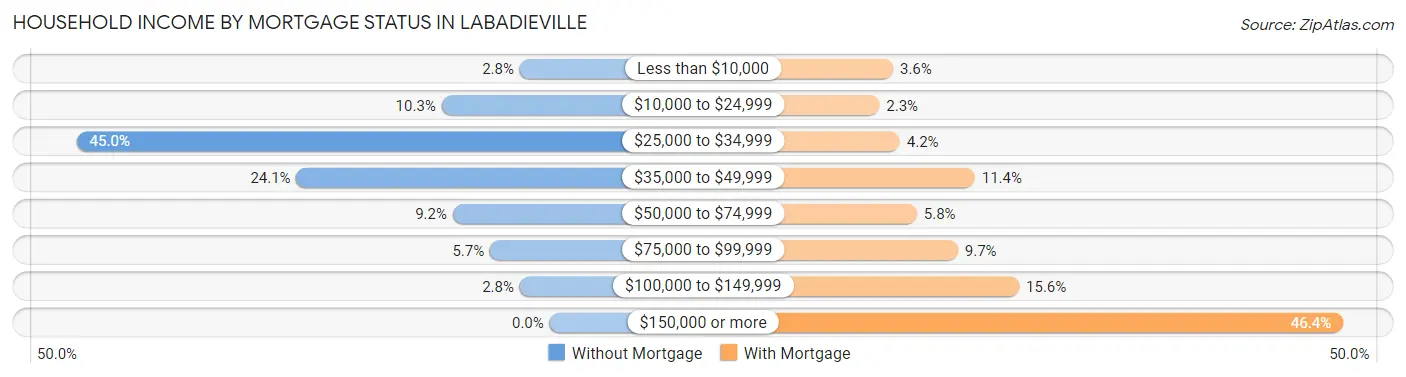
| Household Income | Without Mortgage | With Mortgage |
| Less than $10,000 | 8 (2.8%) | 11 (3.6%) |
| $10,000 to $24,999 | 29 (10.3%) | 7 (2.3%) |
| $25,000 to $34,999 | 127 (45.0%) | 13 (4.2%) |
| $35,000 to $49,999 | 68 (24.1%) | 35 (11.4%) |
| $50,000 to $74,999 | 26 (9.2%) | 18 (5.8%) |
| $75,000 to $99,999 | 16 (5.7%) | 30 (9.7%) |
| $100,000 to $149,999 | 8 (2.8%) | 48 (15.6%) |
| $150,000 or more | 0 (0.0%) | 143 (46.4%) |
| Total | 282 (100.0%) | 308 (100.0%) |
Property Value to Household Income Ratio in Labadieville
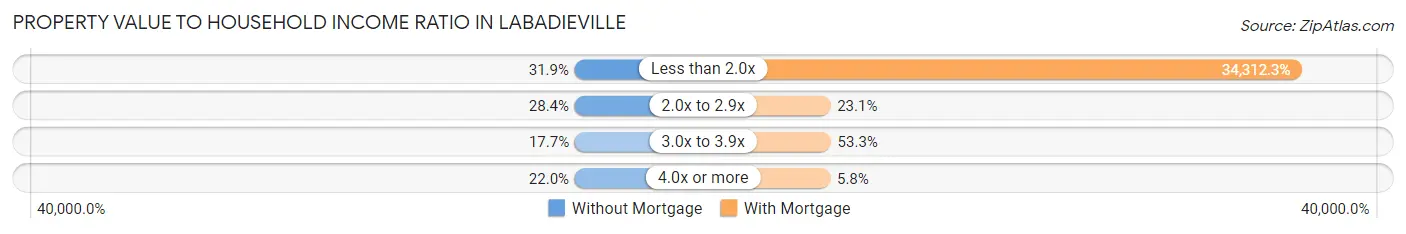
| Value-to-Income Ratio | Without Mortgage | With Mortgage |
| Less than 2.0x | 90 (31.9%) | 105,682 (34,312.3%) |
| 2.0x to 2.9x | 80 (28.4%) | 71 (23.1%) |
| 3.0x to 3.9x | 50 (17.7%) | 164 (53.2%) |
| 4.0x or more | 62 (22.0%) | 18 (5.8%) |
| Total | 282 (100.0%) | 308 (100.0%) |
Real Estate Taxes by Mortgage Status in Labadieville
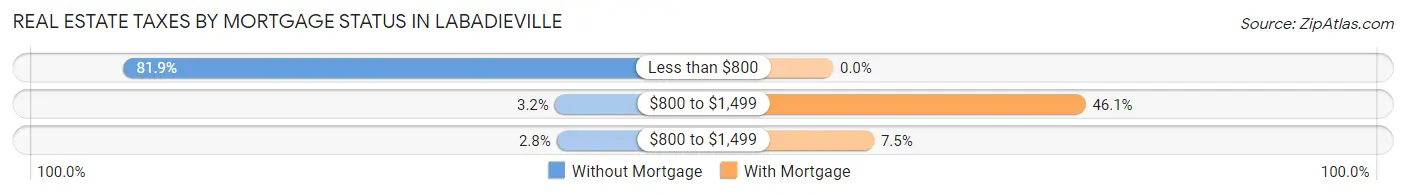
| Property Taxes | Without Mortgage | With Mortgage |
| Less than $800 | 231 (81.9%) | 0 (0.0%) |
| $800 to $1,499 | 9 (3.2%) | 142 (46.1%) |
| $800 to $1,499 | 8 (2.8%) | 23 (7.5%) |
| Total | 282 (100.0%) | 308 (100.0%) |
Health & Disability in Labadieville
Health Insurance Coverage by Age in Labadieville
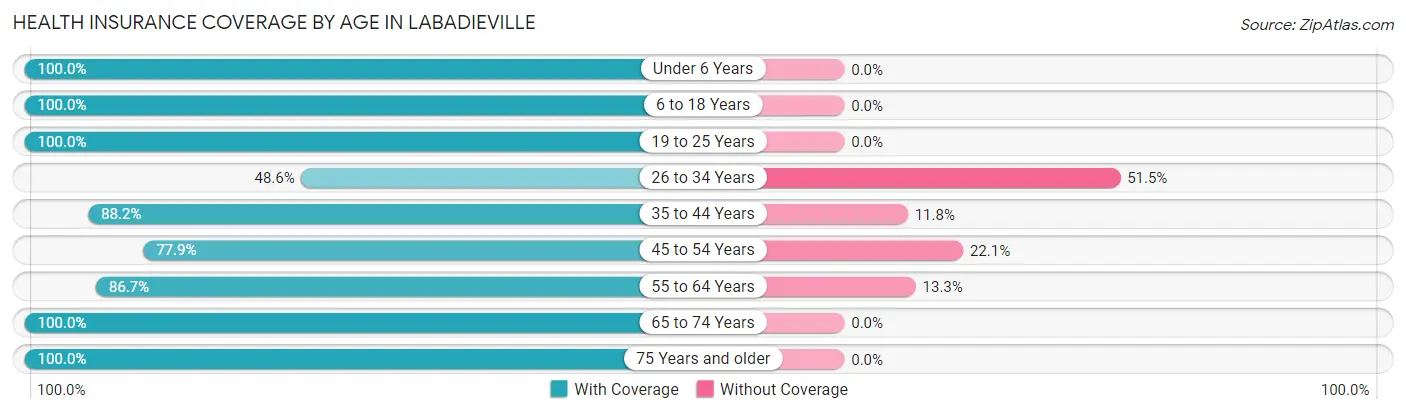
| Age Bracket | With Coverage | Without Coverage |
| Under 6 Years | 40 (100.0%) | 0 (0.0%) |
| 6 to 18 Years | 269 (100.0%) | 0 (0.0%) |
| 19 to 25 Years | 167 (100.0%) | 0 (0.0%) |
| 26 to 34 Years | 84 (48.5%) | 89 (51.4%) |
| 35 to 44 Years | 82 (88.2%) | 11 (11.8%) |
| 45 to 54 Years | 190 (77.9%) | 54 (22.1%) |
| 55 to 64 Years | 202 (86.7%) | 31 (13.3%) |
| 65 to 74 Years | 210 (100.0%) | 0 (0.0%) |
| 75 Years and older | 102 (100.0%) | 0 (0.0%) |
| Total | 1,346 (87.9%) | 185 (12.1%) |
Health Insurance Coverage by Citizenship Status in Labadieville

| Citizenship Status | With Coverage | Without Coverage |
| Native Born | 40 (100.0%) | 0 (0.0%) |
| Foreign Born, Citizen | 269 (100.0%) | 0 (0.0%) |
| Foreign Born, not a Citizen | 167 (100.0%) | 0 (0.0%) |
Health Insurance Coverage by Household Income in Labadieville
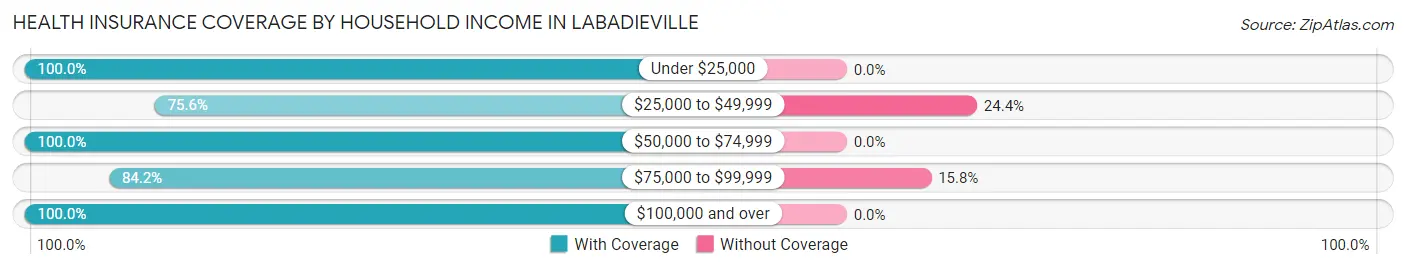
| Household Income | With Coverage | Without Coverage |
| Under $25,000 | 72 (100.0%) | 0 (0.0%) |
| $25,000 to $49,999 | 459 (75.6%) | 148 (24.4%) |
| $50,000 to $74,999 | 156 (100.0%) | 0 (0.0%) |
| $75,000 to $99,999 | 197 (84.2%) | 37 (15.8%) |
| $100,000 and over | 462 (100.0%) | 0 (0.0%) |
Public vs Private Health Insurance Coverage by Age in Labadieville
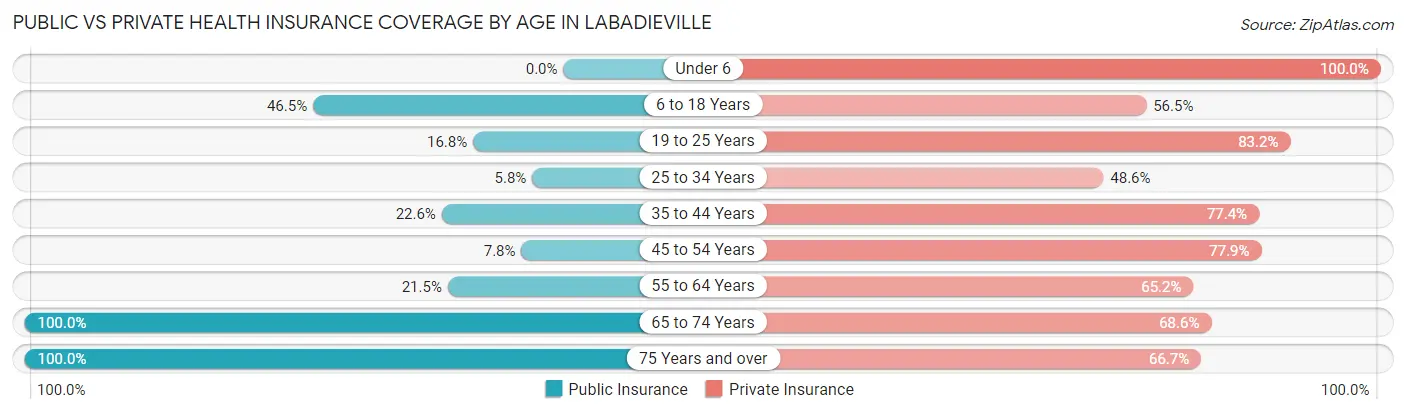
| Age Bracket | Public Insurance | Private Insurance |
| Under 6 | 0 (0.0%) | 40 (100.0%) |
| 6 to 18 Years | 125 (46.5%) | 152 (56.5%) |
| 19 to 25 Years | 28 (16.8%) | 139 (83.2%) |
| 25 to 34 Years | 10 (5.8%) | 84 (48.5%) |
| 35 to 44 Years | 21 (22.6%) | 72 (77.4%) |
| 45 to 54 Years | 19 (7.8%) | 190 (77.9%) |
| 55 to 64 Years | 50 (21.5%) | 152 (65.2%) |
| 65 to 74 Years | 210 (100.0%) | 144 (68.6%) |
| 75 Years and over | 102 (100.0%) | 68 (66.7%) |
| Total | 565 (36.9%) | 1,041 (68.0%) |
Disability Status by Sex by Age in Labadieville
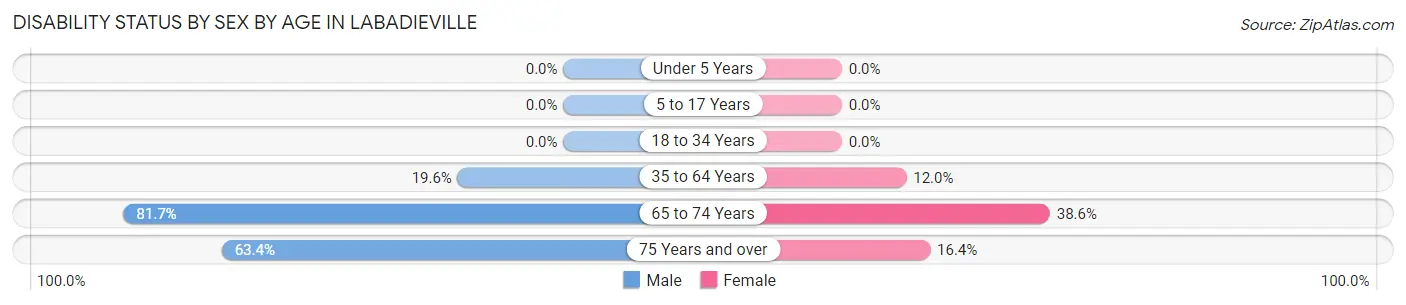
| Age Bracket | Male | Female |
| Under 5 Years | 0 (0.0%) | 0 (0.0%) |
| 5 to 17 Years | 0 (0.0%) | 0 (0.0%) |
| 18 to 34 Years | 0 (0.0%) | 0 (0.0%) |
| 35 to 64 Years | 61 (19.6%) | 31 (12.0%) |
| 65 to 74 Years | 89 (81.7%) | 39 (38.6%) |
| 75 Years and over | 26 (63.4%) | 10 (16.4%) |
Disability Class by Sex by Age in Labadieville
Disability Class: Hearing Difficulty
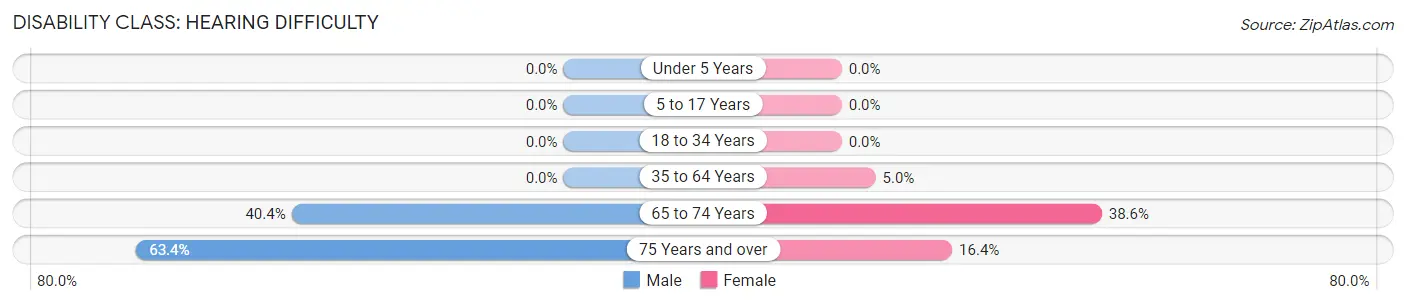
| Age Bracket | Male | Female |
| Under 5 Years | 0 (0.0%) | 0 (0.0%) |
| 5 to 17 Years | 0 (0.0%) | 0 (0.0%) |
| 18 to 34 Years | 0 (0.0%) | 0 (0.0%) |
| 35 to 64 Years | 0 (0.0%) | 13 (5.0%) |
| 65 to 74 Years | 44 (40.4%) | 39 (38.6%) |
| 75 Years and over | 26 (63.4%) | 10 (16.4%) |
Disability Class: Vision Difficulty
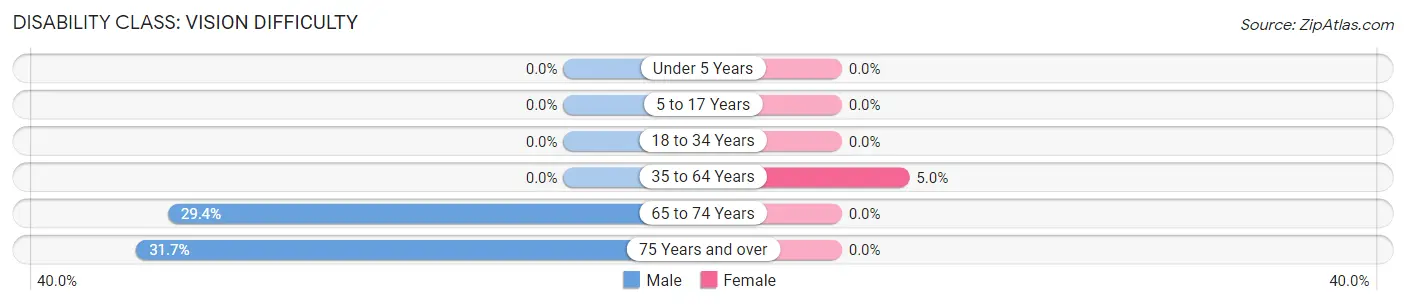
| Age Bracket | Male | Female |
| Under 5 Years | 0 (0.0%) | 0 (0.0%) |
| 5 to 17 Years | 0 (0.0%) | 0 (0.0%) |
| 18 to 34 Years | 0 (0.0%) | 0 (0.0%) |
| 35 to 64 Years | 0 (0.0%) | 13 (5.0%) |
| 65 to 74 Years | 32 (29.4%) | 0 (0.0%) |
| 75 Years and over | 13 (31.7%) | 0 (0.0%) |
Disability Class: Cognitive Difficulty
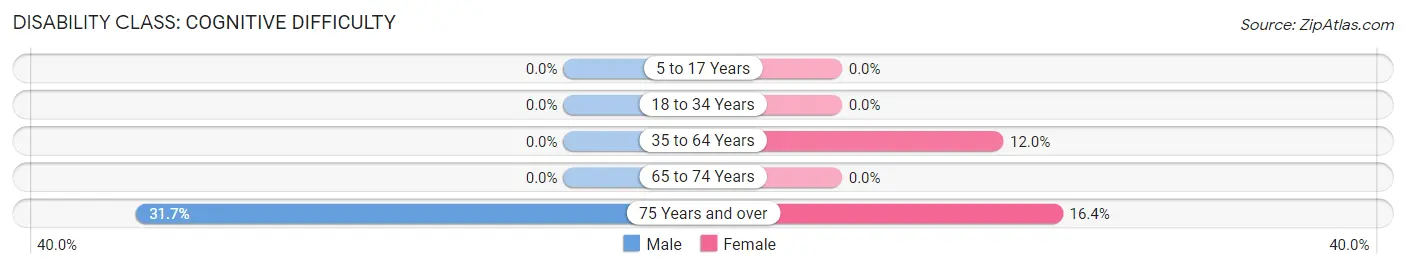
| Age Bracket | Male | Female |
| 5 to 17 Years | 0 (0.0%) | 0 (0.0%) |
| 18 to 34 Years | 0 (0.0%) | 0 (0.0%) |
| 35 to 64 Years | 0 (0.0%) | 31 (12.0%) |
| 65 to 74 Years | 0 (0.0%) | 0 (0.0%) |
| 75 Years and over | 13 (31.7%) | 10 (16.4%) |
Disability Class: Ambulatory Difficulty
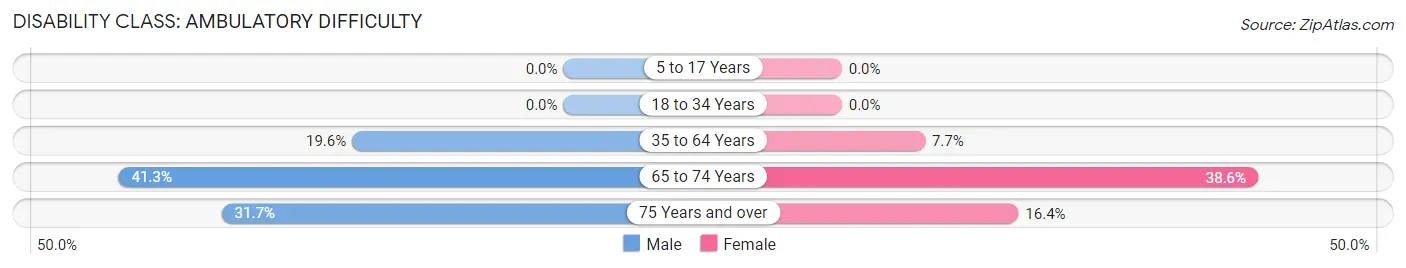
| Age Bracket | Male | Female |
| 5 to 17 Years | 0 (0.0%) | 0 (0.0%) |
| 18 to 34 Years | 0 (0.0%) | 0 (0.0%) |
| 35 to 64 Years | 61 (19.6%) | 20 (7.7%) |
| 65 to 74 Years | 45 (41.3%) | 39 (38.6%) |
| 75 Years and over | 13 (31.7%) | 10 (16.4%) |
Disability Class: Self-Care Difficulty
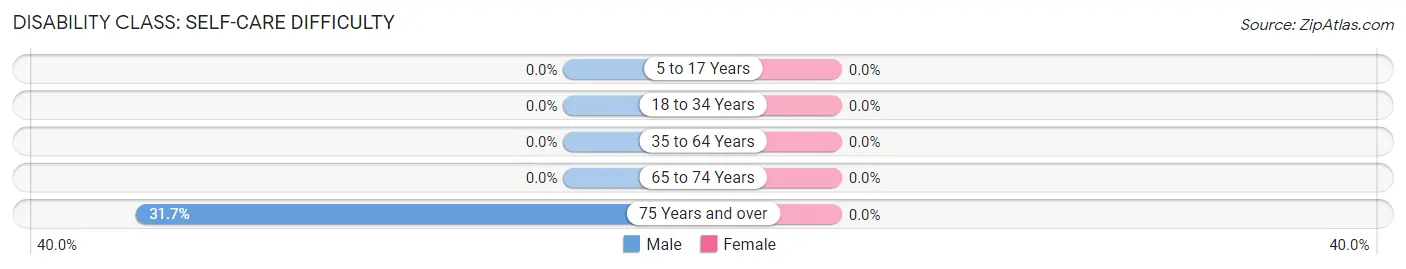
| Age Bracket | Male | Female |
| 5 to 17 Years | 0 (0.0%) | 0 (0.0%) |
| 18 to 34 Years | 0 (0.0%) | 0 (0.0%) |
| 35 to 64 Years | 0 (0.0%) | 0 (0.0%) |
| 65 to 74 Years | 0 (0.0%) | 0 (0.0%) |
| 75 Years and over | 13 (31.7%) | 0 (0.0%) |
Technology Access in Labadieville
Computing Device Access in Labadieville
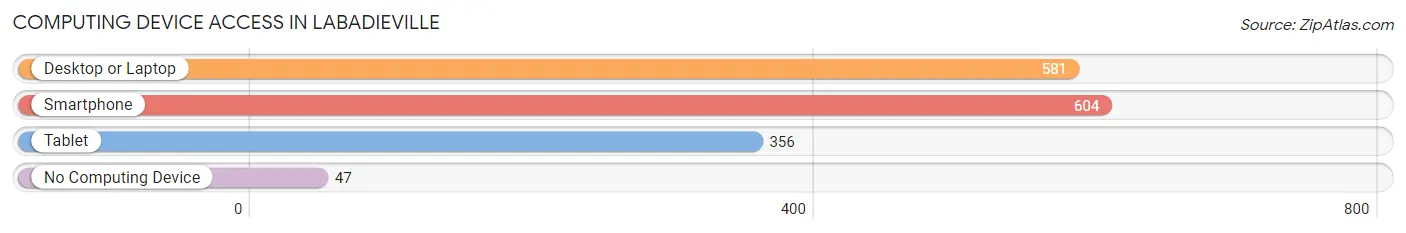
| Device Type | # Households | % Households |
| Desktop or Laptop | 581 | 85.1% |
| Smartphone | 604 | 88.4% |
| Tablet | 356 | 52.1% |
| No Computing Device | 47 | 6.9% |
| Total | 683 | 100.0% |
Internet Access in Labadieville
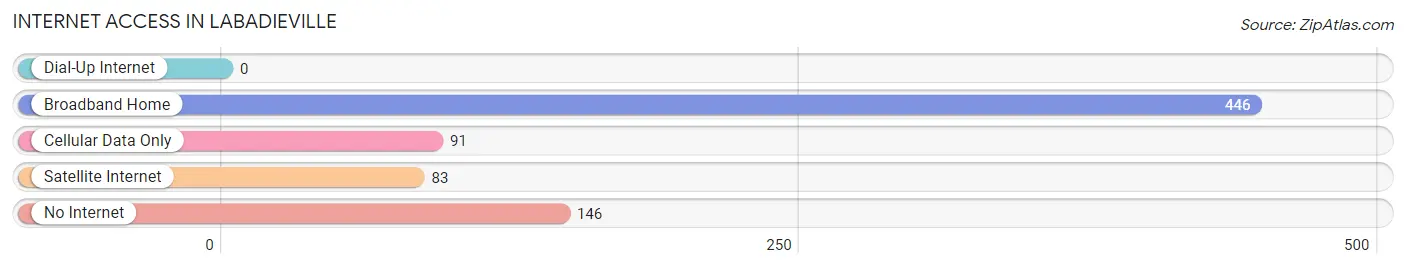
| Internet Type | # Households | % Households |
| Dial-Up Internet | 0 | 0.0% |
| Broadband Home | 446 | 65.3% |
| Cellular Data Only | 91 | 13.3% |
| Satellite Internet | 83 | 12.1% |
| No Internet | 146 | 21.4% |
| Total | 683 | 100.0% |
Labadieville Summary
Labadieville is a small unincorporated community located in Assumption Parish, Louisiana. It is situated along the banks of Bayou Lafourche, approximately 25 miles south of Thibodaux and 40 miles southwest of New Orleans. The town was founded in 1845 by Father Jean-Marie Odin, a French Catholic priest, and is named after Father Antoine Labadie, a French Jesuit missionary who served in the area in the late 1700s.
History
Labadieville was founded in 1845 by Father Jean-Marie Odin, a French Catholic priest. Father Odin was sent to the area by the Bishop of New Orleans to establish a mission for the local Native American population. He named the town after Father Antoine Labadie, a French Jesuit missionary who served in the area in the late 1700s.
In the late 1800s, Labadieville became a popular destination for French-speaking immigrants from Canada, France, and Belgium. These immigrants were attracted to the area by the abundance of fertile land and the opportunity to practice their Catholic faith. The town quickly grew and by the early 1900s, it had become a thriving agricultural center.
In the early 20th century, Labadieville was home to a number of businesses, including a general store, a blacksmith shop, a sawmill, and a cotton gin. The town also had a post office, a bank, and a hotel.
Geography
Labadieville is located in Assumption Parish, Louisiana, approximately 25 miles south of Thibodaux and 40 miles southwest of New Orleans. The town is situated along the banks of Bayou Lafourche, a tributary of the Mississippi River.
The town is surrounded by a number of small towns and villages, including Paincourtville, Pierre Part, Belle Rose, and Plattenville. The nearest major city is Houma, which is located approximately 25 miles to the east.
The terrain around Labadieville is mostly flat, with some rolling hills. The area is known for its lush vegetation, including cypress trees, live oaks, and magnolias.
Economy
Labadieville’s economy is largely based on agriculture. The town is home to a number of farms, which produce a variety of crops, including corn, soybeans, sugarcane, and cotton. The town also has a number of small businesses, including restaurants, convenience stores, and gas stations.
The town is also home to a number of manufacturing companies, including a furniture factory and a plastics plant. The town is also home to a number of oil and gas companies, which are involved in the exploration and production of oil and natural gas in the area.
Demographics
As of the 2010 census, the population of Labadieville was 1,845. The town is predominantly white, with a small African American population. The median household income is $37,000, and the median home value is $90,000.
The town is served by the Assumption Parish School District, which includes two elementary schools, a middle school, and a high school. The town is also home to a number of churches, including Catholic, Baptist, and Methodist.
Conclusion
Labadieville is a small unincorporated community located in Assumption Parish, Louisiana. It was founded in 1845 by Father Jean-Marie Odin, a French Catholic priest, and is named after Father Antoine Labadie, a French Jesuit missionary who served in the area in the late 1700s. The town’s economy is largely based on agriculture, and it is home to a number of small businesses. The population of Labadieville is predominantly white, with a small African American population. The town is served by the Assumption Parish School District, and is home to a number of churches.
Common Questions
What is Per Capita Income in Labadieville?
Per Capita income in Labadieville is $31,523.
What is the Median Family Income in Labadieville?
Median Family Income in Labadieville is $72,143.
What is the Median Household income in Labadieville?
Median Household Income in Labadieville is $55,250.
What is Income or Wage Gap in Labadieville?
Income or Wage Gap in Labadieville is 14.2%.
Women in Labadieville earn 85.8 cents for every dollar earned by a man.
What is Inequality or Gini Index in Labadieville?
Inequality or Gini Index in Labadieville is 0.38.
What is the Total Population of Labadieville?
Total Population of Labadieville is 1,546.
What is the Total Male Population of Labadieville?
Total Male Population of Labadieville is 748.
What is the Total Female Population of Labadieville?
Total Female Population of Labadieville is 798.
What is the Ratio of Males per 100 Females in Labadieville?
There are 93.73 Males per 100 Females in Labadieville.
What is the Ratio of Females per 100 Males in Labadieville?
There are 106.68 Females per 100 Males in Labadieville.
What is the Median Population Age in Labadieville?
Median Population Age in Labadieville is 46.3 Years.
What is the Average Family Size in Labadieville
Average Family Size in Labadieville is 3.0 People.
What is the Average Household Size in Labadieville
Average Household Size in Labadieville is 2.3 People.
How Large is the Labor Force in Labadieville?
There are 731 People in the Labor Forcein in Labadieville.
What is the Percentage of People in the Labor Force in Labadieville?
56.1% of People are in the Labor Force in Labadieville.
What is the Unemployment Rate in Labadieville?
Unemployment Rate in Labadieville is 12.7%.