Monticello, LA Map & Demographics
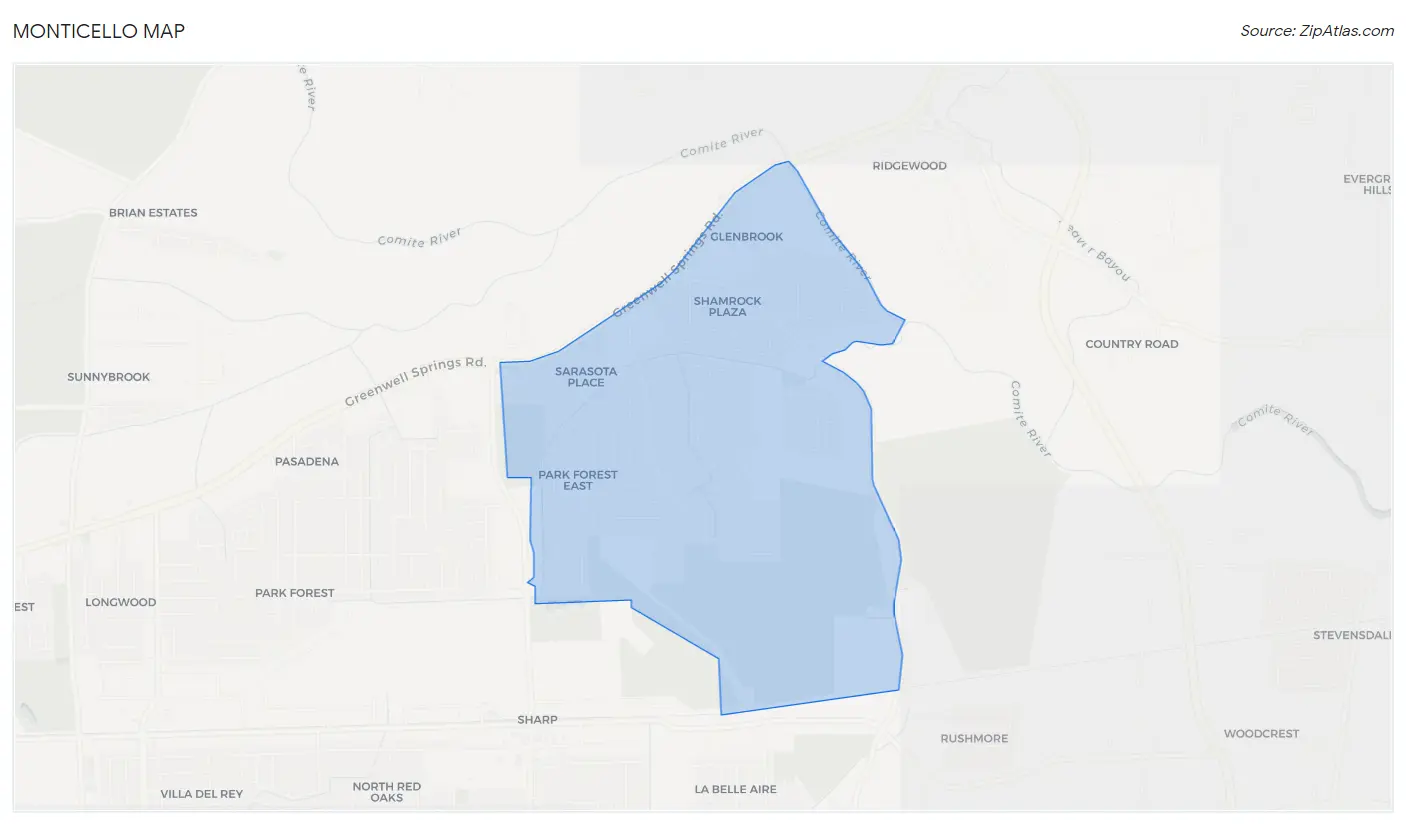
Monticello Map
Monticello Overview
$28,530
PER CAPITA INCOME
$73,750
AVG FAMILY INCOME
$62,540
AVG HOUSEHOLD INCOME
21.1%
WAGE / INCOME GAP [ % ]
78.9¢/ $1
WAGE / INCOME GAP [ $ ]
$13,373
FAMILY INCOME DEFICIT
0.42
INEQUALITY / GINI INDEX
4,767
TOTAL POPULATION
2,197
MALE POPULATION
2,570
FEMALE POPULATION
85.49
MALES / 100 FEMALES
116.98
FEMALES / 100 MALES
37.2
MEDIAN AGE
3.6
AVG FAMILY SIZE
2.9
AVG HOUSEHOLD SIZE
2,057
LABOR FORCE [ PEOPLE ]
57.9%
PERCENT IN LABOR FORCE
4.0%
UNEMPLOYMENT RATE
Income in Monticello
Income Overview in Monticello
Per Capita Income in Monticello is $28,530, while median incomes of families and households are $73,750 and $62,540 respectively.
| Characteristic | Number | Measure |
| Per Capita Income | 4,767 | $28,530 |
| Median Family Income | 1,176 | $73,750 |
| Mean Family Income | 1,176 | $86,575 |
| Median Household Income | 1,621 | $62,540 |
| Mean Household Income | 1,621 | $78,102 |
| Income Deficit | 1,176 | $13,373 |
| Wage / Income Gap (%) | 4,767 | 21.07% |
| Wage / Income Gap ($) | 4,767 | 78.93¢ per $1 |
| Gini / Inequality Index | 4,767 | 0.42 |
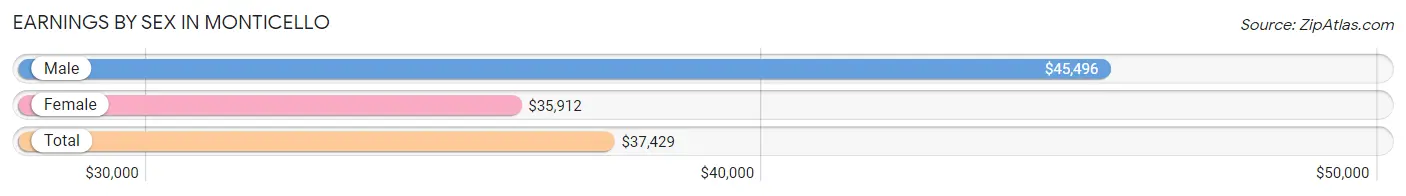
Earnings by Sex in Monticello
Average Earnings in Monticello are $37,429, $45,496 for men and $35,912 for women, a difference of 21.1%.
| Sex | Number | Average Earnings |
| Male | 977 (42.1%) | $45,496 |
| Female | 1,343 (57.9%) | $35,912 |
| Total | 2,320 (100.0%) | $37,429 |
Earnings by Sex by Income Bracket in Monticello
The most common earnings brackets in Monticello are $100,000+ for men (201 | 20.6%) and $65,000 to $74,999 for women (260 | 19.4%).
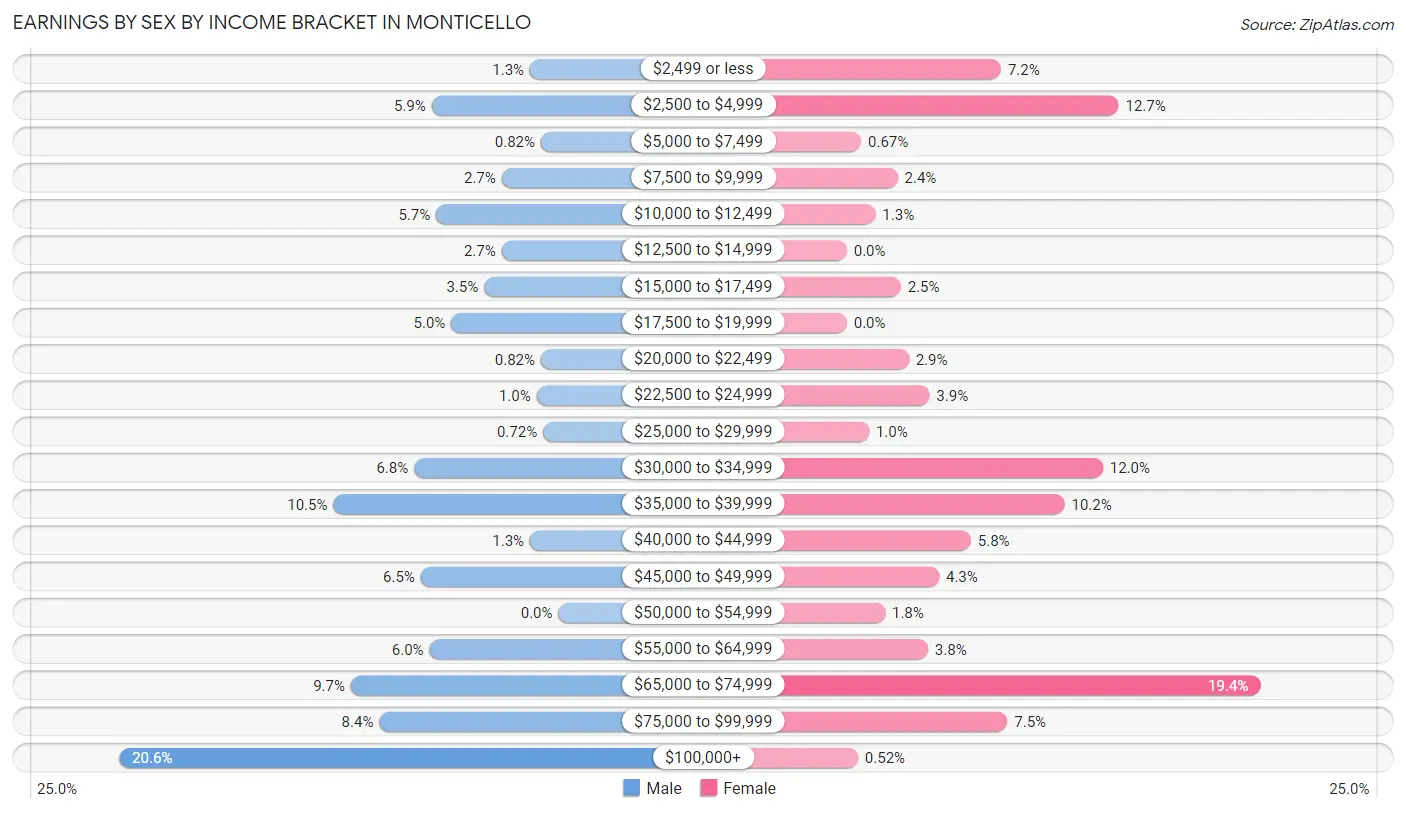
| Income | Male | Female |
| $2,499 or less | 13 (1.3%) | 97 (7.2%) |
| $2,500 to $4,999 | 58 (5.9%) | 171 (12.7%) |
| $5,000 to $7,499 | 8 (0.8%) | 9 (0.7%) |
| $7,500 to $9,999 | 26 (2.7%) | 32 (2.4%) |
| $10,000 to $12,499 | 56 (5.7%) | 18 (1.3%) |
| $12,500 to $14,999 | 26 (2.7%) | 0 (0.0%) |
| $15,000 to $17,499 | 34 (3.5%) | 34 (2.5%) |
| $17,500 to $19,999 | 49 (5.0%) | 0 (0.0%) |
| $20,000 to $22,499 | 8 (0.8%) | 39 (2.9%) |
| $22,500 to $24,999 | 10 (1.0%) | 52 (3.9%) |
| $25,000 to $29,999 | 7 (0.7%) | 14 (1.0%) |
| $30,000 to $34,999 | 66 (6.8%) | 161 (12.0%) |
| $35,000 to $39,999 | 103 (10.5%) | 137 (10.2%) |
| $40,000 to $44,999 | 13 (1.3%) | 78 (5.8%) |
| $45,000 to $49,999 | 63 (6.5%) | 58 (4.3%) |
| $50,000 to $54,999 | 0 (0.0%) | 24 (1.8%) |
| $55,000 to $64,999 | 59 (6.0%) | 51 (3.8%) |
| $65,000 to $74,999 | 95 (9.7%) | 260 (19.4%) |
| $75,000 to $99,999 | 82 (8.4%) | 101 (7.5%) |
| $100,000+ | 201 (20.6%) | 7 (0.5%) |
| Total | 977 (100.0%) | 1,343 (100.0%) |
Earnings by Sex by Educational Attainment in Monticello
Average earnings in Monticello are $47,500 for men and $41,778 for women, a difference of 12.0%. Men with an educational attainment of bachelor's degree enjoy the highest average annual earnings of $91,037, while those with high school diploma education earn the least with $31,890. Women with an educational attainment of bachelor's degree earn the most with the average annual earnings of $65,847, while those with high school diploma education have the smallest earnings of $31,023.
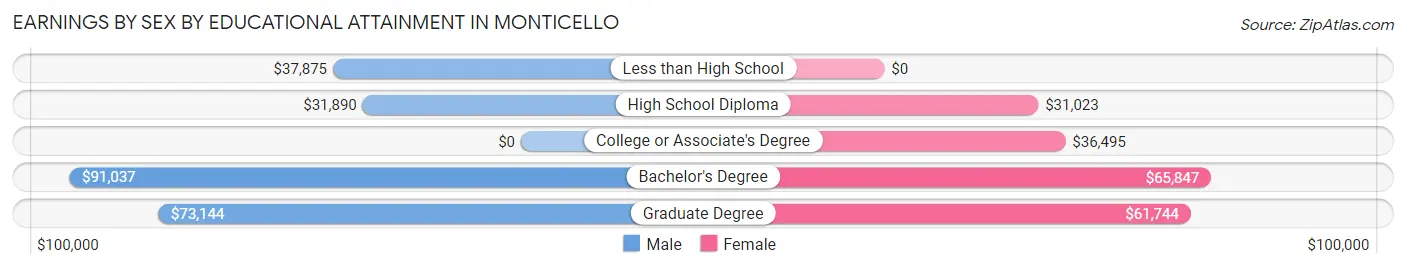
| Educational Attainment | Male Income | Female Income |
| Less than High School | $37,875 | $0 |
| High School Diploma | $31,890 | $31,023 |
| College or Associate's Degree | - | - |
| Bachelor's Degree | $91,037 | $65,847 |
| Graduate Degree | $73,144 | $61,744 |
| Total | $47,500 | $41,778 |
Family Income in Monticello
Family Income Brackets in Monticello
According to the Monticello family income data, there are 226 families falling into the $100,000 to $149,999 income range, which is the most common income bracket and makes up 19.2% of all families. Conversely, the less than $10,000 income bracket is the least frequent group with only 31 families (2.6%) belonging to this category.
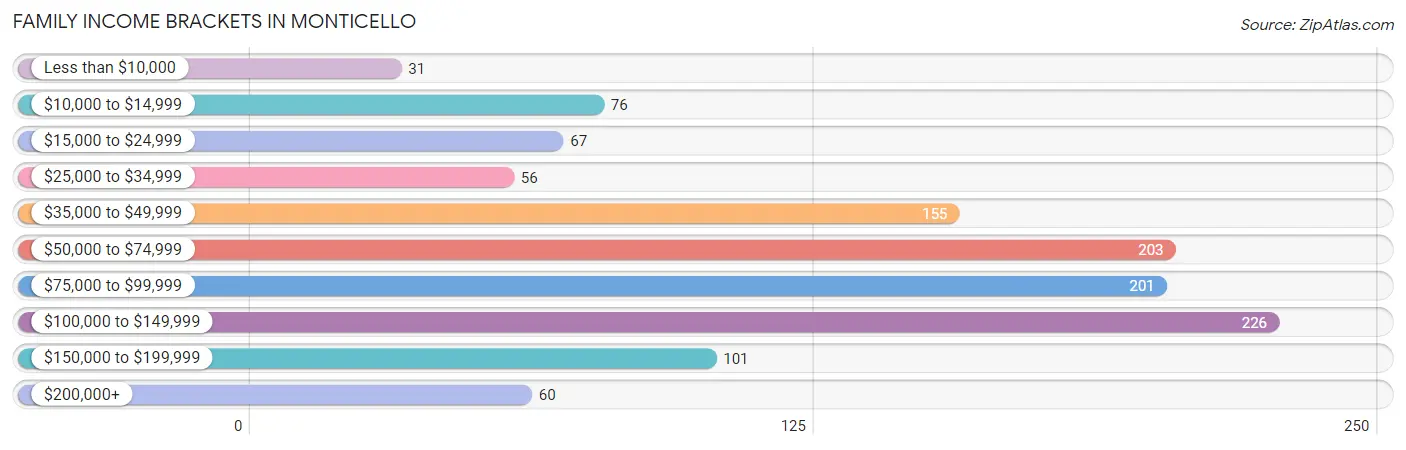
| Income Bracket | # Families | % Families |
| Less than $10,000 | 31 | 2.6% |
| $10,000 to $14,999 | 76 | 6.5% |
| $15,000 to $24,999 | 67 | 5.7% |
| $25,000 to $34,999 | 56 | 4.8% |
| $35,000 to $49,999 | 155 | 13.2% |
| $50,000 to $74,999 | 203 | 17.3% |
| $75,000 to $99,999 | 201 | 17.1% |
| $100,000 to $149,999 | 226 | 19.2% |
| $150,000 to $199,999 | 101 | 8.6% |
| $200,000+ | 60 | 5.1% |
Family Income by Famaliy Size in Monticello
3-person families (270 | 23.0%) account for the highest median family income in Monticello with $82,069 per family, while 2-person families (549 | 46.7%) have the highest median income of $34,540 per family member.
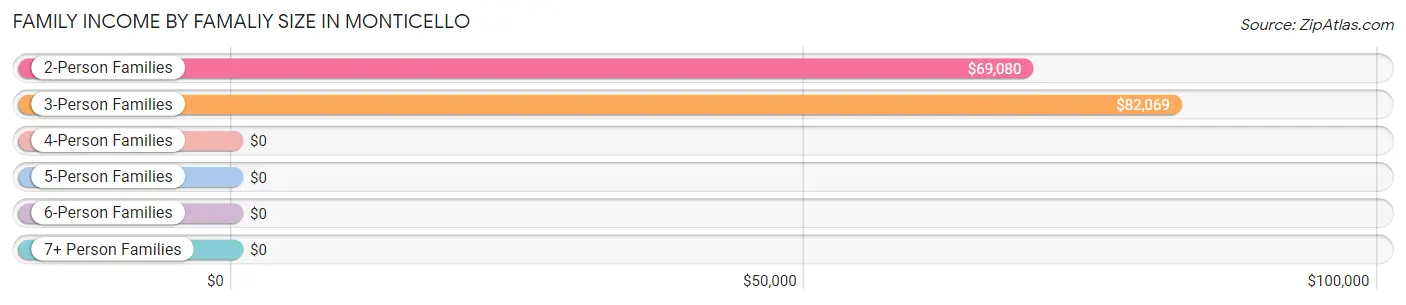
| Income Bracket | # Families | Median Income |
| 2-Person Families | 549 (46.7%) | $69,080 |
| 3-Person Families | 270 (23.0%) | $82,069 |
| 4-Person Families | 205 (17.4%) | $0 |
| 5-Person Families | 152 (12.9%) | $0 |
| 6-Person Families | 0 (0.0%) | $0 |
| 7+ Person Families | 0 (0.0%) | $0 |
| Total | 1,176 (100.0%) | $73,750 |
Family Income by Number of Earners in Monticello
The median family income in Monticello is $73,750, with families comprising 3+ earners (77) having the highest median family income of $176,182, while families with no earners (114) have the lowest median family income of $12,192, accounting for 6.6% and 9.7% of families, respectively.
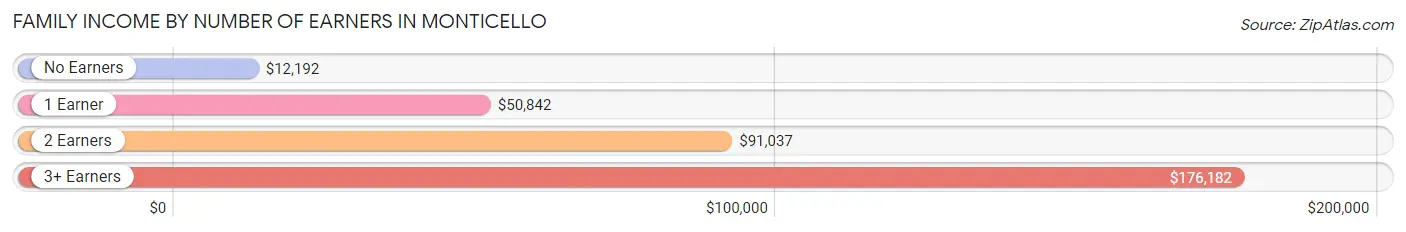
| Number of Earners | # Families | Median Income |
| No Earners | 114 (9.7%) | $12,192 |
| 1 Earner | 483 (41.1%) | $50,842 |
| 2 Earners | 502 (42.7%) | $91,037 |
| 3+ Earners | 77 (6.6%) | $176,182 |
| Total | 1,176 (100.0%) | $73,750 |
Household Income in Monticello
Household Income Brackets in Monticello
With 324 households falling in the category, the $50,000 to $74,999 income range is the most frequent in Monticello, accounting for 20.0% of all households. In contrast, only 66 households (4.1%) fall into the $10,000 to $14,999 income bracket, making it the least populous group.
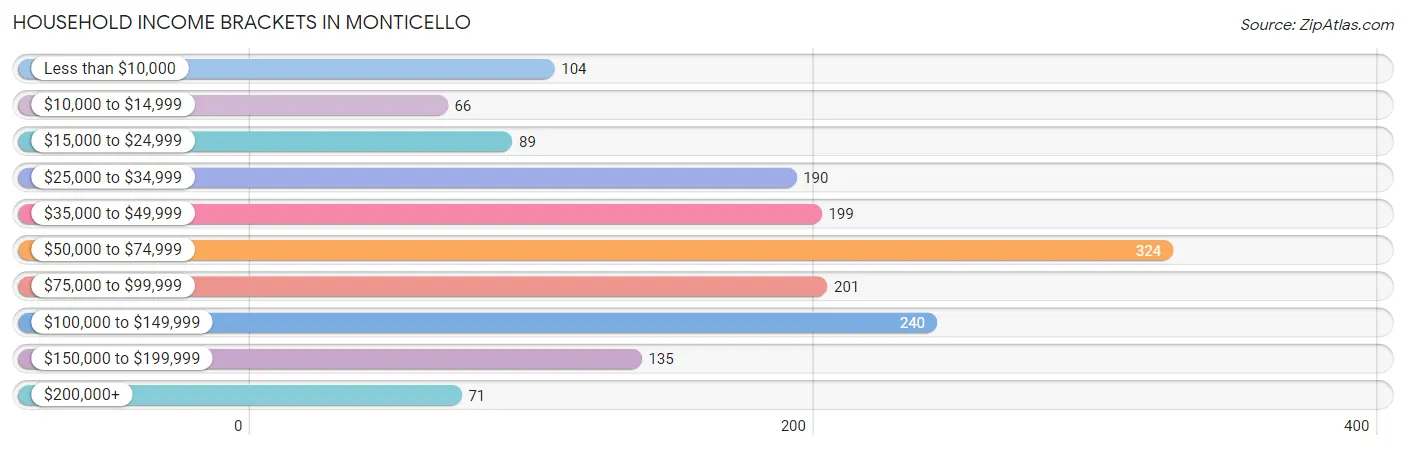
| Income Bracket | # Households | % Households |
| Less than $10,000 | 104 | 6.4% |
| $10,000 to $14,999 | 66 | 4.1% |
| $15,000 to $24,999 | 89 | 5.5% |
| $25,000 to $34,999 | 190 | 11.7% |
| $35,000 to $49,999 | 199 | 12.3% |
| $50,000 to $74,999 | 324 | 20.0% |
| $75,000 to $99,999 | 201 | 12.4% |
| $100,000 to $149,999 | 240 | 14.8% |
| $150,000 to $199,999 | 135 | 8.3% |
| $200,000+ | 71 | 4.4% |
Household Income by Householder Age in Monticello
The median household income in Monticello is $62,540, with the highest median household income of $72,353 found in the 45 to 64 years age bracket for the primary householder. A total of 610 households (37.6%) fall into this category. Meanwhile, the 15 to 24 years age bracket for the primary householder has the lowest median household income of $0, with 29 households (1.8%) in this group.
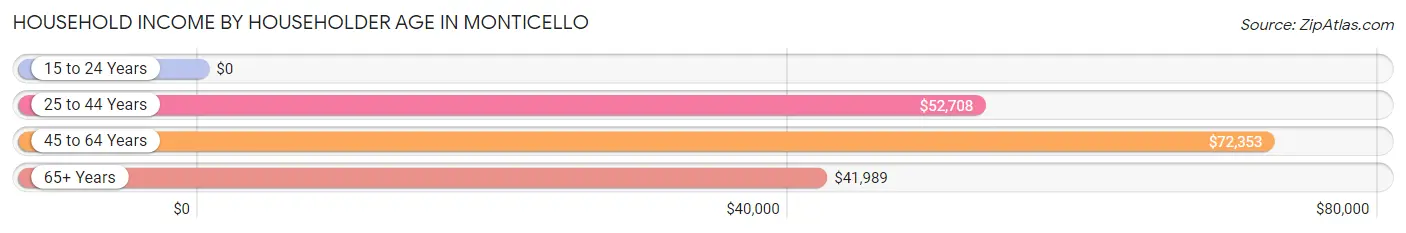
| Income Bracket | # Households | Median Income |
| 15 to 24 Years | 29 (1.8%) | $0 |
| 25 to 44 Years | 523 (32.3%) | $52,708 |
| 45 to 64 Years | 610 (37.6%) | $72,353 |
| 65+ Years | 459 (28.3%) | $41,989 |
| Total | 1,621 (100.0%) | $62,540 |
Poverty in Monticello
Income Below Poverty by Sex and Age in Monticello
With 14.2% poverty level for males and 9.4% for females among the residents of Monticello, 18 to 24 year old males and under 5 year old females are the most vulnerable to poverty, with 82 males (41.2%) and 32 females (100.0%) in their respective age groups living below the poverty level.
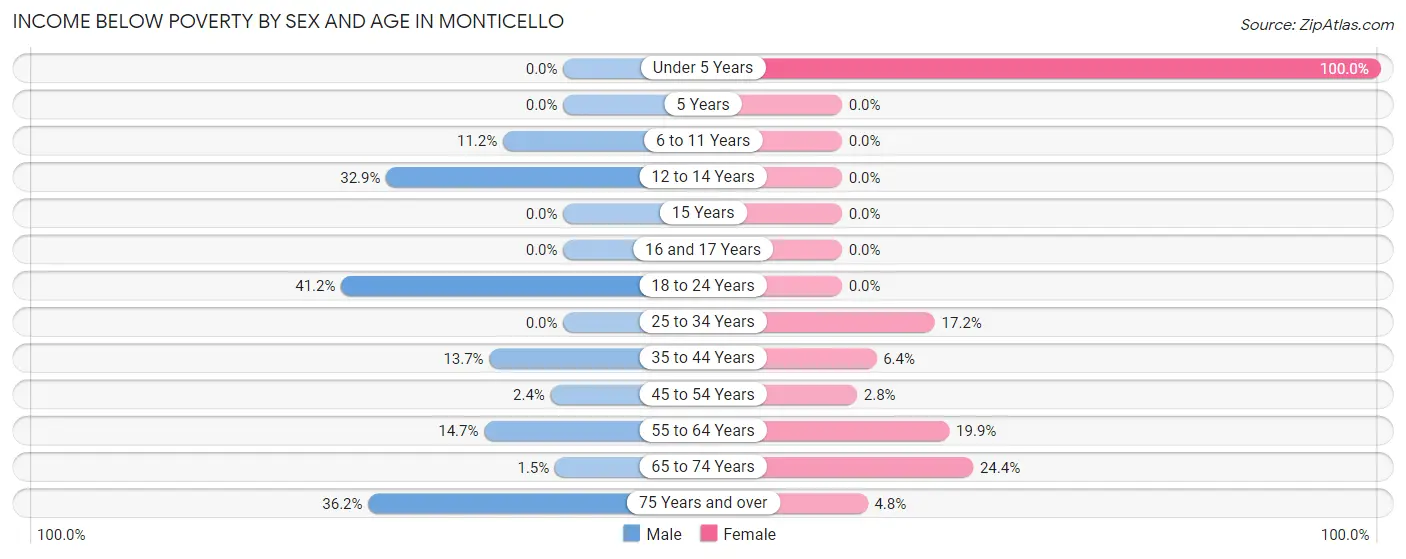
| Age Bracket | Male | Female |
| Under 5 Years | 0 (0.0%) | 32 (100.0%) |
| 5 Years | 0 (0.0%) | 0 (0.0%) |
| 6 to 11 Years | 30 (11.2%) | 0 (0.0%) |
| 12 to 14 Years | 93 (32.9%) | 0 (0.0%) |
| 15 Years | 0 (0.0%) | 0 (0.0%) |
| 16 and 17 Years | 0 (0.0%) | 0 (0.0%) |
| 18 to 24 Years | 82 (41.2%) | 0 (0.0%) |
| 25 to 34 Years | 0 (0.0%) | 40 (17.2%) |
| 35 to 44 Years | 31 (13.7%) | 32 (6.4%) |
| 45 to 54 Years | 8 (2.4%) | 7 (2.8%) |
| 55 to 64 Years | 27 (14.7%) | 54 (19.9%) |
| 65 to 74 Years | 4 (1.5%) | 75 (24.3%) |
| 75 Years and over | 38 (36.2%) | 1 (4.8%) |
| Total | 313 (14.2%) | 241 (9.4%) |
Income Above Poverty by Sex and Age in Monticello
According to the poverty statistics in Monticello, males aged under 5 years and females aged 6 to 11 years are the age groups that are most secure financially, with 100.0% of males and 100.0% of females in these age groups living above the poverty line.
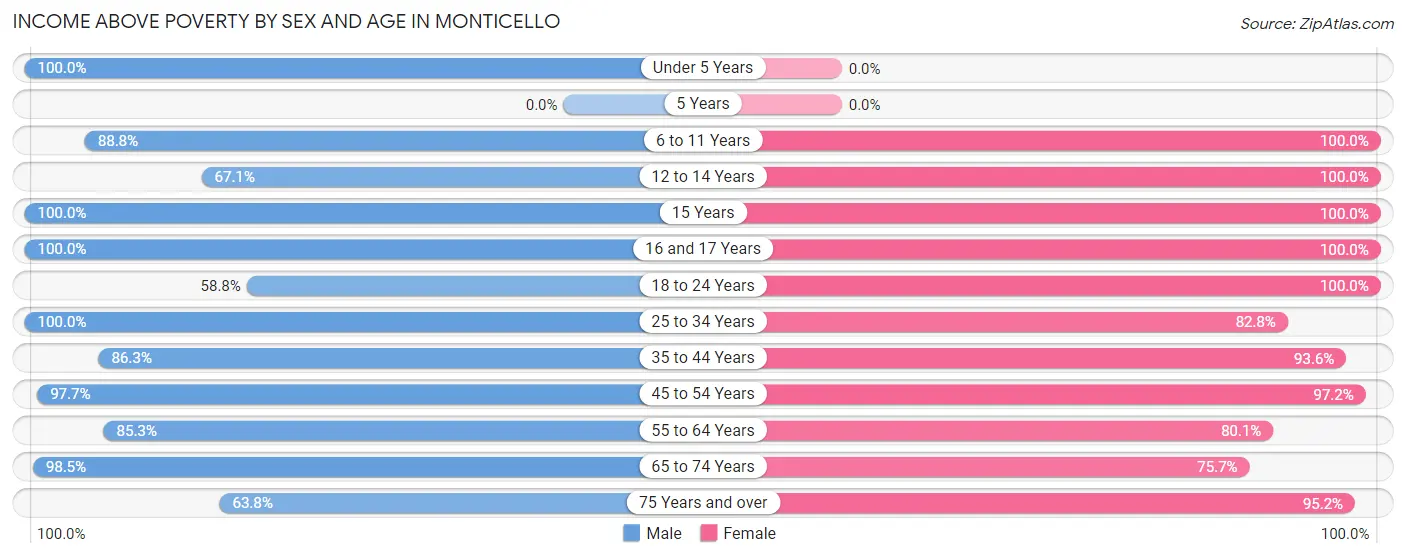
| Age Bracket | Male | Female |
| Under 5 Years | 162 (100.0%) | 0 (0.0%) |
| 5 Years | 0 (0.0%) | 0 (0.0%) |
| 6 to 11 Years | 238 (88.8%) | 219 (100.0%) |
| 12 to 14 Years | 190 (67.1%) | 210 (100.0%) |
| 15 Years | 29 (100.0%) | 12 (100.0%) |
| 16 and 17 Years | 36 (100.0%) | 95 (100.0%) |
| 18 to 24 Years | 117 (58.8%) | 418 (100.0%) |
| 25 to 34 Years | 106 (100.0%) | 192 (82.8%) |
| 35 to 44 Years | 195 (86.3%) | 469 (93.6%) |
| 45 to 54 Years | 332 (97.7%) | 244 (97.2%) |
| 55 to 64 Years | 157 (85.3%) | 217 (80.1%) |
| 65 to 74 Years | 255 (98.5%) | 233 (75.6%) |
| 75 Years and over | 67 (63.8%) | 20 (95.2%) |
| Total | 1,884 (85.8%) | 2,329 (90.6%) |
Income Below Poverty Among Married-Couple Families in Monticello
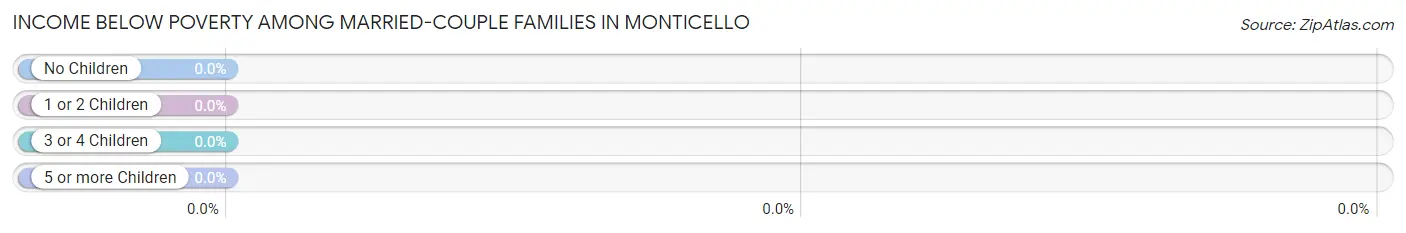
| Children | Above Poverty | Below Poverty |
| No Children | 382 (100.0%) | 0 (0.0%) |
| 1 or 2 Children | 203 (100.0%) | 0 (0.0%) |
| 3 or 4 Children | 64 (100.0%) | 0 (0.0%) |
| 5 or more Children | 0 (0.0%) | 0 (0.0%) |
| Total | 649 (100.0%) | 0 (0.0%) |
Income Below Poverty Among Single-Parent Households in Monticello
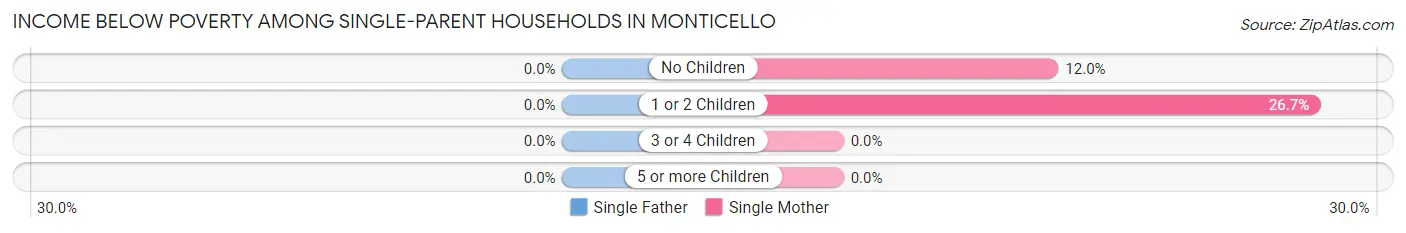
| Children | Single Father | Single Mother |
| No Children | 0 (0.0%) | 18 (12.0%) |
| 1 or 2 Children | 0 (0.0%) | 88 (26.7%) |
| 3 or 4 Children | 0 (0.0%) | 0 (0.0%) |
| 5 or more Children | 0 (0.0%) | 0 (0.0%) |
| Total | 0 (0.0%) | 106 (22.1%) |
Income Below Poverty Among Married-Couple vs Single-Parent Households in Monticello
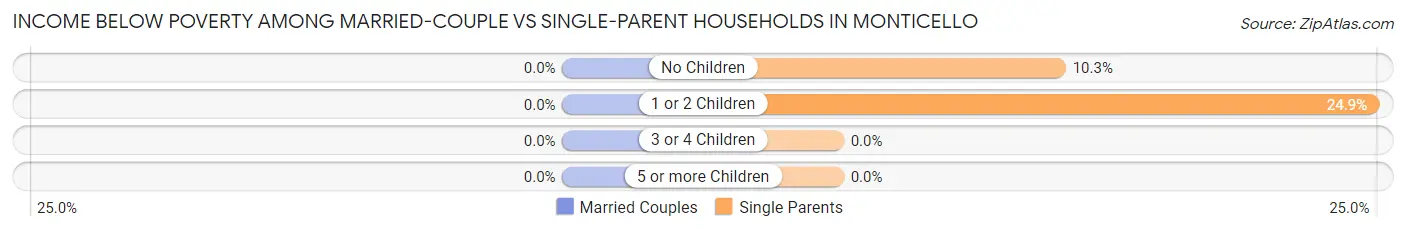
| Children | Married-Couple Families | Single-Parent Households |
| No Children | 0 (0.0%) | 18 (10.3%) |
| 1 or 2 Children | 0 (0.0%) | 88 (24.9%) |
| 3 or 4 Children | 0 (0.0%) | 0 (0.0%) |
| 5 or more Children | 0 (0.0%) | 0 (0.0%) |
| Total | 0 (0.0%) | 106 (20.1%) |
Race in Monticello
The most populous races in Monticello are Black / African American (4,366 | 91.6%), White / Caucasian (266 | 5.6%), and Hispanic or Latino (95 | 2.0%).
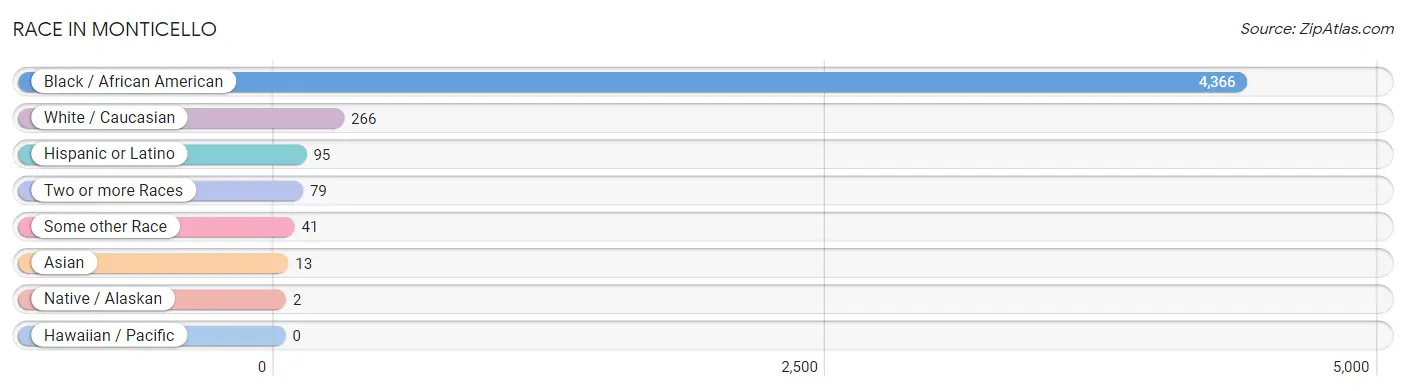
| Race | # Population | % Population |
| Asian | 13 | 0.3% |
| Black / African American | 4,366 | 91.6% |
| Hawaiian / Pacific | 0 | 0.0% |
| Hispanic or Latino | 95 | 2.0% |
| Native / Alaskan | 2 | 0.0% |
| White / Caucasian | 266 | 5.6% |
| Two or more Races | 79 | 1.7% |
| Some other Race | 41 | 0.9% |
| Total | 4,767 | 100.0% |
Ancestry in Monticello
The most populous ancestries reported in Monticello are French (222 | 4.7%), American (202 | 4.2%), German (168 | 3.5%), Italian (24 | 0.5%), and Scotch-Irish (20 | 0.4%), together accounting for 13.3% of all Monticello residents.
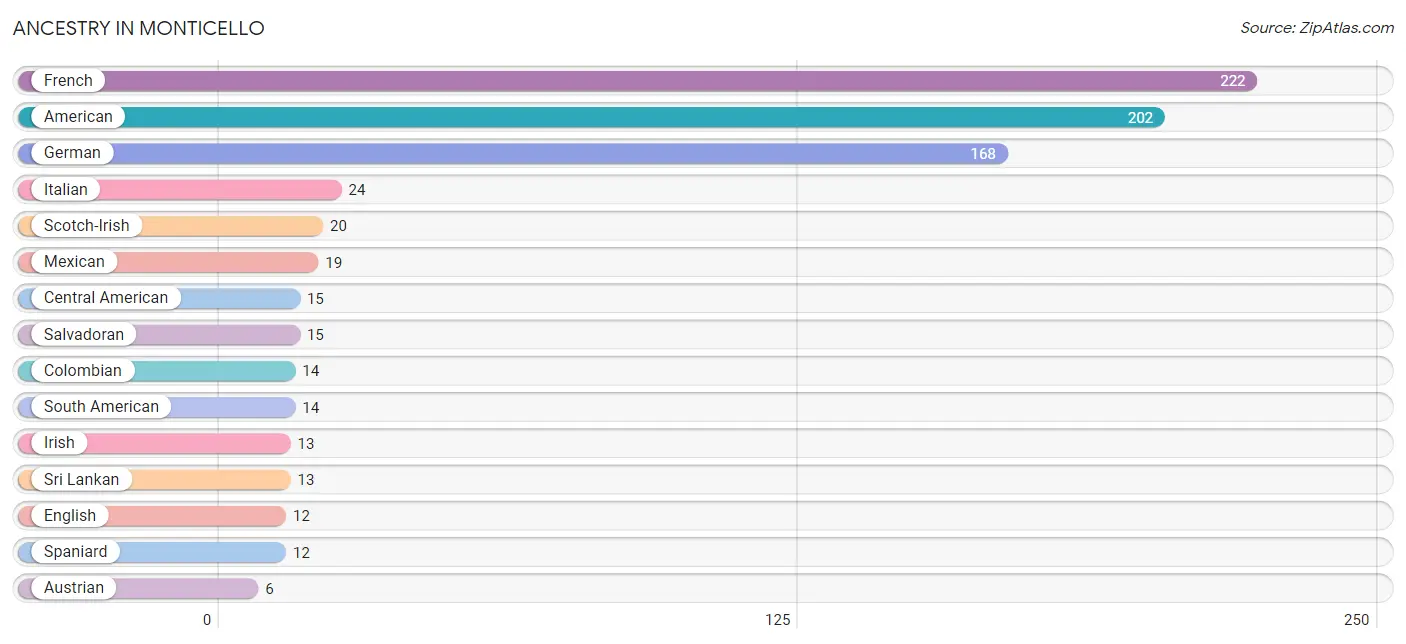
| Ancestry | # Population | % Population |
| American | 202 | 4.2% |
| Austrian | 6 | 0.1% |
| Central American | 15 | 0.3% |
| Colombian | 14 | 0.3% |
| English | 12 | 0.3% |
| French | 222 | 4.7% |
| German | 168 | 3.5% |
| Irish | 13 | 0.3% |
| Italian | 24 | 0.5% |
| Mexican | 19 | 0.4% |
| Salvadoran | 15 | 0.3% |
| Scotch-Irish | 20 | 0.4% |
| South American | 14 | 0.3% |
| Spaniard | 12 | 0.3% |
| Sri Lankan | 13 | 0.3% | View All 15 Rows |
Immigrants in Monticello
The most numerous immigrant groups reported in Monticello came from Latin America (48 | 1.0%), Central America (34 | 0.7%), Mexico (19 | 0.4%), El Salvador (15 | 0.3%), and Colombia (14 | 0.3%), together accounting for 2.7% of all Monticello residents.
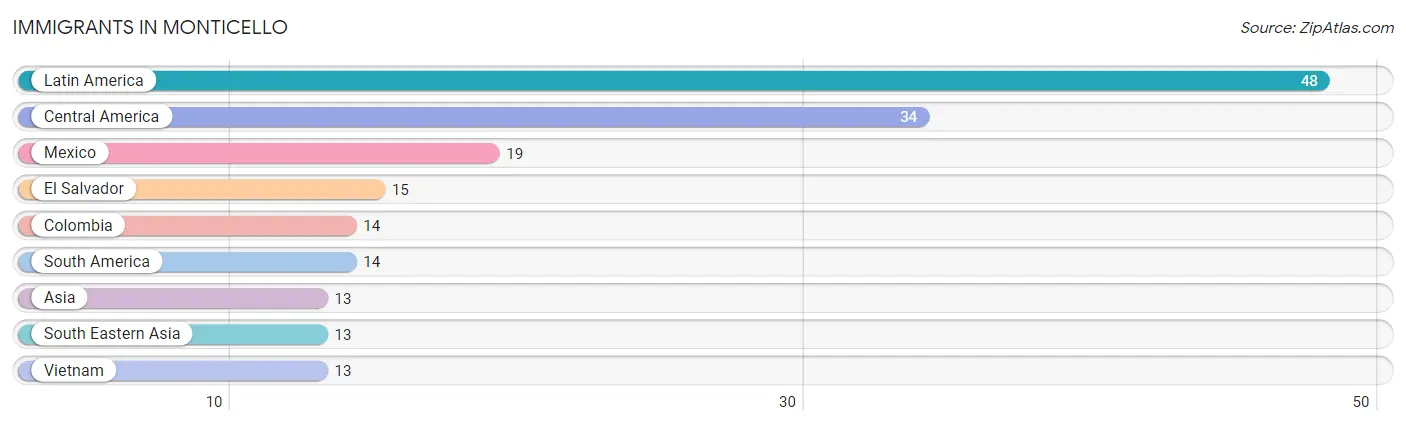
| Immigration Origin | # Population | % Population |
| Asia | 13 | 0.3% |
| Central America | 34 | 0.7% |
| Colombia | 14 | 0.3% |
| El Salvador | 15 | 0.3% |
| Latin America | 48 | 1.0% |
| Mexico | 19 | 0.4% |
| South America | 14 | 0.3% |
| South Eastern Asia | 13 | 0.3% |
| Vietnam | 13 | 0.3% | View All 9 Rows |
Sex and Age in Monticello
Sex and Age in Monticello
The most populous age groups in Monticello are 10 to 14 Years (387 | 17.6%) for men and 20 to 24 Years (330 | 12.8%) for women.
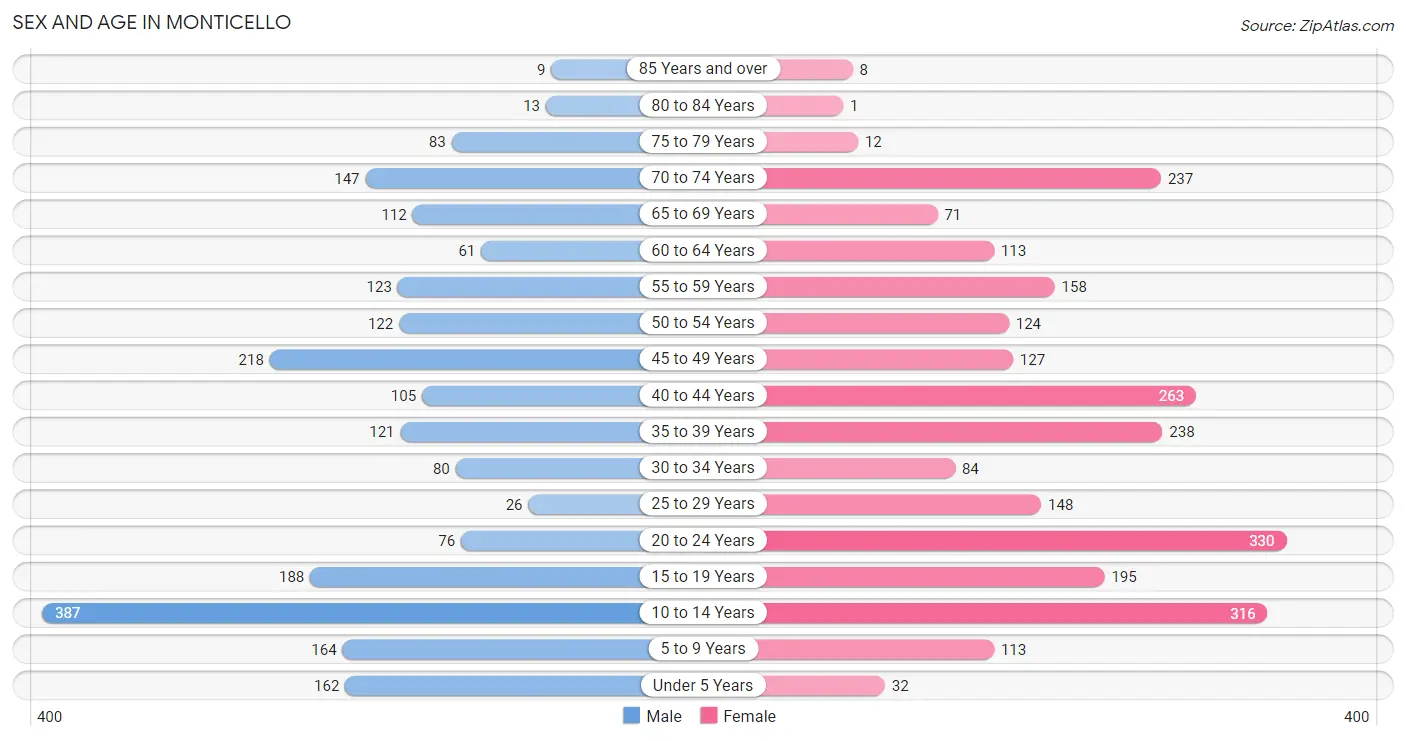
| Age Bracket | Male | Female |
| Under 5 Years | 162 (7.4%) | 32 (1.3%) |
| 5 to 9 Years | 164 (7.5%) | 113 (4.4%) |
| 10 to 14 Years | 387 (17.6%) | 316 (12.3%) |
| 15 to 19 Years | 188 (8.6%) | 195 (7.6%) |
| 20 to 24 Years | 76 (3.5%) | 330 (12.8%) |
| 25 to 29 Years | 26 (1.2%) | 148 (5.8%) |
| 30 to 34 Years | 80 (3.6%) | 84 (3.3%) |
| 35 to 39 Years | 121 (5.5%) | 238 (9.3%) |
| 40 to 44 Years | 105 (4.8%) | 263 (10.2%) |
| 45 to 49 Years | 218 (9.9%) | 127 (4.9%) |
| 50 to 54 Years | 122 (5.6%) | 124 (4.8%) |
| 55 to 59 Years | 123 (5.6%) | 158 (6.1%) |
| 60 to 64 Years | 61 (2.8%) | 113 (4.4%) |
| 65 to 69 Years | 112 (5.1%) | 71 (2.8%) |
| 70 to 74 Years | 147 (6.7%) | 237 (9.2%) |
| 75 to 79 Years | 83 (3.8%) | 12 (0.5%) |
| 80 to 84 Years | 13 (0.6%) | 1 (0.0%) |
| 85 Years and over | 9 (0.4%) | 8 (0.3%) |
| Total | 2,197 (100.0%) | 2,570 (100.0%) |
Families and Households in Monticello
Median Family Size in Monticello
The median family size in Monticello is 3.56 persons per family, with married-couple families (649 | 55.2%) accounting for the largest median family size of 3.84 persons per family. On the other hand, single male/father families (47 | 4.0%) represent the smallest median family size with 2.74 persons per family.
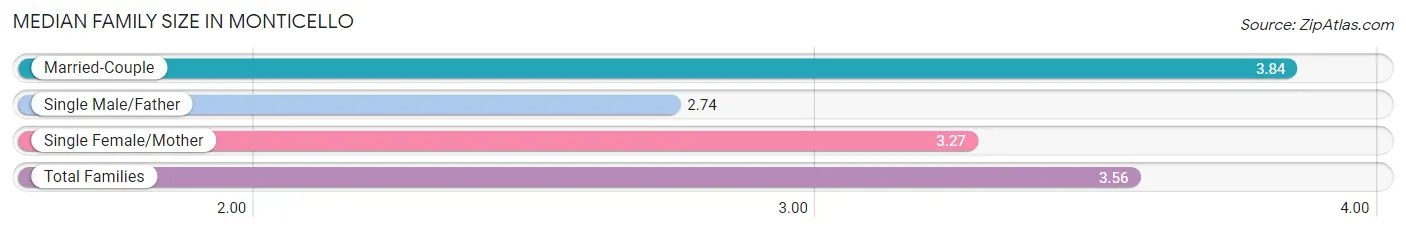
| Family Type | # Families | Family Size |
| Married-Couple | 649 (55.2%) | 3.84 |
| Single Male/Father | 47 (4.0%) | 2.74 |
| Single Female/Mother | 480 (40.8%) | 3.27 |
| Total Families | 1,176 (100.0%) | 3.56 |
Median Household Size in Monticello
The median household size in Monticello is 2.94 persons per household, with married-couple households (649 | 40.0%) accounting for the largest median household size of 3.84 persons per household. non-family households (445 | 27.5%) represent the smallest median household size with 1.12 persons per household.
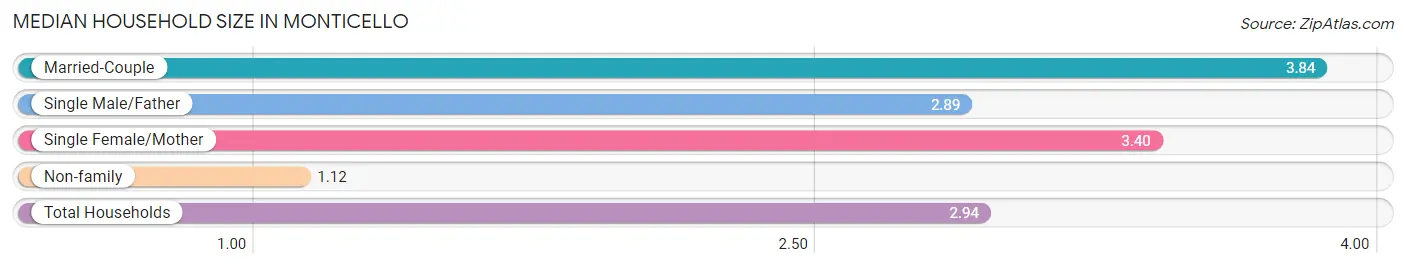
| Household Type | # Households | Household Size |
| Married-Couple | 649 (40.0%) | 3.84 |
| Single Male/Father | 47 (2.9%) | 2.89 |
| Single Female/Mother | 480 (29.6%) | 3.40 |
| Non-family | 445 (27.5%) | 1.12 |
| Total Households | 1,621 (100.0%) | 2.94 |
Household Size by Marriage Status in Monticello
Out of a total of 1,621 households in Monticello, 1,176 (72.6%) are family households, while 445 (27.5%) are nonfamily households. The most numerous type of family households are 2-person households, comprising 499, and the most common type of nonfamily households are 1-person households, comprising 403.
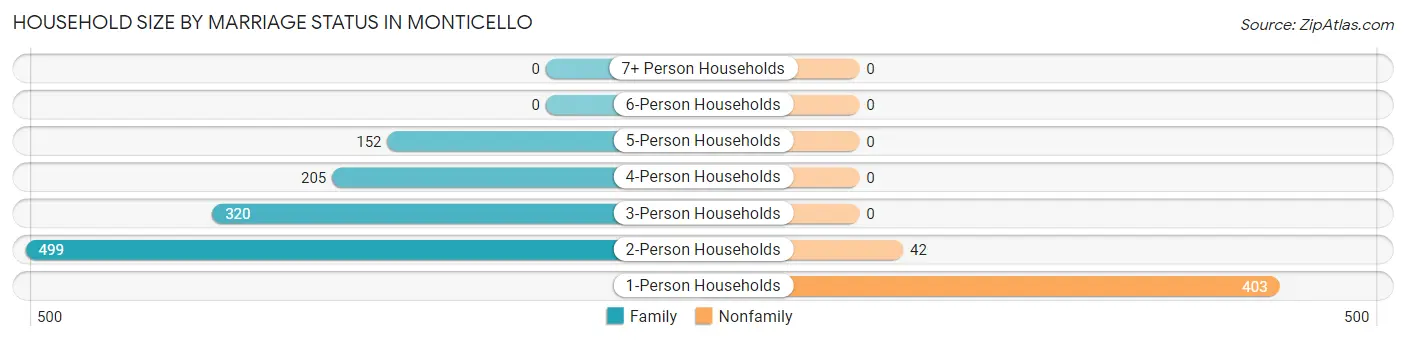
| Household Size | Family Households | Nonfamily Households |
| 1-Person Households | - | 403 (24.9%) |
| 2-Person Households | 499 (30.8%) | 42 (2.6%) |
| 3-Person Households | 320 (19.7%) | 0 (0.0%) |
| 4-Person Households | 205 (12.7%) | 0 (0.0%) |
| 5-Person Households | 152 (9.4%) | 0 (0.0%) |
| 6-Person Households | 0 (0.0%) | 0 (0.0%) |
| 7+ Person Households | 0 (0.0%) | 0 (0.0%) |
| Total | 1,176 (72.6%) | 445 (27.5%) |
Female Fertility in Monticello
Fertility by Age in Monticello
Average fertility rate in Monticello is 103.0 births per 1,000 women. Women in the age bracket of 20 to 34 years have the highest fertility rate with 208.0 births per 1,000 women. Women in the age bracket of 20 to 34 years acount for 80.7% of all women with births.
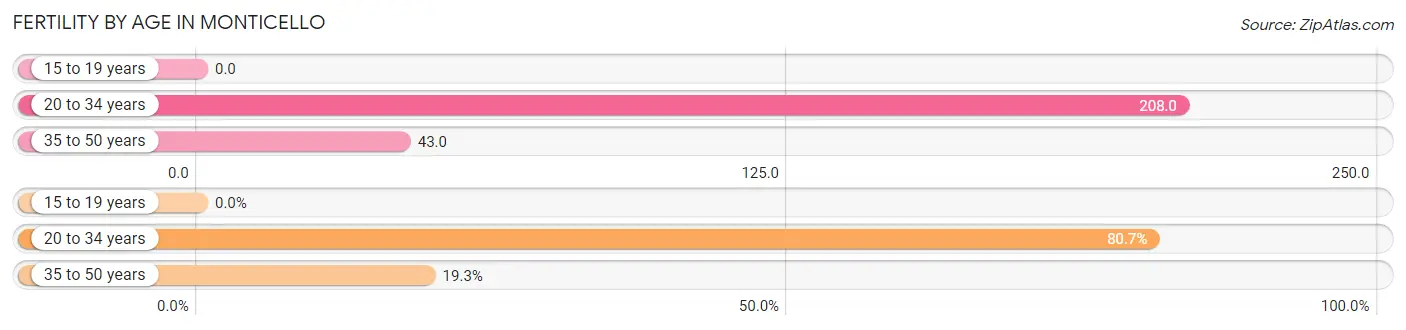
| Age Bracket | Women with Births | Births / 1,000 Women |
| 15 to 19 years | 0 (0.0%) | 0.0 |
| 20 to 34 years | 117 (80.7%) | 208.0 |
| 35 to 50 years | 28 (19.3%) | 43.0 |
| Total | 145 (100.0%) | 103.0 |
Fertility by Age by Marriage Status in Monticello
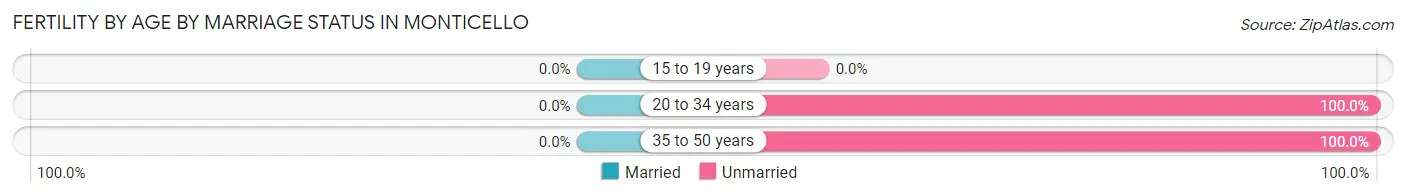
| Age Bracket | Married | Unmarried |
| 15 to 19 years | 0 (0.0%) | 0 (0.0%) |
| 20 to 34 years | 0 (0.0%) | 117 (100.0%) |
| 35 to 50 years | 0 (0.0%) | 28 (100.0%) |
| Total | 0 (0.0%) | 145 (100.0%) |
Fertility by Education in Monticello
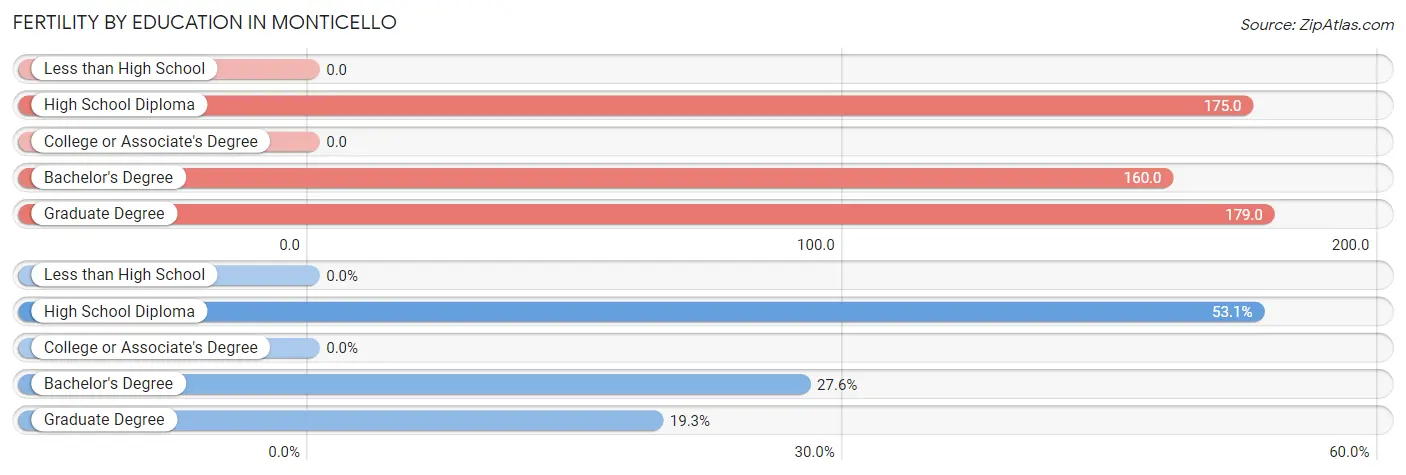
| Educational Attainment | Women with Births | Births / 1,000 Women |
| Less than High School | 0 (0.0%) | 0.0 |
| High School Diploma | 77 (53.1%) | 175.0 |
| College or Associate's Degree | 0 (0.0%) | 0.0 |
| Bachelor's Degree | 40 (27.6%) | 160.0 |
| Graduate Degree | 28 (19.3%) | 179.0 |
| Total | 145 (100.0%) | 103.0 |
Fertility by Education by Marriage Status in Monticello
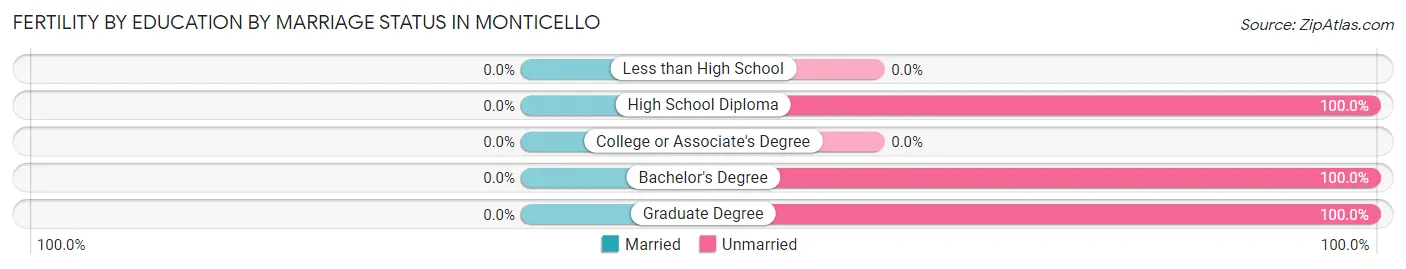
| Educational Attainment | Married | Unmarried |
| Less than High School | 0 (0.0%) | 0 (0.0%) |
| High School Diploma | 0 (0.0%) | 77 (100.0%) |
| College or Associate's Degree | 0 (0.0%) | 0 (0.0%) |
| Bachelor's Degree | 0 (0.0%) | 40 (100.0%) |
| Graduate Degree | 0 (0.0%) | 28 (100.0%) |
| Total | 0 (0.0%) | 145 (100.0%) |
Employment Characteristics in Monticello
Employment by Class of Employer in Monticello
Among the 1,940 employed individuals in Monticello, private company employees (978 | 50.4%), state government employees (356 | 18.3%), and local government employees (238 | 12.3%) make up the most common classes of employment.
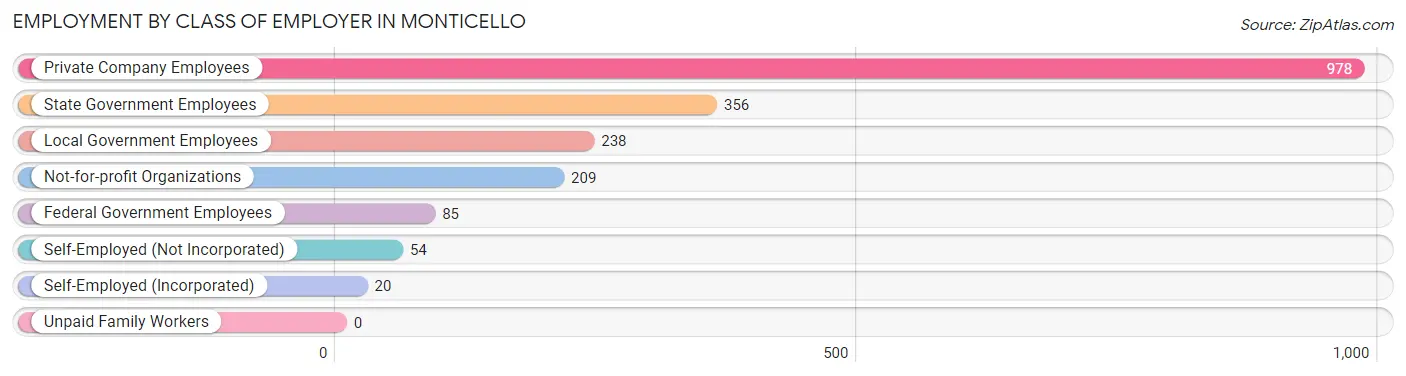
| Employer Class | # Employees | % Employees |
| Private Company Employees | 978 | 50.4% |
| Self-Employed (Incorporated) | 20 | 1.0% |
| Self-Employed (Not Incorporated) | 54 | 2.8% |
| Not-for-profit Organizations | 209 | 10.8% |
| Local Government Employees | 238 | 12.3% |
| State Government Employees | 356 | 18.3% |
| Federal Government Employees | 85 | 4.4% |
| Unpaid Family Workers | 0 | 0.0% |
| Total | 1,940 | 100.0% |
Employment Status by Age in Monticello
According to the labor force statistics for Monticello, out of the total population over 16 years of age (3,552), 57.9% or 2,057 individuals are in the labor force, with 4.0% or 82 of them unemployed. The age group with the highest labor force participation rate is 45 to 54 years, with 98.5% or 582 individuals in the labor force. Within the labor force, the 30 to 34 years age range has the highest percentage of unemployed individuals, with 35.5% or 49 of them being unemployed.
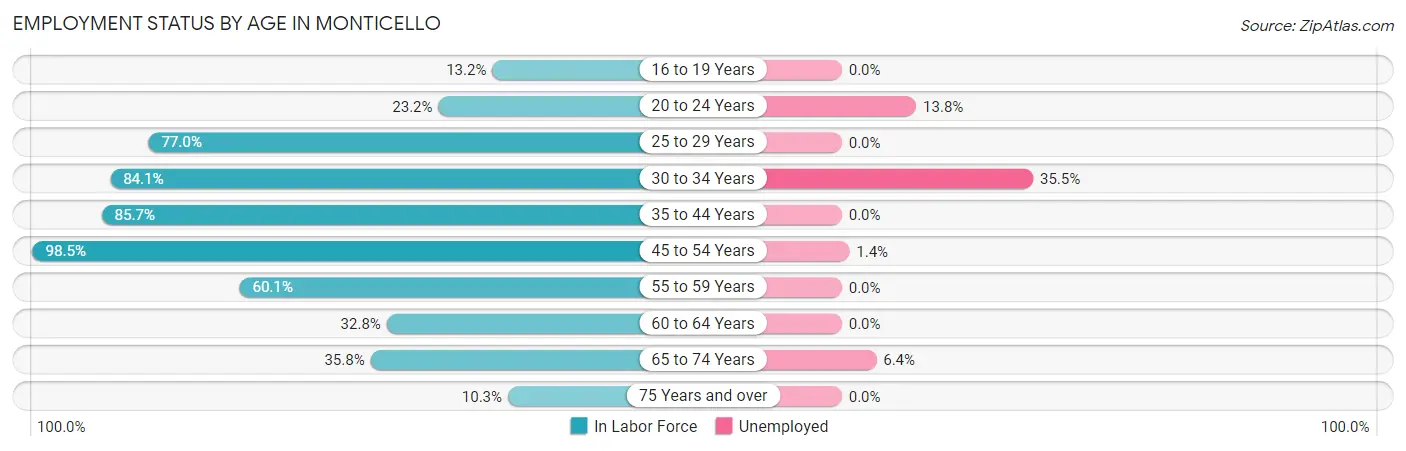
| Age Bracket | In Labor Force | Unemployed |
| 16 to 19 Years | 45 (13.2%) | 0 (0.0%) |
| 20 to 24 Years | 94 (23.2%) | 13 (13.8%) |
| 25 to 29 Years | 134 (77.0%) | 0 (0.0%) |
| 30 to 34 Years | 138 (84.1%) | 49 (35.5%) |
| 35 to 44 Years | 623 (85.7%) | 0 (0.0%) |
| 45 to 54 Years | 582 (98.5%) | 8 (1.4%) |
| 55 to 59 Years | 169 (60.1%) | 0 (0.0%) |
| 60 to 64 Years | 57 (32.8%) | 0 (0.0%) |
| 65 to 74 Years | 203 (35.8%) | 13 (6.4%) |
| 75 Years and over | 13 (10.3%) | 0 (0.0%) |
| Total | 2,057 (57.9%) | 82 (4.0%) |
Employment Status by Educational Attainment in Monticello
According to labor force statistics for Monticello, 80.7% of individuals (1,704) out of the total population between 25 and 64 years of age (2,111) are in the labor force, with 3.3% or 56 of them being unemployed. The group with the highest labor force participation rate are those with the educational attainment of college / associate degree, with 85.4% or 514 individuals in the labor force. Within the labor force, individuals with college / associate degree education have the highest percentage of unemployment, with 5.3% or 27 of them being unemployed.
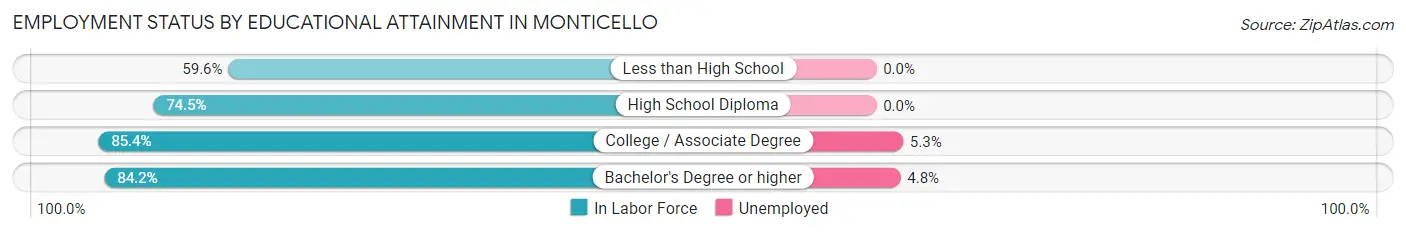
| Educational Attainment | In Labor Force | Unemployed |
| Less than High School | 31 (59.6%) | 0 (0.0%) |
| High School Diploma | 529 (74.5%) | 0 (0.0%) |
| College / Associate Degree | 514 (85.4%) | 32 (5.3%) |
| Bachelor's Degree or higher | 629 (84.2%) | 36 (4.8%) |
| Total | 1,704 (80.7%) | 70 (3.3%) |
Employment Occupations by Sex in Monticello
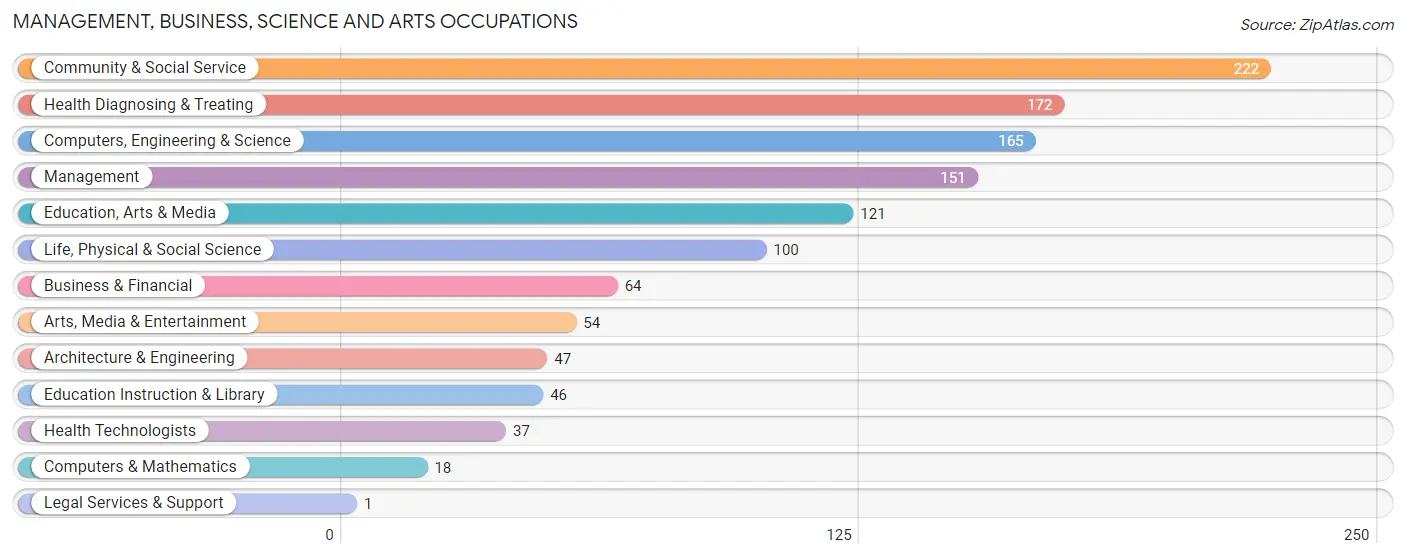
Management, Business, Science and Arts Occupations
The most common Management, Business, Science and Arts occupations in Monticello are Community & Social Service (222 | 11.2%), Health Diagnosing & Treating (172 | 8.7%), Computers, Engineering & Science (165 | 8.4%), Management (151 | 7.6%), and Education, Arts & Media (121 | 6.1%).
Management, Business, Science and Arts Occupations by Sex
Within the Management, Business, Science and Arts occupations in Monticello, the most male-oriented occupations are Computers & Mathematics (100.0%), Architecture & Engineering (100.0%), and Arts, Media & Entertainment (88.9%), while the most female-oriented occupations are Education, Arts & Media (100.0%), Legal Services & Support (100.0%), and Health Technologists (100.0%).
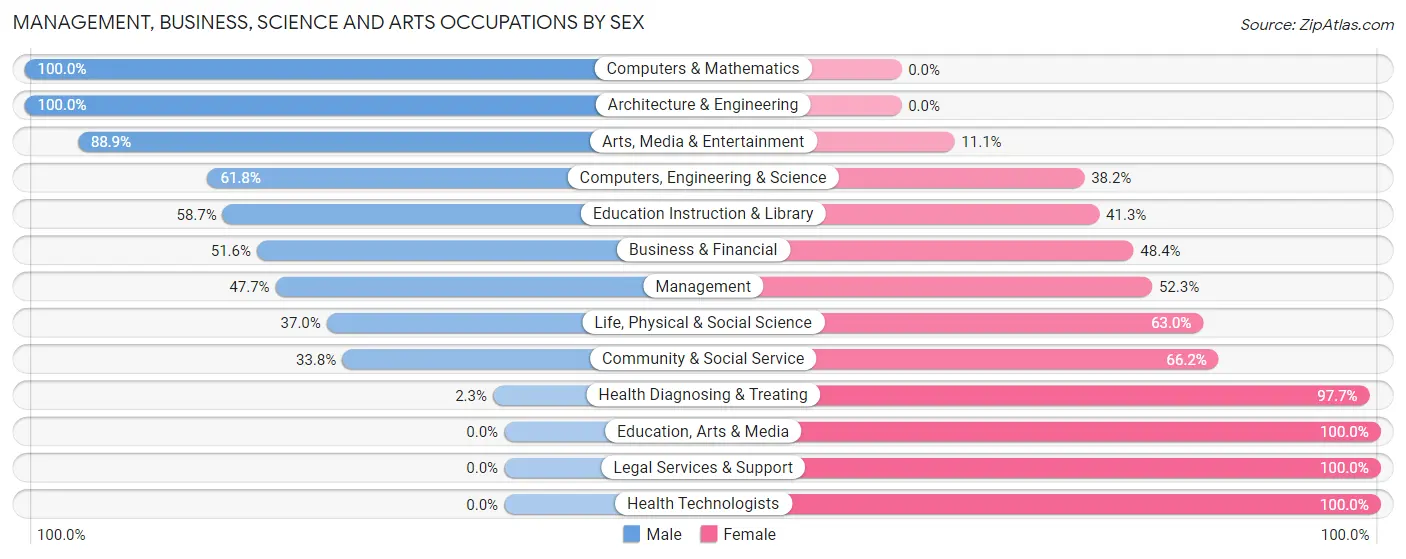
| Occupation | Male | Female |
| Management | 72 (47.7%) | 79 (52.3%) |
| Business & Financial | 33 (51.6%) | 31 (48.4%) |
| Computers, Engineering & Science | 102 (61.8%) | 63 (38.2%) |
| Computers & Mathematics | 18 (100.0%) | 0 (0.0%) |
| Architecture & Engineering | 47 (100.0%) | 0 (0.0%) |
| Life, Physical & Social Science | 37 (37.0%) | 63 (63.0%) |
| Community & Social Service | 75 (33.8%) | 147 (66.2%) |
| Education, Arts & Media | 0 (0.0%) | 121 (100.0%) |
| Legal Services & Support | 0 (0.0%) | 1 (100.0%) |
| Education Instruction & Library | 27 (58.7%) | 19 (41.3%) |
| Arts, Media & Entertainment | 48 (88.9%) | 6 (11.1%) |
| Health Diagnosing & Treating | 4 (2.3%) | 168 (97.7%) |
| Health Technologists | 0 (0.0%) | 37 (100.0%) |
| Total (Category) | 286 (36.9%) | 488 (63.0%) |
| Total (Overall) | 845 (42.8%) | 1,130 (57.2%) |
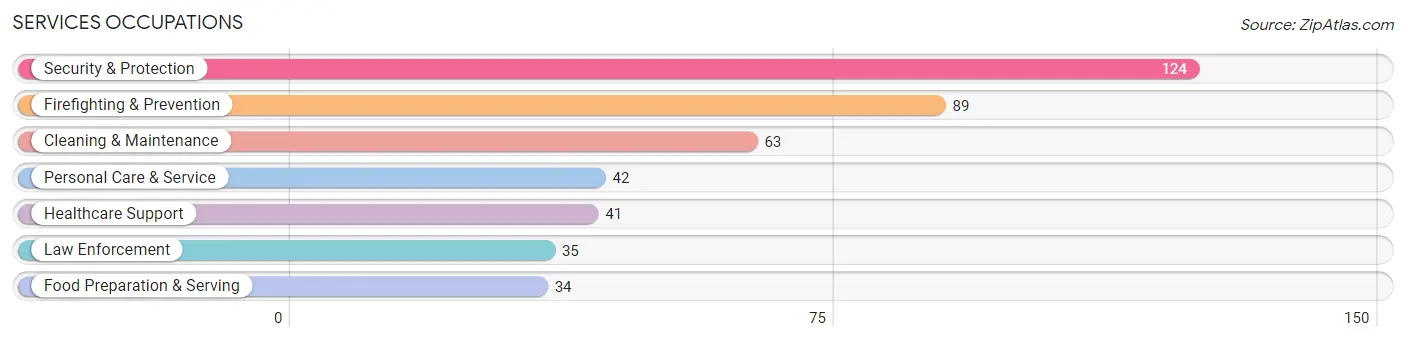
Services Occupations
The most common Services occupations in Monticello are Security & Protection (124 | 6.3%), Firefighting & Prevention (89 | 4.5%), Cleaning & Maintenance (63 | 3.2%), Personal Care & Service (42 | 2.1%), and Healthcare Support (41 | 2.1%).
Services Occupations by Sex
Within the Services occupations in Monticello, the most male-oriented occupations are Law Enforcement (100.0%), Food Preparation & Serving (52.9%), and Security & Protection (36.3%), while the most female-oriented occupations are Cleaning & Maintenance (100.0%), Personal Care & Service (100.0%), and Firefighting & Prevention (88.8%).
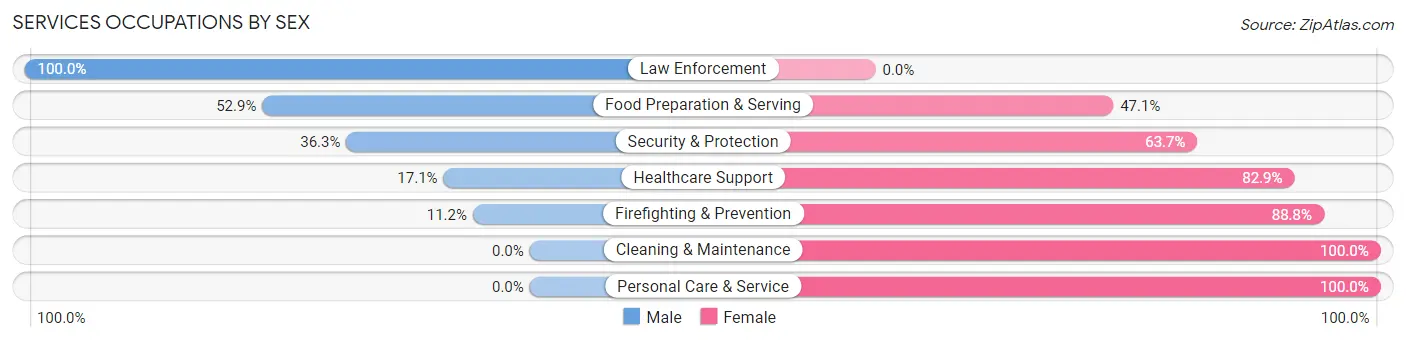
| Occupation | Male | Female |
| Healthcare Support | 7 (17.1%) | 34 (82.9%) |
| Security & Protection | 45 (36.3%) | 79 (63.7%) |
| Firefighting & Prevention | 10 (11.2%) | 79 (88.8%) |
| Law Enforcement | 35 (100.0%) | 0 (0.0%) |
| Food Preparation & Serving | 18 (52.9%) | 16 (47.1%) |
| Cleaning & Maintenance | 0 (0.0%) | 63 (100.0%) |
| Personal Care & Service | 0 (0.0%) | 42 (100.0%) |
| Total (Category) | 70 (23.0%) | 234 (77.0%) |
| Total (Overall) | 845 (42.8%) | 1,130 (57.2%) |
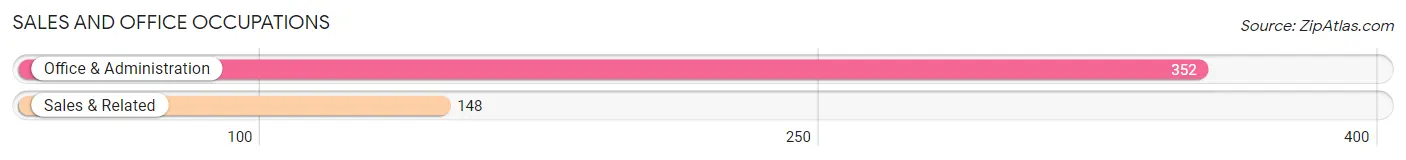
Sales and Office Occupations
The most common Sales and Office occupations in Monticello are Office & Administration (352 | 17.8%), and Sales & Related (148 | 7.5%).
Sales and Office Occupations by Sex
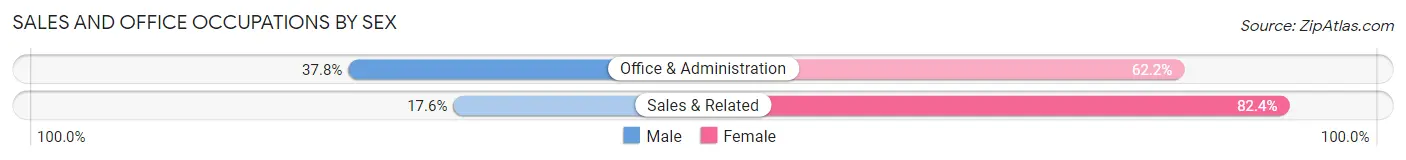
| Occupation | Male | Female |
| Sales & Related | 26 (17.6%) | 122 (82.4%) |
| Office & Administration | 133 (37.8%) | 219 (62.2%) |
| Total (Category) | 159 (31.8%) | 341 (68.2%) |
| Total (Overall) | 845 (42.8%) | 1,130 (57.2%) |
Natural Resources, Construction and Maintenance Occupations
The most common Natural Resources, Construction and Maintenance occupations in Monticello are , and Construction & Extraction (57 | 2.9%).

Natural Resources, Construction and Maintenance Occupations by Sex
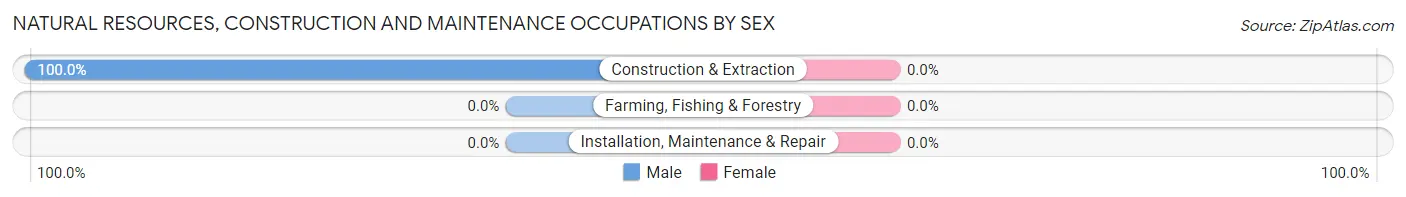
| Occupation | Male | Female |
| Farming, Fishing & Forestry | 0 (0.0%) | 0 (0.0%) |
| Construction & Extraction | 57 (100.0%) | 0 (0.0%) |
| Installation, Maintenance & Repair | 0 (0.0%) | 0 (0.0%) |
| Total (Category) | 57 (100.0%) | 0 (0.0%) |
| Total (Overall) | 845 (42.8%) | 1,130 (57.2%) |
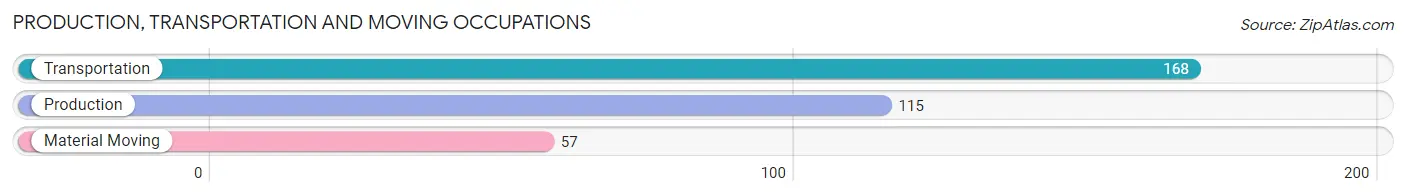
Production, Transportation and Moving Occupations
The most common Production, Transportation and Moving occupations in Monticello are Transportation (168 | 8.5%), Production (115 | 5.8%), and Material Moving (57 | 2.9%).
Production, Transportation and Moving Occupations by Sex
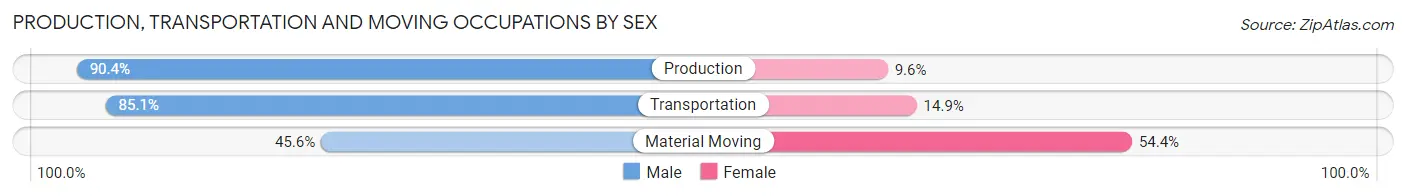
| Occupation | Male | Female |
| Production | 104 (90.4%) | 11 (9.6%) |
| Transportation | 143 (85.1%) | 25 (14.9%) |
| Material Moving | 26 (45.6%) | 31 (54.4%) |
| Total (Category) | 273 (80.3%) | 67 (19.7%) |
| Total (Overall) | 845 (42.8%) | 1,130 (57.2%) |
Employment Industries by Sex in Monticello
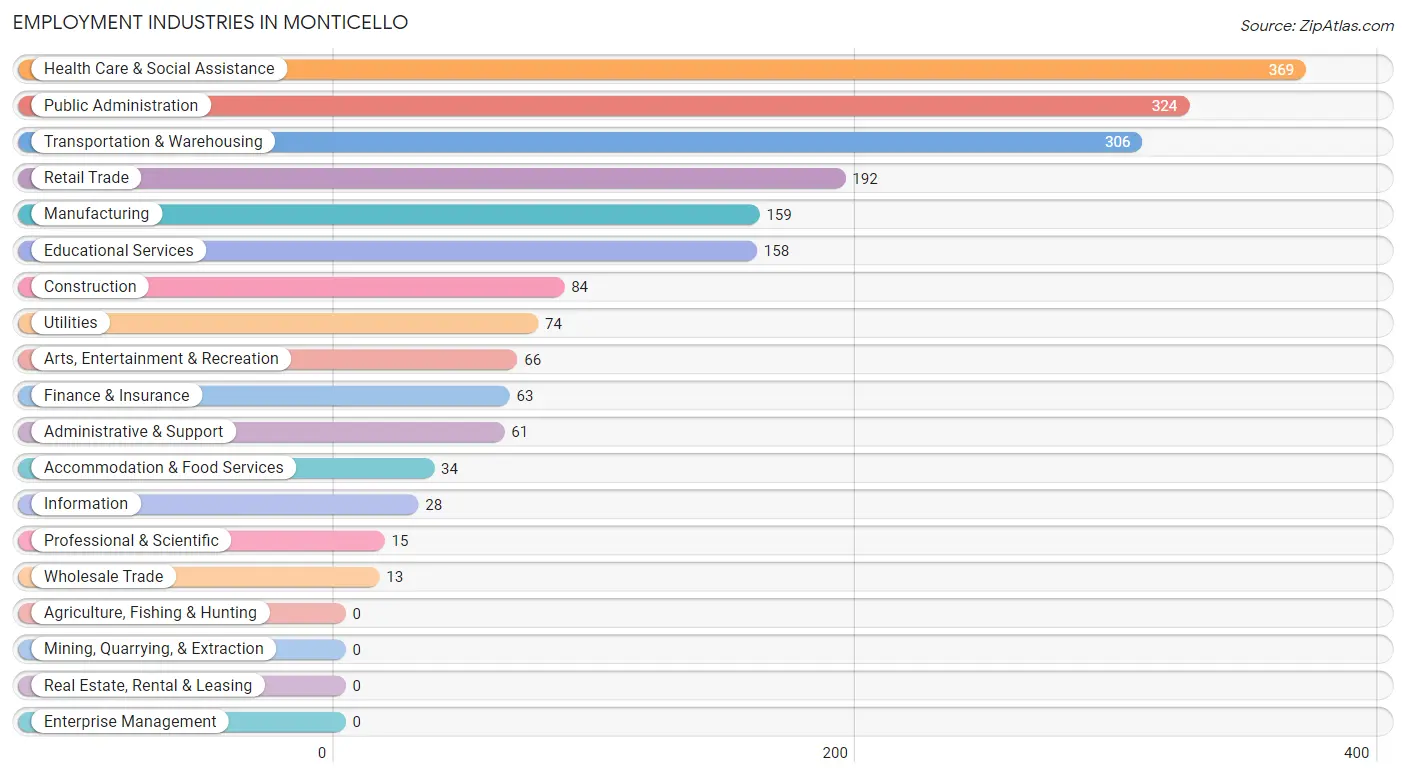
Employment Industries in Monticello
The major employment industries in Monticello include Health Care & Social Assistance (369 | 18.7%), Public Administration (324 | 16.4%), Transportation & Warehousing (306 | 15.5%), Retail Trade (192 | 9.7%), and Manufacturing (159 | 8.1%).
Employment Industries by Sex in Monticello
The Monticello industries that see more men than women are Wholesale Trade (100.0%), Manufacturing (93.1%), and Professional & Scientific (86.7%), whereas the industries that tend to have a higher number of women are Health Care & Social Assistance (97.0%), Information (96.4%), and Administrative & Support (83.6%).
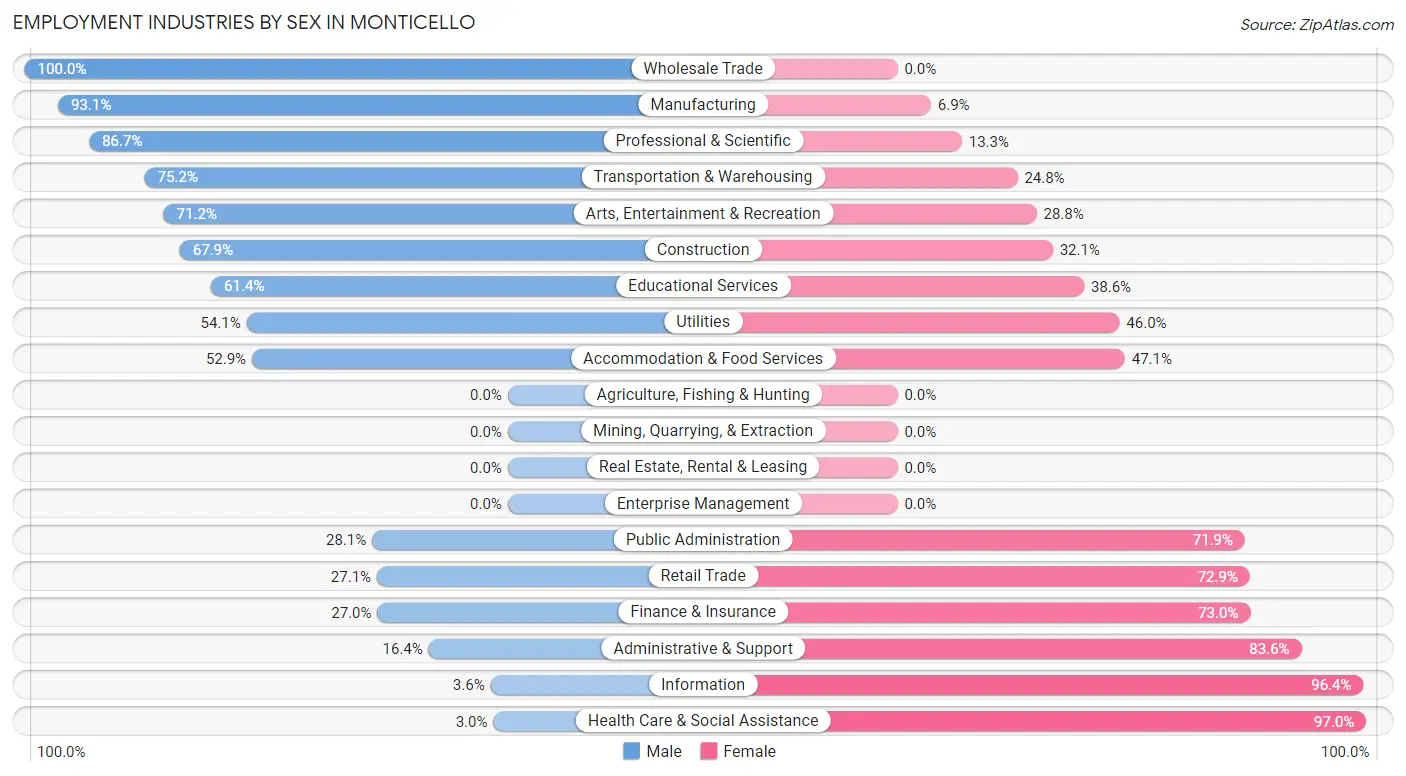
| Industry | Male | Female |
| Agriculture, Fishing & Hunting | 0 (0.0%) | 0 (0.0%) |
| Mining, Quarrying, & Extraction | 0 (0.0%) | 0 (0.0%) |
| Construction | 57 (67.9%) | 27 (32.1%) |
| Manufacturing | 148 (93.1%) | 11 (6.9%) |
| Wholesale Trade | 13 (100.0%) | 0 (0.0%) |
| Retail Trade | 52 (27.1%) | 140 (72.9%) |
| Transportation & Warehousing | 230 (75.2%) | 76 (24.8%) |
| Utilities | 40 (54.0%) | 34 (46.0%) |
| Information | 1 (3.6%) | 27 (96.4%) |
| Finance & Insurance | 17 (27.0%) | 46 (73.0%) |
| Real Estate, Rental & Leasing | 0 (0.0%) | 0 (0.0%) |
| Professional & Scientific | 13 (86.7%) | 2 (13.3%) |
| Enterprise Management | 0 (0.0%) | 0 (0.0%) |
| Administrative & Support | 10 (16.4%) | 51 (83.6%) |
| Educational Services | 97 (61.4%) | 61 (38.6%) |
| Health Care & Social Assistance | 11 (3.0%) | 358 (97.0%) |
| Arts, Entertainment & Recreation | 47 (71.2%) | 19 (28.8%) |
| Accommodation & Food Services | 18 (52.9%) | 16 (47.1%) |
| Public Administration | 91 (28.1%) | 233 (71.9%) |
| Total | 845 (42.8%) | 1,130 (57.2%) |
Education in Monticello
School Enrollment in Monticello
The most common levels of schooling among the 1,546 students in Monticello are middle school (508 | 32.9%), high school (426 | 27.6%), and elementary school (313 | 20.3%).
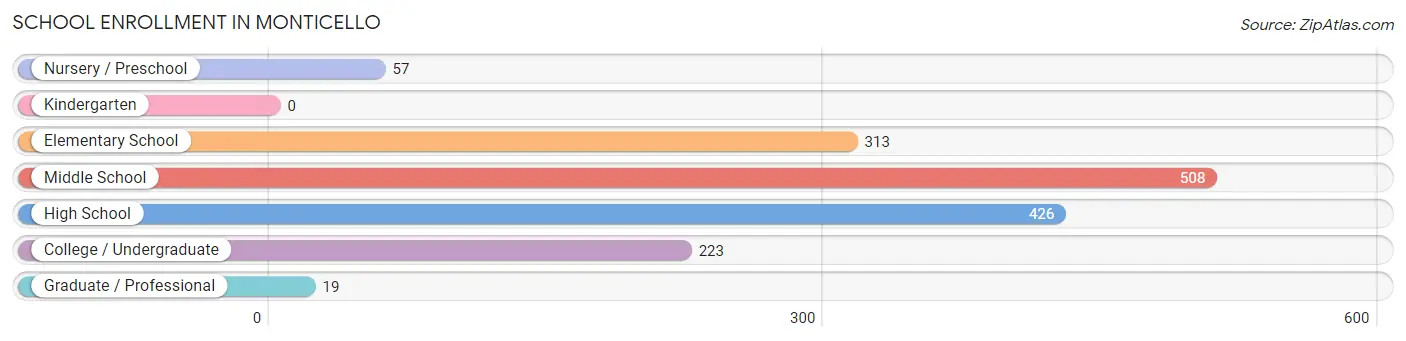
| School Level | # Students | % Students |
| Nursery / Preschool | 57 | 3.7% |
| Kindergarten | 0 | 0.0% |
| Elementary School | 313 | 20.3% |
| Middle School | 508 | 32.9% |
| High School | 426 | 27.6% |
| College / Undergraduate | 223 | 14.4% |
| Graduate / Professional | 19 | 1.2% |
| Total | 1,546 | 100.0% |
School Enrollment by Age by Funding Source in Monticello
Out of a total of 1,546 students who are enrolled in schools in Monticello, 113 (7.3%) attend a private institution, while the remaining 1,433 (92.7%) are enrolled in public schools. The age group of 15 to 17 year olds has the highest likelihood of being enrolled in private schools, with 68 (47.5% in the age bracket) enrolled. Conversely, the age group of 3 to 4 year olds has the lowest likelihood of being enrolled in a private school, with 57 (100.0% in the age bracket) attending a public institution.
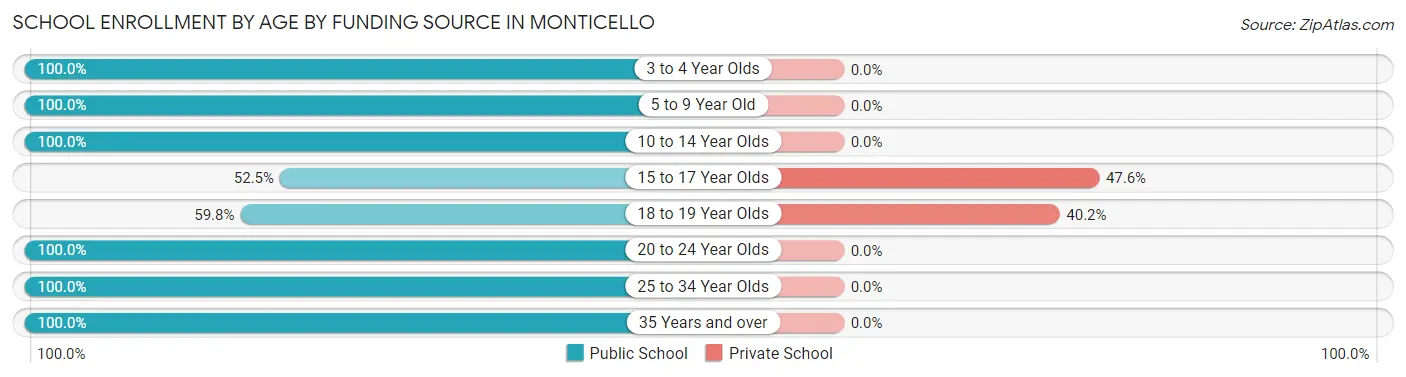
| Age Bracket | Public School | Private School |
| 3 to 4 Year Olds | 57 (100.0%) | 0 (0.0%) |
| 5 to 9 Year Old | 277 (100.0%) | 0 (0.0%) |
| 10 to 14 Year Olds | 703 (100.0%) | 0 (0.0%) |
| 15 to 17 Year Olds | 75 (52.4%) | 68 (47.5%) |
| 18 to 19 Year Olds | 67 (59.8%) | 45 (40.2%) |
| 20 to 24 Year Olds | 176 (100.0%) | 0 (0.0%) |
| 25 to 34 Year Olds | 29 (100.0%) | 0 (0.0%) |
| 35 Years and over | 49 (100.0%) | 0 (0.0%) |
| Total | 1,433 (92.7%) | 113 (7.3%) |
Educational Attainment by Field of Study in Monticello
Business (260 | 28.8%), education (115 | 12.8%), psychology (114 | 12.6%), bio, nature & agricultural (79 | 8.8%), and computers & mathematics (74 | 8.2%) are the most common fields of study among 902 individuals in Monticello who have obtained a bachelor's degree or higher.
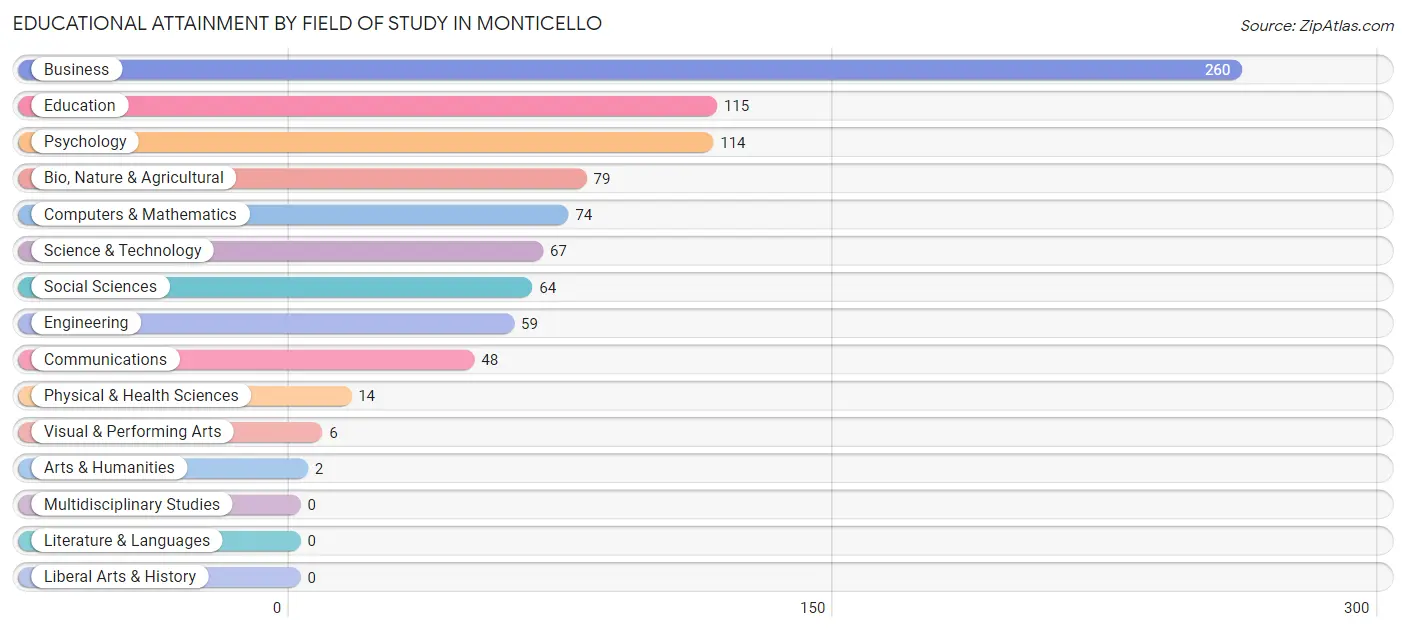
| Field of Study | # Graduates | % Graduates |
| Computers & Mathematics | 74 | 8.2% |
| Bio, Nature & Agricultural | 79 | 8.8% |
| Physical & Health Sciences | 14 | 1.5% |
| Psychology | 114 | 12.6% |
| Social Sciences | 64 | 7.1% |
| Engineering | 59 | 6.5% |
| Multidisciplinary Studies | 0 | 0.0% |
| Science & Technology | 67 | 7.4% |
| Business | 260 | 28.8% |
| Education | 115 | 12.8% |
| Literature & Languages | 0 | 0.0% |
| Liberal Arts & History | 0 | 0.0% |
| Visual & Performing Arts | 6 | 0.7% |
| Communications | 48 | 5.3% |
| Arts & Humanities | 2 | 0.2% |
| Total | 902 | 100.0% |
Transportation & Commute in Monticello
Vehicle Availability by Sex in Monticello
The most prevalent vehicle ownership categories in Monticello are males with 1 vehicle (236, accounting for 29.1%) and females with 1 vehicle (419, making up 20.9%).
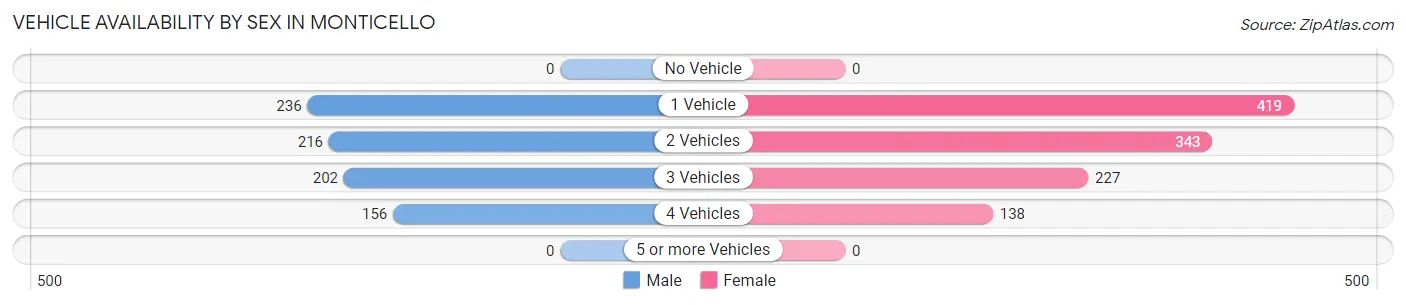
| Vehicles Available | Male | Female |
| No Vehicle | 0 (0.0%) | 0 (0.0%) |
| 1 Vehicle | 236 (29.1%) | 419 (37.2%) |
| 2 Vehicles | 216 (26.7%) | 343 (30.4%) |
| 3 Vehicles | 202 (24.9%) | 227 (20.1%) |
| 4 Vehicles | 156 (19.3%) | 138 (12.2%) |
| 5 or more Vehicles | 0 (0.0%) | 0 (0.0%) |
| Total | 810 (100.0%) | 1,127 (100.0%) |
Commute Time in Monticello
The most frequently occuring commute durations in Monticello are 30 to 34 minutes (433 commuters, 22.5%), 15 to 19 minutes (345 commuters, 18.0%), and 25 to 29 minutes (294 commuters, 15.3%).
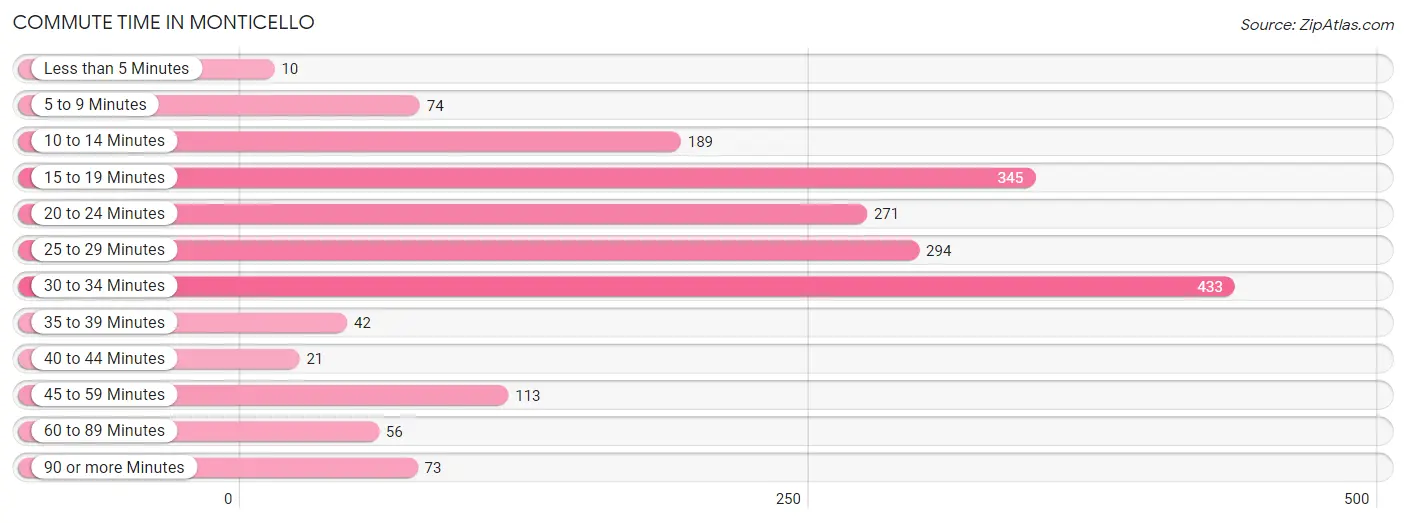
| Commute Time | # Commuters | % Commuters |
| Less than 5 Minutes | 10 | 0.5% |
| 5 to 9 Minutes | 74 | 3.8% |
| 10 to 14 Minutes | 189 | 9.8% |
| 15 to 19 Minutes | 345 | 18.0% |
| 20 to 24 Minutes | 271 | 14.1% |
| 25 to 29 Minutes | 294 | 15.3% |
| 30 to 34 Minutes | 433 | 22.5% |
| 35 to 39 Minutes | 42 | 2.2% |
| 40 to 44 Minutes | 21 | 1.1% |
| 45 to 59 Minutes | 113 | 5.9% |
| 60 to 89 Minutes | 56 | 2.9% |
| 90 or more Minutes | 73 | 3.8% |
Commute Time by Sex in Monticello
The most common commute times in Monticello are 20 to 24 minutes (187 commuters, 23.1%) for males and 30 to 34 minutes (284 commuters, 25.6%) for females.
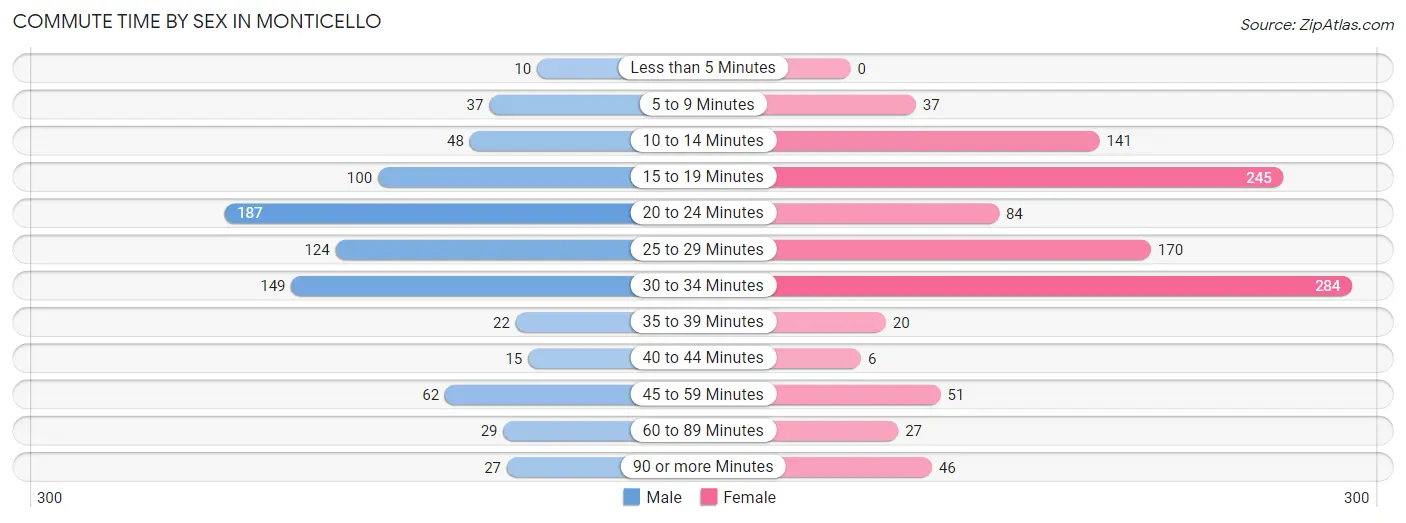
| Commute Time | Male | Female |
| Less than 5 Minutes | 10 (1.2%) | 0 (0.0%) |
| 5 to 9 Minutes | 37 (4.6%) | 37 (3.3%) |
| 10 to 14 Minutes | 48 (5.9%) | 141 (12.7%) |
| 15 to 19 Minutes | 100 (12.3%) | 245 (22.1%) |
| 20 to 24 Minutes | 187 (23.1%) | 84 (7.6%) |
| 25 to 29 Minutes | 124 (15.3%) | 170 (15.3%) |
| 30 to 34 Minutes | 149 (18.4%) | 284 (25.6%) |
| 35 to 39 Minutes | 22 (2.7%) | 20 (1.8%) |
| 40 to 44 Minutes | 15 (1.8%) | 6 (0.5%) |
| 45 to 59 Minutes | 62 (7.6%) | 51 (4.6%) |
| 60 to 89 Minutes | 29 (3.6%) | 27 (2.4%) |
| 90 or more Minutes | 27 (3.3%) | 46 (4.1%) |
Time of Departure to Work by Sex in Monticello
The most frequent times of departure to work in Monticello are 12:00 AM to 4:59 AM (140, 17.3%) for males and 7:30 AM to 7:59 AM (291, 26.2%) for females.
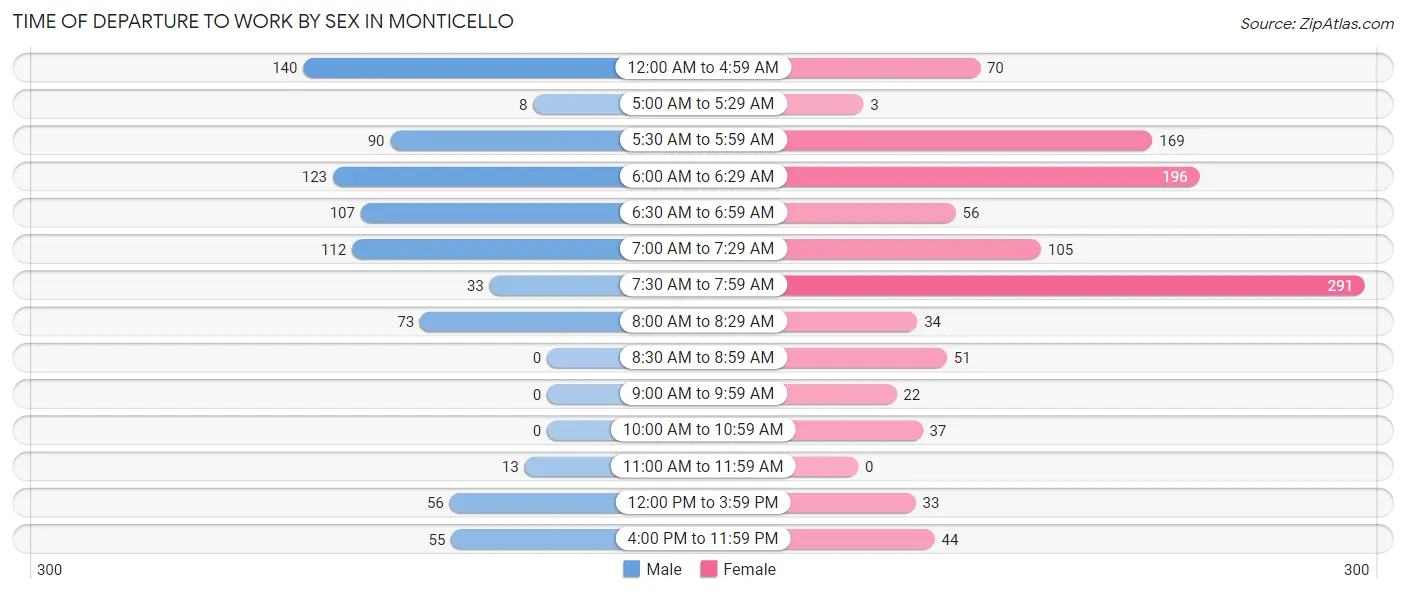
| Time of Departure | Male | Female |
| 12:00 AM to 4:59 AM | 140 (17.3%) | 70 (6.3%) |
| 5:00 AM to 5:29 AM | 8 (1.0%) | 3 (0.3%) |
| 5:30 AM to 5:59 AM | 90 (11.1%) | 169 (15.2%) |
| 6:00 AM to 6:29 AM | 123 (15.2%) | 196 (17.6%) |
| 6:30 AM to 6:59 AM | 107 (13.2%) | 56 (5.0%) |
| 7:00 AM to 7:29 AM | 112 (13.8%) | 105 (9.5%) |
| 7:30 AM to 7:59 AM | 33 (4.1%) | 291 (26.2%) |
| 8:00 AM to 8:29 AM | 73 (9.0%) | 34 (3.1%) |
| 8:30 AM to 8:59 AM | 0 (0.0%) | 51 (4.6%) |
| 9:00 AM to 9:59 AM | 0 (0.0%) | 22 (2.0%) |
| 10:00 AM to 10:59 AM | 0 (0.0%) | 37 (3.3%) |
| 11:00 AM to 11:59 AM | 13 (1.6%) | 0 (0.0%) |
| 12:00 PM to 3:59 PM | 56 (6.9%) | 33 (3.0%) |
| 4:00 PM to 11:59 PM | 55 (6.8%) | 44 (4.0%) |
| Total | 810 (100.0%) | 1,111 (100.0%) |
Housing Occupancy in Monticello
Occupancy by Ownership in Monticello
Of the total 1,621 dwellings in Monticello, owner-occupied units account for 1,311 (80.9%), while renter-occupied units make up 310 (19.1%).
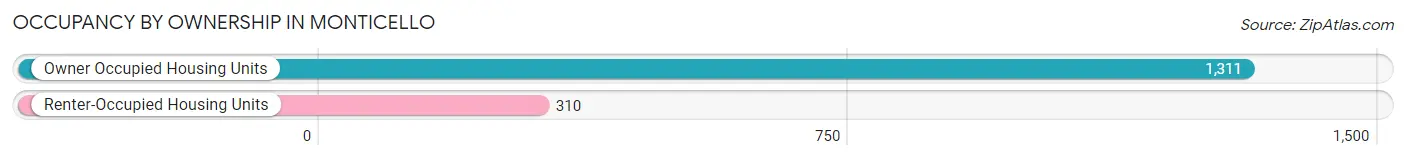
| Occupancy | # Housing Units | % Housing Units |
| Owner Occupied Housing Units | 1,311 | 80.9% |
| Renter-Occupied Housing Units | 310 | 19.1% |
| Total Occupied Housing Units | 1,621 | 100.0% |
Occupancy by Household Size in Monticello
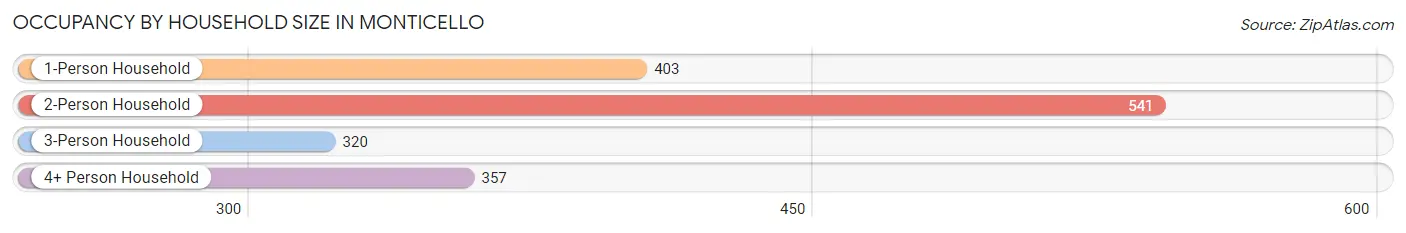
| Household Size | # Housing Units | % Housing Units |
| 1-Person Household | 403 | 24.9% |
| 2-Person Household | 541 | 33.4% |
| 3-Person Household | 320 | 19.7% |
| 4+ Person Household | 357 | 22.0% |
| Total Housing Units | 1,621 | 100.0% |
Occupancy by Ownership by Household Size in Monticello
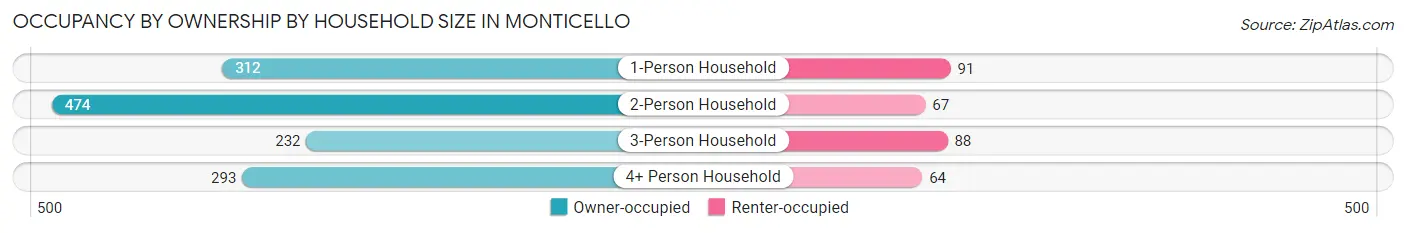
| Household Size | Owner-occupied | Renter-occupied |
| 1-Person Household | 312 (77.4%) | 91 (22.6%) |
| 2-Person Household | 474 (87.6%) | 67 (12.4%) |
| 3-Person Household | 232 (72.5%) | 88 (27.5%) |
| 4+ Person Household | 293 (82.1%) | 64 (17.9%) |
| Total Housing Units | 1,311 (80.9%) | 310 (19.1%) |
Occupancy by Educational Attainment in Monticello
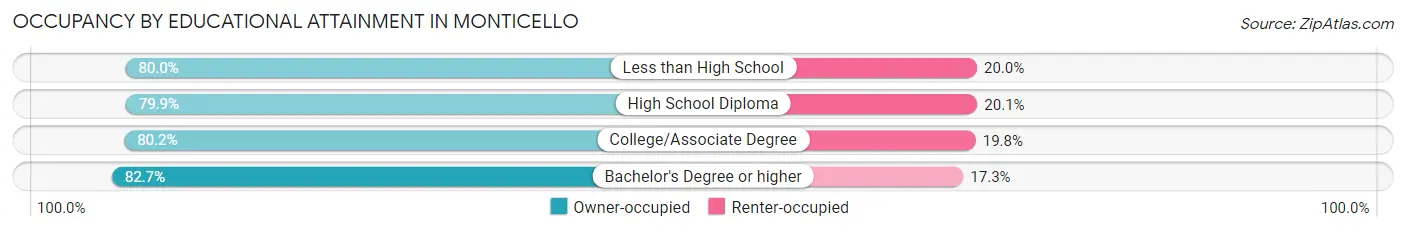
| Household Size | Owner-occupied | Renter-occupied |
| Less than High School | 40 (80.0%) | 10 (20.0%) |
| High School Diploma | 466 (79.9%) | 117 (20.1%) |
| College/Associate Degree | 394 (80.2%) | 97 (19.8%) |
| Bachelor's Degree or higher | 411 (82.7%) | 86 (17.3%) |
Occupancy by Age of Householder in Monticello
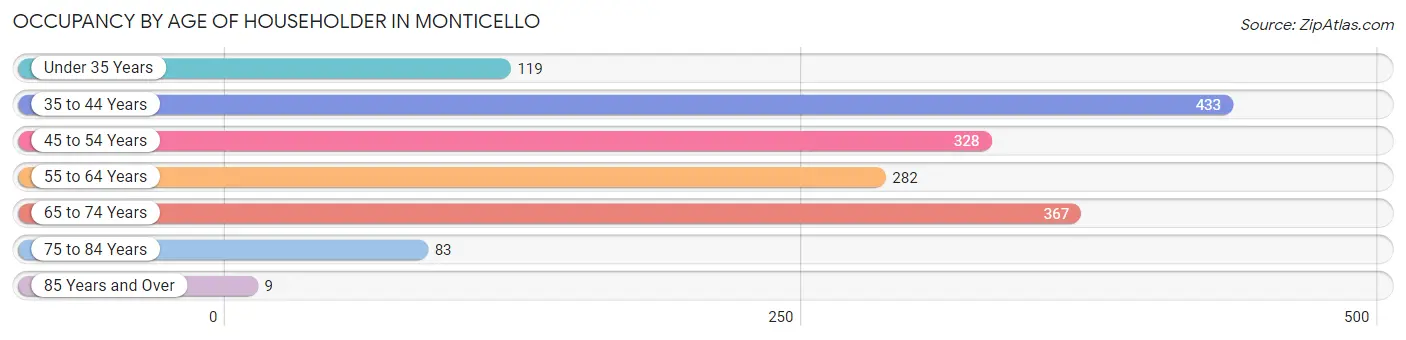
| Age Bracket | # Households | % Households |
| Under 35 Years | 119 | 7.3% |
| 35 to 44 Years | 433 | 26.7% |
| 45 to 54 Years | 328 | 20.2% |
| 55 to 64 Years | 282 | 17.4% |
| 65 to 74 Years | 367 | 22.6% |
| 75 to 84 Years | 83 | 5.1% |
| 85 Years and Over | 9 | 0.6% |
| Total | 1,621 | 100.0% |
Housing Finances in Monticello
Median Income by Occupancy in Monticello
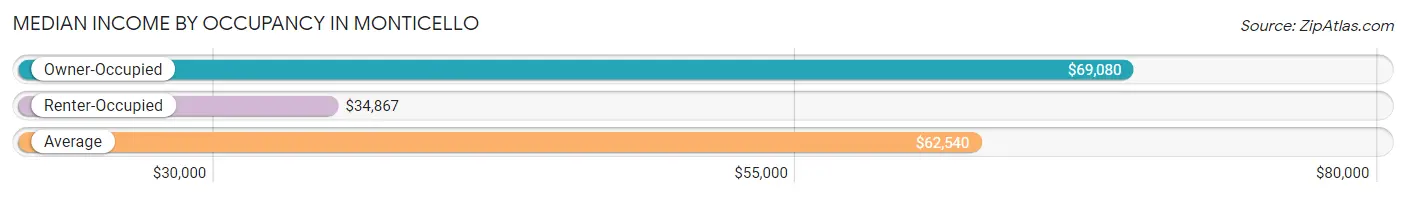
| Occupancy Type | # Households | Median Income |
| Owner-Occupied | 1,311 (80.9%) | $69,080 |
| Renter-Occupied | 310 (19.1%) | $34,867 |
| Average | 1,621 (100.0%) | $62,540 |
Occupancy by Householder Income Bracket in Monticello
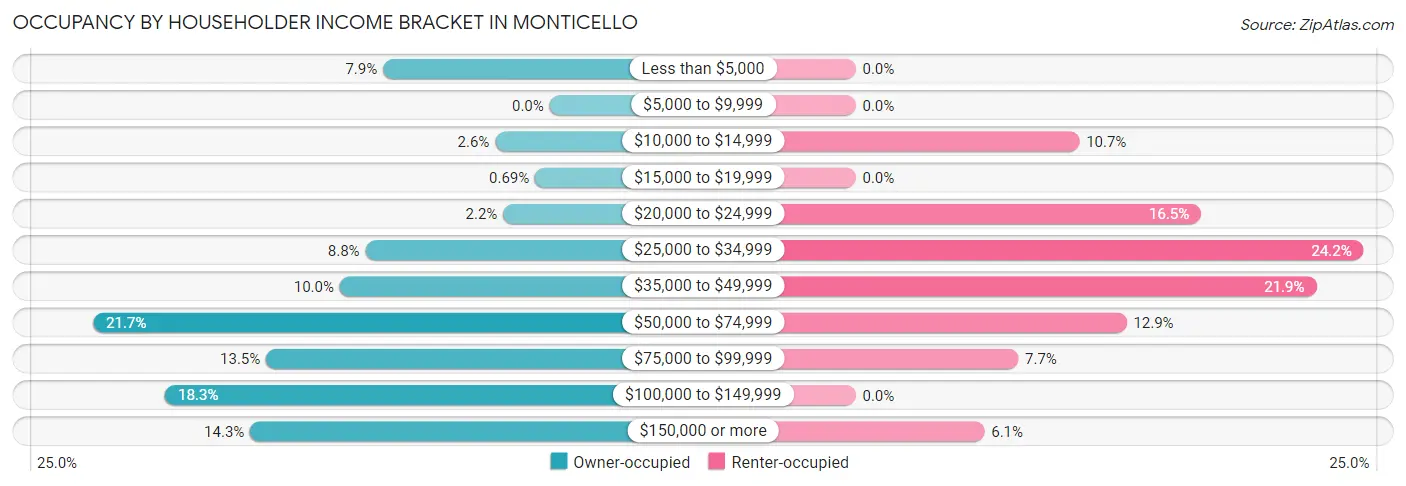
| Income Bracket | Owner-occupied | Renter-occupied |
| Less than $5,000 | 104 (7.9%) | 0 (0.0%) |
| $5,000 to $9,999 | 0 (0.0%) | 0 (0.0%) |
| $10,000 to $14,999 | 34 (2.6%) | 33 (10.6%) |
| $15,000 to $19,999 | 9 (0.7%) | 0 (0.0%) |
| $20,000 to $24,999 | 29 (2.2%) | 51 (16.5%) |
| $25,000 to $34,999 | 115 (8.8%) | 75 (24.2%) |
| $35,000 to $49,999 | 131 (10.0%) | 68 (21.9%) |
| $50,000 to $74,999 | 285 (21.7%) | 40 (12.9%) |
| $75,000 to $99,999 | 177 (13.5%) | 24 (7.7%) |
| $100,000 to $149,999 | 240 (18.3%) | 0 (0.0%) |
| $150,000 or more | 187 (14.3%) | 19 (6.1%) |
| Total | 1,311 (100.0%) | 310 (100.0%) |
Monthly Housing Cost Tiers in Monticello
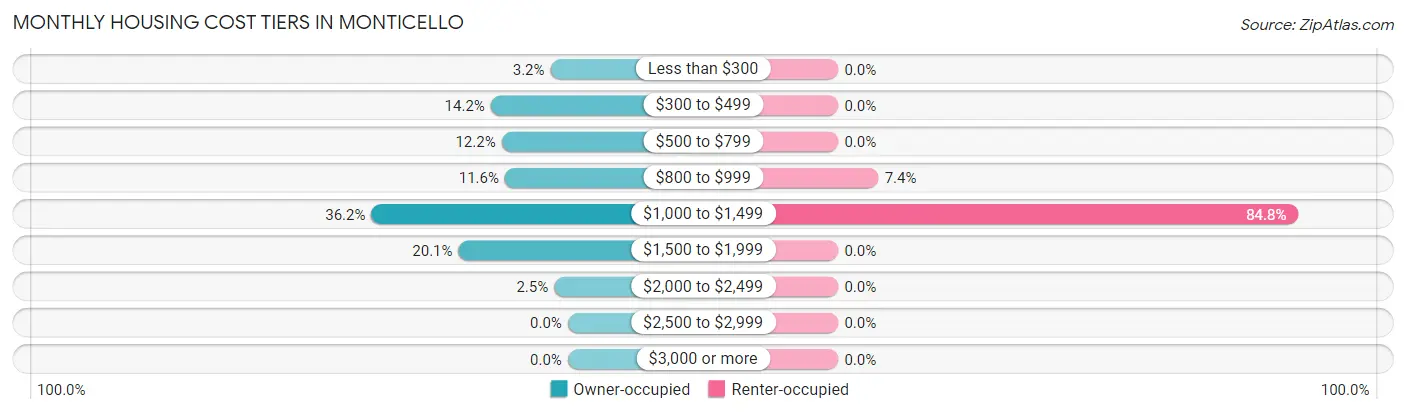
| Monthly Cost | Owner-occupied | Renter-occupied |
| Less than $300 | 42 (3.2%) | 0 (0.0%) |
| $300 to $499 | 186 (14.2%) | 0 (0.0%) |
| $500 to $799 | 160 (12.2%) | 0 (0.0%) |
| $800 to $999 | 152 (11.6%) | 23 (7.4%) |
| $1,000 to $1,499 | 474 (36.2%) | 263 (84.8%) |
| $1,500 to $1,999 | 264 (20.1%) | 0 (0.0%) |
| $2,000 to $2,499 | 33 (2.5%) | 0 (0.0%) |
| $2,500 to $2,999 | 0 (0.0%) | 0 (0.0%) |
| $3,000 or more | 0 (0.0%) | 0 (0.0%) |
| Total | 1,311 (100.0%) | 310 (100.0%) |
Physical Housing Characteristics in Monticello
Housing Structures in Monticello
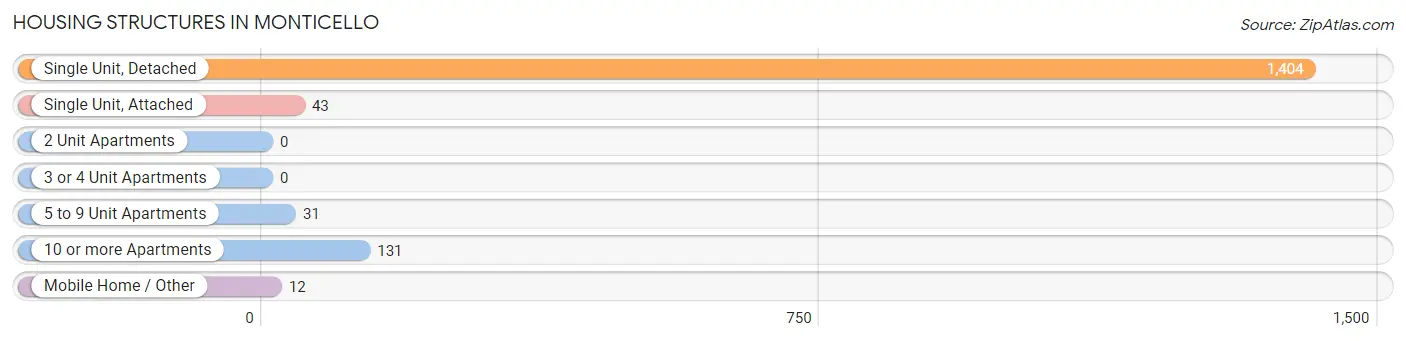
| Structure Type | # Housing Units | % Housing Units |
| Single Unit, Detached | 1,404 | 86.6% |
| Single Unit, Attached | 43 | 2.6% |
| 2 Unit Apartments | 0 | 0.0% |
| 3 or 4 Unit Apartments | 0 | 0.0% |
| 5 to 9 Unit Apartments | 31 | 1.9% |
| 10 or more Apartments | 131 | 8.1% |
| Mobile Home / Other | 12 | 0.7% |
| Total | 1,621 | 100.0% |
Housing Structures by Occupancy in Monticello
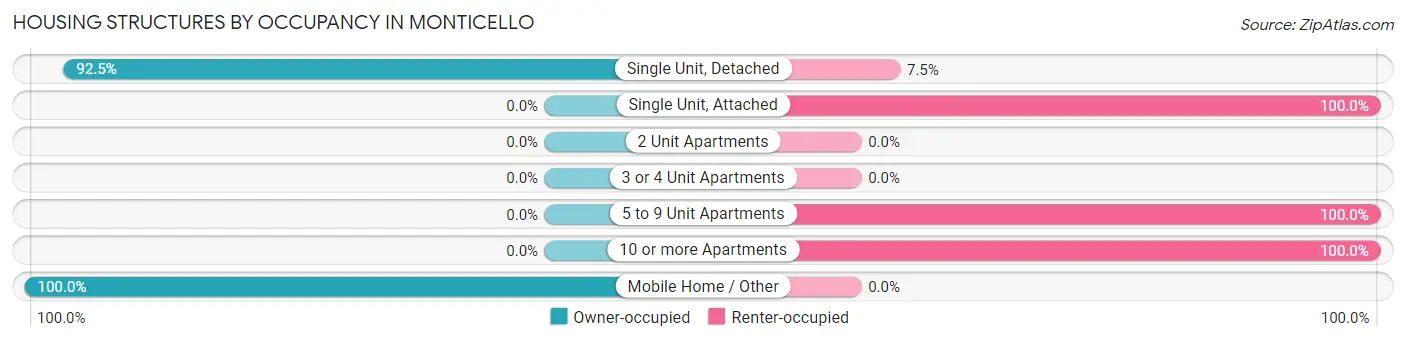
| Structure Type | Owner-occupied | Renter-occupied |
| Single Unit, Detached | 1,299 (92.5%) | 105 (7.5%) |
| Single Unit, Attached | 0 (0.0%) | 43 (100.0%) |
| 2 Unit Apartments | 0 (0.0%) | 0 (0.0%) |
| 3 or 4 Unit Apartments | 0 (0.0%) | 0 (0.0%) |
| 5 to 9 Unit Apartments | 0 (0.0%) | 31 (100.0%) |
| 10 or more Apartments | 0 (0.0%) | 131 (100.0%) |
| Mobile Home / Other | 12 (100.0%) | 0 (0.0%) |
| Total | 1,311 (80.9%) | 310 (19.1%) |
Housing Structures by Number of Rooms in Monticello
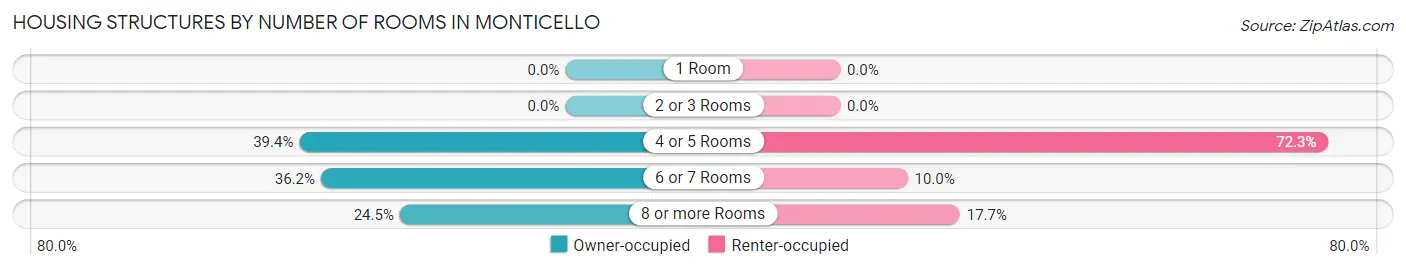
| Number of Rooms | Owner-occupied | Renter-occupied |
| 1 Room | 0 (0.0%) | 0 (0.0%) |
| 2 or 3 Rooms | 0 (0.0%) | 0 (0.0%) |
| 4 or 5 Rooms | 516 (39.4%) | 224 (72.3%) |
| 6 or 7 Rooms | 474 (36.2%) | 31 (10.0%) |
| 8 or more Rooms | 321 (24.5%) | 55 (17.7%) |
| Total | 1,311 (100.0%) | 310 (100.0%) |
Housing Structure by Heating Type in Monticello
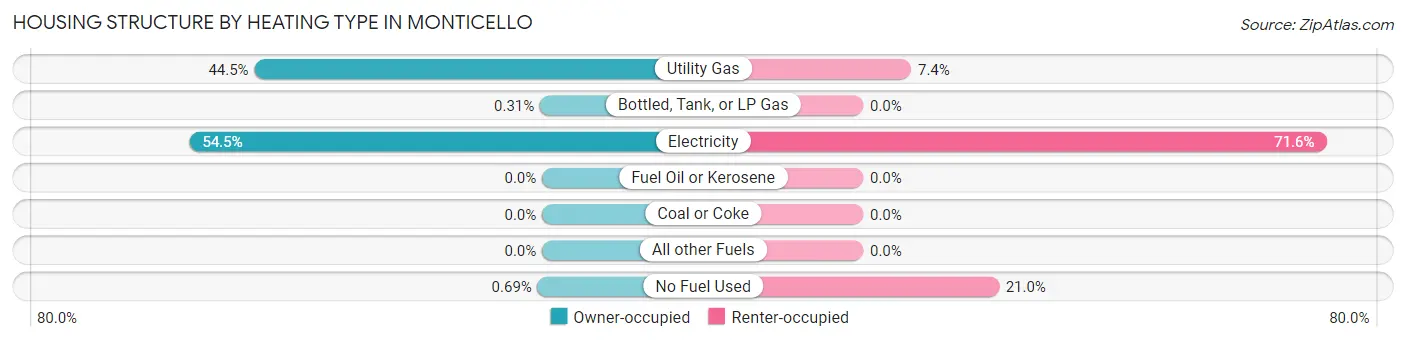
| Heating Type | Owner-occupied | Renter-occupied |
| Utility Gas | 583 (44.5%) | 23 (7.4%) |
| Bottled, Tank, or LP Gas | 4 (0.3%) | 0 (0.0%) |
| Electricity | 715 (54.5%) | 222 (71.6%) |
| Fuel Oil or Kerosene | 0 (0.0%) | 0 (0.0%) |
| Coal or Coke | 0 (0.0%) | 0 (0.0%) |
| All other Fuels | 0 (0.0%) | 0 (0.0%) |
| No Fuel Used | 9 (0.7%) | 65 (21.0%) |
| Total | 1,311 (100.0%) | 310 (100.0%) |
Household Vehicle Usage in Monticello
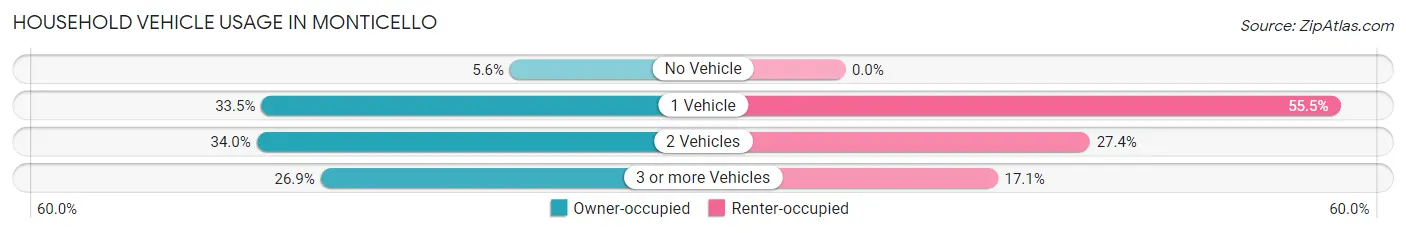
| Vehicles per Household | Owner-occupied | Renter-occupied |
| No Vehicle | 74 (5.6%) | 0 (0.0%) |
| 1 Vehicle | 439 (33.5%) | 172 (55.5%) |
| 2 Vehicles | 446 (34.0%) | 85 (27.4%) |
| 3 or more Vehicles | 352 (26.9%) | 53 (17.1%) |
| Total | 1,311 (100.0%) | 310 (100.0%) |
Real Estate & Mortgages in Monticello
Real Estate and Mortgage Overview in Monticello
| Characteristic | Without Mortgage | With Mortgage |
| Housing Units | 327 | 984 |
| Median Property Value | $183,400 | $163,700 |
| Median Household Income | $106,513 | $120 |
| Monthly Housing Costs | $429 | $0 |
| Real Estate Taxes | $1,054 | $47 |
Property Value by Mortgage Status in Monticello
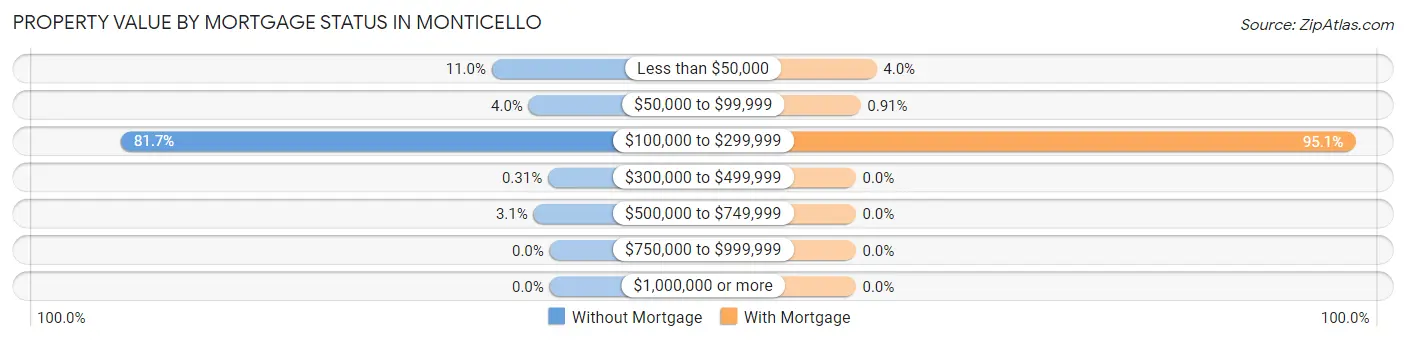
| Property Value | Without Mortgage | With Mortgage |
| Less than $50,000 | 36 (11.0%) | 39 (4.0%) |
| $50,000 to $99,999 | 13 (4.0%) | 9 (0.9%) |
| $100,000 to $299,999 | 267 (81.7%) | 936 (95.1%) |
| $300,000 to $499,999 | 1 (0.3%) | 0 (0.0%) |
| $500,000 to $749,999 | 10 (3.1%) | 0 (0.0%) |
| $750,000 to $999,999 | 0 (0.0%) | 0 (0.0%) |
| $1,000,000 or more | 0 (0.0%) | 0 (0.0%) |
| Total | 327 (100.0%) | 984 (100.0%) |
Household Income by Mortgage Status in Monticello
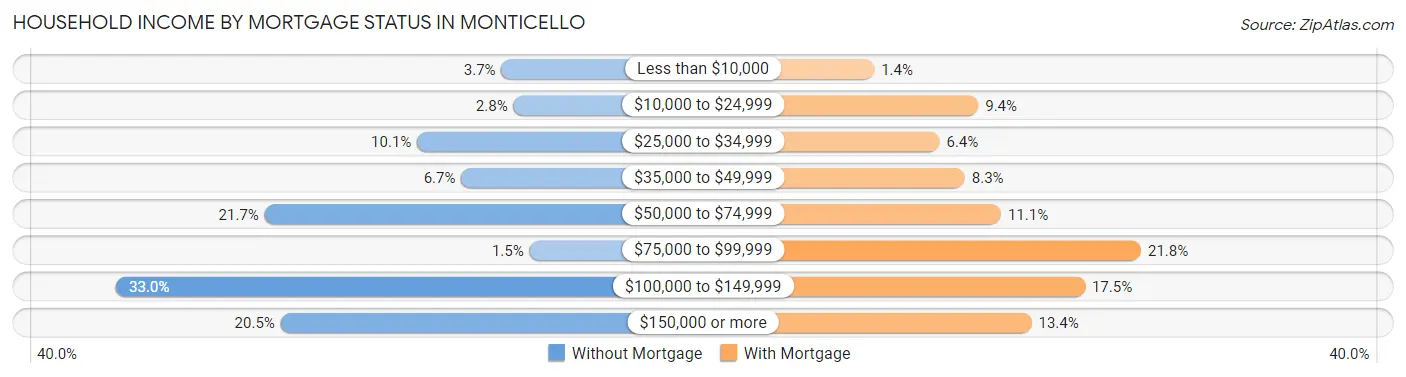
| Household Income | Without Mortgage | With Mortgage |
| Less than $10,000 | 12 (3.7%) | 14 (1.4%) |
| $10,000 to $24,999 | 9 (2.8%) | 92 (9.3%) |
| $25,000 to $34,999 | 33 (10.1%) | 63 (6.4%) |
| $35,000 to $49,999 | 22 (6.7%) | 82 (8.3%) |
| $50,000 to $74,999 | 71 (21.7%) | 109 (11.1%) |
| $75,000 to $99,999 | 5 (1.5%) | 214 (21.7%) |
| $100,000 to $149,999 | 108 (33.0%) | 172 (17.5%) |
| $150,000 or more | 67 (20.5%) | 132 (13.4%) |
| Total | 327 (100.0%) | 984 (100.0%) |
Property Value to Household Income Ratio in Monticello
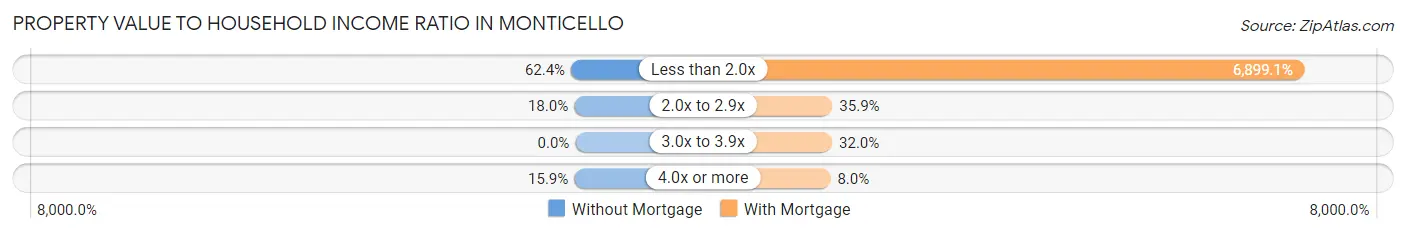
| Value-to-Income Ratio | Without Mortgage | With Mortgage |
| Less than 2.0x | 204 (62.4%) | 67,887 (6,899.1%) |
| 2.0x to 2.9x | 59 (18.0%) | 353 (35.9%) |
| 3.0x to 3.9x | 0 (0.0%) | 315 (32.0%) |
| 4.0x or more | 52 (15.9%) | 79 (8.0%) |
| Total | 327 (100.0%) | 984 (100.0%) |
Real Estate Taxes by Mortgage Status in Monticello
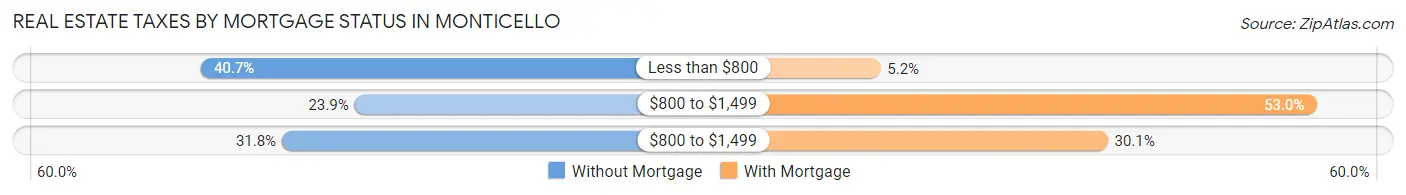
| Property Taxes | Without Mortgage | With Mortgage |
| Less than $800 | 133 (40.7%) | 51 (5.2%) |
| $800 to $1,499 | 78 (23.8%) | 521 (52.9%) |
| $800 to $1,499 | 104 (31.8%) | 296 (30.1%) |
| Total | 327 (100.0%) | 984 (100.0%) |
Health & Disability in Monticello
Health Insurance Coverage by Age in Monticello
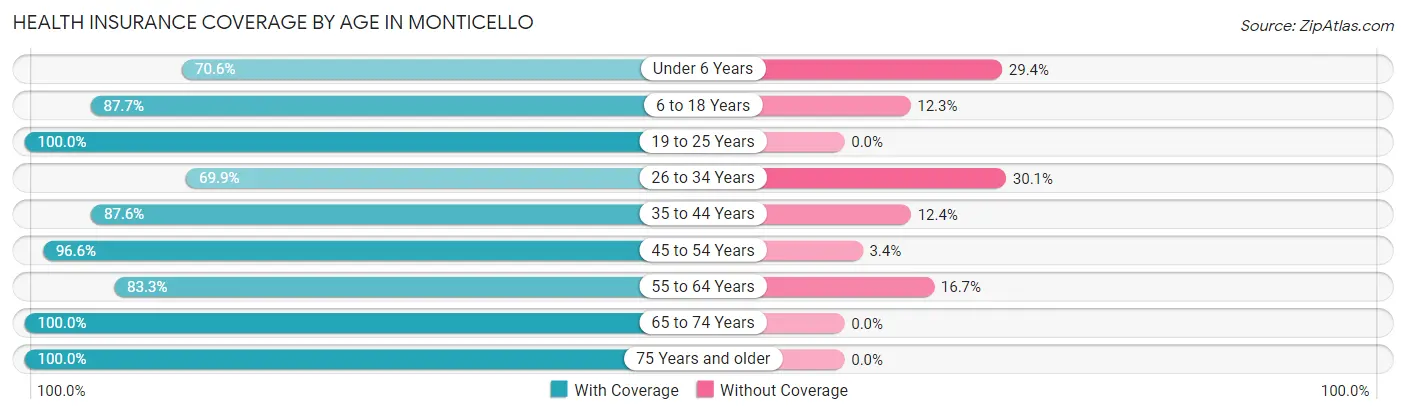
| Age Bracket | With Coverage | Without Coverage |
| Under 6 Years | 137 (70.6%) | 57 (29.4%) |
| 6 to 18 Years | 1,133 (87.7%) | 159 (12.3%) |
| 19 to 25 Years | 503 (100.0%) | 0 (0.0%) |
| 26 to 34 Years | 218 (69.9%) | 94 (30.1%) |
| 35 to 44 Years | 637 (87.6%) | 90 (12.4%) |
| 45 to 54 Years | 571 (96.6%) | 20 (3.4%) |
| 55 to 64 Years | 379 (83.3%) | 76 (16.7%) |
| 65 to 74 Years | 567 (100.0%) | 0 (0.0%) |
| 75 Years and older | 126 (100.0%) | 0 (0.0%) |
| Total | 4,271 (89.6%) | 496 (10.4%) |
Health Insurance Coverage by Citizenship Status in Monticello
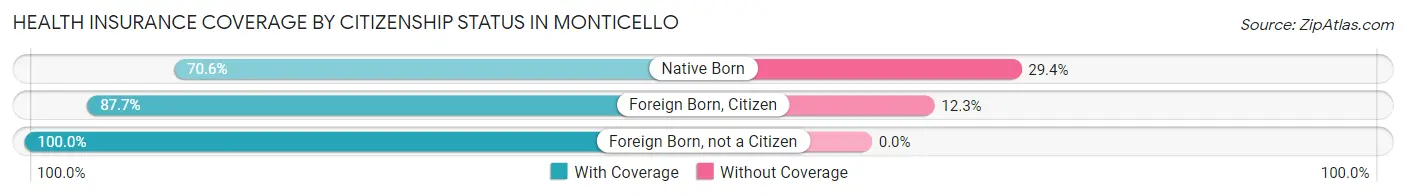
| Citizenship Status | With Coverage | Without Coverage |
| Native Born | 137 (70.6%) | 57 (29.4%) |
| Foreign Born, Citizen | 1,133 (87.7%) | 159 (12.3%) |
| Foreign Born, not a Citizen | 503 (100.0%) | 0 (0.0%) |
Health Insurance Coverage by Household Income in Monticello
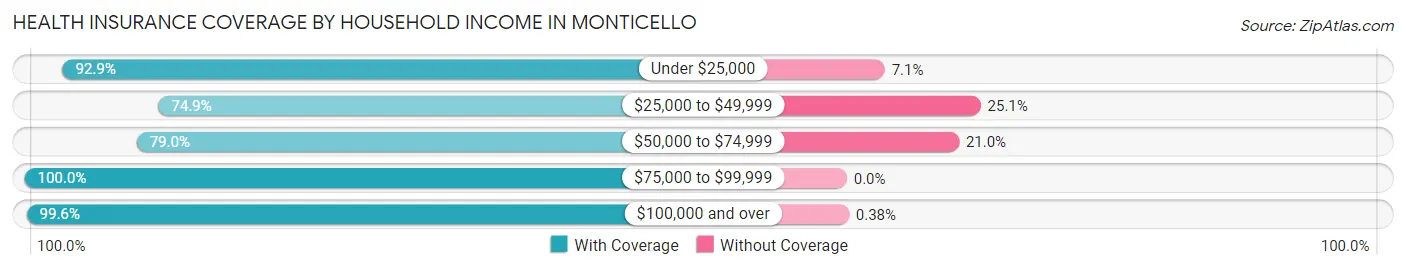
| Household Income | With Coverage | Without Coverage |
| Under $25,000 | 615 (92.9%) | 47 (7.1%) |
| $25,000 to $49,999 | 825 (74.9%) | 276 (25.1%) |
| $50,000 to $74,999 | 628 (79.0%) | 167 (21.0%) |
| $75,000 to $99,999 | 613 (100.0%) | 0 (0.0%) |
| $100,000 and over | 1,585 (99.6%) | 6 (0.4%) |
Public vs Private Health Insurance Coverage by Age in Monticello
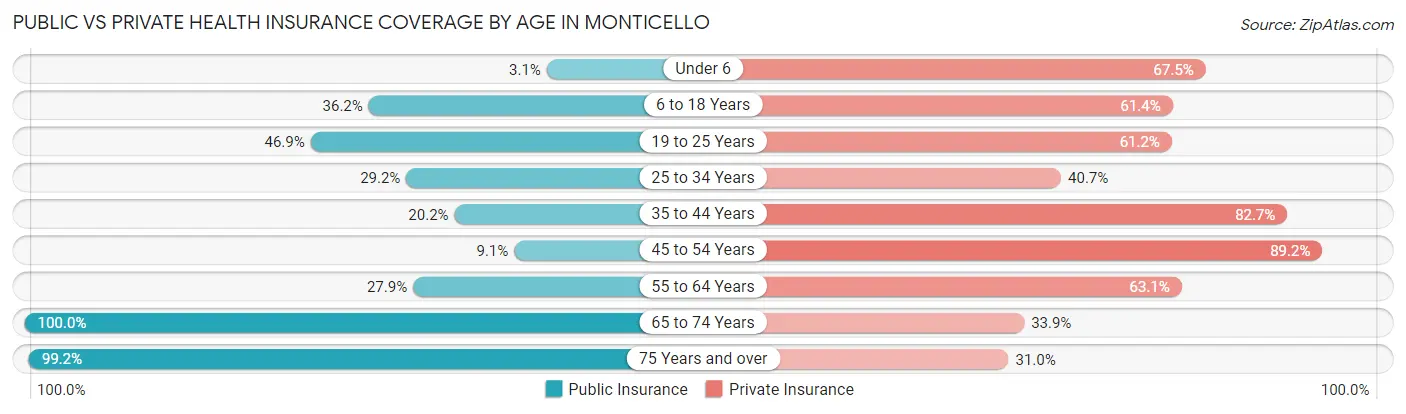
| Age Bracket | Public Insurance | Private Insurance |
| Under 6 | 6 (3.1%) | 131 (67.5%) |
| 6 to 18 Years | 467 (36.1%) | 793 (61.4%) |
| 19 to 25 Years | 236 (46.9%) | 308 (61.2%) |
| 25 to 34 Years | 91 (29.2%) | 127 (40.7%) |
| 35 to 44 Years | 147 (20.2%) | 601 (82.7%) |
| 45 to 54 Years | 54 (9.1%) | 527 (89.2%) |
| 55 to 64 Years | 127 (27.9%) | 287 (63.1%) |
| 65 to 74 Years | 567 (100.0%) | 192 (33.9%) |
| 75 Years and over | 125 (99.2%) | 39 (30.9%) |
| Total | 1,820 (38.2%) | 3,005 (63.0%) |
Disability Status by Sex by Age in Monticello
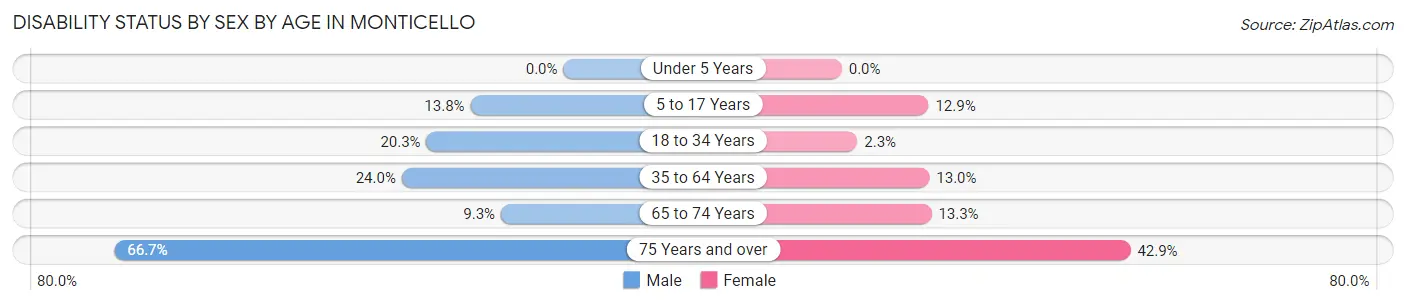
| Age Bracket | Male | Female |
| Under 5 Years | 0 (0.0%) | 0 (0.0%) |
| 5 to 17 Years | 85 (13.8%) | 69 (12.9%) |
| 18 to 34 Years | 62 (20.3%) | 15 (2.3%) |
| 35 to 64 Years | 180 (24.0%) | 133 (13.0%) |
| 65 to 74 Years | 24 (9.3%) | 41 (13.3%) |
| 75 Years and over | 70 (66.7%) | 9 (42.9%) |
Disability Class by Sex by Age in Monticello
Disability Class: Hearing Difficulty
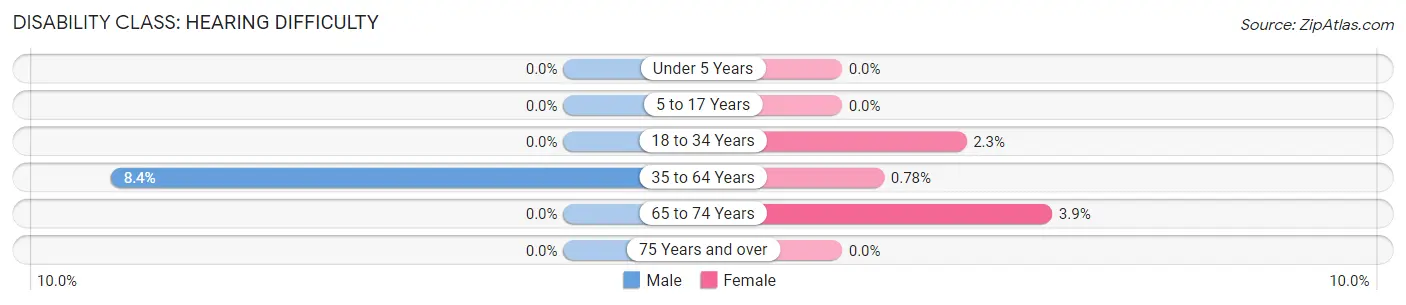
| Age Bracket | Male | Female |
| Under 5 Years | 0 (0.0%) | 0 (0.0%) |
| 5 to 17 Years | 0 (0.0%) | 0 (0.0%) |
| 18 to 34 Years | 0 (0.0%) | 15 (2.3%) |
| 35 to 64 Years | 63 (8.4%) | 8 (0.8%) |
| 65 to 74 Years | 0 (0.0%) | 12 (3.9%) |
| 75 Years and over | 0 (0.0%) | 0 (0.0%) |
Disability Class: Vision Difficulty
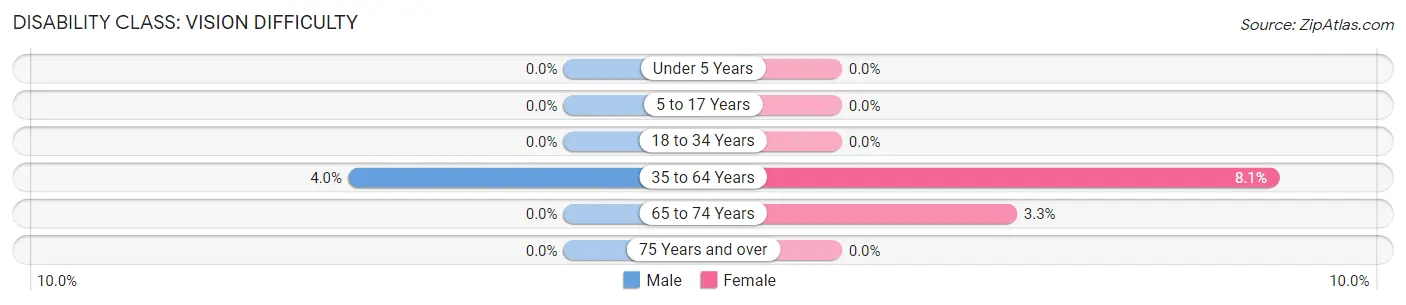
| Age Bracket | Male | Female |
| Under 5 Years | 0 (0.0%) | 0 (0.0%) |
| 5 to 17 Years | 0 (0.0%) | 0 (0.0%) |
| 18 to 34 Years | 0 (0.0%) | 0 (0.0%) |
| 35 to 64 Years | 30 (4.0%) | 83 (8.1%) |
| 65 to 74 Years | 0 (0.0%) | 10 (3.3%) |
| 75 Years and over | 0 (0.0%) | 0 (0.0%) |
Disability Class: Cognitive Difficulty
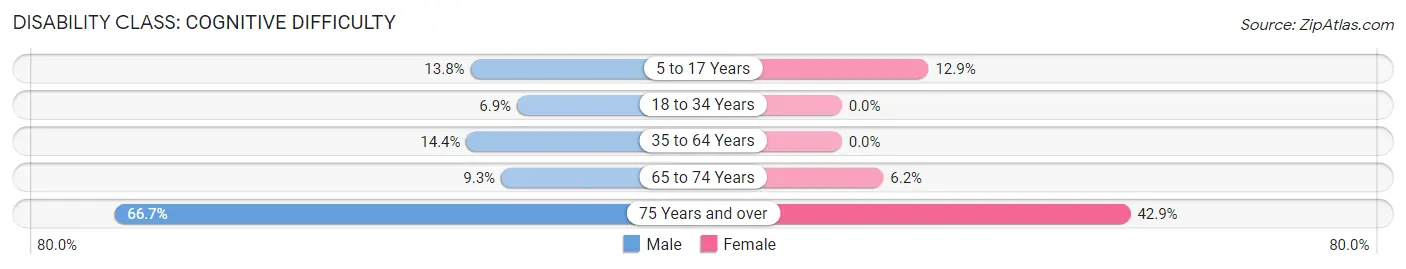
| Age Bracket | Male | Female |
| 5 to 17 Years | 85 (13.8%) | 69 (12.9%) |
| 18 to 34 Years | 21 (6.9%) | 0 (0.0%) |
| 35 to 64 Years | 108 (14.4%) | 0 (0.0%) |
| 65 to 74 Years | 24 (9.3%) | 19 (6.2%) |
| 75 Years and over | 70 (66.7%) | 9 (42.9%) |
Disability Class: Ambulatory Difficulty
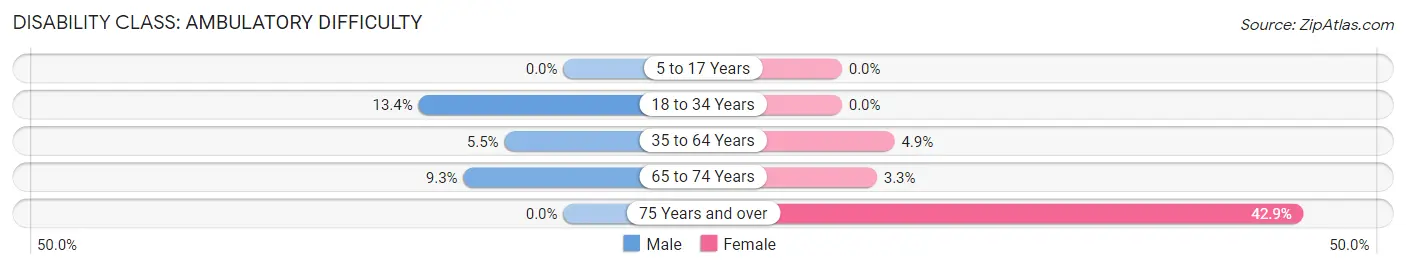
| Age Bracket | Male | Female |
| 5 to 17 Years | 0 (0.0%) | 0 (0.0%) |
| 18 to 34 Years | 41 (13.4%) | 0 (0.0%) |
| 35 to 64 Years | 41 (5.5%) | 50 (4.9%) |
| 65 to 74 Years | 24 (9.3%) | 10 (3.3%) |
| 75 Years and over | 0 (0.0%) | 9 (42.9%) |
Disability Class: Self-Care Difficulty
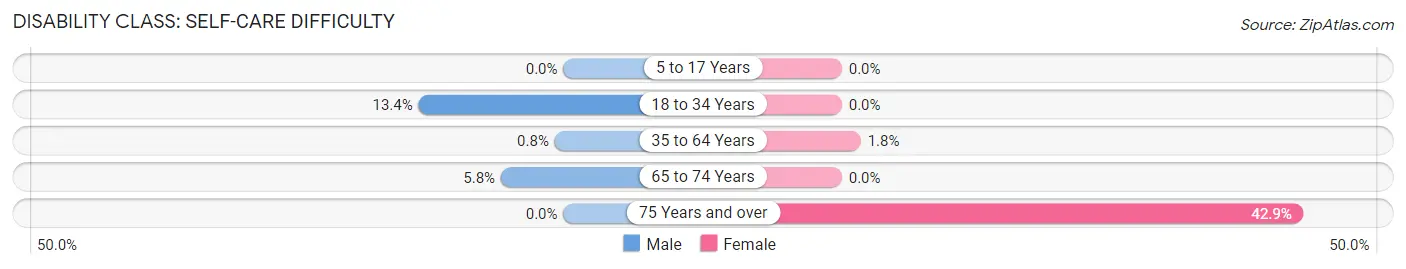
| Age Bracket | Male | Female |
| 5 to 17 Years | 0 (0.0%) | 0 (0.0%) |
| 18 to 34 Years | 41 (13.4%) | 0 (0.0%) |
| 35 to 64 Years | 6 (0.8%) | 18 (1.8%) |
| 65 to 74 Years | 15 (5.8%) | 0 (0.0%) |
| 75 Years and over | 0 (0.0%) | 9 (42.9%) |
Technology Access in Monticello
Computing Device Access in Monticello
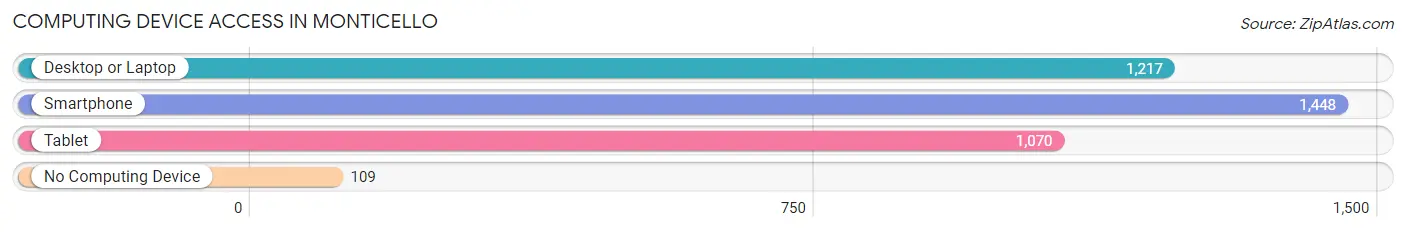
| Device Type | # Households | % Households |
| Desktop or Laptop | 1,217 | 75.1% |
| Smartphone | 1,448 | 89.3% |
| Tablet | 1,070 | 66.0% |
| No Computing Device | 109 | 6.7% |
| Total | 1,621 | 100.0% |
Internet Access in Monticello
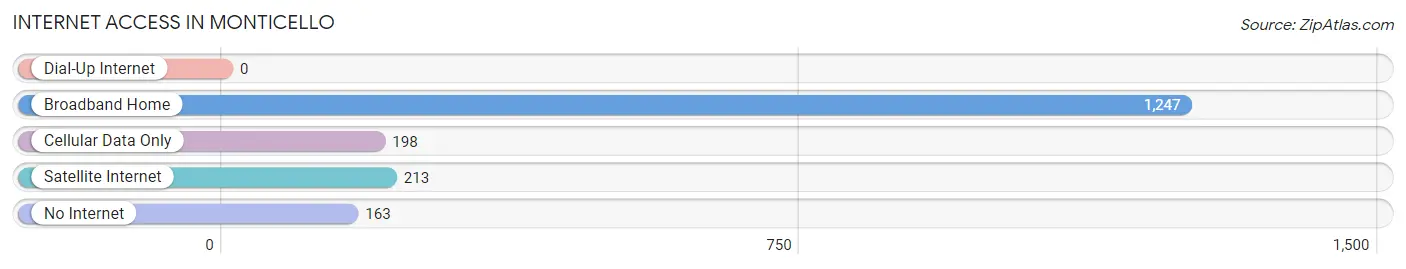
| Internet Type | # Households | % Households |
| Dial-Up Internet | 0 | 0.0% |
| Broadband Home | 1,247 | 76.9% |
| Cellular Data Only | 198 | 12.2% |
| Satellite Internet | 213 | 13.1% |
| No Internet | 163 | 10.1% |
| Total | 1,621 | 100.0% |
Monticello Summary
Monticello is a small town located in the state of Louisiana, United States. It is situated in the northeastern part of the state, in the parish of Jackson. The town has a population of approximately 1,500 people and is part of the Ruston-Lincoln Parish Metropolitan Statistical Area.
History
Monticello was founded in 1845 by a group of settlers from the nearby town of Ruston. The town was named after the Italian city of Monticello, which was the home of Thomas Jefferson. The town was originally a farming community, but it soon developed into a small industrial center. The town was home to several factories, including a cotton mill, a sawmill, and a brickyard.
In the late 19th century, Monticello was a thriving community. It had a population of over 1,000 people and was home to several businesses, including a bank, a hotel, and a newspaper. The town was also home to a number of churches, including the First Baptist Church, which was founded in 1867.
In the early 20th century, Monticello experienced a period of decline. The factories closed and the population began to decline. By the 1950s, the population had dropped to just over 500 people.
Geography
Monticello is located in the northeastern part of Louisiana, in the parish of Jackson. The town is situated on the banks of the Ouachita River, which flows through the town. The town is surrounded by rolling hills and is located near the border of Arkansas.
The climate in Monticello is humid subtropical, with hot summers and mild winters. The average annual temperature is around 70 degrees Fahrenheit (21 degrees Celsius). The average annual precipitation is around 50 inches (127 cm).
Economy
The economy of Monticello is largely based on agriculture. The town is home to several farms, which produce a variety of crops, including cotton, soybeans, corn, and wheat. The town is also home to several small businesses, including restaurants, retail stores, and service providers.
Demographics
As of the 2010 census, the population of Monticello was 1,500 people. The racial makeup of the town was 79.2% White, 17.3% African American, 0.7% Native American, 0.3% Asian, 0.1% Pacific Islander, and 2.4% from other races. The median household income was $30,000, and the median family income was $37,000. The per capita income was $15,000. The poverty rate was 22.2%.
Common Questions
What is Per Capita Income in Monticello?
Per Capita income in Monticello is $28,530.
What is the Median Family Income in Monticello?
Median Family Income in Monticello is $73,750.
What is the Median Household income in Monticello?
Median Household Income in Monticello is $62,540.
What is Income or Wage Gap in Monticello?
Income or Wage Gap in Monticello is 21.1%.
Women in Monticello earn 78.9 cents for every dollar earned by a man.
What is Family Income Deficit in Monticello?
Family Income Deficit in Monticello is $13,373.
Families that are below poverty line in Monticello earn $13,373 less on average than the poverty threshold level.
What is Inequality or Gini Index in Monticello?
Inequality or Gini Index in Monticello is 0.42.
What is the Total Population of Monticello?
Total Population of Monticello is 4,767.
What is the Total Male Population of Monticello?
Total Male Population of Monticello is 2,197.
What is the Total Female Population of Monticello?
Total Female Population of Monticello is 2,570.
What is the Ratio of Males per 100 Females in Monticello?
There are 85.49 Males per 100 Females in Monticello.
What is the Ratio of Females per 100 Males in Monticello?
There are 116.98 Females per 100 Males in Monticello.
What is the Median Population Age in Monticello?
Median Population Age in Monticello is 37.2 Years.
What is the Average Family Size in Monticello
Average Family Size in Monticello is 3.6 People.
What is the Average Household Size in Monticello
Average Household Size in Monticello is 2.9 People.
How Large is the Labor Force in Monticello?
There are 2,057 People in the Labor Forcein in Monticello.
What is the Percentage of People in the Labor Force in Monticello?
57.9% of People are in the Labor Force in Monticello.
What is the Unemployment Rate in Monticello?
Unemployment Rate in Monticello is 4.0%.