St Gabriel, LA Map & Demographics
St Gabriel Map
St Gabriel Overview
$20,644
PER CAPITA INCOME
$62,852
AVG FAMILY INCOME
$55,735
AVG HOUSEHOLD INCOME
23.1%
WAGE / INCOME GAP [ % ]
76.9¢/ $1
WAGE / INCOME GAP [ $ ]
0.42
INEQUALITY / GINI INDEX
6,526
TOTAL POPULATION
4,023
MALE POPULATION
2,503
FEMALE POPULATION
160.73
MALES / 100 FEMALES
62.22
FEMALES / 100 MALES
34.8
MEDIAN AGE
2.8
AVG FAMILY SIZE
2.5
AVG HOUSEHOLD SIZE
2,603
LABOR FORCE [ PEOPLE ]
43.7%
PERCENT IN LABOR FORCE
6.9%
UNEMPLOYMENT RATE
Income in St Gabriel
Income Overview in St Gabriel
Per Capita Income in St Gabriel is $20,644, while median incomes of families and households are $62,852 and $55,735 respectively.
| Characteristic | Number | Measure |
| Per Capita Income | 6,526 | $20,644 |
| Median Family Income | 1,163 | $62,852 |
| Mean Family Income | 1,163 | $81,682 |
| Median Household Income | 1,580 | $55,735 |
| Mean Household Income | 1,580 | $76,473 |
| Income Deficit | 1,163 | $0 |
| Wage / Income Gap (%) | 6,526 | 23.06% |
| Wage / Income Gap ($) | 6,526 | 76.94¢ per $1 |
| Gini / Inequality Index | 6,526 | 0.42 |
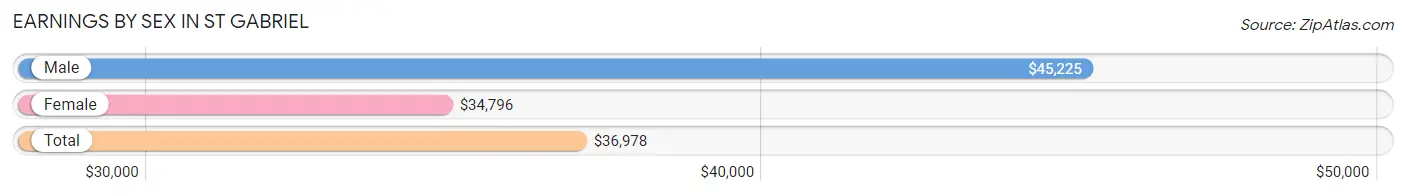
Earnings by Sex in St Gabriel
Average Earnings in St Gabriel are $36,978, $45,225 for men and $34,796 for women, a difference of 23.1%.
| Sex | Number | Average Earnings |
| Male | 1,548 (54.3%) | $45,225 |
| Female | 1,301 (45.7%) | $34,796 |
| Total | 2,849 (100.0%) | $36,978 |
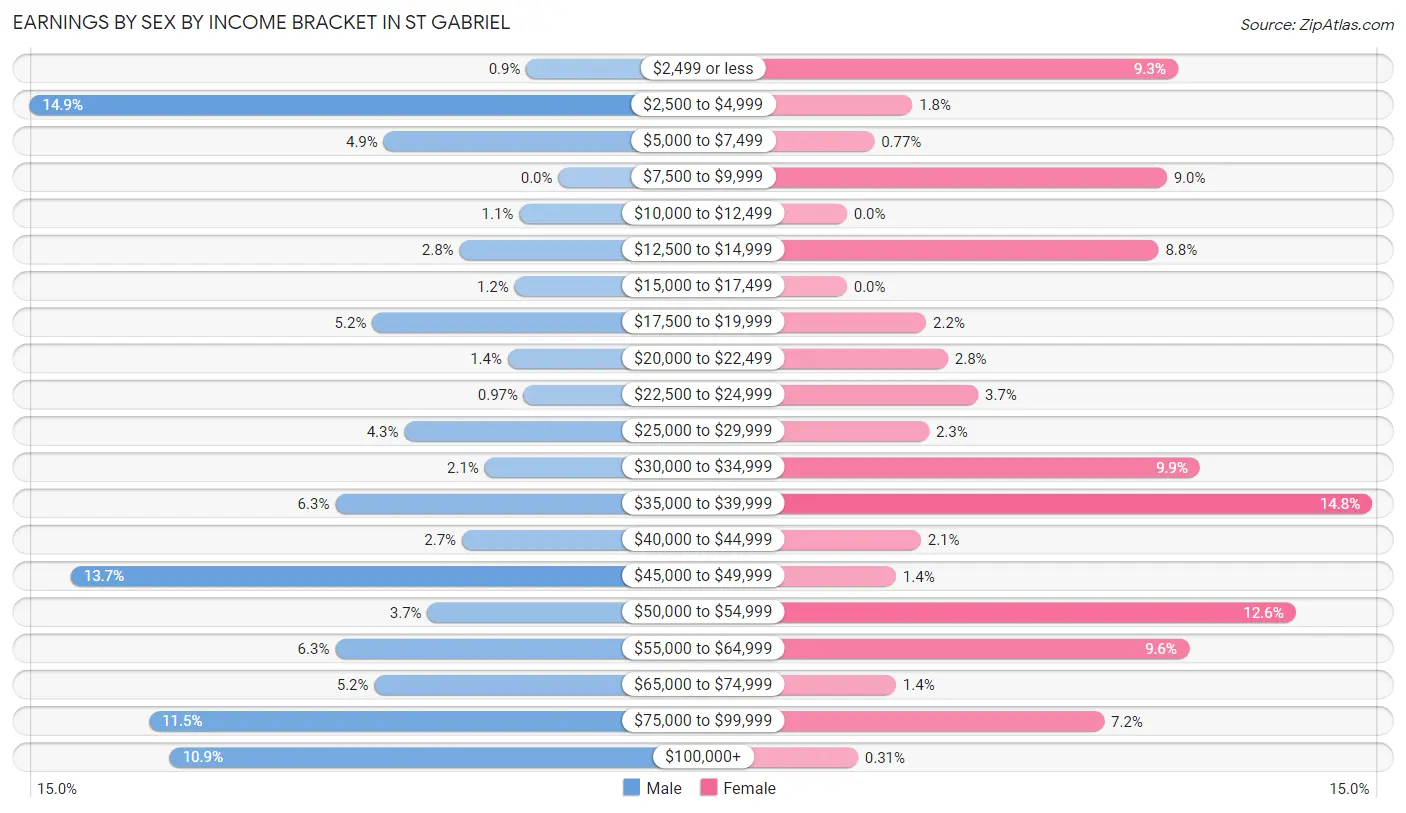
Earnings by Sex by Income Bracket in St Gabriel
The most common earnings brackets in St Gabriel are $2,500 to $4,999 for men (230 | 14.9%) and $35,000 to $39,999 for women (192 | 14.8%).
| Income | Male | Female |
| $2,499 or less | 14 (0.9%) | 121 (9.3%) |
| $2,500 to $4,999 | 230 (14.9%) | 24 (1.8%) |
| $5,000 to $7,499 | 76 (4.9%) | 10 (0.8%) |
| $7,500 to $9,999 | 0 (0.0%) | 117 (9.0%) |
| $10,000 to $12,499 | 17 (1.1%) | 0 (0.0%) |
| $12,500 to $14,999 | 43 (2.8%) | 114 (8.8%) |
| $15,000 to $17,499 | 19 (1.2%) | 0 (0.0%) |
| $17,500 to $19,999 | 81 (5.2%) | 29 (2.2%) |
| $20,000 to $22,499 | 22 (1.4%) | 37 (2.8%) |
| $22,500 to $24,999 | 15 (1.0%) | 48 (3.7%) |
| $25,000 to $29,999 | 67 (4.3%) | 30 (2.3%) |
| $30,000 to $34,999 | 32 (2.1%) | 129 (9.9%) |
| $35,000 to $39,999 | 97 (6.3%) | 192 (14.8%) |
| $40,000 to $44,999 | 42 (2.7%) | 27 (2.1%) |
| $45,000 to $49,999 | 212 (13.7%) | 18 (1.4%) |
| $50,000 to $54,999 | 57 (3.7%) | 164 (12.6%) |
| $55,000 to $64,999 | 97 (6.3%) | 125 (9.6%) |
| $65,000 to $74,999 | 80 (5.2%) | 18 (1.4%) |
| $75,000 to $99,999 | 178 (11.5%) | 94 (7.2%) |
| $100,000+ | 169 (10.9%) | 4 (0.3%) |
| Total | 1,548 (100.0%) | 1,301 (100.0%) |
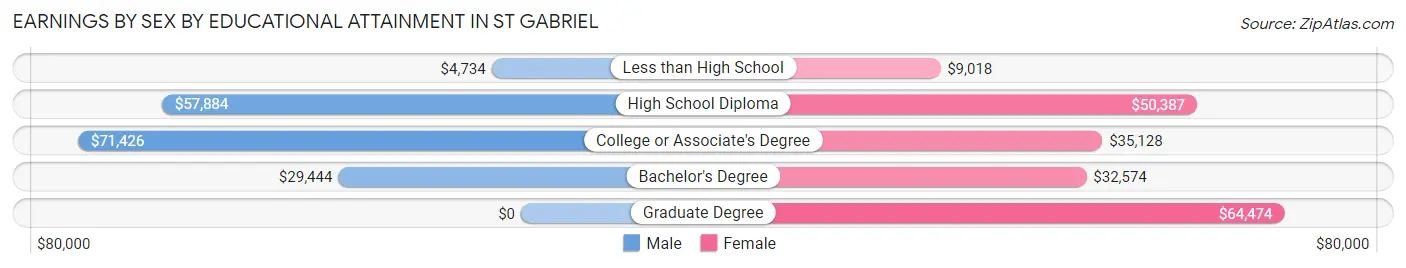
Earnings by Sex by Educational Attainment in St Gabriel
Average earnings in St Gabriel are $47,133 for men and $35,531 for women, a difference of 24.6%. Men with an educational attainment of college or associate's degree enjoy the highest average annual earnings of $71,426, while those with less than high school education earn the least with $4,734. Women with an educational attainment of graduate degree earn the most with the average annual earnings of $64,474, while those with less than high school education have the smallest earnings of $9,018.
| Educational Attainment | Male Income | Female Income |
| Less than High School | $4,734 | $9,018 |
| High School Diploma | $57,884 | $50,387 |
| College or Associate's Degree | $71,426 | $35,128 |
| Bachelor's Degree | $29,444 | $32,574 |
| Graduate Degree | - | - |
| Total | $47,133 | $35,531 |
Family Income in St Gabriel
Family Income Brackets in St Gabriel
According to the St Gabriel family income data, there are 313 families falling into the $35,000 to $49,999 income range, which is the most common income bracket and makes up 26.9% of all families.
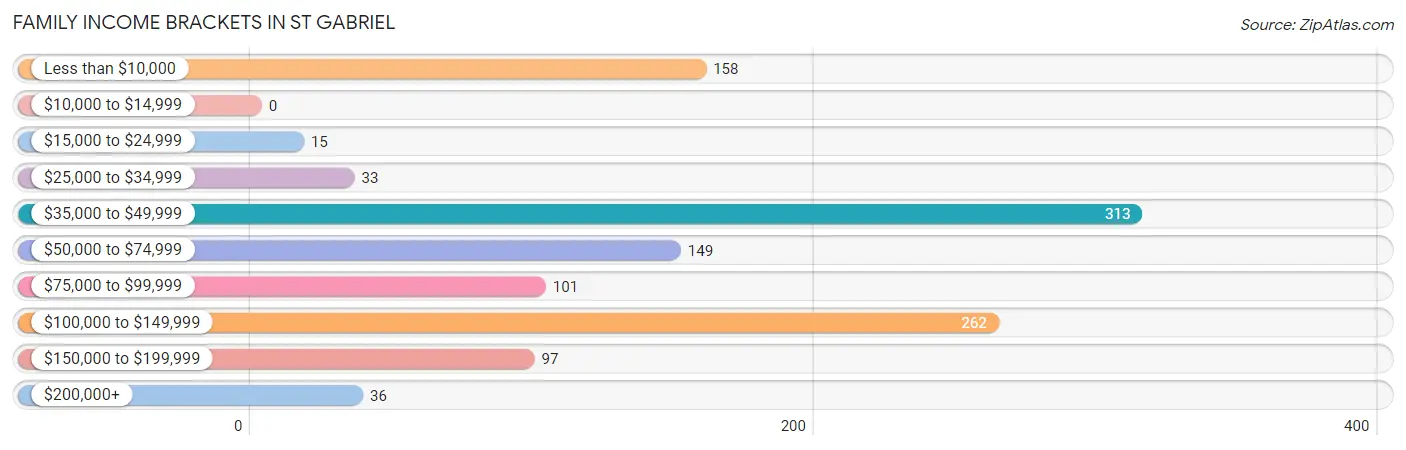
| Income Bracket | # Families | % Families |
| Less than $10,000 | 158 | 13.6% |
| $10,000 to $14,999 | 0 | 0.0% |
| $15,000 to $24,999 | 15 | 1.3% |
| $25,000 to $34,999 | 33 | 2.8% |
| $35,000 to $49,999 | 313 | 26.9% |
| $50,000 to $74,999 | 149 | 12.8% |
| $75,000 to $99,999 | 101 | 8.7% |
| $100,000 to $149,999 | 262 | 22.5% |
| $150,000 to $199,999 | 97 | 8.3% |
| $200,000+ | 36 | 3.1% |
Family Income by Famaliy Size in St Gabriel
5-person families (39 | 3.4%) account for the highest median family income in St Gabriel with $232,969 per family, while 3-person families (170 | 14.6%) have the highest median income of $47,654 per family member.
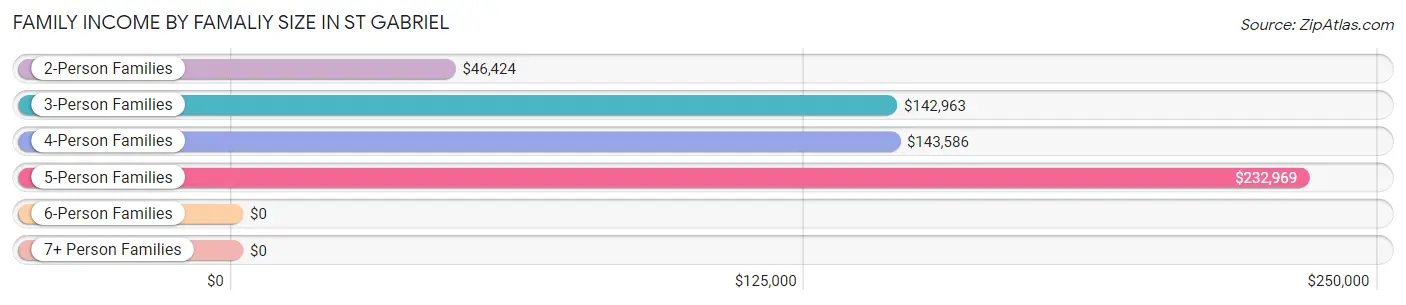
| Income Bracket | # Families | Median Income |
| 2-Person Families | 709 (61.0%) | $46,424 |
| 3-Person Families | 170 (14.6%) | $142,963 |
| 4-Person Families | 199 (17.1%) | $143,586 |
| 5-Person Families | 39 (3.4%) | $232,969 |
| 6-Person Families | 33 (2.8%) | $0 |
| 7+ Person Families | 13 (1.1%) | $0 |
| Total | 1,163 (100.0%) | $62,852 |
Family Income by Number of Earners in St Gabriel
The median family income in St Gabriel is $62,852, with families comprising 3+ earners (210) having the highest median family income of $143,681, while families with no earners (234) have the lowest median family income of $2,499, accounting for 18.1% and 20.1% of families, respectively.
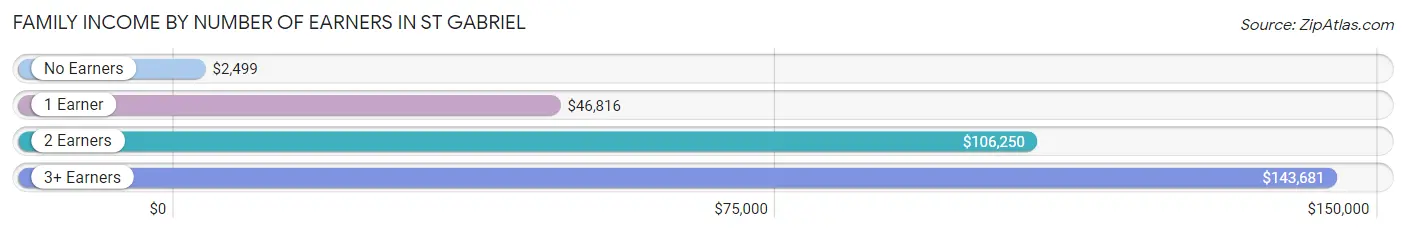
| Number of Earners | # Families | Median Income |
| No Earners | 234 (20.1%) | $2,499 |
| 1 Earner | 300 (25.8%) | $46,816 |
| 2 Earners | 419 (36.0%) | $106,250 |
| 3+ Earners | 210 (18.1%) | $143,681 |
| Total | 1,163 (100.0%) | $62,852 |
Household Income in St Gabriel
Household Income Brackets in St Gabriel
With 403 households falling in the category, the $35,000 to $49,999 income range is the most frequent in St Gabriel, accounting for 25.5% of all households. In contrast, only 14 households (0.9%) fall into the $15,000 to $24,999 income bracket, making it the least populous group.
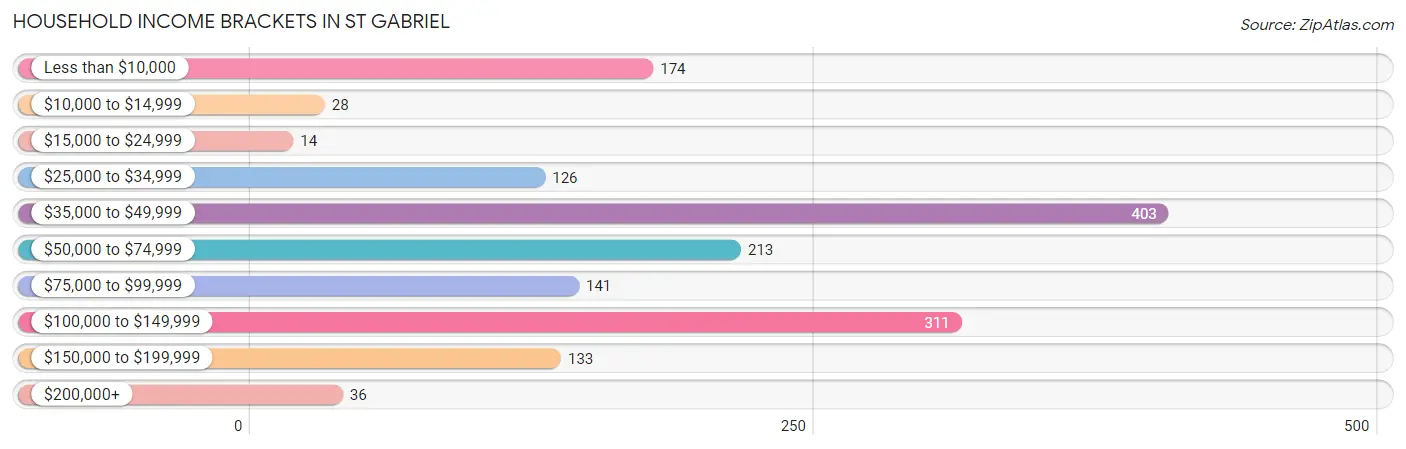
| Income Bracket | # Households | % Households |
| Less than $10,000 | 174 | 11.0% |
| $10,000 to $14,999 | 28 | 1.8% |
| $15,000 to $24,999 | 14 | 0.9% |
| $25,000 to $34,999 | 126 | 8.0% |
| $35,000 to $49,999 | 403 | 25.5% |
| $50,000 to $74,999 | 213 | 13.5% |
| $75,000 to $99,999 | 141 | 8.9% |
| $100,000 to $149,999 | 311 | 19.7% |
| $150,000 to $199,999 | 133 | 8.4% |
| $200,000+ | 36 | 2.3% |
Household Income by Householder Age in St Gabriel
The median household income in St Gabriel is $55,735, with the highest median household income of $92,679 found in the 45 to 64 years age bracket for the primary householder. A total of 513 households (32.5%) fall into this category. Meanwhile, the 15 to 24 years age bracket for the primary householder has the lowest median household income of $0, with 62 households (3.9%) in this group.
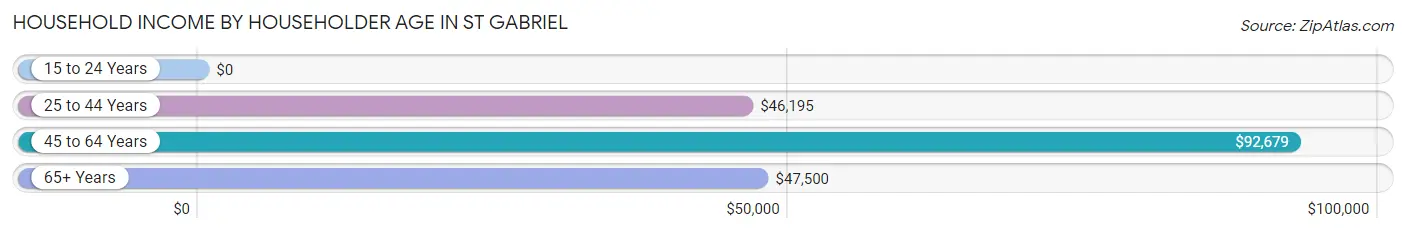
| Income Bracket | # Households | Median Income |
| 15 to 24 Years | 62 (3.9%) | $0 |
| 25 to 44 Years | 711 (45.0%) | $46,195 |
| 45 to 64 Years | 513 (32.5%) | $92,679 |
| 65+ Years | 294 (18.6%) | $47,500 |
| Total | 1,580 (100.0%) | $55,735 |
Poverty in St Gabriel
Income Below Poverty by Sex and Age in St Gabriel
With 16.4% poverty level for males and 8.9% for females among the residents of St Gabriel, 16 and 17 year old males and 75 year old and over females are the most vulnerable to poverty, with 109 males (93.2%) and 6 females (54.5%) in their respective age groups living below the poverty level.
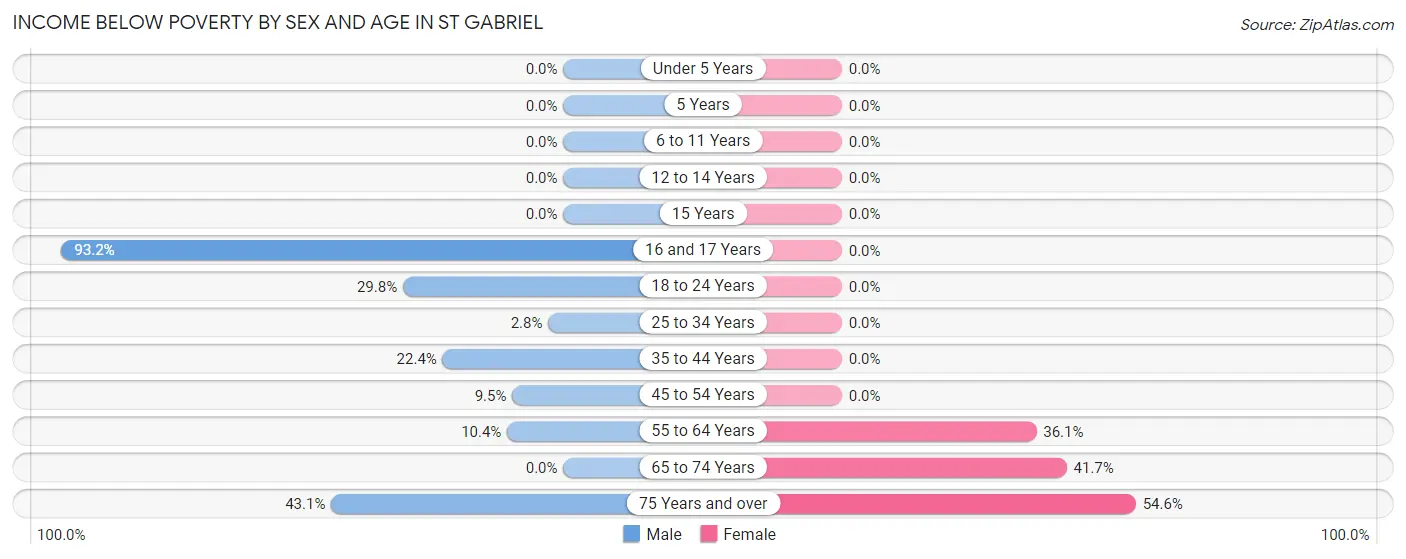
| Age Bracket | Male | Female |
| Under 5 Years | 0 (0.0%) | 0 (0.0%) |
| 5 Years | 0 (0.0%) | 0 (0.0%) |
| 6 to 11 Years | 0 (0.0%) | 0 (0.0%) |
| 12 to 14 Years | 0 (0.0%) | 0 (0.0%) |
| 15 Years | 0 (0.0%) | 0 (0.0%) |
| 16 and 17 Years | 109 (93.2%) | 0 (0.0%) |
| 18 to 24 Years | 103 (29.8%) | 0 (0.0%) |
| 25 to 34 Years | 19 (2.8%) | 0 (0.0%) |
| 35 to 44 Years | 43 (22.4%) | 0 (0.0%) |
| 45 to 54 Years | 16 (9.5%) | 0 (0.0%) |
| 55 to 64 Years | 15 (10.4%) | 87 (36.1%) |
| 65 to 74 Years | 0 (0.0%) | 78 (41.7%) |
| 75 Years and over | 28 (43.1%) | 6 (54.5%) |
| Total | 333 (16.4%) | 171 (8.9%) |
Income Above Poverty by Sex and Age in St Gabriel
According to the poverty statistics in St Gabriel, males aged under 5 years and females aged under 5 years are the age groups that are most secure financially, with 100.0% of males and 100.0% of females in these age groups living above the poverty line.
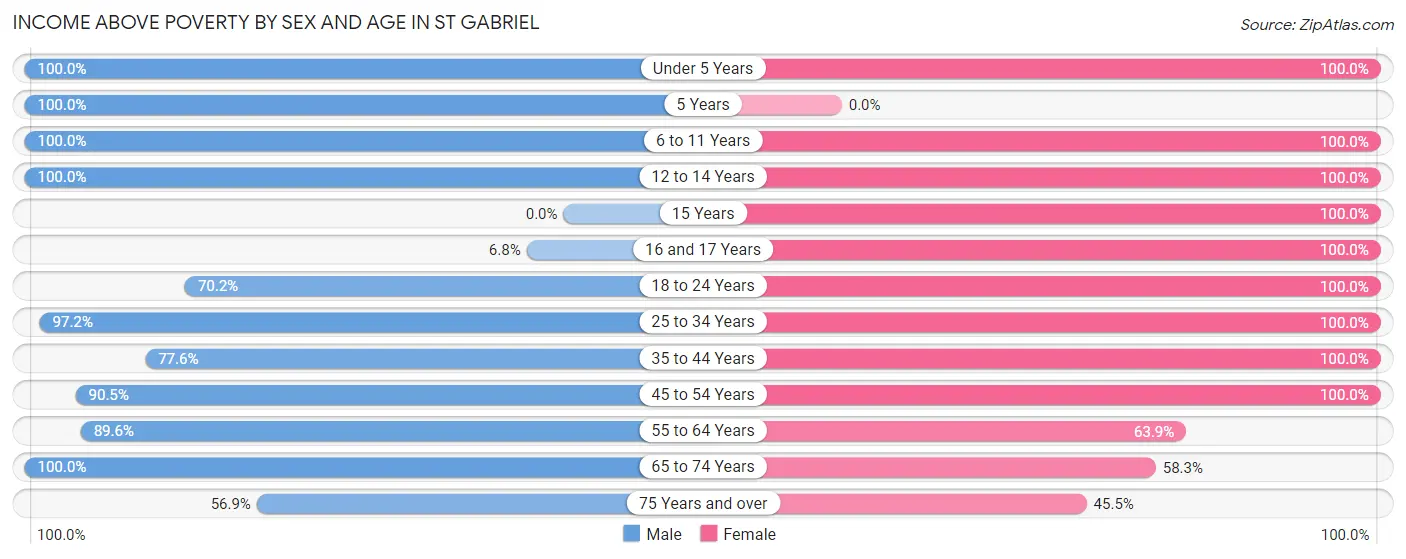
| Age Bracket | Male | Female |
| Under 5 Years | 73 (100.0%) | 277 (100.0%) |
| 5 Years | 43 (100.0%) | 0 (0.0%) |
| 6 to 11 Years | 39 (100.0%) | 34 (100.0%) |
| 12 to 14 Years | 31 (100.0%) | 40 (100.0%) |
| 15 Years | 0 (0.0%) | 19 (100.0%) |
| 16 and 17 Years | 8 (6.8%) | 27 (100.0%) |
| 18 to 24 Years | 243 (70.2%) | 116 (100.0%) |
| 25 to 34 Years | 663 (97.2%) | 668 (100.0%) |
| 35 to 44 Years | 149 (77.6%) | 166 (100.0%) |
| 45 to 54 Years | 153 (90.5%) | 143 (100.0%) |
| 55 to 64 Years | 129 (89.6%) | 154 (63.9%) |
| 65 to 74 Years | 134 (100.0%) | 109 (58.3%) |
| 75 Years and over | 37 (56.9%) | 5 (45.5%) |
| Total | 1,702 (83.6%) | 1,758 (91.1%) |
Income Below Poverty Among Married-Couple Families in St Gabriel
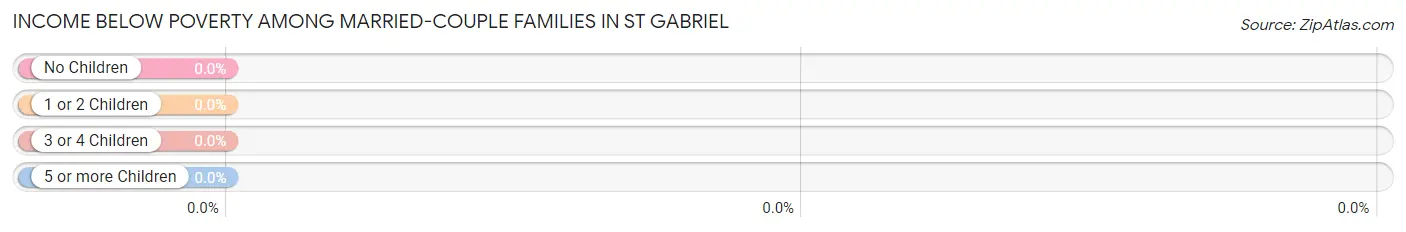
| Children | Above Poverty | Below Poverty |
| No Children | 266 (100.0%) | 0 (0.0%) |
| 1 or 2 Children | 85 (100.0%) | 0 (0.0%) |
| 3 or 4 Children | 47 (100.0%) | 0 (0.0%) |
| 5 or more Children | 0 (0.0%) | 0 (0.0%) |
| Total | 398 (100.0%) | 0 (0.0%) |
Income Below Poverty Among Single-Parent Households in St Gabriel
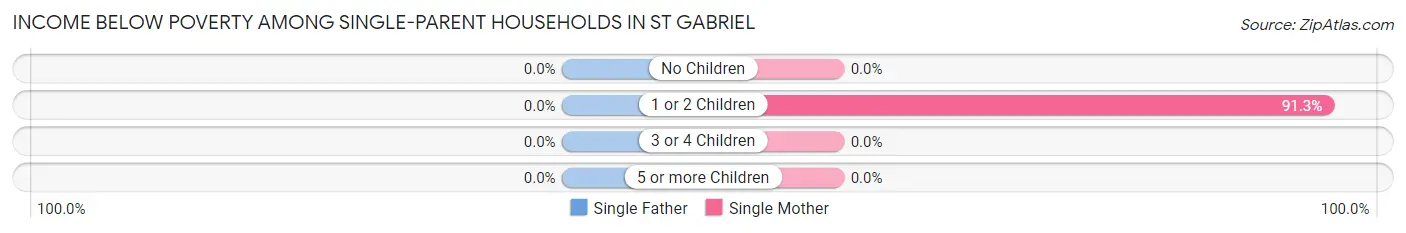
| Children | Single Father | Single Mother |
| No Children | 0 (0.0%) | 0 (0.0%) |
| 1 or 2 Children | 0 (0.0%) | 158 (91.3%) |
| 3 or 4 Children | 0 (0.0%) | 0 (0.0%) |
| 5 or more Children | 0 (0.0%) | 0 (0.0%) |
| Total | 0 (0.0%) | 158 (41.6%) |
Income Below Poverty Among Married-Couple vs Single-Parent Households in St Gabriel
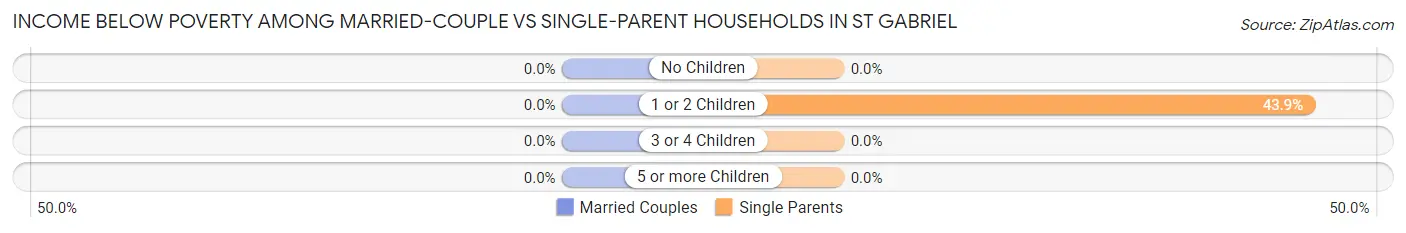
| Children | Married-Couple Families | Single-Parent Households |
| No Children | 0 (0.0%) | 0 (0.0%) |
| 1 or 2 Children | 0 (0.0%) | 158 (43.9%) |
| 3 or 4 Children | 0 (0.0%) | 0 (0.0%) |
| 5 or more Children | 0 (0.0%) | 0 (0.0%) |
| Total | 0 (0.0%) | 158 (20.6%) |
Race in St Gabriel
The most populous races in St Gabriel are Black / African American (3,774 | 57.8%), White / Caucasian (2,285 | 35.0%), and Hispanic or Latino (490 | 7.5%).
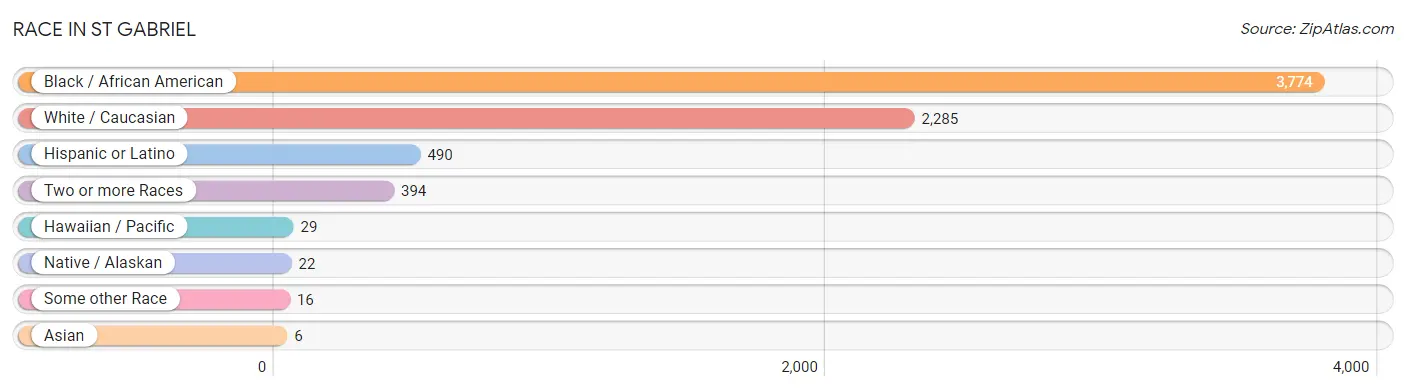
| Race | # Population | % Population |
| Asian | 6 | 0.1% |
| Black / African American | 3,774 | 57.8% |
| Hawaiian / Pacific | 29 | 0.4% |
| Hispanic or Latino | 490 | 7.5% |
| Native / Alaskan | 22 | 0.3% |
| White / Caucasian | 2,285 | 35.0% |
| Two or more Races | 394 | 6.0% |
| Some other Race | 16 | 0.3% |
| Total | 6,526 | 100.0% |
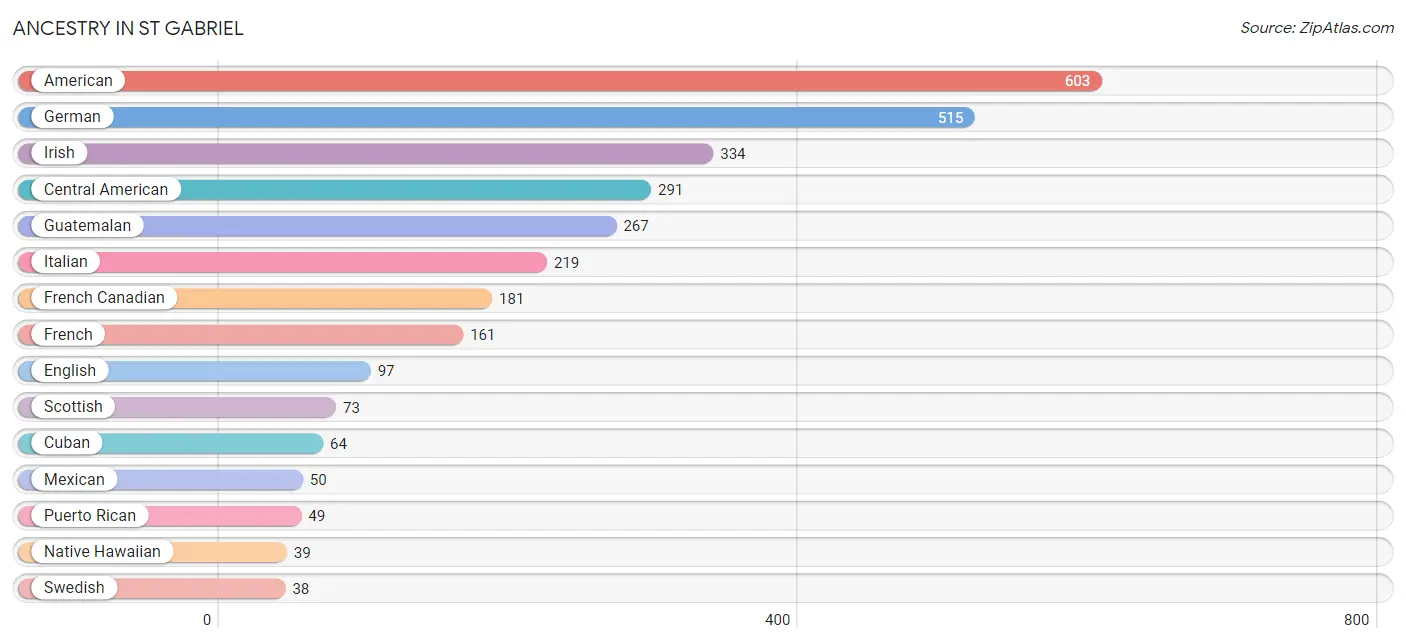
Ancestry in St Gabriel
The most populous ancestries reported in St Gabriel are American (603 | 9.2%), German (515 | 7.9%), Irish (334 | 5.1%), Central American (291 | 4.5%), and Guatemalan (267 | 4.1%), together accounting for 30.8% of all St Gabriel residents.
| Ancestry | # Population | % Population |
| Alaska Native | 5 | 0.1% |
| American | 603 | 9.2% |
| Apache | 3 | 0.1% |
| Arab | 9 | 0.1% |
| Argentinean | 4 | 0.1% |
| Blackfeet | 10 | 0.2% |
| British | 18 | 0.3% |
| Cajun | 28 | 0.4% |
| Central American | 291 | 4.5% |
| Cherokee | 9 | 0.1% |
| Choctaw | 13 | 0.2% |
| Colombian | 7 | 0.1% |
| Cuban | 64 | 1.0% |
| Dominican | 10 | 0.2% |
| Dutch | 18 | 0.3% |
| English | 97 | 1.5% |
| European | 26 | 0.4% |
| French | 161 | 2.5% |
| French Canadian | 181 | 2.8% |
| German | 515 | 7.9% |
| Greek | 3 | 0.1% |
| Guatemalan | 267 | 4.1% |
| Honduran | 19 | 0.3% |
| Houma | 3 | 0.1% |
| Irish | 334 | 5.1% |
| Israeli | 27 | 0.4% |
| Italian | 219 | 3.4% |
| Mexican | 50 | 0.8% |
| Native Hawaiian | 39 | 0.6% |
| Navajo | 10 | 0.2% |
| Nigerian | 8 | 0.1% |
| Norwegian | 3 | 0.1% |
| Paiute | 3 | 0.1% |
| Pakistani | 1 | 0.0% |
| Pueblo | 3 | 0.1% |
| Puerto Rican | 49 | 0.7% |
| Russian | 5 | 0.1% |
| Salvadoran | 5 | 0.1% |
| Scandinavian | 16 | 0.3% |
| Scotch-Irish | 36 | 0.5% |
| Scottish | 73 | 1.1% |
| Seminole | 3 | 0.1% |
| South American | 11 | 0.2% |
| Spaniard | 3 | 0.1% |
| Spanish | 9 | 0.1% |
| Subsaharan African | 26 | 0.4% |
| Swedish | 38 | 0.6% |
| Syrian | 9 | 0.1% |
| Thai | 5 | 0.1% |
| Welsh | 12 | 0.2% | View All 50 Rows |
Immigrants in St Gabriel
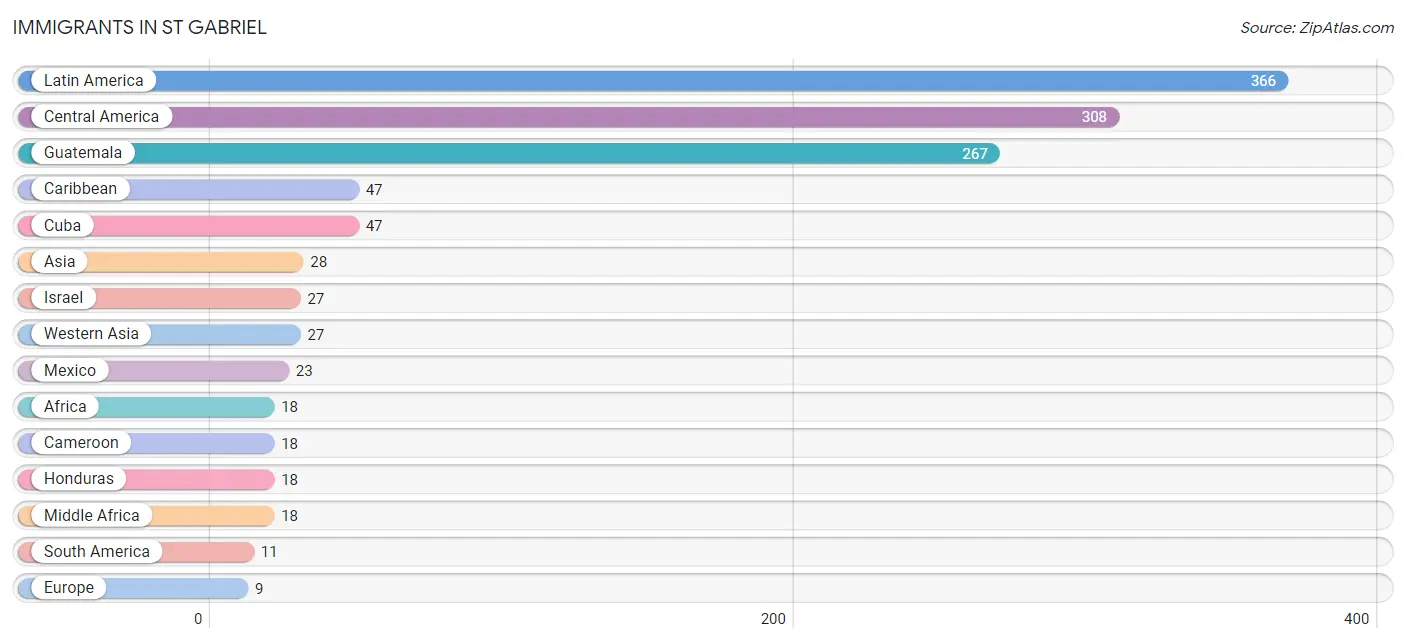
The most numerous immigrant groups reported in St Gabriel came from Latin America (366 | 5.6%), Central America (308 | 4.7%), Guatemala (267 | 4.1%), Caribbean (47 | 0.7%), and Cuba (47 | 0.7%), together accounting for 15.9% of all St Gabriel residents.
| Immigration Origin | # Population | % Population |
| Africa | 18 | 0.3% |
| Argentina | 4 | 0.1% |
| Asia | 28 | 0.4% |
| Cameroon | 18 | 0.3% |
| Caribbean | 47 | 0.7% |
| Central America | 308 | 4.7% |
| Colombia | 7 | 0.1% |
| Cuba | 47 | 0.7% |
| Europe | 9 | 0.1% |
| Germany | 6 | 0.1% |
| Greece | 3 | 0.1% |
| Guatemala | 267 | 4.1% |
| Honduras | 18 | 0.3% |
| Israel | 27 | 0.4% |
| Latin America | 366 | 5.6% |
| Mexico | 23 | 0.4% |
| Middle Africa | 18 | 0.3% |
| South America | 11 | 0.2% |
| South Eastern Asia | 1 | 0.0% |
| Southern Europe | 3 | 0.1% |
| Thailand | 1 | 0.0% |
| Western Asia | 27 | 0.4% |
| Western Europe | 6 | 0.1% | View All 23 Rows |
Sex and Age in St Gabriel
Sex and Age in St Gabriel
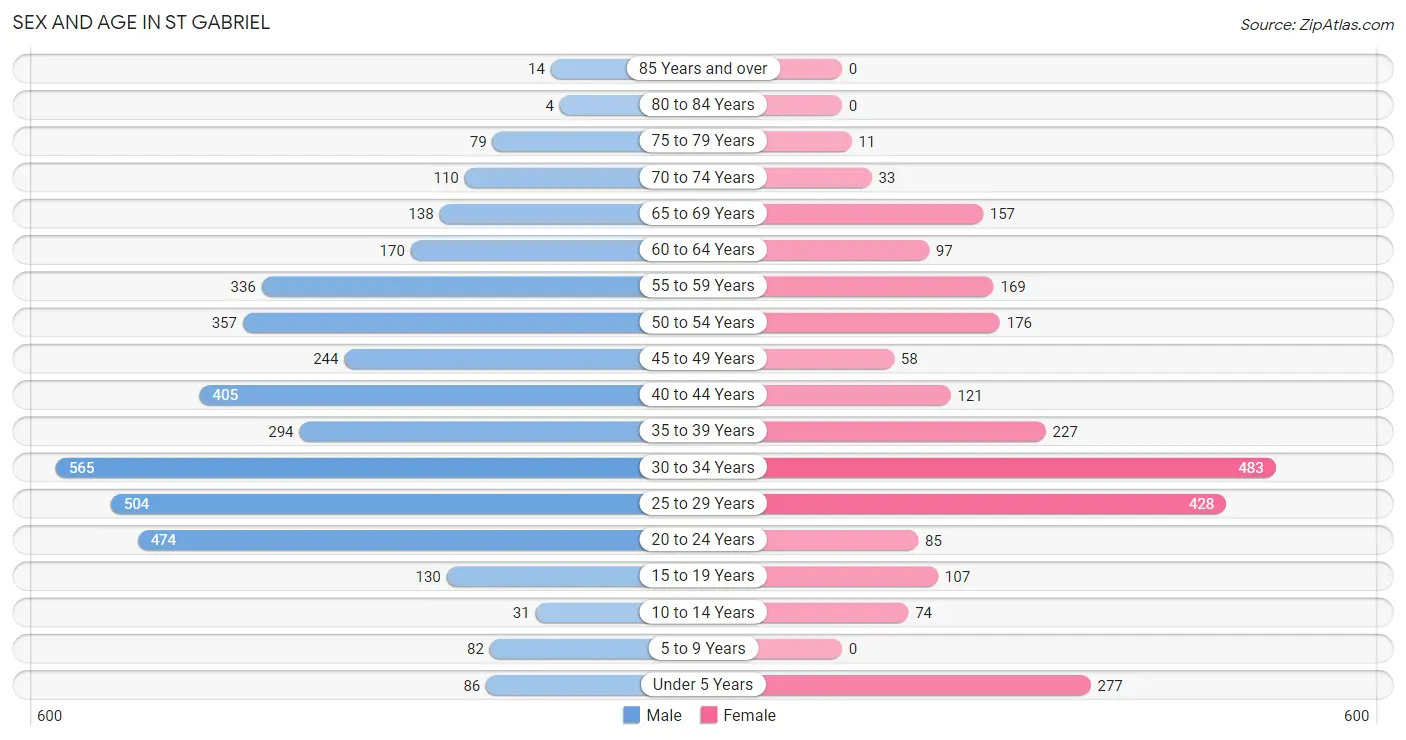
The most populous age groups in St Gabriel are 30 to 34 Years (565 | 14.0%) for men and 30 to 34 Years (483 | 19.3%) for women.
| Age Bracket | Male | Female |
| Under 5 Years | 86 (2.1%) | 277 (11.1%) |
| 5 to 9 Years | 82 (2.0%) | 0 (0.0%) |
| 10 to 14 Years | 31 (0.8%) | 74 (3.0%) |
| 15 to 19 Years | 130 (3.2%) | 107 (4.3%) |
| 20 to 24 Years | 474 (11.8%) | 85 (3.4%) |
| 25 to 29 Years | 504 (12.5%) | 428 (17.1%) |
| 30 to 34 Years | 565 (14.0%) | 483 (19.3%) |
| 35 to 39 Years | 294 (7.3%) | 227 (9.1%) |
| 40 to 44 Years | 405 (10.1%) | 121 (4.8%) |
| 45 to 49 Years | 244 (6.1%) | 58 (2.3%) |
| 50 to 54 Years | 357 (8.9%) | 176 (7.0%) |
| 55 to 59 Years | 336 (8.4%) | 169 (6.8%) |
| 60 to 64 Years | 170 (4.2%) | 97 (3.9%) |
| 65 to 69 Years | 138 (3.4%) | 157 (6.3%) |
| 70 to 74 Years | 110 (2.7%) | 33 (1.3%) |
| 75 to 79 Years | 79 (2.0%) | 11 (0.4%) |
| 80 to 84 Years | 4 (0.1%) | 0 (0.0%) |
| 85 Years and over | 14 (0.4%) | 0 (0.0%) |
| Total | 4,023 (100.0%) | 2,503 (100.0%) |
Families and Households in St Gabriel
Median Family Size in St Gabriel
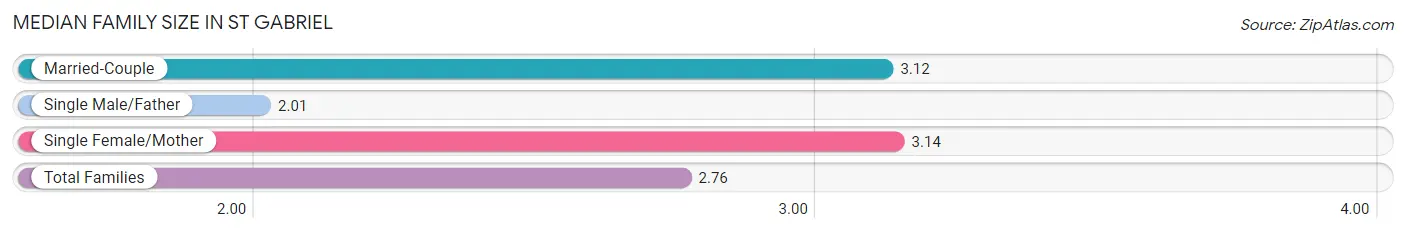
The median family size in St Gabriel is 2.76 persons per family, with single female/mother families (380 | 32.7%) accounting for the largest median family size of 3.14 persons per family. On the other hand, single male/father families (385 | 33.1%) represent the smallest median family size with 2.01 persons per family.
| Family Type | # Families | Family Size |
| Married-Couple | 398 (34.2%) | 3.12 |
| Single Male/Father | 385 (33.1%) | 2.01 |
| Single Female/Mother | 380 (32.7%) | 3.14 |
| Total Families | 1,163 (100.0%) | 2.76 |
Median Household Size in St Gabriel
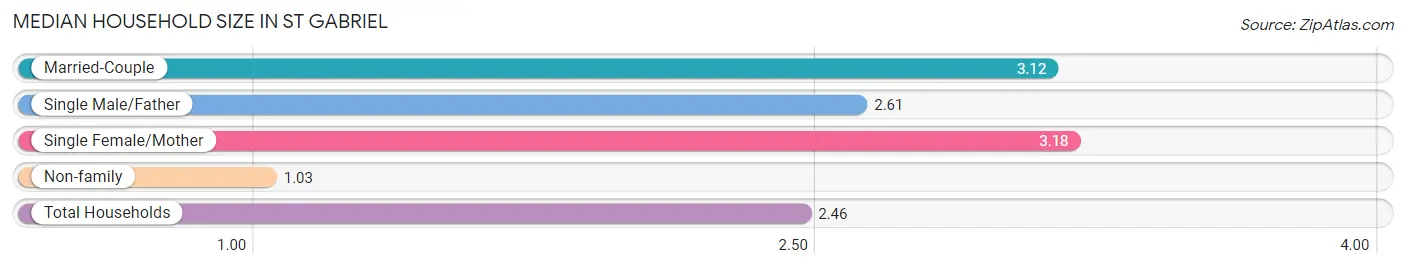
The median household size in St Gabriel is 2.46 persons per household, with single female/mother households (380 | 24.0%) accounting for the largest median household size of 3.18 persons per household. non-family households (417 | 26.4%) represent the smallest median household size with 1.03 persons per household.
| Household Type | # Households | Household Size |
| Married-Couple | 398 (25.2%) | 3.12 |
| Single Male/Father | 385 (24.4%) | 2.61 |
| Single Female/Mother | 380 (24.0%) | 3.18 |
| Non-family | 417 (26.4%) | 1.03 |
| Total Households | 1,580 (100.0%) | 2.46 |
Household Size by Marriage Status in St Gabriel
Out of a total of 1,580 households in St Gabriel, 1,163 (73.6%) are family households, while 417 (26.4%) are nonfamily households. The most numerous type of family households are 2-person households, comprising 620, and the most common type of nonfamily households are 1-person households, comprising 405.
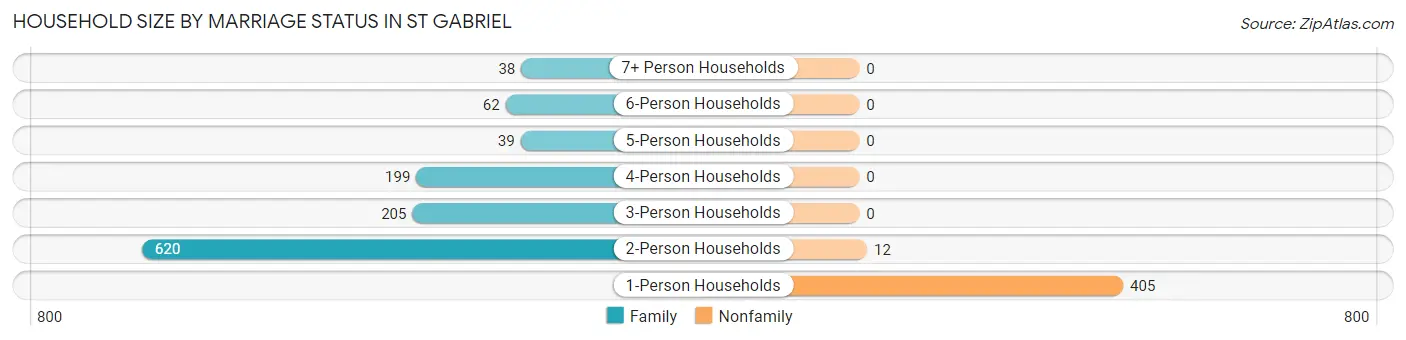
| Household Size | Family Households | Nonfamily Households |
| 1-Person Households | - | 405 (25.6%) |
| 2-Person Households | 620 (39.2%) | 12 (0.8%) |
| 3-Person Households | 205 (13.0%) | 0 (0.0%) |
| 4-Person Households | 199 (12.6%) | 0 (0.0%) |
| 5-Person Households | 39 (2.5%) | 0 (0.0%) |
| 6-Person Households | 62 (3.9%) | 0 (0.0%) |
| 7+ Person Households | 38 (2.4%) | 0 (0.0%) |
| Total | 1,163 (73.6%) | 417 (26.4%) |
Female Fertility in St Gabriel
Fertility by Age in St Gabriel
Average fertility rate in St Gabriel is 27.0 births per 1,000 women. Women in the age bracket of 20 to 34 years have the highest fertility rate with 42.0 births per 1,000 women. Women in the age bracket of 20 to 34 years acount for 100.0% of all women with births.
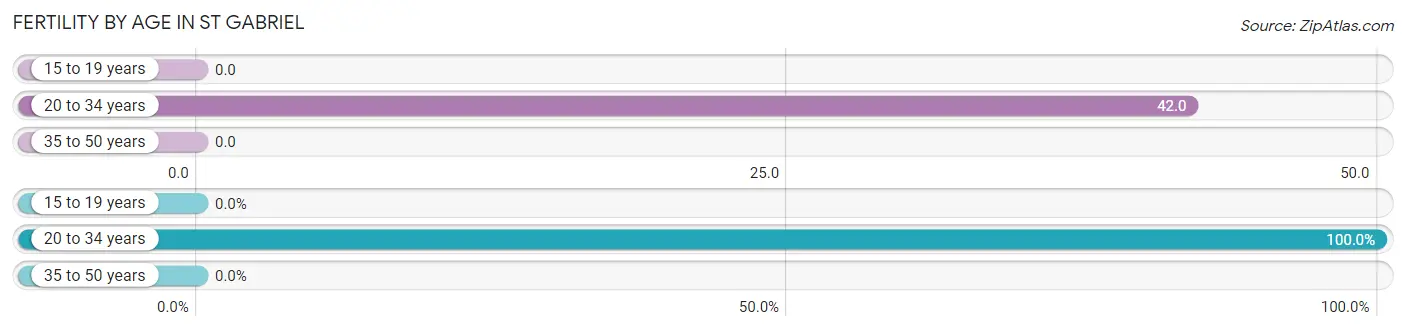
| Age Bracket | Women with Births | Births / 1,000 Women |
| 15 to 19 years | 0 (0.0%) | 0.0 |
| 20 to 34 years | 42 (100.0%) | 42.0 |
| 35 to 50 years | 0 (0.0%) | 0.0 |
| Total | 42 (100.0%) | 27.0 |
Fertility by Age by Marriage Status in St Gabriel
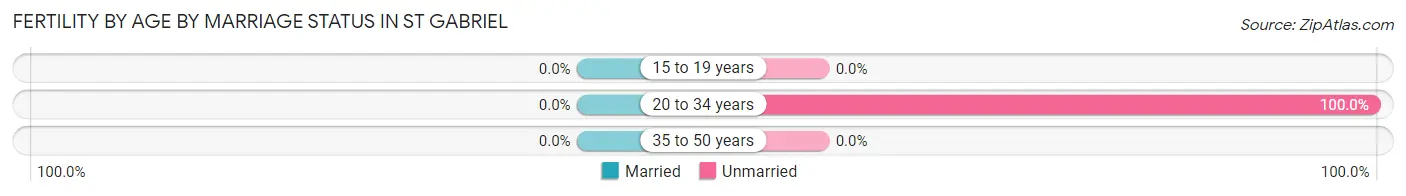
| Age Bracket | Married | Unmarried |
| 15 to 19 years | 0 (0.0%) | 0 (0.0%) |
| 20 to 34 years | 0 (0.0%) | 42 (100.0%) |
| 35 to 50 years | 0 (0.0%) | 0 (0.0%) |
| Total | 0 (0.0%) | 42 (100.0%) |
Fertility by Education in St Gabriel
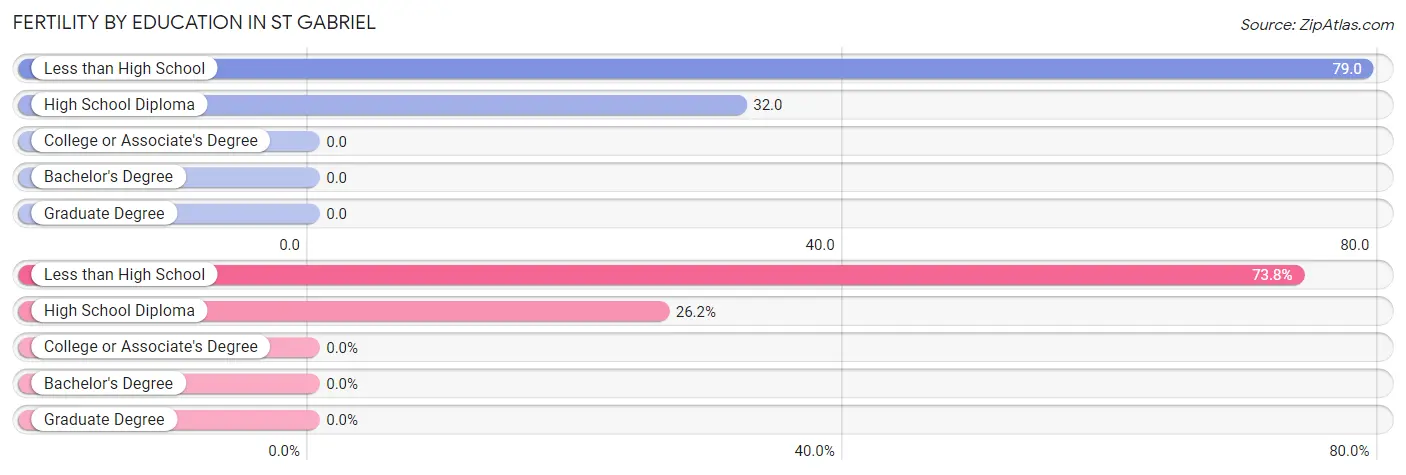
| Educational Attainment | Women with Births | Births / 1,000 Women |
| Less than High School | 31 (73.8%) | 79.0 |
| High School Diploma | 11 (26.2%) | 32.0 |
| College or Associate's Degree | 0 (0.0%) | 0.0 |
| Bachelor's Degree | 0 (0.0%) | 0.0 |
| Graduate Degree | 0 (0.0%) | 0.0 |
| Total | 42 (100.0%) | 27.0 |
Fertility by Education by Marriage Status in St Gabriel
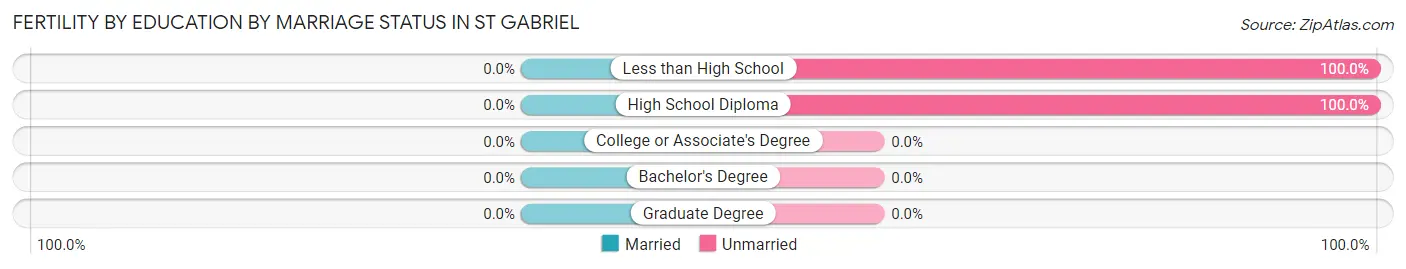
| Educational Attainment | Married | Unmarried |
| Less than High School | 0 (0.0%) | 31 (100.0%) |
| High School Diploma | 0 (0.0%) | 11 (100.0%) |
| College or Associate's Degree | 0 (0.0%) | 0 (0.0%) |
| Bachelor's Degree | 0 (0.0%) | 0 (0.0%) |
| Graduate Degree | 0 (0.0%) | 0 (0.0%) |
| Total | 0 (0.0%) | 42 (100.0%) |
Employment Characteristics in St Gabriel
Employment by Class of Employer in St Gabriel
Among the 2,387 employed individuals in St Gabriel, private company employees (1,122 | 47.0%), state government employees (522 | 21.9%), and self-employed (not incorporated) (299 | 12.5%) make up the most common classes of employment.
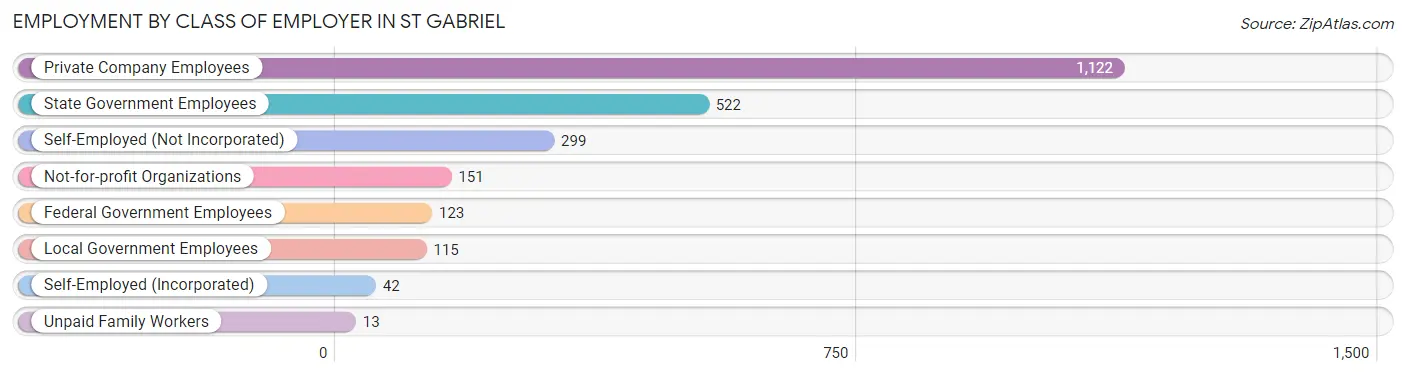
| Employer Class | # Employees | % Employees |
| Private Company Employees | 1,122 | 47.0% |
| Self-Employed (Incorporated) | 42 | 1.8% |
| Self-Employed (Not Incorporated) | 299 | 12.5% |
| Not-for-profit Organizations | 151 | 6.3% |
| Local Government Employees | 115 | 4.8% |
| State Government Employees | 522 | 21.9% |
| Federal Government Employees | 123 | 5.1% |
| Unpaid Family Workers | 13 | 0.5% |
| Total | 2,387 | 100.0% |
Employment Status by Age in St Gabriel
According to the labor force statistics for St Gabriel, out of the total population over 16 years of age (5,957), 43.7% or 2,603 individuals are in the labor force, with 6.9% or 180 of them unemployed. The age group with the highest labor force participation rate is 25 to 29 years, with 68.0% or 634 individuals in the labor force. Within the labor force, the 16 to 19 years age range has the highest percentage of unemployed individuals, with 100.0% or 62 of them being unemployed.
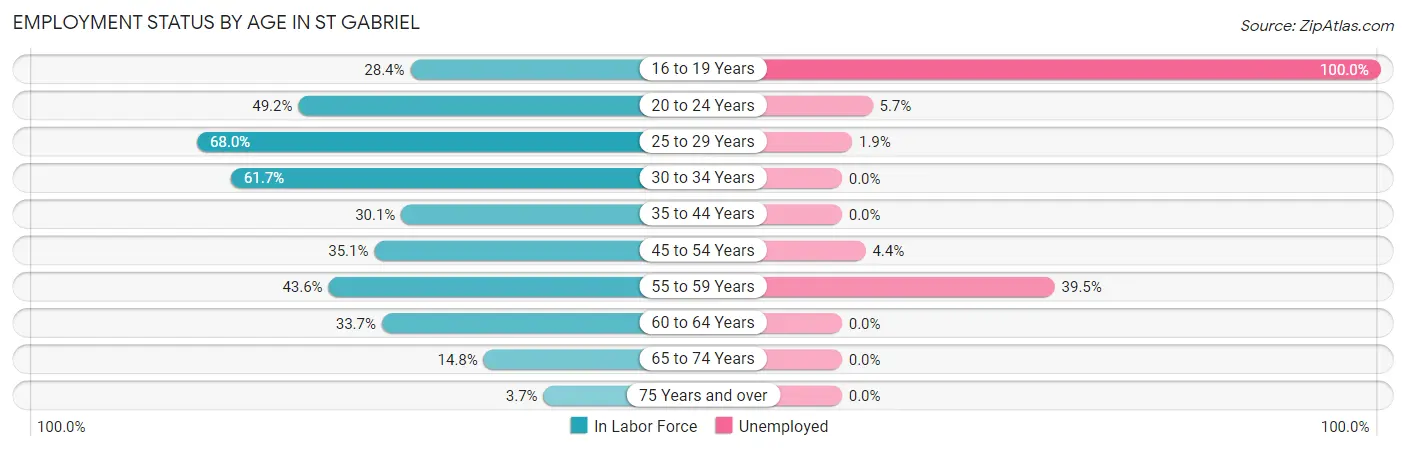
| Age Bracket | In Labor Force | Unemployed |
| 16 to 19 Years | 62 (28.4%) | 62 (100.0%) |
| 20 to 24 Years | 275 (49.2%) | 16 (5.7%) |
| 25 to 29 Years | 634 (68.0%) | 12 (1.9%) |
| 30 to 34 Years | 647 (61.7%) | 0 (0.0%) |
| 35 to 44 Years | 315 (30.1%) | 0 (0.0%) |
| 45 to 54 Years | 293 (35.1%) | 13 (4.4%) |
| 55 to 59 Years | 220 (43.6%) | 87 (39.5%) |
| 60 to 64 Years | 90 (33.7%) | 0 (0.0%) |
| 65 to 74 Years | 65 (14.8%) | 0 (0.0%) |
| 75 Years and over | 4 (3.7%) | 0 (0.0%) |
| Total | 2,603 (43.7%) | 180 (6.9%) |
Employment Status by Educational Attainment in St Gabriel
According to labor force statistics for St Gabriel, 47.5% of individuals (2,201) out of the total population between 25 and 64 years of age (4,634) are in the labor force, with 5.1% or 112 of them being unemployed. The group with the highest labor force participation rate are those with the educational attainment of bachelor's degree or higher, with 81.6% or 733 individuals in the labor force. Within the labor force, individuals with high school diploma education have the highest percentage of unemployment, with 17.9% or 98 of them being unemployed.
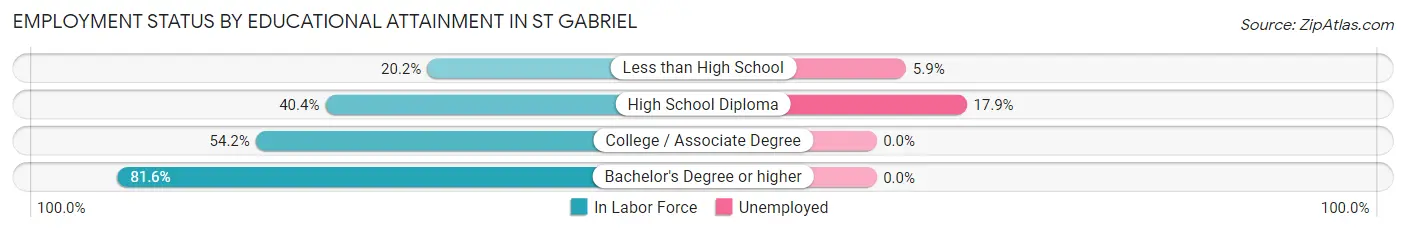
| Educational Attainment | In Labor Force | Unemployed |
| Less than High School | 220 (20.2%) | 64 (5.9%) |
| High School Diploma | 549 (40.4%) | 243 (17.9%) |
| College / Associate Degree | 698 (54.2%) | 0 (0.0%) |
| Bachelor's Degree or higher | 733 (81.6%) | 0 (0.0%) |
| Total | 2,201 (47.5%) | 236 (5.1%) |
Employment Occupations by Sex in St Gabriel
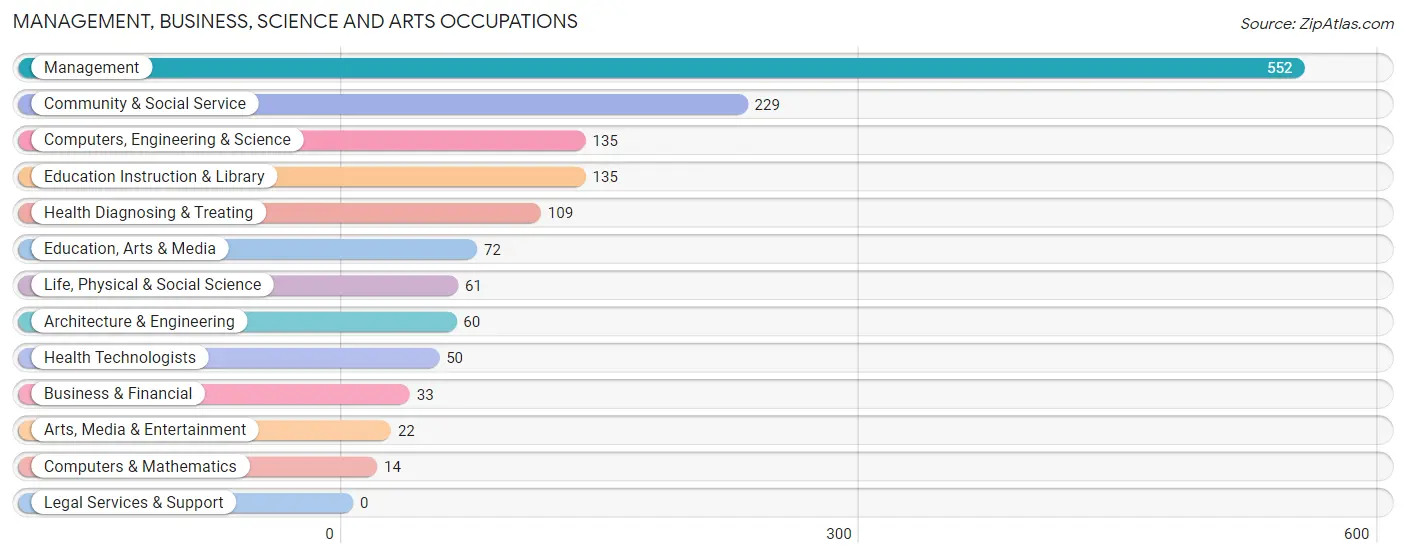
Management, Business, Science and Arts Occupations
The most common Management, Business, Science and Arts occupations in St Gabriel are Management (552 | 23.8%), Community & Social Service (229 | 9.9%), Computers, Engineering & Science (135 | 5.8%), Education Instruction & Library (135 | 5.8%), and Health Diagnosing & Treating (109 | 4.7%).
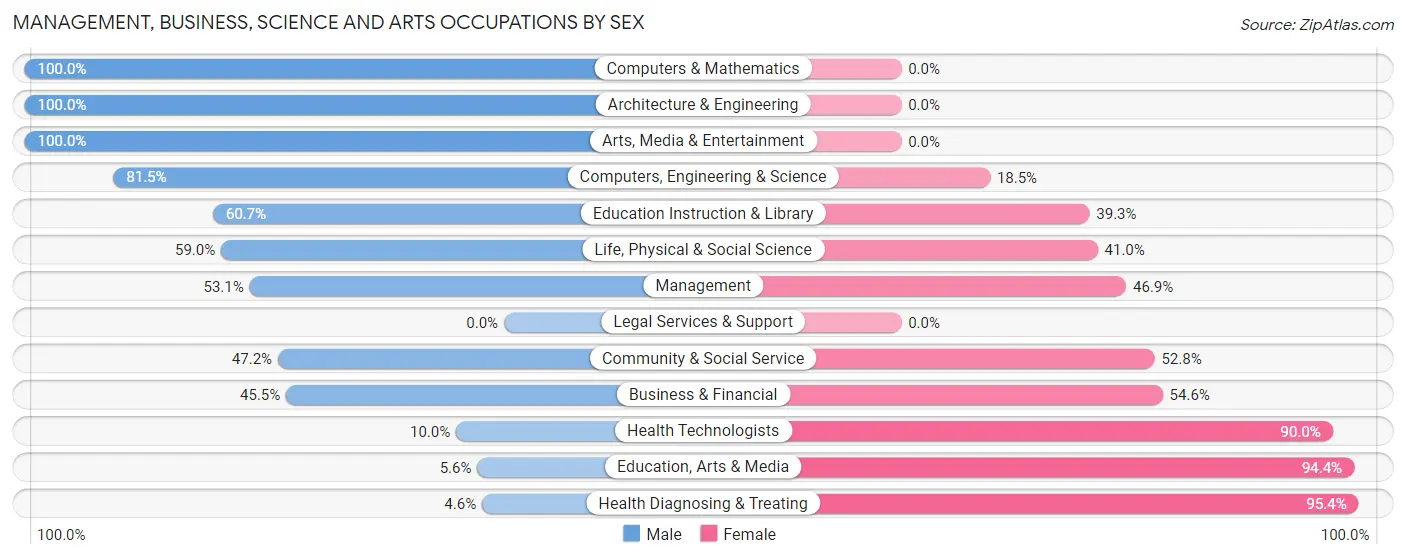
Management, Business, Science and Arts Occupations by Sex
Within the Management, Business, Science and Arts occupations in St Gabriel, the most male-oriented occupations are Computers & Mathematics (100.0%), Architecture & Engineering (100.0%), and Arts, Media & Entertainment (100.0%), while the most female-oriented occupations are Health Diagnosing & Treating (95.4%), Education, Arts & Media (94.4%), and Health Technologists (90.0%).
| Occupation | Male | Female |
| Management | 293 (53.1%) | 259 (46.9%) |
| Business & Financial | 15 (45.5%) | 18 (54.5%) |
| Computers, Engineering & Science | 110 (81.5%) | 25 (18.5%) |
| Computers & Mathematics | 14 (100.0%) | 0 (0.0%) |
| Architecture & Engineering | 60 (100.0%) | 0 (0.0%) |
| Life, Physical & Social Science | 36 (59.0%) | 25 (41.0%) |
| Community & Social Service | 108 (47.2%) | 121 (52.8%) |
| Education, Arts & Media | 4 (5.6%) | 68 (94.4%) |
| Legal Services & Support | 0 (0.0%) | 0 (0.0%) |
| Education Instruction & Library | 82 (60.7%) | 53 (39.3%) |
| Arts, Media & Entertainment | 22 (100.0%) | 0 (0.0%) |
| Health Diagnosing & Treating | 5 (4.6%) | 104 (95.4%) |
| Health Technologists | 5 (10.0%) | 45 (90.0%) |
| Total (Category) | 531 (50.2%) | 527 (49.8%) |
| Total (Overall) | 1,303 (56.3%) | 1,012 (43.7%) |
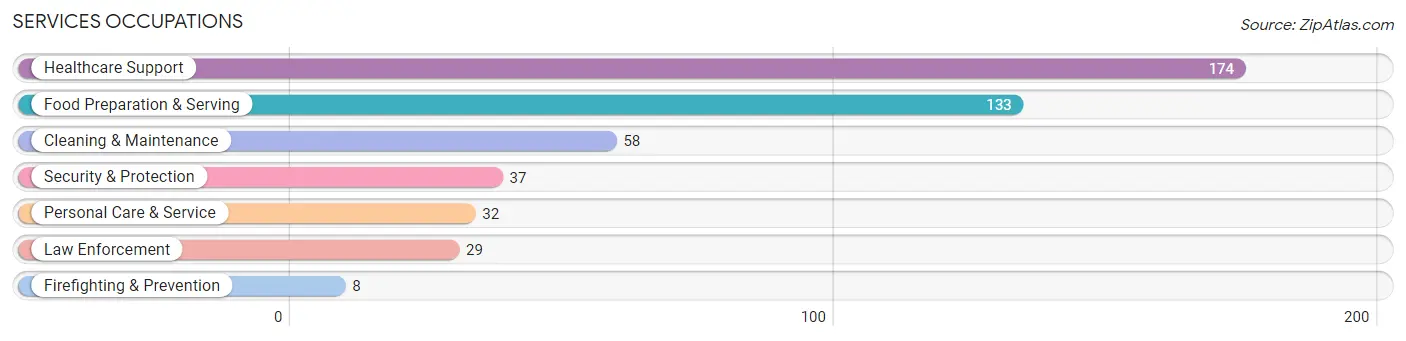
Services Occupations
The most common Services occupations in St Gabriel are Healthcare Support (174 | 7.5%), Food Preparation & Serving (133 | 5.8%), Cleaning & Maintenance (58 | 2.5%), Security & Protection (37 | 1.6%), and Personal Care & Service (32 | 1.4%).
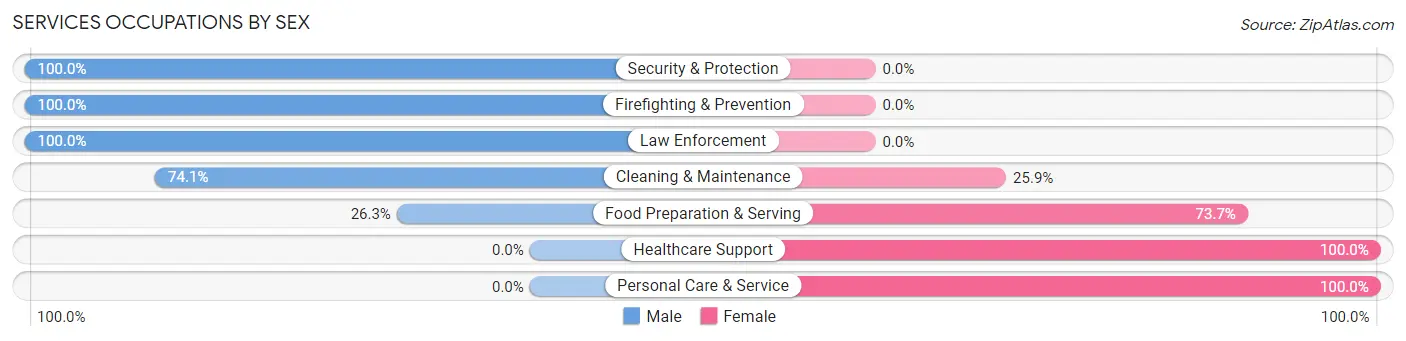
Services Occupations by Sex
Within the Services occupations in St Gabriel, the most male-oriented occupations are Security & Protection (100.0%), Firefighting & Prevention (100.0%), and Law Enforcement (100.0%), while the most female-oriented occupations are Healthcare Support (100.0%), Personal Care & Service (100.0%), and Food Preparation & Serving (73.7%).
| Occupation | Male | Female |
| Healthcare Support | 0 (0.0%) | 174 (100.0%) |
| Security & Protection | 37 (100.0%) | 0 (0.0%) |
| Firefighting & Prevention | 8 (100.0%) | 0 (0.0%) |
| Law Enforcement | 29 (100.0%) | 0 (0.0%) |
| Food Preparation & Serving | 35 (26.3%) | 98 (73.7%) |
| Cleaning & Maintenance | 43 (74.1%) | 15 (25.9%) |
| Personal Care & Service | 0 (0.0%) | 32 (100.0%) |
| Total (Category) | 115 (26.5%) | 319 (73.5%) |
| Total (Overall) | 1,303 (56.3%) | 1,012 (43.7%) |
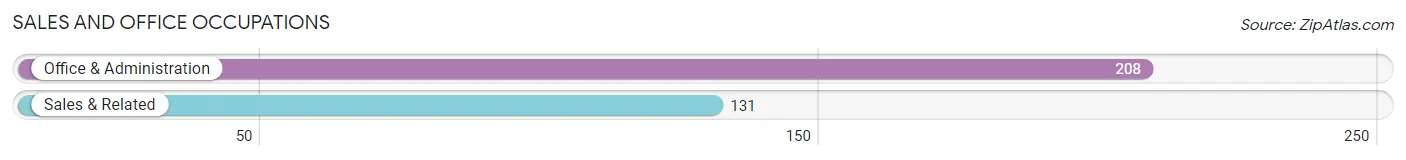
Sales and Office Occupations
The most common Sales and Office occupations in St Gabriel are Office & Administration (208 | 9.0%), and Sales & Related (131 | 5.7%).
Sales and Office Occupations by Sex
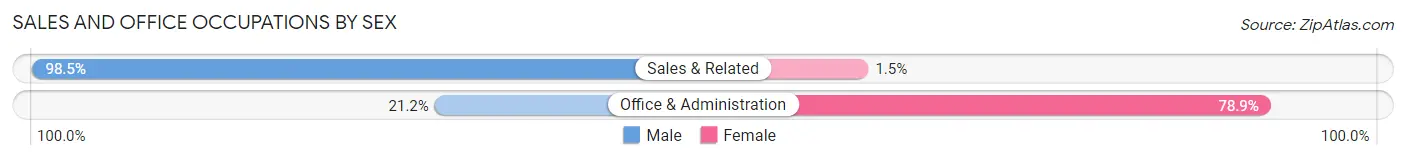
| Occupation | Male | Female |
| Sales & Related | 129 (98.5%) | 2 (1.5%) |
| Office & Administration | 44 (21.1%) | 164 (78.8%) |
| Total (Category) | 173 (51.0%) | 166 (49.0%) |
| Total (Overall) | 1,303 (56.3%) | 1,012 (43.7%) |
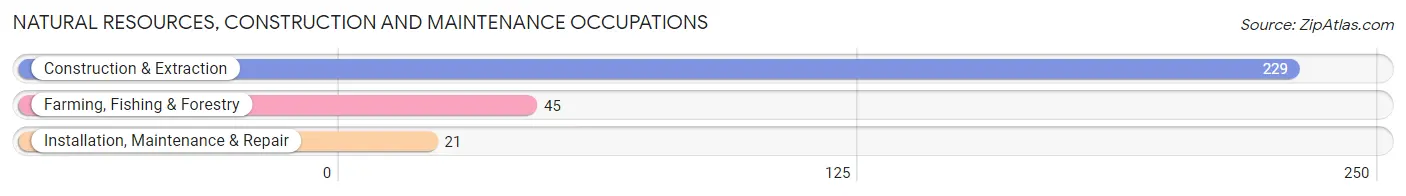
Natural Resources, Construction and Maintenance Occupations
The most common Natural Resources, Construction and Maintenance occupations in St Gabriel are Construction & Extraction (229 | 9.9%), Farming, Fishing & Forestry (45 | 1.9%), and Installation, Maintenance & Repair (21 | 0.9%).
Natural Resources, Construction and Maintenance Occupations by Sex
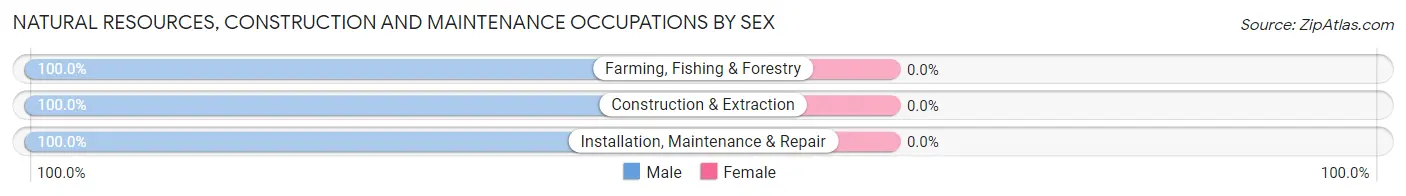
| Occupation | Male | Female |
| Farming, Fishing & Forestry | 45 (100.0%) | 0 (0.0%) |
| Construction & Extraction | 229 (100.0%) | 0 (0.0%) |
| Installation, Maintenance & Repair | 21 (100.0%) | 0 (0.0%) |
| Total (Category) | 295 (100.0%) | 0 (0.0%) |
| Total (Overall) | 1,303 (56.3%) | 1,012 (43.7%) |
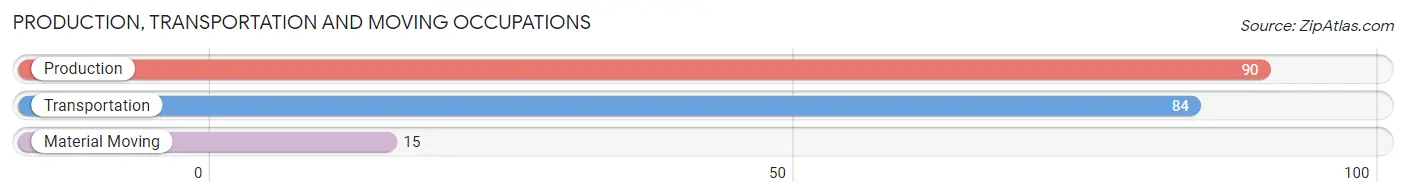
Production, Transportation and Moving Occupations
The most common Production, Transportation and Moving occupations in St Gabriel are Production (90 | 3.9%), Transportation (84 | 3.6%), and Material Moving (15 | 0.6%).
Production, Transportation and Moving Occupations by Sex
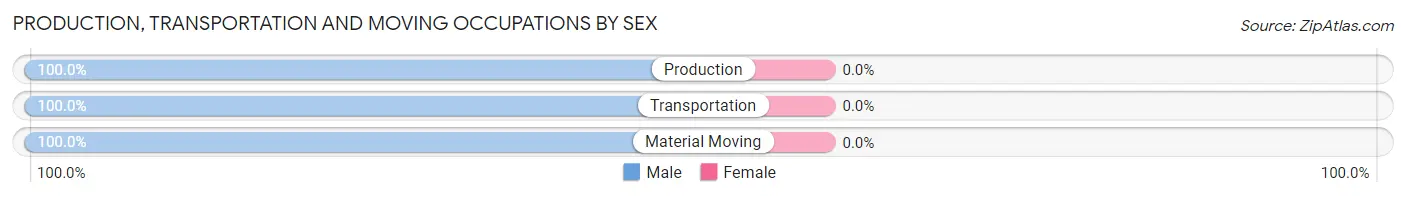
| Occupation | Male | Female |
| Production | 90 (100.0%) | 0 (0.0%) |
| Transportation | 84 (100.0%) | 0 (0.0%) |
| Material Moving | 15 (100.0%) | 0 (0.0%) |
| Total (Category) | 189 (100.0%) | 0 (0.0%) |
| Total (Overall) | 1,303 (56.3%) | 1,012 (43.7%) |
Employment Industries by Sex in St Gabriel
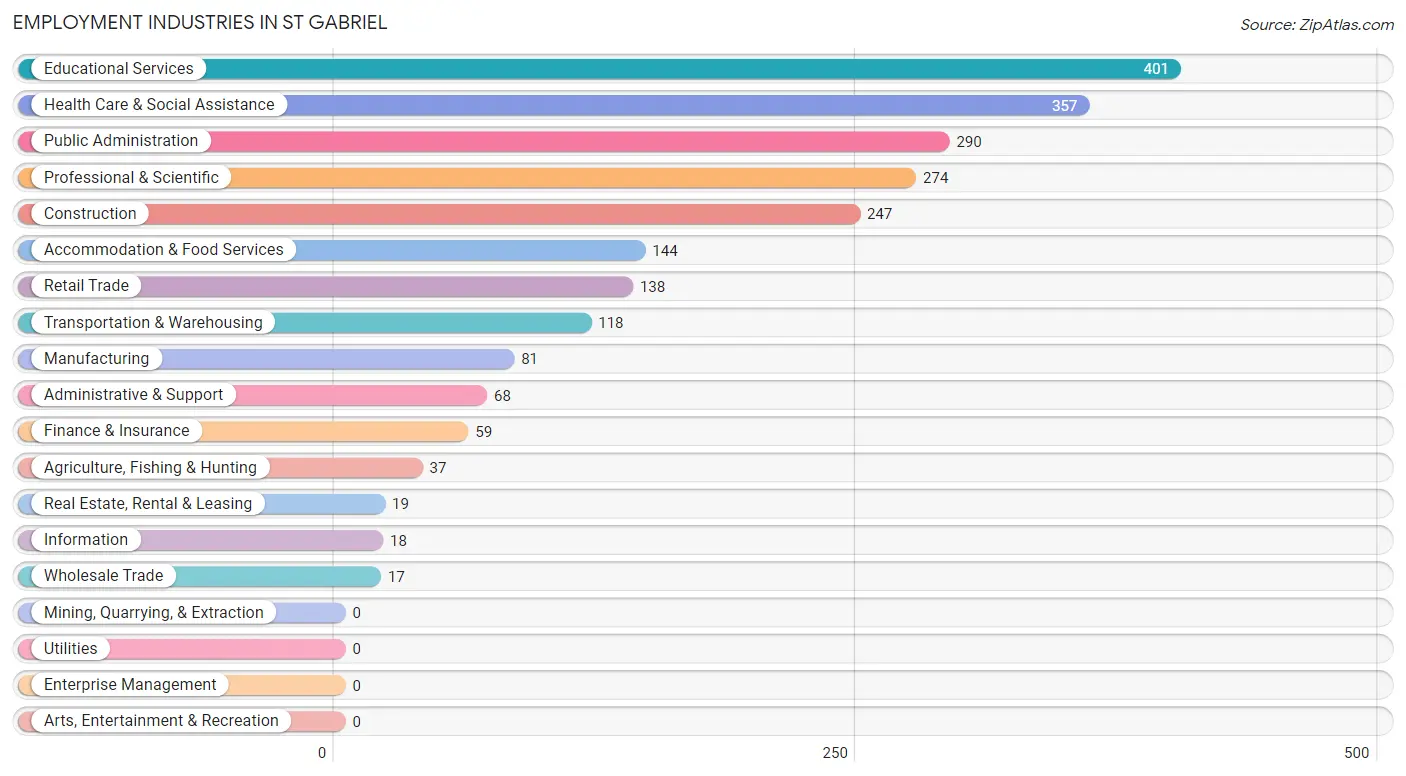
Employment Industries in St Gabriel
The major employment industries in St Gabriel include Educational Services (401 | 17.3%), Health Care & Social Assistance (357 | 15.4%), Public Administration (290 | 12.5%), Professional & Scientific (274 | 11.8%), and Construction (247 | 10.7%).
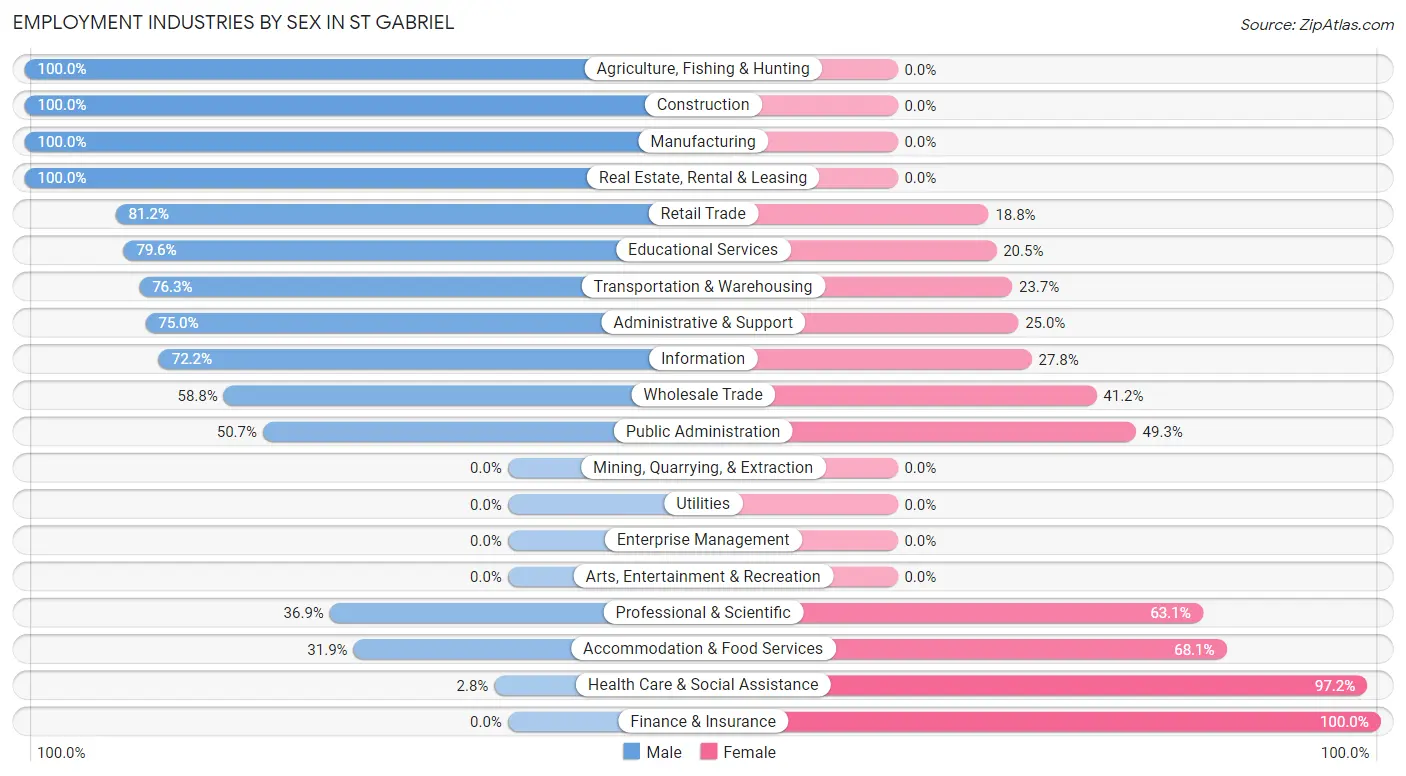
Employment Industries by Sex in St Gabriel
The St Gabriel industries that see more men than women are Agriculture, Fishing & Hunting (100.0%), Construction (100.0%), and Manufacturing (100.0%), whereas the industries that tend to have a higher number of women are Finance & Insurance (100.0%), Health Care & Social Assistance (97.2%), and Accommodation & Food Services (68.1%).
| Industry | Male | Female |
| Agriculture, Fishing & Hunting | 37 (100.0%) | 0 (0.0%) |
| Mining, Quarrying, & Extraction | 0 (0.0%) | 0 (0.0%) |
| Construction | 247 (100.0%) | 0 (0.0%) |
| Manufacturing | 81 (100.0%) | 0 (0.0%) |
| Wholesale Trade | 10 (58.8%) | 7 (41.2%) |
| Retail Trade | 112 (81.2%) | 26 (18.8%) |
| Transportation & Warehousing | 90 (76.3%) | 28 (23.7%) |
| Utilities | 0 (0.0%) | 0 (0.0%) |
| Information | 13 (72.2%) | 5 (27.8%) |
| Finance & Insurance | 0 (0.0%) | 59 (100.0%) |
| Real Estate, Rental & Leasing | 19 (100.0%) | 0 (0.0%) |
| Professional & Scientific | 101 (36.9%) | 173 (63.1%) |
| Enterprise Management | 0 (0.0%) | 0 (0.0%) |
| Administrative & Support | 51 (75.0%) | 17 (25.0%) |
| Educational Services | 319 (79.5%) | 82 (20.4%) |
| Health Care & Social Assistance | 10 (2.8%) | 347 (97.2%) |
| Arts, Entertainment & Recreation | 0 (0.0%) | 0 (0.0%) |
| Accommodation & Food Services | 46 (31.9%) | 98 (68.1%) |
| Public Administration | 147 (50.7%) | 143 (49.3%) |
| Total | 1,303 (56.3%) | 1,012 (43.7%) |
Education in St Gabriel
School Enrollment in St Gabriel
The most common levels of schooling among the 1,118 students in St Gabriel are high school (400 | 35.8%), graduate / professional (239 | 21.4%), and college / undergraduate (229 | 20.5%).
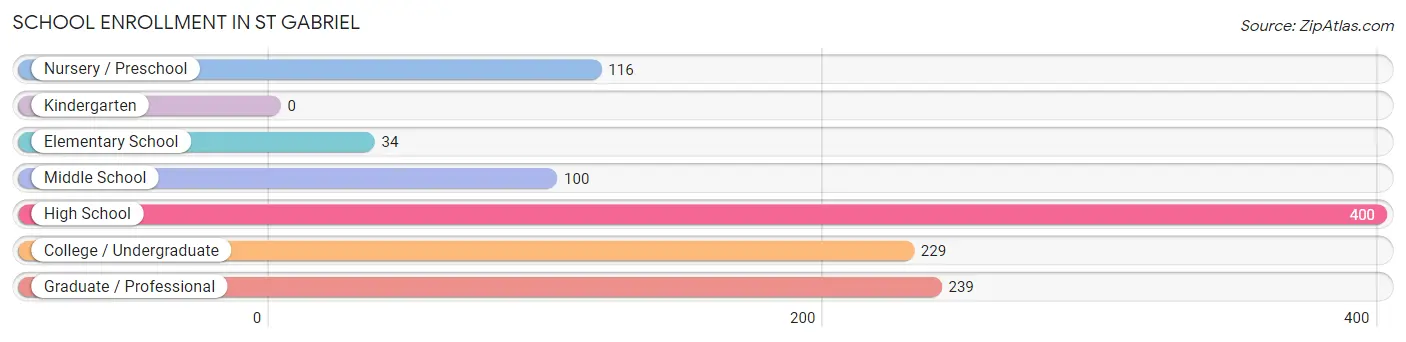
| School Level | # Students | % Students |
| Nursery / Preschool | 116 | 10.4% |
| Kindergarten | 0 | 0.0% |
| Elementary School | 34 | 3.0% |
| Middle School | 100 | 8.9% |
| High School | 400 | 35.8% |
| College / Undergraduate | 229 | 20.5% |
| Graduate / Professional | 239 | 21.4% |
| Total | 1,118 | 100.0% |
School Enrollment by Age by Funding Source in St Gabriel
Out of a total of 1,118 students who are enrolled in schools in St Gabriel, 130 (11.6%) attend a private institution, while the remaining 988 (88.4%) are enrolled in public schools. The age group of 20 to 24 year olds has the highest likelihood of being enrolled in private schools, with 35 (43.2% in the age bracket) enrolled. Conversely, the age group of 5 to 9 year old has the lowest likelihood of being enrolled in a private school, with 82 (100.0% in the age bracket) attending a public institution.
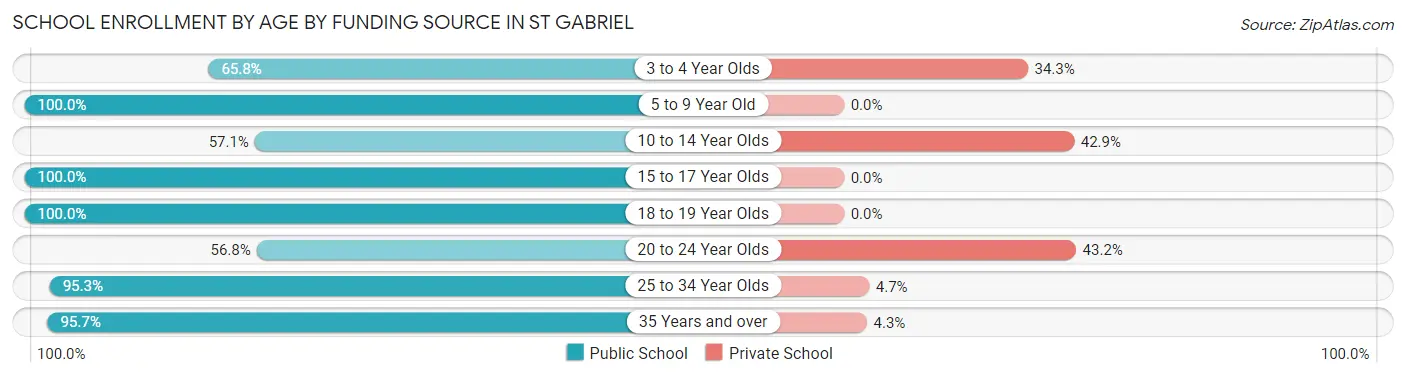
| Age Bracket | Public School | Private School |
| 3 to 4 Year Olds | 48 (65.7%) | 25 (34.3%) |
| 5 to 9 Year Old | 82 (100.0%) | 0 (0.0%) |
| 10 to 14 Year Olds | 60 (57.1%) | 45 (42.9%) |
| 15 to 17 Year Olds | 163 (100.0%) | 0 (0.0%) |
| 18 to 19 Year Olds | 60 (100.0%) | 0 (0.0%) |
| 20 to 24 Year Olds | 46 (56.8%) | 35 (43.2%) |
| 25 to 34 Year Olds | 305 (95.3%) | 15 (4.7%) |
| 35 Years and over | 224 (95.7%) | 10 (4.3%) |
| Total | 988 (88.4%) | 130 (11.6%) |
Educational Attainment by Field of Study in St Gabriel
Bio, nature & agricultural (233 | 23.5%), education (143 | 14.4%), arts & humanities (131 | 13.2%), business (100 | 10.1%), and communications (74 | 7.5%) are the most common fields of study among 991 individuals in St Gabriel who have obtained a bachelor's degree or higher.
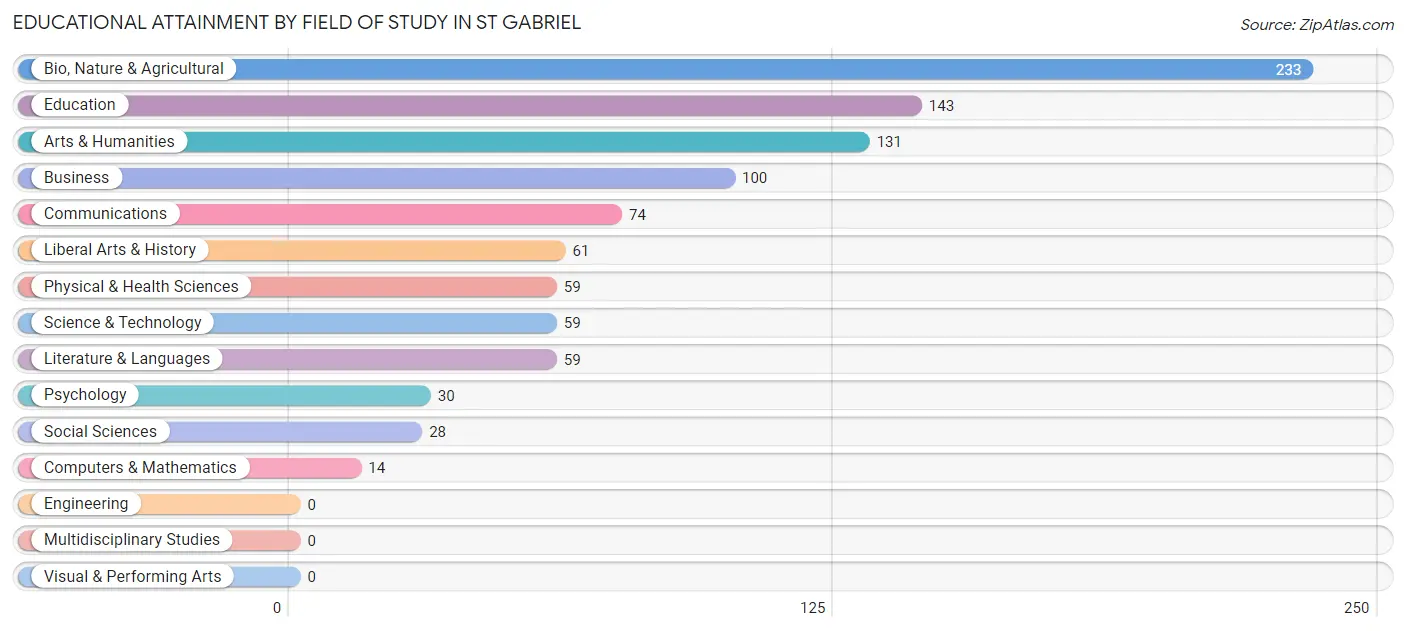
| Field of Study | # Graduates | % Graduates |
| Computers & Mathematics | 14 | 1.4% |
| Bio, Nature & Agricultural | 233 | 23.5% |
| Physical & Health Sciences | 59 | 5.9% |
| Psychology | 30 | 3.0% |
| Social Sciences | 28 | 2.8% |
| Engineering | 0 | 0.0% |
| Multidisciplinary Studies | 0 | 0.0% |
| Science & Technology | 59 | 5.9% |
| Business | 100 | 10.1% |
| Education | 143 | 14.4% |
| Literature & Languages | 59 | 5.9% |
| Liberal Arts & History | 61 | 6.2% |
| Visual & Performing Arts | 0 | 0.0% |
| Communications | 74 | 7.5% |
| Arts & Humanities | 131 | 13.2% |
| Total | 991 | 100.0% |
Transportation & Commute in St Gabriel
Vehicle Availability by Sex in St Gabriel
The most prevalent vehicle ownership categories in St Gabriel are males with 2 vehicles (626, accounting for 51.2%) and females with 2 vehicles (359, making up 62.3%).
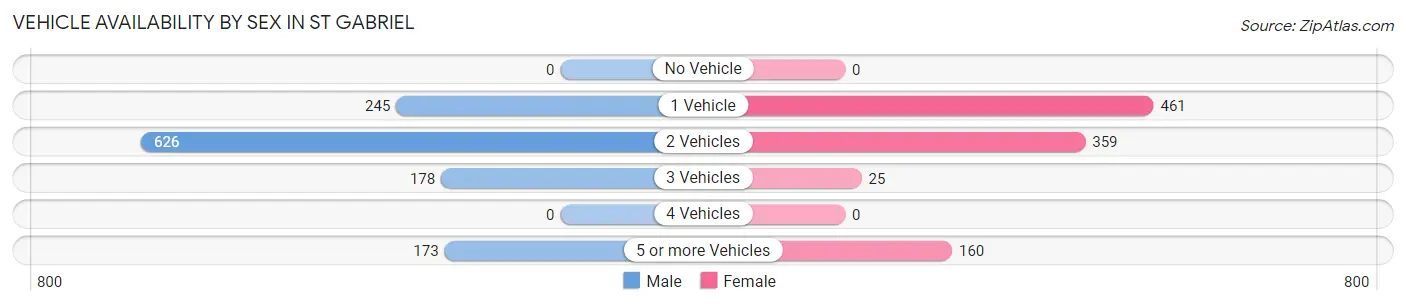
| Vehicles Available | Male | Female |
| No Vehicle | 0 (0.0%) | 0 (0.0%) |
| 1 Vehicle | 245 (20.1%) | 461 (45.9%) |
| 2 Vehicles | 626 (51.2%) | 359 (35.7%) |
| 3 Vehicles | 178 (14.6%) | 25 (2.5%) |
| 4 Vehicles | 0 (0.0%) | 0 (0.0%) |
| 5 or more Vehicles | 173 (14.2%) | 160 (15.9%) |
| Total | 1,222 (100.0%) | 1,005 (100.0%) |
Commute Time in St Gabriel
The most frequently occuring commute durations in St Gabriel are 5 to 9 minutes (435 commuters, 19.9%), 20 to 24 minutes (322 commuters, 14.7%), and 25 to 29 minutes (281 commuters, 12.9%).
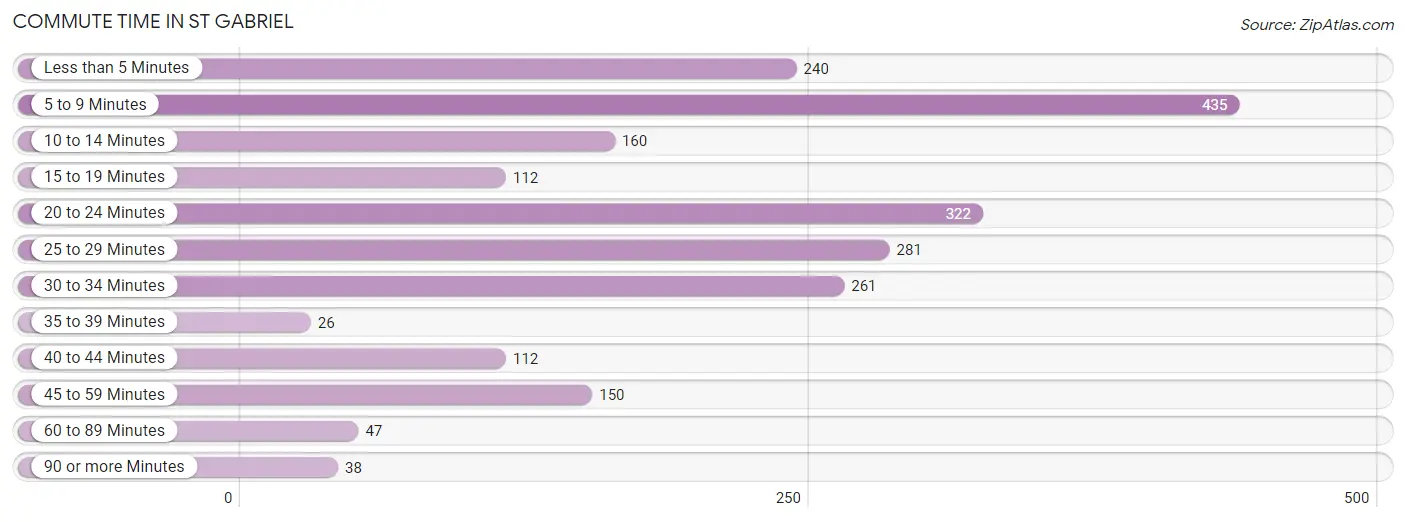
| Commute Time | # Commuters | % Commuters |
| Less than 5 Minutes | 240 | 11.0% |
| 5 to 9 Minutes | 435 | 19.9% |
| 10 to 14 Minutes | 160 | 7.3% |
| 15 to 19 Minutes | 112 | 5.1% |
| 20 to 24 Minutes | 322 | 14.7% |
| 25 to 29 Minutes | 281 | 12.9% |
| 30 to 34 Minutes | 261 | 11.9% |
| 35 to 39 Minutes | 26 | 1.2% |
| 40 to 44 Minutes | 112 | 5.1% |
| 45 to 59 Minutes | 150 | 6.9% |
| 60 to 89 Minutes | 47 | 2.1% |
| 90 or more Minutes | 38 | 1.7% |
Commute Time by Sex in St Gabriel
The most common commute times in St Gabriel are 5 to 9 minutes (350 commuters, 28.8%) for males and 20 to 24 minutes (243 commuters, 25.1%) for females.
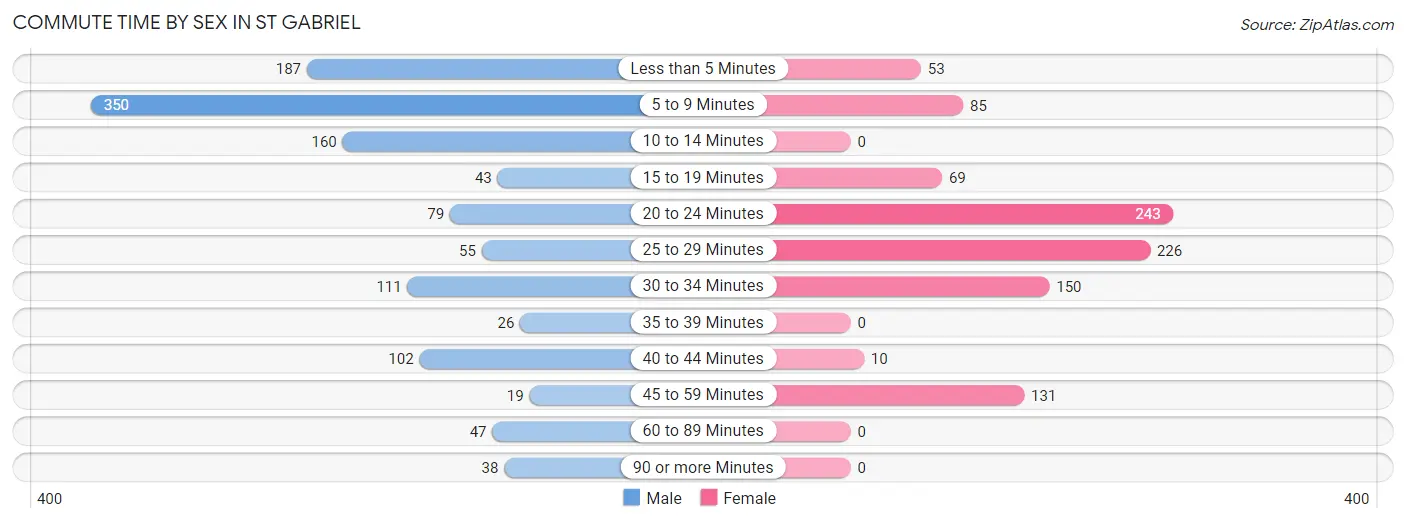
| Commute Time | Male | Female |
| Less than 5 Minutes | 187 (15.4%) | 53 (5.5%) |
| 5 to 9 Minutes | 350 (28.8%) | 85 (8.8%) |
| 10 to 14 Minutes | 160 (13.2%) | 0 (0.0%) |
| 15 to 19 Minutes | 43 (3.5%) | 69 (7.1%) |
| 20 to 24 Minutes | 79 (6.5%) | 243 (25.1%) |
| 25 to 29 Minutes | 55 (4.5%) | 226 (23.4%) |
| 30 to 34 Minutes | 111 (9.1%) | 150 (15.5%) |
| 35 to 39 Minutes | 26 (2.1%) | 0 (0.0%) |
| 40 to 44 Minutes | 102 (8.4%) | 10 (1.0%) |
| 45 to 59 Minutes | 19 (1.6%) | 131 (13.6%) |
| 60 to 89 Minutes | 47 (3.9%) | 0 (0.0%) |
| 90 or more Minutes | 38 (3.1%) | 0 (0.0%) |
Time of Departure to Work by Sex in St Gabriel
The most frequent times of departure to work in St Gabriel are 7:00 AM to 7:29 AM (415, 34.1%) for males and 7:30 AM to 7:59 AM (237, 24.5%) for females.
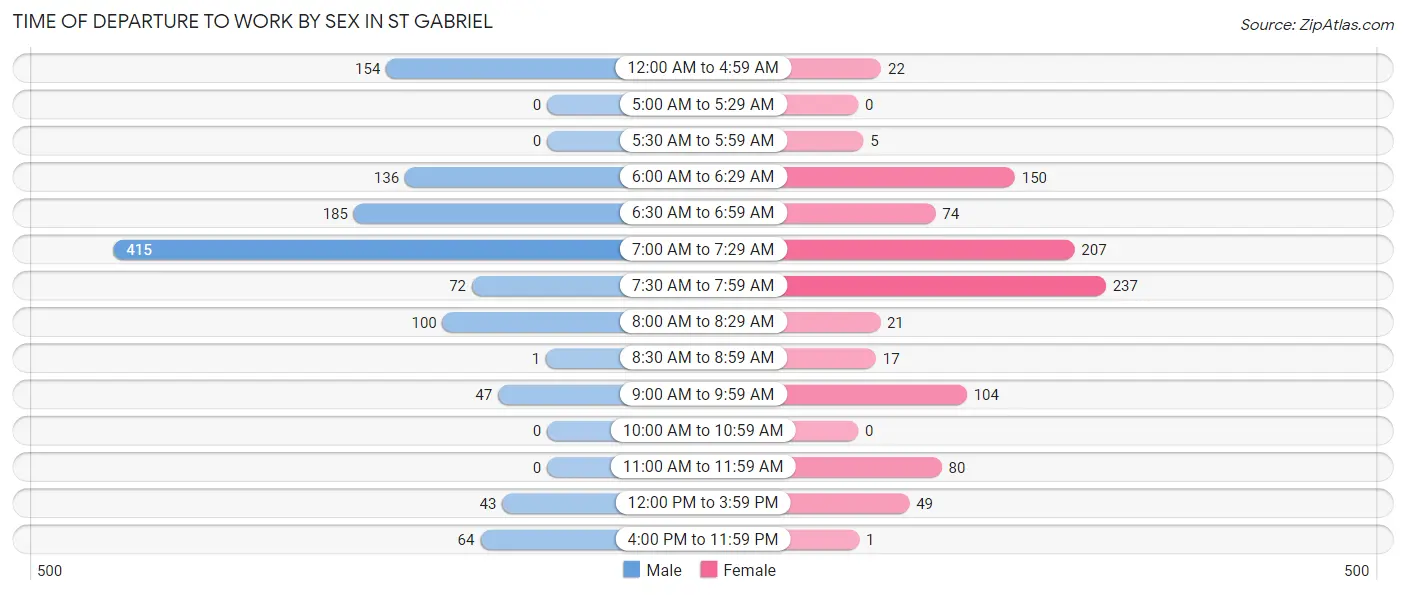
| Time of Departure | Male | Female |
| 12:00 AM to 4:59 AM | 154 (12.7%) | 22 (2.3%) |
| 5:00 AM to 5:29 AM | 0 (0.0%) | 0 (0.0%) |
| 5:30 AM to 5:59 AM | 0 (0.0%) | 5 (0.5%) |
| 6:00 AM to 6:29 AM | 136 (11.2%) | 150 (15.5%) |
| 6:30 AM to 6:59 AM | 185 (15.2%) | 74 (7.6%) |
| 7:00 AM to 7:29 AM | 415 (34.1%) | 207 (21.4%) |
| 7:30 AM to 7:59 AM | 72 (5.9%) | 237 (24.5%) |
| 8:00 AM to 8:29 AM | 100 (8.2%) | 21 (2.2%) |
| 8:30 AM to 8:59 AM | 1 (0.1%) | 17 (1.8%) |
| 9:00 AM to 9:59 AM | 47 (3.9%) | 104 (10.7%) |
| 10:00 AM to 10:59 AM | 0 (0.0%) | 0 (0.0%) |
| 11:00 AM to 11:59 AM | 0 (0.0%) | 80 (8.3%) |
| 12:00 PM to 3:59 PM | 43 (3.5%) | 49 (5.1%) |
| 4:00 PM to 11:59 PM | 64 (5.3%) | 1 (0.1%) |
| Total | 1,217 (100.0%) | 967 (100.0%) |
Housing Occupancy in St Gabriel
Occupancy by Ownership in St Gabriel
Of the total 1,580 dwellings in St Gabriel, owner-occupied units account for 1,013 (64.1%), while renter-occupied units make up 567 (35.9%).
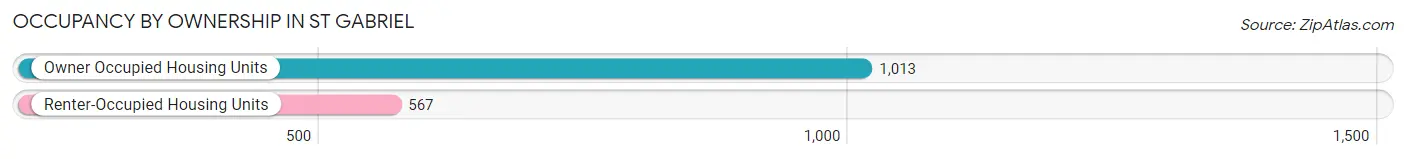
| Occupancy | # Housing Units | % Housing Units |
| Owner Occupied Housing Units | 1,013 | 64.1% |
| Renter-Occupied Housing Units | 567 | 35.9% |
| Total Occupied Housing Units | 1,580 | 100.0% |
Occupancy by Household Size in St Gabriel
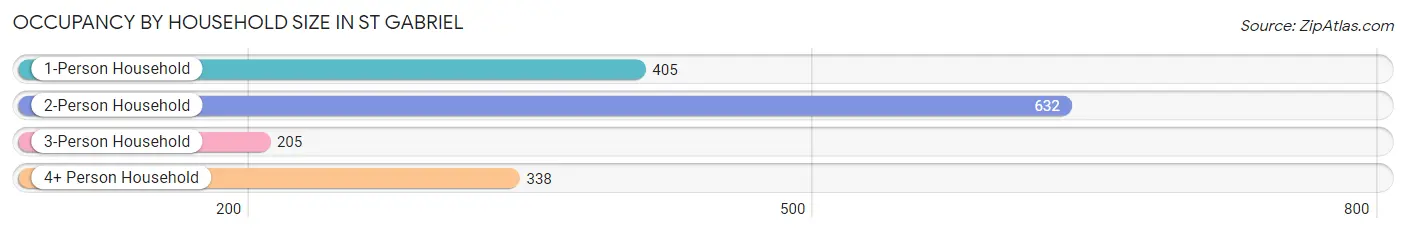
| Household Size | # Housing Units | % Housing Units |
| 1-Person Household | 405 | 25.6% |
| 2-Person Household | 632 | 40.0% |
| 3-Person Household | 205 | 13.0% |
| 4+ Person Household | 338 | 21.4% |
| Total Housing Units | 1,580 | 100.0% |
Occupancy by Ownership by Household Size in St Gabriel
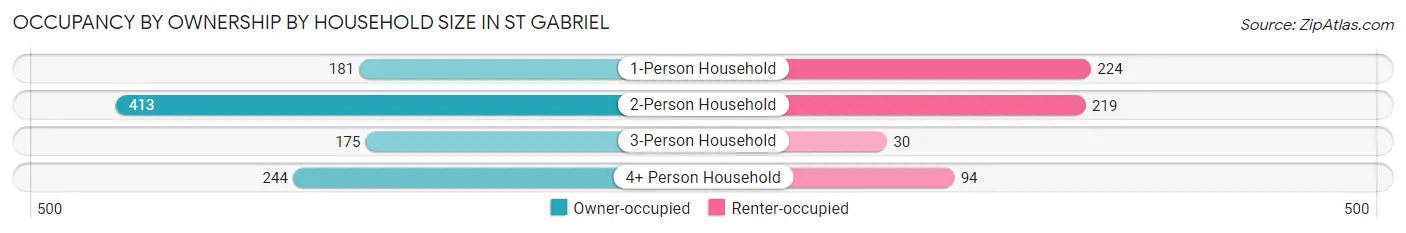
| Household Size | Owner-occupied | Renter-occupied |
| 1-Person Household | 181 (44.7%) | 224 (55.3%) |
| 2-Person Household | 413 (65.3%) | 219 (34.6%) |
| 3-Person Household | 175 (85.4%) | 30 (14.6%) |
| 4+ Person Household | 244 (72.2%) | 94 (27.8%) |
| Total Housing Units | 1,013 (64.1%) | 567 (35.9%) |
Occupancy by Educational Attainment in St Gabriel
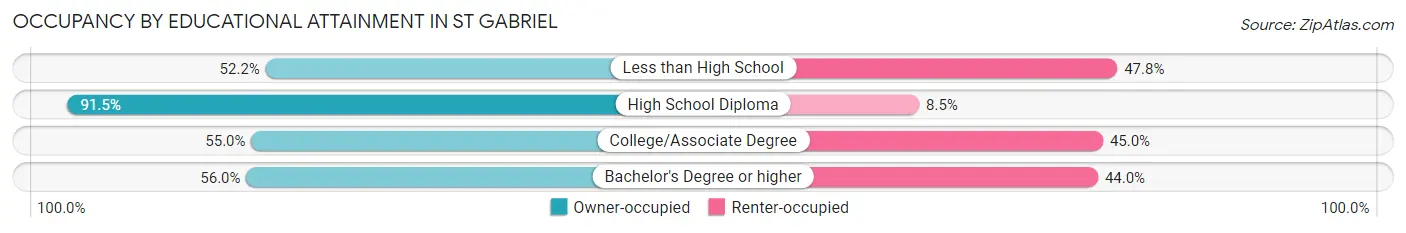
| Household Size | Owner-occupied | Renter-occupied |
| Less than High School | 59 (52.2%) | 54 (47.8%) |
| High School Diploma | 355 (91.5%) | 33 (8.5%) |
| College/Associate Degree | 311 (55.0%) | 254 (45.0%) |
| Bachelor's Degree or higher | 288 (56.0%) | 226 (44.0%) |
Occupancy by Age of Householder in St Gabriel
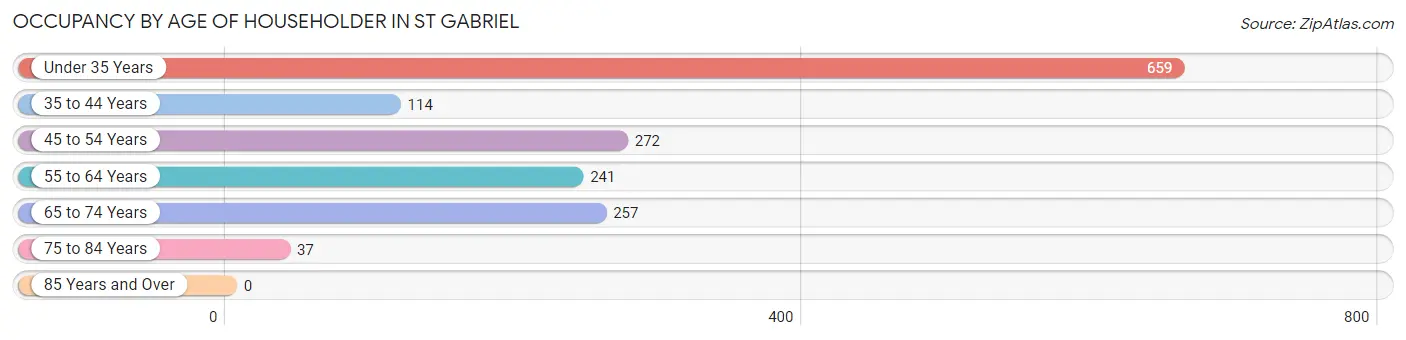
| Age Bracket | # Households | % Households |
| Under 35 Years | 659 | 41.7% |
| 35 to 44 Years | 114 | 7.2% |
| 45 to 54 Years | 272 | 17.2% |
| 55 to 64 Years | 241 | 15.2% |
| 65 to 74 Years | 257 | 16.3% |
| 75 to 84 Years | 37 | 2.3% |
| 85 Years and Over | 0 | 0.0% |
| Total | 1,580 | 100.0% |
Housing Finances in St Gabriel
Median Income by Occupancy in St Gabriel
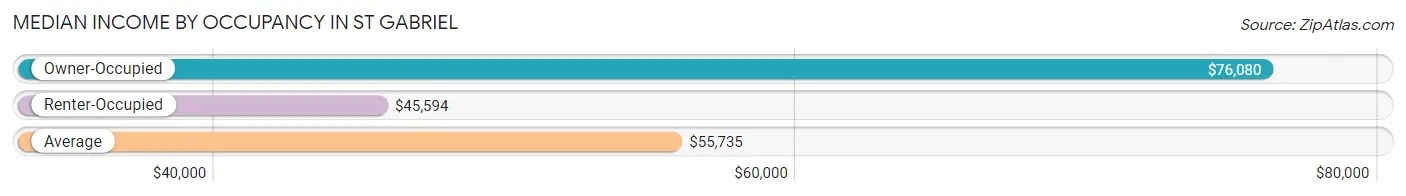
| Occupancy Type | # Households | Median Income |
| Owner-Occupied | 1,013 (64.1%) | $76,080 |
| Renter-Occupied | 567 (35.9%) | $45,594 |
| Average | 1,580 (100.0%) | $55,735 |
Occupancy by Householder Income Bracket in St Gabriel
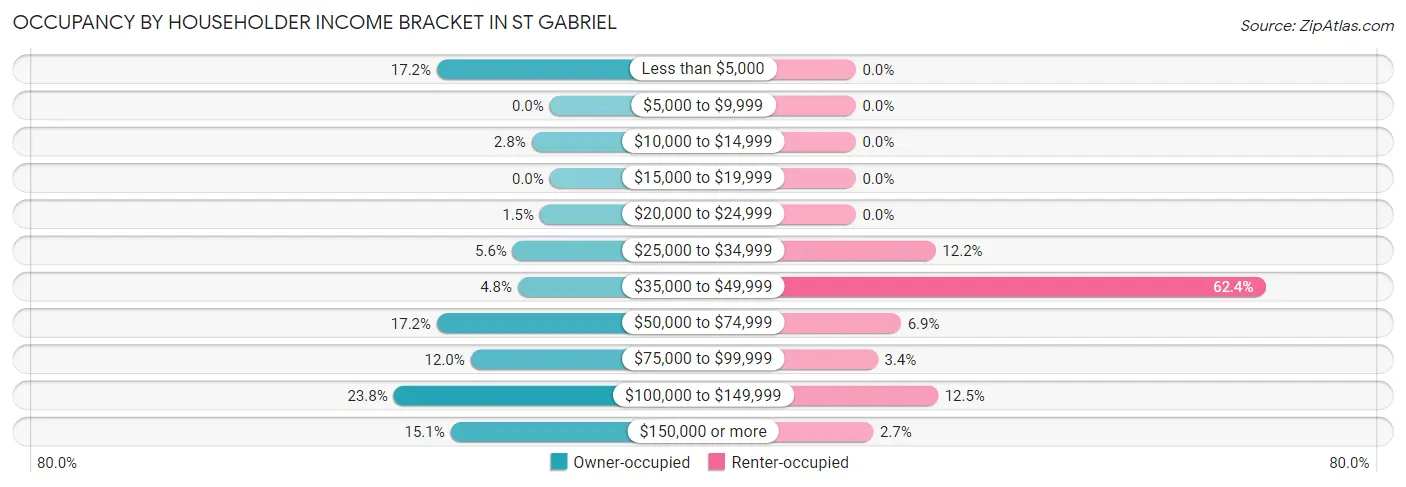
| Income Bracket | Owner-occupied | Renter-occupied |
| Less than $5,000 | 174 (17.2%) | 0 (0.0%) |
| $5,000 to $9,999 | 0 (0.0%) | 0 (0.0%) |
| $10,000 to $14,999 | 28 (2.8%) | 0 (0.0%) |
| $15,000 to $19,999 | 0 (0.0%) | 0 (0.0%) |
| $20,000 to $24,999 | 15 (1.5%) | 0 (0.0%) |
| $25,000 to $34,999 | 57 (5.6%) | 69 (12.2%) |
| $35,000 to $49,999 | 49 (4.8%) | 354 (62.4%) |
| $50,000 to $74,999 | 174 (17.2%) | 39 (6.9%) |
| $75,000 to $99,999 | 122 (12.0%) | 19 (3.4%) |
| $100,000 to $149,999 | 241 (23.8%) | 71 (12.5%) |
| $150,000 or more | 153 (15.1%) | 15 (2.6%) |
| Total | 1,013 (100.0%) | 567 (100.0%) |
Monthly Housing Cost Tiers in St Gabriel
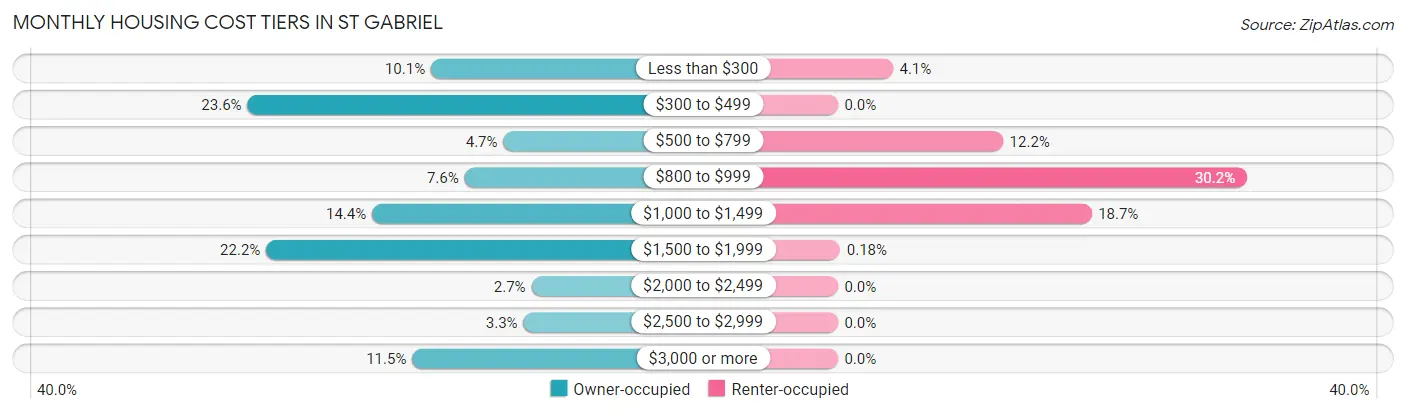
| Monthly Cost | Owner-occupied | Renter-occupied |
| Less than $300 | 102 (10.1%) | 23 (4.1%) |
| $300 to $499 | 239 (23.6%) | 0 (0.0%) |
| $500 to $799 | 48 (4.7%) | 69 (12.2%) |
| $800 to $999 | 77 (7.6%) | 171 (30.2%) |
| $1,000 to $1,499 | 146 (14.4%) | 106 (18.7%) |
| $1,500 to $1,999 | 225 (22.2%) | 1 (0.2%) |
| $2,000 to $2,499 | 27 (2.7%) | 0 (0.0%) |
| $2,500 to $2,999 | 33 (3.3%) | 0 (0.0%) |
| $3,000 or more | 116 (11.5%) | 0 (0.0%) |
| Total | 1,013 (100.0%) | 567 (100.0%) |
Physical Housing Characteristics in St Gabriel
Housing Structures in St Gabriel
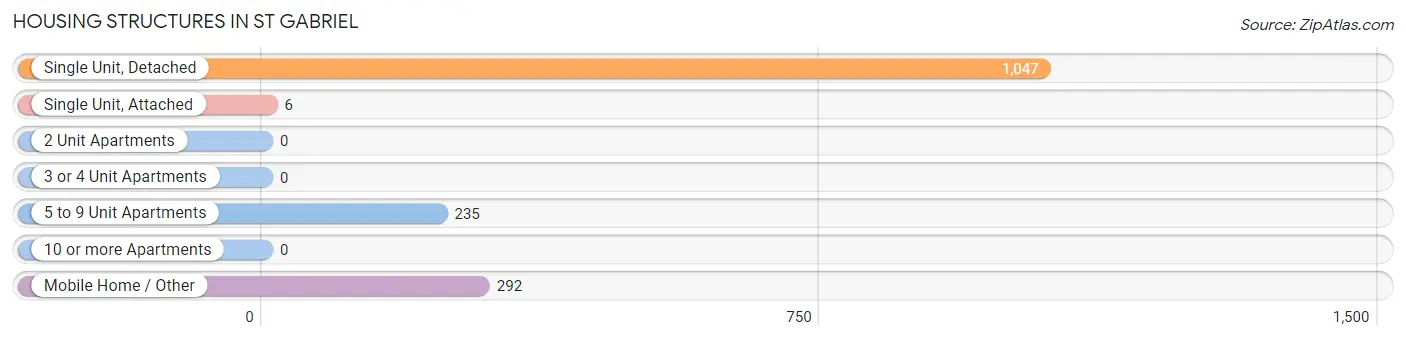
| Structure Type | # Housing Units | % Housing Units |
| Single Unit, Detached | 1,047 | 66.3% |
| Single Unit, Attached | 6 | 0.4% |
| 2 Unit Apartments | 0 | 0.0% |
| 3 or 4 Unit Apartments | 0 | 0.0% |
| 5 to 9 Unit Apartments | 235 | 14.9% |
| 10 or more Apartments | 0 | 0.0% |
| Mobile Home / Other | 292 | 18.5% |
| Total | 1,580 | 100.0% |
Housing Structures by Occupancy in St Gabriel
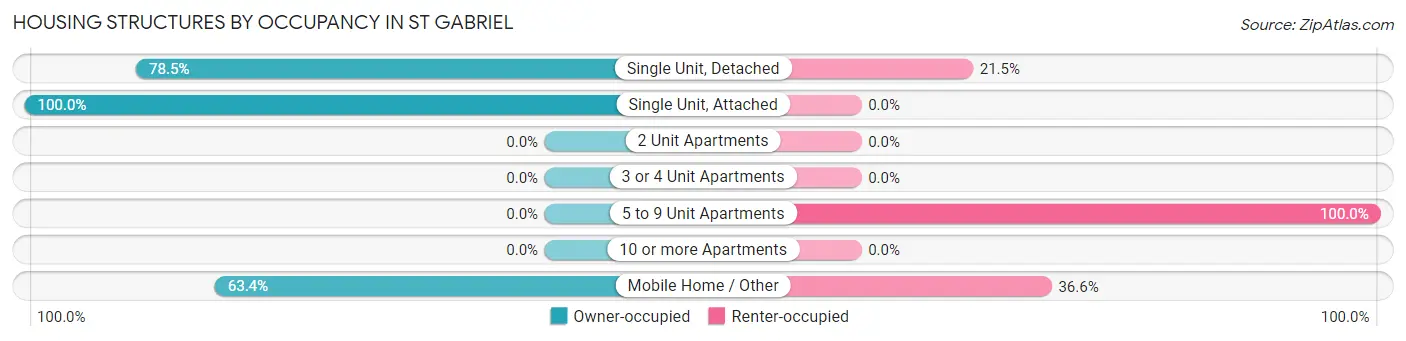
| Structure Type | Owner-occupied | Renter-occupied |
| Single Unit, Detached | 822 (78.5%) | 225 (21.5%) |
| Single Unit, Attached | 6 (100.0%) | 0 (0.0%) |
| 2 Unit Apartments | 0 (0.0%) | 0 (0.0%) |
| 3 or 4 Unit Apartments | 0 (0.0%) | 0 (0.0%) |
| 5 to 9 Unit Apartments | 0 (0.0%) | 235 (100.0%) |
| 10 or more Apartments | 0 (0.0%) | 0 (0.0%) |
| Mobile Home / Other | 185 (63.4%) | 107 (36.6%) |
| Total | 1,013 (64.1%) | 567 (35.9%) |
Housing Structures by Number of Rooms in St Gabriel
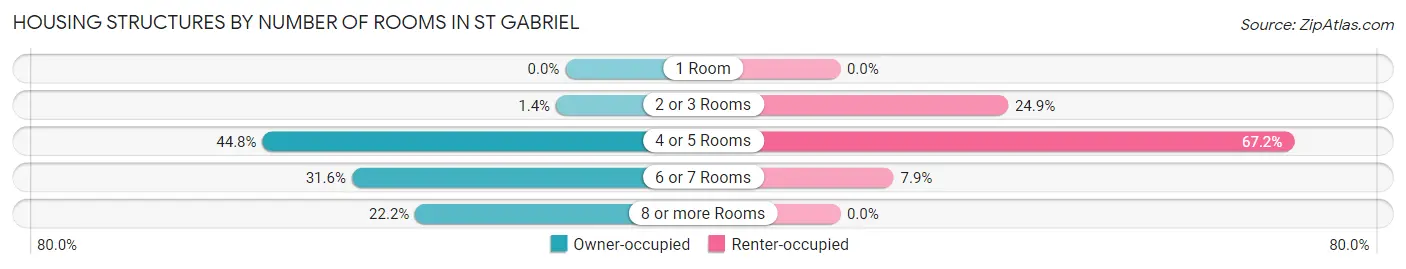
| Number of Rooms | Owner-occupied | Renter-occupied |
| 1 Room | 0 (0.0%) | 0 (0.0%) |
| 2 or 3 Rooms | 14 (1.4%) | 141 (24.9%) |
| 4 or 5 Rooms | 454 (44.8%) | 381 (67.2%) |
| 6 or 7 Rooms | 320 (31.6%) | 45 (7.9%) |
| 8 or more Rooms | 225 (22.2%) | 0 (0.0%) |
| Total | 1,013 (100.0%) | 567 (100.0%) |
Housing Structure by Heating Type in St Gabriel
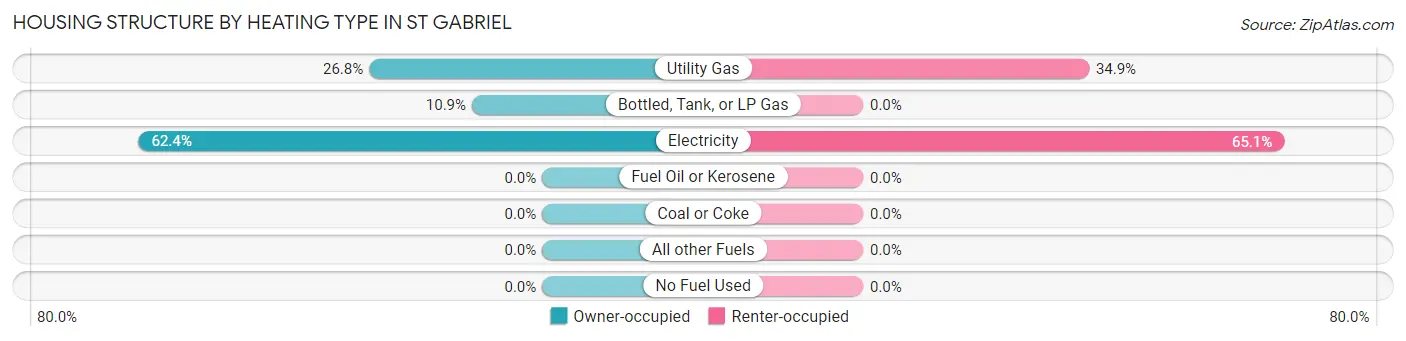
| Heating Type | Owner-occupied | Renter-occupied |
| Utility Gas | 271 (26.8%) | 198 (34.9%) |
| Bottled, Tank, or LP Gas | 110 (10.9%) | 0 (0.0%) |
| Electricity | 632 (62.4%) | 369 (65.1%) |
| Fuel Oil or Kerosene | 0 (0.0%) | 0 (0.0%) |
| Coal or Coke | 0 (0.0%) | 0 (0.0%) |
| All other Fuels | 0 (0.0%) | 0 (0.0%) |
| No Fuel Used | 0 (0.0%) | 0 (0.0%) |
| Total | 1,013 (100.0%) | 567 (100.0%) |
Household Vehicle Usage in St Gabriel
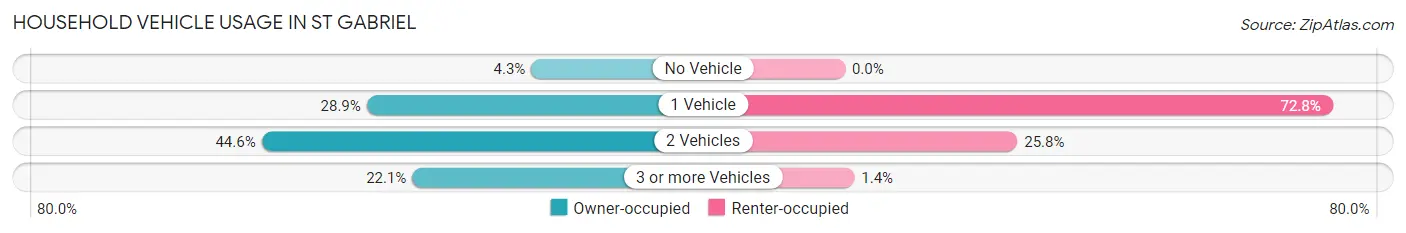
| Vehicles per Household | Owner-occupied | Renter-occupied |
| No Vehicle | 44 (4.3%) | 0 (0.0%) |
| 1 Vehicle | 293 (28.9%) | 413 (72.8%) |
| 2 Vehicles | 452 (44.6%) | 146 (25.8%) |
| 3 or more Vehicles | 224 (22.1%) | 8 (1.4%) |
| Total | 1,013 (100.0%) | 567 (100.0%) |
Real Estate & Mortgages in St Gabriel
Real Estate and Mortgage Overview in St Gabriel
| Characteristic | Without Mortgage | With Mortgage |
| Housing Units | 284 | 729 |
| Median Property Value | $186,900 | $306,200 |
| Median Household Income | - | - |
| Monthly Housing Costs | $355 | $116 |
| Real Estate Taxes | $2,014 | $173 |
Property Value by Mortgage Status in St Gabriel
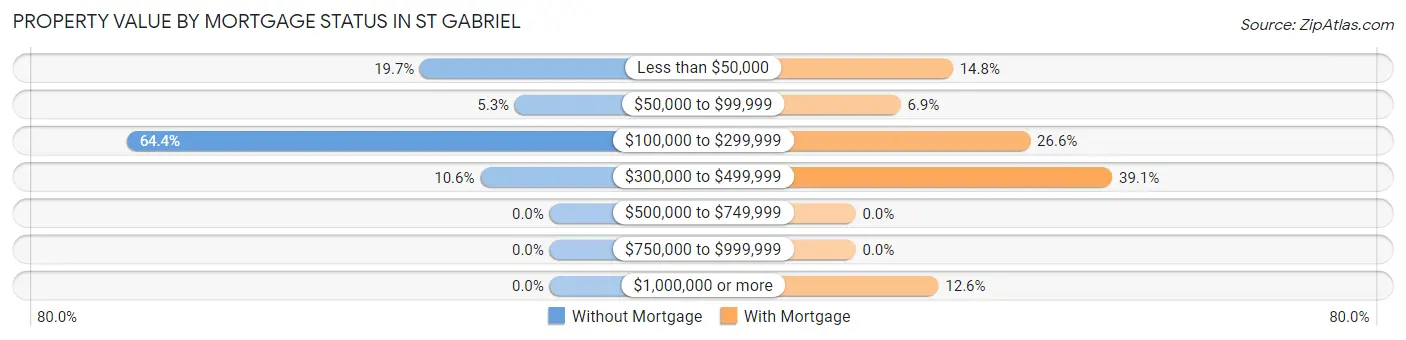
| Property Value | Without Mortgage | With Mortgage |
| Less than $50,000 | 56 (19.7%) | 108 (14.8%) |
| $50,000 to $99,999 | 15 (5.3%) | 50 (6.9%) |
| $100,000 to $299,999 | 183 (64.4%) | 194 (26.6%) |
| $300,000 to $499,999 | 30 (10.6%) | 285 (39.1%) |
| $500,000 to $749,999 | 0 (0.0%) | 0 (0.0%) |
| $750,000 to $999,999 | 0 (0.0%) | 0 (0.0%) |
| $1,000,000 or more | 0 (0.0%) | 92 (12.6%) |
| Total | 284 (100.0%) | 729 (100.0%) |
Household Income by Mortgage Status in St Gabriel
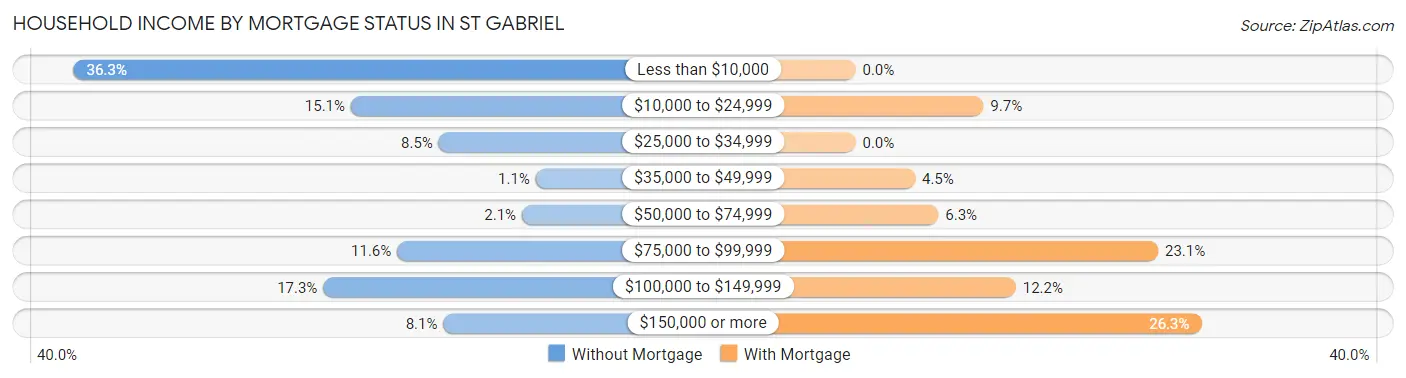
| Household Income | Without Mortgage | With Mortgage |
| Less than $10,000 | 103 (36.3%) | 0 (0.0%) |
| $10,000 to $24,999 | 43 (15.1%) | 71 (9.7%) |
| $25,000 to $34,999 | 24 (8.5%) | 0 (0.0%) |
| $35,000 to $49,999 | 3 (1.1%) | 33 (4.5%) |
| $50,000 to $74,999 | 6 (2.1%) | 46 (6.3%) |
| $75,000 to $99,999 | 33 (11.6%) | 168 (23.1%) |
| $100,000 to $149,999 | 49 (17.2%) | 89 (12.2%) |
| $150,000 or more | 23 (8.1%) | 192 (26.3%) |
| Total | 284 (100.0%) | 729 (100.0%) |
Property Value to Household Income Ratio in St Gabriel
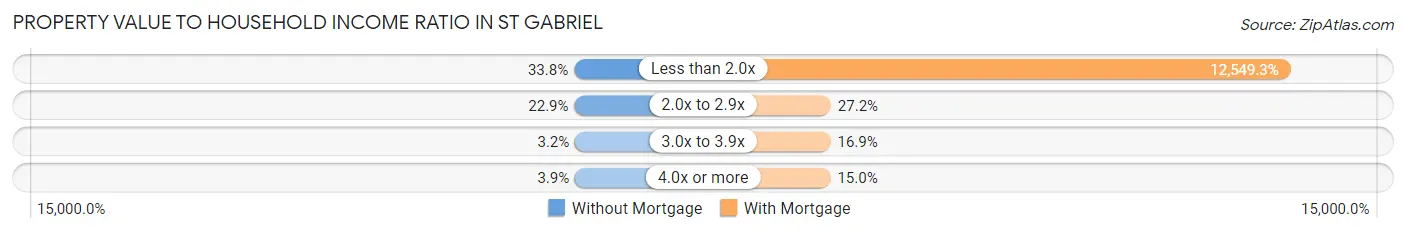
| Value-to-Income Ratio | Without Mortgage | With Mortgage |
| Less than 2.0x | 96 (33.8%) | 91,484 (12,549.3%) |
| 2.0x to 2.9x | 65 (22.9%) | 198 (27.2%) |
| 3.0x to 3.9x | 9 (3.2%) | 123 (16.9%) |
| 4.0x or more | 11 (3.9%) | 109 (14.9%) |
| Total | 284 (100.0%) | 729 (100.0%) |
Real Estate Taxes by Mortgage Status in St Gabriel

| Property Taxes | Without Mortgage | With Mortgage |
| Less than $800 | 63 (22.2%) | 0 (0.0%) |
| $800 to $1,499 | 38 (13.4%) | 152 (20.8%) |
| $800 to $1,499 | 122 (43.0%) | 116 (15.9%) |
| Total | 284 (100.0%) | 729 (100.0%) |
Health & Disability in St Gabriel
Health Insurance Coverage by Age in St Gabriel
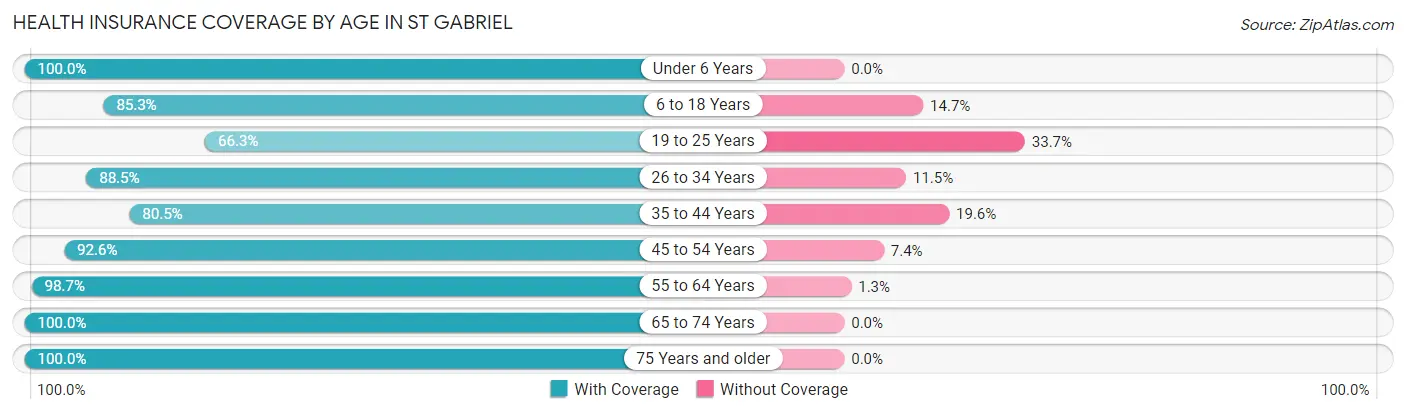
| Age Bracket | With Coverage | Without Coverage |
| Under 6 Years | 406 (100.0%) | 0 (0.0%) |
| 6 to 18 Years | 313 (85.3%) | 54 (14.7%) |
| 19 to 25 Years | 396 (66.3%) | 201 (33.7%) |
| 26 to 34 Years | 1,015 (88.5%) | 132 (11.5%) |
| 35 to 44 Years | 288 (80.4%) | 70 (19.6%) |
| 45 to 54 Years | 289 (92.6%) | 23 (7.4%) |
| 55 to 64 Years | 380 (98.7%) | 5 (1.3%) |
| 65 to 74 Years | 321 (100.0%) | 0 (0.0%) |
| 75 Years and older | 76 (100.0%) | 0 (0.0%) |
| Total | 3,484 (87.8%) | 485 (12.2%) |
Health Insurance Coverage by Citizenship Status in St Gabriel
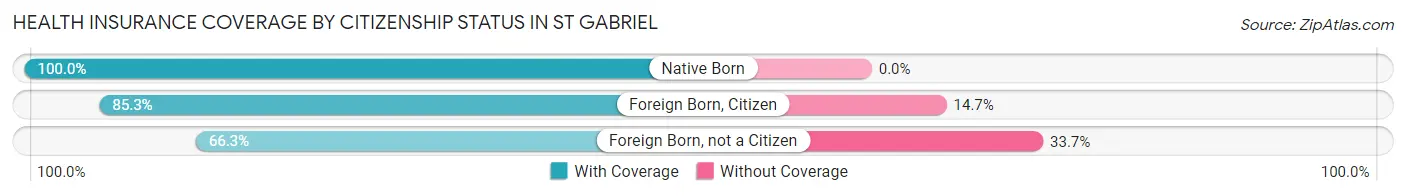
| Citizenship Status | With Coverage | Without Coverage |
| Native Born | 406 (100.0%) | 0 (0.0%) |
| Foreign Born, Citizen | 313 (85.3%) | 54 (14.7%) |
| Foreign Born, not a Citizen | 396 (66.3%) | 201 (33.7%) |
Health Insurance Coverage by Household Income in St Gabriel
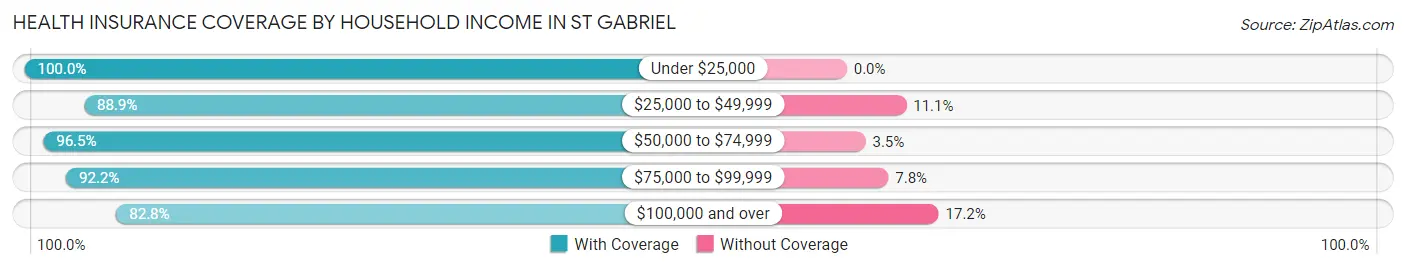
| Household Income | With Coverage | Without Coverage |
| Under $25,000 | 348 (100.0%) | 0 (0.0%) |
| $25,000 to $49,999 | 774 (88.9%) | 97 (11.1%) |
| $50,000 to $74,999 | 604 (96.5%) | 22 (3.5%) |
| $75,000 to $99,999 | 320 (92.2%) | 27 (7.8%) |
| $100,000 and over | 1,396 (82.8%) | 290 (17.2%) |
Public vs Private Health Insurance Coverage by Age in St Gabriel
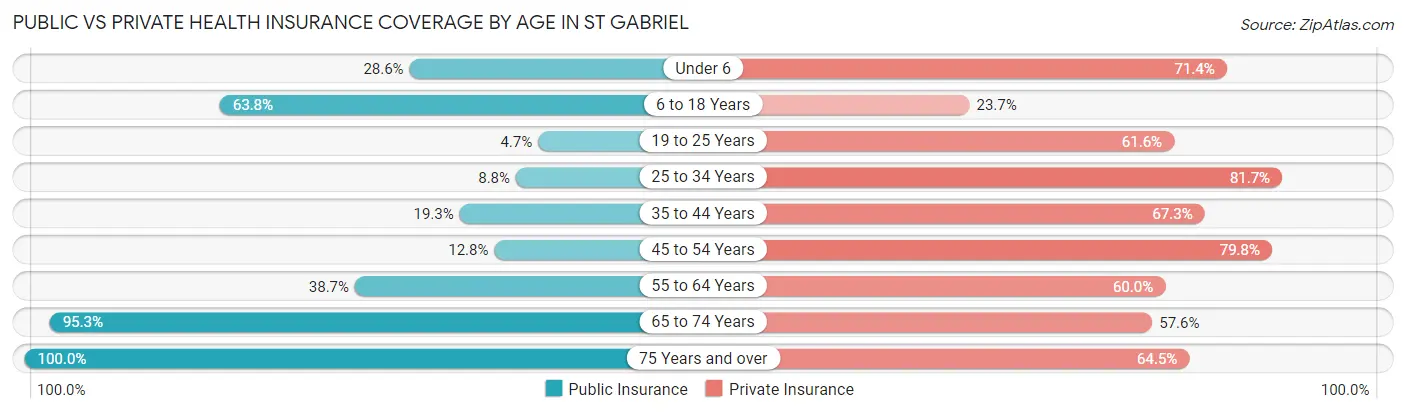
| Age Bracket | Public Insurance | Private Insurance |
| Under 6 | 116 (28.6%) | 290 (71.4%) |
| 6 to 18 Years | 234 (63.8%) | 87 (23.7%) |
| 19 to 25 Years | 28 (4.7%) | 368 (61.6%) |
| 25 to 34 Years | 101 (8.8%) | 937 (81.7%) |
| 35 to 44 Years | 69 (19.3%) | 241 (67.3%) |
| 45 to 54 Years | 40 (12.8%) | 249 (79.8%) |
| 55 to 64 Years | 149 (38.7%) | 231 (60.0%) |
| 65 to 74 Years | 306 (95.3%) | 185 (57.6%) |
| 75 Years and over | 76 (100.0%) | 49 (64.5%) |
| Total | 1,119 (28.2%) | 2,637 (66.4%) |
Disability Status by Sex by Age in St Gabriel
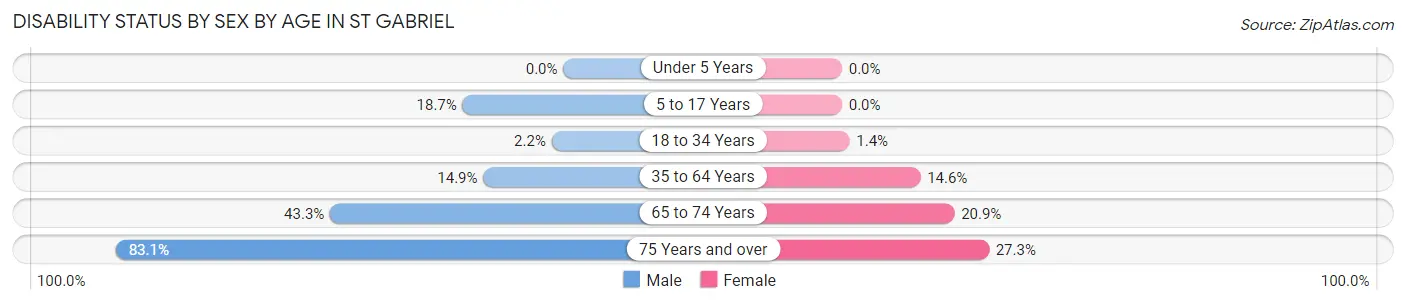
| Age Bracket | Male | Female |
| Under 5 Years | 0 (0.0%) | 0 (0.0%) |
| 5 to 17 Years | 43 (18.7%) | 0 (0.0%) |
| 18 to 34 Years | 22 (2.2%) | 11 (1.4%) |
| 35 to 64 Years | 75 (14.8%) | 80 (14.5%) |
| 65 to 74 Years | 58 (43.3%) | 39 (20.9%) |
| 75 Years and over | 54 (83.1%) | 3 (27.3%) |
Disability Class by Sex by Age in St Gabriel
Disability Class: Hearing Difficulty
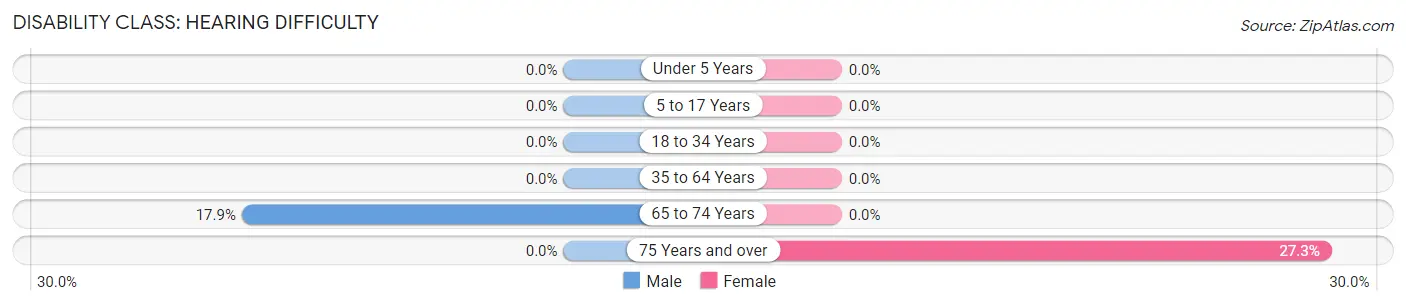
| Age Bracket | Male | Female |
| Under 5 Years | 0 (0.0%) | 0 (0.0%) |
| 5 to 17 Years | 0 (0.0%) | 0 (0.0%) |
| 18 to 34 Years | 0 (0.0%) | 0 (0.0%) |
| 35 to 64 Years | 0 (0.0%) | 0 (0.0%) |
| 65 to 74 Years | 24 (17.9%) | 0 (0.0%) |
| 75 Years and over | 0 (0.0%) | 3 (27.3%) |
Disability Class: Vision Difficulty
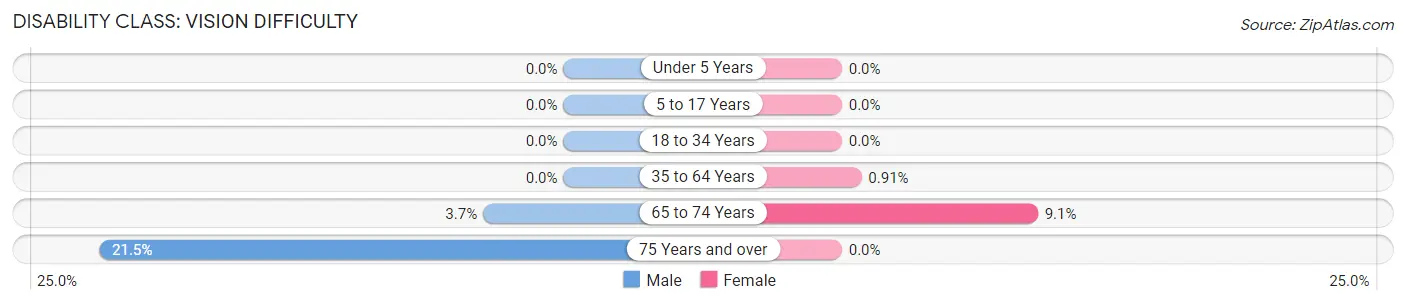
| Age Bracket | Male | Female |
| Under 5 Years | 0 (0.0%) | 0 (0.0%) |
| 5 to 17 Years | 0 (0.0%) | 0 (0.0%) |
| 18 to 34 Years | 0 (0.0%) | 0 (0.0%) |
| 35 to 64 Years | 0 (0.0%) | 5 (0.9%) |
| 65 to 74 Years | 5 (3.7%) | 17 (9.1%) |
| 75 Years and over | 14 (21.5%) | 0 (0.0%) |
Disability Class: Cognitive Difficulty
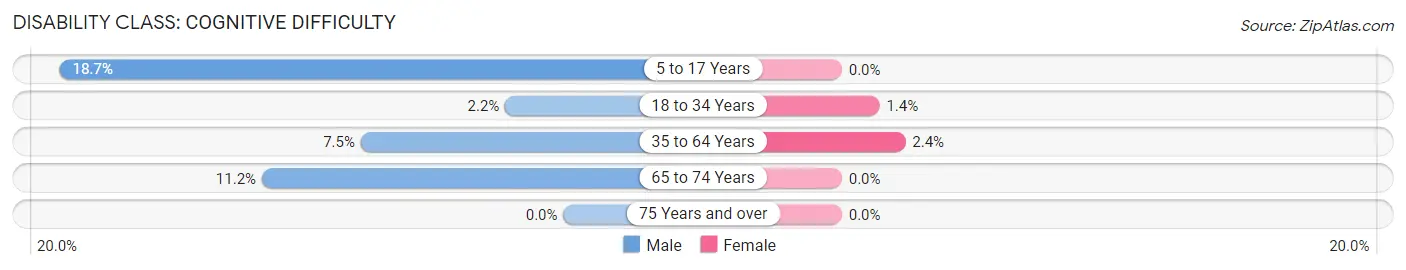
| Age Bracket | Male | Female |
| 5 to 17 Years | 43 (18.7%) | 0 (0.0%) |
| 18 to 34 Years | 22 (2.2%) | 11 (1.4%) |
| 35 to 64 Years | 38 (7.5%) | 13 (2.4%) |
| 65 to 74 Years | 15 (11.2%) | 0 (0.0%) |
| 75 Years and over | 0 (0.0%) | 0 (0.0%) |
Disability Class: Ambulatory Difficulty
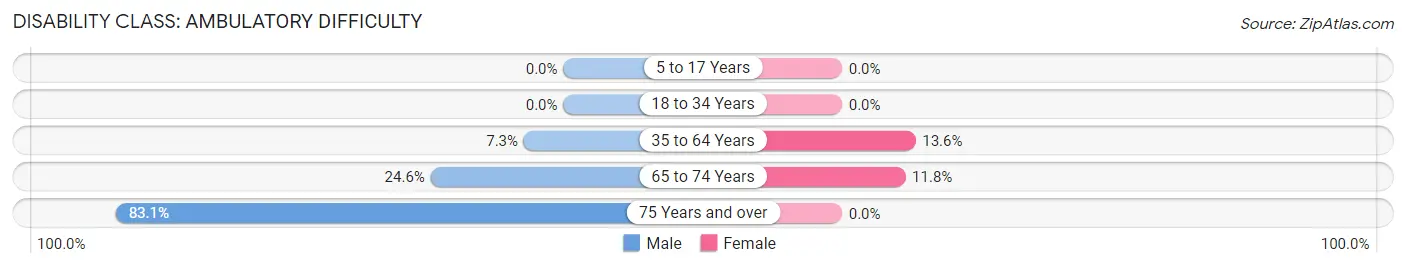
| Age Bracket | Male | Female |
| 5 to 17 Years | 0 (0.0%) | 0 (0.0%) |
| 18 to 34 Years | 0 (0.0%) | 0 (0.0%) |
| 35 to 64 Years | 37 (7.3%) | 75 (13.6%) |
| 65 to 74 Years | 33 (24.6%) | 22 (11.8%) |
| 75 Years and over | 54 (83.1%) | 0 (0.0%) |
Disability Class: Self-Care Difficulty
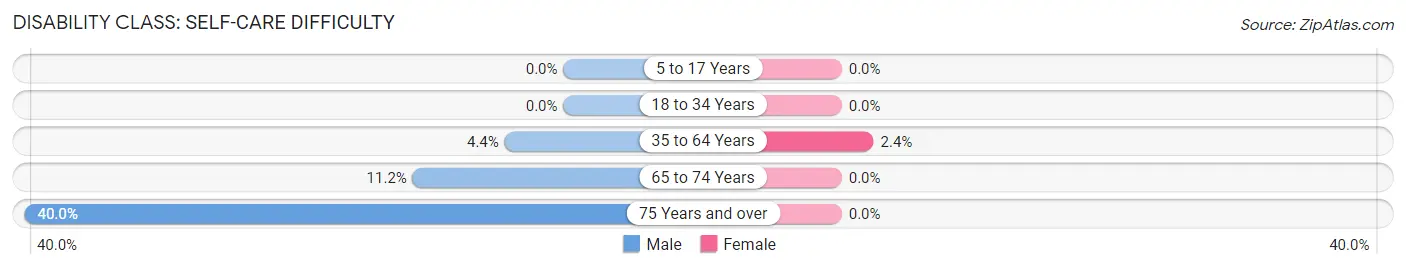
| Age Bracket | Male | Female |
| 5 to 17 Years | 0 (0.0%) | 0 (0.0%) |
| 18 to 34 Years | 0 (0.0%) | 0 (0.0%) |
| 35 to 64 Years | 22 (4.4%) | 13 (2.4%) |
| 65 to 74 Years | 15 (11.2%) | 0 (0.0%) |
| 75 Years and over | 26 (40.0%) | 0 (0.0%) |
Technology Access in St Gabriel
Computing Device Access in St Gabriel
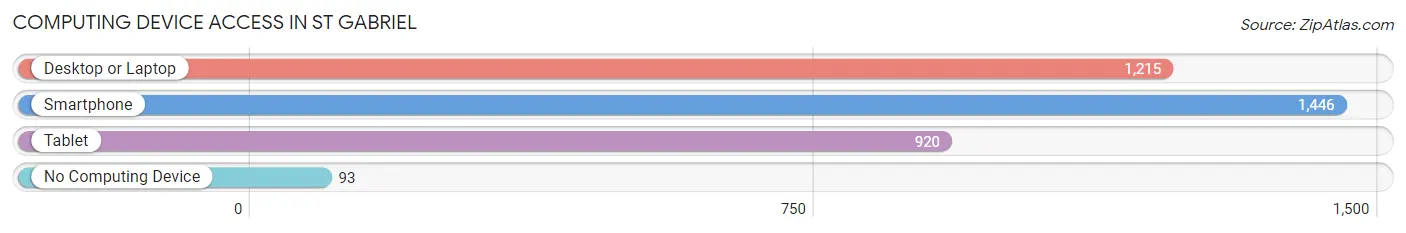
| Device Type | # Households | % Households |
| Desktop or Laptop | 1,215 | 76.9% |
| Smartphone | 1,446 | 91.5% |
| Tablet | 920 | 58.2% |
| No Computing Device | 93 | 5.9% |
| Total | 1,580 | 100.0% |
Internet Access in St Gabriel
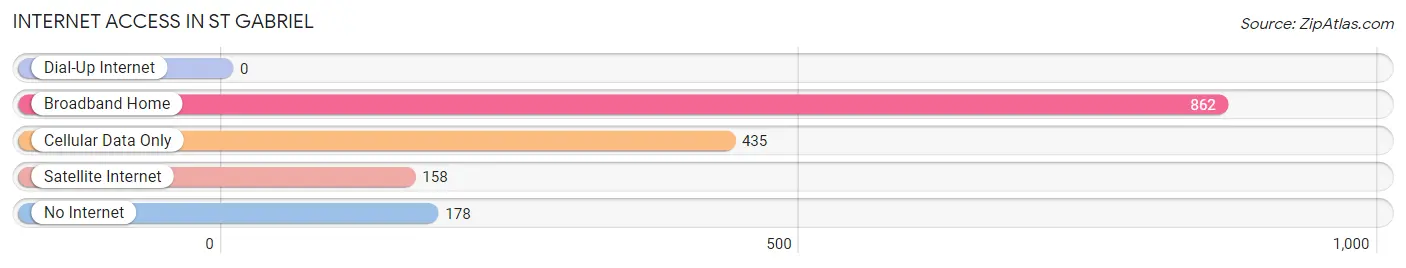
| Internet Type | # Households | % Households |
| Dial-Up Internet | 0 | 0.0% |
| Broadband Home | 862 | 54.6% |
| Cellular Data Only | 435 | 27.5% |
| Satellite Internet | 158 | 10.0% |
| No Internet | 178 | 11.3% |
| Total | 1,580 | 100.0% |
St Gabriel Summary
St. Gabriel is a small city located in Iberville Parish, Louisiana. It is situated on the banks of the Mississippi River, approximately 20 miles south of Baton Rouge. The city has a population of approximately 7,000 people and is part of the Baton Rouge Metropolitan Statistical Area.
History
St. Gabriel was founded in 1805 by French settlers who named it after the Archangel Gabriel. The city was originally a trading post and was used as a port for the shipment of goods from the Mississippi River. In 1821, the city was incorporated and became the first incorporated city in Iberville Parish.
In the late 19th century, St. Gabriel was a major port for the shipment of cotton and other goods. The city was also home to a number of sawmills and other industries. In the early 20th century, the city experienced a period of growth and development, with the construction of a number of new buildings, including a post office, a bank, and a hotel.
Geography
St. Gabriel is located in Iberville Parish, Louisiana, on the banks of the Mississippi River. The city is situated approximately 20 miles south of Baton Rouge and is part of the Baton Rouge Metropolitan Statistical Area. The city has a total area of 2.2 square miles, all of which is land.
The city is located in a humid subtropical climate zone, with hot, humid summers and mild winters. The average annual temperature is 68 degrees Fahrenheit, with an average high of 91 degrees in the summer and an average low of 45 degrees in the winter.
Economy
St. Gabriel’s economy is largely based on the service industry, with a number of restaurants, hotels, and other businesses located in the city. The city is also home to a number of manufacturing and industrial businesses, including a paper mill, a chemical plant, and a steel mill.
The city is also home to a number of government offices, including the Iberville Parish Courthouse and the Iberville Parish Sheriff’s Office.
Demographics
As of the 2010 census, St. Gabriel had a population of 7,000 people. The racial makeup of the city was 65.3% White, 30.2% African American, 0.3% Native American, 0.7% Asian, 0.1% Pacific Islander, and 3.4% from other races. Hispanic or Latino of any race were 2.3% of the population.
The median household income in St. Gabriel was $37,917, and the median family income was $45,938. The per capita income for the city was $17,945. About 17.2% of families and 20.3% of the population were below the poverty line, including 28.3% of those under age 18 and 11.2% of those age 65 or over.
St. Gabriel is served by the Iberville Parish School System, which includes two elementary schools, one middle school, and one high school. The city is also home to a number of private schools, including St. Gabriel Catholic School and St. Gabriel Academy.
Common Questions
What is Per Capita Income in St Gabriel?
Per Capita income in St Gabriel is $20,644.
What is the Median Family Income in St Gabriel?
Median Family Income in St Gabriel is $62,852.
What is the Median Household income in St Gabriel?
Median Household Income in St Gabriel is $55,735.
What is Income or Wage Gap in St Gabriel?
Income or Wage Gap in St Gabriel is 23.1%.
Women in St Gabriel earn 76.9 cents for every dollar earned by a man.
What is Inequality or Gini Index in St Gabriel?
Inequality or Gini Index in St Gabriel is 0.42.
What is the Total Population of St Gabriel?
Total Population of St Gabriel is 6,526.
What is the Total Male Population of St Gabriel?
Total Male Population of St Gabriel is 4,023.
What is the Total Female Population of St Gabriel?
Total Female Population of St Gabriel is 2,503.
What is the Ratio of Males per 100 Females in St Gabriel?
There are 160.73 Males per 100 Females in St Gabriel.
What is the Ratio of Females per 100 Males in St Gabriel?
There are 62.22 Females per 100 Males in St Gabriel.
What is the Median Population Age in St Gabriel?
Median Population Age in St Gabriel is 34.8 Years.
What is the Average Family Size in St Gabriel
Average Family Size in St Gabriel is 2.8 People.
What is the Average Household Size in St Gabriel
Average Household Size in St Gabriel is 2.5 People.
How Large is the Labor Force in St Gabriel?
There are 2,603 People in the Labor Forcein in St Gabriel.
What is the Percentage of People in the Labor Force in St Gabriel?
43.7% of People are in the Labor Force in St Gabriel.
What is the Unemployment Rate in St Gabriel?
Unemployment Rate in St Gabriel is 6.9%.