Jordan Hill, LA Map & Demographics
Jordan Hill Map
Jordan Hill Overview
$49,819
PER CAPITA INCOME
$193,287
AVG FAMILY INCOME
34.7%
WAGE / INCOME GAP [ % ]
65.3¢/ $1
WAGE / INCOME GAP [ $ ]
0.38
INEQUALITY / GINI INDEX
180
TOTAL POPULATION
131
MALE POPULATION
49
FEMALE POPULATION
267.35
MALES / 100 FEMALES
37.40
FEMALES / 100 MALES
50.3
MEDIAN AGE
4.3
AVG FAMILY SIZE
3.1
AVG HOUSEHOLD SIZE
171
LABOR FORCE [ PEOPLE ]
95.0%
PERCENT IN LABOR FORCE
Income in Jordan Hill
Income Overview in Jordan Hill
| Characteristic | Number | Measure |
| Per Capita Income | 180 | $49,819 |
| Median Family Income | 37 | $193,287 |
| Mean Family Income | 37 | $159,549 |
| Median Household Income | 58 | $0 |
| Mean Household Income | 58 | $110,593 |
| Income Deficit | 37 | $0 |
| Wage / Income Gap (%) | 180 | 34.68% |
| Wage / Income Gap ($) | 180 | 65.32¢ per $1 |
| Gini / Inequality Index | 180 | 0.38 |
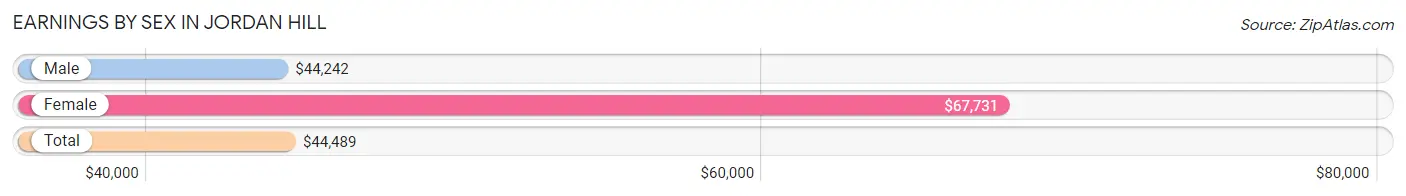
Earnings by Sex in Jordan Hill
Average Earnings in Jordan Hill are $44,489, $44,242 for men and $67,731 for women, a difference of 34.7%.
| Sex | Number | Average Earnings |
| Male | 122 (71.4%) | $44,242 |
| Female | 49 (28.6%) | $67,731 |
| Total | 171 (100.0%) | $44,489 |
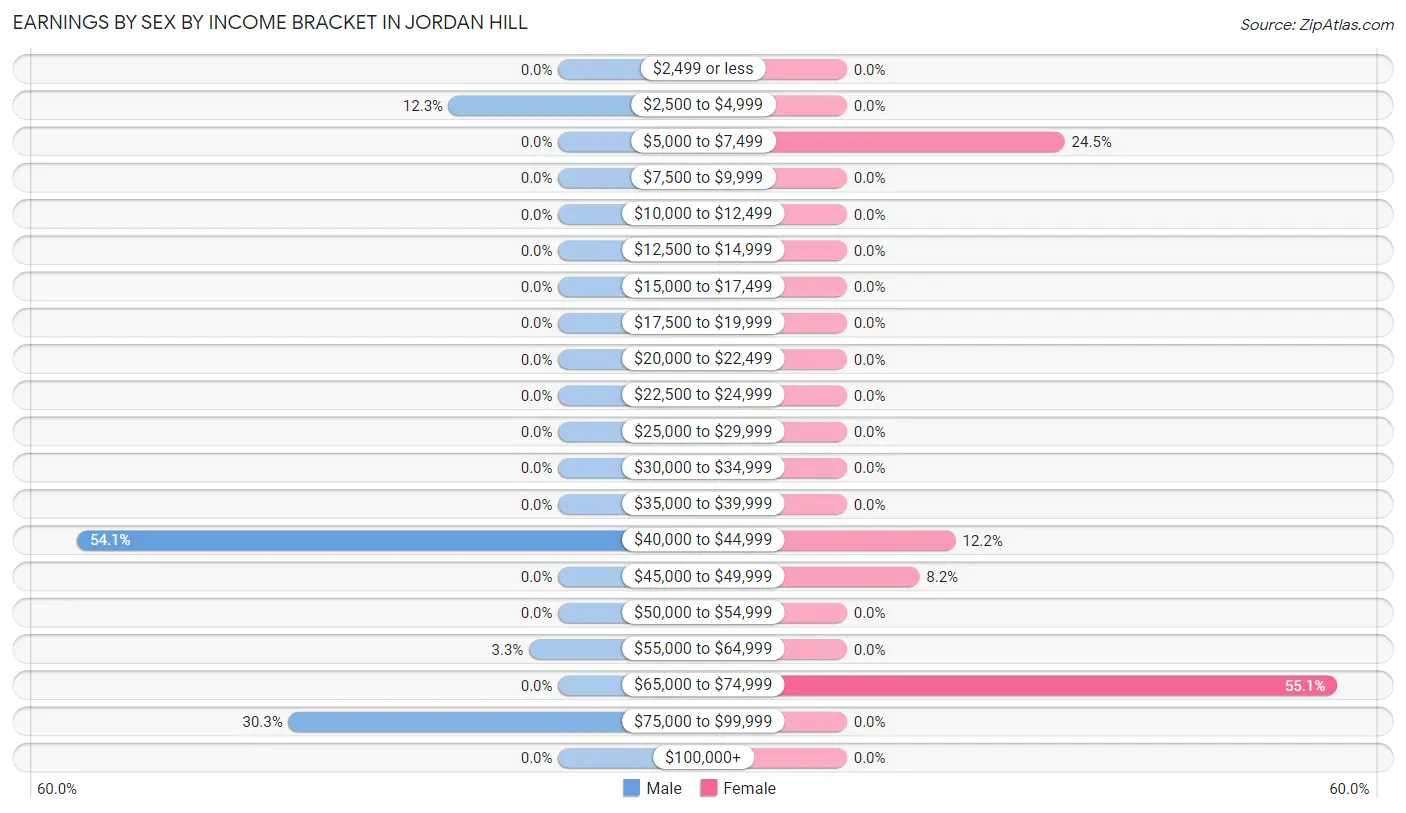
Earnings by Sex by Income Bracket in Jordan Hill
The most common earnings brackets in Jordan Hill are $40,000 to $44,999 for men (66 | 54.1%) and $65,000 to $74,999 for women (27 | 55.1%).
| Income | Male | Female |
| $2,499 or less | 0 (0.0%) | 0 (0.0%) |
| $2,500 to $4,999 | 15 (12.3%) | 0 (0.0%) |
| $5,000 to $7,499 | 0 (0.0%) | 12 (24.5%) |
| $7,500 to $9,999 | 0 (0.0%) | 0 (0.0%) |
| $10,000 to $12,499 | 0 (0.0%) | 0 (0.0%) |
| $12,500 to $14,999 | 0 (0.0%) | 0 (0.0%) |
| $15,000 to $17,499 | 0 (0.0%) | 0 (0.0%) |
| $17,500 to $19,999 | 0 (0.0%) | 0 (0.0%) |
| $20,000 to $22,499 | 0 (0.0%) | 0 (0.0%) |
| $22,500 to $24,999 | 0 (0.0%) | 0 (0.0%) |
| $25,000 to $29,999 | 0 (0.0%) | 0 (0.0%) |
| $30,000 to $34,999 | 0 (0.0%) | 0 (0.0%) |
| $35,000 to $39,999 | 0 (0.0%) | 0 (0.0%) |
| $40,000 to $44,999 | 66 (54.1%) | 6 (12.2%) |
| $45,000 to $49,999 | 0 (0.0%) | 4 (8.2%) |
| $50,000 to $54,999 | 0 (0.0%) | 0 (0.0%) |
| $55,000 to $64,999 | 4 (3.3%) | 0 (0.0%) |
| $65,000 to $74,999 | 0 (0.0%) | 27 (55.1%) |
| $75,000 to $99,999 | 37 (30.3%) | 0 (0.0%) |
| $100,000+ | 0 (0.0%) | 0 (0.0%) |
| Total | 122 (100.0%) | 49 (100.0%) |
Earnings by Sex by Educational Attainment in Jordan Hill
| Educational Attainment | Male Income | Female Income |
| Less than High School | - | - |
| High School Diploma | - | - |
| College or Associate's Degree | - | - |
| Bachelor's Degree | - | - |
| Graduate Degree | - | - |
| Total | - | - |
Family Income in Jordan Hill
Family Income Brackets in Jordan Hill
According to the Jordan Hill family income data, there are 27 families falling into the $150,000 to $199,999 income range, which is the most common income bracket and makes up 73.0% of all families.
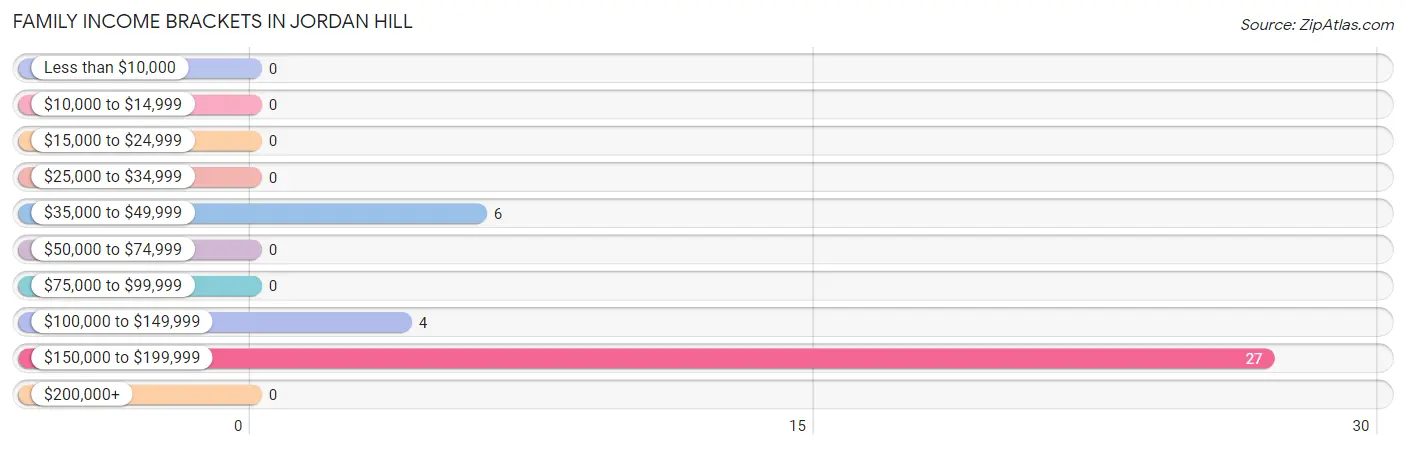
| Income Bracket | # Families | % Families |
| Less than $10,000 | 0 | 0.0% |
| $10,000 to $14,999 | 0 | 0.0% |
| $15,000 to $24,999 | 0 | 0.0% |
| $25,000 to $34,999 | 0 | 0.0% |
| $35,000 to $49,999 | 6 | 16.2% |
| $50,000 to $74,999 | 0 | 0.0% |
| $75,000 to $99,999 | 0 | 0.0% |
| $100,000 to $149,999 | 4 | 10.8% |
| $150,000 to $199,999 | 27 | 73.0% |
| $200,000+ | 0 | 0.0% |
Family Income by Famaliy Size in Jordan Hill
| Income Bracket | # Families | Median Income |
| 2-Person Families | 10 (27.0%) | $0 |
| 3-Person Families | 27 (73.0%) | $0 |
| 4-Person Families | 0 (0.0%) | $0 |
| 5-Person Families | 0 (0.0%) | $0 |
| 6-Person Families | 0 (0.0%) | $0 |
| 7+ Person Families | 0 (0.0%) | $0 |
| Total | 37 (100.0%) | $193,287 |
Family Income by Number of Earners in Jordan Hill
| Number of Earners | # Families | Median Income |
| No Earners | 0 (0.0%) | $0 |
| 1 Earner | 0 (0.0%) | $0 |
| 2 Earners | 10 (27.0%) | $0 |
| 3+ Earners | 27 (73.0%) | $0 |
| Total | 37 (100.0%) | $193,287 |
Household Income in Jordan Hill
Household Income Brackets in Jordan Hill
With 27 households falling in the category, the $150,000 to $199,999 income range is the most frequent in Jordan Hill, accounting for 46.6% of all households.
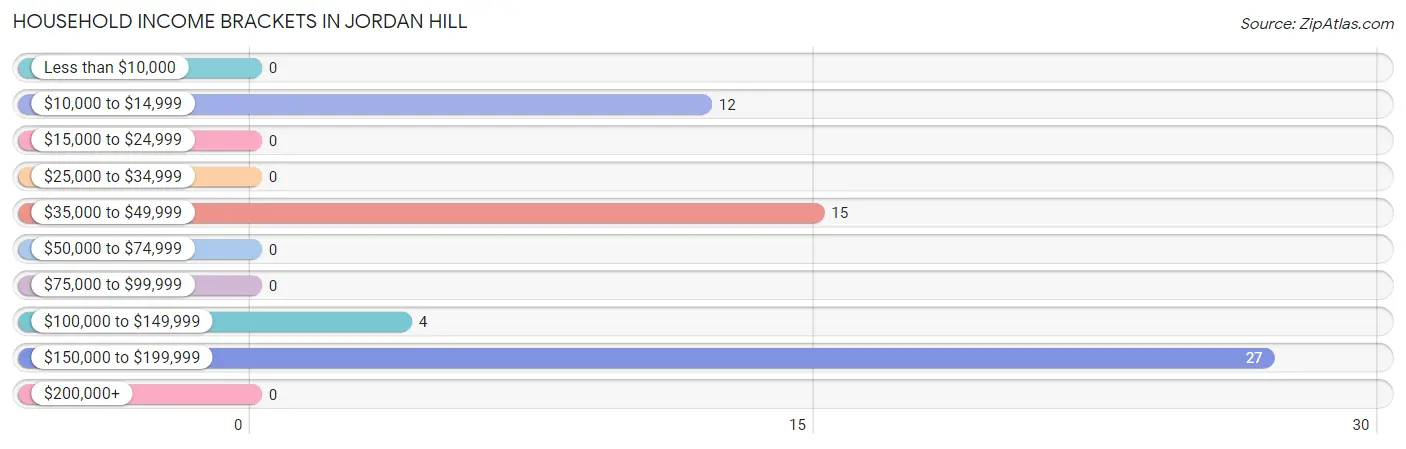
| Income Bracket | # Households | % Households |
| Less than $10,000 | 0 | 0.0% |
| $10,000 to $14,999 | 12 | 20.7% |
| $15,000 to $24,999 | 0 | 0.0% |
| $25,000 to $34,999 | 0 | 0.0% |
| $35,000 to $49,999 | 15 | 25.9% |
| $50,000 to $74,999 | 0 | 0.0% |
| $75,000 to $99,999 | 0 | 0.0% |
| $100,000 to $149,999 | 4 | 6.9% |
| $150,000 to $199,999 | 27 | 46.6% |
| $200,000+ | 0 | 0.0% |
Household Income by Householder Age in Jordan Hill
The median household income in Jordan Hill is $0, with the highest median household income of $193,287 found in the 45 to 64 years age bracket for the primary householder. A total of 37 households (63.8%) fall into this category.
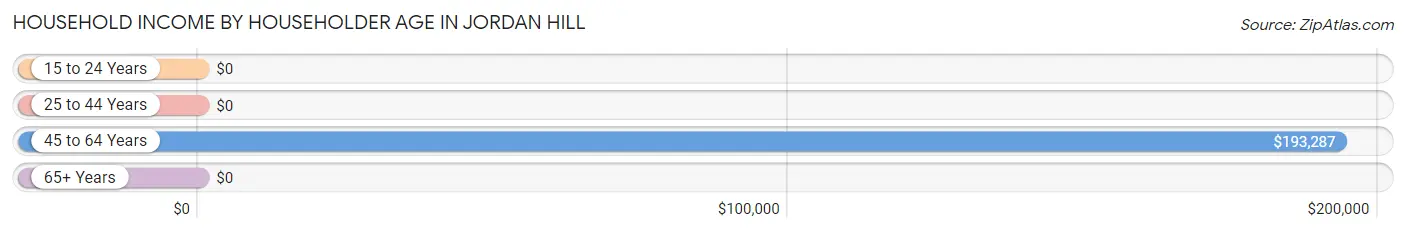
| Income Bracket | # Households | Median Income |
| 15 to 24 Years | 0 (0.0%) | $0 |
| 25 to 44 Years | 0 (0.0%) | $0 |
| 45 to 64 Years | 37 (63.8%) | $193,287 |
| 65+ Years | 21 (36.2%) | $0 |
| Total | 58 (100.0%) | $0 |
Poverty in Jordan Hill
Income Below Poverty by Sex and Age in Jordan Hill
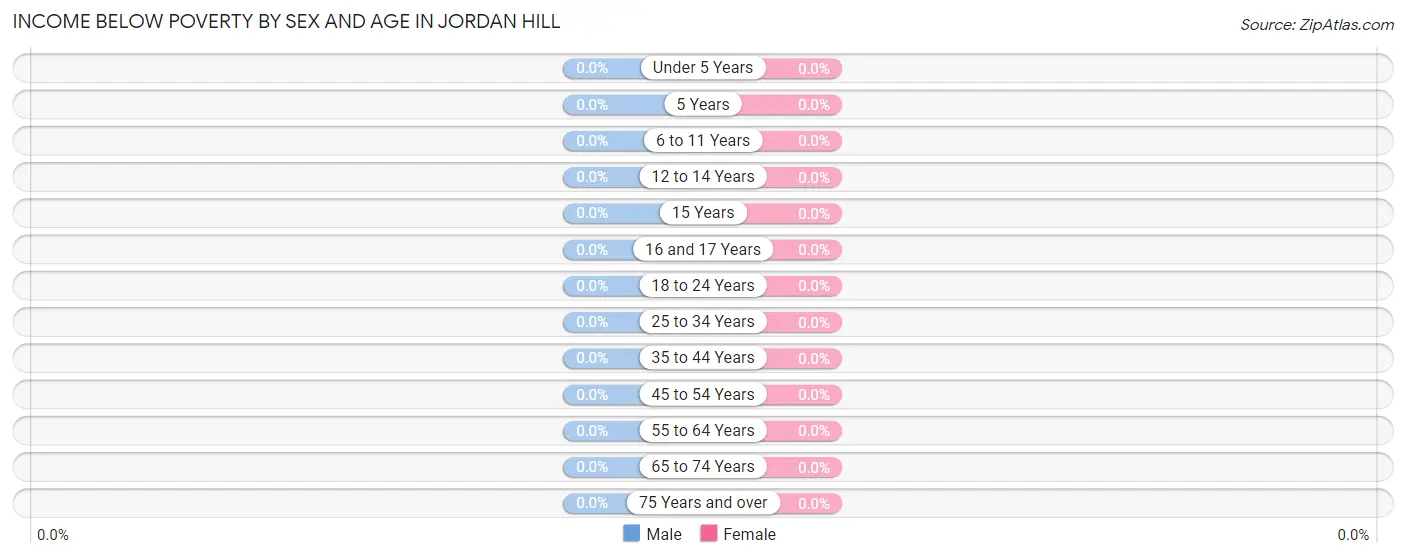
| Age Bracket | Male | Female |
| Under 5 Years | 0 (0.0%) | 0 (0.0%) |
| 5 Years | 0 (0.0%) | 0 (0.0%) |
| 6 to 11 Years | 0 (0.0%) | 0 (0.0%) |
| 12 to 14 Years | 0 (0.0%) | 0 (0.0%) |
| 15 Years | 0 (0.0%) | 0 (0.0%) |
| 16 and 17 Years | 0 (0.0%) | 0 (0.0%) |
| 18 to 24 Years | 0 (0.0%) | 0 (0.0%) |
| 25 to 34 Years | 0 (0.0%) | 0 (0.0%) |
| 35 to 44 Years | 0 (0.0%) | 0 (0.0%) |
| 45 to 54 Years | 0 (0.0%) | 0 (0.0%) |
| 55 to 64 Years | 0 (0.0%) | 0 (0.0%) |
| 65 to 74 Years | 0 (0.0%) | 0 (0.0%) |
| 75 Years and over | 0 (0.0%) | 0 (0.0%) |
| Total | 0 (0.0%) | 0 (0.0%) |
Income Above Poverty by Sex and Age in Jordan Hill
According to the poverty statistics in Jordan Hill, males aged 16 and 17 years and females aged 45 to 54 years are the age groups that are most secure financially, with 100.0% of males and 100.0% of females in these age groups living above the poverty line.
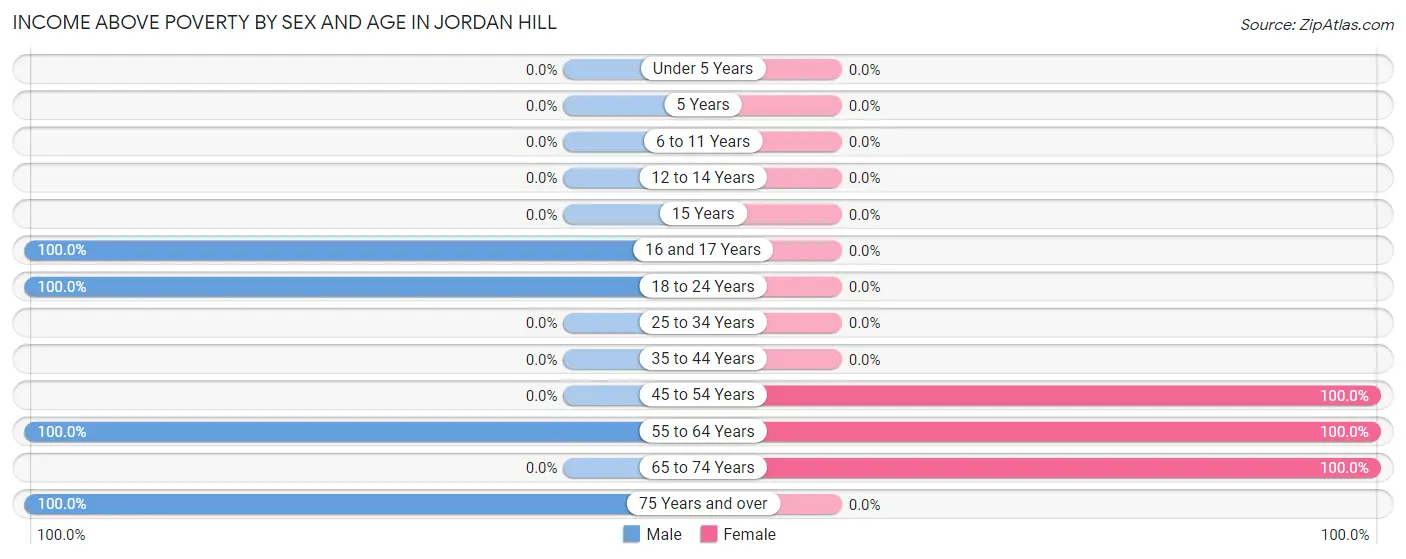
| Age Bracket | Male | Female |
| Under 5 Years | 0 (0.0%) | 0 (0.0%) |
| 5 Years | 0 (0.0%) | 0 (0.0%) |
| 6 to 11 Years | 0 (0.0%) | 0 (0.0%) |
| 12 to 14 Years | 0 (0.0%) | 0 (0.0%) |
| 15 Years | 0 (0.0%) | 0 (0.0%) |
| 16 and 17 Years | 15 (100.0%) | 0 (0.0%) |
| 18 to 24 Years | 66 (100.0%) | 0 (0.0%) |
| 25 to 34 Years | 0 (0.0%) | 0 (0.0%) |
| 35 to 44 Years | 0 (0.0%) | 0 (0.0%) |
| 45 to 54 Years | 0 (0.0%) | 33 (100.0%) |
| 55 to 64 Years | 41 (100.0%) | 4 (100.0%) |
| 65 to 74 Years | 0 (0.0%) | 12 (100.0%) |
| 75 Years and over | 9 (100.0%) | 0 (0.0%) |
| Total | 131 (100.0%) | 49 (100.0%) |
Income Below Poverty Among Married-Couple Families in Jordan Hill
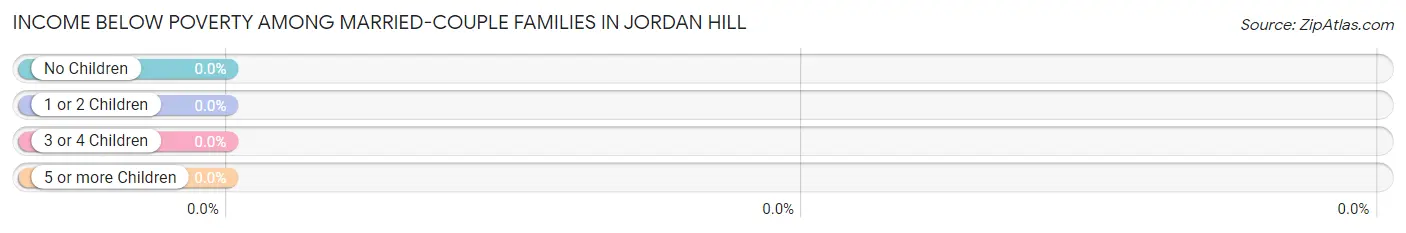
| Children | Above Poverty | Below Poverty |
| No Children | 31 (100.0%) | 0 (0.0%) |
| 1 or 2 Children | 0 (0.0%) | 0 (0.0%) |
| 3 or 4 Children | 0 (0.0%) | 0 (0.0%) |
| 5 or more Children | 0 (0.0%) | 0 (0.0%) |
| Total | 31 (100.0%) | 0 (0.0%) |
Income Below Poverty Among Single-Parent Households in Jordan Hill
| Children | Single Father | Single Mother |
| No Children | 0 (0.0%) | 0 (0.0%) |
| 1 or 2 Children | 0 (0.0%) | 0 (0.0%) |
| 3 or 4 Children | 0 (0.0%) | 0 (0.0%) |
| 5 or more Children | 0 (0.0%) | 0 (0.0%) |
| Total | 0 (0.0%) | 0 (0.0%) |
Income Below Poverty Among Married-Couple vs Single-Parent Households in Jordan Hill
| Children | Married-Couple Families | Single-Parent Households |
| No Children | 0 (0.0%) | 0 (0.0%) |
| 1 or 2 Children | 0 (0.0%) | 0 (0.0%) |
| 3 or 4 Children | 0 (0.0%) | 0 (0.0%) |
| 5 or more Children | 0 (0.0%) | 0 (0.0%) |
| Total | 0 (0.0%) | 0 (0.0%) |
Race in Jordan Hill
The most populous races in Jordan Hill are , and White / Caucasian (180 | 100.0%).
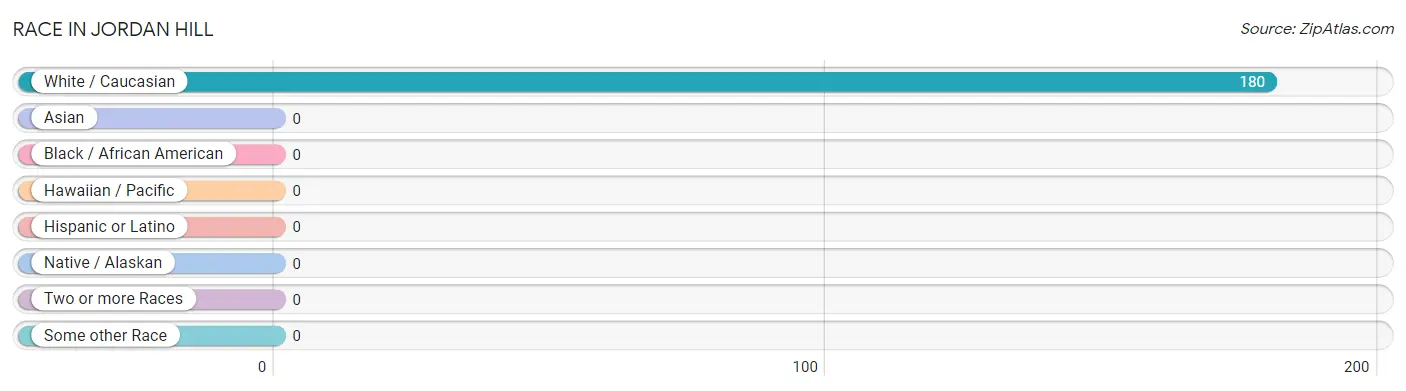
| Race | # Population | % Population |
| Asian | 0 | 0.0% |
| Black / African American | 0 | 0.0% |
| Hawaiian / Pacific | 0 | 0.0% |
| Hispanic or Latino | 0 | 0.0% |
| Native / Alaskan | 0 | 0.0% |
| White / Caucasian | 180 | 100.0% |
| Two or more Races | 0 | 0.0% |
| Some other Race | 0 | 0.0% |
| Total | 180 | 100.0% |
Ancestry in Jordan Hill
The most populous ancestries reported in Jordan Hill are Irish (130 | 72.2%), English (102 | 56.7%), and American (8 | 4.4%), together accounting for 133.3% of all Jordan Hill residents.
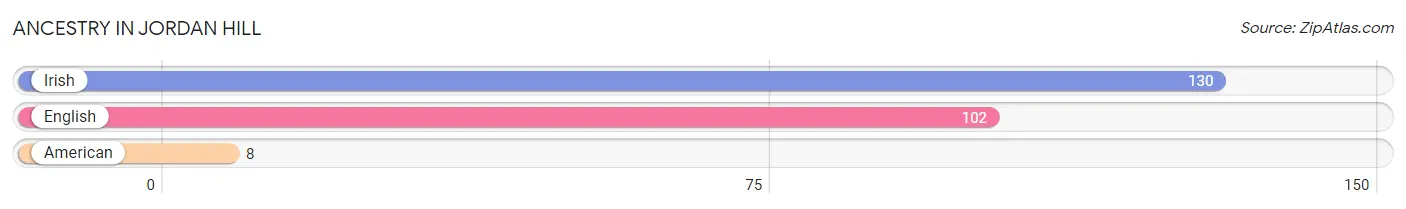
| Ancestry | # Population | % Population |
| American | 8 | 4.4% |
| English | 102 | 56.7% |
| Irish | 130 | 72.2% | View All 3 Rows |
Immigrants in Jordan Hill

| Immigration Origin | # Population | % Population | View All 0 Rows |
Sex and Age in Jordan Hill
Sex and Age in Jordan Hill
The most populous age groups in Jordan Hill are 20 to 24 Years (66 | 50.4%) for men and 50 to 54 Years (33 | 67.3%) for women.
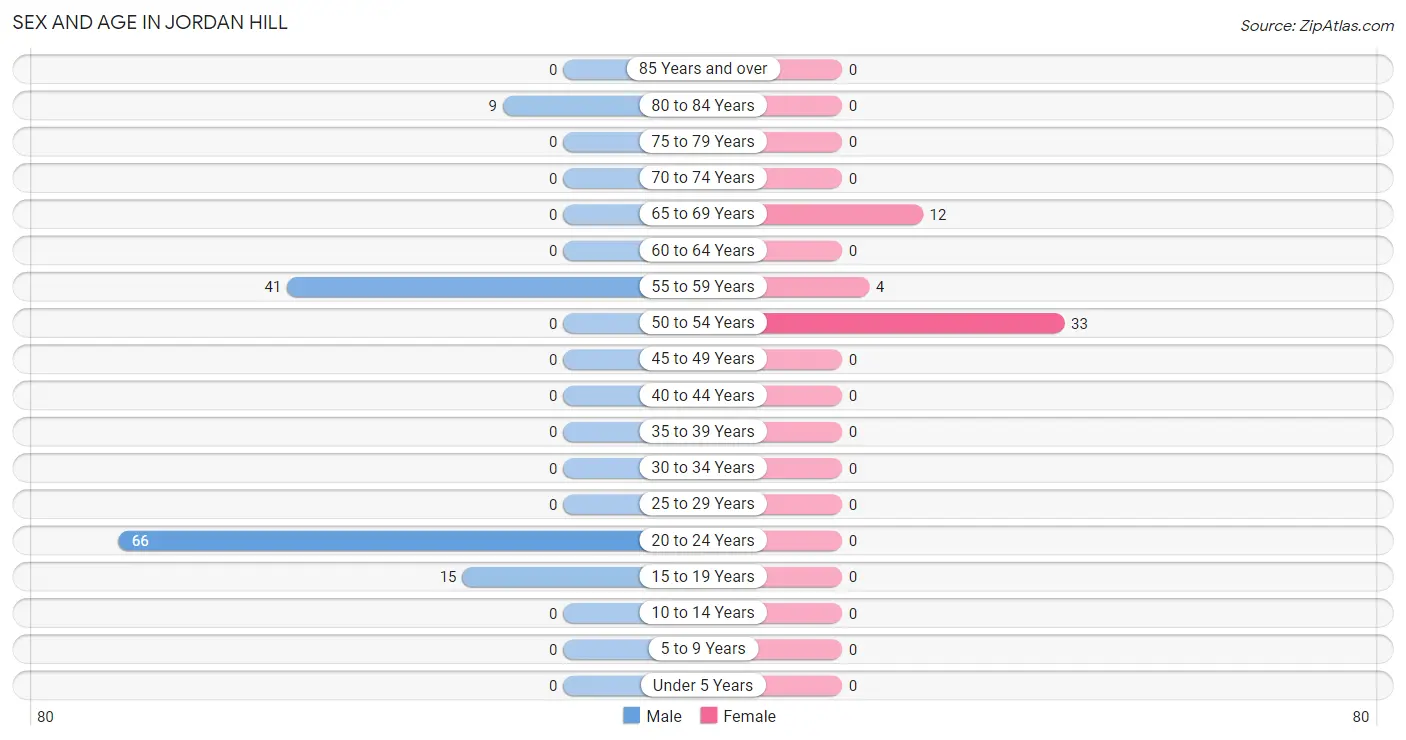
| Age Bracket | Male | Female |
| Under 5 Years | 0 (0.0%) | 0 (0.0%) |
| 5 to 9 Years | 0 (0.0%) | 0 (0.0%) |
| 10 to 14 Years | 0 (0.0%) | 0 (0.0%) |
| 15 to 19 Years | 15 (11.5%) | 0 (0.0%) |
| 20 to 24 Years | 66 (50.4%) | 0 (0.0%) |
| 25 to 29 Years | 0 (0.0%) | 0 (0.0%) |
| 30 to 34 Years | 0 (0.0%) | 0 (0.0%) |
| 35 to 39 Years | 0 (0.0%) | 0 (0.0%) |
| 40 to 44 Years | 0 (0.0%) | 0 (0.0%) |
| 45 to 49 Years | 0 (0.0%) | 0 (0.0%) |
| 50 to 54 Years | 0 (0.0%) | 33 (67.3%) |
| 55 to 59 Years | 41 (31.3%) | 4 (8.2%) |
| 60 to 64 Years | 0 (0.0%) | 0 (0.0%) |
| 65 to 69 Years | 0 (0.0%) | 12 (24.5%) |
| 70 to 74 Years | 0 (0.0%) | 0 (0.0%) |
| 75 to 79 Years | 0 (0.0%) | 0 (0.0%) |
| 80 to 84 Years | 9 (6.9%) | 0 (0.0%) |
| 85 Years and over | 0 (0.0%) | 0 (0.0%) |
| Total | 131 (100.0%) | 49 (100.0%) |
Families and Households in Jordan Hill
Median Family Size in Jordan Hill
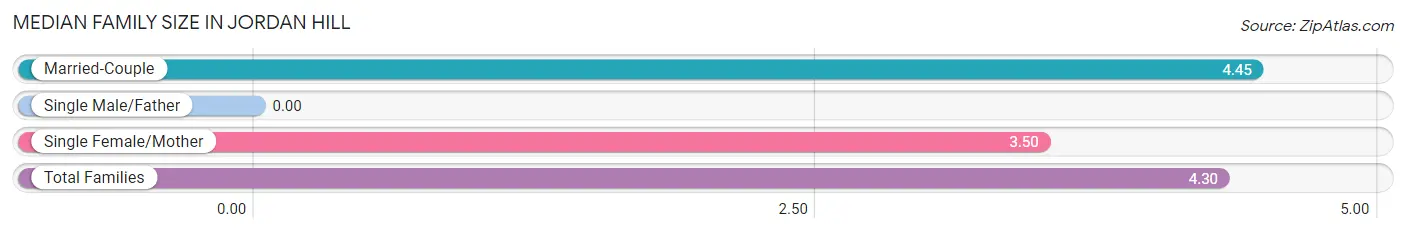
| Family Type | # Families | Family Size |
| Married-Couple | 31 (83.8%) | 4.45 |
| Single Male/Father | 0 (0.0%) | - |
| Single Female/Mother | 6 (16.2%) | 3.50 |
| Total Families | 37 (100.0%) | 4.30 |
Median Household Size in Jordan Hill
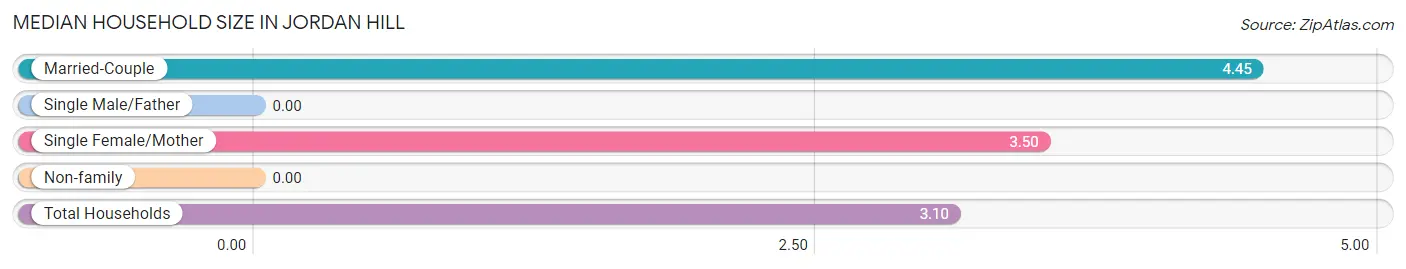
| Household Type | # Households | Household Size |
| Married-Couple | 31 (53.4%) | 4.45 |
| Single Male/Father | 0 (0.0%) | - |
| Single Female/Mother | 6 (10.3%) | 3.50 |
| Non-family | 21 (36.2%) | - |
| Total Households | 58 (100.0%) | 3.10 |
Household Size by Marriage Status in Jordan Hill
Out of a total of 58 households in Jordan Hill, 37 (63.8%) are family households, while 21 (36.2%) are nonfamily households. The most numerous type of family households are 3-person households, comprising 27, and the most common type of nonfamily households are 1-person households, comprising 21.
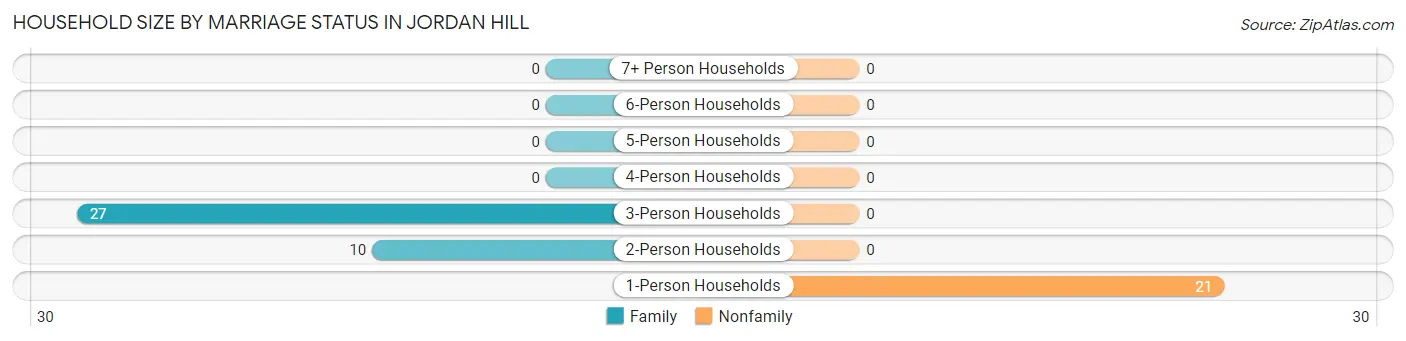
| Household Size | Family Households | Nonfamily Households |
| 1-Person Households | - | 21 (36.2%) |
| 2-Person Households | 10 (17.2%) | 0 (0.0%) |
| 3-Person Households | 27 (46.6%) | 0 (0.0%) |
| 4-Person Households | 0 (0.0%) | 0 (0.0%) |
| 5-Person Households | 0 (0.0%) | 0 (0.0%) |
| 6-Person Households | 0 (0.0%) | 0 (0.0%) |
| 7+ Person Households | 0 (0.0%) | 0 (0.0%) |
| Total | 37 (63.8%) | 21 (36.2%) |
Female Fertility in Jordan Hill
Fertility by Age in Jordan Hill
| Age Bracket | Women with Births | Births / 1,000 Women |
| 15 to 19 years | 0 (0.0%) | 0.0 |
| 20 to 34 years | 0 (0.0%) | 0.0 |
| 35 to 50 years | 0 (0.0%) | 0.0 |
| Total | 0 (0.0%) | 0.0 |
Fertility by Age by Marriage Status in Jordan Hill
| Age Bracket | Married | Unmarried |
| 15 to 19 years | 0 (0.0%) | 0 (0.0%) |
| 20 to 34 years | 0 (0.0%) | 0 (0.0%) |
| 35 to 50 years | 0 (0.0%) | 0 (0.0%) |
| Total | 0 (0.0%) | 0 (0.0%) |
Fertility by Education in Jordan Hill
| Educational Attainment | Women with Births | Births / 1,000 Women |
| Less than High School | 0 (0.0%) | 0.0 |
| High School Diploma | 0 (0.0%) | 0.0 |
| College or Associate's Degree | 0 (0.0%) | 0.0 |
| Bachelor's Degree | 0 (0.0%) | 0.0 |
| Graduate Degree | 0 (0.0%) | 0.0 |
| Total | 0 (0.0%) | 0.0 |
Fertility by Education by Marriage Status in Jordan Hill
| Educational Attainment | Married | Unmarried |
| Less than High School | 0 (0.0%) | 0 (0.0%) |
| High School Diploma | 0 (0.0%) | 0 (0.0%) |
| College or Associate's Degree | 0 (0.0%) | 0 (0.0%) |
| Bachelor's Degree | 0 (0.0%) | 0 (0.0%) |
| Graduate Degree | 0 (0.0%) | 0 (0.0%) |
| Total | 0 (0.0%) | 0 (0.0%) |
Employment Characteristics in Jordan Hill
Employment by Class of Employer in Jordan Hill
Among the 165 employed individuals in Jordan Hill, private company employees (85 | 51.5%), state government employees (41 | 24.8%), and not-for-profit organizations (39 | 23.6%) make up the most common classes of employment.
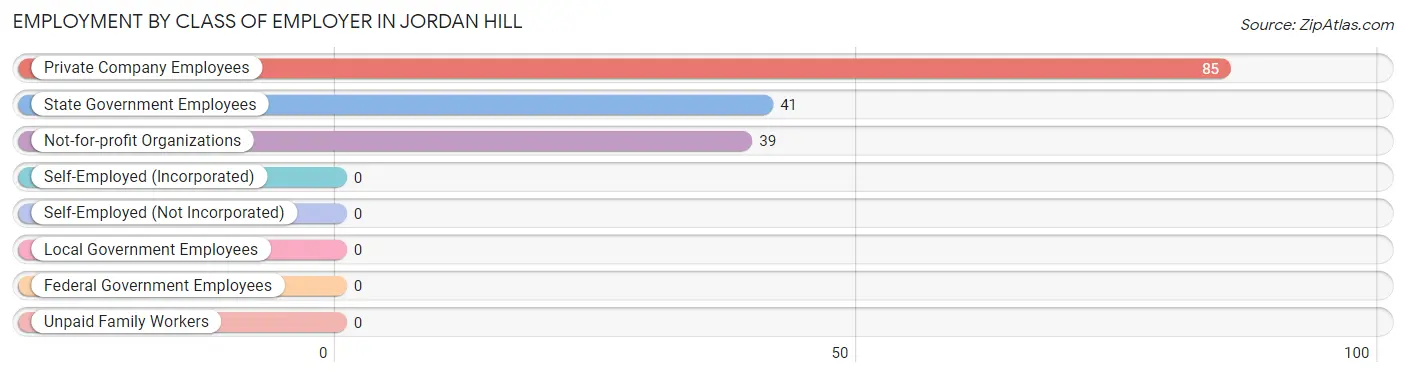
| Employer Class | # Employees | % Employees |
| Private Company Employees | 85 | 51.5% |
| Self-Employed (Incorporated) | 0 | 0.0% |
| Self-Employed (Not Incorporated) | 0 | 0.0% |
| Not-for-profit Organizations | 39 | 23.6% |
| Local Government Employees | 0 | 0.0% |
| State Government Employees | 41 | 24.8% |
| Federal Government Employees | 0 | 0.0% |
| Unpaid Family Workers | 0 | 0.0% |
| Total | 165 | 100.0% |
Employment Status by Age in Jordan Hill
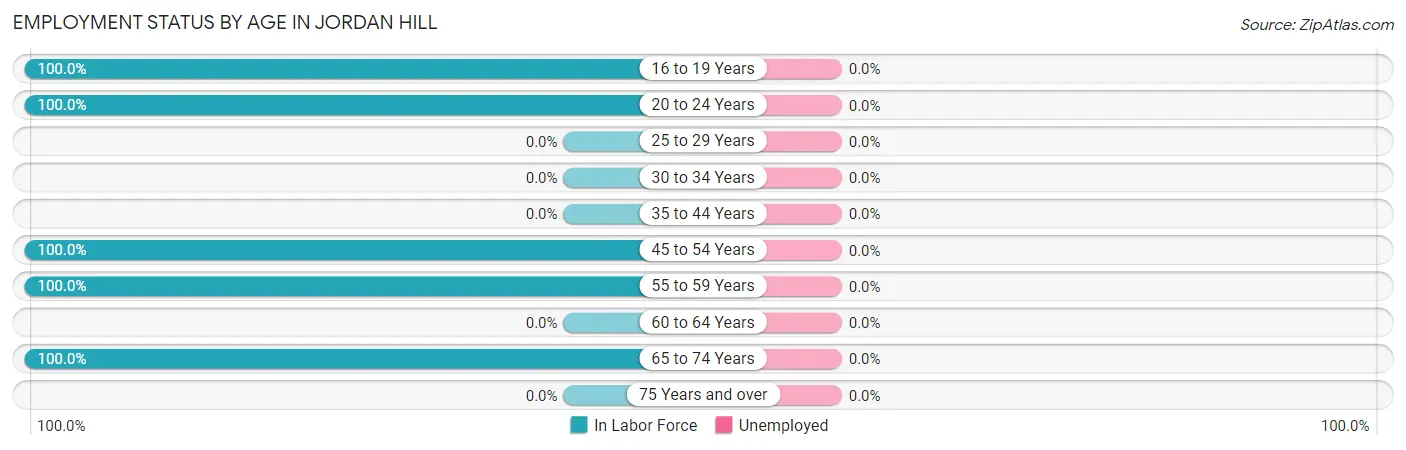
| Age Bracket | In Labor Force | Unemployed |
| 16 to 19 Years | 15 (100.0%) | 0 (0.0%) |
| 20 to 24 Years | 66 (100.0%) | 0 (0.0%) |
| 25 to 29 Years | 0 (0.0%) | 0 (0.0%) |
| 30 to 34 Years | 0 (0.0%) | 0 (0.0%) |
| 35 to 44 Years | 0 (0.0%) | 0 (0.0%) |
| 45 to 54 Years | 33 (100.0%) | 0 (0.0%) |
| 55 to 59 Years | 45 (100.0%) | 0 (0.0%) |
| 60 to 64 Years | 0 (0.0%) | 0 (0.0%) |
| 65 to 74 Years | 12 (100.0%) | 0 (0.0%) |
| 75 Years and over | 0 (0.0%) | 0 (0.0%) |
| Total | 171 (95.0%) | 0 (0.0%) |
Employment Status by Educational Attainment in Jordan Hill
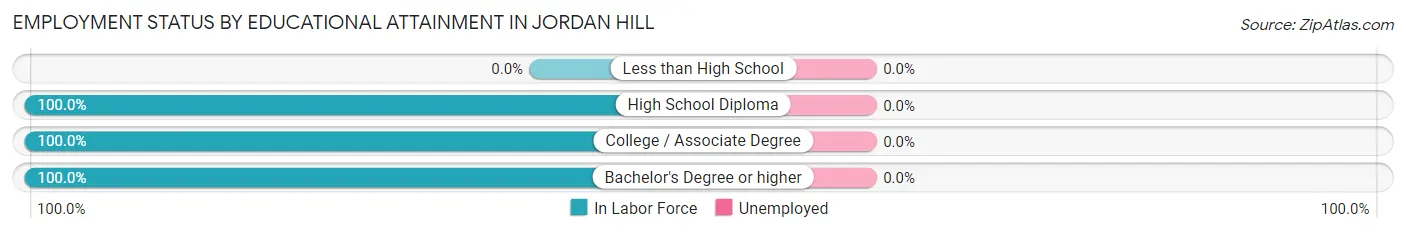
| Educational Attainment | In Labor Force | Unemployed |
| Less than High School | 0 (0.0%) | 0 (0.0%) |
| High School Diploma | 4 (100.0%) | 0 (0.0%) |
| College / Associate Degree | 4 (100.0%) | 0 (0.0%) |
| Bachelor's Degree or higher | 70 (100.0%) | 0 (0.0%) |
| Total | 78 (100.0%) | 0 (0.0%) |
Employment Occupations by Sex in Jordan Hill
Management, Business, Science and Arts Occupations
The most common Management, Business, Science and Arts occupations in Jordan Hill are Community & Social Service (82 | 47.9%), Education Instruction & Library (70 | 40.9%), and Arts, Media & Entertainment (12 | 7.0%).
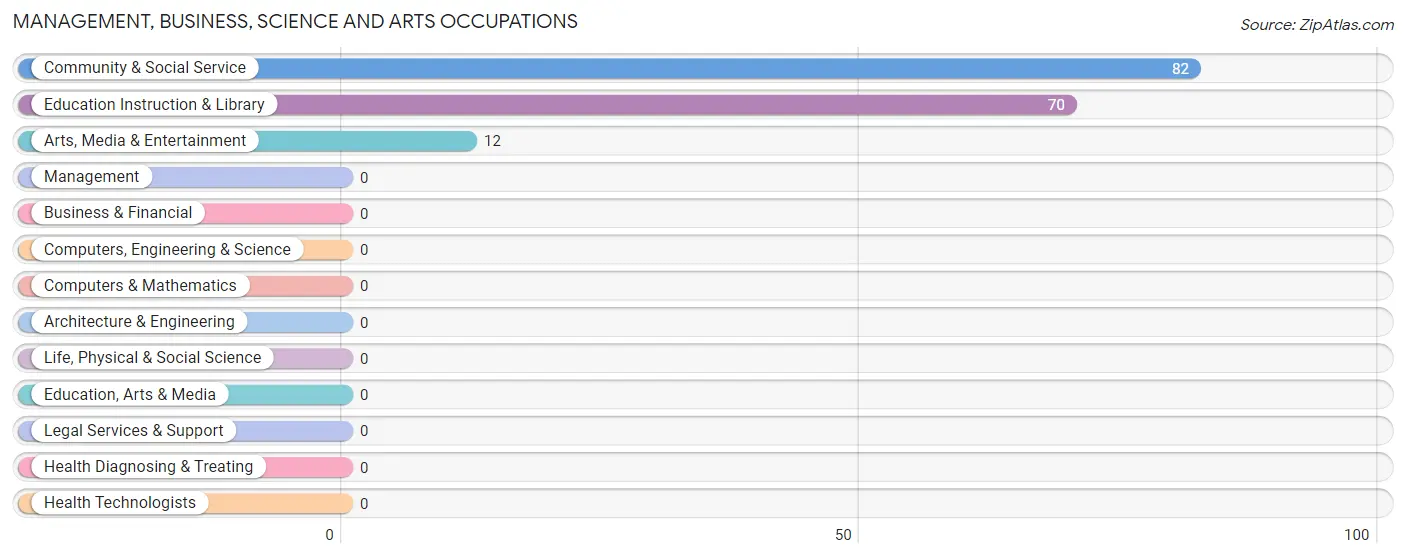
Management, Business, Science and Arts Occupations by Sex
Within the Management, Business, Science and Arts occupations in Jordan Hill, the most male-oriented occupations are Education Instruction & Library (52.9%), and Community & Social Service (45.1%), while the most female-oriented occupations are Arts, Media & Entertainment (100.0%), Community & Social Service (54.9%), and Education Instruction & Library (47.1%).
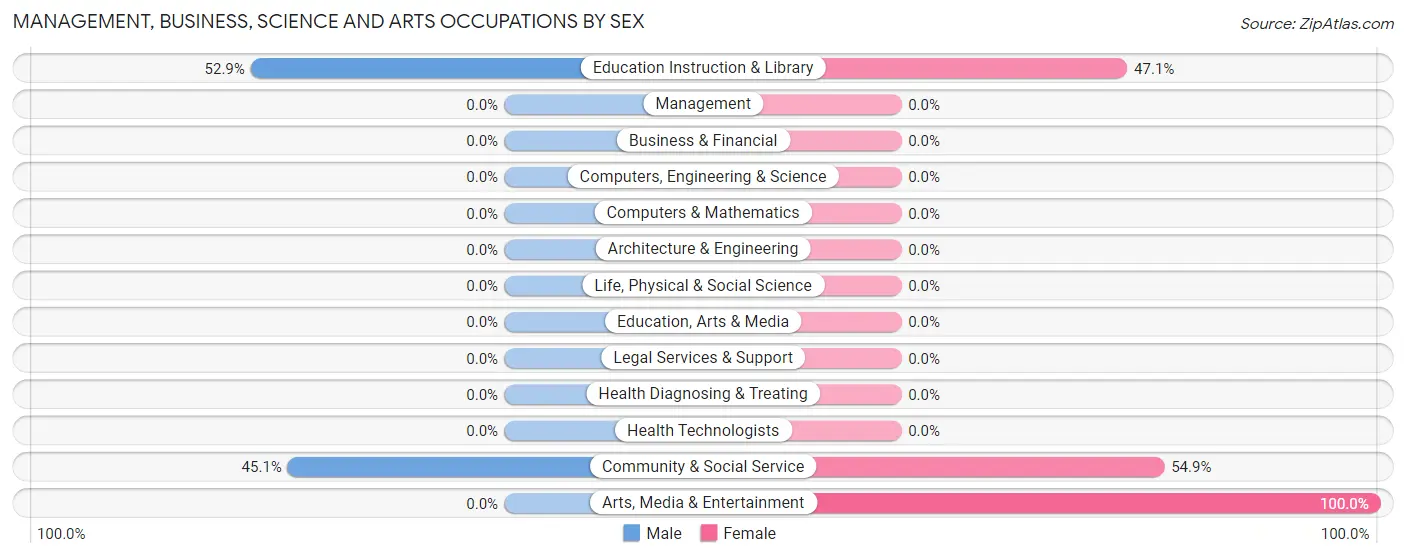
| Occupation | Male | Female |
| Management | 0 (0.0%) | 0 (0.0%) |
| Business & Financial | 0 (0.0%) | 0 (0.0%) |
| Computers, Engineering & Science | 0 (0.0%) | 0 (0.0%) |
| Computers & Mathematics | 0 (0.0%) | 0 (0.0%) |
| Architecture & Engineering | 0 (0.0%) | 0 (0.0%) |
| Life, Physical & Social Science | 0 (0.0%) | 0 (0.0%) |
| Community & Social Service | 37 (45.1%) | 45 (54.9%) |
| Education, Arts & Media | 0 (0.0%) | 0 (0.0%) |
| Legal Services & Support | 0 (0.0%) | 0 (0.0%) |
| Education Instruction & Library | 37 (52.9%) | 33 (47.1%) |
| Arts, Media & Entertainment | 0 (0.0%) | 12 (100.0%) |
| Health Diagnosing & Treating | 0 (0.0%) | 0 (0.0%) |
| Health Technologists | 0 (0.0%) | 0 (0.0%) |
| Total (Category) | 37 (45.1%) | 45 (54.9%) |
| Total (Overall) | 122 (71.4%) | 49 (28.6%) |
Services Occupations
The most common Services occupations in Jordan Hill are , and Food Preparation & Serving (15 | 8.8%).
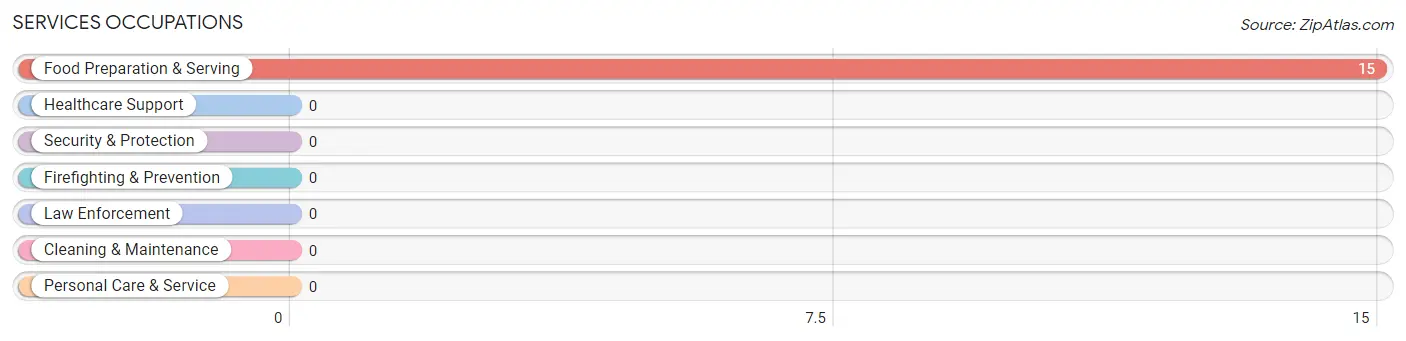
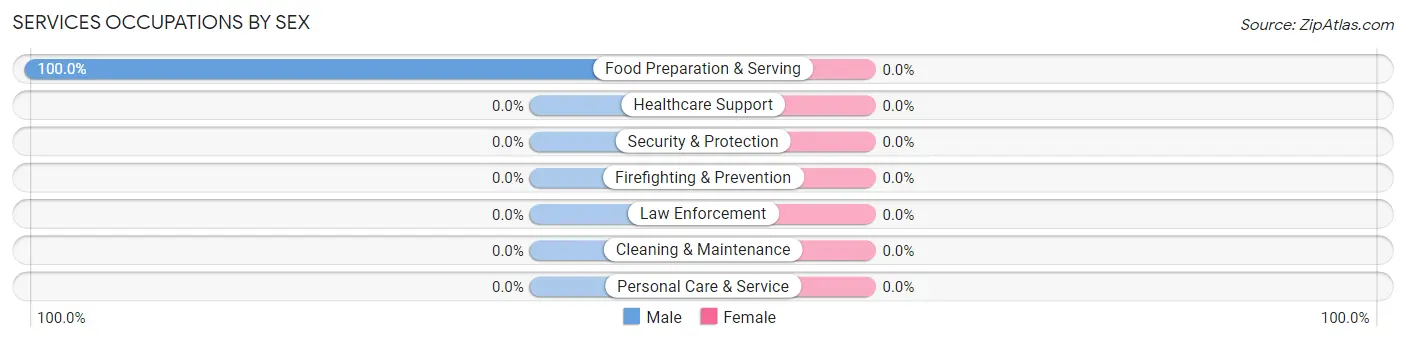
Services Occupations by Sex
| Occupation | Male | Female |
| Healthcare Support | 0 (0.0%) | 0 (0.0%) |
| Security & Protection | 0 (0.0%) | 0 (0.0%) |
| Firefighting & Prevention | 0 (0.0%) | 0 (0.0%) |
| Law Enforcement | 0 (0.0%) | 0 (0.0%) |
| Food Preparation & Serving | 15 (100.0%) | 0 (0.0%) |
| Cleaning & Maintenance | 0 (0.0%) | 0 (0.0%) |
| Personal Care & Service | 0 (0.0%) | 0 (0.0%) |
| Total (Category) | 15 (100.0%) | 0 (0.0%) |
| Total (Overall) | 122 (71.4%) | 49 (28.6%) |
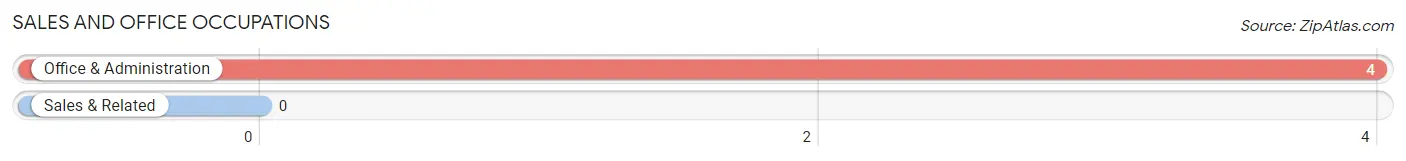
Sales and Office Occupations
The most common Sales and Office occupations in Jordan Hill are , and Office & Administration (4 | 2.3%).
Sales and Office Occupations by Sex
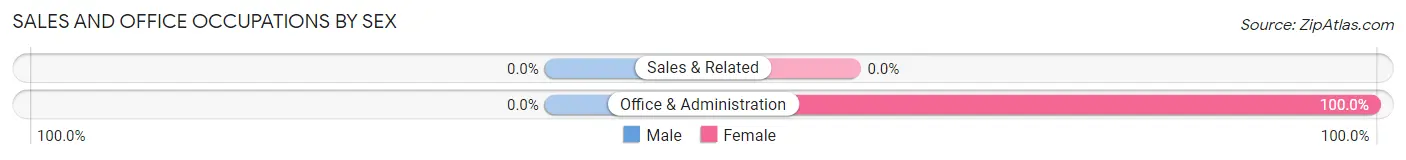
| Occupation | Male | Female |
| Sales & Related | 0 (0.0%) | 0 (0.0%) |
| Office & Administration | 0 (0.0%) | 4 (100.0%) |
| Total (Category) | 0 (0.0%) | 4 (100.0%) |
| Total (Overall) | 122 (71.4%) | 49 (28.6%) |
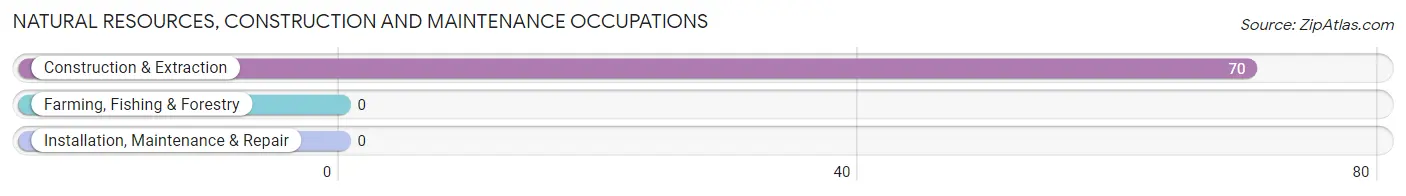
Natural Resources, Construction and Maintenance Occupations
The most common Natural Resources, Construction and Maintenance occupations in Jordan Hill are , and Construction & Extraction (70 | 40.9%).
Natural Resources, Construction and Maintenance Occupations by Sex
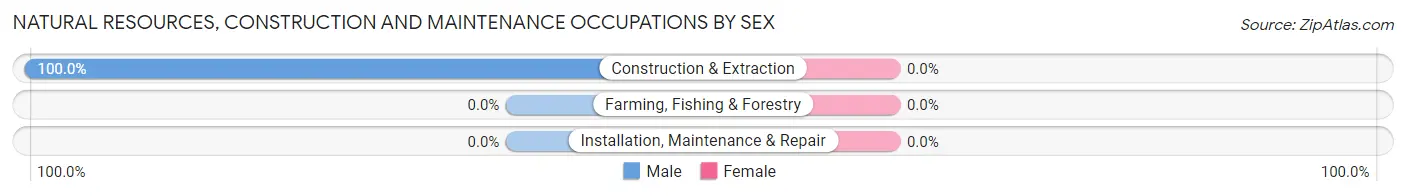
| Occupation | Male | Female |
| Farming, Fishing & Forestry | 0 (0.0%) | 0 (0.0%) |
| Construction & Extraction | 70 (100.0%) | 0 (0.0%) |
| Installation, Maintenance & Repair | 0 (0.0%) | 0 (0.0%) |
| Total (Category) | 70 (100.0%) | 0 (0.0%) |
| Total (Overall) | 122 (71.4%) | 49 (28.6%) |
Production, Transportation and Moving Occupations
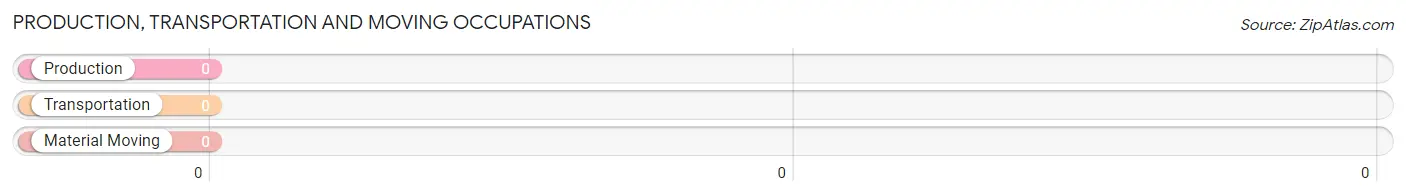
Production, Transportation and Moving Occupations by Sex
| Occupation | Male | Female |
| Production | 0 (0.0%) | 0 (0.0%) |
| Transportation | 0 (0.0%) | 0 (0.0%) |
| Material Moving | 0 (0.0%) | 0 (0.0%) |
| Total (Category) | 0 (0.0%) | 0 (0.0%) |
| Total (Overall) | 122 (71.4%) | 49 (28.6%) |
Employment Industries by Sex in Jordan Hill
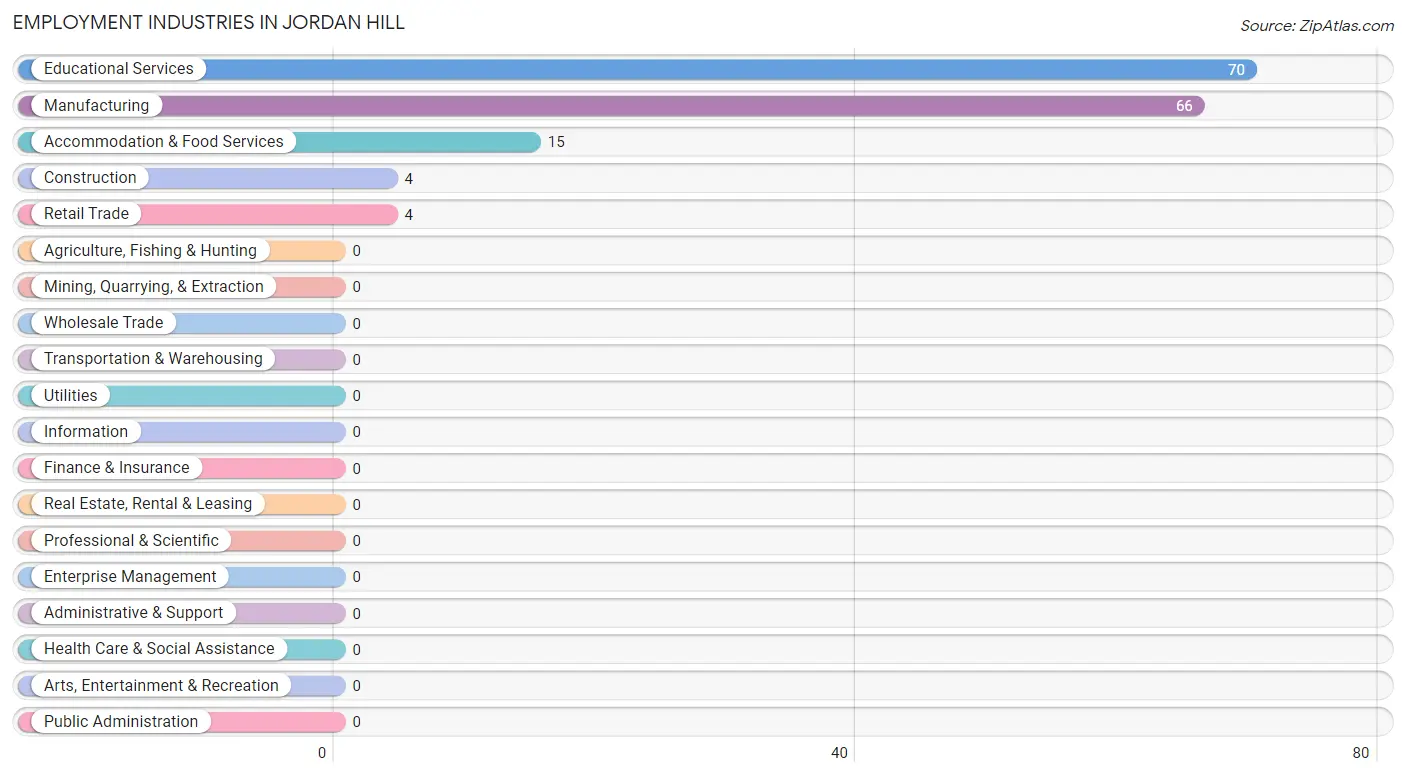
Employment Industries in Jordan Hill
The major employment industries in Jordan Hill include Educational Services (70 | 40.9%), Manufacturing (66 | 38.6%), Accommodation & Food Services (15 | 8.8%), Construction (4 | 2.3%), and Retail Trade (4 | 2.3%).
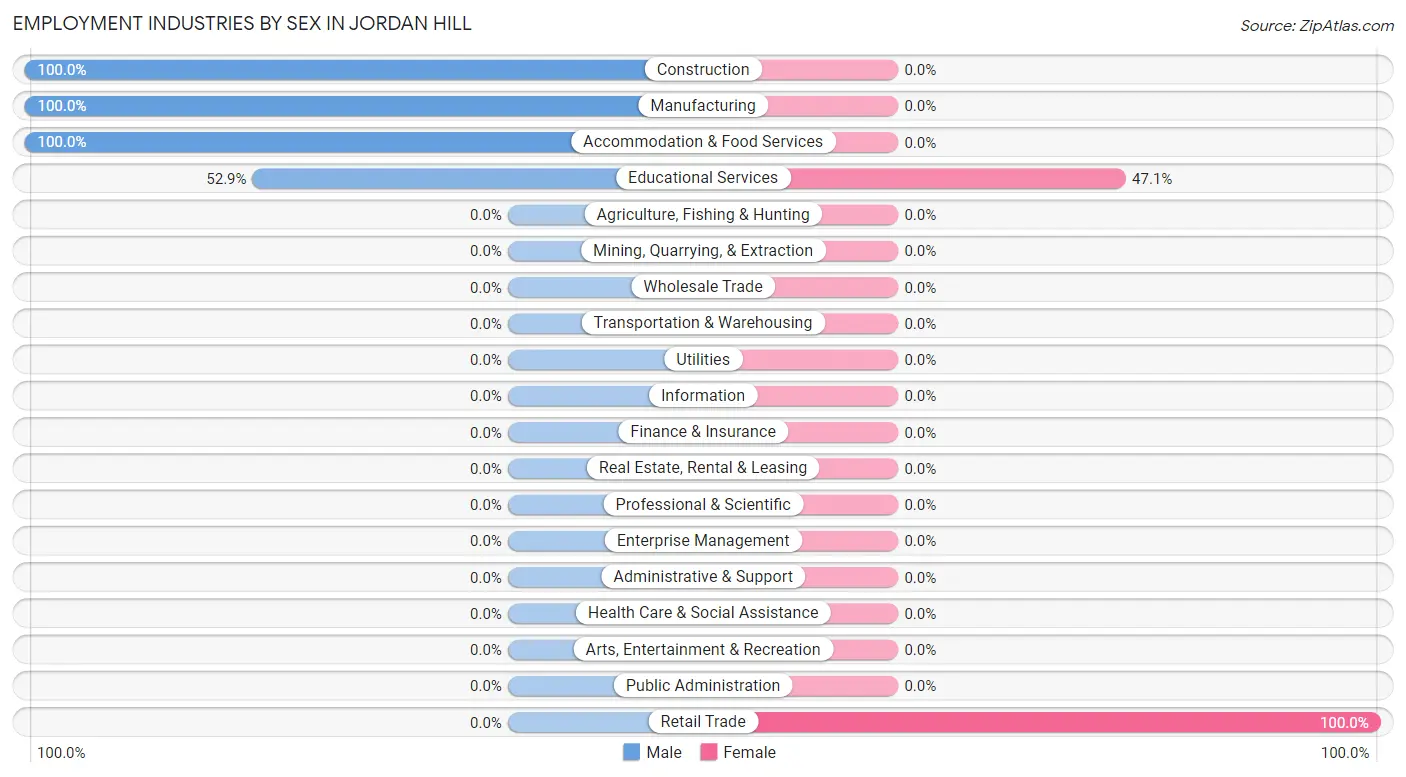
Employment Industries by Sex in Jordan Hill
The Jordan Hill industries that see more men than women are Construction (100.0%), Manufacturing (100.0%), and Accommodation & Food Services (100.0%), whereas the industries that tend to have a higher number of women are Retail Trade (100.0%), and Educational Services (47.1%).
| Industry | Male | Female |
| Agriculture, Fishing & Hunting | 0 (0.0%) | 0 (0.0%) |
| Mining, Quarrying, & Extraction | 0 (0.0%) | 0 (0.0%) |
| Construction | 4 (100.0%) | 0 (0.0%) |
| Manufacturing | 66 (100.0%) | 0 (0.0%) |
| Wholesale Trade | 0 (0.0%) | 0 (0.0%) |
| Retail Trade | 0 (0.0%) | 4 (100.0%) |
| Transportation & Warehousing | 0 (0.0%) | 0 (0.0%) |
| Utilities | 0 (0.0%) | 0 (0.0%) |
| Information | 0 (0.0%) | 0 (0.0%) |
| Finance & Insurance | 0 (0.0%) | 0 (0.0%) |
| Real Estate, Rental & Leasing | 0 (0.0%) | 0 (0.0%) |
| Professional & Scientific | 0 (0.0%) | 0 (0.0%) |
| Enterprise Management | 0 (0.0%) | 0 (0.0%) |
| Administrative & Support | 0 (0.0%) | 0 (0.0%) |
| Educational Services | 37 (52.9%) | 33 (47.1%) |
| Health Care & Social Assistance | 0 (0.0%) | 0 (0.0%) |
| Arts, Entertainment & Recreation | 0 (0.0%) | 0 (0.0%) |
| Accommodation & Food Services | 15 (100.0%) | 0 (0.0%) |
| Public Administration | 0 (0.0%) | 0 (0.0%) |
| Total | 122 (71.4%) | 49 (28.6%) |
Education in Jordan Hill
School Enrollment in Jordan Hill
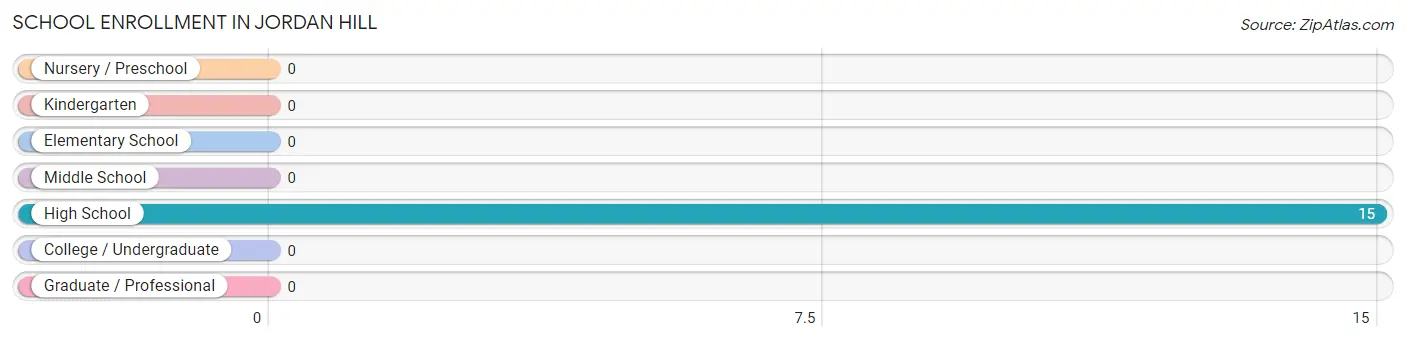
| School Level | # Students | % Students |
| Nursery / Preschool | 0 | 0.0% |
| Kindergarten | 0 | 0.0% |
| Elementary School | 0 | 0.0% |
| Middle School | 0 | 0.0% |
| High School | 15 | 100.0% |
| College / Undergraduate | 0 | 0.0% |
| Graduate / Professional | 0 | 0.0% |
| Total | 15 | 100.0% |
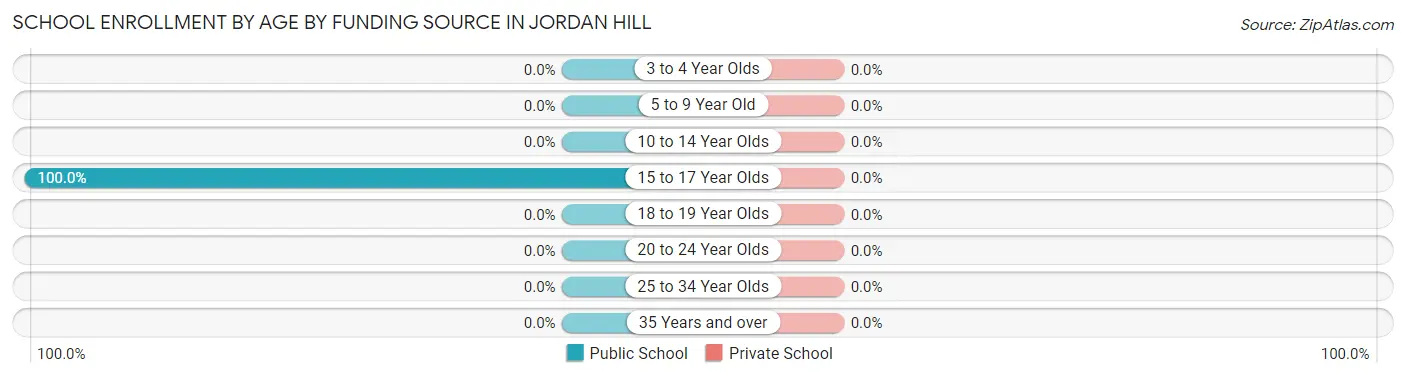
School Enrollment by Age by Funding Source in Jordan Hill
| Age Bracket | Public School | Private School |
| 3 to 4 Year Olds | 0 (0.0%) | 0 (0.0%) |
| 5 to 9 Year Old | 0 (0.0%) | 0 (0.0%) |
| 10 to 14 Year Olds | 0 (0.0%) | 0 (0.0%) |
| 15 to 17 Year Olds | 15 (100.0%) | 0 (0.0%) |
| 18 to 19 Year Olds | 0 (0.0%) | 0 (0.0%) |
| 20 to 24 Year Olds | 0 (0.0%) | 0 (0.0%) |
| 25 to 34 Year Olds | 0 (0.0%) | 0 (0.0%) |
| 35 Years and over | 0 (0.0%) | 0 (0.0%) |
| Total | 15 (100.0%) | 0 (0.0%) |
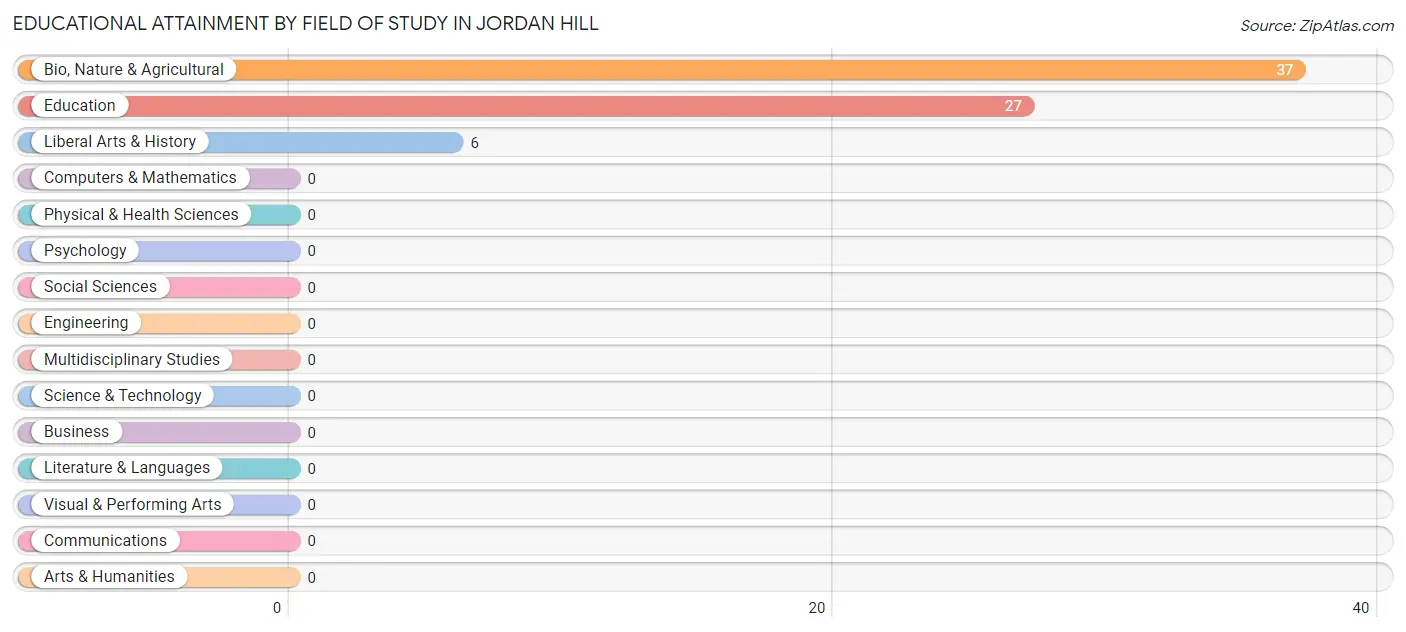
Educational Attainment by Field of Study in Jordan Hill
Bio, nature & agricultural (37 | 52.9%), education (27 | 38.6%), and liberal arts & history (6 | 8.6%) are the most common fields of study among 70 individuals in Jordan Hill who have obtained a bachelor's degree or higher.
| Field of Study | # Graduates | % Graduates |
| Computers & Mathematics | 0 | 0.0% |
| Bio, Nature & Agricultural | 37 | 52.9% |
| Physical & Health Sciences | 0 | 0.0% |
| Psychology | 0 | 0.0% |
| Social Sciences | 0 | 0.0% |
| Engineering | 0 | 0.0% |
| Multidisciplinary Studies | 0 | 0.0% |
| Science & Technology | 0 | 0.0% |
| Business | 0 | 0.0% |
| Education | 27 | 38.6% |
| Literature & Languages | 0 | 0.0% |
| Liberal Arts & History | 6 | 8.6% |
| Visual & Performing Arts | 0 | 0.0% |
| Communications | 0 | 0.0% |
| Arts & Humanities | 0 | 0.0% |
| Total | 70 | 100.0% |
Transportation & Commute in Jordan Hill
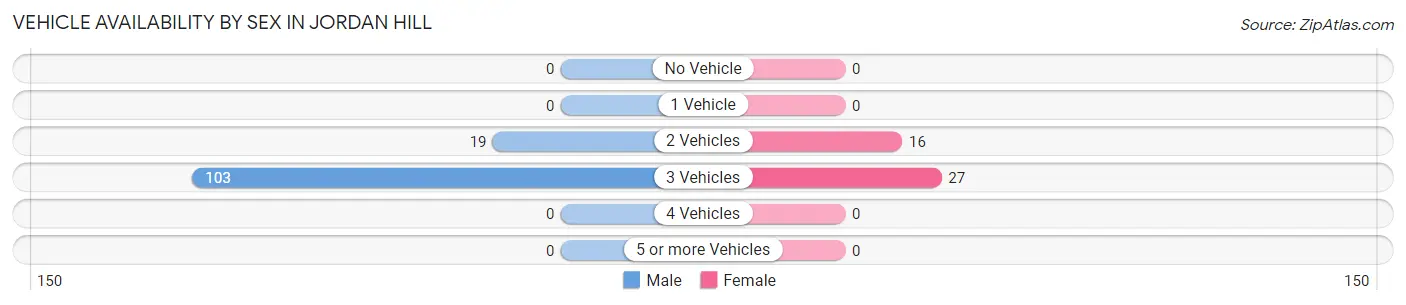
Vehicle Availability by Sex in Jordan Hill
The most prevalent vehicle ownership categories in Jordan Hill are males with 3 vehicles (103, accounting for 84.4%) and females with 3 vehicles (27, making up 239.5%).
| Vehicles Available | Male | Female |
| No Vehicle | 0 (0.0%) | 0 (0.0%) |
| 1 Vehicle | 0 (0.0%) | 0 (0.0%) |
| 2 Vehicles | 19 (15.6%) | 16 (37.2%) |
| 3 Vehicles | 103 (84.4%) | 27 (62.8%) |
| 4 Vehicles | 0 (0.0%) | 0 (0.0%) |
| 5 or more Vehicles | 0 (0.0%) | 0 (0.0%) |
| Total | 122 (100.0%) | 43 (100.0%) |
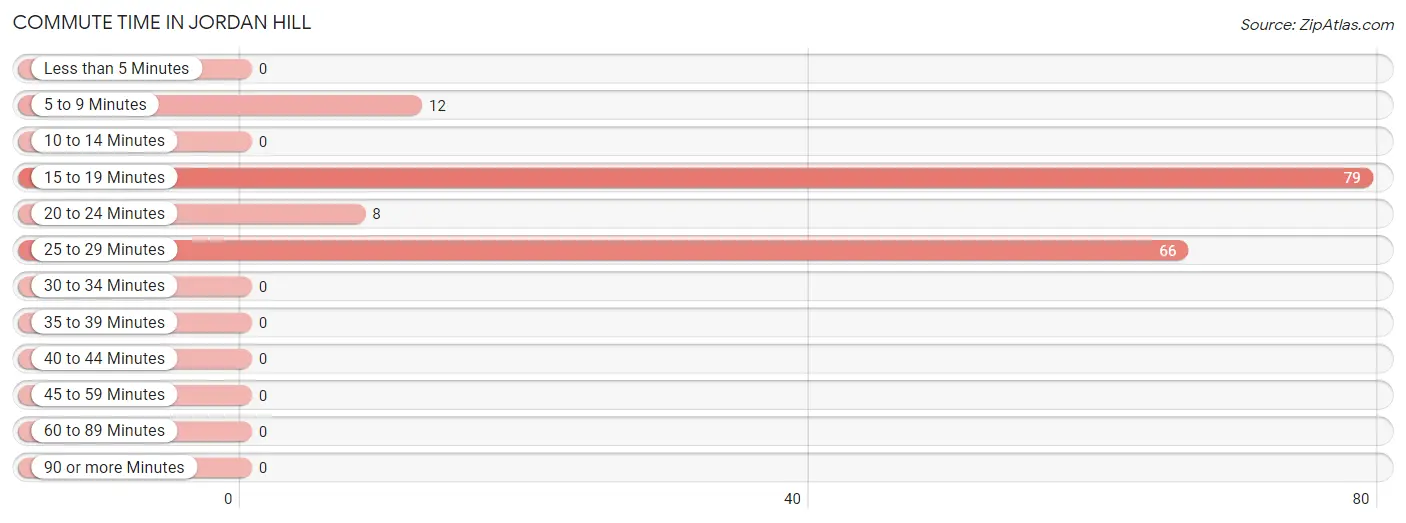
Commute Time in Jordan Hill
The most frequently occuring commute durations in Jordan Hill are 15 to 19 minutes (79 commuters, 47.9%), 25 to 29 minutes (66 commuters, 40.0%), and 5 to 9 minutes (12 commuters, 7.3%).
| Commute Time | # Commuters | % Commuters |
| Less than 5 Minutes | 0 | 0.0% |
| 5 to 9 Minutes | 12 | 7.3% |
| 10 to 14 Minutes | 0 | 0.0% |
| 15 to 19 Minutes | 79 | 47.9% |
| 20 to 24 Minutes | 8 | 4.9% |
| 25 to 29 Minutes | 66 | 40.0% |
| 30 to 34 Minutes | 0 | 0.0% |
| 35 to 39 Minutes | 0 | 0.0% |
| 40 to 44 Minutes | 0 | 0.0% |
| 45 to 59 Minutes | 0 | 0.0% |
| 60 to 89 Minutes | 0 | 0.0% |
| 90 or more Minutes | 0 | 0.0% |
Commute Time by Sex in Jordan Hill
The most common commute times in Jordan Hill are 25 to 29 minutes (66 commuters, 54.1%) for males and 15 to 19 minutes (27 commuters, 62.8%) for females.
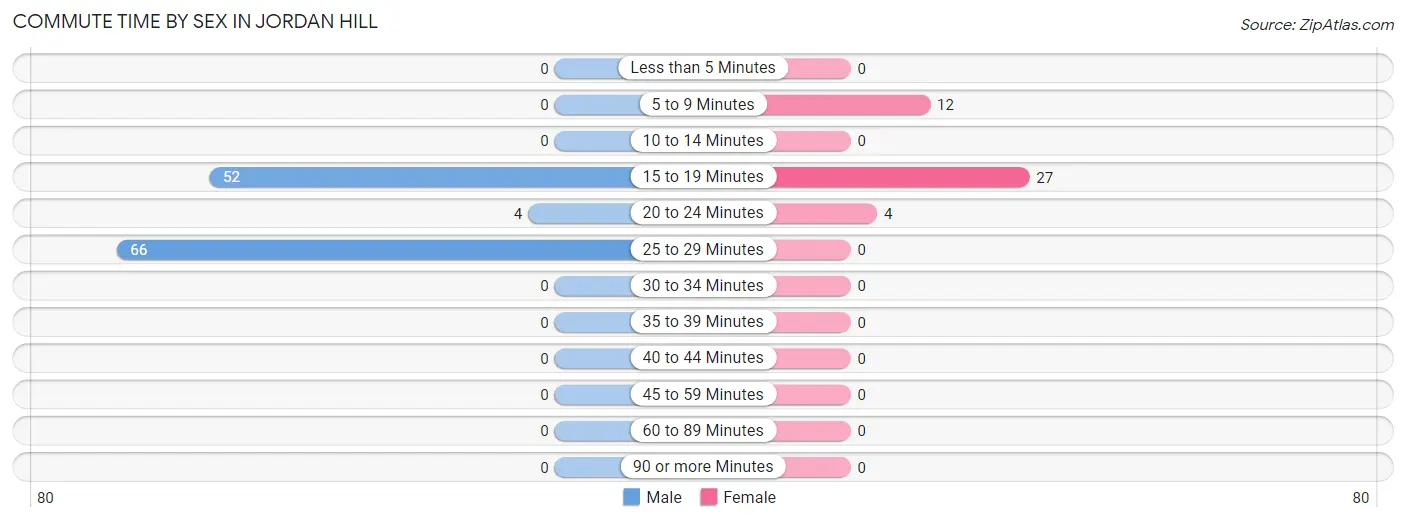
| Commute Time | Male | Female |
| Less than 5 Minutes | 0 (0.0%) | 0 (0.0%) |
| 5 to 9 Minutes | 0 (0.0%) | 12 (27.9%) |
| 10 to 14 Minutes | 0 (0.0%) | 0 (0.0%) |
| 15 to 19 Minutes | 52 (42.6%) | 27 (62.8%) |
| 20 to 24 Minutes | 4 (3.3%) | 4 (9.3%) |
| 25 to 29 Minutes | 66 (54.1%) | 0 (0.0%) |
| 30 to 34 Minutes | 0 (0.0%) | 0 (0.0%) |
| 35 to 39 Minutes | 0 (0.0%) | 0 (0.0%) |
| 40 to 44 Minutes | 0 (0.0%) | 0 (0.0%) |
| 45 to 59 Minutes | 0 (0.0%) | 0 (0.0%) |
| 60 to 89 Minutes | 0 (0.0%) | 0 (0.0%) |
| 90 or more Minutes | 0 (0.0%) | 0 (0.0%) |
Time of Departure to Work by Sex in Jordan Hill
The most frequent times of departure to work in Jordan Hill are 6:00 AM to 6:29 AM (70, 57.4%) for males and 7:30 AM to 7:59 AM (31, 72.1%) for females.
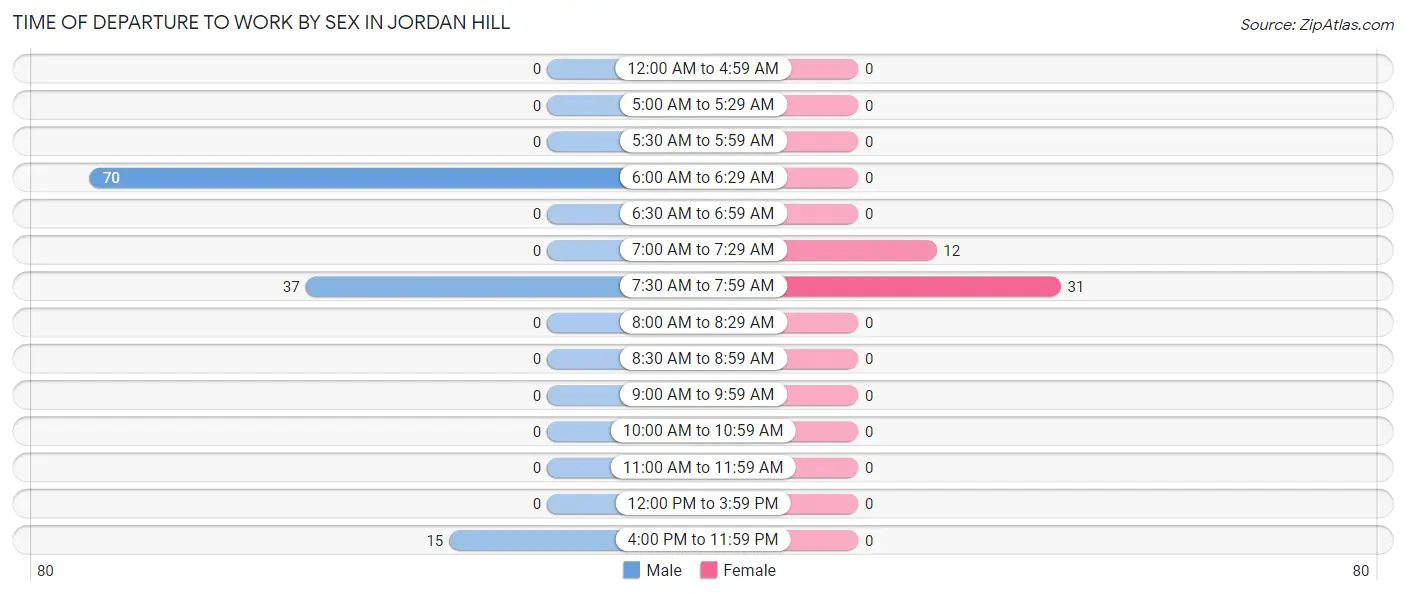
| Time of Departure | Male | Female |
| 12:00 AM to 4:59 AM | 0 (0.0%) | 0 (0.0%) |
| 5:00 AM to 5:29 AM | 0 (0.0%) | 0 (0.0%) |
| 5:30 AM to 5:59 AM | 0 (0.0%) | 0 (0.0%) |
| 6:00 AM to 6:29 AM | 70 (57.4%) | 0 (0.0%) |
| 6:30 AM to 6:59 AM | 0 (0.0%) | 0 (0.0%) |
| 7:00 AM to 7:29 AM | 0 (0.0%) | 12 (27.9%) |
| 7:30 AM to 7:59 AM | 37 (30.3%) | 31 (72.1%) |
| 8:00 AM to 8:29 AM | 0 (0.0%) | 0 (0.0%) |
| 8:30 AM to 8:59 AM | 0 (0.0%) | 0 (0.0%) |
| 9:00 AM to 9:59 AM | 0 (0.0%) | 0 (0.0%) |
| 10:00 AM to 10:59 AM | 0 (0.0%) | 0 (0.0%) |
| 11:00 AM to 11:59 AM | 0 (0.0%) | 0 (0.0%) |
| 12:00 PM to 3:59 PM | 0 (0.0%) | 0 (0.0%) |
| 4:00 PM to 11:59 PM | 15 (12.3%) | 0 (0.0%) |
| Total | 122 (100.0%) | 43 (100.0%) |
Housing Occupancy in Jordan Hill
Occupancy by Ownership in Jordan Hill
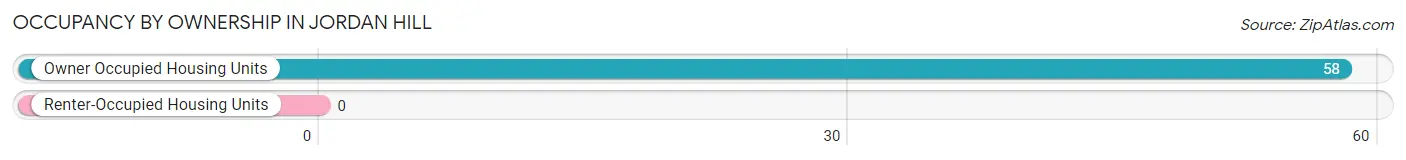
Of the total 58 dwellings in Jordan Hill, owner-occupied units account for 58 (100.0%), while renter-occupied units make up 0 (0.0%).
| Occupancy | # Housing Units | % Housing Units |
| Owner Occupied Housing Units | 58 | 100.0% |
| Renter-Occupied Housing Units | 0 | 0.0% |
| Total Occupied Housing Units | 58 | 100.0% |
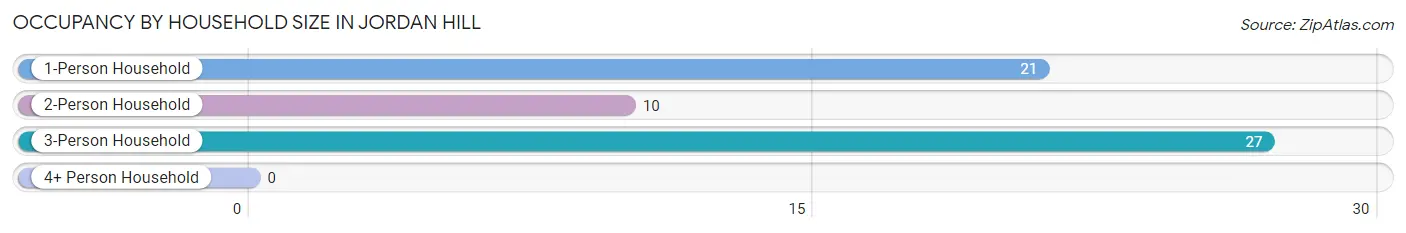
Occupancy by Household Size in Jordan Hill
| Household Size | # Housing Units | % Housing Units |
| 1-Person Household | 21 | 36.2% |
| 2-Person Household | 10 | 17.2% |
| 3-Person Household | 27 | 46.6% |
| 4+ Person Household | 0 | 0.0% |
| Total Housing Units | 58 | 100.0% |
Occupancy by Ownership by Household Size in Jordan Hill
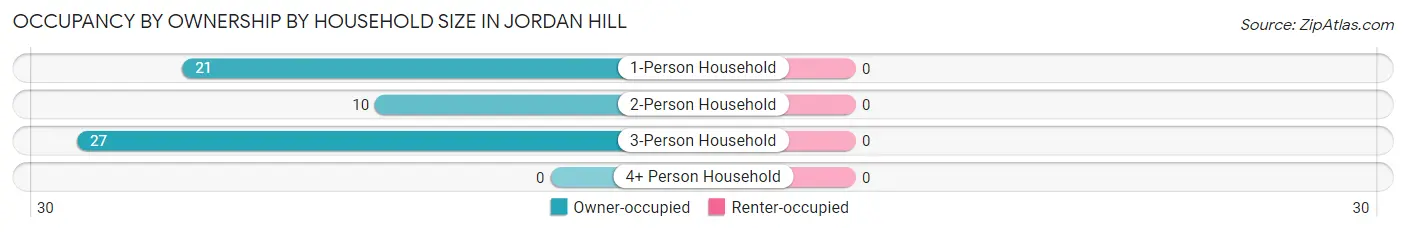
| Household Size | Owner-occupied | Renter-occupied |
| 1-Person Household | 21 (100.0%) | 0 (0.0%) |
| 2-Person Household | 10 (100.0%) | 0 (0.0%) |
| 3-Person Household | 27 (100.0%) | 0 (0.0%) |
| 4+ Person Household | 0 (0.0%) | 0 (0.0%) |
| Total Housing Units | 58 (100.0%) | 0 (0.0%) |
Occupancy by Educational Attainment in Jordan Hill
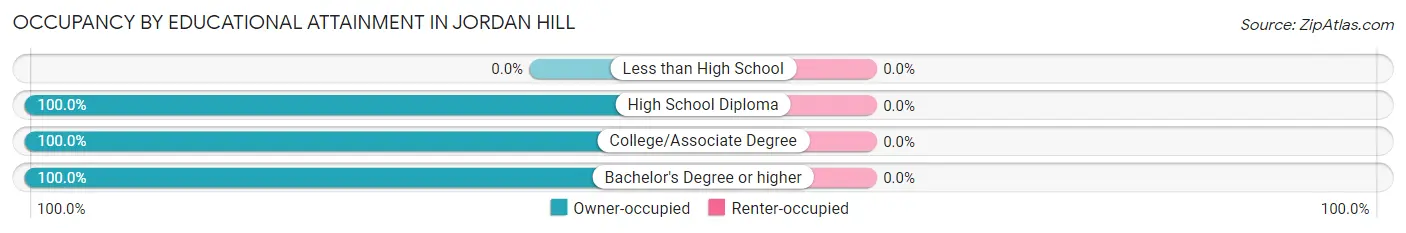
| Household Size | Owner-occupied | Renter-occupied |
| Less than High School | 0 (0.0%) | 0 (0.0%) |
| High School Diploma | 4 (100.0%) | 0 (0.0%) |
| College/Associate Degree | 21 (100.0%) | 0 (0.0%) |
| Bachelor's Degree or higher | 33 (100.0%) | 0 (0.0%) |
Occupancy by Age of Householder in Jordan Hill
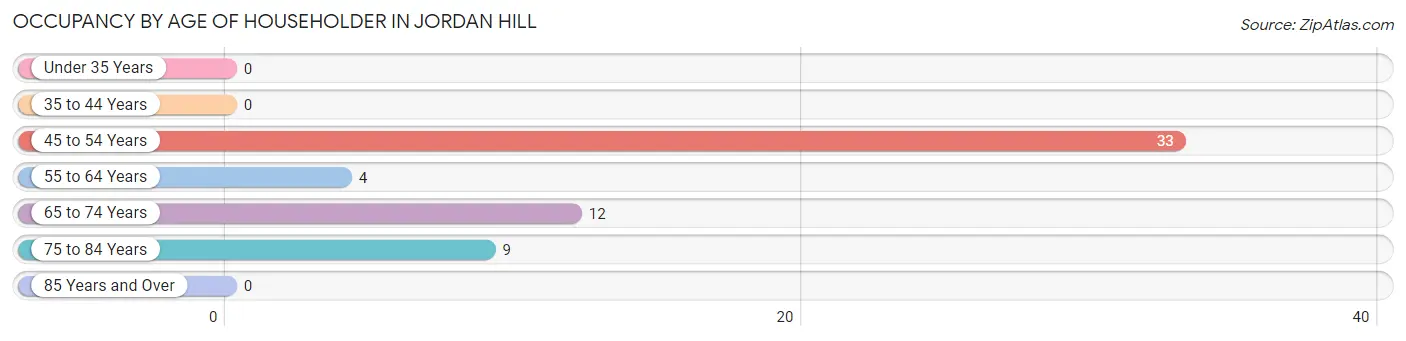
| Age Bracket | # Households | % Households |
| Under 35 Years | 0 | 0.0% |
| 35 to 44 Years | 0 | 0.0% |
| 45 to 54 Years | 33 | 56.9% |
| 55 to 64 Years | 4 | 6.9% |
| 65 to 74 Years | 12 | 20.7% |
| 75 to 84 Years | 9 | 15.5% |
| 85 Years and Over | 0 | 0.0% |
| Total | 58 | 100.0% |
Housing Finances in Jordan Hill
Median Income by Occupancy in Jordan Hill
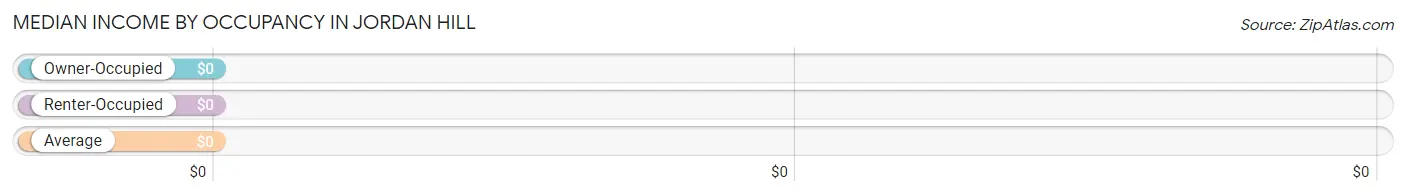
| Occupancy Type | # Households | Median Income |
| Owner-Occupied | 58 (100.0%) | $0 |
| Renter-Occupied | 0 (0.0%) | $0 |
| Average | 58 (100.0%) | $0 |
Occupancy by Householder Income Bracket in Jordan Hill
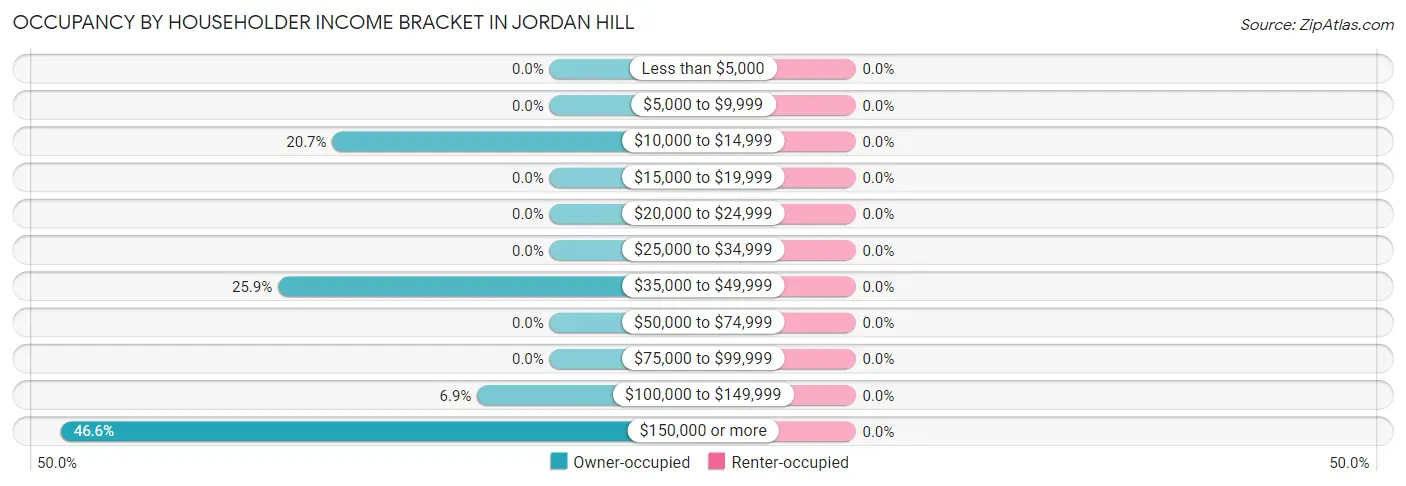
| Income Bracket | Owner-occupied | Renter-occupied |
| Less than $5,000 | 0 (0.0%) | 0 (0.0%) |
| $5,000 to $9,999 | 0 (0.0%) | 0 (0.0%) |
| $10,000 to $14,999 | 12 (20.7%) | 0 (0.0%) |
| $15,000 to $19,999 | 0 (0.0%) | 0 (0.0%) |
| $20,000 to $24,999 | 0 (0.0%) | 0 (0.0%) |
| $25,000 to $34,999 | 0 (0.0%) | 0 (0.0%) |
| $35,000 to $49,999 | 15 (25.9%) | 0 (0.0%) |
| $50,000 to $74,999 | 0 (0.0%) | 0 (0.0%) |
| $75,000 to $99,999 | 0 (0.0%) | 0 (0.0%) |
| $100,000 to $149,999 | 4 (6.9%) | 0 (0.0%) |
| $150,000 or more | 27 (46.6%) | 0 (0.0%) |
| Total | 58 (100.0%) | 0 (0.0%) |
Monthly Housing Cost Tiers in Jordan Hill
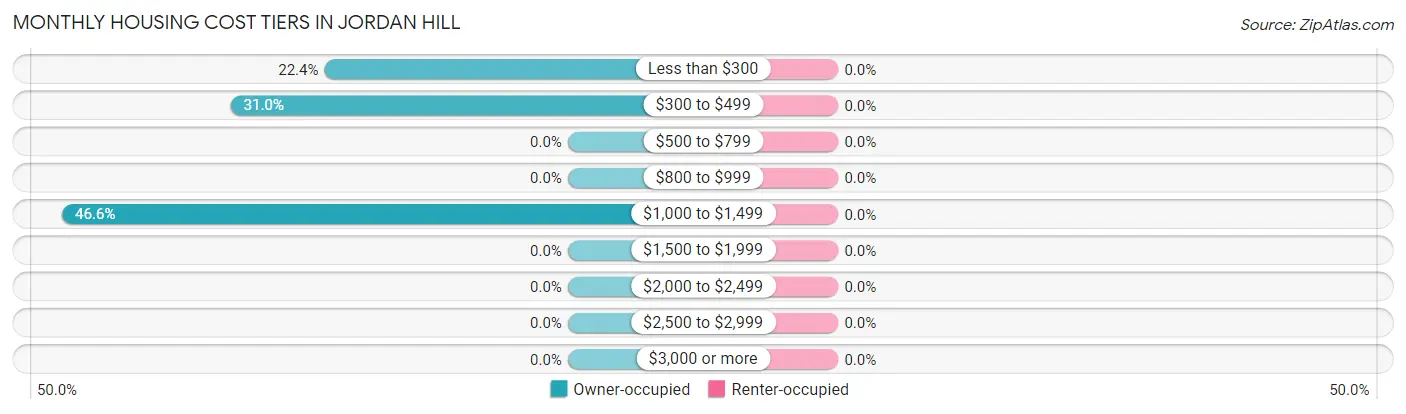
| Monthly Cost | Owner-occupied | Renter-occupied |
| Less than $300 | 13 (22.4%) | 0 (0.0%) |
| $300 to $499 | 18 (31.0%) | 0 (0.0%) |
| $500 to $799 | 0 (0.0%) | 0 (0.0%) |
| $800 to $999 | 0 (0.0%) | 0 (0.0%) |
| $1,000 to $1,499 | 27 (46.6%) | 0 (0.0%) |
| $1,500 to $1,999 | 0 (0.0%) | 0 (0.0%) |
| $2,000 to $2,499 | 0 (0.0%) | 0 (0.0%) |
| $2,500 to $2,999 | 0 (0.0%) | 0 (0.0%) |
| $3,000 or more | 0 (0.0%) | 0 (0.0%) |
| Total | 58 (100.0%) | 0 (0.0%) |
Physical Housing Characteristics in Jordan Hill
Housing Structures in Jordan Hill
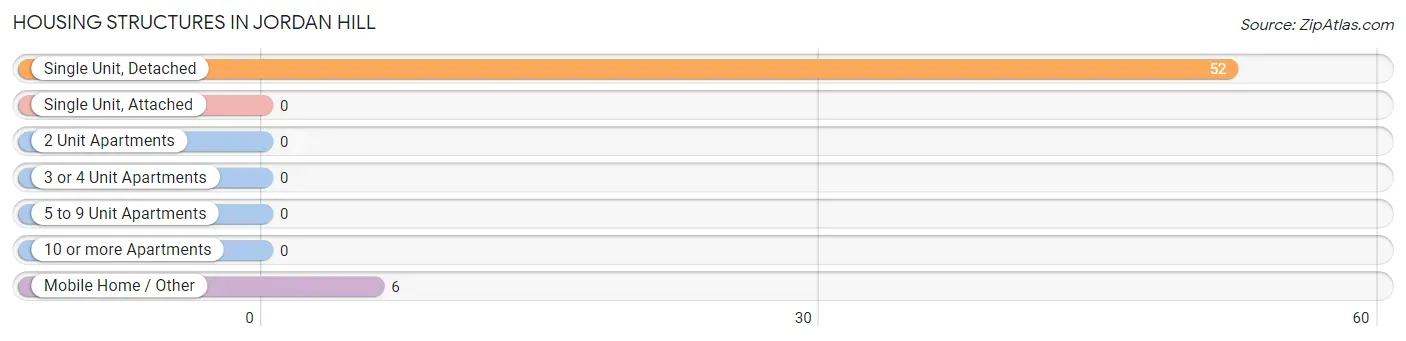
| Structure Type | # Housing Units | % Housing Units |
| Single Unit, Detached | 52 | 89.7% |
| Single Unit, Attached | 0 | 0.0% |
| 2 Unit Apartments | 0 | 0.0% |
| 3 or 4 Unit Apartments | 0 | 0.0% |
| 5 to 9 Unit Apartments | 0 | 0.0% |
| 10 or more Apartments | 0 | 0.0% |
| Mobile Home / Other | 6 | 10.3% |
| Total | 58 | 100.0% |
Housing Structures by Occupancy in Jordan Hill
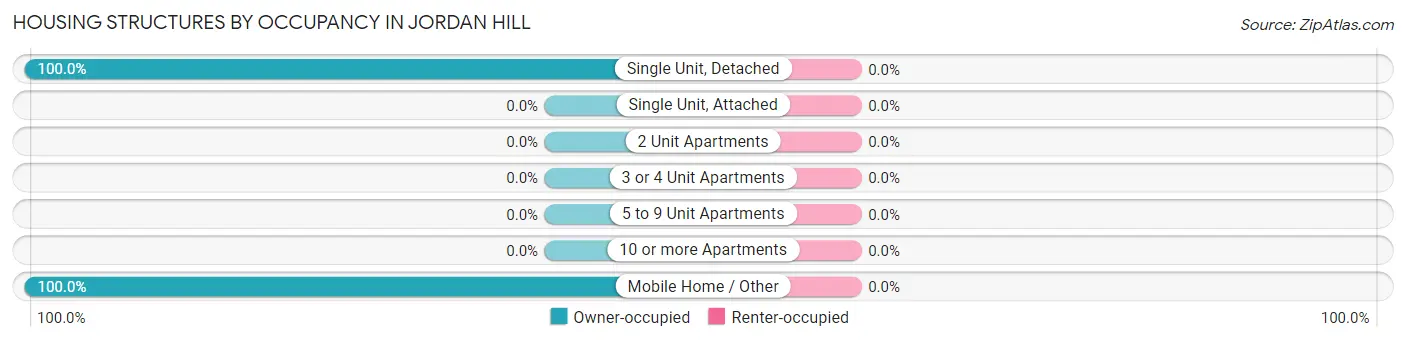
| Structure Type | Owner-occupied | Renter-occupied |
| Single Unit, Detached | 52 (100.0%) | 0 (0.0%) |
| Single Unit, Attached | 0 (0.0%) | 0 (0.0%) |
| 2 Unit Apartments | 0 (0.0%) | 0 (0.0%) |
| 3 or 4 Unit Apartments | 0 (0.0%) | 0 (0.0%) |
| 5 to 9 Unit Apartments | 0 (0.0%) | 0 (0.0%) |
| 10 or more Apartments | 0 (0.0%) | 0 (0.0%) |
| Mobile Home / Other | 6 (100.0%) | 0 (0.0%) |
| Total | 58 (100.0%) | 0 (0.0%) |
Housing Structures by Number of Rooms in Jordan Hill
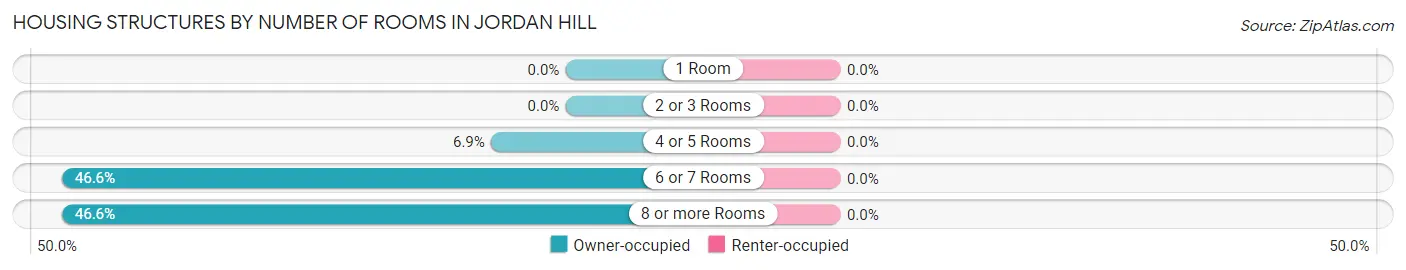
| Number of Rooms | Owner-occupied | Renter-occupied |
| 1 Room | 0 (0.0%) | 0 (0.0%) |
| 2 or 3 Rooms | 0 (0.0%) | 0 (0.0%) |
| 4 or 5 Rooms | 4 (6.9%) | 0 (0.0%) |
| 6 or 7 Rooms | 27 (46.6%) | 0 (0.0%) |
| 8 or more Rooms | 27 (46.6%) | 0 (0.0%) |
| Total | 58 (100.0%) | 0 (0.0%) |
Housing Structure by Heating Type in Jordan Hill
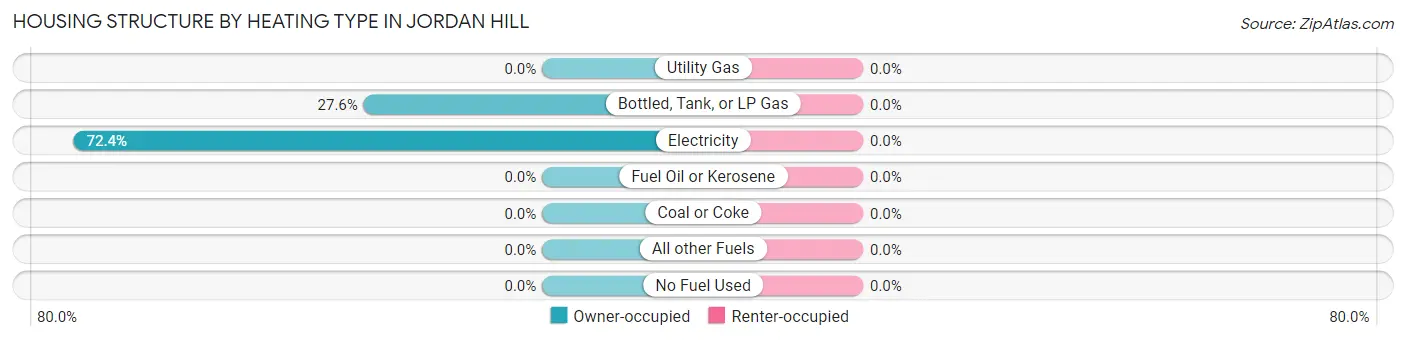
| Heating Type | Owner-occupied | Renter-occupied |
| Utility Gas | 0 (0.0%) | 0 (0.0%) |
| Bottled, Tank, or LP Gas | 16 (27.6%) | 0 (0.0%) |
| Electricity | 42 (72.4%) | 0 (0.0%) |
| Fuel Oil or Kerosene | 0 (0.0%) | 0 (0.0%) |
| Coal or Coke | 0 (0.0%) | 0 (0.0%) |
| All other Fuels | 0 (0.0%) | 0 (0.0%) |
| No Fuel Used | 0 (0.0%) | 0 (0.0%) |
| Total | 58 (100.0%) | 0 (0.0%) |
Household Vehicle Usage in Jordan Hill
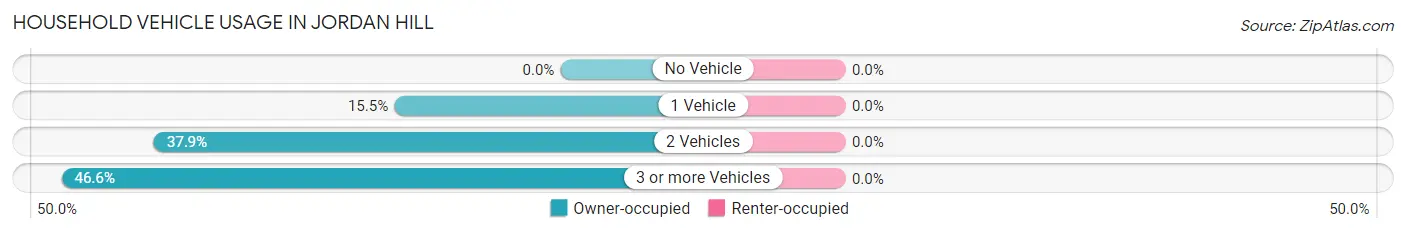
| Vehicles per Household | Owner-occupied | Renter-occupied |
| No Vehicle | 0 (0.0%) | 0 (0.0%) |
| 1 Vehicle | 9 (15.5%) | 0 (0.0%) |
| 2 Vehicles | 22 (37.9%) | 0 (0.0%) |
| 3 or more Vehicles | 27 (46.6%) | 0 (0.0%) |
| Total | 58 (100.0%) | 0 (0.0%) |
Real Estate & Mortgages in Jordan Hill
Real Estate and Mortgage Overview in Jordan Hill
| Characteristic | Without Mortgage | With Mortgage |
| Housing Units | 31 | 27 |
| Median Property Value | $82,600 | $0 |
| Median Household Income | $38,472 | $27 |
| Monthly Housing Costs | $414 | $0 |
| Real Estate Taxes | - | - |
Property Value by Mortgage Status in Jordan Hill
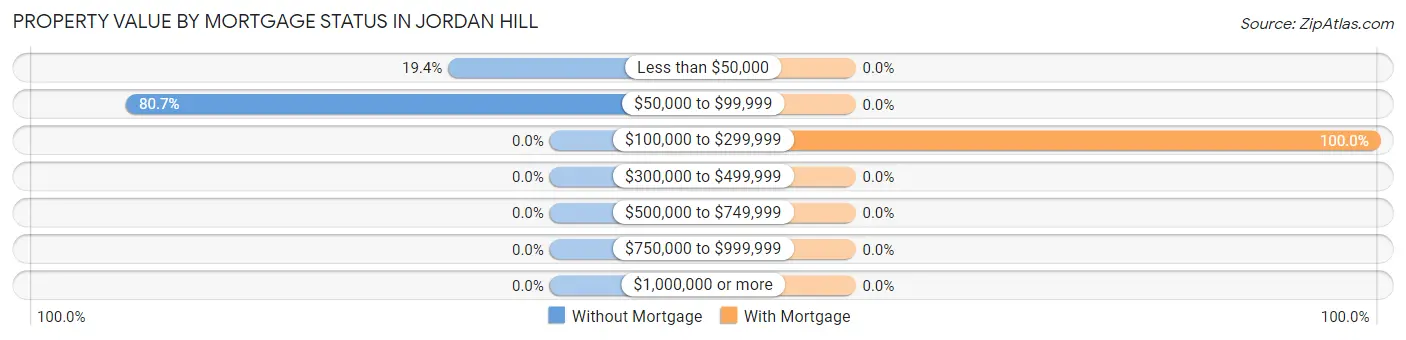
| Property Value | Without Mortgage | With Mortgage |
| Less than $50,000 | 6 (19.4%) | 0 (0.0%) |
| $50,000 to $99,999 | 25 (80.6%) | 0 (0.0%) |
| $100,000 to $299,999 | 0 (0.0%) | 27 (100.0%) |
| $300,000 to $499,999 | 0 (0.0%) | 0 (0.0%) |
| $500,000 to $749,999 | 0 (0.0%) | 0 (0.0%) |
| $750,000 to $999,999 | 0 (0.0%) | 0 (0.0%) |
| $1,000,000 or more | 0 (0.0%) | 0 (0.0%) |
| Total | 31 (100.0%) | 27 (100.0%) |
Household Income by Mortgage Status in Jordan Hill
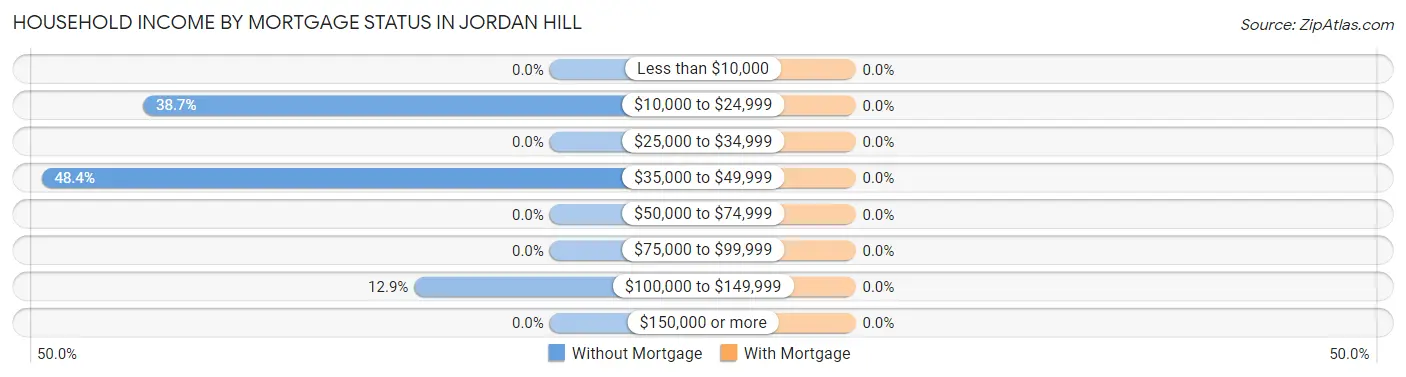
| Household Income | Without Mortgage | With Mortgage |
| Less than $10,000 | 0 (0.0%) | 0 (0.0%) |
| $10,000 to $24,999 | 12 (38.7%) | 0 (0.0%) |
| $25,000 to $34,999 | 0 (0.0%) | 0 (0.0%) |
| $35,000 to $49,999 | 15 (48.4%) | 0 (0.0%) |
| $50,000 to $74,999 | 0 (0.0%) | 0 (0.0%) |
| $75,000 to $99,999 | 0 (0.0%) | 0 (0.0%) |
| $100,000 to $149,999 | 4 (12.9%) | 0 (0.0%) |
| $150,000 or more | 0 (0.0%) | 0 (0.0%) |
| Total | 31 (100.0%) | 27 (100.0%) |
Property Value to Household Income Ratio in Jordan Hill
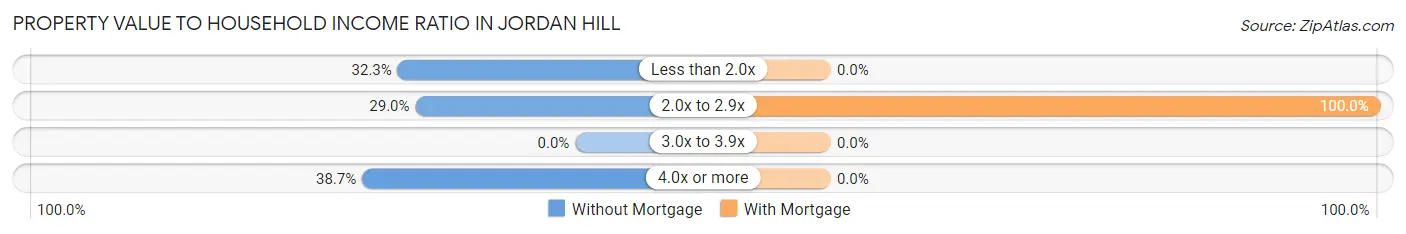
| Value-to-Income Ratio | Without Mortgage | With Mortgage |
| Less than 2.0x | 10 (32.3%) | 0 (0.0%) |
| 2.0x to 2.9x | 9 (29.0%) | 27 (100.0%) |
| 3.0x to 3.9x | 0 (0.0%) | 0 (0.0%) |
| 4.0x or more | 12 (38.7%) | 0 (0.0%) |
| Total | 31 (100.0%) | 27 (100.0%) |
Real Estate Taxes by Mortgage Status in Jordan Hill
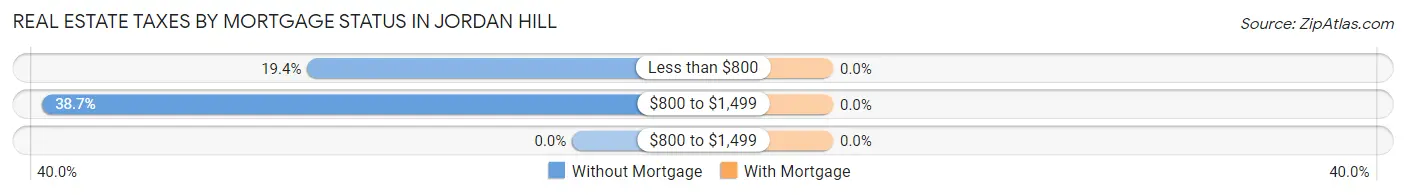
| Property Taxes | Without Mortgage | With Mortgage |
| Less than $800 | 6 (19.4%) | 0 (0.0%) |
| $800 to $1,499 | 12 (38.7%) | 0 (0.0%) |
| $800 to $1,499 | 0 (0.0%) | 0 (0.0%) |
| Total | 31 (100.0%) | 27 (100.0%) |
Health & Disability in Jordan Hill
Health Insurance Coverage by Age in Jordan Hill
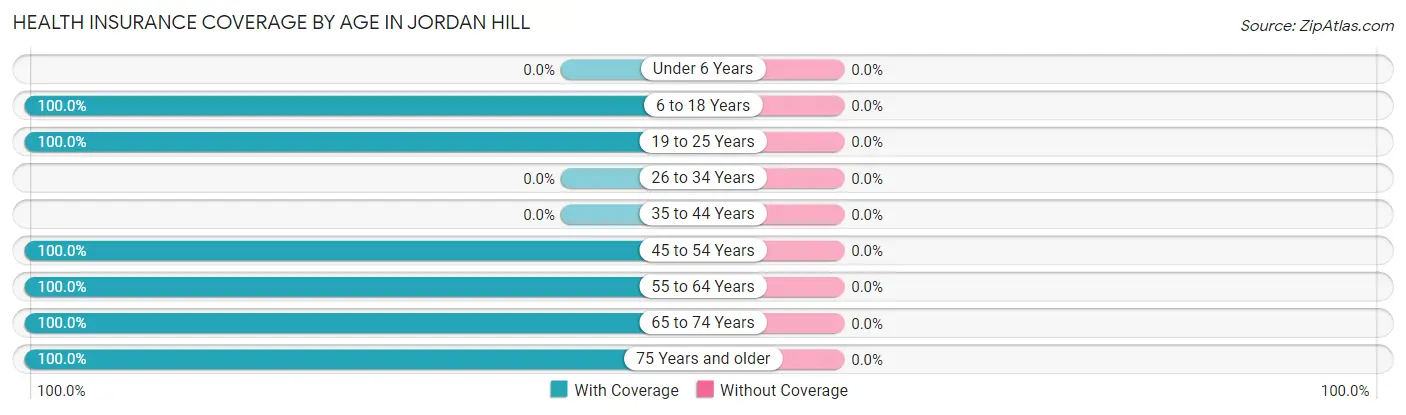
| Age Bracket | With Coverage | Without Coverage |
| Under 6 Years | 0 (0.0%) | 0 (0.0%) |
| 6 to 18 Years | 15 (100.0%) | 0 (0.0%) |
| 19 to 25 Years | 66 (100.0%) | 0 (0.0%) |
| 26 to 34 Years | 0 (0.0%) | 0 (0.0%) |
| 35 to 44 Years | 0 (0.0%) | 0 (0.0%) |
| 45 to 54 Years | 33 (100.0%) | 0 (0.0%) |
| 55 to 64 Years | 45 (100.0%) | 0 (0.0%) |
| 65 to 74 Years | 12 (100.0%) | 0 (0.0%) |
| 75 Years and older | 9 (100.0%) | 0 (0.0%) |
| Total | 180 (100.0%) | 0 (0.0%) |
Health Insurance Coverage by Citizenship Status in Jordan Hill
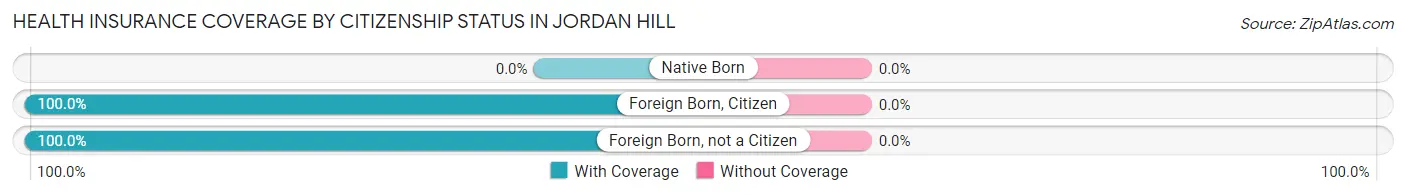
| Citizenship Status | With Coverage | Without Coverage |
| Native Born | 0 (0.0%) | 0 (0.0%) |
| Foreign Born, Citizen | 15 (100.0%) | 0 (0.0%) |
| Foreign Born, not a Citizen | 66 (100.0%) | 0 (0.0%) |
Health Insurance Coverage by Household Income in Jordan Hill
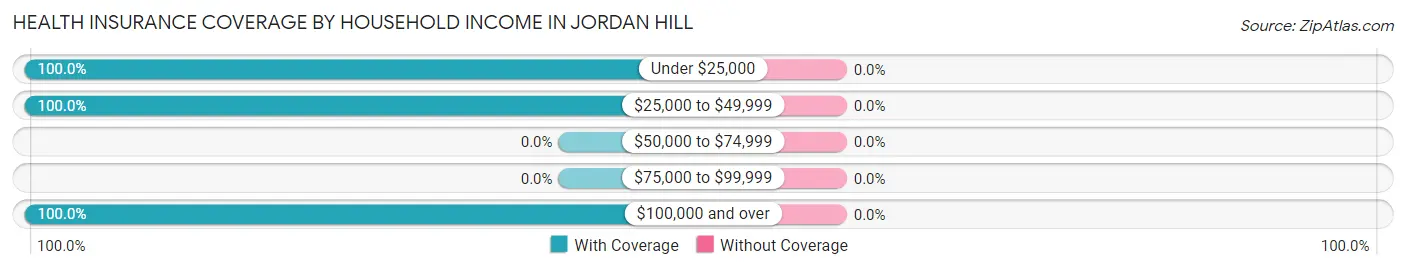
| Household Income | With Coverage | Without Coverage |
| Under $25,000 | 12 (100.0%) | 0 (0.0%) |
| $25,000 to $49,999 | 30 (100.0%) | 0 (0.0%) |
| $50,000 to $74,999 | 0 (0.0%) | 0 (0.0%) |
| $75,000 to $99,999 | 0 (0.0%) | 0 (0.0%) |
| $100,000 and over | 138 (100.0%) | 0 (0.0%) |
Public vs Private Health Insurance Coverage by Age in Jordan Hill
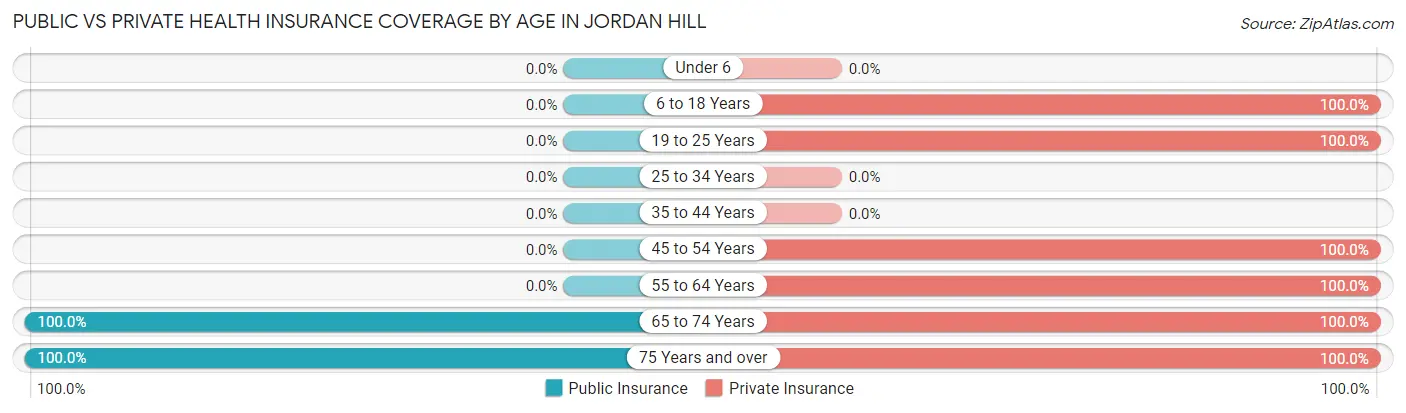
| Age Bracket | Public Insurance | Private Insurance |
| Under 6 | 0 (0.0%) | 0 (0.0%) |
| 6 to 18 Years | 0 (0.0%) | 15 (100.0%) |
| 19 to 25 Years | 0 (0.0%) | 66 (100.0%) |
| 25 to 34 Years | 0 (0.0%) | 0 (0.0%) |
| 35 to 44 Years | 0 (0.0%) | 0 (0.0%) |
| 45 to 54 Years | 0 (0.0%) | 33 (100.0%) |
| 55 to 64 Years | 0 (0.0%) | 45 (100.0%) |
| 65 to 74 Years | 12 (100.0%) | 12 (100.0%) |
| 75 Years and over | 9 (100.0%) | 9 (100.0%) |
| Total | 21 (11.7%) | 180 (100.0%) |
Disability Status by Sex by Age in Jordan Hill
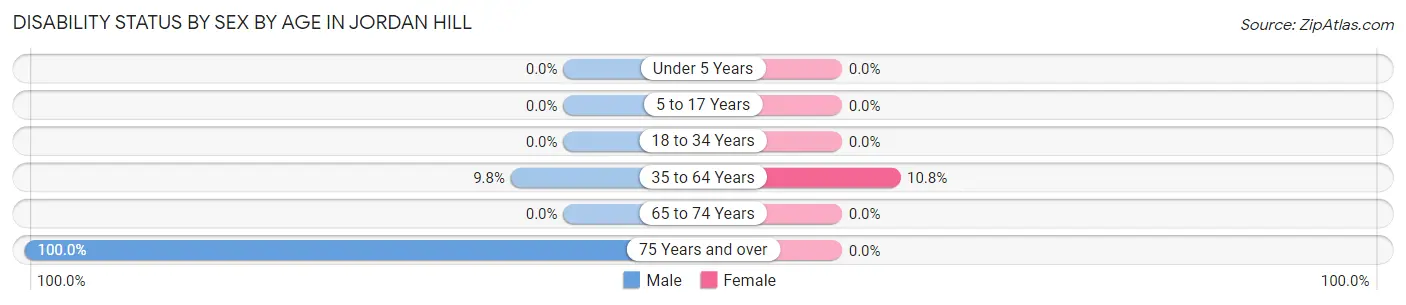
| Age Bracket | Male | Female |
| Under 5 Years | 0 (0.0%) | 0 (0.0%) |
| 5 to 17 Years | 0 (0.0%) | 0 (0.0%) |
| 18 to 34 Years | 0 (0.0%) | 0 (0.0%) |
| 35 to 64 Years | 4 (9.8%) | 4 (10.8%) |
| 65 to 74 Years | 0 (0.0%) | 0 (0.0%) |
| 75 Years and over | 9 (100.0%) | 0 (0.0%) |
Disability Class by Sex by Age in Jordan Hill
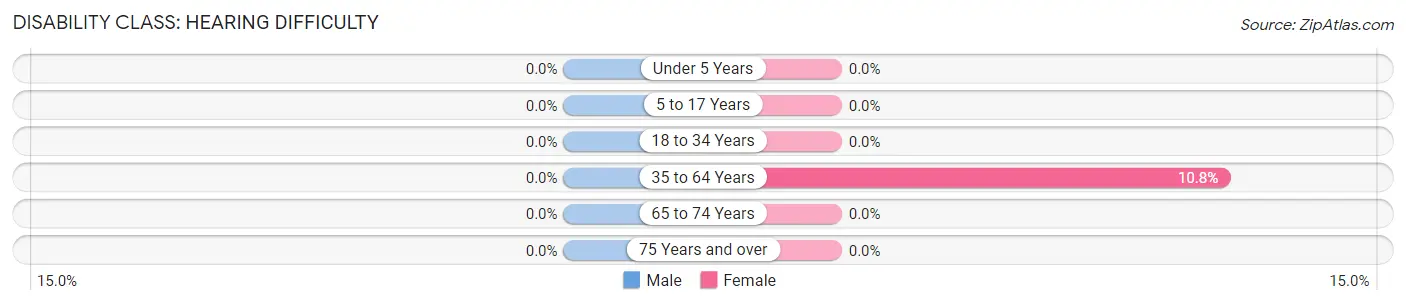
Disability Class: Hearing Difficulty
| Age Bracket | Male | Female |
| Under 5 Years | 0 (0.0%) | 0 (0.0%) |
| 5 to 17 Years | 0 (0.0%) | 0 (0.0%) |
| 18 to 34 Years | 0 (0.0%) | 0 (0.0%) |
| 35 to 64 Years | 0 (0.0%) | 4 (10.8%) |
| 65 to 74 Years | 0 (0.0%) | 0 (0.0%) |
| 75 Years and over | 0 (0.0%) | 0 (0.0%) |
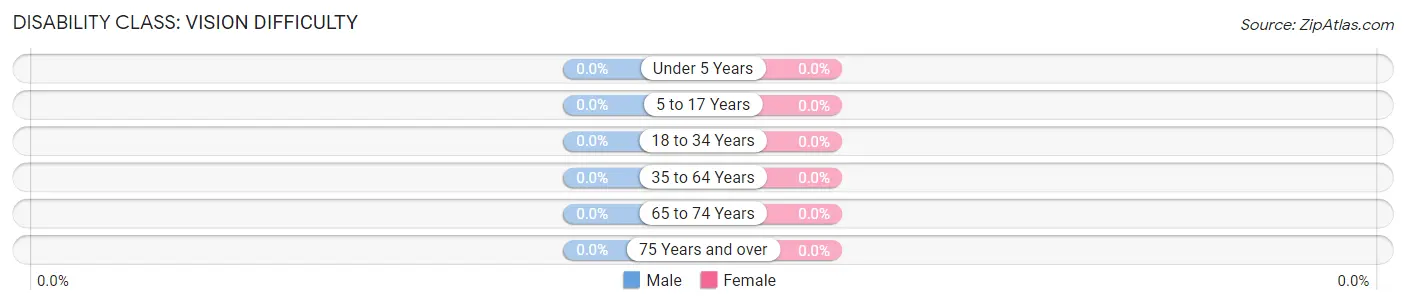
Disability Class: Vision Difficulty
| Age Bracket | Male | Female |
| Under 5 Years | 0 (0.0%) | 0 (0.0%) |
| 5 to 17 Years | 0 (0.0%) | 0 (0.0%) |
| 18 to 34 Years | 0 (0.0%) | 0 (0.0%) |
| 35 to 64 Years | 0 (0.0%) | 0 (0.0%) |
| 65 to 74 Years | 0 (0.0%) | 0 (0.0%) |
| 75 Years and over | 0 (0.0%) | 0 (0.0%) |
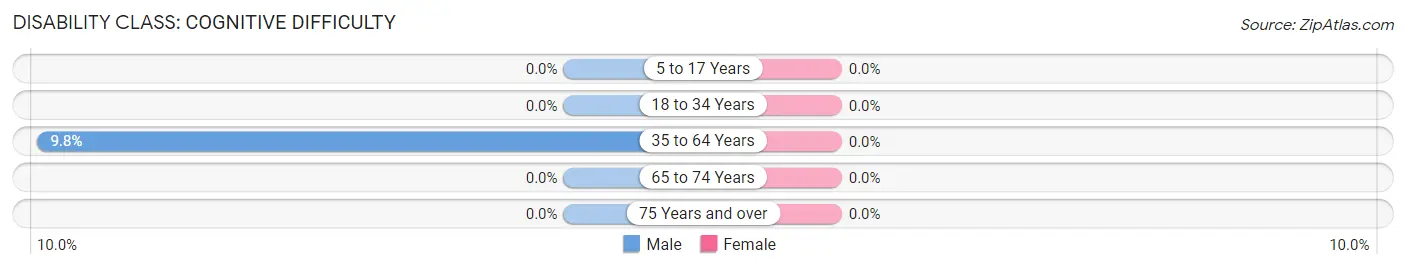
Disability Class: Cognitive Difficulty
| Age Bracket | Male | Female |
| 5 to 17 Years | 0 (0.0%) | 0 (0.0%) |
| 18 to 34 Years | 0 (0.0%) | 0 (0.0%) |
| 35 to 64 Years | 4 (9.8%) | 0 (0.0%) |
| 65 to 74 Years | 0 (0.0%) | 0 (0.0%) |
| 75 Years and over | 0 (0.0%) | 0 (0.0%) |
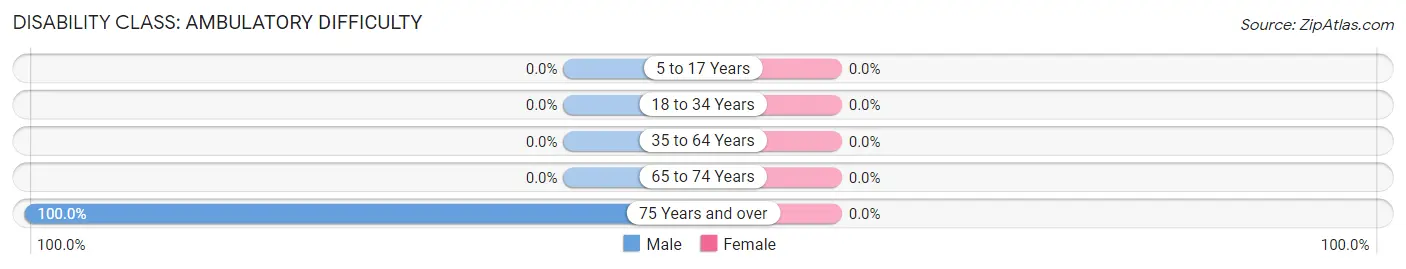
Disability Class: Ambulatory Difficulty
| Age Bracket | Male | Female |
| 5 to 17 Years | 0 (0.0%) | 0 (0.0%) |
| 18 to 34 Years | 0 (0.0%) | 0 (0.0%) |
| 35 to 64 Years | 0 (0.0%) | 0 (0.0%) |
| 65 to 74 Years | 0 (0.0%) | 0 (0.0%) |
| 75 Years and over | 9 (100.0%) | 0 (0.0%) |
Disability Class: Self-Care Difficulty
| Age Bracket | Male | Female |
| 5 to 17 Years | 0 (0.0%) | 0 (0.0%) |
| 18 to 34 Years | 0 (0.0%) | 0 (0.0%) |
| 35 to 64 Years | 0 (0.0%) | 0 (0.0%) |
| 65 to 74 Years | 0 (0.0%) | 0 (0.0%) |
| 75 Years and over | 0 (0.0%) | 0 (0.0%) |
Technology Access in Jordan Hill
Computing Device Access in Jordan Hill
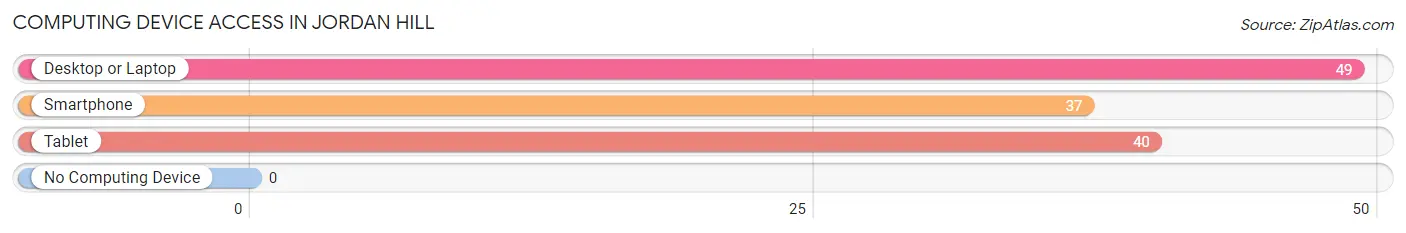
| Device Type | # Households | % Households |
| Desktop or Laptop | 49 | 84.5% |
| Smartphone | 37 | 63.8% |
| Tablet | 40 | 69.0% |
| No Computing Device | 0 | 0.0% |
| Total | 58 | 100.0% |
Internet Access in Jordan Hill
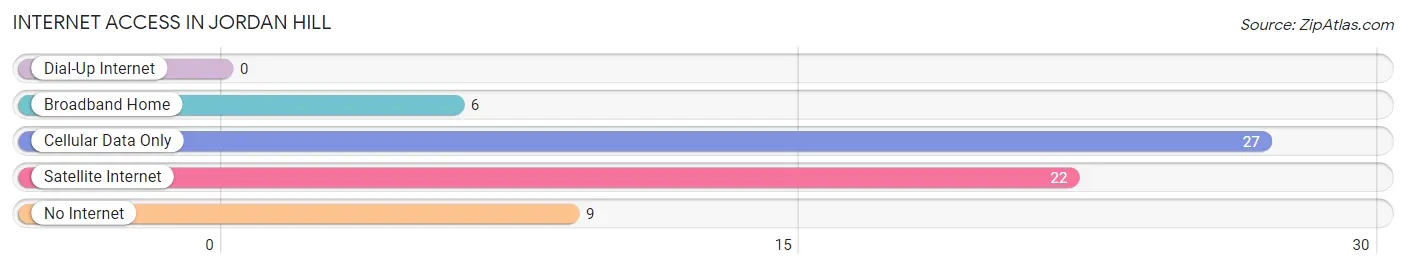
| Internet Type | # Households | % Households |
| Dial-Up Internet | 0 | 0.0% |
| Broadband Home | 6 | 10.3% |
| Cellular Data Only | 27 | 46.6% |
| Satellite Internet | 22 | 37.9% |
| No Internet | 9 | 15.5% |
| Total | 58 | 100.0% |
Jordan Hill Summary
LA History
Los Angeles, or LA, is the second-largest city in the United States and the largest city in California. It is located in the southern part of the state, along the Pacific Ocean. The city was founded in 1781 by Spanish settlers, and it has a long and rich history.
The area that is now Los Angeles was originally inhabited by the Tongva people, who were hunter-gatherers. The Spanish arrived in the area in 1769, and they established the first mission in the area in 1771. The mission was called San Gabriel Arcángel, and it was the first of 21 missions that were established in California.
In 1781, the Spanish founded the city of Los Angeles. The city was named after the Virgin Mary, and it was the first city in California. The city quickly grew, and by the mid-1800s, it was the largest city in California.
In 1848, the United States acquired California from Mexico, and Los Angeles became part of the United States. The city continued to grow, and by the early 1900s, it was the largest city in the state.
In the early 1900s, Los Angeles was a major center of the film industry. The city was home to many of the major film studios, and it was the birthplace of the Hollywood film industry.
In the 1950s and 1960s, Los Angeles experienced a period of rapid growth. The city was transformed from a small city to a major metropolis. The population of the city grew from 1 million in 1950 to 3 million in 1970.
Today, Los Angeles is a major global city. It is home to many major industries, including entertainment, technology, finance, and tourism. The city is also home to many world-famous attractions, including the Hollywood Walk of Fame, the Griffith Observatory, and the Santa Monica Pier.
Geography
Los Angeles is located in the southern part of California, along the Pacific Ocean. The city covers an area of 502 square miles, and it is the second-largest city in the United States.
The city is divided into four main regions: the San Fernando Valley, the San Gabriel Valley, the South Bay, and the Westside. The San Fernando Valley is located in the northern part of the city, and it is home to many of the city’s suburbs. The San Gabriel Valley is located in the eastern part of the city, and it is home to many of the city’s major attractions. The South Bay is located in the southern part of the city, and it is home to many of the city’s beaches. The Westside is located in the western part of the city, and it is home to many of the city’s affluent neighborhoods.
The city is surrounded by mountains on three sides. To the north is the Santa Monica Mountains, to the east is the San Gabriel Mountains, and to the south is the Santa Ana Mountains.
Economy
Los Angeles is a major global city, and it is home to many major industries. The city is a major center of the entertainment industry, and it is home to many of the major film studios. The city is also a major center of the technology industry, and it is home to many of the world’s leading technology companies.
The city is also a major center of finance, and it is home to many of the world’s leading financial institutions. The city is also a major center of tourism, and it is home to many of the world’s most popular tourist attractions.
The city’s economy is also supported by many other industries, including manufacturing, transportation, and education. The city is home to many of the world’s leading universities, and it is a major center of research and development.
Demographics
Los Angeles is the second-largest city in the United States, and it is home to a diverse population. The city has a population of 4 million people, and it is one of the most ethnically diverse cities in the world.
The city is home to many different ethnic groups, including Hispanics, African Americans, Asians, and whites. The city is also home to many immigrants, and it is one of the most popular destinations for immigrants in the United States.
The city is also home to many different religions, including Christianity, Judaism, Islam, and Buddhism. The city is also home to many different languages, including English, Spanish, Chinese, and Korean.
Conclusion
Los Angeles is the second-largest city in the United States, and it is one of the most diverse cities in the world. The city has a long and rich history, and it is home to many major industries, including entertainment, technology, finance, and tourism. The city is also home to many different ethnic groups, religions, and languages. Los Angeles is a major global city, and it is one of the most popular destinations for immigrants in the United States.
Common Questions
What is Per Capita Income in Jordan Hill?
Per Capita income in Jordan Hill is $49,819.
What is the Median Family Income in Jordan Hill?
Median Family Income in Jordan Hill is $193,287.
What is Income or Wage Gap in Jordan Hill?
Income or Wage Gap in Jordan Hill is 34.7%.
Women in Jordan Hill earn 65.3 cents for every dollar earned by a man.
What is Inequality or Gini Index in Jordan Hill?
Inequality or Gini Index in Jordan Hill is 0.38.
What is the Total Population of Jordan Hill?
Total Population of Jordan Hill is 180.
What is the Total Male Population of Jordan Hill?
Total Male Population of Jordan Hill is 131.
What is the Total Female Population of Jordan Hill?
Total Female Population of Jordan Hill is 49.
What is the Ratio of Males per 100 Females in Jordan Hill?
There are 267.35 Males per 100 Females in Jordan Hill.
What is the Ratio of Females per 100 Males in Jordan Hill?
There are 37.40 Females per 100 Males in Jordan Hill.
What is the Median Population Age in Jordan Hill?
Median Population Age in Jordan Hill is 50.3 Years.
What is the Average Family Size in Jordan Hill
Average Family Size in Jordan Hill is 4.3 People.
What is the Average Household Size in Jordan Hill
Average Household Size in Jordan Hill is 3.1 People.
How Large is the Labor Force in Jordan Hill?
There are 171 People in the Labor Forcein in Jordan Hill.
What is the Percentage of People in the Labor Force in Jordan Hill?
95.0% of People are in the Labor Force in Jordan Hill.