Zip Codes with the Highest Percentage of Population Employed in Food Preparation & Serving in New Orleans, LA
RELATED REPORTS & OPTIONS
Food Preparation & Serving
New Orleans
Compare Zip Codes
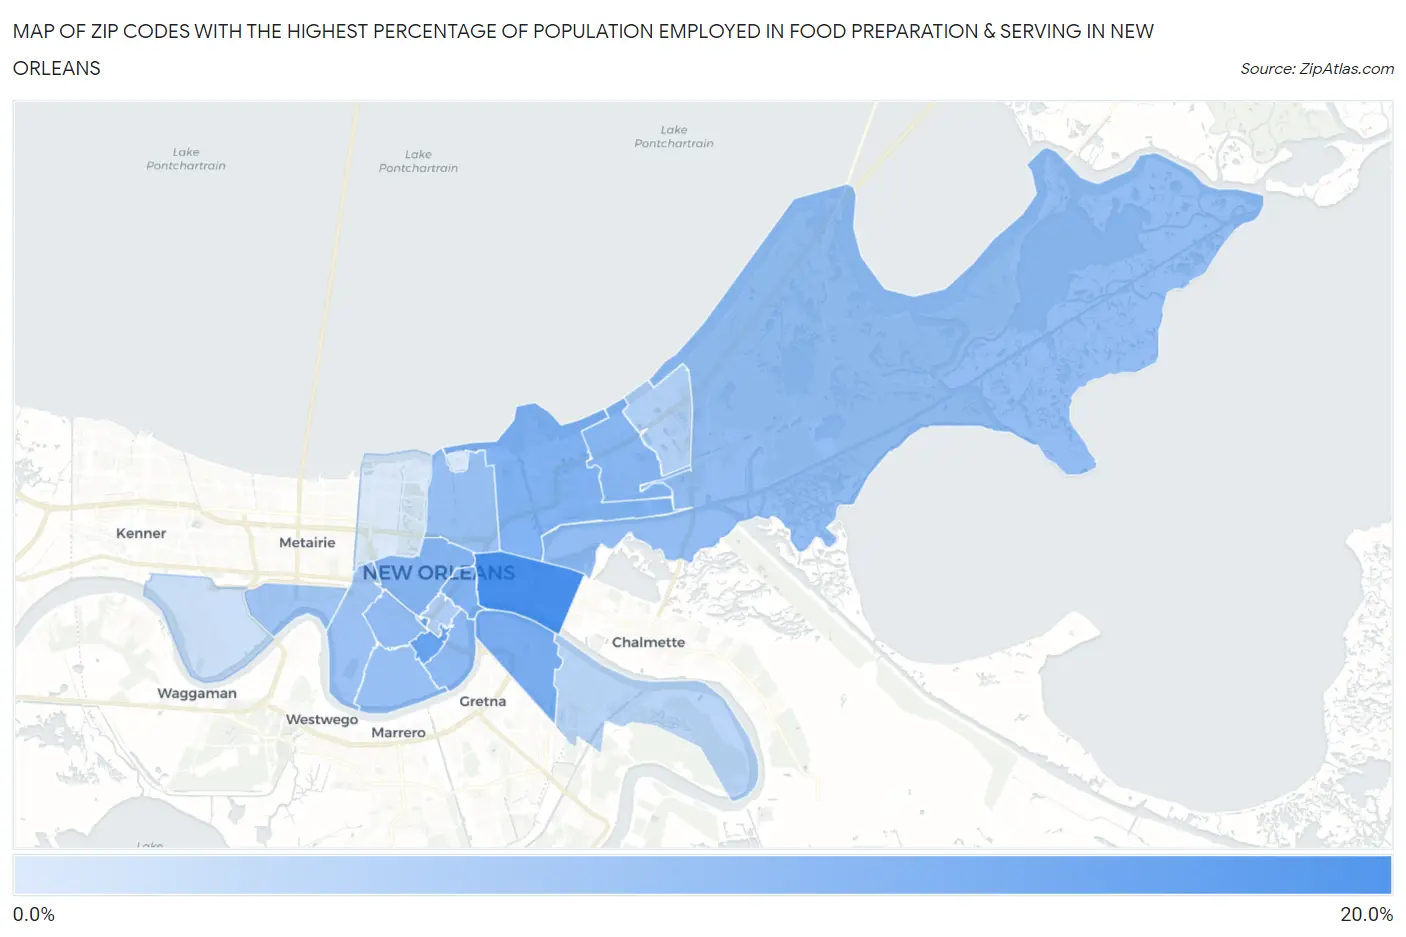
Map of Zip Codes with the Highest Percentage of Population Employed in Food Preparation & Serving in New Orleans
2.6%
15.6%
Zip Codes with the Highest Percentage of Population Employed in Food Preparation & Serving in New Orleans, LA
| Zip Code | % Employed | vs State | vs National | |
| 1. | 70117 | 15.6% | 6.0%(+9.52)#26 | 5.3%(+10.3)#908 |
| 2. | 70113 | 12.6% | 6.0%(+6.51)#43 | 5.3%(+7.27)#1,506 |
| 3. | 70114 | 10.9% | 6.0%(+4.85)#53 | 5.3%(+5.60)#2,107 |
| 4. | 70116 | 10.5% | 6.0%(+4.43)#57 | 5.3%(+5.18)#2,341 |
| 5. | 70126 | 10.3% | 6.0%(+4.27)#60 | 5.3%(+5.03)#2,418 |
| 6. | 70119 | 10.3% | 6.0%(+4.22)#61 | 5.3%(+4.97)#2,449 |
| 7. | 70127 | 9.8% | 6.0%(+3.75)#65 | 5.3%(+4.51)#2,803 |
| 8. | 70130 | 9.4% | 6.0%(+3.40)#71 | 5.3%(+4.16)#3,100 |
| 9. | 70125 | 9.0% | 6.0%(+2.99)#76 | 5.3%(+3.75)#3,494 |
| 10. | 70129 | 8.7% | 6.0%(+2.68)#81 | 5.3%(+3.44)#3,814 |
| 11. | 70115 | 8.4% | 6.0%(+2.32)#91 | 5.3%(+3.07)#4,227 |
| 12. | 70122 | 8.3% | 6.0%(+2.31)#92 | 5.3%(+3.06)#4,242 |
| 13. | 70118 | 8.0% | 6.0%(+1.94)#104 | 5.3%(+2.69)#4,757 |
| 14. | 70121 | 7.6% | 6.0%(+1.55)#110 | 5.3%(+2.31)#5,391 |
| 15. | 70112 | 6.3% | 6.0%(+0.283)#155 | 5.3%(+1.04)#8,355 |
| 16. | 70128 | 6.1% | 6.0%(+0.054)#165 | 5.3%(+0.809)#9,041 |
| 17. | 70131 | 5.5% | 6.0%(-0.567)#191 | 5.3%(+0.189)#11,140 |
| 18. | 70123 | 3.8% | 6.0%(-2.23)#285 | 5.3%(-1.48)#17,898 |
| 19. | 70148 | 2.7% | 6.0%(-3.31)#336 | 5.3%(-2.56)#22,338 |
| 20. | 70124 | 2.6% | 6.0%(-3.49)#354 | 5.3%(-2.73)#22,970 |
1
Common Questions
What are the Top 10 Zip Codes with the Highest Percentage of Population Employed in Food Preparation & Serving in New Orleans, LA?
Top 10 Zip Codes with the Highest Percentage of Population Employed in Food Preparation & Serving in New Orleans, LA are:
What zip code has the Highest Percentage of Population Employed in Food Preparation & Serving in New Orleans, LA?
70117 has the Highest Percentage of Population Employed in Food Preparation & Serving in New Orleans, LA with 15.6%.
What is the Percentage of Population Employed in Food Preparation & Serving in New Orleans, LA?
Percentage of Population Employed in Food Preparation & Serving in New Orleans is 8.9%.
What is the Percentage of Population Employed in Food Preparation & Serving in Louisiana?
Percentage of Population Employed in Food Preparation & Serving in Louisiana is 6.0%.
What is the Percentage of Population Employed in Food Preparation & Serving in the United States?
Percentage of Population Employed in Food Preparation & Serving in the United States is 5.3%.