Port Barre, LA Map & Demographics
Port Barre Map
Port Barre Overview
$17,306
PER CAPITA INCOME
$48,107
AVG FAMILY INCOME
$37,000
AVG HOUSEHOLD INCOME
44.4%
WAGE / INCOME GAP [ % ]
55.6¢/ $1
WAGE / INCOME GAP [ $ ]
0.44
INEQUALITY / GINI INDEX
2,181
TOTAL POPULATION
1,041
MALE POPULATION
1,140
FEMALE POPULATION
91.32
MALES / 100 FEMALES
109.51
FEMALES / 100 MALES
27.1
MEDIAN AGE
3.2
AVG FAMILY SIZE
2.7
AVG HOUSEHOLD SIZE
870
LABOR FORCE [ PEOPLE ]
51.8%
PERCENT IN LABOR FORCE
7.1%
UNEMPLOYMENT RATE
Port Barre Zip Codes
Port Barre Area Codes
Income in Port Barre
Income Overview in Port Barre
Per Capita Income in Port Barre is $17,306, while median incomes of families and households are $48,107 and $37,000 respectively.
| Characteristic | Number | Measure |
| Per Capita Income | 2,181 | $17,306 |
| Median Family Income | 593 | $48,107 |
| Mean Family Income | 593 | $53,026 |
| Median Household Income | 820 | $37,000 |
| Mean Household Income | 820 | $44,996 |
| Income Deficit | 593 | $0 |
| Wage / Income Gap (%) | 2,181 | 44.38% |
| Wage / Income Gap ($) | 2,181 | 55.62¢ per $1 |
| Gini / Inequality Index | 2,181 | 0.44 |
Earnings by Sex in Port Barre
Average Earnings in Port Barre are $25,600, $34,120 for men and $18,977 for women, a difference of 44.4%.
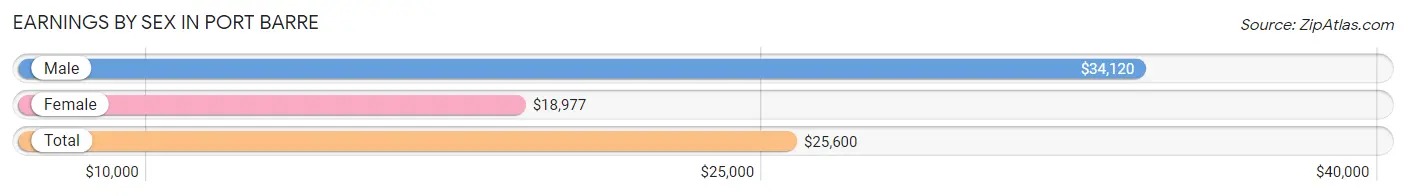
| Sex | Number | Average Earnings |
| Male | 446 (49.8%) | $34,120 |
| Female | 450 (50.2%) | $18,977 |
| Total | 896 (100.0%) | $25,600 |
Earnings by Sex by Income Bracket in Port Barre
The most common earnings brackets in Port Barre are $40,000 to $44,999 for men (87 | 19.5%) and $30,000 to $34,999 for women (56 | 12.4%).
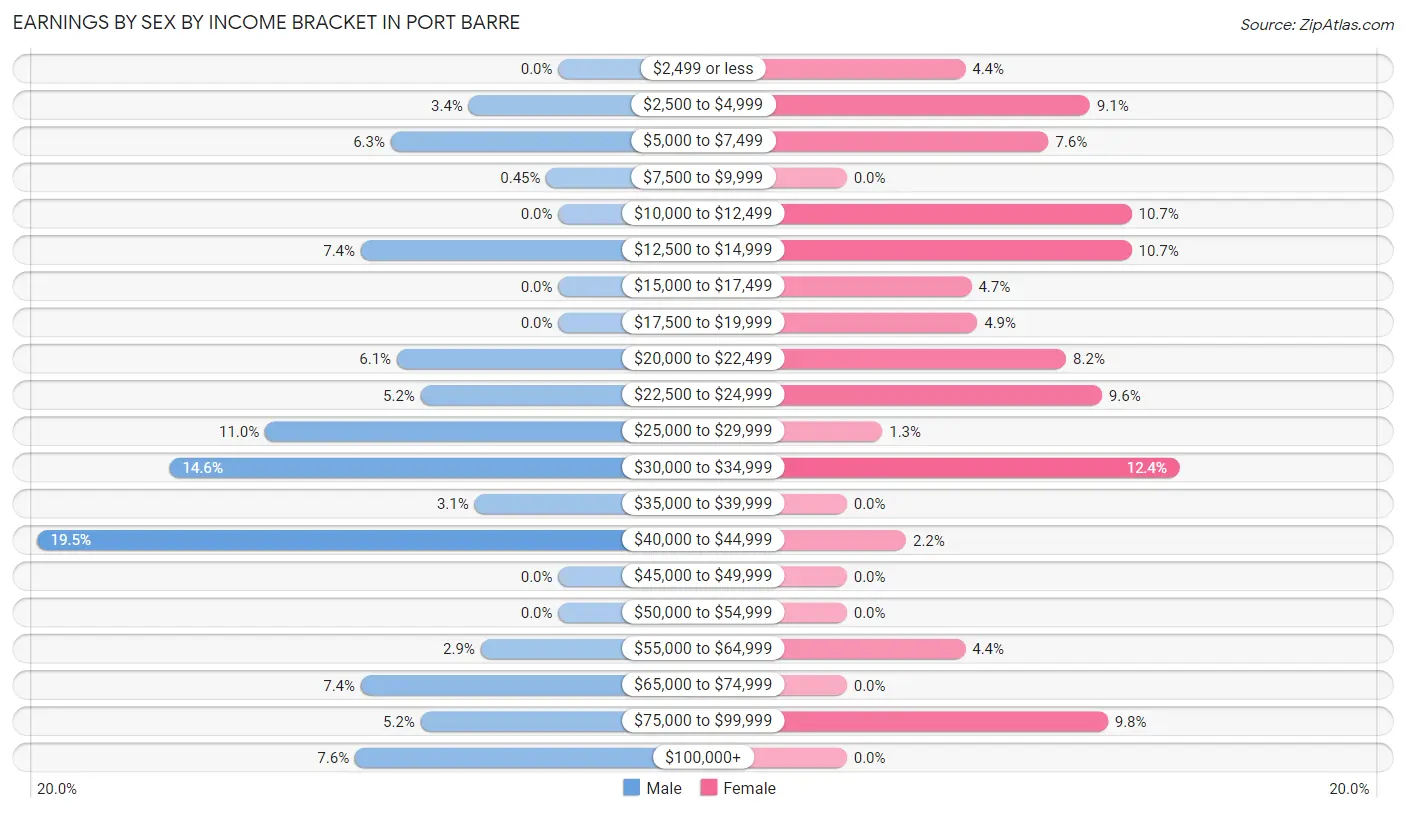
| Income | Male | Female |
| $2,499 or less | 0 (0.0%) | 20 (4.4%) |
| $2,500 to $4,999 | 15 (3.4%) | 41 (9.1%) |
| $5,000 to $7,499 | 28 (6.3%) | 34 (7.6%) |
| $7,500 to $9,999 | 2 (0.4%) | 0 (0.0%) |
| $10,000 to $12,499 | 0 (0.0%) | 48 (10.7%) |
| $12,500 to $14,999 | 33 (7.4%) | 48 (10.7%) |
| $15,000 to $17,499 | 0 (0.0%) | 21 (4.7%) |
| $17,500 to $19,999 | 0 (0.0%) | 22 (4.9%) |
| $20,000 to $22,499 | 27 (6.0%) | 37 (8.2%) |
| $22,500 to $24,999 | 23 (5.2%) | 43 (9.6%) |
| $25,000 to $29,999 | 49 (11.0%) | 6 (1.3%) |
| $30,000 to $34,999 | 65 (14.6%) | 56 (12.4%) |
| $35,000 to $39,999 | 14 (3.1%) | 0 (0.0%) |
| $40,000 to $44,999 | 87 (19.5%) | 10 (2.2%) |
| $45,000 to $49,999 | 0 (0.0%) | 0 (0.0%) |
| $50,000 to $54,999 | 0 (0.0%) | 0 (0.0%) |
| $55,000 to $64,999 | 13 (2.9%) | 20 (4.4%) |
| $65,000 to $74,999 | 33 (7.4%) | 0 (0.0%) |
| $75,000 to $99,999 | 23 (5.2%) | 44 (9.8%) |
| $100,000+ | 34 (7.6%) | 0 (0.0%) |
| Total | 446 (100.0%) | 450 (100.0%) |
Earnings by Sex by Educational Attainment in Port Barre
Average earnings in Port Barre are $40,240 for men and $22,791 for women, a difference of 43.4%. Men with an educational attainment of high school diploma enjoy the highest average annual earnings of $40,822, while those with high school diploma education earn the least with $40,822. Women with an educational attainment of less than high school earn the most with the average annual earnings of $23,833, while those with high school diploma education have the smallest earnings of $21,689.
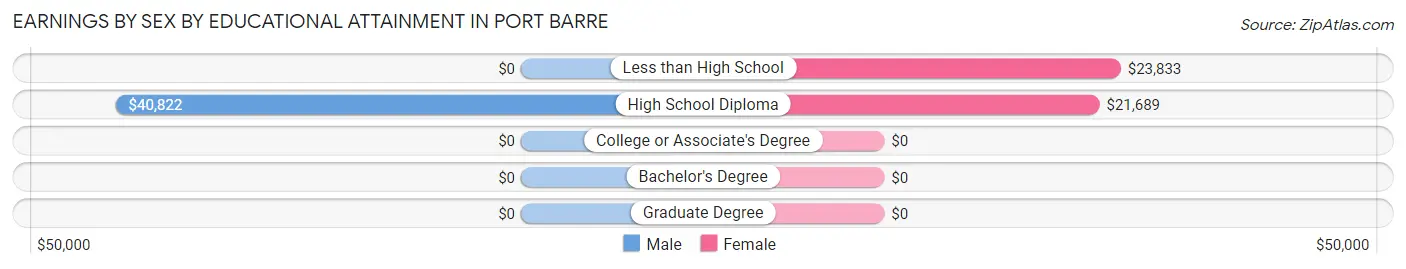
| Educational Attainment | Male Income | Female Income |
| Less than High School | - | - |
| High School Diploma | $40,822 | $21,689 |
| College or Associate's Degree | - | - |
| Bachelor's Degree | - | - |
| Graduate Degree | - | - |
| Total | $40,240 | $22,791 |
Family Income in Port Barre
Family Income Brackets in Port Barre
According to the Port Barre family income data, there are 152 families falling into the $50,000 to $74,999 income range, which is the most common income bracket and makes up 25.6% of all families.
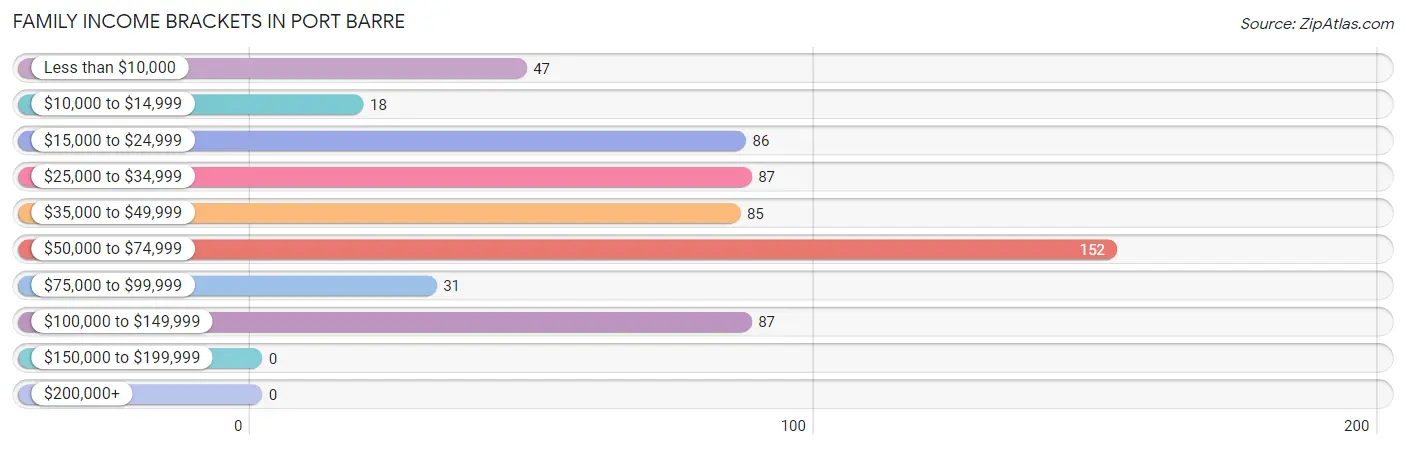
| Income Bracket | # Families | % Families |
| Less than $10,000 | 47 | 7.9% |
| $10,000 to $14,999 | 18 | 3.0% |
| $15,000 to $24,999 | 86 | 14.5% |
| $25,000 to $34,999 | 87 | 14.7% |
| $35,000 to $49,999 | 85 | 14.3% |
| $50,000 to $74,999 | 152 | 25.6% |
| $75,000 to $99,999 | 31 | 5.2% |
| $100,000 to $149,999 | 87 | 14.7% |
| $150,000 to $199,999 | 0 | 0.0% |
| $200,000+ | 0 | 0.0% |
Family Income by Famaliy Size in Port Barre
5-person families (101 | 17.0%) account for the highest median family income in Port Barre with $68,271 per family, while 3-person families (161 | 27.2%) have the highest median income of $16,557 per family member.
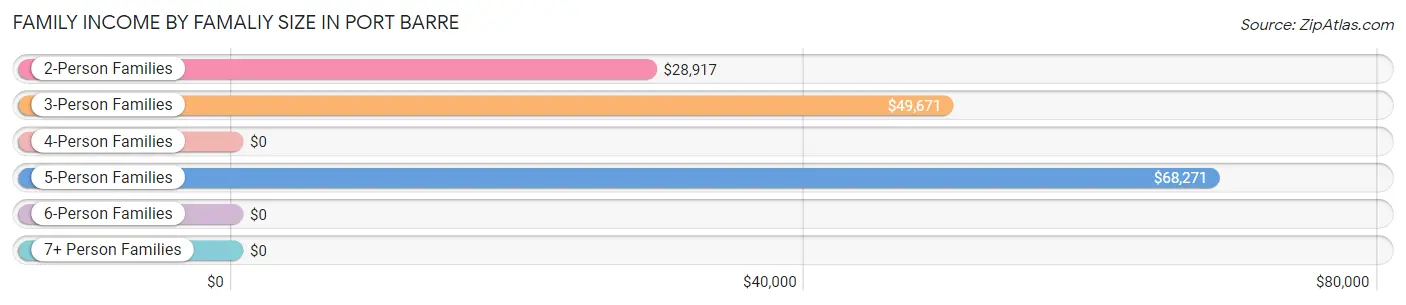
| Income Bracket | # Families | Median Income |
| 2-Person Families | 262 (44.2%) | $28,917 |
| 3-Person Families | 161 (27.2%) | $49,671 |
| 4-Person Families | 65 (11.0%) | $0 |
| 5-Person Families | 101 (17.0%) | $68,271 |
| 6-Person Families | 4 (0.7%) | $0 |
| 7+ Person Families | 0 (0.0%) | $0 |
| Total | 593 (100.0%) | $48,107 |
Family Income by Number of Earners in Port Barre
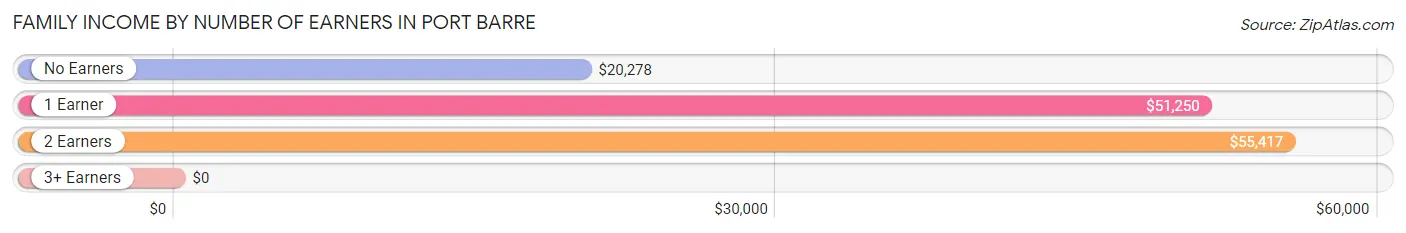
| Number of Earners | # Families | Median Income |
| No Earners | 88 (14.8%) | $20,278 |
| 1 Earner | 324 (54.6%) | $51,250 |
| 2 Earners | 119 (20.1%) | $55,417 |
| 3+ Earners | 62 (10.5%) | $0 |
| Total | 593 (100.0%) | $48,107 |
Household Income in Port Barre
Household Income Brackets in Port Barre
With 152 households falling in the category, the $50,000 to $74,999 income range is the most frequent in Port Barre, accounting for 18.5% of all households.
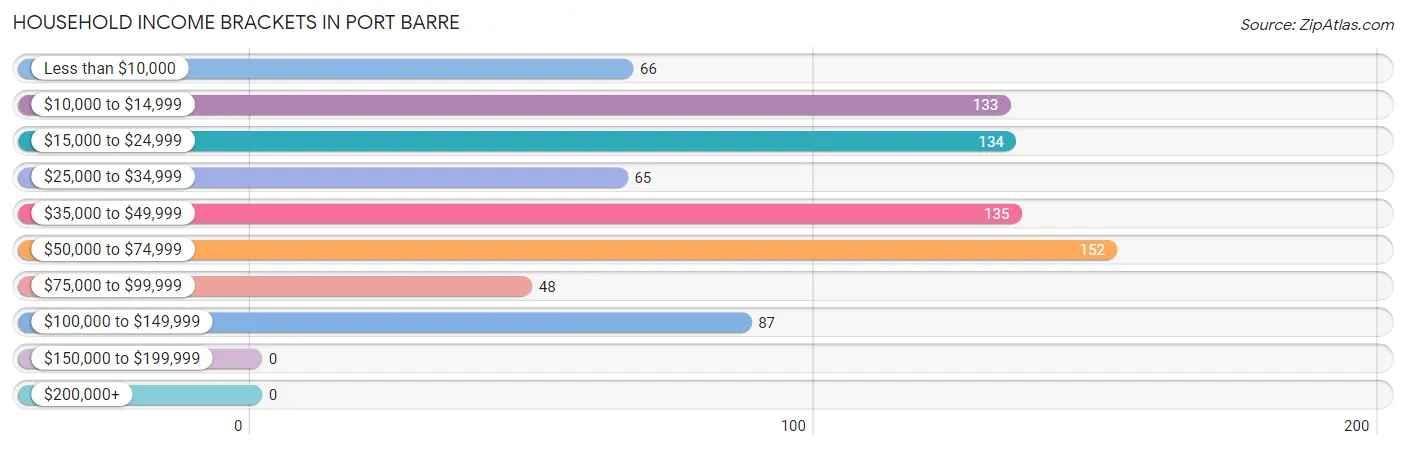
| Income Bracket | # Households | % Households |
| Less than $10,000 | 66 | 8.0% |
| $10,000 to $14,999 | 133 | 16.2% |
| $15,000 to $24,999 | 134 | 16.3% |
| $25,000 to $34,999 | 65 | 7.9% |
| $35,000 to $49,999 | 135 | 16.5% |
| $50,000 to $74,999 | 152 | 18.5% |
| $75,000 to $99,999 | 48 | 5.9% |
| $100,000 to $149,999 | 87 | 10.6% |
| $150,000 to $199,999 | 0 | 0.0% |
| $200,000+ | 0 | 0.0% |
Household Income by Householder Age in Port Barre
The median household income in Port Barre is $37,000, with the highest median household income of $49,750 found in the 25 to 44 years age bracket for the primary householder. A total of 287 households (35.0%) fall into this category. Meanwhile, the 65+ years age bracket for the primary householder has the lowest median household income of $0, with 132 households (16.1%) in this group.
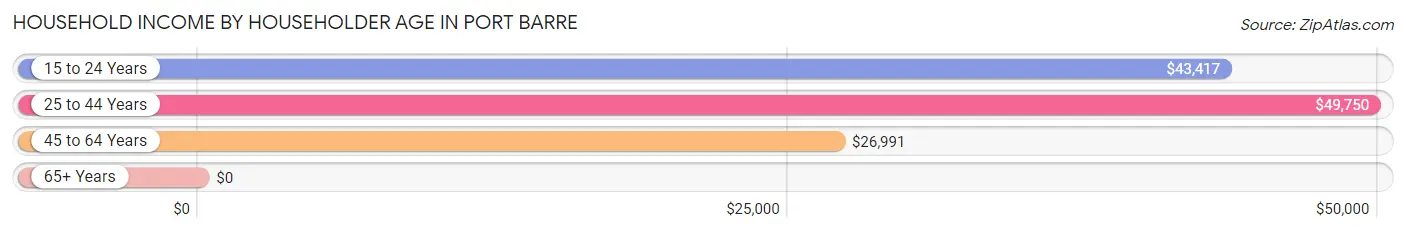
| Income Bracket | # Households | Median Income |
| 15 to 24 Years | 92 (11.2%) | $43,417 |
| 25 to 44 Years | 287 (35.0%) | $49,750 |
| 45 to 64 Years | 309 (37.7%) | $26,991 |
| 65+ Years | 132 (16.1%) | $0 |
| Total | 820 (100.0%) | $37,000 |
Poverty in Port Barre
Income Below Poverty by Sex and Age in Port Barre
With 18.2% poverty level for males and 28.9% for females among the residents of Port Barre, 5 year old males and under 5 year old females are the most vulnerable to poverty, with 34 males (100.0%) and 28 females (62.2%) in their respective age groups living below the poverty level.
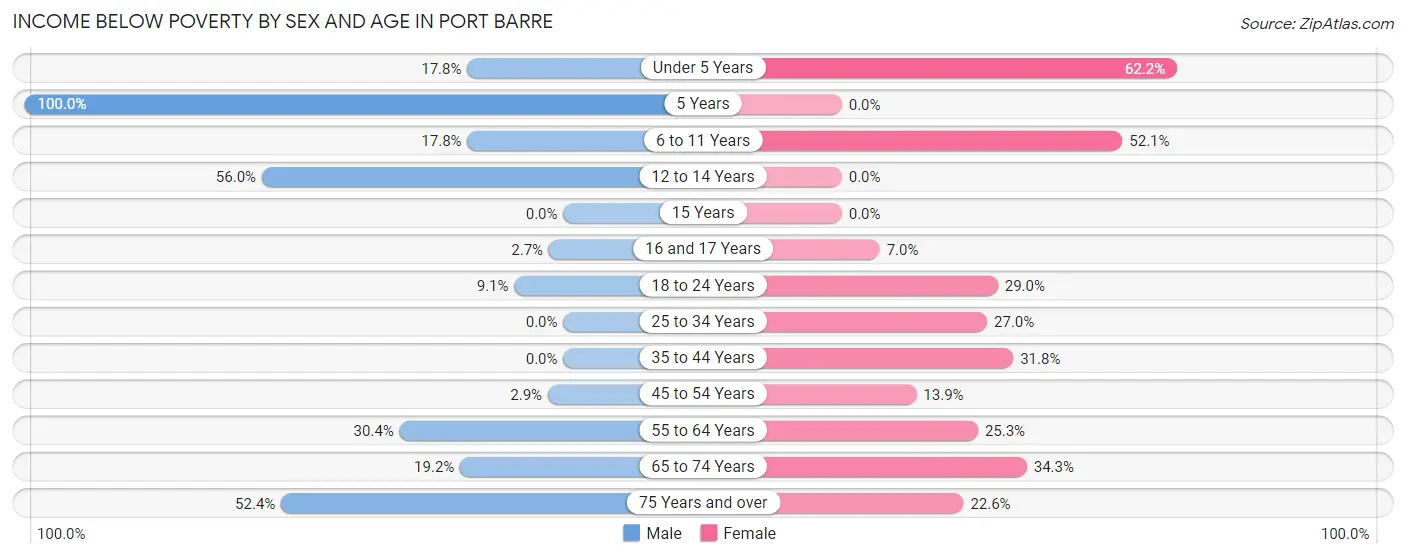
| Age Bracket | Male | Female |
| Under 5 Years | 23 (17.8%) | 28 (62.2%) |
| 5 Years | 34 (100.0%) | 0 (0.0%) |
| 6 to 11 Years | 13 (17.8%) | 50 (52.1%) |
| 12 to 14 Years | 47 (55.9%) | 0 (0.0%) |
| 15 Years | 0 (0.0%) | 0 (0.0%) |
| 16 and 17 Years | 3 (2.7%) | 5 (7.0%) |
| 18 to 24 Years | 14 (9.1%) | 53 (29.0%) |
| 25 to 34 Years | 0 (0.0%) | 41 (27.0%) |
| 35 to 44 Years | 0 (0.0%) | 56 (31.8%) |
| 45 to 54 Years | 3 (2.9%) | 9 (13.9%) |
| 55 to 64 Years | 24 (30.4%) | 46 (25.3%) |
| 65 to 74 Years | 18 (19.2%) | 34 (34.3%) |
| 75 Years and over | 11 (52.4%) | 7 (22.6%) |
| Total | 190 (18.2%) | 329 (28.9%) |
Income Above Poverty by Sex and Age in Port Barre
According to the poverty statistics in Port Barre, males aged 25 to 34 years and females aged 5 years are the age groups that are most secure financially, with 100.0% of males and 100.0% of females in these age groups living above the poverty line.
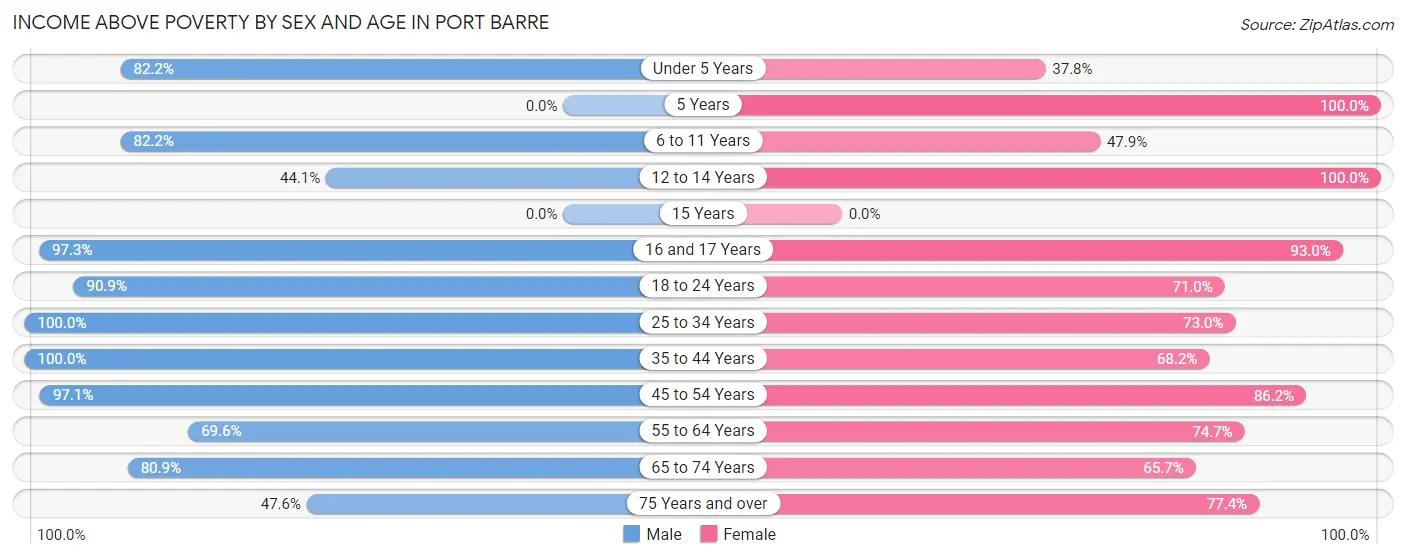
| Age Bracket | Male | Female |
| Under 5 Years | 106 (82.2%) | 17 (37.8%) |
| 5 Years | 0 (0.0%) | 8 (100.0%) |
| 6 to 11 Years | 60 (82.2%) | 46 (47.9%) |
| 12 to 14 Years | 37 (44.1%) | 32 (100.0%) |
| 15 Years | 0 (0.0%) | 0 (0.0%) |
| 16 and 17 Years | 109 (97.3%) | 66 (93.0%) |
| 18 to 24 Years | 140 (90.9%) | 130 (71.0%) |
| 25 to 34 Years | 111 (100.0%) | 111 (73.0%) |
| 35 to 44 Years | 45 (100.0%) | 120 (68.2%) |
| 45 to 54 Years | 102 (97.1%) | 56 (86.2%) |
| 55 to 64 Years | 55 (69.6%) | 136 (74.7%) |
| 65 to 74 Years | 76 (80.8%) | 65 (65.7%) |
| 75 Years and over | 10 (47.6%) | 24 (77.4%) |
| Total | 851 (81.8%) | 811 (71.1%) |
Income Below Poverty Among Married-Couple Families in Port Barre
The poverty statistics for married-couple families in Port Barre show that 8.7% or 16 of the total 183 families live below the poverty line. Families with 3 or 4 children have the highest poverty rate of 100.0%, comprising of 4 families. On the other hand, families with 1 or 2 children have the lowest poverty rate of 0.0%, which includes 0 families.
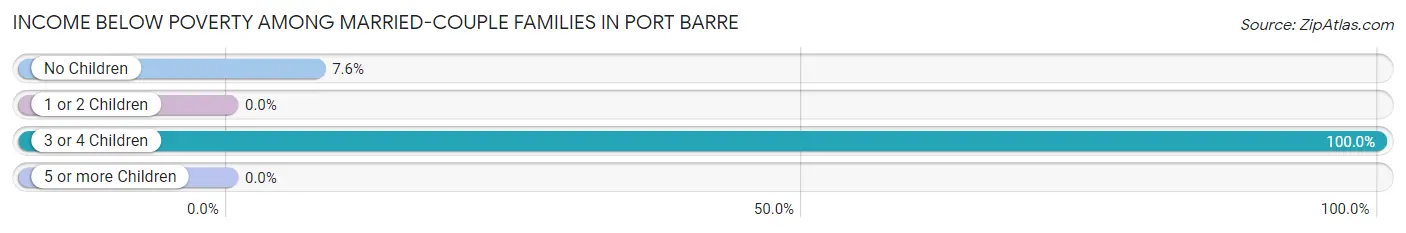
| Children | Above Poverty | Below Poverty |
| No Children | 146 (92.4%) | 12 (7.6%) |
| 1 or 2 Children | 21 (100.0%) | 0 (0.0%) |
| 3 or 4 Children | 0 (0.0%) | 4 (100.0%) |
| 5 or more Children | 0 (0.0%) | 0 (0.0%) |
| Total | 167 (91.3%) | 16 (8.7%) |
Income Below Poverty Among Single-Parent Households in Port Barre
According to the poverty data in Port Barre, 10.1% or 17 single-father households and 35.7% or 86 single-mother households are living below the poverty line. Among single-father households, those with 3 or 4 children have the highest poverty rate, with 17 households (18.1%) experiencing poverty. Likewise, among single-mother households, those with 3 or 4 children have the highest poverty rate, with 18 households (47.4%) falling below the poverty line.
| Children | Single Father | Single Mother |
| No Children | 0 (0.0%) | 8 (16.3%) |
| 1 or 2 Children | 0 (0.0%) | 60 (39.0%) |
| 3 or 4 Children | 17 (18.1%) | 18 (47.4%) |
| 5 or more Children | 0 (0.0%) | 0 (0.0%) |
| Total | 17 (10.1%) | 86 (35.7%) |
Income Below Poverty Among Married-Couple vs Single-Parent Households in Port Barre
The poverty data for Port Barre shows that 16 of the married-couple family households (8.7%) and 103 of the single-parent households (25.1%) are living below the poverty level. Within the married-couple family households, those with 3 or 4 children have the highest poverty rate, with 4 households (100.0%) falling below the poverty line. Among the single-parent households, those with 1 or 2 children have the highest poverty rate, with 60 household (31.1%) living below poverty.
| Children | Married-Couple Families | Single-Parent Households |
| No Children | 12 (7.6%) | 8 (9.4%) |
| 1 or 2 Children | 0 (0.0%) | 60 (31.1%) |
| 3 or 4 Children | 4 (100.0%) | 35 (26.5%) |
| 5 or more Children | 0 (0.0%) | 0 (0.0%) |
| Total | 16 (8.7%) | 103 (25.1%) |
Race in Port Barre
The most populous races in Port Barre are Black / African American (1,009 | 46.3%), White / Caucasian (914 | 41.9%), and Two or more Races (234 | 10.7%).
| Race | # Population | % Population |
| Asian | 24 | 1.1% |
| Black / African American | 1,009 | 46.3% |
| Hawaiian / Pacific | 0 | 0.0% |
| Hispanic or Latino | 118 | 5.4% |
| Native / Alaskan | 0 | 0.0% |
| White / Caucasian | 914 | 41.9% |
| Two or more Races | 234 | 10.7% |
| Some other Race | 0 | 0.0% |
| Total | 2,181 | 100.0% |
Ancestry in Port Barre
The most populous ancestries reported in Port Barre are French Canadian (408 | 18.7%), French (152 | 7.0%), Spanish American (118 | 5.4%), American (54 | 2.5%), and European (35 | 1.6%), together accounting for 35.2% of all Port Barre residents.
| Ancestry | # Population | % Population |
| American | 54 | 2.5% |
| Bhutanese | 24 | 1.1% |
| Cajun | 12 | 0.5% |
| English | 29 | 1.3% |
| European | 35 | 1.6% |
| French | 152 | 7.0% |
| French Canadian | 408 | 18.7% |
| Irish | 6 | 0.3% |
| Spanish American | 118 | 5.4% |
| Swedish | 2 | 0.1% | View All 10 Rows |
Immigrants in Port Barre

| Immigration Origin | # Population | % Population | View All 0 Rows |
Sex and Age in Port Barre
Sex and Age in Port Barre
The most populous age groups in Port Barre are 15 to 19 Years (144 | 13.8%) for men and 20 to 24 Years (183 | 16.1%) for women.
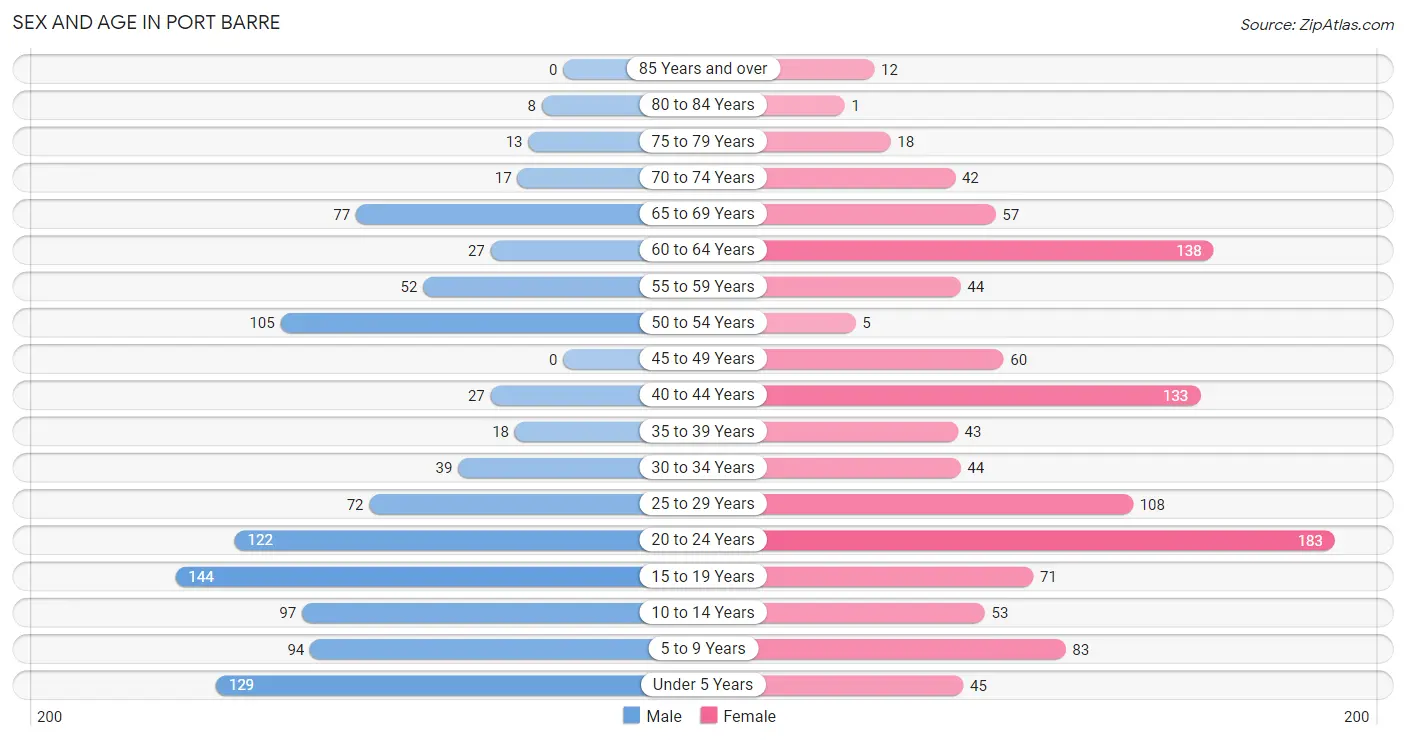
| Age Bracket | Male | Female |
| Under 5 Years | 129 (12.4%) | 45 (4.0%) |
| 5 to 9 Years | 94 (9.0%) | 83 (7.3%) |
| 10 to 14 Years | 97 (9.3%) | 53 (4.6%) |
| 15 to 19 Years | 144 (13.8%) | 71 (6.2%) |
| 20 to 24 Years | 122 (11.7%) | 183 (16.1%) |
| 25 to 29 Years | 72 (6.9%) | 108 (9.5%) |
| 30 to 34 Years | 39 (3.7%) | 44 (3.9%) |
| 35 to 39 Years | 18 (1.7%) | 43 (3.8%) |
| 40 to 44 Years | 27 (2.6%) | 133 (11.7%) |
| 45 to 49 Years | 0 (0.0%) | 60 (5.3%) |
| 50 to 54 Years | 105 (10.1%) | 5 (0.4%) |
| 55 to 59 Years | 52 (5.0%) | 44 (3.9%) |
| 60 to 64 Years | 27 (2.6%) | 138 (12.1%) |
| 65 to 69 Years | 77 (7.4%) | 57 (5.0%) |
| 70 to 74 Years | 17 (1.6%) | 42 (3.7%) |
| 75 to 79 Years | 13 (1.3%) | 18 (1.6%) |
| 80 to 84 Years | 8 (0.8%) | 1 (0.1%) |
| 85 Years and over | 0 (0.0%) | 12 (1.1%) |
| Total | 1,041 (100.0%) | 1,140 (100.0%) |
Families and Households in Port Barre
Median Family Size in Port Barre
The median family size in Port Barre is 3.21 persons per family, with single male/father families (169 | 28.5%) accounting for the largest median family size of 4.07 persons per family. On the other hand, single female/mother families (241 | 40.6%) represent the smallest median family size with 2.79 persons per family.
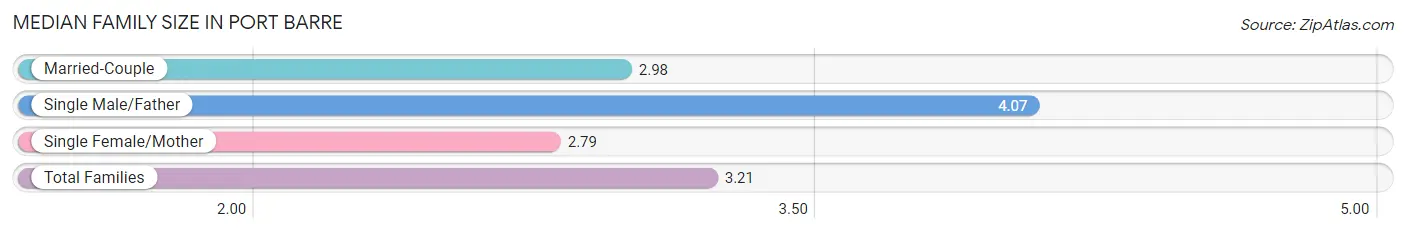
| Family Type | # Families | Family Size |
| Married-Couple | 183 (30.9%) | 2.98 |
| Single Male/Father | 169 (28.5%) | 4.07 |
| Single Female/Mother | 241 (40.6%) | 2.79 |
| Total Families | 593 (100.0%) | 3.21 |
Median Household Size in Port Barre
The median household size in Port Barre is 2.66 persons per household, with single male/father households (169 | 20.6%) accounting for the largest median household size of 4.2 persons per household. non-family households (227 | 27.7%) represent the smallest median household size with 1.03 persons per household.
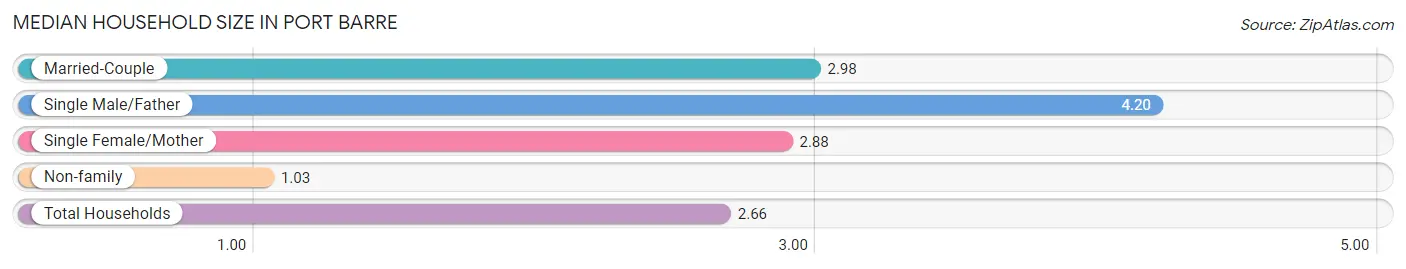
| Household Type | # Households | Household Size |
| Married-Couple | 183 (22.3%) | 2.98 |
| Single Male/Father | 169 (20.6%) | 4.20 |
| Single Female/Mother | 241 (29.4%) | 2.88 |
| Non-family | 227 (27.7%) | 1.03 |
| Total Households | 820 (100.0%) | 2.66 |
Household Size by Marriage Status in Port Barre
Out of a total of 820 households in Port Barre, 593 (72.3%) are family households, while 227 (27.7%) are nonfamily households. The most numerous type of family households are 2-person households, comprising 232, and the most common type of nonfamily households are 1-person households, comprising 221.
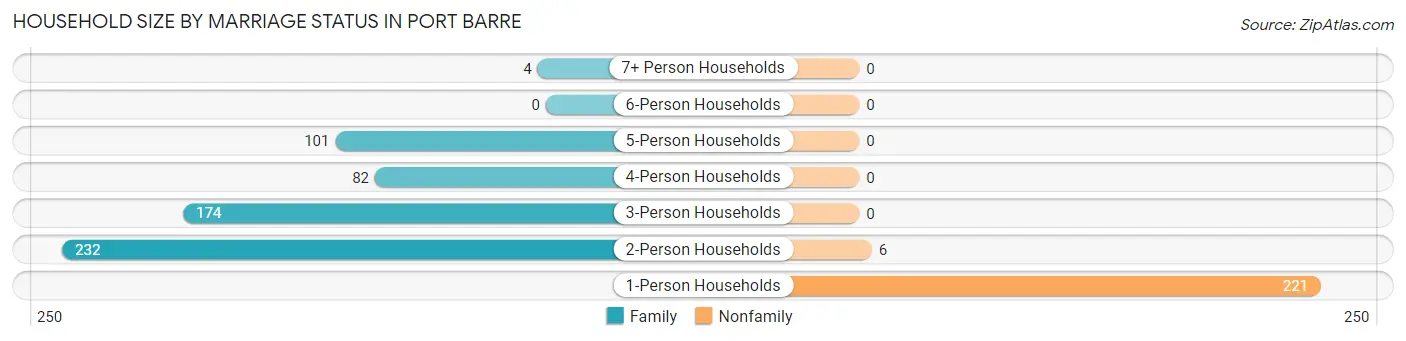
| Household Size | Family Households | Nonfamily Households |
| 1-Person Households | - | 221 (27.0%) |
| 2-Person Households | 232 (28.3%) | 6 (0.7%) |
| 3-Person Households | 174 (21.2%) | 0 (0.0%) |
| 4-Person Households | 82 (10.0%) | 0 (0.0%) |
| 5-Person Households | 101 (12.3%) | 0 (0.0%) |
| 6-Person Households | 0 (0.0%) | 0 (0.0%) |
| 7+ Person Households | 4 (0.5%) | 0 (0.0%) |
| Total | 593 (72.3%) | 227 (27.7%) |
Female Fertility in Port Barre
Fertility by Age in Port Barre
Average fertility rate in Port Barre is 33.0 births per 1,000 women. Women in the age bracket of 20 to 34 years have the highest fertility rate with 63.0 births per 1,000 women. Women in the age bracket of 20 to 34 years acount for 100.0% of all women with births.
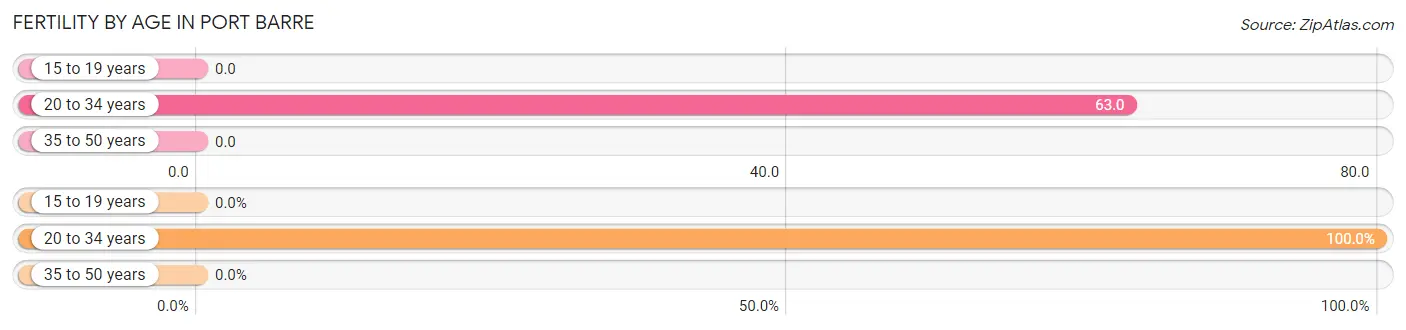
| Age Bracket | Women with Births | Births / 1,000 Women |
| 15 to 19 years | 0 (0.0%) | 0.0 |
| 20 to 34 years | 21 (100.0%) | 63.0 |
| 35 to 50 years | 0 (0.0%) | 0.0 |
| Total | 21 (100.0%) | 33.0 |
Fertility by Age by Marriage Status in Port Barre
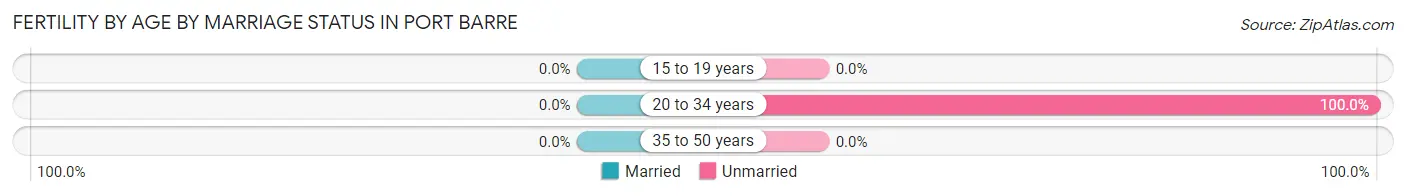
| Age Bracket | Married | Unmarried |
| 15 to 19 years | 0 (0.0%) | 0 (0.0%) |
| 20 to 34 years | 0 (0.0%) | 21 (100.0%) |
| 35 to 50 years | 0 (0.0%) | 0 (0.0%) |
| Total | 0 (0.0%) | 21 (100.0%) |
Fertility by Education in Port Barre
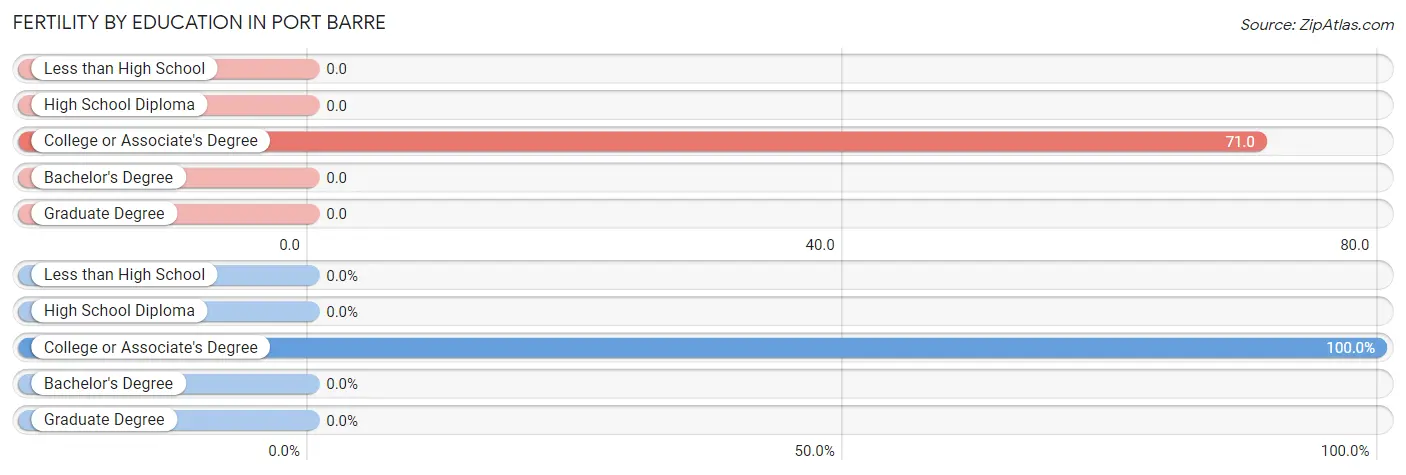
| Educational Attainment | Women with Births | Births / 1,000 Women |
| Less than High School | 0 (0.0%) | 0.0 |
| High School Diploma | 0 (0.0%) | 0.0 |
| College or Associate's Degree | 21 (100.0%) | 71.0 |
| Bachelor's Degree | 0 (0.0%) | 0.0 |
| Graduate Degree | 0 (0.0%) | 0.0 |
| Total | 21 (100.0%) | 33.0 |
Fertility by Education by Marriage Status in Port Barre
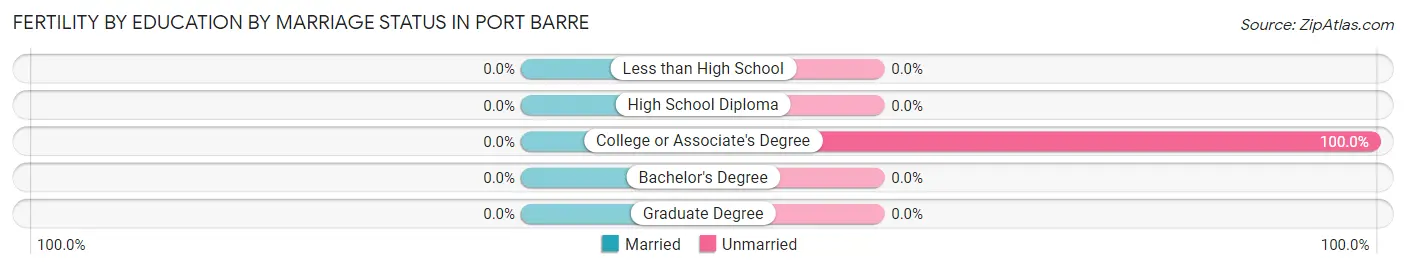
| Educational Attainment | Married | Unmarried |
| Less than High School | 0 (0.0%) | 0 (0.0%) |
| High School Diploma | 0 (0.0%) | 0 (0.0%) |
| College or Associate's Degree | 0 (0.0%) | 21 (100.0%) |
| Bachelor's Degree | 0 (0.0%) | 0 (0.0%) |
| Graduate Degree | 0 (0.0%) | 0 (0.0%) |
| Total | 0 (0.0%) | 21 (100.0%) |
Employment Characteristics in Port Barre
Employment by Class of Employer in Port Barre
Among the 768 employed individuals in Port Barre, private company employees (606 | 78.9%), self-employed (not incorporated) (41 | 5.3%), and not-for-profit organizations (36 | 4.7%) make up the most common classes of employment.
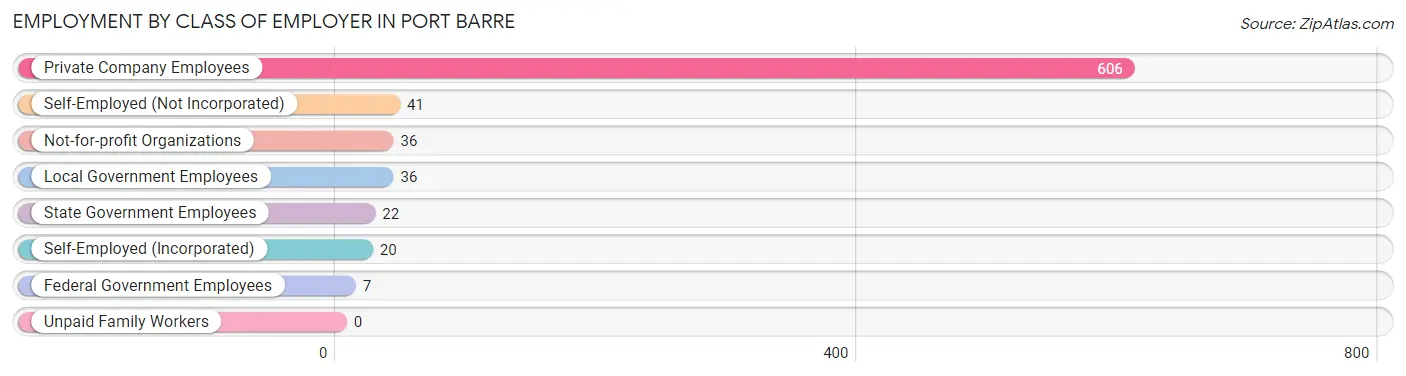
| Employer Class | # Employees | % Employees |
| Private Company Employees | 606 | 78.9% |
| Self-Employed (Incorporated) | 20 | 2.6% |
| Self-Employed (Not Incorporated) | 41 | 5.3% |
| Not-for-profit Organizations | 36 | 4.7% |
| Local Government Employees | 36 | 4.7% |
| State Government Employees | 22 | 2.9% |
| Federal Government Employees | 7 | 0.9% |
| Unpaid Family Workers | 0 | 0.0% |
| Total | 768 | 100.0% |
Employment Status by Age in Port Barre
According to the labor force statistics for Port Barre, out of the total population over 16 years of age (1,680), 51.8% or 870 individuals are in the labor force, with 7.1% or 62 of them unemployed. The age group with the highest labor force participation rate is 30 to 34 years, with 100.0% or 83 individuals in the labor force. Within the labor force, the 45 to 54 years age range has the highest percentage of unemployed individuals, with 17.1% or 25 of them being unemployed.
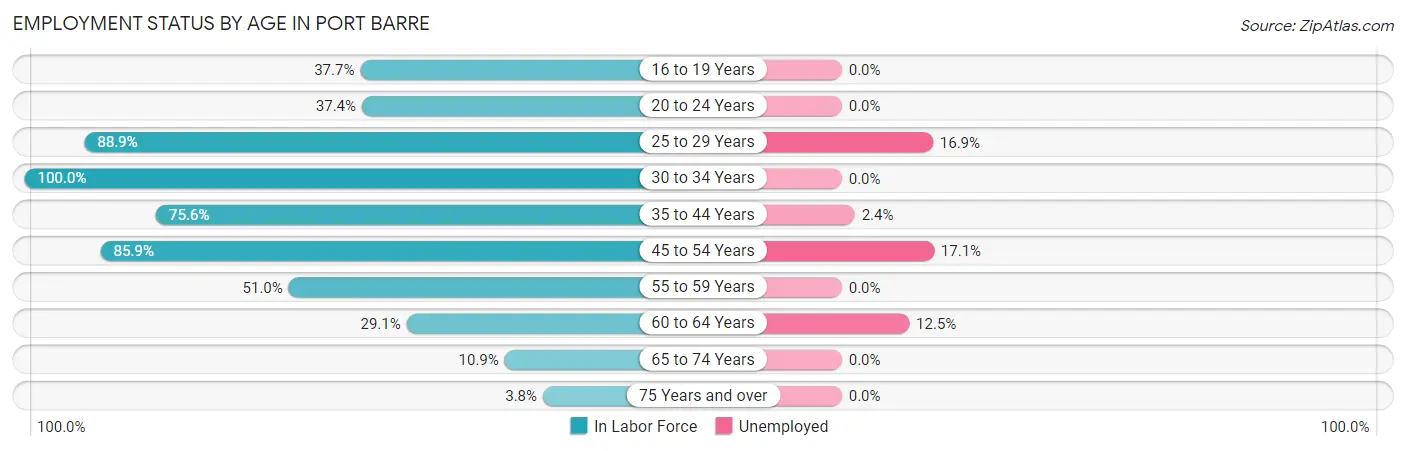
| Age Bracket | In Labor Force | Unemployed |
| 16 to 19 Years | 81 (37.7%) | 0 (0.0%) |
| 20 to 24 Years | 114 (37.4%) | 0 (0.0%) |
| 25 to 29 Years | 160 (88.9%) | 27 (16.9%) |
| 30 to 34 Years | 83 (100.0%) | 0 (0.0%) |
| 35 to 44 Years | 167 (75.6%) | 4 (2.4%) |
| 45 to 54 Years | 146 (85.9%) | 25 (17.1%) |
| 55 to 59 Years | 49 (51.0%) | 0 (0.0%) |
| 60 to 64 Years | 48 (29.1%) | 6 (12.5%) |
| 65 to 74 Years | 21 (10.9%) | 0 (0.0%) |
| 75 Years and over | 2 (3.8%) | 0 (0.0%) |
| Total | 870 (51.8%) | 62 (7.1%) |
Employment Status by Educational Attainment in Port Barre
According to labor force statistics for Port Barre, 71.4% of individuals (653) out of the total population between 25 and 64 years of age (915) are in the labor force, with 9.5% or 62 of them being unemployed. The group with the highest labor force participation rate are those with the educational attainment of bachelor's degree or higher, with 82.8% or 24 individuals in the labor force. Within the labor force, individuals with high school diploma education have the highest percentage of unemployment, with 14.9% or 62 of them being unemployed.
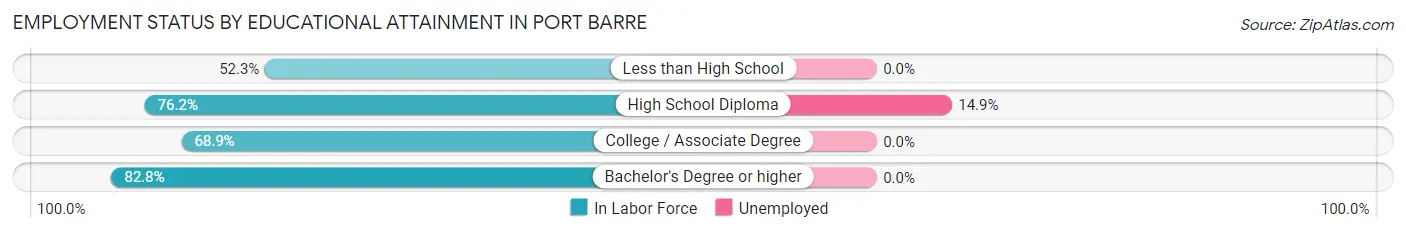
| Educational Attainment | In Labor Force | Unemployed |
| Less than High School | 67 (52.3%) | 0 (0.0%) |
| High School Diploma | 416 (76.2%) | 81 (14.9%) |
| College / Associate Degree | 146 (68.9%) | 0 (0.0%) |
| Bachelor's Degree or higher | 24 (82.8%) | 0 (0.0%) |
| Total | 653 (71.4%) | 87 (9.5%) |
Employment Occupations by Sex in Port Barre
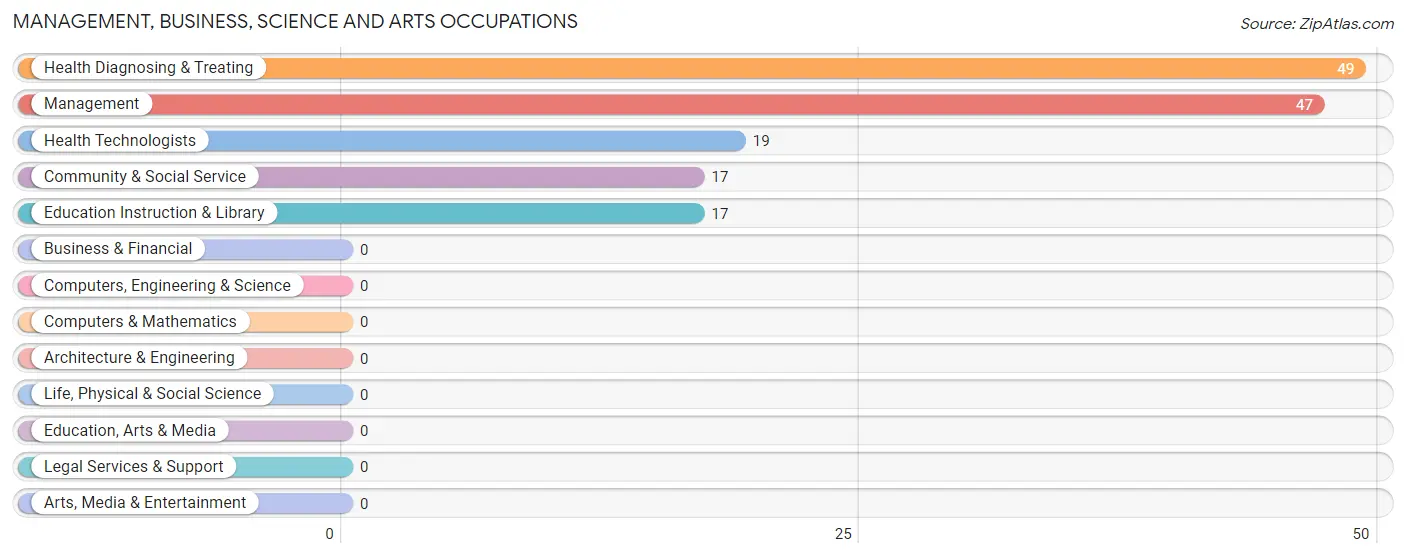
Management, Business, Science and Arts Occupations
The most common Management, Business, Science and Arts occupations in Port Barre are Health Diagnosing & Treating (49 | 6.1%), Management (47 | 5.8%), Health Technologists (19 | 2.4%), Community & Social Service (17 | 2.1%), and Education Instruction & Library (17 | 2.1%).
Management, Business, Science and Arts Occupations by Sex
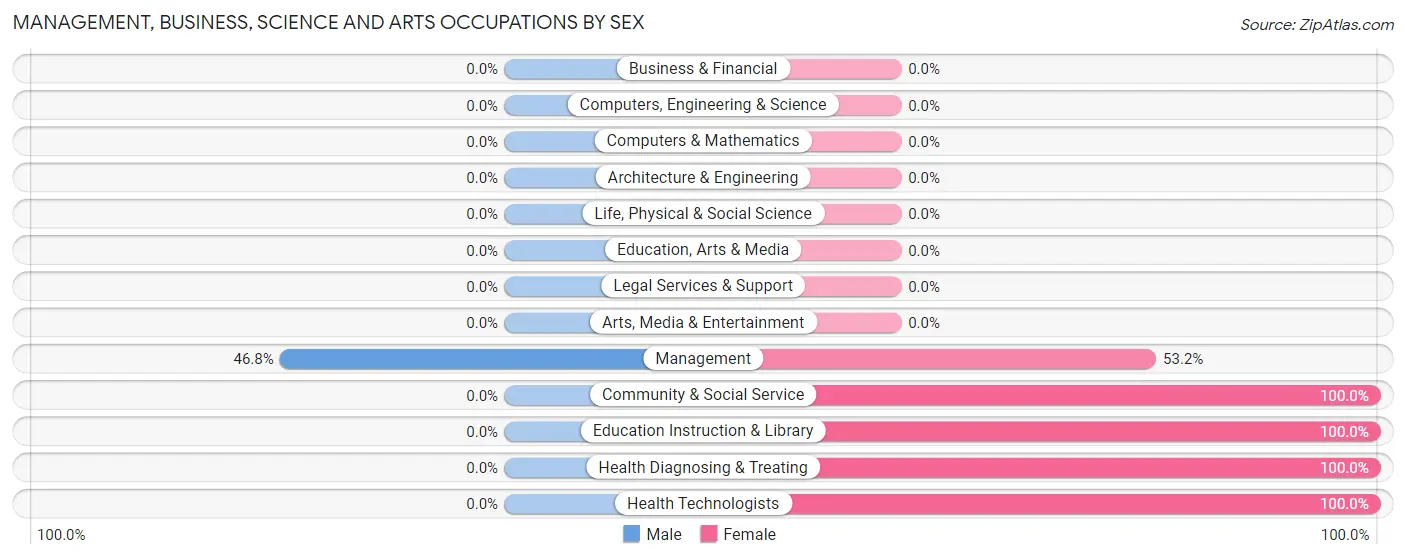
| Occupation | Male | Female |
| Management | 22 (46.8%) | 25 (53.2%) |
| Business & Financial | 0 (0.0%) | 0 (0.0%) |
| Computers, Engineering & Science | 0 (0.0%) | 0 (0.0%) |
| Computers & Mathematics | 0 (0.0%) | 0 (0.0%) |
| Architecture & Engineering | 0 (0.0%) | 0 (0.0%) |
| Life, Physical & Social Science | 0 (0.0%) | 0 (0.0%) |
| Community & Social Service | 0 (0.0%) | 17 (100.0%) |
| Education, Arts & Media | 0 (0.0%) | 0 (0.0%) |
| Legal Services & Support | 0 (0.0%) | 0 (0.0%) |
| Education Instruction & Library | 0 (0.0%) | 17 (100.0%) |
| Arts, Media & Entertainment | 0 (0.0%) | 0 (0.0%) |
| Health Diagnosing & Treating | 0 (0.0%) | 49 (100.0%) |
| Health Technologists | 0 (0.0%) | 19 (100.0%) |
| Total (Category) | 22 (19.5%) | 91 (80.5%) |
| Total (Overall) | 428 (52.9%) | 381 (47.1%) |
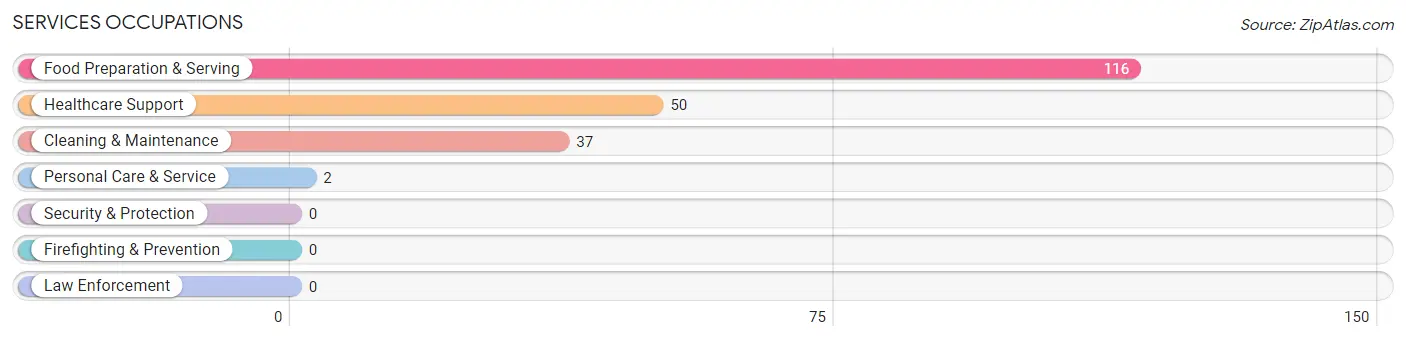
Services Occupations
The most common Services occupations in Port Barre are Food Preparation & Serving (116 | 14.3%), Healthcare Support (50 | 6.2%), Cleaning & Maintenance (37 | 4.6%), and Personal Care & Service (2 | 0.3%).
Services Occupations by Sex
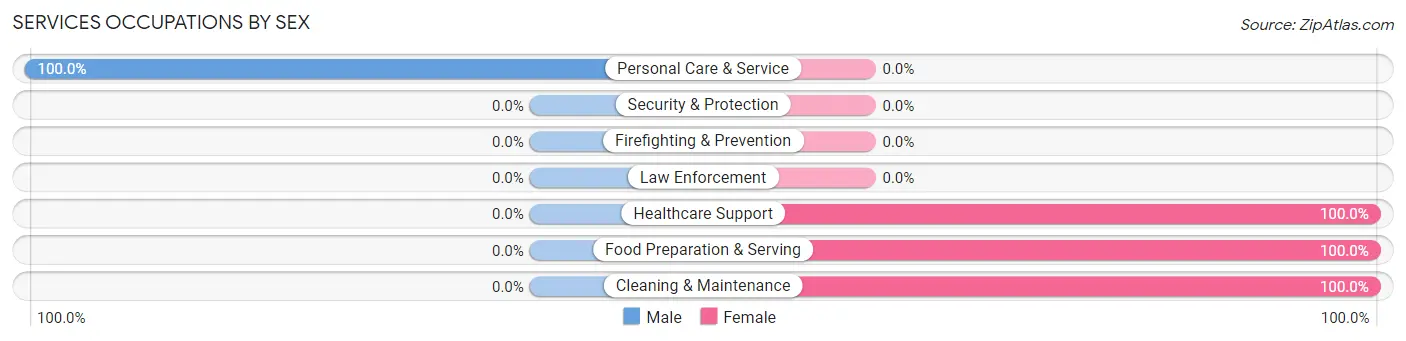
| Occupation | Male | Female |
| Healthcare Support | 0 (0.0%) | 50 (100.0%) |
| Security & Protection | 0 (0.0%) | 0 (0.0%) |
| Firefighting & Prevention | 0 (0.0%) | 0 (0.0%) |
| Law Enforcement | 0 (0.0%) | 0 (0.0%) |
| Food Preparation & Serving | 0 (0.0%) | 116 (100.0%) |
| Cleaning & Maintenance | 0 (0.0%) | 37 (100.0%) |
| Personal Care & Service | 2 (100.0%) | 0 (0.0%) |
| Total (Category) | 2 (1.0%) | 203 (99.0%) |
| Total (Overall) | 428 (52.9%) | 381 (47.1%) |
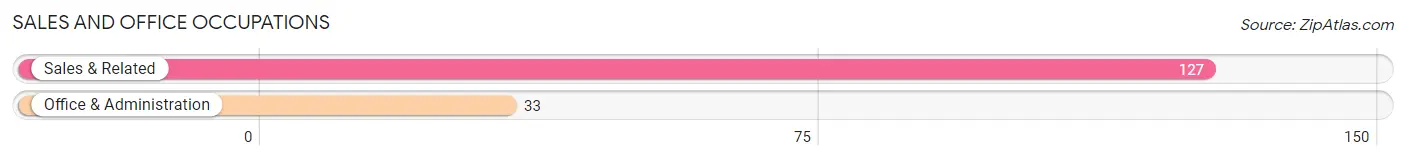
Sales and Office Occupations
The most common Sales and Office occupations in Port Barre are Sales & Related (127 | 15.7%), and Office & Administration (33 | 4.1%).
Sales and Office Occupations by Sex
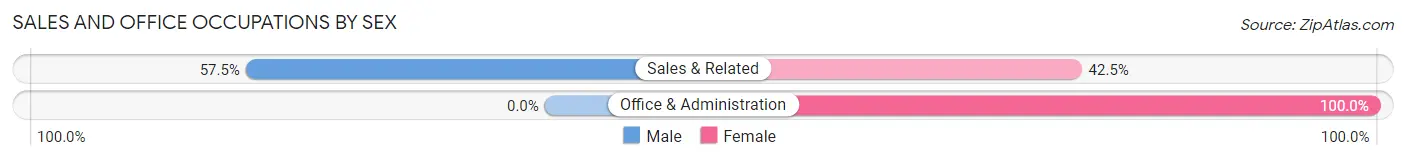
| Occupation | Male | Female |
| Sales & Related | 73 (57.5%) | 54 (42.5%) |
| Office & Administration | 0 (0.0%) | 33 (100.0%) |
| Total (Category) | 73 (45.6%) | 87 (54.4%) |
| Total (Overall) | 428 (52.9%) | 381 (47.1%) |
Natural Resources, Construction and Maintenance Occupations
The most common Natural Resources, Construction and Maintenance occupations in Port Barre are Construction & Extraction (169 | 20.9%), Farming, Fishing & Forestry (15 | 1.8%), and Installation, Maintenance & Repair (14 | 1.7%).
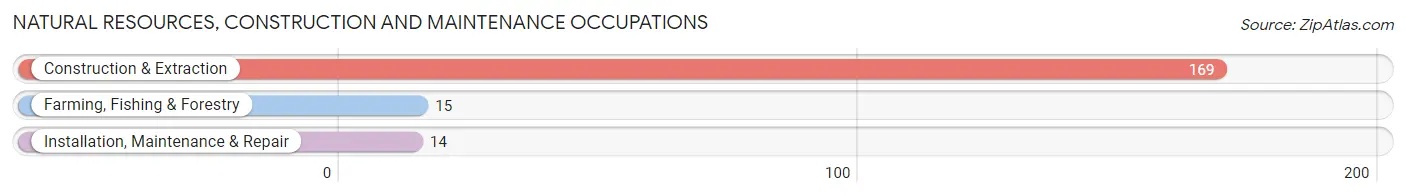
Natural Resources, Construction and Maintenance Occupations by Sex
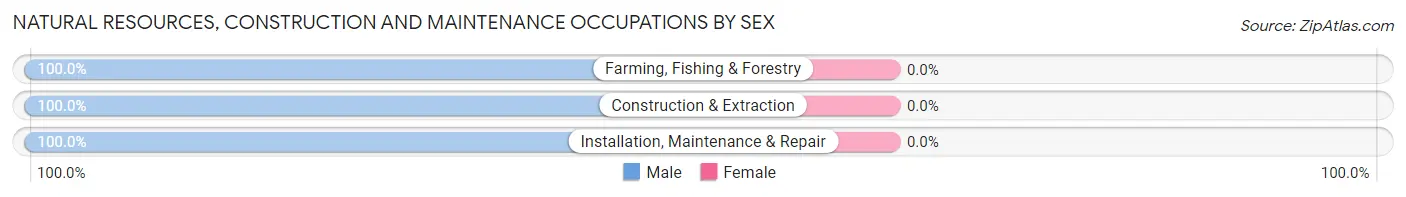
| Occupation | Male | Female |
| Farming, Fishing & Forestry | 15 (100.0%) | 0 (0.0%) |
| Construction & Extraction | 169 (100.0%) | 0 (0.0%) |
| Installation, Maintenance & Repair | 14 (100.0%) | 0 (0.0%) |
| Total (Category) | 198 (100.0%) | 0 (0.0%) |
| Total (Overall) | 428 (52.9%) | 381 (47.1%) |
Production, Transportation and Moving Occupations
The most common Production, Transportation and Moving occupations in Port Barre are Material Moving (75 | 9.3%), Production (52 | 6.4%), and Transportation (6 | 0.7%).
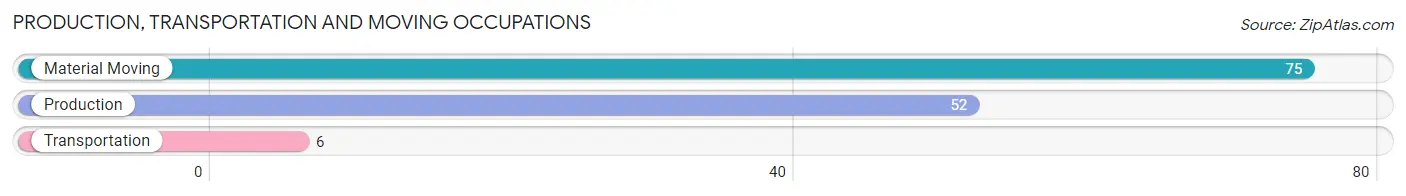
Production, Transportation and Moving Occupations by Sex
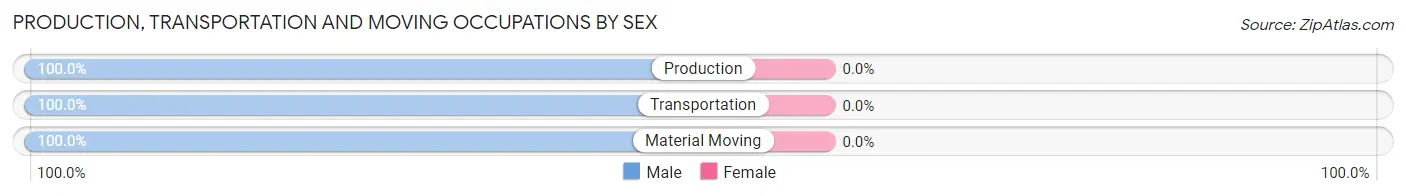
| Occupation | Male | Female |
| Production | 52 (100.0%) | 0 (0.0%) |
| Transportation | 6 (100.0%) | 0 (0.0%) |
| Material Moving | 75 (100.0%) | 0 (0.0%) |
| Total (Category) | 133 (100.0%) | 0 (0.0%) |
| Total (Overall) | 428 (52.9%) | 381 (47.1%) |
Employment Industries by Sex in Port Barre
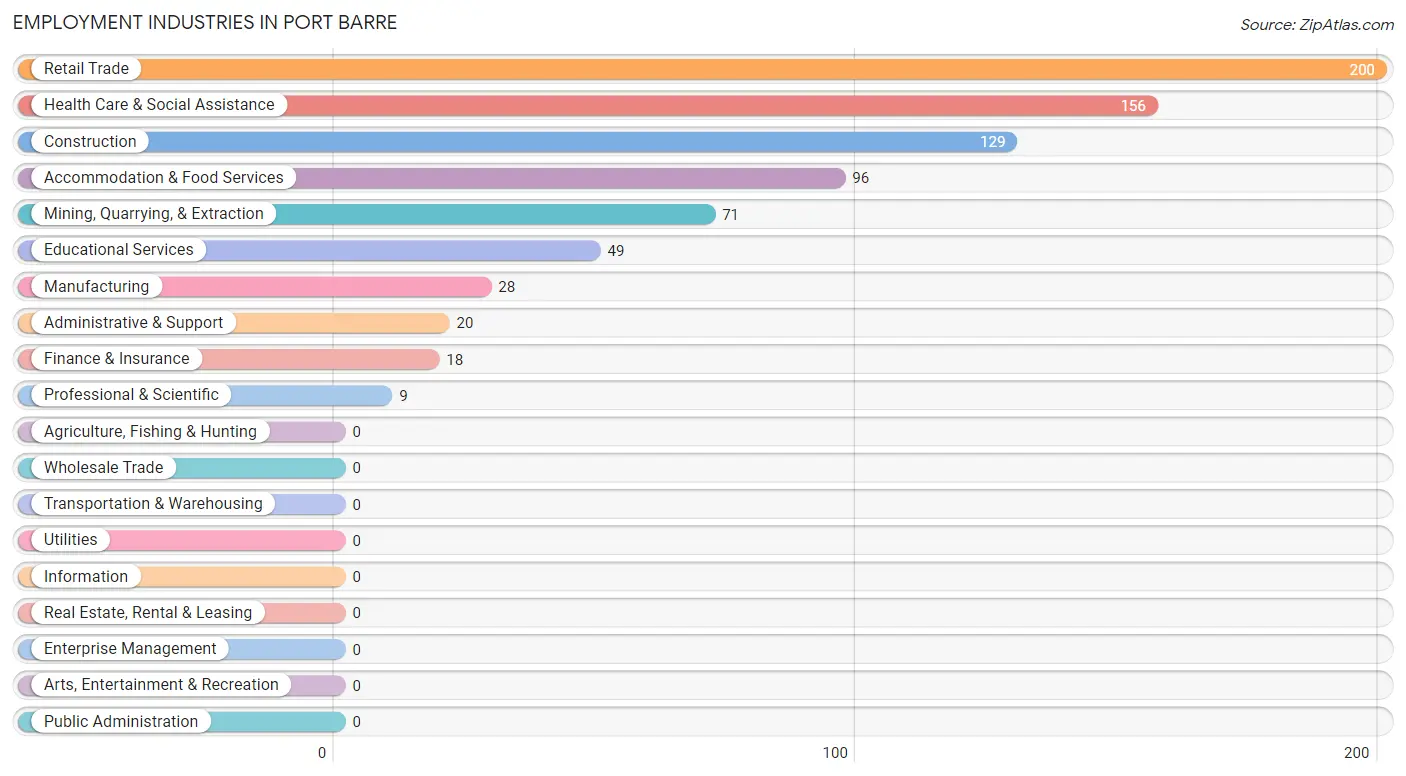
Employment Industries in Port Barre
The major employment industries in Port Barre include Retail Trade (200 | 24.7%), Health Care & Social Assistance (156 | 19.3%), Construction (129 | 16.0%), Accommodation & Food Services (96 | 11.9%), and Mining, Quarrying, & Extraction (71 | 8.8%).
Employment Industries by Sex in Port Barre
The Port Barre industries that see more men than women are Mining, Quarrying, & Extraction (100.0%), Construction (100.0%), and Manufacturing (100.0%), whereas the industries that tend to have a higher number of women are Finance & Insurance (100.0%), Administrative & Support (100.0%), and Health Care & Social Assistance (100.0%).
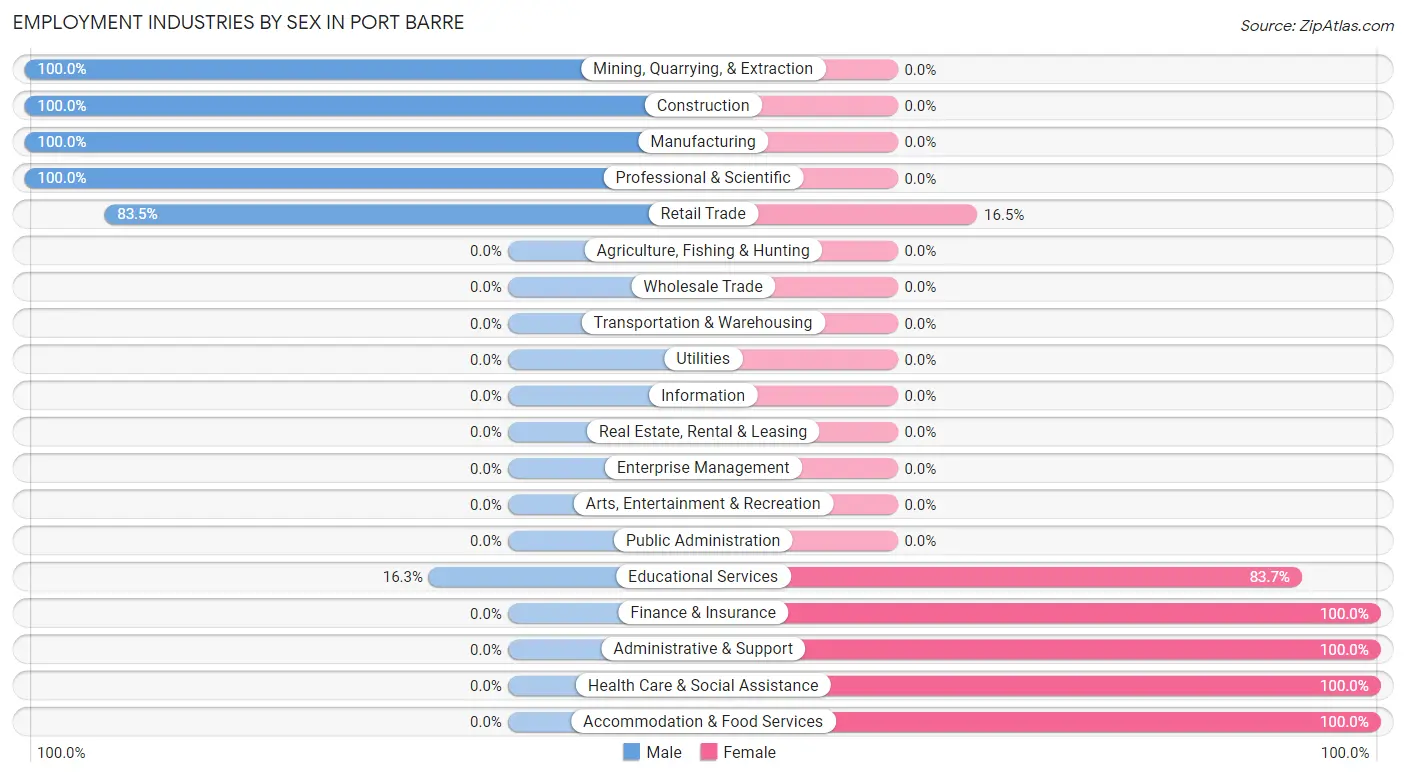
| Industry | Male | Female |
| Agriculture, Fishing & Hunting | 0 (0.0%) | 0 (0.0%) |
| Mining, Quarrying, & Extraction | 71 (100.0%) | 0 (0.0%) |
| Construction | 129 (100.0%) | 0 (0.0%) |
| Manufacturing | 28 (100.0%) | 0 (0.0%) |
| Wholesale Trade | 0 (0.0%) | 0 (0.0%) |
| Retail Trade | 167 (83.5%) | 33 (16.5%) |
| Transportation & Warehousing | 0 (0.0%) | 0 (0.0%) |
| Utilities | 0 (0.0%) | 0 (0.0%) |
| Information | 0 (0.0%) | 0 (0.0%) |
| Finance & Insurance | 0 (0.0%) | 18 (100.0%) |
| Real Estate, Rental & Leasing | 0 (0.0%) | 0 (0.0%) |
| Professional & Scientific | 9 (100.0%) | 0 (0.0%) |
| Enterprise Management | 0 (0.0%) | 0 (0.0%) |
| Administrative & Support | 0 (0.0%) | 20 (100.0%) |
| Educational Services | 8 (16.3%) | 41 (83.7%) |
| Health Care & Social Assistance | 0 (0.0%) | 156 (100.0%) |
| Arts, Entertainment & Recreation | 0 (0.0%) | 0 (0.0%) |
| Accommodation & Food Services | 0 (0.0%) | 96 (100.0%) |
| Public Administration | 0 (0.0%) | 0 (0.0%) |
| Total | 428 (52.9%) | 381 (47.1%) |
Education in Port Barre
School Enrollment in Port Barre
The most common levels of schooling among the 725 students in Port Barre are high school (247 | 34.1%), college / undergraduate (178 | 24.5%), and elementary school (131 | 18.1%).
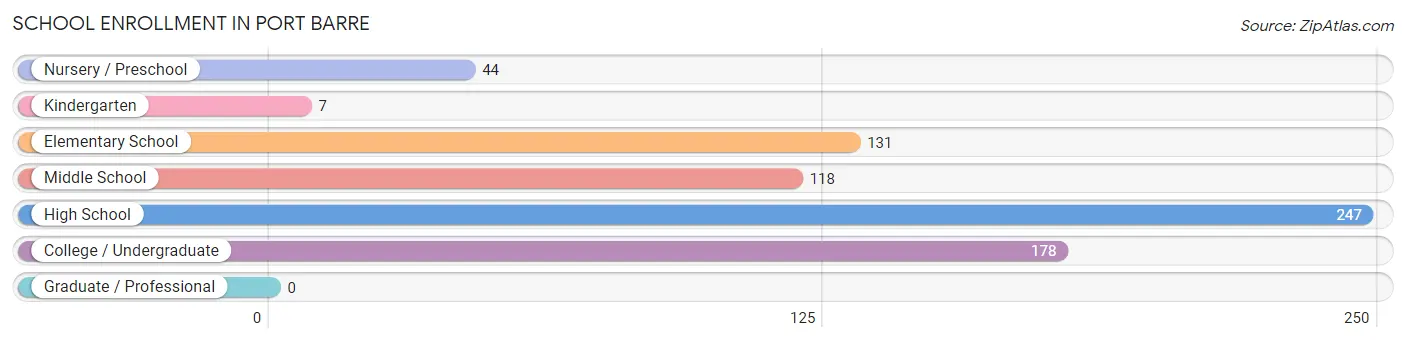
| School Level | # Students | % Students |
| Nursery / Preschool | 44 | 6.1% |
| Kindergarten | 7 | 1.0% |
| Elementary School | 131 | 18.1% |
| Middle School | 118 | 16.3% |
| High School | 247 | 34.1% |
| College / Undergraduate | 178 | 24.5% |
| Graduate / Professional | 0 | 0.0% |
| Total | 725 | 100.0% |
School Enrollment by Age by Funding Source in Port Barre
Out of a total of 725 students who are enrolled in schools in Port Barre, 153 (21.1%) attend a private institution, while the remaining 572 (78.9%) are enrolled in public schools. The age group of 20 to 24 year olds has the highest likelihood of being enrolled in private schools, with 148 (90.2% in the age bracket) enrolled. Conversely, the age group of 3 to 4 year olds has the lowest likelihood of being enrolled in a private school, with 17 (100.0% in the age bracket) attending a public institution.
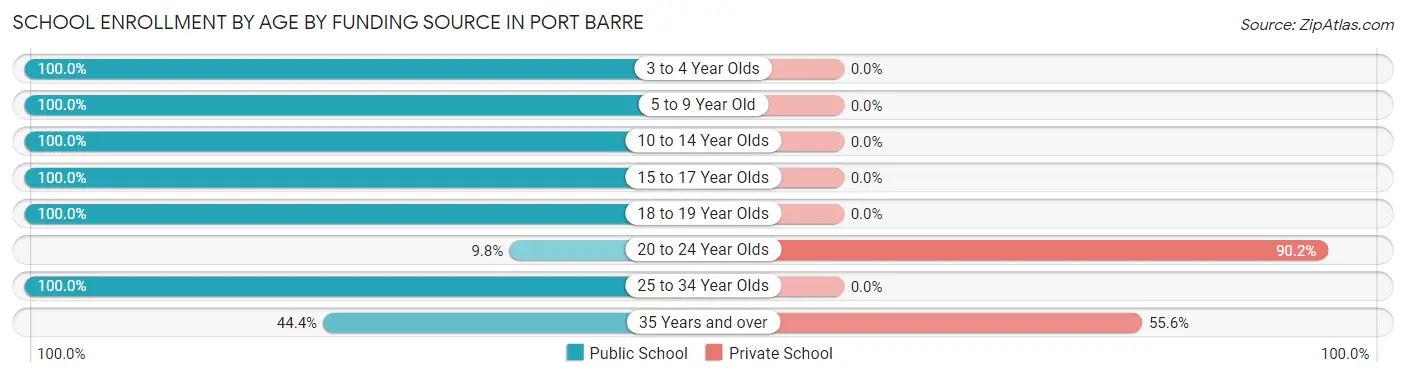
| Age Bracket | Public School | Private School |
| 3 to 4 Year Olds | 17 (100.0%) | 0 (0.0%) |
| 5 to 9 Year Old | 165 (100.0%) | 0 (0.0%) |
| 10 to 14 Year Olds | 150 (100.0%) | 0 (0.0%) |
| 15 to 17 Year Olds | 183 (100.0%) | 0 (0.0%) |
| 18 to 19 Year Olds | 32 (100.0%) | 0 (0.0%) |
| 20 to 24 Year Olds | 16 (9.8%) | 148 (90.2%) |
| 25 to 34 Year Olds | 5 (100.0%) | 0 (0.0%) |
| 35 Years and over | 4 (44.4%) | 5 (55.6%) |
| Total | 572 (78.9%) | 153 (21.1%) |
Educational Attainment by Field of Study in Port Barre
Education (25 | 56.8%), science & technology (7 | 15.9%), arts & humanities (7 | 15.9%), and business (5 | 11.4%) are the most common fields of study among 44 individuals in Port Barre who have obtained a bachelor's degree or higher.
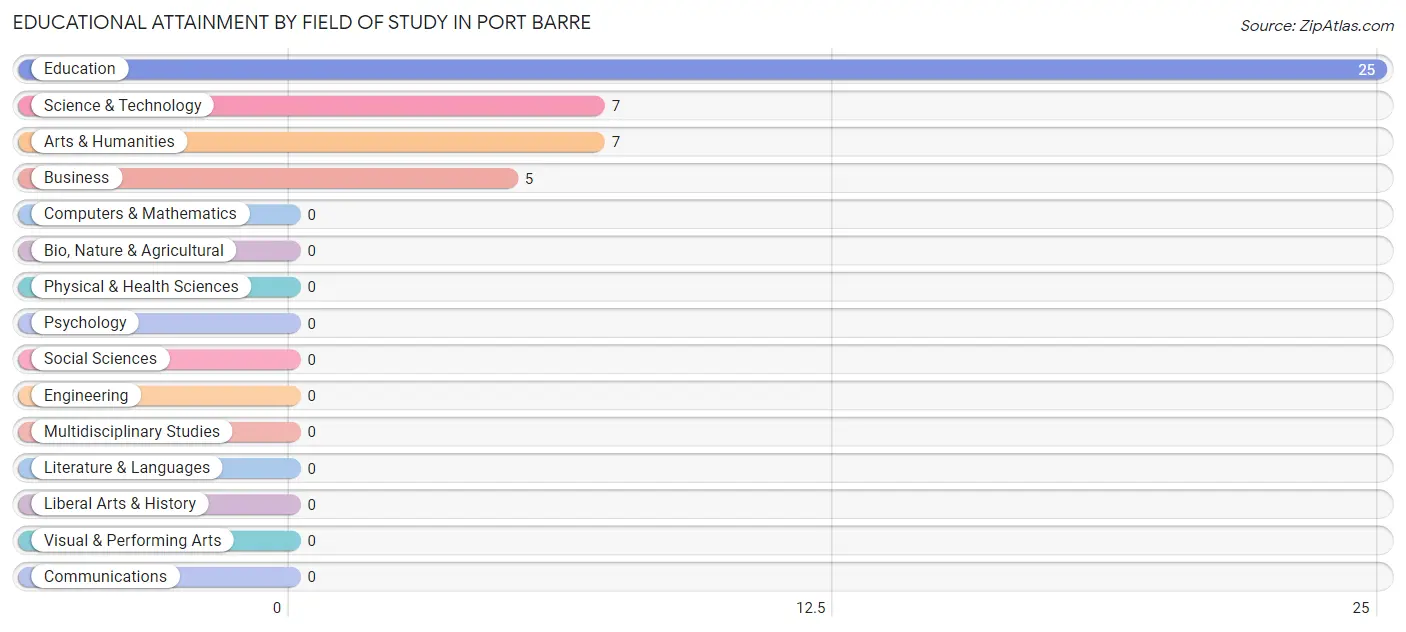
| Field of Study | # Graduates | % Graduates |
| Computers & Mathematics | 0 | 0.0% |
| Bio, Nature & Agricultural | 0 | 0.0% |
| Physical & Health Sciences | 0 | 0.0% |
| Psychology | 0 | 0.0% |
| Social Sciences | 0 | 0.0% |
| Engineering | 0 | 0.0% |
| Multidisciplinary Studies | 0 | 0.0% |
| Science & Technology | 7 | 15.9% |
| Business | 5 | 11.4% |
| Education | 25 | 56.8% |
| Literature & Languages | 0 | 0.0% |
| Liberal Arts & History | 0 | 0.0% |
| Visual & Performing Arts | 0 | 0.0% |
| Communications | 0 | 0.0% |
| Arts & Humanities | 7 | 15.9% |
| Total | 44 | 100.0% |
Transportation & Commute in Port Barre
Vehicle Availability by Sex in Port Barre
The most prevalent vehicle ownership categories in Port Barre are males with 2 vehicles (267, accounting for 62.4%) and females with 2 vehicles (68, making up 78.5%).
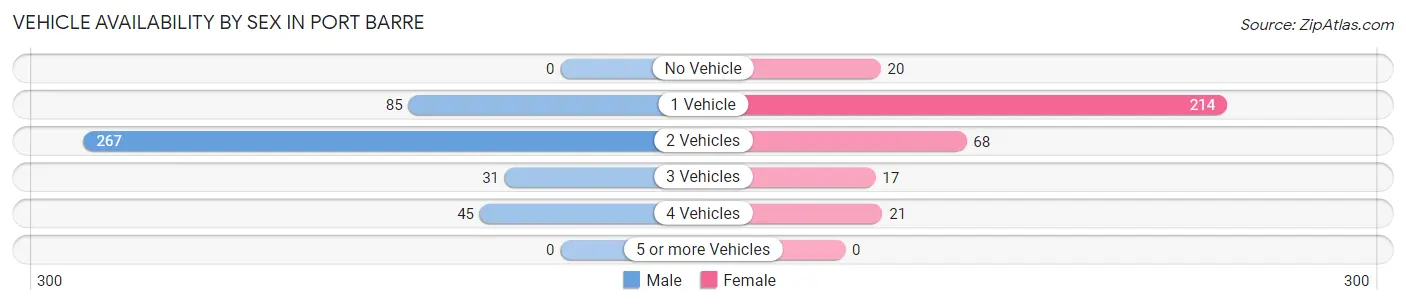
| Vehicles Available | Male | Female |
| No Vehicle | 0 (0.0%) | 20 (5.9%) |
| 1 Vehicle | 85 (19.9%) | 214 (62.9%) |
| 2 Vehicles | 267 (62.4%) | 68 (20.0%) |
| 3 Vehicles | 31 (7.2%) | 17 (5.0%) |
| 4 Vehicles | 45 (10.5%) | 21 (6.2%) |
| 5 or more Vehicles | 0 (0.0%) | 0 (0.0%) |
| Total | 428 (100.0%) | 340 (100.0%) |
Commute Time in Port Barre
The most frequently occuring commute durations in Port Barre are 5 to 9 minutes (223 commuters, 29.0%), 15 to 19 minutes (161 commuters, 21.0%), and 30 to 34 minutes (137 commuters, 17.8%).
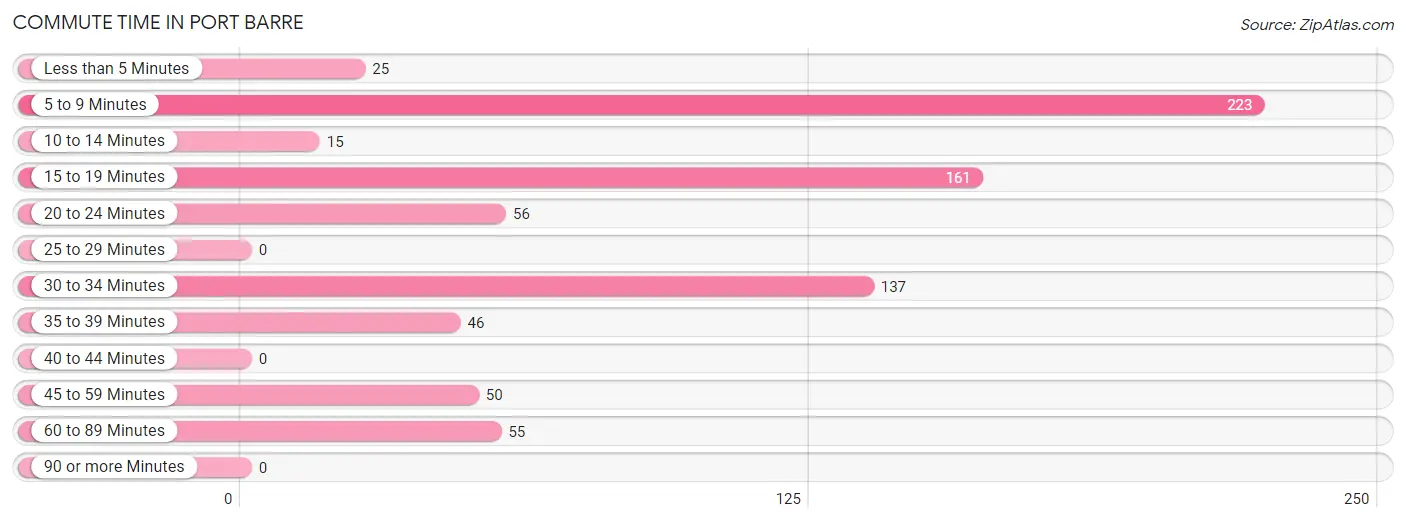
| Commute Time | # Commuters | % Commuters |
| Less than 5 Minutes | 25 | 3.3% |
| 5 to 9 Minutes | 223 | 29.0% |
| 10 to 14 Minutes | 15 | 1.9% |
| 15 to 19 Minutes | 161 | 21.0% |
| 20 to 24 Minutes | 56 | 7.3% |
| 25 to 29 Minutes | 0 | 0.0% |
| 30 to 34 Minutes | 137 | 17.8% |
| 35 to 39 Minutes | 46 | 6.0% |
| 40 to 44 Minutes | 0 | 0.0% |
| 45 to 59 Minutes | 50 | 6.5% |
| 60 to 89 Minutes | 55 | 7.2% |
| 90 or more Minutes | 0 | 0.0% |
Commute Time by Sex in Port Barre
The most common commute times in Port Barre are 5 to 9 minutes (136 commuters, 31.8%) for males and 5 to 9 minutes (87 commuters, 25.6%) for females.
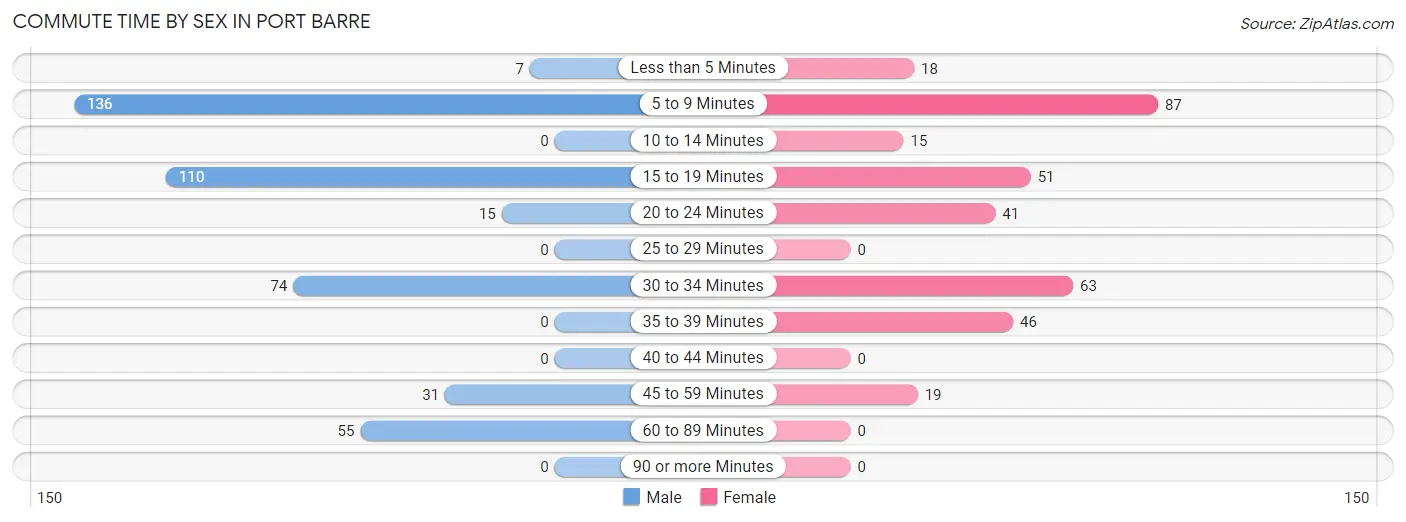
| Commute Time | Male | Female |
| Less than 5 Minutes | 7 (1.6%) | 18 (5.3%) |
| 5 to 9 Minutes | 136 (31.8%) | 87 (25.6%) |
| 10 to 14 Minutes | 0 (0.0%) | 15 (4.4%) |
| 15 to 19 Minutes | 110 (25.7%) | 51 (15.0%) |
| 20 to 24 Minutes | 15 (3.5%) | 41 (12.1%) |
| 25 to 29 Minutes | 0 (0.0%) | 0 (0.0%) |
| 30 to 34 Minutes | 74 (17.3%) | 63 (18.5%) |
| 35 to 39 Minutes | 0 (0.0%) | 46 (13.5%) |
| 40 to 44 Minutes | 0 (0.0%) | 0 (0.0%) |
| 45 to 59 Minutes | 31 (7.2%) | 19 (5.6%) |
| 60 to 89 Minutes | 55 (12.9%) | 0 (0.0%) |
| 90 or more Minutes | 0 (0.0%) | 0 (0.0%) |
Time of Departure to Work by Sex in Port Barre
The most frequent times of departure to work in Port Barre are 6:30 AM to 6:59 AM (87, 20.3%) for males and 7:00 AM to 7:29 AM (66, 19.4%) for females.
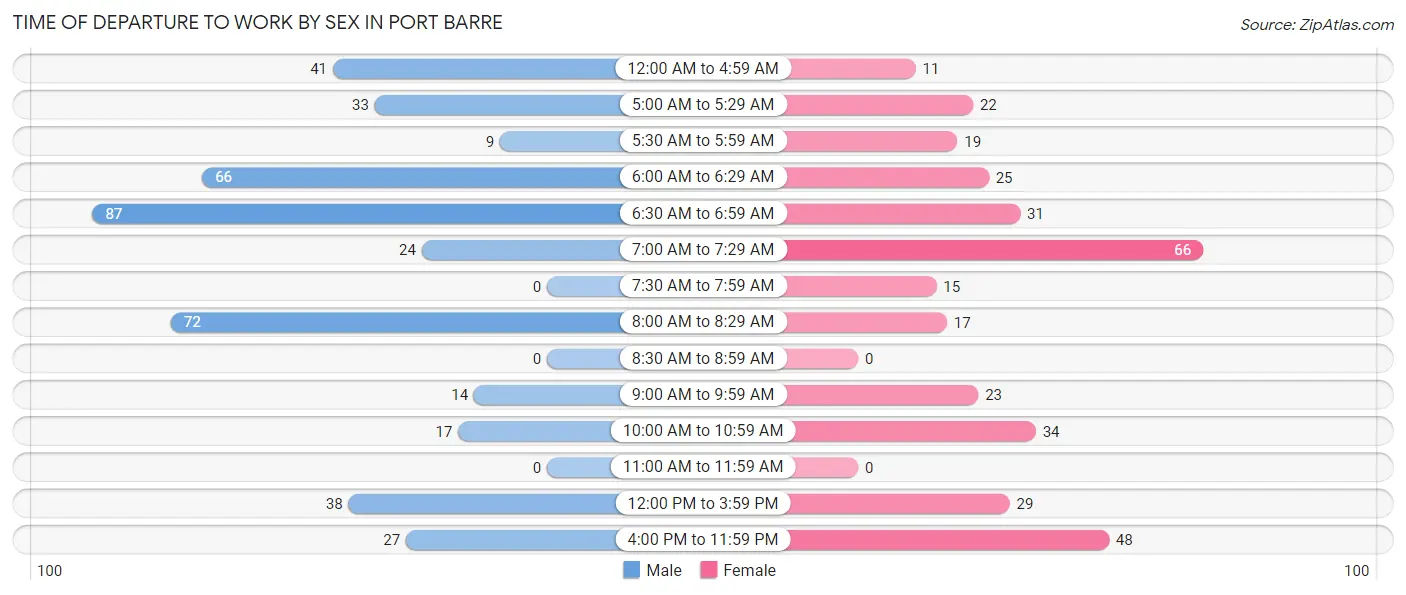
| Time of Departure | Male | Female |
| 12:00 AM to 4:59 AM | 41 (9.6%) | 11 (3.2%) |
| 5:00 AM to 5:29 AM | 33 (7.7%) | 22 (6.5%) |
| 5:30 AM to 5:59 AM | 9 (2.1%) | 19 (5.6%) |
| 6:00 AM to 6:29 AM | 66 (15.4%) | 25 (7.3%) |
| 6:30 AM to 6:59 AM | 87 (20.3%) | 31 (9.1%) |
| 7:00 AM to 7:29 AM | 24 (5.6%) | 66 (19.4%) |
| 7:30 AM to 7:59 AM | 0 (0.0%) | 15 (4.4%) |
| 8:00 AM to 8:29 AM | 72 (16.8%) | 17 (5.0%) |
| 8:30 AM to 8:59 AM | 0 (0.0%) | 0 (0.0%) |
| 9:00 AM to 9:59 AM | 14 (3.3%) | 23 (6.8%) |
| 10:00 AM to 10:59 AM | 17 (4.0%) | 34 (10.0%) |
| 11:00 AM to 11:59 AM | 0 (0.0%) | 0 (0.0%) |
| 12:00 PM to 3:59 PM | 38 (8.9%) | 29 (8.5%) |
| 4:00 PM to 11:59 PM | 27 (6.3%) | 48 (14.1%) |
| Total | 428 (100.0%) | 340 (100.0%) |
Housing Occupancy in Port Barre
Occupancy by Ownership in Port Barre
Of the total 820 dwellings in Port Barre, owner-occupied units account for 440 (53.7%), while renter-occupied units make up 380 (46.3%).
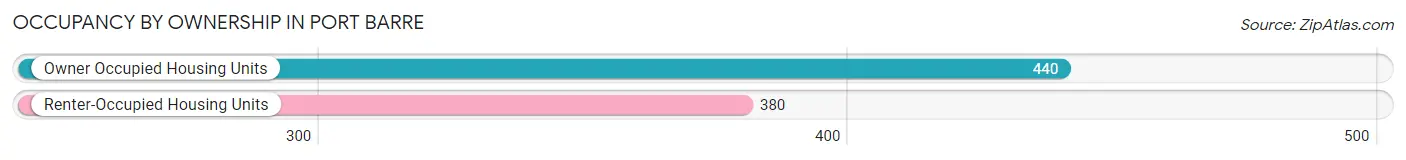
| Occupancy | # Housing Units | % Housing Units |
| Owner Occupied Housing Units | 440 | 53.7% |
| Renter-Occupied Housing Units | 380 | 46.3% |
| Total Occupied Housing Units | 820 | 100.0% |
Occupancy by Household Size in Port Barre
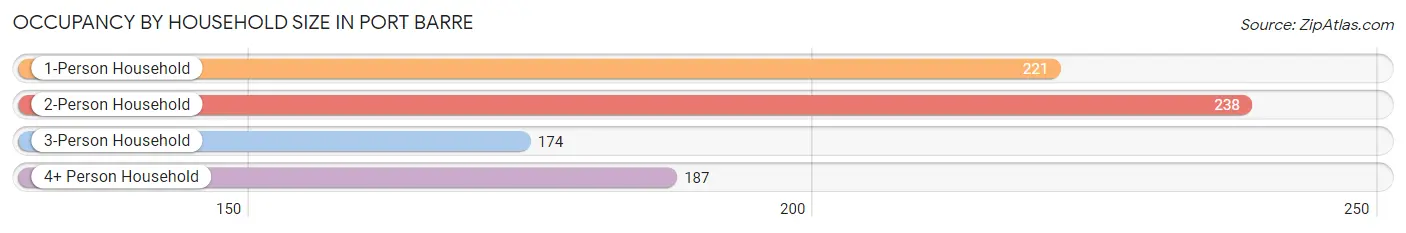
| Household Size | # Housing Units | % Housing Units |
| 1-Person Household | 221 | 27.0% |
| 2-Person Household | 238 | 29.0% |
| 3-Person Household | 174 | 21.2% |
| 4+ Person Household | 187 | 22.8% |
| Total Housing Units | 820 | 100.0% |
Occupancy by Ownership by Household Size in Port Barre
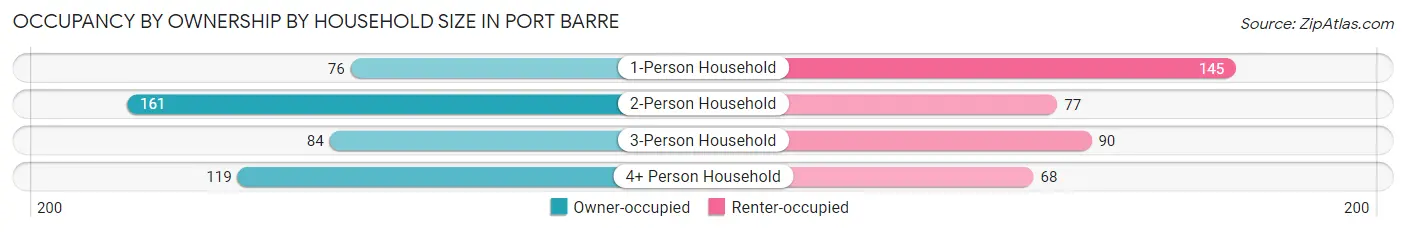
| Household Size | Owner-occupied | Renter-occupied |
| 1-Person Household | 76 (34.4%) | 145 (65.6%) |
| 2-Person Household | 161 (67.6%) | 77 (32.4%) |
| 3-Person Household | 84 (48.3%) | 90 (51.7%) |
| 4+ Person Household | 119 (63.6%) | 68 (36.4%) |
| Total Housing Units | 440 (53.7%) | 380 (46.3%) |
Occupancy by Educational Attainment in Port Barre
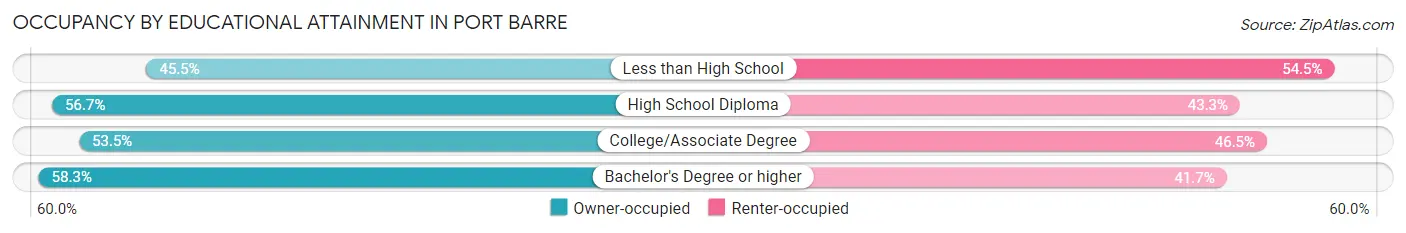
| Household Size | Owner-occupied | Renter-occupied |
| Less than High School | 81 (45.5%) | 97 (54.5%) |
| High School Diploma | 261 (56.7%) | 199 (43.3%) |
| College/Associate Degree | 91 (53.5%) | 79 (46.5%) |
| Bachelor's Degree or higher | 7 (58.3%) | 5 (41.7%) |
Occupancy by Age of Householder in Port Barre
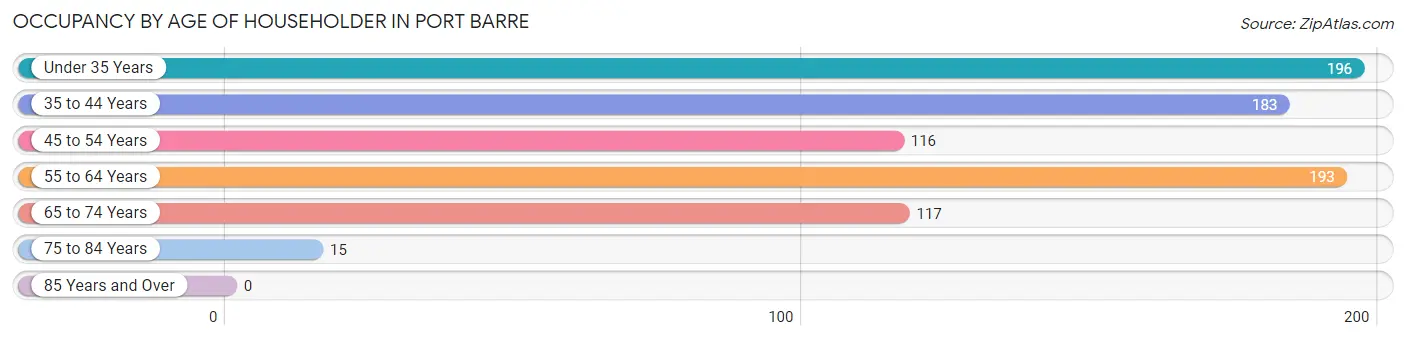
| Age Bracket | # Households | % Households |
| Under 35 Years | 196 | 23.9% |
| 35 to 44 Years | 183 | 22.3% |
| 45 to 54 Years | 116 | 14.1% |
| 55 to 64 Years | 193 | 23.5% |
| 65 to 74 Years | 117 | 14.3% |
| 75 to 84 Years | 15 | 1.8% |
| 85 Years and Over | 0 | 0.0% |
| Total | 820 | 100.0% |
Housing Finances in Port Barre
Median Income by Occupancy in Port Barre
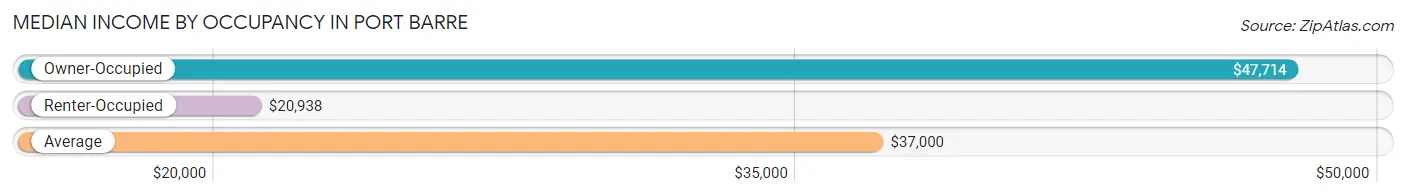
| Occupancy Type | # Households | Median Income |
| Owner-Occupied | 440 (53.7%) | $47,714 |
| Renter-Occupied | 380 (46.3%) | $20,938 |
| Average | 820 (100.0%) | $37,000 |
Occupancy by Householder Income Bracket in Port Barre
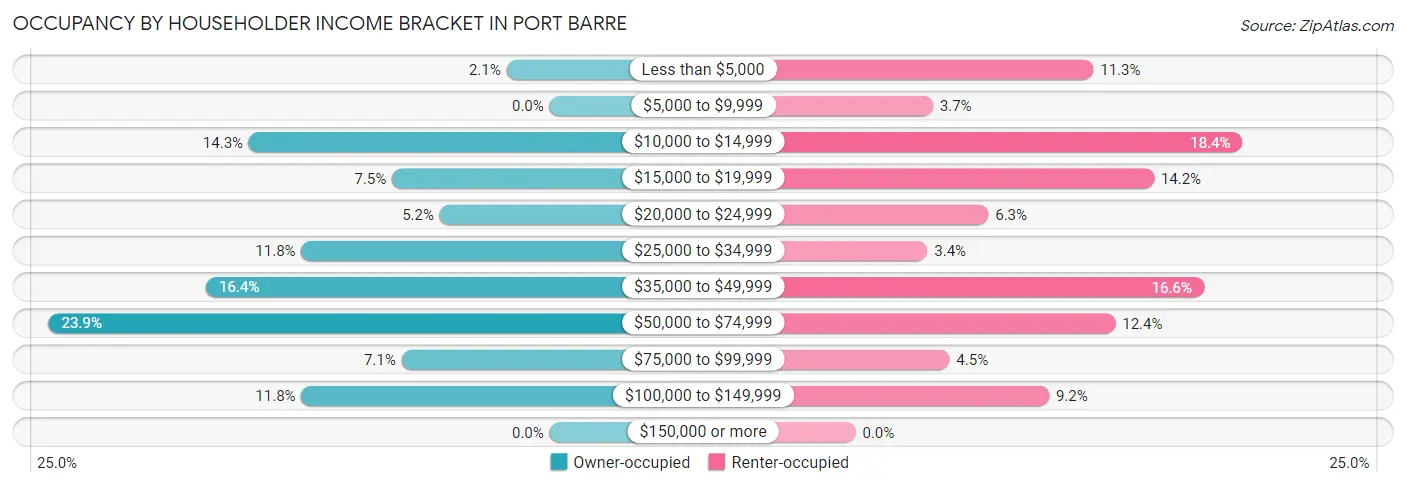
| Income Bracket | Owner-occupied | Renter-occupied |
| Less than $5,000 | 9 (2.1%) | 43 (11.3%) |
| $5,000 to $9,999 | 0 (0.0%) | 14 (3.7%) |
| $10,000 to $14,999 | 63 (14.3%) | 70 (18.4%) |
| $15,000 to $19,999 | 33 (7.5%) | 54 (14.2%) |
| $20,000 to $24,999 | 23 (5.2%) | 24 (6.3%) |
| $25,000 to $34,999 | 52 (11.8%) | 13 (3.4%) |
| $35,000 to $49,999 | 72 (16.4%) | 63 (16.6%) |
| $50,000 to $74,999 | 105 (23.9%) | 47 (12.4%) |
| $75,000 to $99,999 | 31 (7.0%) | 17 (4.5%) |
| $100,000 to $149,999 | 52 (11.8%) | 35 (9.2%) |
| $150,000 or more | 0 (0.0%) | 0 (0.0%) |
| Total | 440 (100.0%) | 380 (100.0%) |
Monthly Housing Cost Tiers in Port Barre
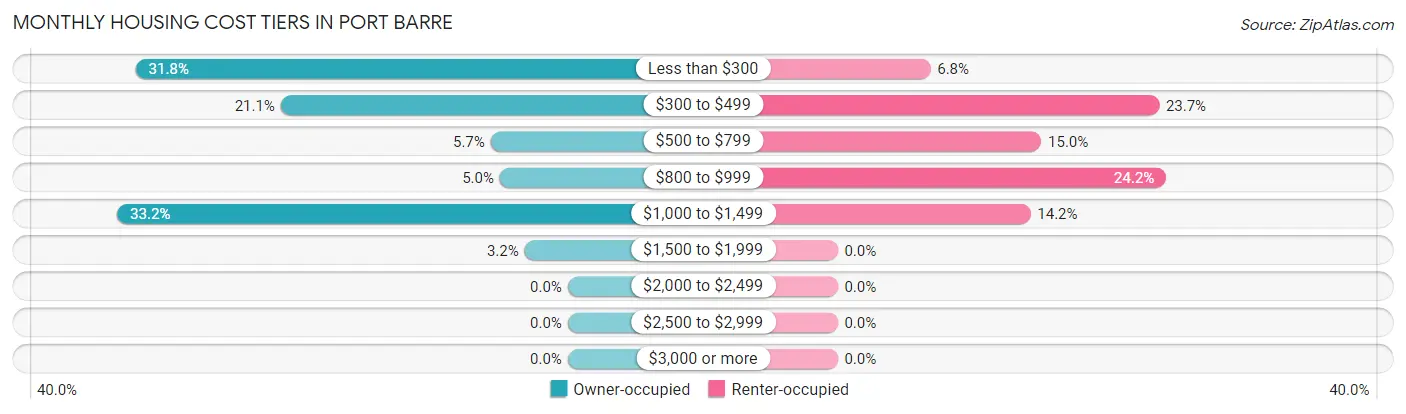
| Monthly Cost | Owner-occupied | Renter-occupied |
| Less than $300 | 140 (31.8%) | 26 (6.8%) |
| $300 to $499 | 93 (21.1%) | 90 (23.7%) |
| $500 to $799 | 25 (5.7%) | 57 (15.0%) |
| $800 to $999 | 22 (5.0%) | 92 (24.2%) |
| $1,000 to $1,499 | 146 (33.2%) | 54 (14.2%) |
| $1,500 to $1,999 | 14 (3.2%) | 0 (0.0%) |
| $2,000 to $2,499 | 0 (0.0%) | 0 (0.0%) |
| $2,500 to $2,999 | 0 (0.0%) | 0 (0.0%) |
| $3,000 or more | 0 (0.0%) | 0 (0.0%) |
| Total | 440 (100.0%) | 380 (100.0%) |
Physical Housing Characteristics in Port Barre
Housing Structures in Port Barre
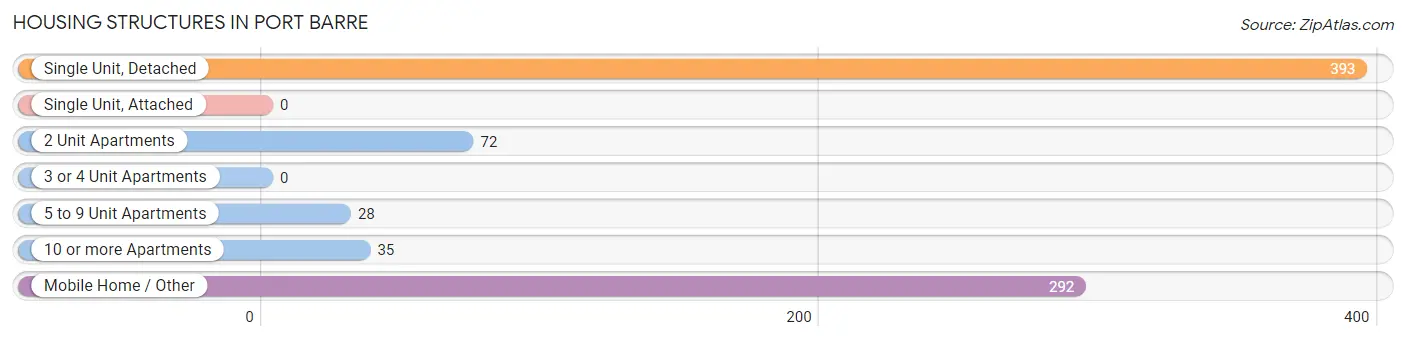
| Structure Type | # Housing Units | % Housing Units |
| Single Unit, Detached | 393 | 47.9% |
| Single Unit, Attached | 0 | 0.0% |
| 2 Unit Apartments | 72 | 8.8% |
| 3 or 4 Unit Apartments | 0 | 0.0% |
| 5 to 9 Unit Apartments | 28 | 3.4% |
| 10 or more Apartments | 35 | 4.3% |
| Mobile Home / Other | 292 | 35.6% |
| Total | 820 | 100.0% |
Housing Structures by Occupancy in Port Barre
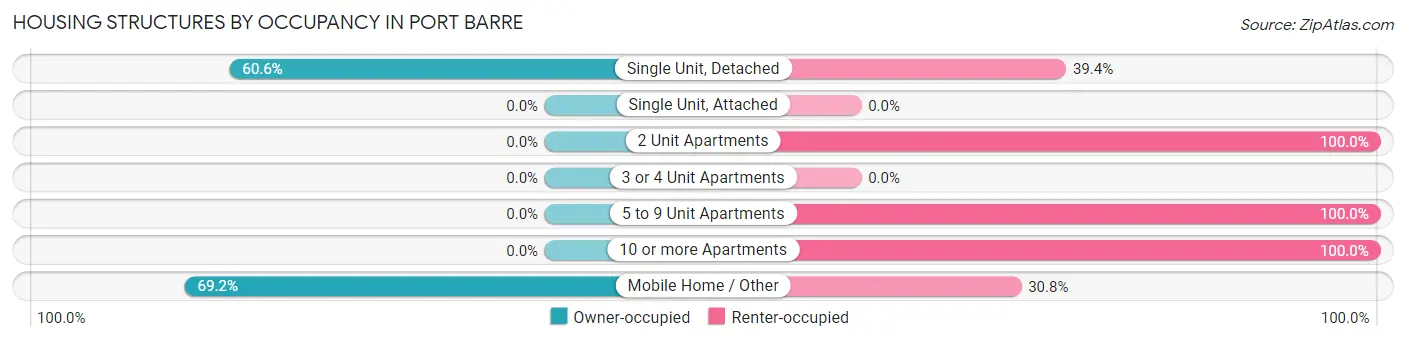
| Structure Type | Owner-occupied | Renter-occupied |
| Single Unit, Detached | 238 (60.6%) | 155 (39.4%) |
| Single Unit, Attached | 0 (0.0%) | 0 (0.0%) |
| 2 Unit Apartments | 0 (0.0%) | 72 (100.0%) |
| 3 or 4 Unit Apartments | 0 (0.0%) | 0 (0.0%) |
| 5 to 9 Unit Apartments | 0 (0.0%) | 28 (100.0%) |
| 10 or more Apartments | 0 (0.0%) | 35 (100.0%) |
| Mobile Home / Other | 202 (69.2%) | 90 (30.8%) |
| Total | 440 (53.7%) | 380 (46.3%) |
Housing Structures by Number of Rooms in Port Barre
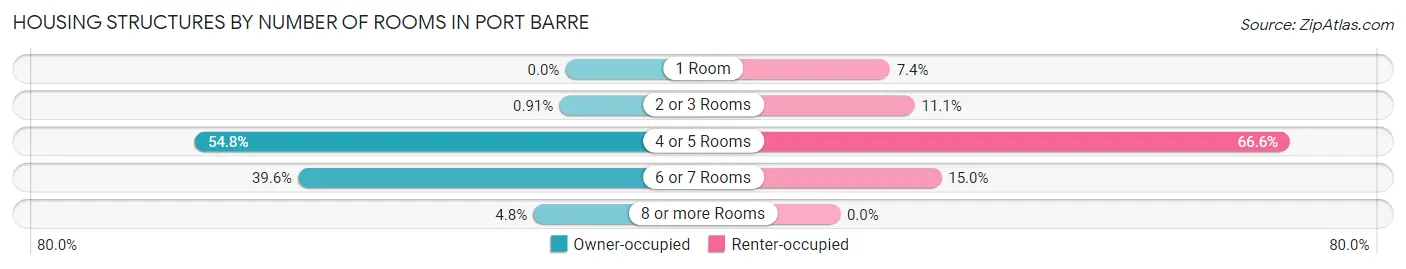
| Number of Rooms | Owner-occupied | Renter-occupied |
| 1 Room | 0 (0.0%) | 28 (7.4%) |
| 2 or 3 Rooms | 4 (0.9%) | 42 (11.1%) |
| 4 or 5 Rooms | 241 (54.8%) | 253 (66.6%) |
| 6 or 7 Rooms | 174 (39.6%) | 57 (15.0%) |
| 8 or more Rooms | 21 (4.8%) | 0 (0.0%) |
| Total | 440 (100.0%) | 380 (100.0%) |
Housing Structure by Heating Type in Port Barre
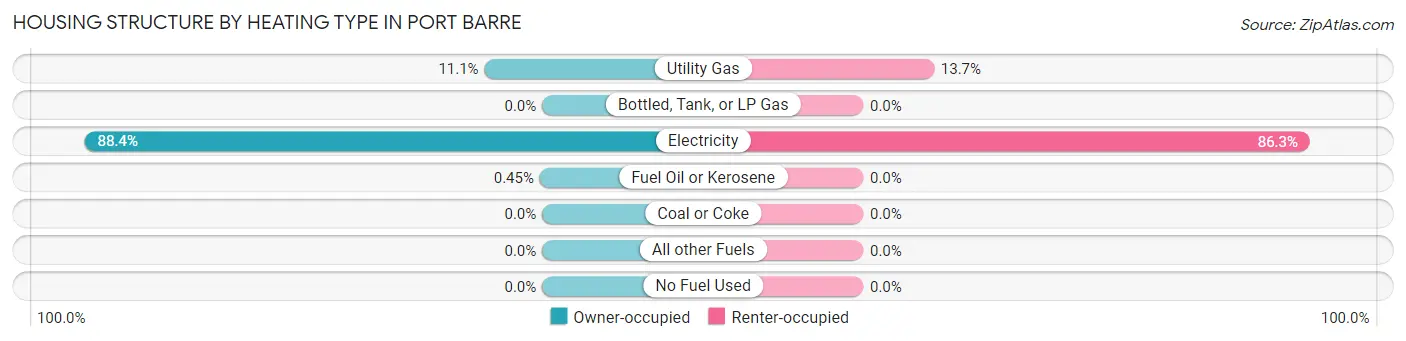
| Heating Type | Owner-occupied | Renter-occupied |
| Utility Gas | 49 (11.1%) | 52 (13.7%) |
| Bottled, Tank, or LP Gas | 0 (0.0%) | 0 (0.0%) |
| Electricity | 389 (88.4%) | 328 (86.3%) |
| Fuel Oil or Kerosene | 2 (0.4%) | 0 (0.0%) |
| Coal or Coke | 0 (0.0%) | 0 (0.0%) |
| All other Fuels | 0 (0.0%) | 0 (0.0%) |
| No Fuel Used | 0 (0.0%) | 0 (0.0%) |
| Total | 440 (100.0%) | 380 (100.0%) |
Household Vehicle Usage in Port Barre
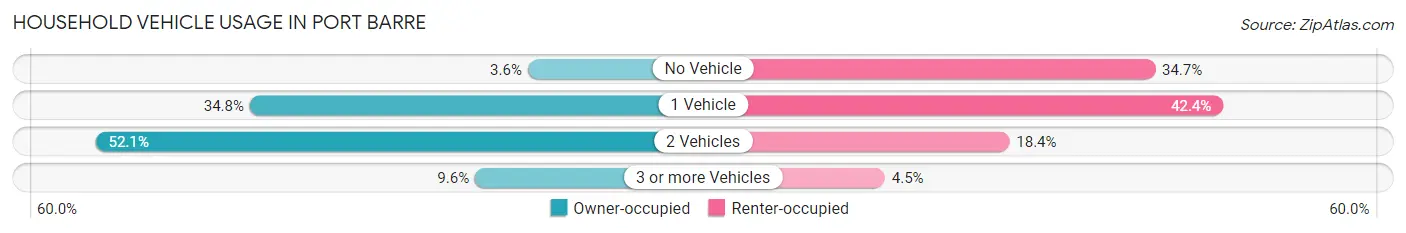
| Vehicles per Household | Owner-occupied | Renter-occupied |
| No Vehicle | 16 (3.6%) | 132 (34.7%) |
| 1 Vehicle | 153 (34.8%) | 161 (42.4%) |
| 2 Vehicles | 229 (52.0%) | 70 (18.4%) |
| 3 or more Vehicles | 42 (9.6%) | 17 (4.5%) |
| Total | 440 (100.0%) | 380 (100.0%) |
Real Estate & Mortgages in Port Barre
Real Estate and Mortgage Overview in Port Barre
| Characteristic | Without Mortgage | With Mortgage |
| Housing Units | 244 | 196 |
| Median Property Value | $72,900 | $0 |
| Median Household Income | $32,500 | $0 |
| Monthly Housing Costs | $263 | $0 |
| Real Estate Taxes | $199 | $162 |
Property Value by Mortgage Status in Port Barre
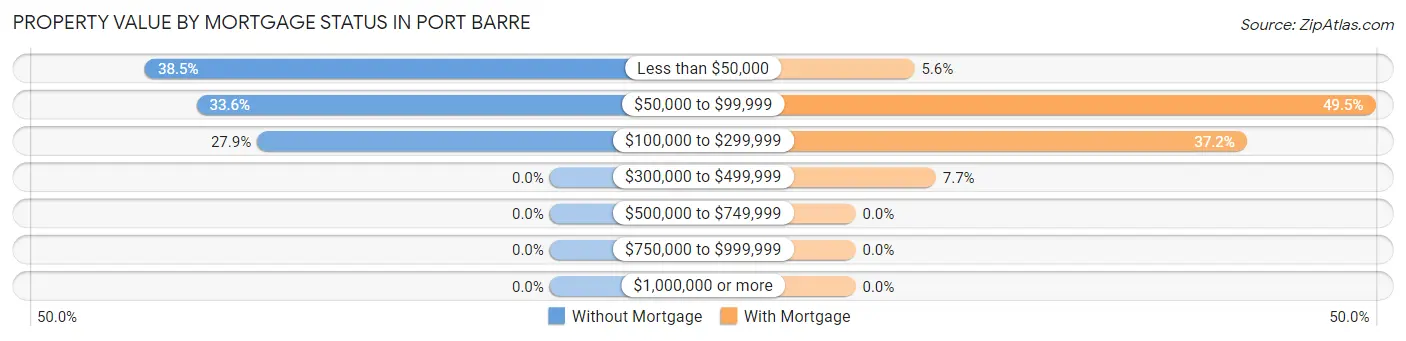
| Property Value | Without Mortgage | With Mortgage |
| Less than $50,000 | 94 (38.5%) | 11 (5.6%) |
| $50,000 to $99,999 | 82 (33.6%) | 97 (49.5%) |
| $100,000 to $299,999 | 68 (27.9%) | 73 (37.2%) |
| $300,000 to $499,999 | 0 (0.0%) | 15 (7.6%) |
| $500,000 to $749,999 | 0 (0.0%) | 0 (0.0%) |
| $750,000 to $999,999 | 0 (0.0%) | 0 (0.0%) |
| $1,000,000 or more | 0 (0.0%) | 0 (0.0%) |
| Total | 244 (100.0%) | 196 (100.0%) |
Household Income by Mortgage Status in Port Barre
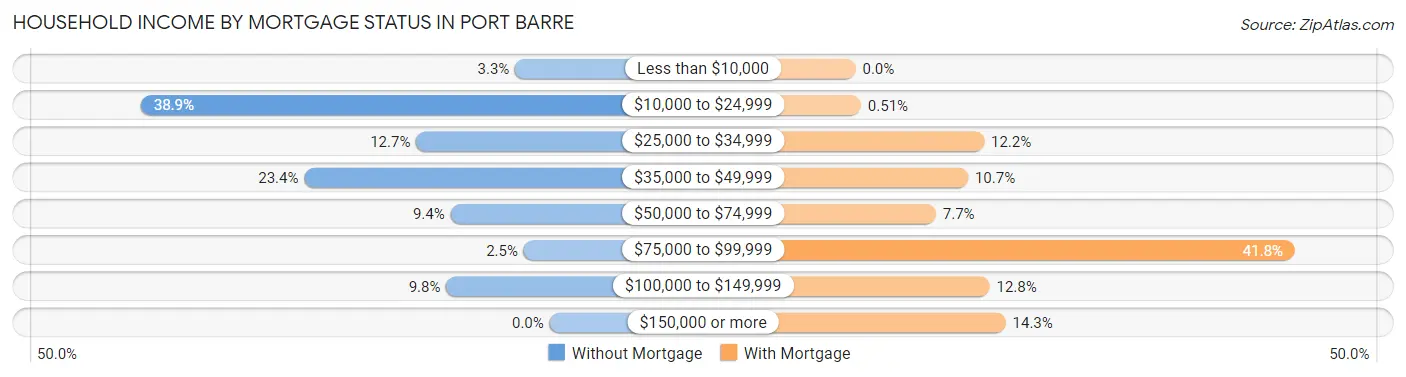
| Household Income | Without Mortgage | With Mortgage |
| Less than $10,000 | 8 (3.3%) | 0 (0.0%) |
| $10,000 to $24,999 | 95 (38.9%) | 1 (0.5%) |
| $25,000 to $34,999 | 31 (12.7%) | 24 (12.2%) |
| $35,000 to $49,999 | 57 (23.4%) | 21 (10.7%) |
| $50,000 to $74,999 | 23 (9.4%) | 15 (7.6%) |
| $75,000 to $99,999 | 6 (2.5%) | 82 (41.8%) |
| $100,000 to $149,999 | 24 (9.8%) | 25 (12.8%) |
| $150,000 or more | 0 (0.0%) | 28 (14.3%) |
| Total | 244 (100.0%) | 196 (100.0%) |
Property Value to Household Income Ratio in Port Barre
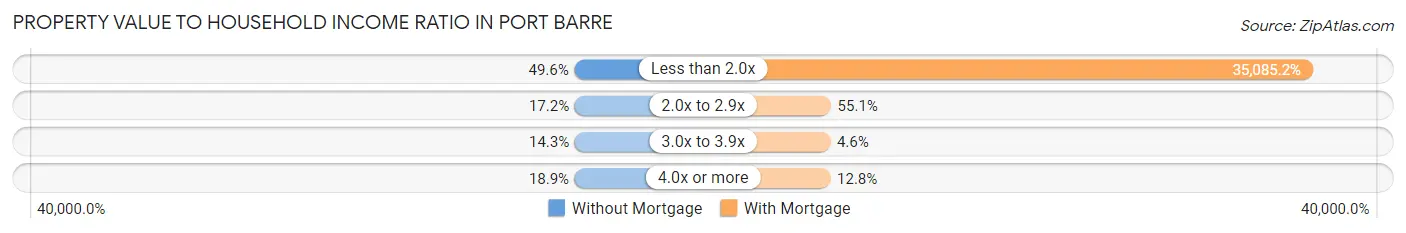
| Value-to-Income Ratio | Without Mortgage | With Mortgage |
| Less than 2.0x | 121 (49.6%) | 68,767 (35,085.2%) |
| 2.0x to 2.9x | 42 (17.2%) | 108 (55.1%) |
| 3.0x to 3.9x | 35 (14.3%) | 9 (4.6%) |
| 4.0x or more | 46 (18.9%) | 25 (12.8%) |
| Total | 244 (100.0%) | 196 (100.0%) |
Real Estate Taxes by Mortgage Status in Port Barre
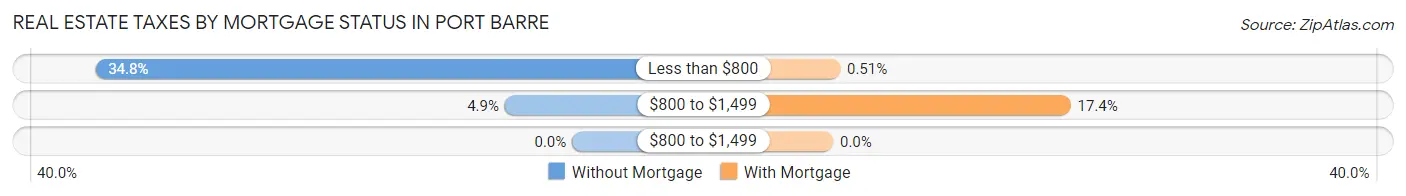
| Property Taxes | Without Mortgage | With Mortgage |
| Less than $800 | 85 (34.8%) | 1 (0.5%) |
| $800 to $1,499 | 12 (4.9%) | 34 (17.3%) |
| $800 to $1,499 | 0 (0.0%) | 0 (0.0%) |
| Total | 244 (100.0%) | 196 (100.0%) |
Health & Disability in Port Barre
Health Insurance Coverage by Age in Port Barre
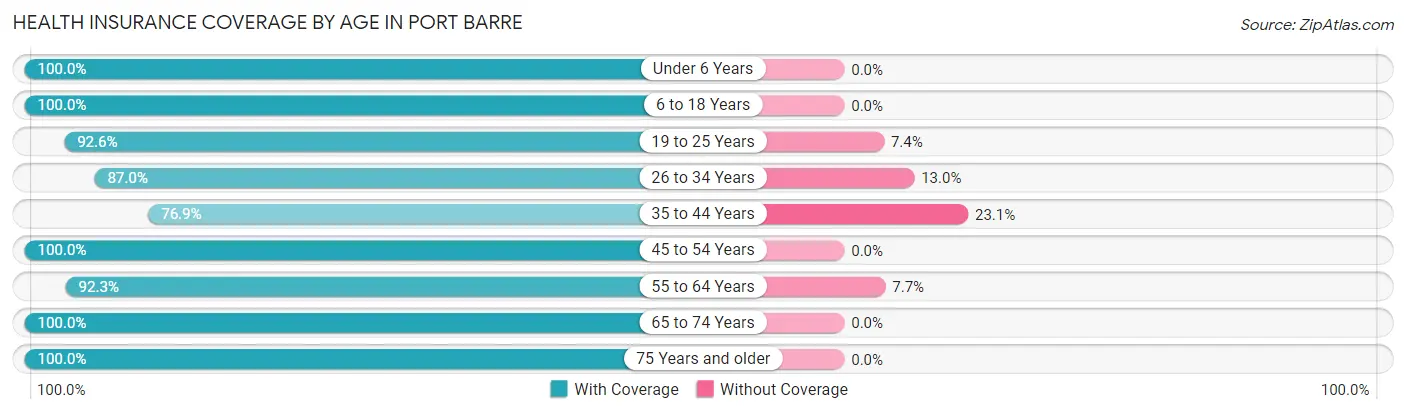
| Age Bracket | With Coverage | Without Coverage |
| Under 6 Years | 216 (100.0%) | 0 (0.0%) |
| 6 to 18 Years | 500 (100.0%) | 0 (0.0%) |
| 19 to 25 Years | 313 (92.6%) | 25 (7.4%) |
| 26 to 34 Years | 200 (87.0%) | 30 (13.0%) |
| 35 to 44 Years | 170 (76.9%) | 51 (23.1%) |
| 45 to 54 Years | 170 (100.0%) | 0 (0.0%) |
| 55 to 64 Years | 241 (92.3%) | 20 (7.7%) |
| 65 to 74 Years | 193 (100.0%) | 0 (0.0%) |
| 75 Years and older | 52 (100.0%) | 0 (0.0%) |
| Total | 2,055 (94.2%) | 126 (5.8%) |
Health Insurance Coverage by Citizenship Status in Port Barre
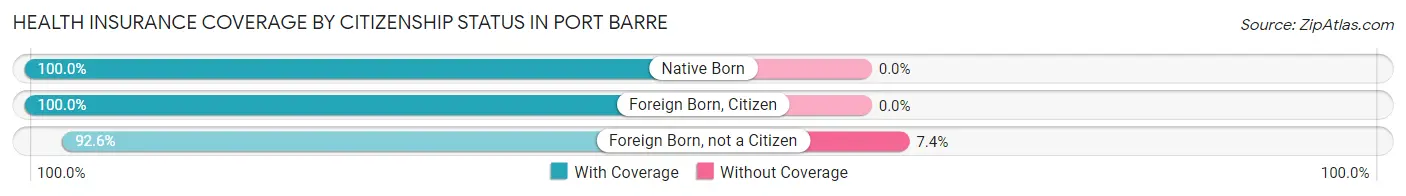
| Citizenship Status | With Coverage | Without Coverage |
| Native Born | 216 (100.0%) | 0 (0.0%) |
| Foreign Born, Citizen | 500 (100.0%) | 0 (0.0%) |
| Foreign Born, not a Citizen | 313 (92.6%) | 25 (7.4%) |
Health Insurance Coverage by Household Income in Port Barre
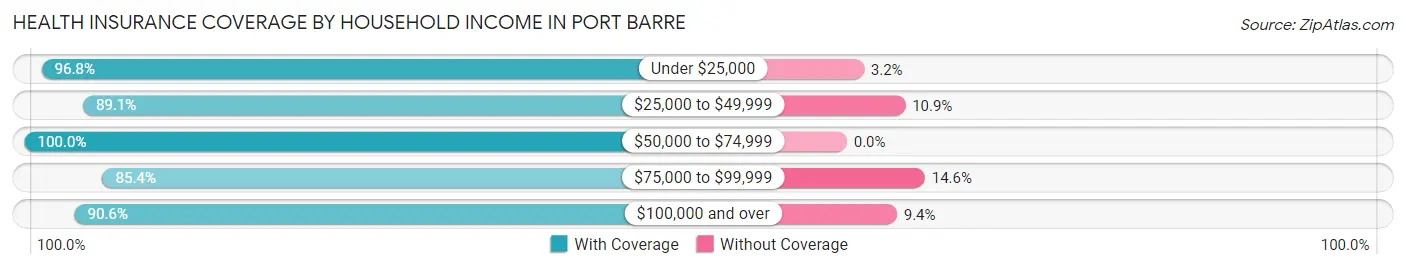
| Household Income | With Coverage | Without Coverage |
| Under $25,000 | 607 (96.8%) | 20 (3.2%) |
| $25,000 to $49,999 | 407 (89.1%) | 50 (10.9%) |
| $50,000 to $74,999 | 595 (100.0%) | 0 (0.0%) |
| $75,000 to $99,999 | 146 (85.4%) | 25 (14.6%) |
| $100,000 and over | 300 (90.6%) | 31 (9.4%) |
Public vs Private Health Insurance Coverage by Age in Port Barre
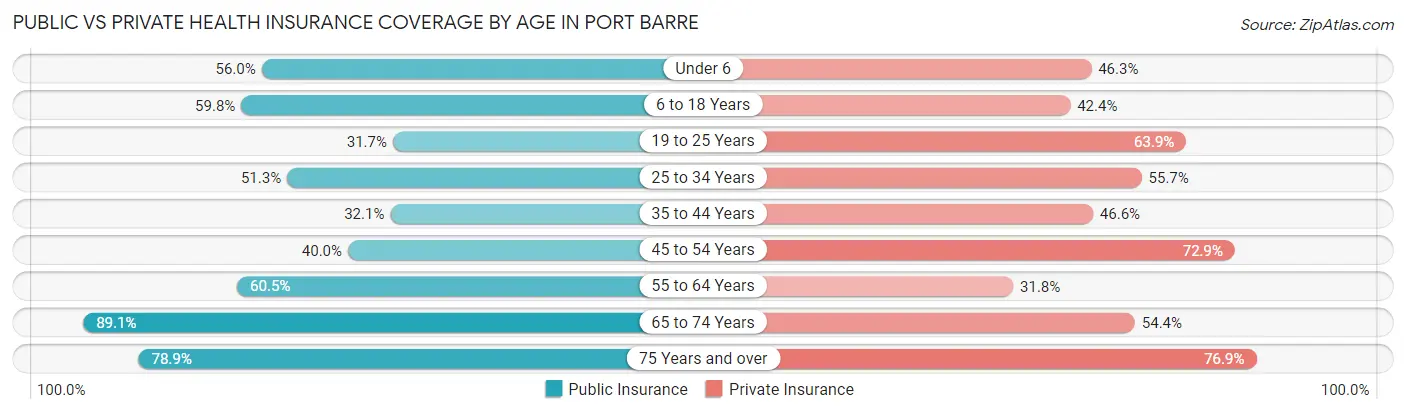
| Age Bracket | Public Insurance | Private Insurance |
| Under 6 | 121 (56.0%) | 100 (46.3%) |
| 6 to 18 Years | 299 (59.8%) | 212 (42.4%) |
| 19 to 25 Years | 107 (31.7%) | 216 (63.9%) |
| 25 to 34 Years | 118 (51.3%) | 128 (55.6%) |
| 35 to 44 Years | 71 (32.1%) | 103 (46.6%) |
| 45 to 54 Years | 68 (40.0%) | 124 (72.9%) |
| 55 to 64 Years | 158 (60.5%) | 83 (31.8%) |
| 65 to 74 Years | 172 (89.1%) | 105 (54.4%) |
| 75 Years and over | 41 (78.8%) | 40 (76.9%) |
| Total | 1,155 (53.0%) | 1,111 (50.9%) |
Disability Status by Sex by Age in Port Barre
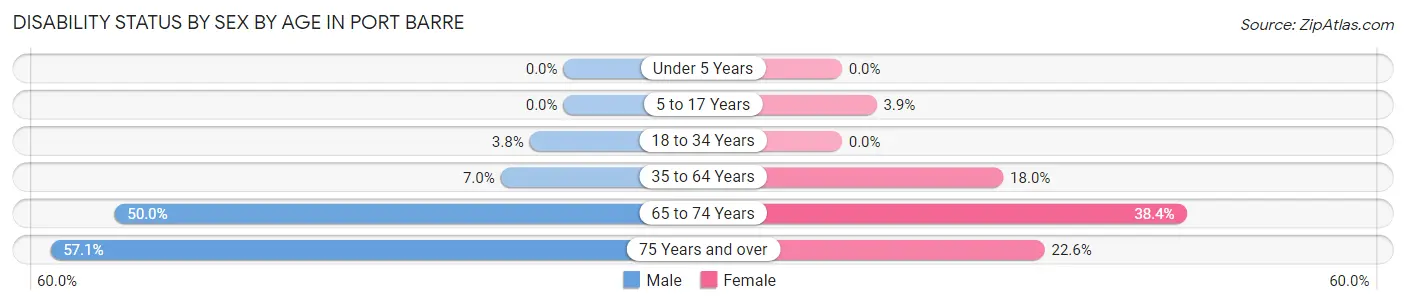
| Age Bracket | Male | Female |
| Under 5 Years | 0 (0.0%) | 0 (0.0%) |
| 5 to 17 Years | 0 (0.0%) | 8 (3.9%) |
| 18 to 34 Years | 10 (3.8%) | 0 (0.0%) |
| 35 to 64 Years | 16 (7.0%) | 76 (18.0%) |
| 65 to 74 Years | 47 (50.0%) | 38 (38.4%) |
| 75 Years and over | 12 (57.1%) | 7 (22.6%) |
Disability Class by Sex by Age in Port Barre
Disability Class: Hearing Difficulty
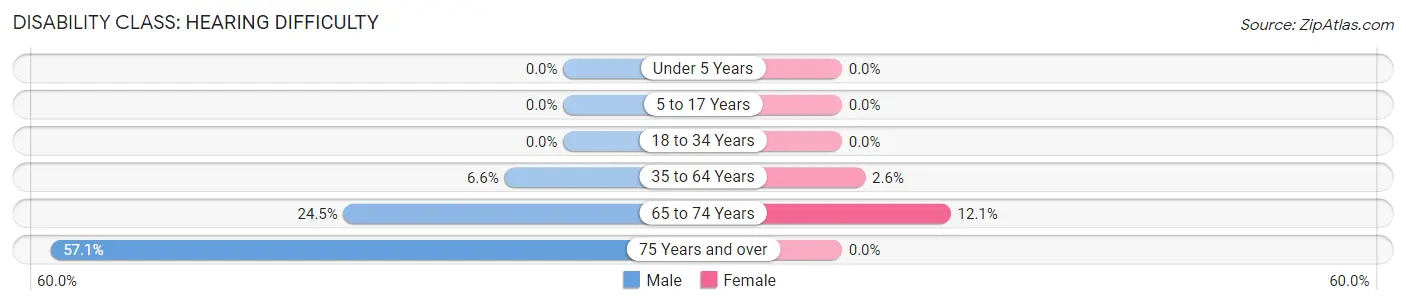
| Age Bracket | Male | Female |
| Under 5 Years | 0 (0.0%) | 0 (0.0%) |
| 5 to 17 Years | 0 (0.0%) | 0 (0.0%) |
| 18 to 34 Years | 0 (0.0%) | 0 (0.0%) |
| 35 to 64 Years | 15 (6.6%) | 11 (2.6%) |
| 65 to 74 Years | 23 (24.5%) | 12 (12.1%) |
| 75 Years and over | 12 (57.1%) | 0 (0.0%) |
Disability Class: Vision Difficulty
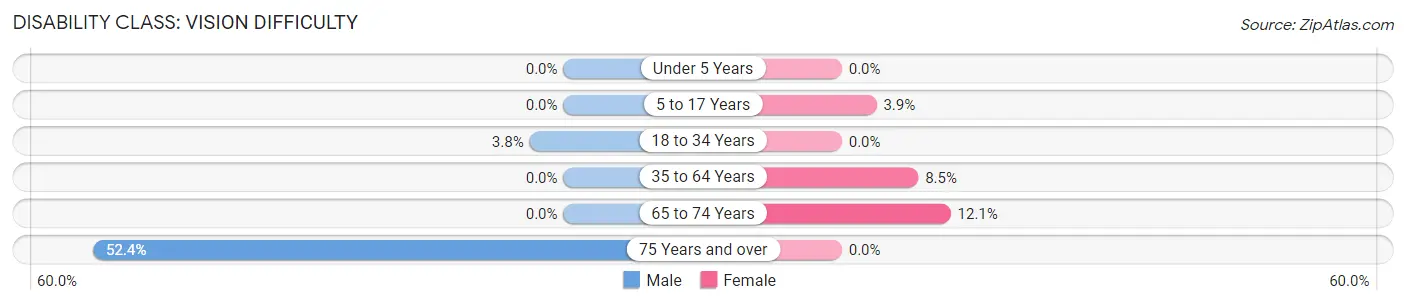
| Age Bracket | Male | Female |
| Under 5 Years | 0 (0.0%) | 0 (0.0%) |
| 5 to 17 Years | 0 (0.0%) | 8 (3.9%) |
| 18 to 34 Years | 10 (3.8%) | 0 (0.0%) |
| 35 to 64 Years | 0 (0.0%) | 36 (8.5%) |
| 65 to 74 Years | 0 (0.0%) | 12 (12.1%) |
| 75 Years and over | 11 (52.4%) | 0 (0.0%) |
Disability Class: Cognitive Difficulty
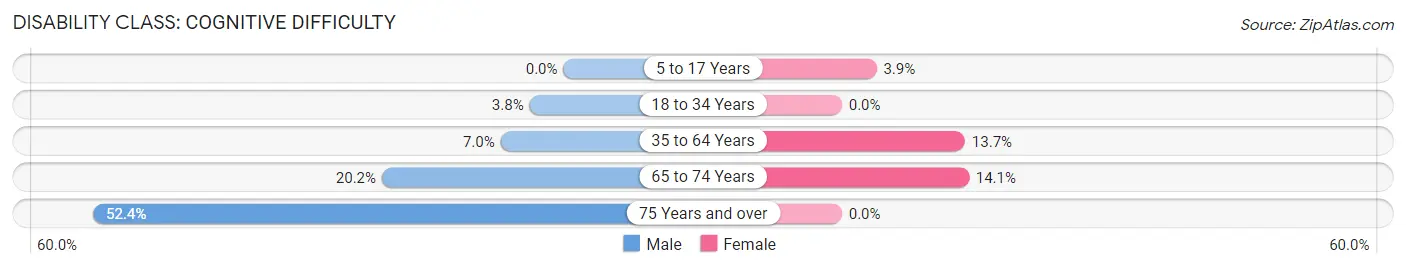
| Age Bracket | Male | Female |
| 5 to 17 Years | 0 (0.0%) | 8 (3.9%) |
| 18 to 34 Years | 10 (3.8%) | 0 (0.0%) |
| 35 to 64 Years | 16 (7.0%) | 58 (13.7%) |
| 65 to 74 Years | 19 (20.2%) | 14 (14.1%) |
| 75 Years and over | 11 (52.4%) | 0 (0.0%) |
Disability Class: Ambulatory Difficulty
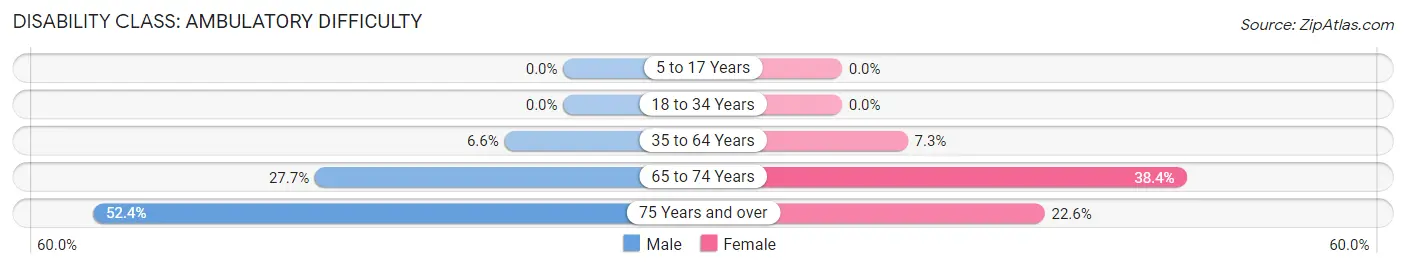
| Age Bracket | Male | Female |
| 5 to 17 Years | 0 (0.0%) | 0 (0.0%) |
| 18 to 34 Years | 0 (0.0%) | 0 (0.0%) |
| 35 to 64 Years | 15 (6.6%) | 31 (7.3%) |
| 65 to 74 Years | 26 (27.7%) | 38 (38.4%) |
| 75 Years and over | 11 (52.4%) | 7 (22.6%) |
Disability Class: Self-Care Difficulty
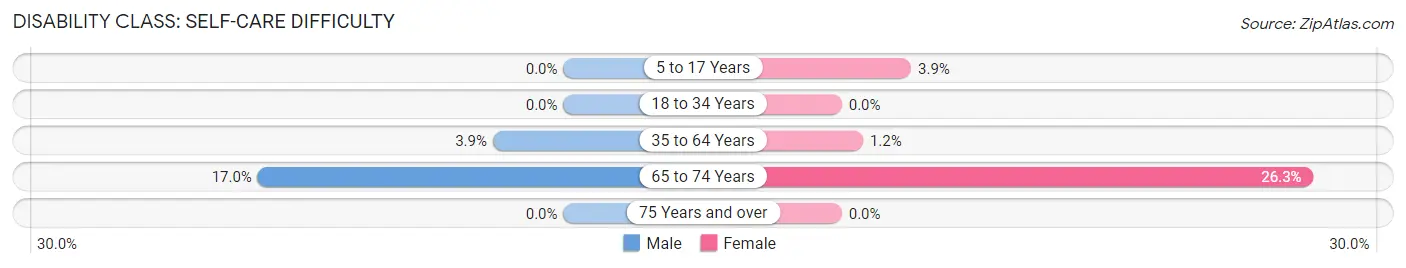
| Age Bracket | Male | Female |
| 5 to 17 Years | 0 (0.0%) | 8 (3.9%) |
| 18 to 34 Years | 0 (0.0%) | 0 (0.0%) |
| 35 to 64 Years | 9 (3.9%) | 5 (1.2%) |
| 65 to 74 Years | 16 (17.0%) | 26 (26.3%) |
| 75 Years and over | 0 (0.0%) | 0 (0.0%) |
Technology Access in Port Barre
Computing Device Access in Port Barre
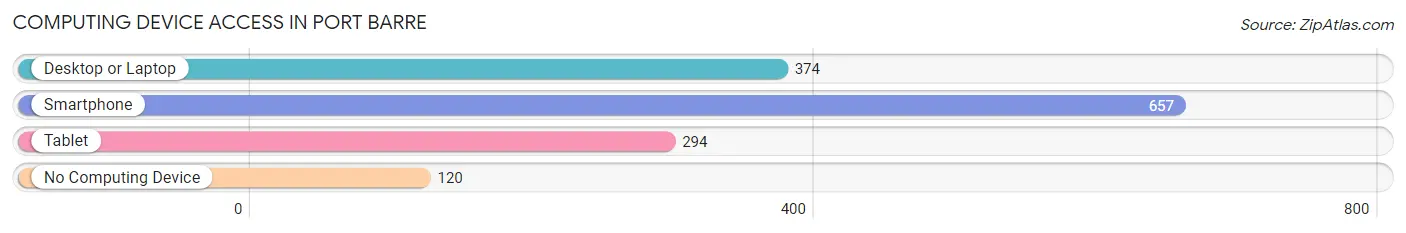
| Device Type | # Households | % Households |
| Desktop or Laptop | 374 | 45.6% |
| Smartphone | 657 | 80.1% |
| Tablet | 294 | 35.8% |
| No Computing Device | 120 | 14.6% |
| Total | 820 | 100.0% |
Internet Access in Port Barre
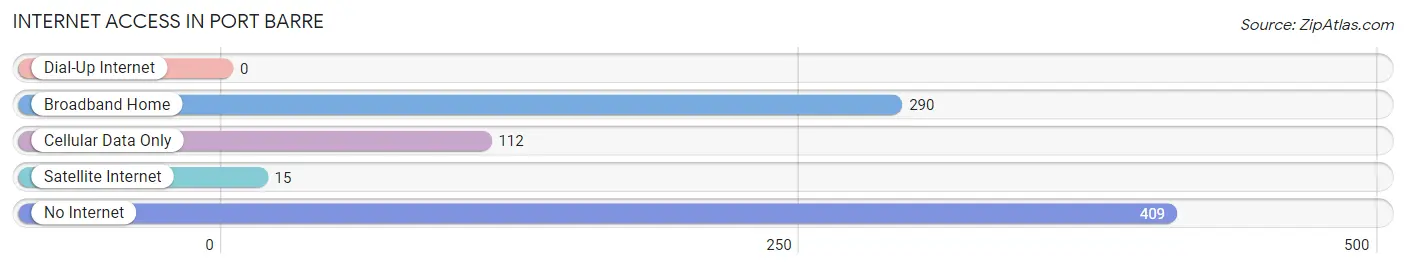
| Internet Type | # Households | % Households |
| Dial-Up Internet | 0 | 0.0% |
| Broadband Home | 290 | 35.4% |
| Cellular Data Only | 112 | 13.7% |
| Satellite Internet | 15 | 1.8% |
| No Internet | 409 | 49.9% |
| Total | 820 | 100.0% |
Port Barre Summary
Port Barre is a small town located in St. Landry Parish, Louisiana. It is situated on the banks of Bayou Courtableau, approximately 10 miles south of Opelousas and 25 miles north of Lafayette. The town has a population of 2,239 people, according to the 2010 census.
History
Port Barre was founded in 1883 by a group of French-speaking settlers from the nearby town of Grand Coteau. The town was named after the nearby port of Barre, which was used to transport goods from the nearby bayou. The town was incorporated in 1884 and quickly became a hub for the local lumber industry. The town was also home to a number of small businesses, including a general store, a blacksmith shop, and a sawmill.
In the early 1900s, the town began to experience a period of growth and prosperity. The lumber industry continued to thrive, and the town was home to a number of new businesses, including a bank, a hotel, and a movie theater. The town also became a popular destination for tourists, who came to enjoy the nearby bayou and the town’s picturesque setting.
In the 1950s, the town began to experience a period of decline. The lumber industry began to decline, and the town’s population began to dwindle. In the 1970s, the town began to experience a period of revitalization. The town was home to a number of new businesses, including a grocery store, a hardware store, and a restaurant. The town also began to attract new residents, and the population began to grow again.
Geography
Port Barre is located in St. Landry Parish, Louisiana. The town is situated on the banks of Bayou Courtableau, approximately 10 miles south of Opelousas and 25 miles north of Lafayette. The town is located in the humid subtropical climate zone, and the average temperature in the summer is around 90 degrees Fahrenheit. The town is also home to a number of parks and recreational areas, including the Port Barre City Park and the Bayou Courtableau State Wildlife Management Area.
Economy
The economy of Port Barre is largely based on the lumber industry. The town is home to a number of sawmills and lumber yards, and the town’s economy is heavily reliant on the lumber industry. The town is also home to a number of small businesses, including a grocery store, a hardware store, and a restaurant. The town is also home to a number of manufacturing companies, including a furniture manufacturer and a plastics manufacturer.
Demographics
According to the 2010 census, the population of Port Barre is 2,239 people. The town is predominantly white, with a population that is 79.3% white, 17.2% African American, and 2.5% Hispanic or Latino. The median household income in the town is $31,250, and the median home value is $90,000. The town has a poverty rate of 22.3%, and the unemployment rate is 6.2%.
Conclusion
Port Barre is a small town located in St. Landry Parish, Louisiana. The town was founded in 1883 and has a population of 2,239 people, according to the 2010 census. The town’s economy is largely based on the lumber industry, and the town is also home to a number of small businesses. The town is predominantly white, with a population that is 79.3% white, 17.2% African American, and 2.5% Hispanic or Latino. The median household income in the town is $31,250, and the median home value is $90,000.
Common Questions
What is Per Capita Income in Port Barre?
Per Capita income in Port Barre is $17,306.
What is the Median Family Income in Port Barre?
Median Family Income in Port Barre is $48,107.
What is the Median Household income in Port Barre?
Median Household Income in Port Barre is $37,000.
What is Income or Wage Gap in Port Barre?
Income or Wage Gap in Port Barre is 44.4%.
Women in Port Barre earn 55.6 cents for every dollar earned by a man.
What is Inequality or Gini Index in Port Barre?
Inequality or Gini Index in Port Barre is 0.44.
What is the Total Population of Port Barre?
Total Population of Port Barre is 2,181.
What is the Total Male Population of Port Barre?
Total Male Population of Port Barre is 1,041.
What is the Total Female Population of Port Barre?
Total Female Population of Port Barre is 1,140.
What is the Ratio of Males per 100 Females in Port Barre?
There are 91.32 Males per 100 Females in Port Barre.
What is the Ratio of Females per 100 Males in Port Barre?
There are 109.51 Females per 100 Males in Port Barre.
What is the Median Population Age in Port Barre?
Median Population Age in Port Barre is 27.1 Years.
What is the Average Family Size in Port Barre
Average Family Size in Port Barre is 3.2 People.
What is the Average Household Size in Port Barre
Average Household Size in Port Barre is 2.7 People.
How Large is the Labor Force in Port Barre?
There are 870 People in the Labor Forcein in Port Barre.
What is the Percentage of People in the Labor Force in Port Barre?
51.8% of People are in the Labor Force in Port Barre.
What is the Unemployment Rate in Port Barre?
Unemployment Rate in Port Barre is 7.1%.