Richwood, LA Map & Demographics
Richwood Map
Richwood Overview
$9,788
PER CAPITA INCOME
$32,772
AVG FAMILY INCOME
$28,594
AVG HOUSEHOLD INCOME
43.2%
WAGE / INCOME GAP [ % ]
56.8¢/ $1
WAGE / INCOME GAP [ $ ]
0.44
INEQUALITY / GINI INDEX
3,847
TOTAL POPULATION
2,711
MALE POPULATION
1,136
FEMALE POPULATION
238.64
MALES / 100 FEMALES
41.90
FEMALES / 100 MALES
35.6
MEDIAN AGE
3.7
AVG FAMILY SIZE
2.7
AVG HOUSEHOLD SIZE
732
LABOR FORCE [ PEOPLE ]
22.4%
PERCENT IN LABOR FORCE
12.0%
UNEMPLOYMENT RATE
Richwood Area Codes
Income in Richwood
Income Overview in Richwood
Per Capita Income in Richwood is $9,788, while median incomes of families and households are $32,772 and $28,594 respectively.
| Characteristic | Number | Measure |
| Per Capita Income | 3,847 | $9,788 |
| Median Family Income | 419 | $32,772 |
| Mean Family Income | 419 | $39,885 |
| Median Household Income | 687 | $28,594 |
| Mean Household Income | 687 | $35,863 |
| Income Deficit | 419 | $0 |
| Wage / Income Gap (%) | 3,847 | 43.17% |
| Wage / Income Gap ($) | 3,847 | 56.83¢ per $1 |
| Gini / Inequality Index | 3,847 | 0.44 |
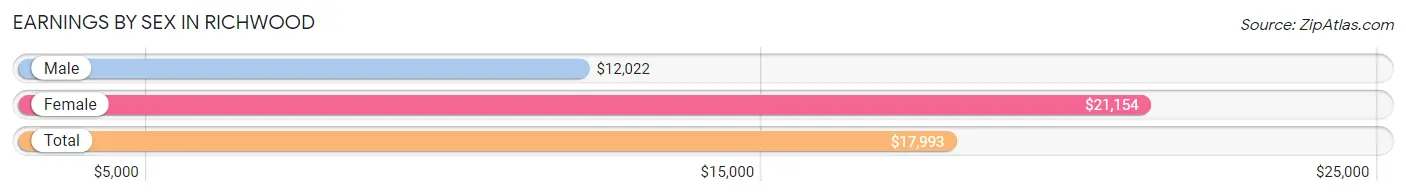
Earnings by Sex in Richwood
Average Earnings in Richwood are $17,993, $12,022 for men and $21,154 for women, a difference of 43.2%.
| Sex | Number | Average Earnings |
| Male | 603 (58.2%) | $12,022 |
| Female | 434 (41.8%) | $21,154 |
| Total | 1,037 (100.0%) | $17,993 |
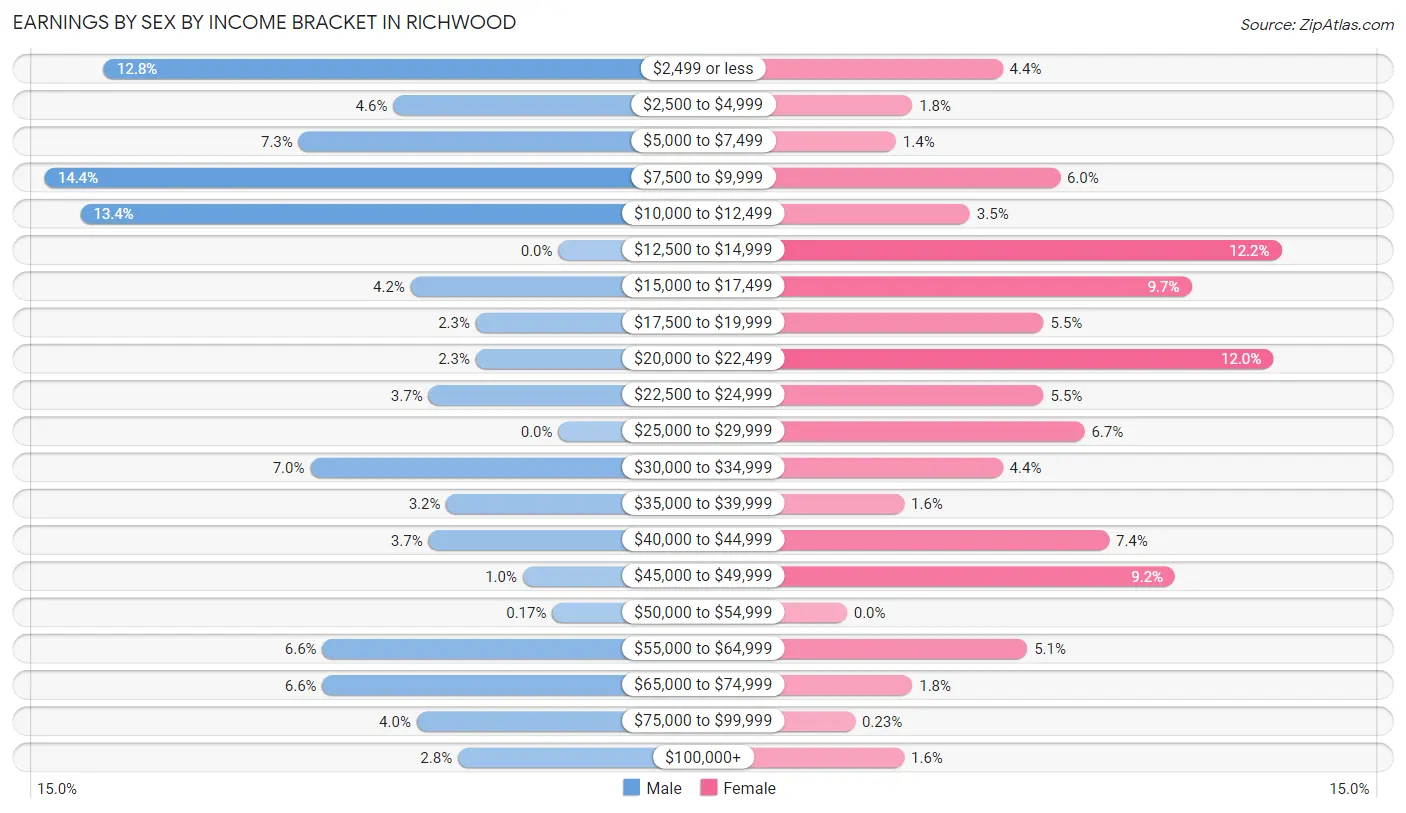
Earnings by Sex by Income Bracket in Richwood
The most common earnings brackets in Richwood are $7,500 to $9,999 for men (87 | 14.4%) and $12,500 to $14,999 for women (53 | 12.2%).
| Income | Male | Female |
| $2,499 or less | 77 (12.8%) | 19 (4.4%) |
| $2,500 to $4,999 | 28 (4.6%) | 8 (1.8%) |
| $5,000 to $7,499 | 44 (7.3%) | 6 (1.4%) |
| $7,500 to $9,999 | 87 (14.4%) | 26 (6.0%) |
| $10,000 to $12,499 | 81 (13.4%) | 15 (3.5%) |
| $12,500 to $14,999 | 0 (0.0%) | 53 (12.2%) |
| $15,000 to $17,499 | 25 (4.2%) | 42 (9.7%) |
| $17,500 to $19,999 | 14 (2.3%) | 24 (5.5%) |
| $20,000 to $22,499 | 14 (2.3%) | 52 (12.0%) |
| $22,500 to $24,999 | 22 (3.6%) | 24 (5.5%) |
| $25,000 to $29,999 | 0 (0.0%) | 29 (6.7%) |
| $30,000 to $34,999 | 42 (7.0%) | 19 (4.4%) |
| $35,000 to $39,999 | 19 (3.2%) | 7 (1.6%) |
| $40,000 to $44,999 | 22 (3.6%) | 32 (7.4%) |
| $45,000 to $49,999 | 6 (1.0%) | 40 (9.2%) |
| $50,000 to $54,999 | 1 (0.2%) | 0 (0.0%) |
| $55,000 to $64,999 | 40 (6.6%) | 22 (5.1%) |
| $65,000 to $74,999 | 40 (6.6%) | 8 (1.8%) |
| $75,000 to $99,999 | 24 (4.0%) | 1 (0.2%) |
| $100,000+ | 17 (2.8%) | 7 (1.6%) |
| Total | 603 (100.0%) | 434 (100.0%) |
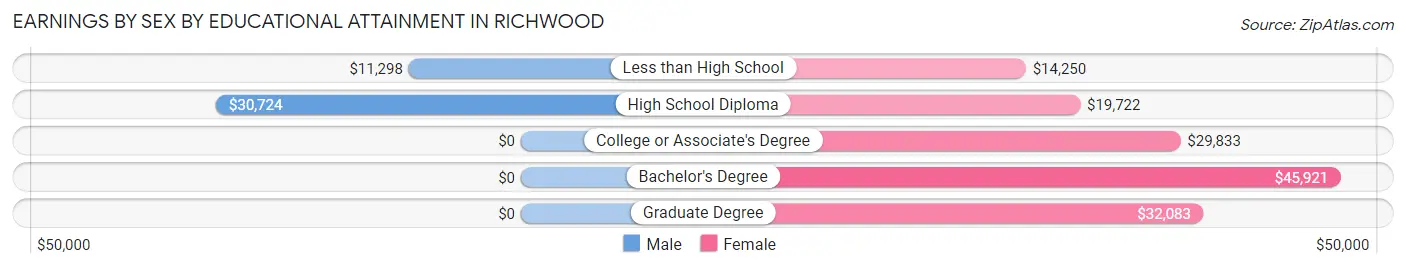
Earnings by Sex by Educational Attainment in Richwood
| Educational Attainment | Male Income | Female Income |
| Less than High School | $11,298 | $14,250 |
| High School Diploma | $30,724 | $19,722 |
| College or Associate's Degree | - | - |
| Bachelor's Degree | - | - |
| Graduate Degree | - | - |
| Total | - | - |
Family Income in Richwood
Family Income Brackets in Richwood
According to the Richwood family income data, there are 85 families falling into the $35,000 to $49,999 income range, which is the most common income bracket and makes up 20.3% of all families.
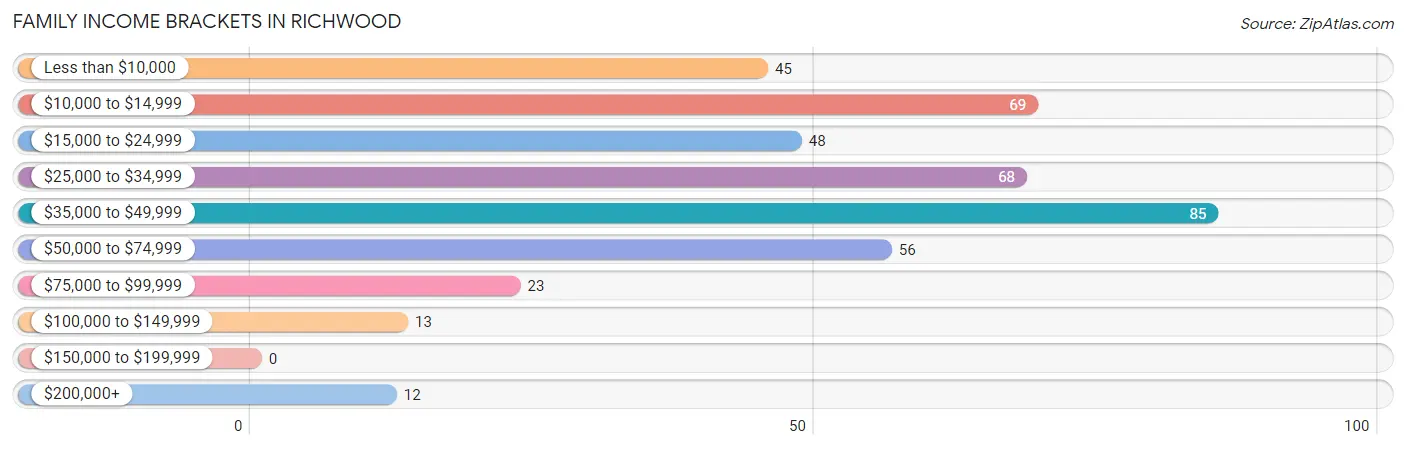
| Income Bracket | # Families | % Families |
| Less than $10,000 | 45 | 10.7% |
| $10,000 to $14,999 | 69 | 16.5% |
| $15,000 to $24,999 | 48 | 11.5% |
| $25,000 to $34,999 | 68 | 16.2% |
| $35,000 to $49,999 | 85 | 20.3% |
| $50,000 to $74,999 | 56 | 13.4% |
| $75,000 to $99,999 | 23 | 5.5% |
| $100,000 to $149,999 | 13 | 3.1% |
| $150,000 to $199,999 | 0 | 0.0% |
| $200,000+ | 12 | 2.9% |
Family Income by Famaliy Size in Richwood
3-person families (71 | 17.0%) account for the highest median family income in Richwood with $40,208 per family, while 2-person families (114 | 27.2%) have the highest median income of $18,296 per family member.
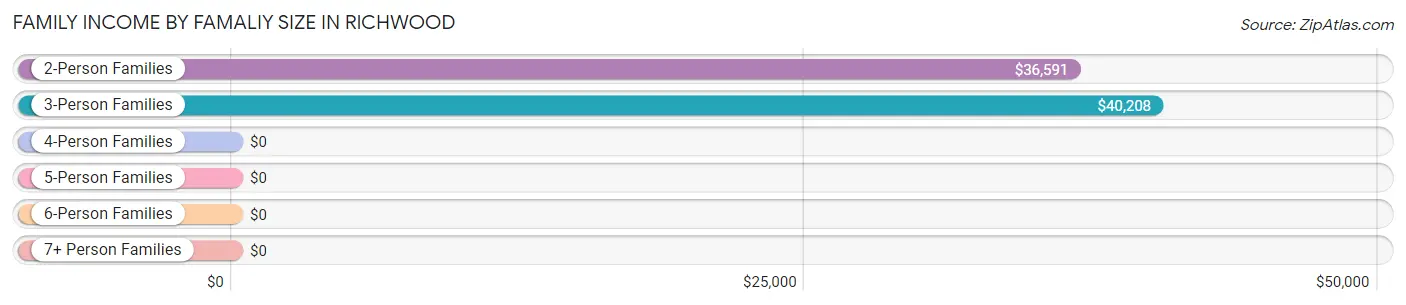
| Income Bracket | # Families | Median Income |
| 2-Person Families | 114 (27.2%) | $36,591 |
| 3-Person Families | 71 (17.0%) | $40,208 |
| 4-Person Families | 167 (39.9%) | $0 |
| 5-Person Families | 60 (14.3%) | $0 |
| 6-Person Families | 7 (1.7%) | $0 |
| 7+ Person Families | 0 (0.0%) | $0 |
| Total | 419 (100.0%) | $32,772 |
Family Income by Number of Earners in Richwood
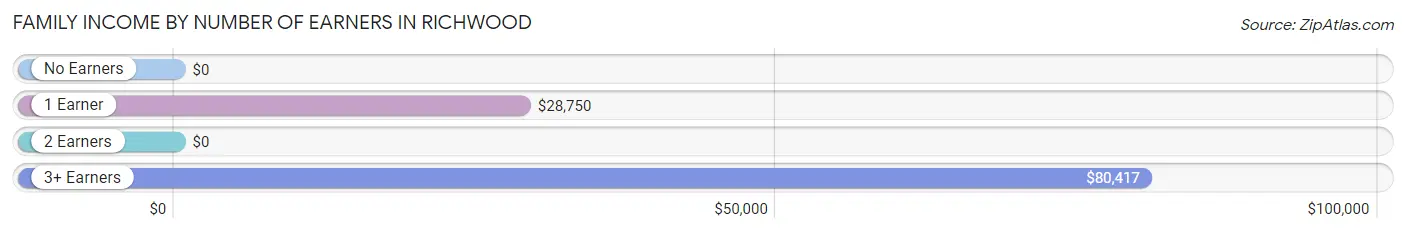
| Number of Earners | # Families | Median Income |
| No Earners | 96 (22.9%) | $0 |
| 1 Earner | 247 (59.0%) | $28,750 |
| 2 Earners | 61 (14.6%) | $0 |
| 3+ Earners | 15 (3.6%) | $80,417 |
| Total | 419 (100.0%) | $32,772 |
Household Income in Richwood
Household Income Brackets in Richwood
With 147 households falling in the category, the $35,000 to $49,999 income range is the most frequent in Richwood, accounting for 21.4% of all households.
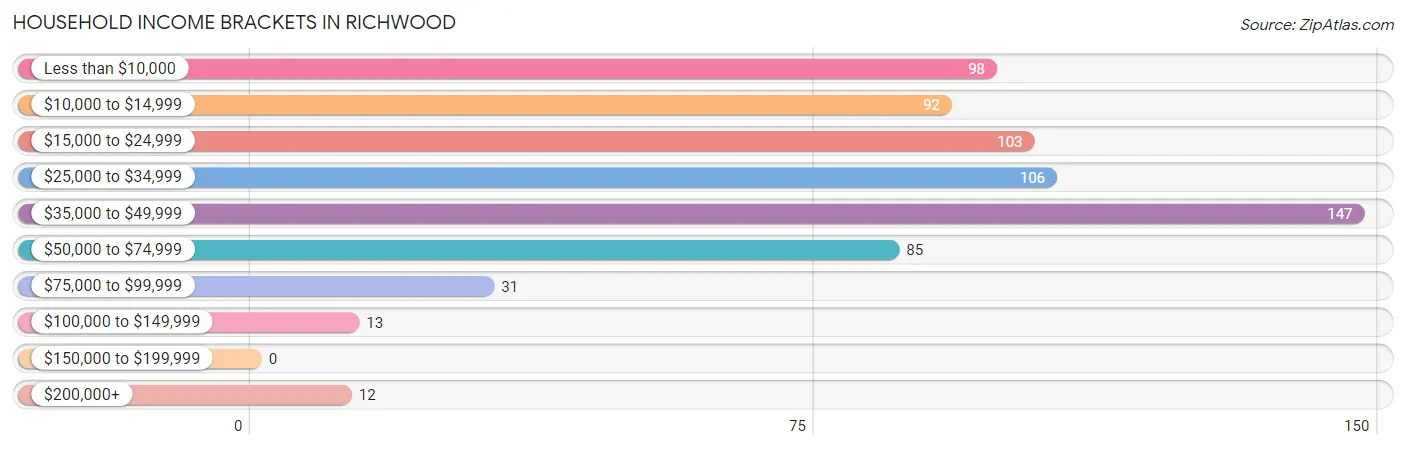
| Income Bracket | # Households | % Households |
| Less than $10,000 | 98 | 14.3% |
| $10,000 to $14,999 | 92 | 13.4% |
| $15,000 to $24,999 | 103 | 15.0% |
| $25,000 to $34,999 | 106 | 15.4% |
| $35,000 to $49,999 | 147 | 21.4% |
| $50,000 to $74,999 | 85 | 12.4% |
| $75,000 to $99,999 | 31 | 4.5% |
| $100,000 to $149,999 | 13 | 1.9% |
| $150,000 to $199,999 | 0 | 0.0% |
| $200,000+ | 12 | 1.7% |
Household Income by Householder Age in Richwood
The median household income in Richwood is $28,594, with the highest median household income of $34,760 found in the 45 to 64 years age bracket for the primary householder. A total of 209 households (30.4%) fall into this category. Meanwhile, the 15 to 24 years age bracket for the primary householder has the lowest median household income of $0, with 29 households (4.2%) in this group.
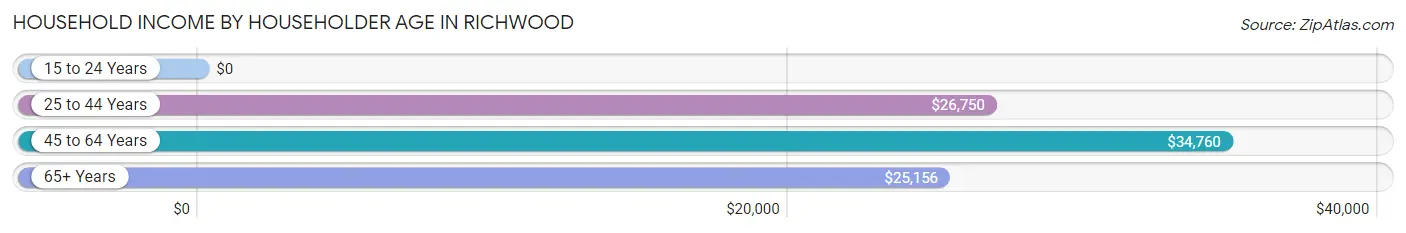
| Income Bracket | # Households | Median Income |
| 15 to 24 Years | 29 (4.2%) | $0 |
| 25 to 44 Years | 298 (43.4%) | $26,750 |
| 45 to 64 Years | 209 (30.4%) | $34,760 |
| 65+ Years | 151 (22.0%) | $25,156 |
| Total | 687 (100.0%) | $28,594 |
Poverty in Richwood
Income Below Poverty by Sex and Age in Richwood
With 39.5% poverty level for males and 49.3% for females among the residents of Richwood, 6 to 11 year old males and 12 to 14 year old females are the most vulnerable to poverty, with 68 males (81.9%) and 48 females (100.0%) in their respective age groups living below the poverty level.
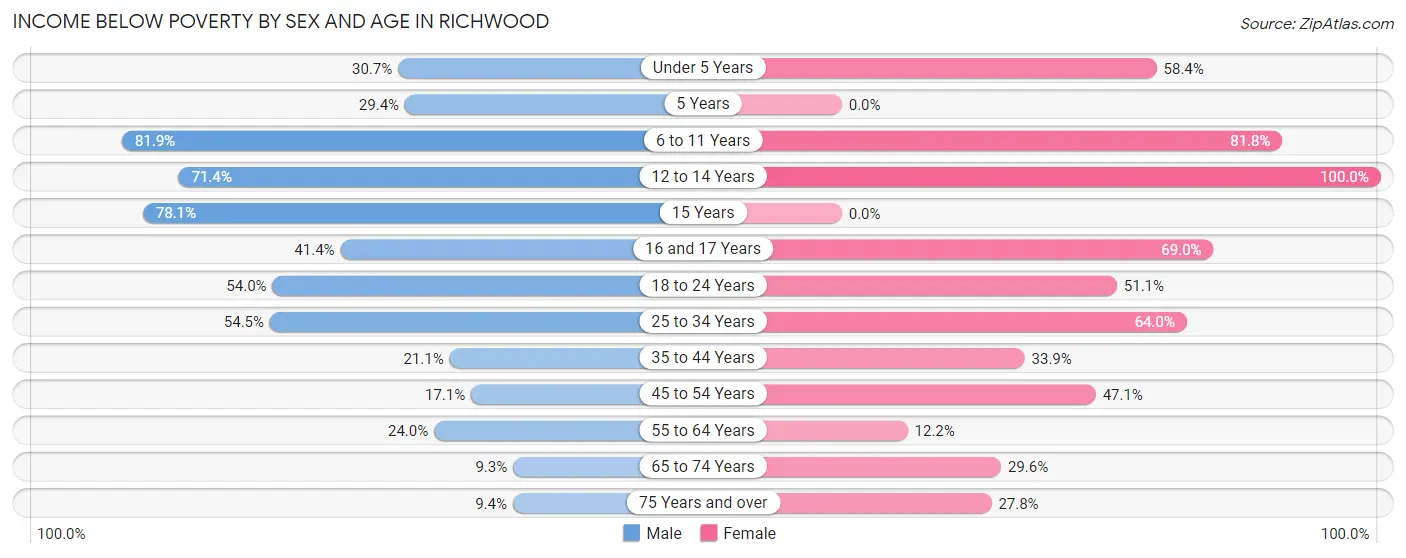
| Age Bracket | Male | Female |
| Under 5 Years | 27 (30.7%) | 52 (58.4%) |
| 5 Years | 5 (29.4%) | 0 (0.0%) |
| 6 to 11 Years | 68 (81.9%) | 139 (81.8%) |
| 12 to 14 Years | 10 (71.4%) | 48 (100.0%) |
| 15 Years | 32 (78.0%) | 0 (0.0%) |
| 16 and 17 Years | 12 (41.4%) | 20 (69.0%) |
| 18 to 24 Years | 27 (54.0%) | 48 (51.1%) |
| 25 to 34 Years | 67 (54.5%) | 89 (64.0%) |
| 35 to 44 Years | 15 (21.1%) | 57 (33.9%) |
| 45 to 54 Years | 12 (17.1%) | 41 (47.1%) |
| 55 to 64 Years | 18 (24.0%) | 16 (12.2%) |
| 65 to 74 Years | 7 (9.3%) | 26 (29.5%) |
| 75 Years and over | 3 (9.4%) | 10 (27.8%) |
| Total | 303 (39.5%) | 546 (49.3%) |
Income Above Poverty by Sex and Age in Richwood
According to the poverty statistics in Richwood, males aged 65 to 74 years and females aged 15 years are the age groups that are most secure financially, with 90.7% of males and 100.0% of females in these age groups living above the poverty line.
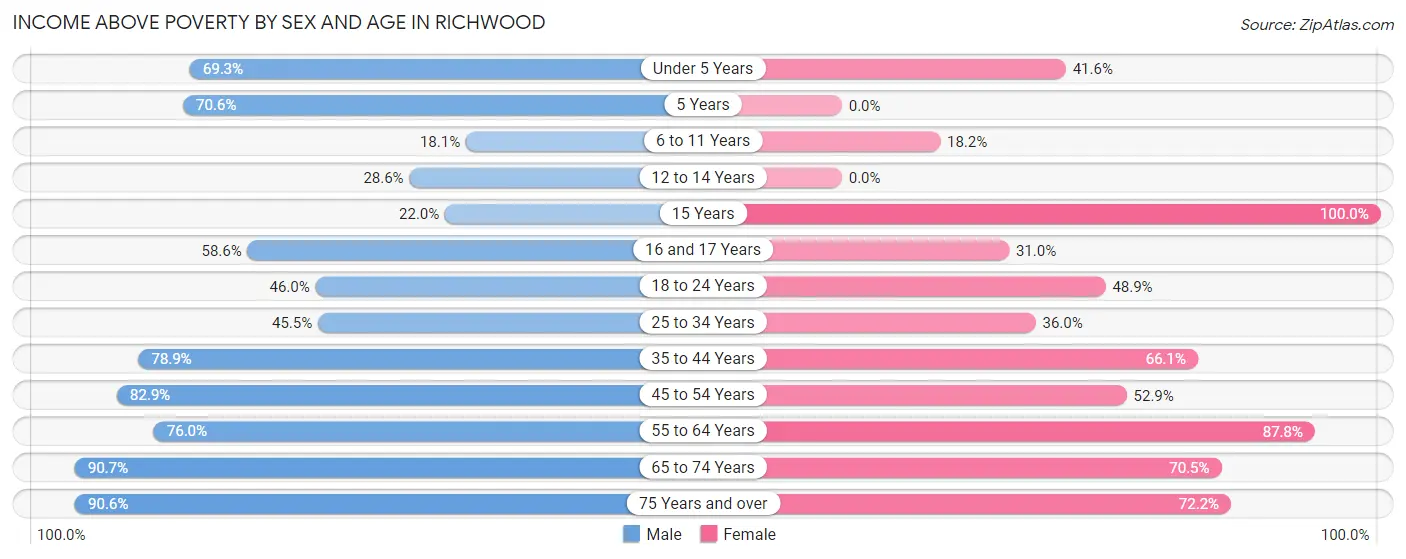
| Age Bracket | Male | Female |
| Under 5 Years | 61 (69.3%) | 37 (41.6%) |
| 5 Years | 12 (70.6%) | 0 (0.0%) |
| 6 to 11 Years | 15 (18.1%) | 31 (18.2%) |
| 12 to 14 Years | 4 (28.6%) | 0 (0.0%) |
| 15 Years | 9 (22.0%) | 29 (100.0%) |
| 16 and 17 Years | 17 (58.6%) | 9 (31.0%) |
| 18 to 24 Years | 23 (46.0%) | 46 (48.9%) |
| 25 to 34 Years | 56 (45.5%) | 50 (36.0%) |
| 35 to 44 Years | 56 (78.9%) | 111 (66.1%) |
| 45 to 54 Years | 58 (82.9%) | 46 (52.9%) |
| 55 to 64 Years | 57 (76.0%) | 115 (87.8%) |
| 65 to 74 Years | 68 (90.7%) | 62 (70.5%) |
| 75 Years and over | 29 (90.6%) | 26 (72.2%) |
| Total | 465 (60.6%) | 562 (50.7%) |
Income Below Poverty Among Married-Couple Families in Richwood
The poverty statistics for married-couple families in Richwood show that 6.7% or 4 of the total 60 families live below the poverty line. Families with no children have the highest poverty rate of 7.7%, comprising of 4 families. On the other hand, families with 1 or 2 children have the lowest poverty rate of 0.0%, which includes 0 families.
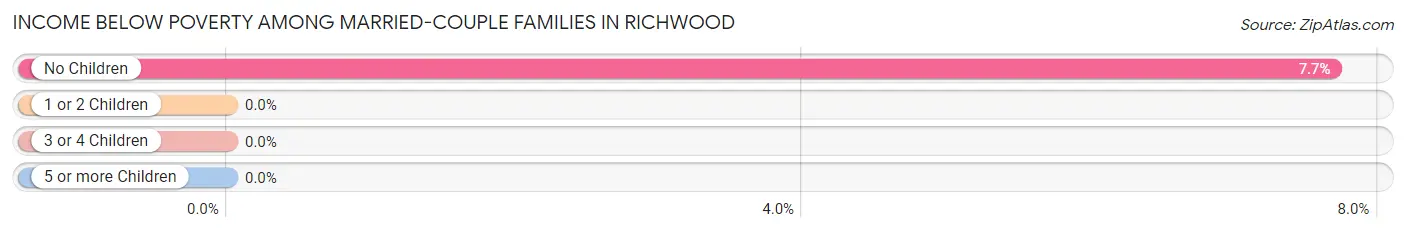
| Children | Above Poverty | Below Poverty |
| No Children | 48 (92.3%) | 4 (7.7%) |
| 1 or 2 Children | 8 (100.0%) | 0 (0.0%) |
| 3 or 4 Children | 0 (0.0%) | 0 (0.0%) |
| 5 or more Children | 0 (0.0%) | 0 (0.0%) |
| Total | 56 (93.3%) | 4 (6.7%) |
Income Below Poverty Among Single-Parent Households in Richwood
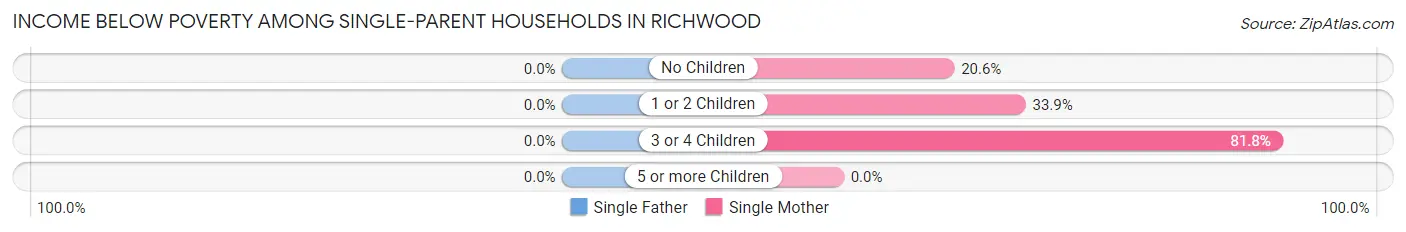
| Children | Single Father | Single Mother |
| No Children | 0 (0.0%) | 14 (20.6%) |
| 1 or 2 Children | 0 (0.0%) | 42 (33.9%) |
| 3 or 4 Children | 0 (0.0%) | 121 (81.8%) |
| 5 or more Children | 0 (0.0%) | 0 (0.0%) |
| Total | 0 (0.0%) | 177 (52.1%) |
Income Below Poverty Among Married-Couple vs Single-Parent Households in Richwood
The poverty data for Richwood shows that 4 of the married-couple family households (6.7%) and 177 of the single-parent households (49.3%) are living below the poverty level. Within the married-couple family households, those with no children have the highest poverty rate, with 4 households (7.7%) falling below the poverty line. Among the single-parent households, those with 3 or 4 children have the highest poverty rate, with 121 household (81.8%) living below poverty.
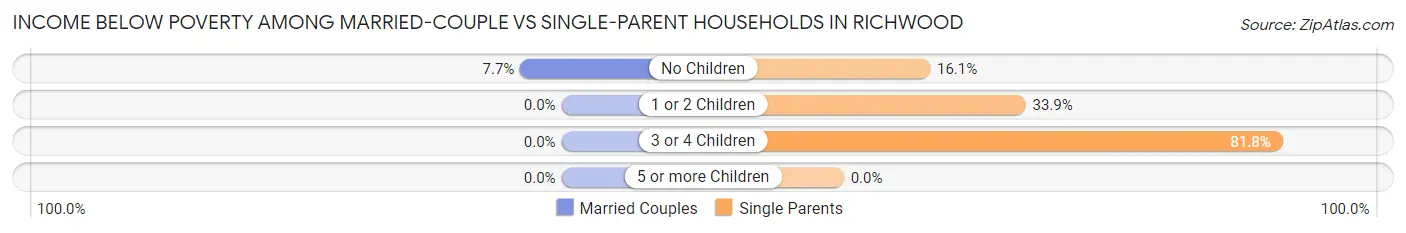
| Children | Married-Couple Families | Single-Parent Households |
| No Children | 4 (7.7%) | 14 (16.1%) |
| 1 or 2 Children | 0 (0.0%) | 42 (33.9%) |
| 3 or 4 Children | 0 (0.0%) | 121 (81.8%) |
| 5 or more Children | 0 (0.0%) | 0 (0.0%) |
| Total | 4 (6.7%) | 177 (49.3%) |
Race in Richwood
The most populous races in Richwood are Black / African American (2,835 | 73.7%), White / Caucasian (804 | 20.9%), and Hispanic or Latino (154 | 4.0%).
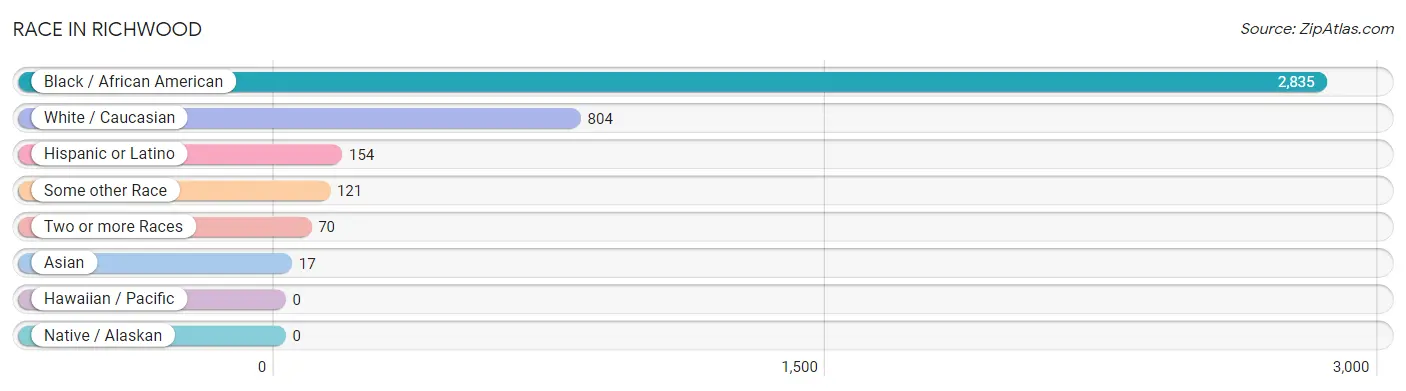
| Race | # Population | % Population |
| Asian | 17 | 0.4% |
| Black / African American | 2,835 | 73.7% |
| Hawaiian / Pacific | 0 | 0.0% |
| Hispanic or Latino | 154 | 4.0% |
| Native / Alaskan | 0 | 0.0% |
| White / Caucasian | 804 | 20.9% |
| Two or more Races | 70 | 1.8% |
| Some other Race | 121 | 3.2% |
| Total | 3,847 | 100.0% |
Ancestry in Richwood
The most populous ancestries reported in Richwood are American (540 | 14.0%), Mexican (128 | 3.3%), Italian (83 | 2.2%), French (76 | 2.0%), and English (62 | 1.6%), together accounting for 23.1% of all Richwood residents.
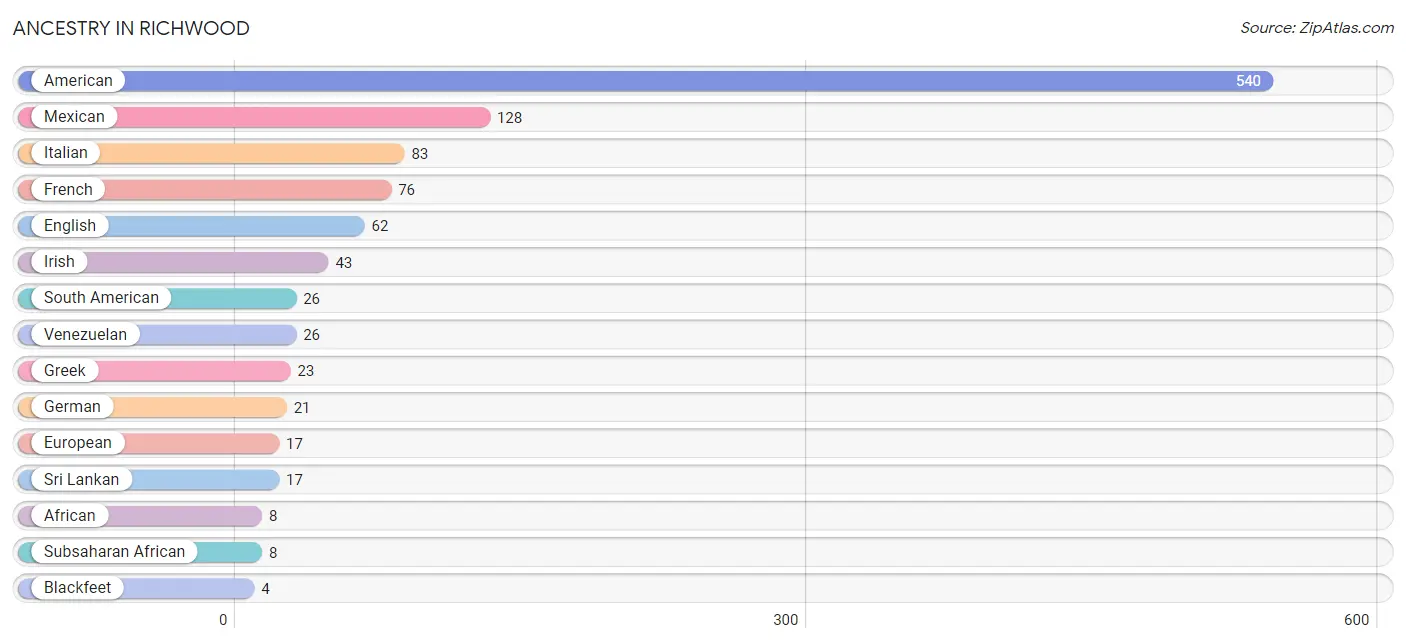
| Ancestry | # Population | % Population |
| African | 8 | 0.2% |
| American | 540 | 14.0% |
| Blackfeet | 4 | 0.1% |
| Comanche | 4 | 0.1% |
| English | 62 | 1.6% |
| European | 17 | 0.4% |
| French | 76 | 2.0% |
| German | 21 | 0.5% |
| Greek | 23 | 0.6% |
| Irish | 43 | 1.1% |
| Italian | 83 | 2.2% |
| Mexican | 128 | 3.3% |
| South American | 26 | 0.7% |
| Sri Lankan | 17 | 0.4% |
| Subsaharan African | 8 | 0.2% |
| Venezuelan | 26 | 0.7% | View All 16 Rows |
Immigrants in Richwood
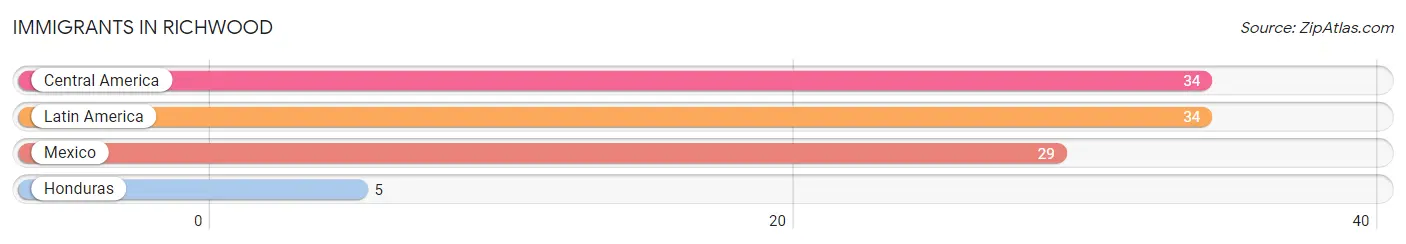
The most numerous immigrant groups reported in Richwood came from Central America (34 | 0.9%), Latin America (34 | 0.9%), Mexico (29 | 0.7%), and Honduras (5 | 0.1%), together accounting for 2.6% of all Richwood residents.
| Immigration Origin | # Population | % Population |
| Central America | 34 | 0.9% |
| Honduras | 5 | 0.1% |
| Latin America | 34 | 0.9% |
| Mexico | 29 | 0.7% | View All 4 Rows |
Sex and Age in Richwood
Sex and Age in Richwood
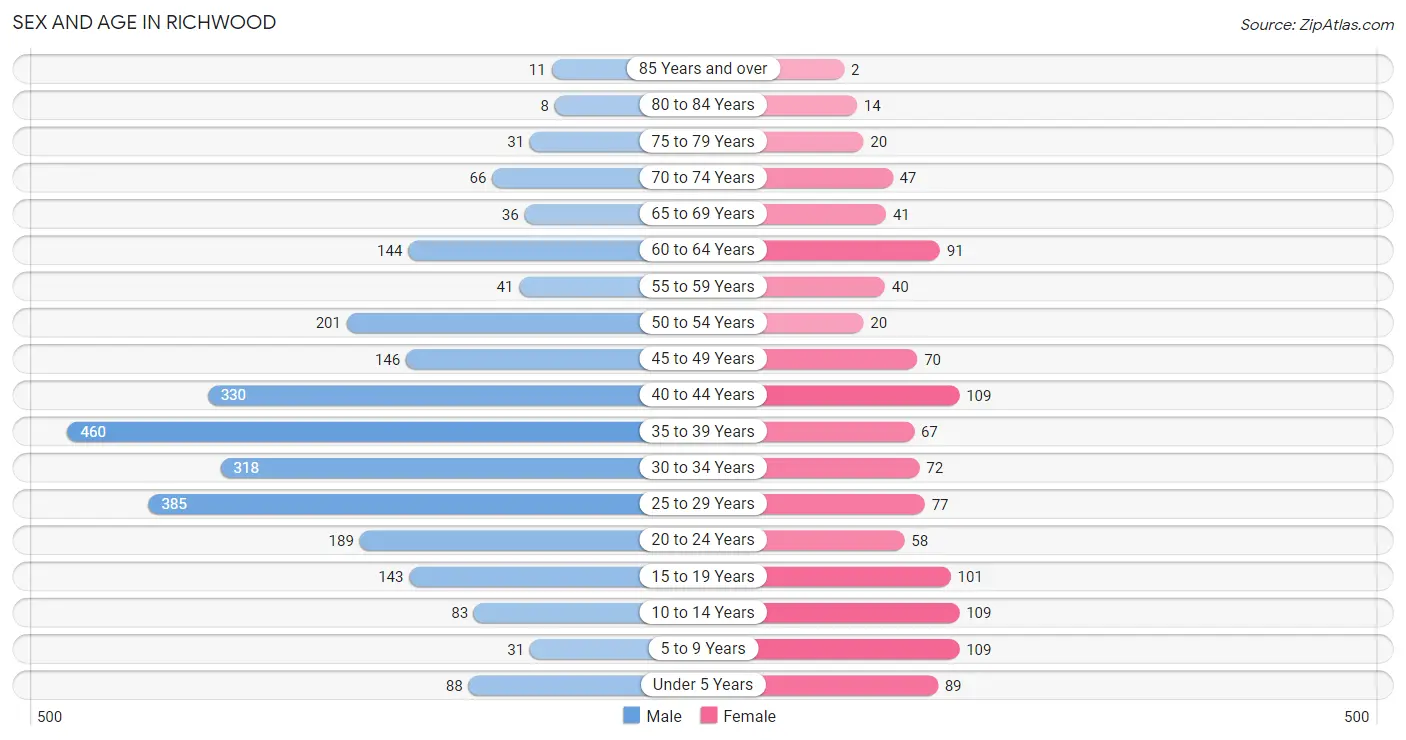
The most populous age groups in Richwood are 35 to 39 Years (460 | 17.0%) for men and 5 to 9 Years (109 | 9.6%) for women.
| Age Bracket | Male | Female |
| Under 5 Years | 88 (3.3%) | 89 (7.8%) |
| 5 to 9 Years | 31 (1.1%) | 109 (9.6%) |
| 10 to 14 Years | 83 (3.1%) | 109 (9.6%) |
| 15 to 19 Years | 143 (5.3%) | 101 (8.9%) |
| 20 to 24 Years | 189 (7.0%) | 58 (5.1%) |
| 25 to 29 Years | 385 (14.2%) | 77 (6.8%) |
| 30 to 34 Years | 318 (11.7%) | 72 (6.3%) |
| 35 to 39 Years | 460 (17.0%) | 67 (5.9%) |
| 40 to 44 Years | 330 (12.2%) | 109 (9.6%) |
| 45 to 49 Years | 146 (5.4%) | 70 (6.2%) |
| 50 to 54 Years | 201 (7.4%) | 20 (1.8%) |
| 55 to 59 Years | 41 (1.5%) | 40 (3.5%) |
| 60 to 64 Years | 144 (5.3%) | 91 (8.0%) |
| 65 to 69 Years | 36 (1.3%) | 41 (3.6%) |
| 70 to 74 Years | 66 (2.4%) | 47 (4.1%) |
| 75 to 79 Years | 31 (1.1%) | 20 (1.8%) |
| 80 to 84 Years | 8 (0.3%) | 14 (1.2%) |
| 85 Years and over | 11 (0.4%) | 2 (0.2%) |
| Total | 2,711 (100.0%) | 1,136 (100.0%) |
Families and Households in Richwood
Median Family Size in Richwood
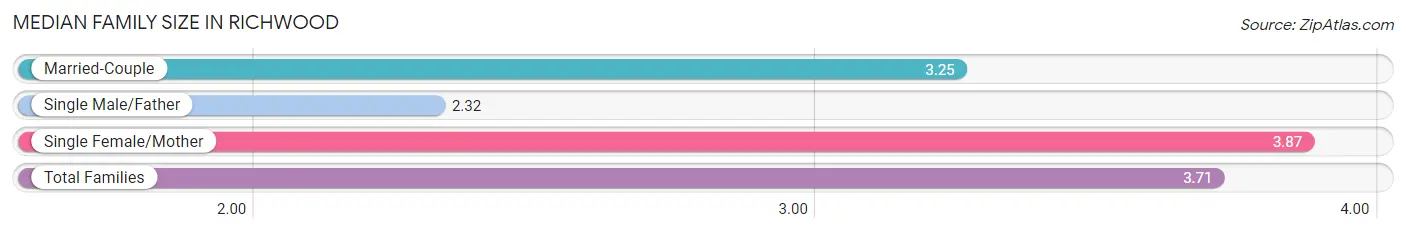
The median family size in Richwood is 3.71 persons per family, with single female/mother families (340 | 81.1%) accounting for the largest median family size of 3.87 persons per family. On the other hand, single male/father families (19 | 4.5%) represent the smallest median family size with 2.32 persons per family.
| Family Type | # Families | Family Size |
| Married-Couple | 60 (14.3%) | 3.25 |
| Single Male/Father | 19 (4.5%) | 2.32 |
| Single Female/Mother | 340 (81.1%) | 3.87 |
| Total Families | 419 (100.0%) | 3.71 |
Median Household Size in Richwood
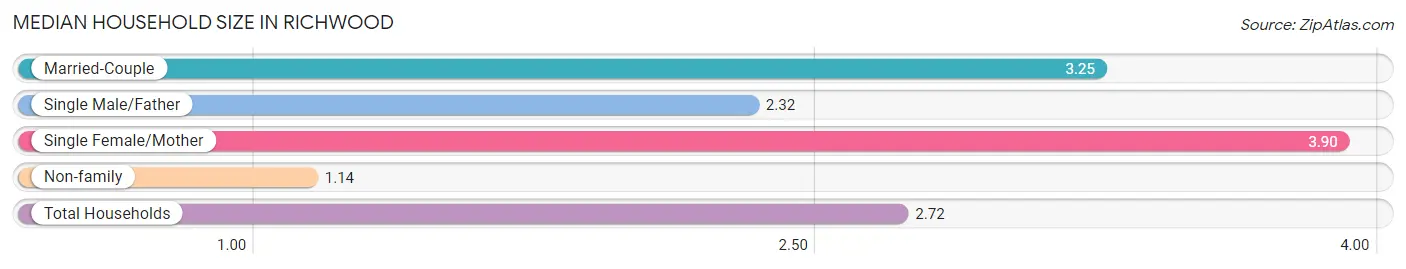
The median household size in Richwood is 2.72 persons per household, with single female/mother households (340 | 49.5%) accounting for the largest median household size of 3.9 persons per household. non-family households (268 | 39.0%) represent the smallest median household size with 1.14 persons per household.
| Household Type | # Households | Household Size |
| Married-Couple | 60 (8.7%) | 3.25 |
| Single Male/Father | 19 (2.8%) | 2.32 |
| Single Female/Mother | 340 (49.5%) | 3.90 |
| Non-family | 268 (39.0%) | 1.14 |
| Total Households | 687 (100.0%) | 2.72 |
Household Size by Marriage Status in Richwood
Out of a total of 687 households in Richwood, 419 (61.0%) are family households, while 268 (39.0%) are nonfamily households. The most numerous type of family households are 4-person households, comprising 170, and the most common type of nonfamily households are 1-person households, comprising 237.
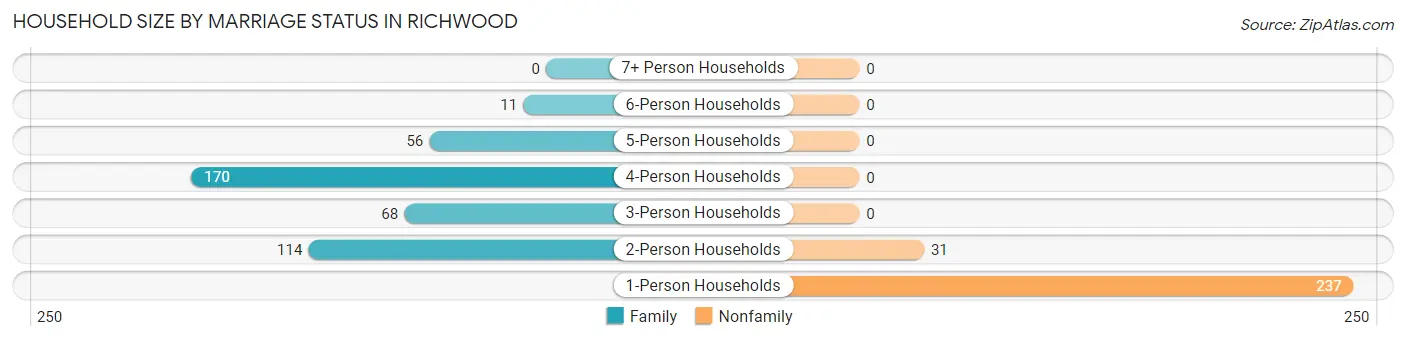
| Household Size | Family Households | Nonfamily Households |
| 1-Person Households | - | 237 (34.5%) |
| 2-Person Households | 114 (16.6%) | 31 (4.5%) |
| 3-Person Households | 68 (9.9%) | 0 (0.0%) |
| 4-Person Households | 170 (24.7%) | 0 (0.0%) |
| 5-Person Households | 56 (8.2%) | 0 (0.0%) |
| 6-Person Households | 11 (1.6%) | 0 (0.0%) |
| 7+ Person Households | 0 (0.0%) | 0 (0.0%) |
| Total | 419 (61.0%) | 268 (39.0%) |
Female Fertility in Richwood
Fertility by Age in Richwood
Average fertility rate in Richwood is 92.0 births per 1,000 women. Women in the age bracket of 20 to 34 years have the highest fertility rate with 164.0 births per 1,000 women. Women in the age bracket of 20 to 34 years acount for 66.7% of all women with births.
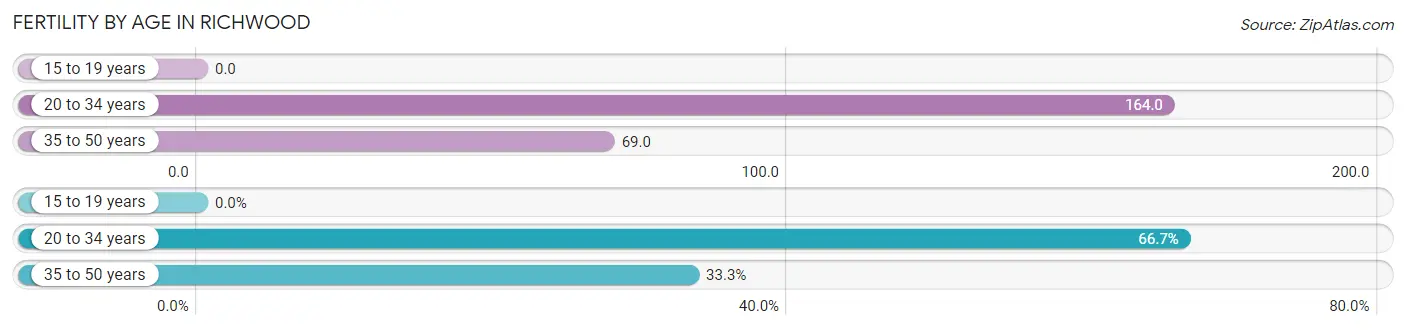
| Age Bracket | Women with Births | Births / 1,000 Women |
| 15 to 19 years | 0 (0.0%) | 0.0 |
| 20 to 34 years | 34 (66.7%) | 164.0 |
| 35 to 50 years | 17 (33.3%) | 69.0 |
| Total | 51 (100.0%) | 92.0 |
Fertility by Age by Marriage Status in Richwood
25.5% of women with births (51) in Richwood are married. The highest percentage of unmarried women with births falls into 20 to 34 years age bracket with 79.4% of them unmarried at the time of birth, while the lowest percentage of unmarried women with births belong to 35 to 50 years age bracket with 64.7% of them unmarried.
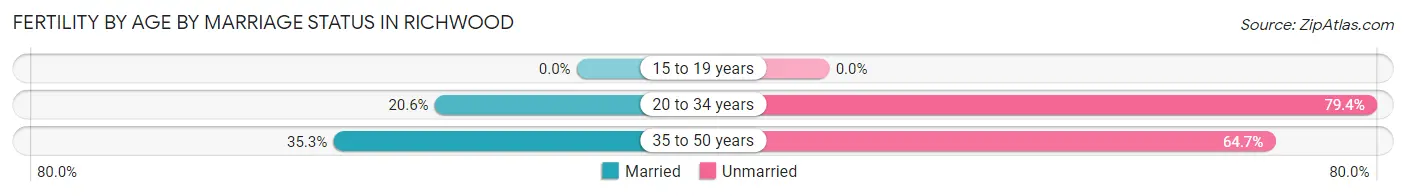
| Age Bracket | Married | Unmarried |
| 15 to 19 years | 0 (0.0%) | 0 (0.0%) |
| 20 to 34 years | 7 (20.6%) | 27 (79.4%) |
| 35 to 50 years | 6 (35.3%) | 11 (64.7%) |
| Total | 13 (25.5%) | 38 (74.5%) |
Fertility by Education in Richwood
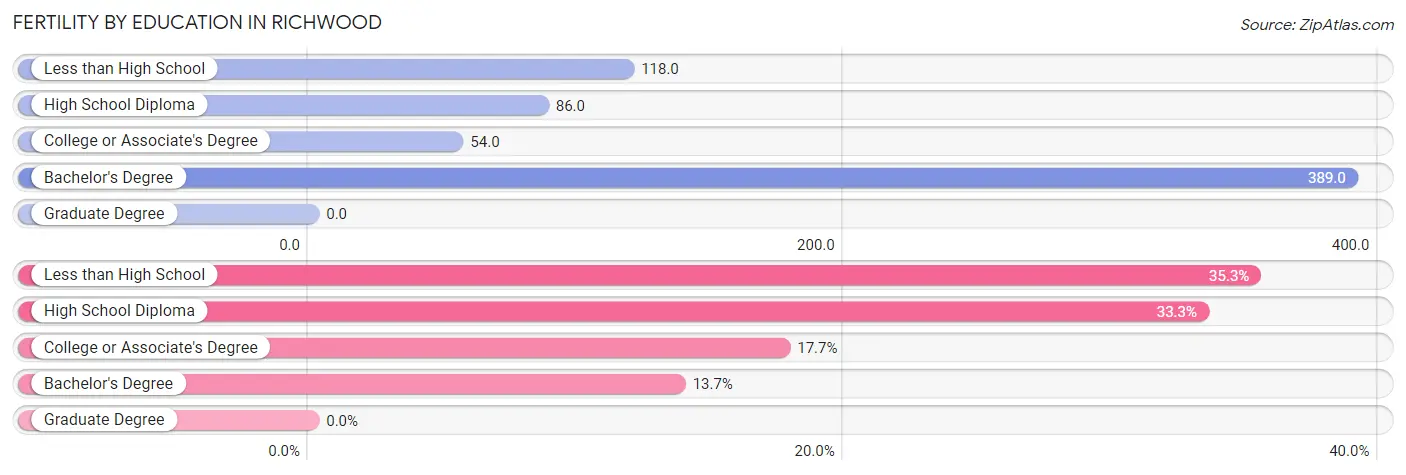
| Educational Attainment | Women with Births | Births / 1,000 Women |
| Less than High School | 18 (35.3%) | 118.0 |
| High School Diploma | 17 (33.3%) | 86.0 |
| College or Associate's Degree | 9 (17.6%) | 54.0 |
| Bachelor's Degree | 7 (13.7%) | 389.0 |
| Graduate Degree | 0 (0.0%) | 0.0 |
| Total | 51 (100.0%) | 92.0 |
Fertility by Education by Marriage Status in Richwood
74.5% of women with births in Richwood are unmarried. Women with the educational attainment of high school diploma are most likely to be married with 41.2% of them married at childbirth, while women with the educational attainment of college or associate's degree are least likely to be married with 100.0% of them unmarried at childbirth.
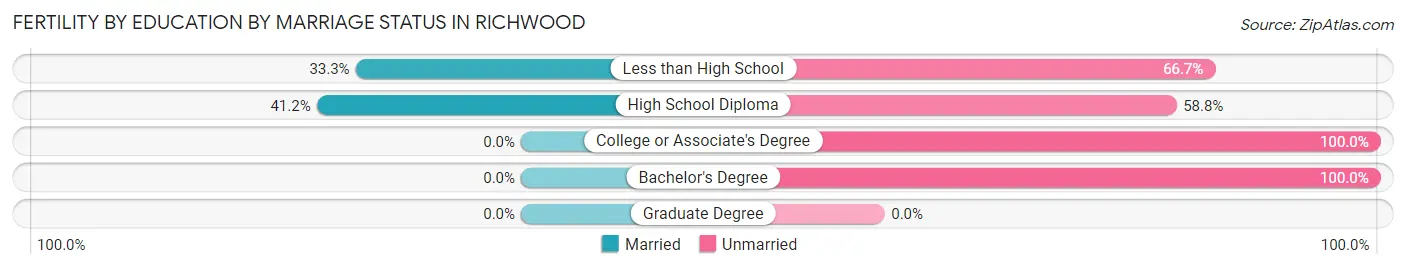
| Educational Attainment | Married | Unmarried |
| Less than High School | 6 (33.3%) | 12 (66.7%) |
| High School Diploma | 7 (41.2%) | 10 (58.8%) |
| College or Associate's Degree | 0 (0.0%) | 9 (100.0%) |
| Bachelor's Degree | 0 (0.0%) | 7 (100.0%) |
| Graduate Degree | 0 (0.0%) | 0 (0.0%) |
| Total | 13 (25.5%) | 38 (74.5%) |
Employment Characteristics in Richwood
Employment by Class of Employer in Richwood
Among the 625 employed individuals in Richwood, private company employees (470 | 75.2%), local government employees (42 | 6.7%), and state government employees (40 | 6.4%) make up the most common classes of employment.
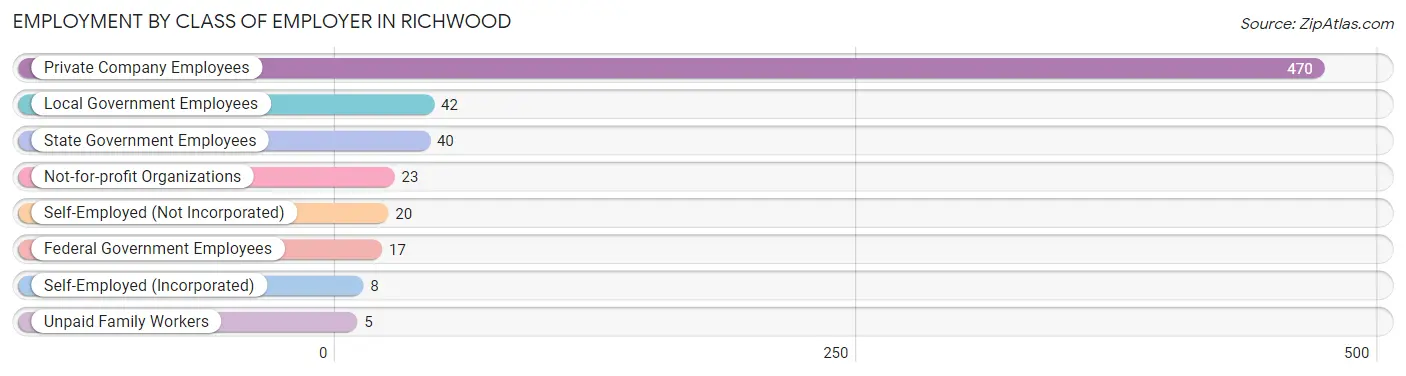
| Employer Class | # Employees | % Employees |
| Private Company Employees | 470 | 75.2% |
| Self-Employed (Incorporated) | 8 | 1.3% |
| Self-Employed (Not Incorporated) | 20 | 3.2% |
| Not-for-profit Organizations | 23 | 3.7% |
| Local Government Employees | 42 | 6.7% |
| State Government Employees | 40 | 6.4% |
| Federal Government Employees | 17 | 2.7% |
| Unpaid Family Workers | 5 | 0.8% |
| Total | 625 | 100.0% |
Employment Status by Age in Richwood
According to the labor force statistics for Richwood, out of the total population over 16 years of age (3,268), 22.4% or 732 individuals are in the labor force, with 12.0% or 88 of them unemployed. The age group with the highest labor force participation rate is 55 to 59 years, with 49.4% or 40 individuals in the labor force. Within the labor force, the 25 to 29 years age range has the highest percentage of unemployed individuals, with 27.7% or 44 of them being unemployed.
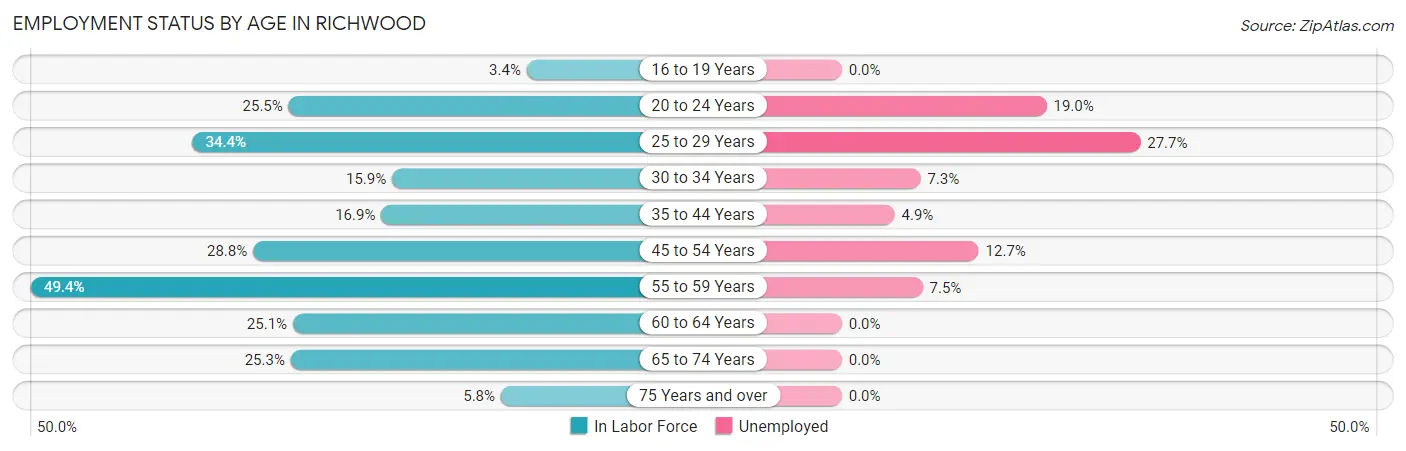
| Age Bracket | In Labor Force | Unemployed |
| 16 to 19 Years | 6 (3.4%) | 0 (0.0%) |
| 20 to 24 Years | 63 (25.5%) | 12 (19.0%) |
| 25 to 29 Years | 159 (34.4%) | 44 (27.7%) |
| 30 to 34 Years | 62 (15.9%) | 5 (7.3%) |
| 35 to 44 Years | 163 (16.9%) | 8 (4.9%) |
| 45 to 54 Years | 126 (28.8%) | 16 (12.7%) |
| 55 to 59 Years | 40 (49.4%) | 3 (7.5%) |
| 60 to 64 Years | 59 (25.1%) | 0 (0.0%) |
| 65 to 74 Years | 48 (25.3%) | 0 (0.0%) |
| 75 Years and over | 5 (5.8%) | 0 (0.0%) |
| Total | 732 (22.4%) | 88 (12.0%) |
Employment Status by Educational Attainment in Richwood
According to labor force statistics for Richwood, 23.7% of individuals (609) out of the total population between 25 and 64 years of age (2,571) are in the labor force, with 12.5% or 76 of them being unemployed. The group with the highest labor force participation rate are those with the educational attainment of bachelor's degree or higher, with 80.2% or 77 individuals in the labor force. Within the labor force, individuals with high school diploma education have the highest percentage of unemployment, with 19.4% or 55 of them being unemployed.
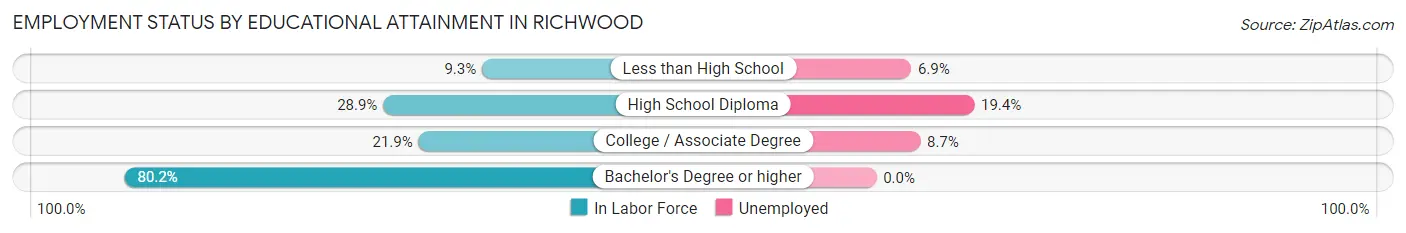
| Educational Attainment | In Labor Force | Unemployed |
| Less than High School | 58 (9.3%) | 43 (6.9%) |
| High School Diploma | 284 (28.9%) | 191 (19.4%) |
| College / Associate Degree | 190 (21.9%) | 75 (8.7%) |
| Bachelor's Degree or higher | 77 (80.2%) | 0 (0.0%) |
| Total | 609 (23.7%) | 321 (12.5%) |
Employment Occupations by Sex in Richwood
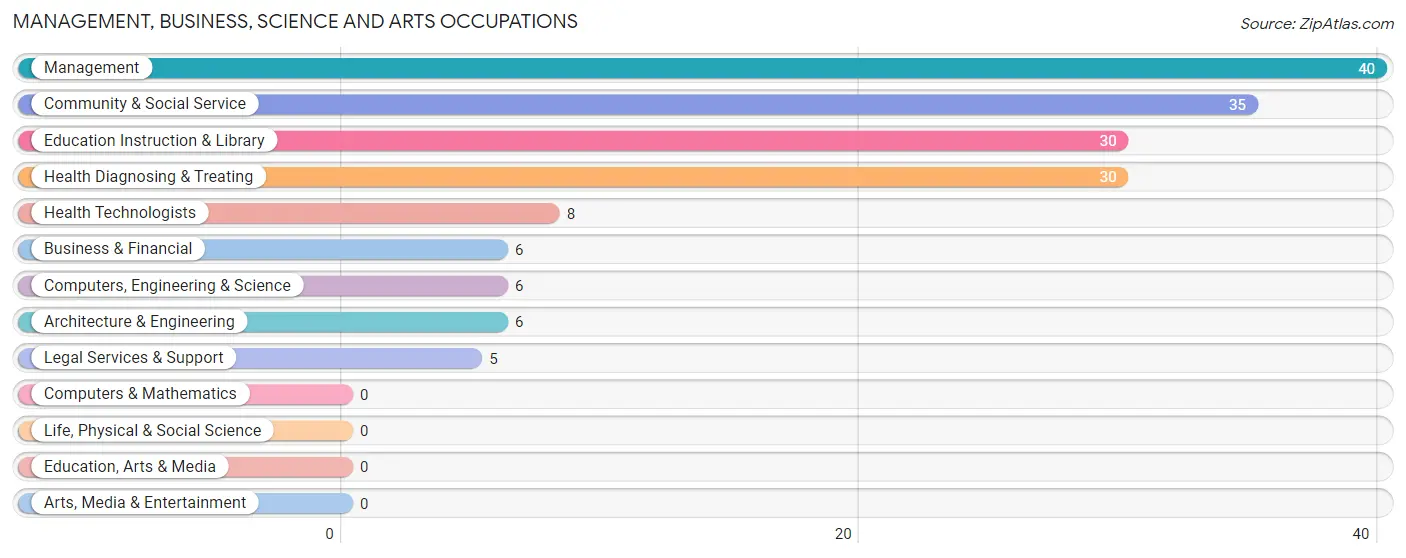
Management, Business, Science and Arts Occupations
The most common Management, Business, Science and Arts occupations in Richwood are Management (40 | 6.3%), Community & Social Service (35 | 5.5%), Education Instruction & Library (30 | 4.7%), Health Diagnosing & Treating (30 | 4.7%), and Health Technologists (8 | 1.3%).
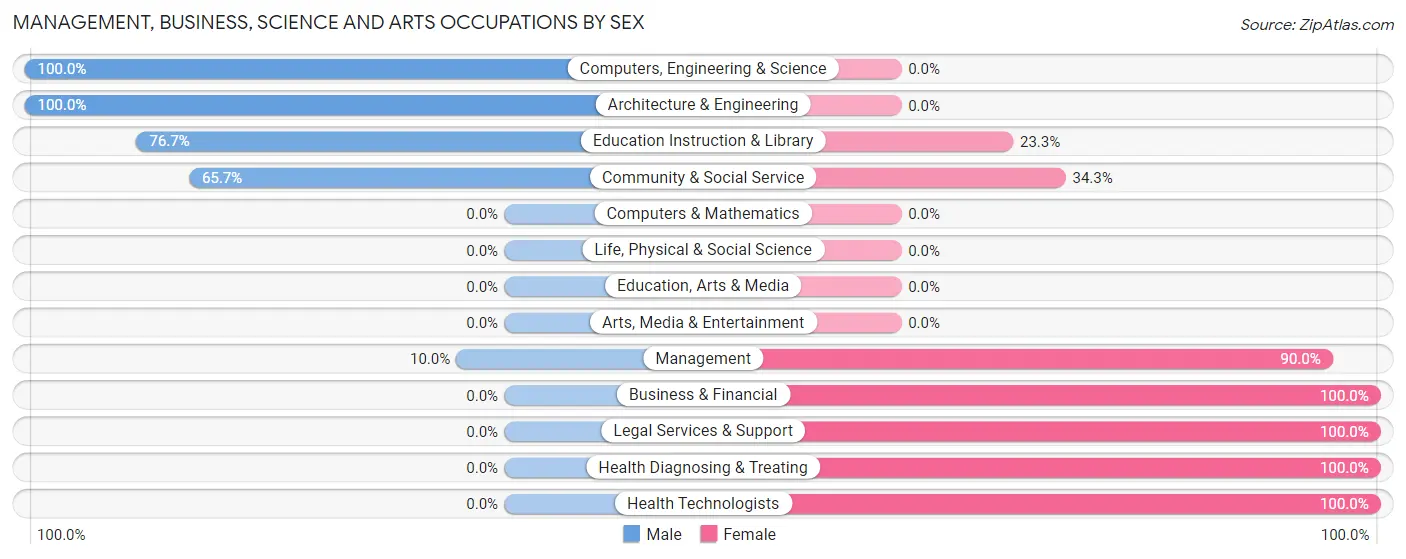
Management, Business, Science and Arts Occupations by Sex
Within the Management, Business, Science and Arts occupations in Richwood, the most male-oriented occupations are Computers, Engineering & Science (100.0%), Architecture & Engineering (100.0%), and Education Instruction & Library (76.7%), while the most female-oriented occupations are Business & Financial (100.0%), Legal Services & Support (100.0%), and Health Diagnosing & Treating (100.0%).
| Occupation | Male | Female |
| Management | 4 (10.0%) | 36 (90.0%) |
| Business & Financial | 0 (0.0%) | 6 (100.0%) |
| Computers, Engineering & Science | 6 (100.0%) | 0 (0.0%) |
| Computers & Mathematics | 0 (0.0%) | 0 (0.0%) |
| Architecture & Engineering | 6 (100.0%) | 0 (0.0%) |
| Life, Physical & Social Science | 0 (0.0%) | 0 (0.0%) |
| Community & Social Service | 23 (65.7%) | 12 (34.3%) |
| Education, Arts & Media | 0 (0.0%) | 0 (0.0%) |
| Legal Services & Support | 0 (0.0%) | 5 (100.0%) |
| Education Instruction & Library | 23 (76.7%) | 7 (23.3%) |
| Arts, Media & Entertainment | 0 (0.0%) | 0 (0.0%) |
| Health Diagnosing & Treating | 0 (0.0%) | 30 (100.0%) |
| Health Technologists | 0 (0.0%) | 8 (100.0%) |
| Total (Category) | 33 (28.2%) | 84 (71.8%) |
| Total (Overall) | 252 (39.6%) | 385 (60.4%) |
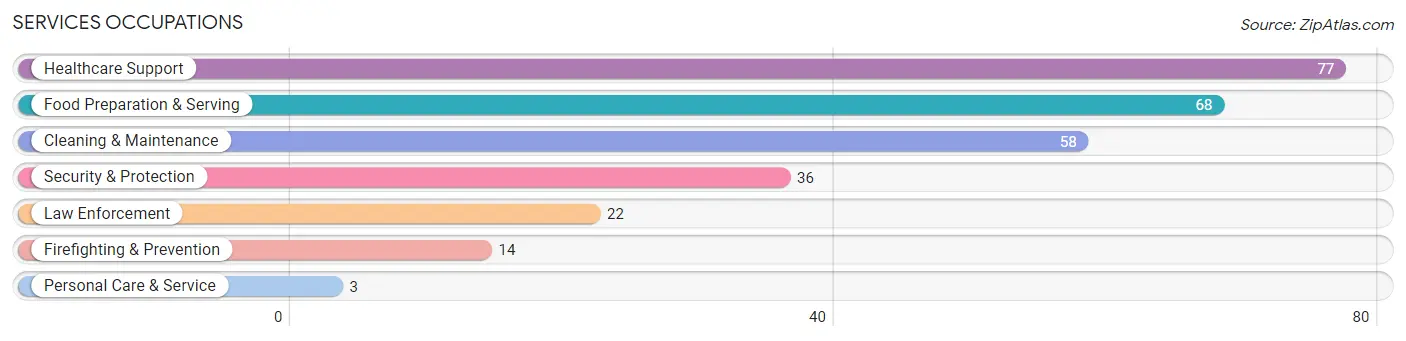
Services Occupations
The most common Services occupations in Richwood are Healthcare Support (77 | 12.1%), Food Preparation & Serving (68 | 10.7%), Cleaning & Maintenance (58 | 9.1%), Security & Protection (36 | 5.7%), and Law Enforcement (22 | 3.5%).
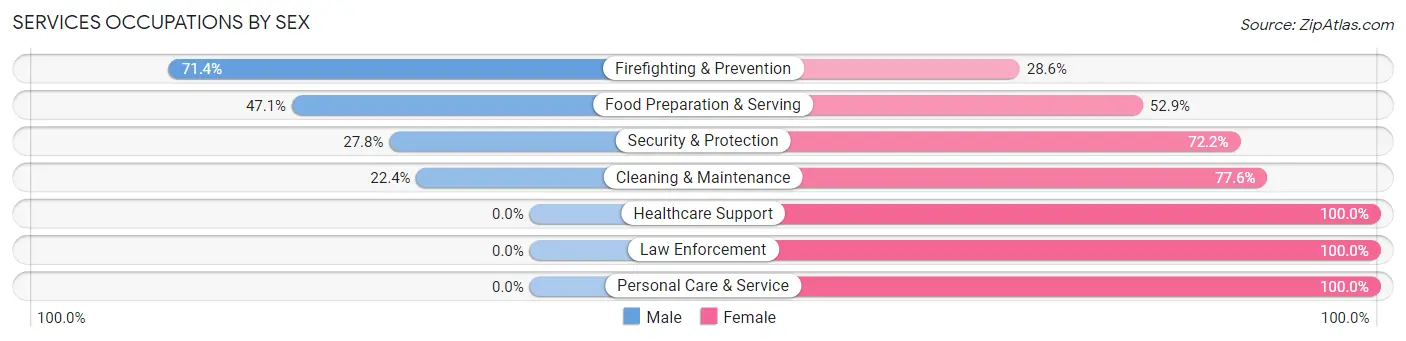
Services Occupations by Sex
Within the Services occupations in Richwood, the most male-oriented occupations are Firefighting & Prevention (71.4%), Food Preparation & Serving (47.1%), and Security & Protection (27.8%), while the most female-oriented occupations are Healthcare Support (100.0%), Law Enforcement (100.0%), and Personal Care & Service (100.0%).
| Occupation | Male | Female |
| Healthcare Support | 0 (0.0%) | 77 (100.0%) |
| Security & Protection | 10 (27.8%) | 26 (72.2%) |
| Firefighting & Prevention | 10 (71.4%) | 4 (28.6%) |
| Law Enforcement | 0 (0.0%) | 22 (100.0%) |
| Food Preparation & Serving | 32 (47.1%) | 36 (52.9%) |
| Cleaning & Maintenance | 13 (22.4%) | 45 (77.6%) |
| Personal Care & Service | 0 (0.0%) | 3 (100.0%) |
| Total (Category) | 55 (22.7%) | 187 (77.3%) |
| Total (Overall) | 252 (39.6%) | 385 (60.4%) |
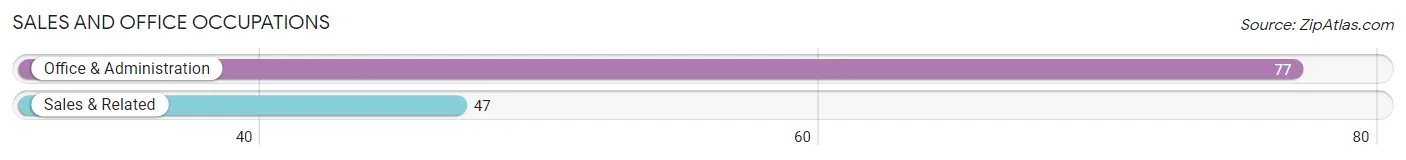
Sales and Office Occupations
The most common Sales and Office occupations in Richwood are Office & Administration (77 | 12.1%), and Sales & Related (47 | 7.4%).
Sales and Office Occupations by Sex
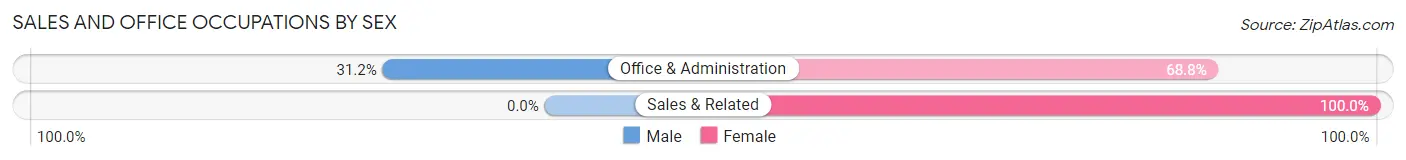
| Occupation | Male | Female |
| Sales & Related | 0 (0.0%) | 47 (100.0%) |
| Office & Administration | 24 (31.2%) | 53 (68.8%) |
| Total (Category) | 24 (19.4%) | 100 (80.6%) |
| Total (Overall) | 252 (39.6%) | 385 (60.4%) |
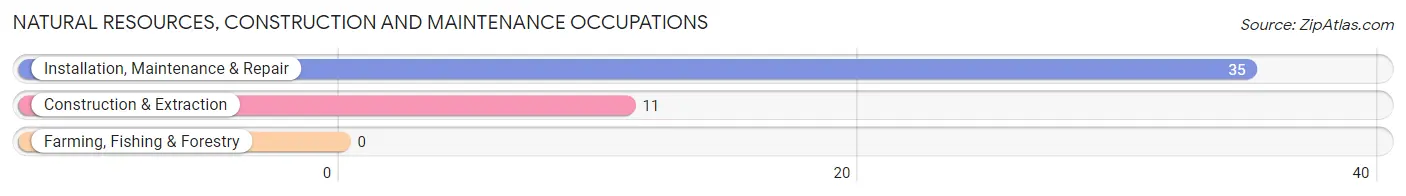
Natural Resources, Construction and Maintenance Occupations
The most common Natural Resources, Construction and Maintenance occupations in Richwood are Installation, Maintenance & Repair (35 | 5.5%), and Construction & Extraction (11 | 1.7%).
Natural Resources, Construction and Maintenance Occupations by Sex
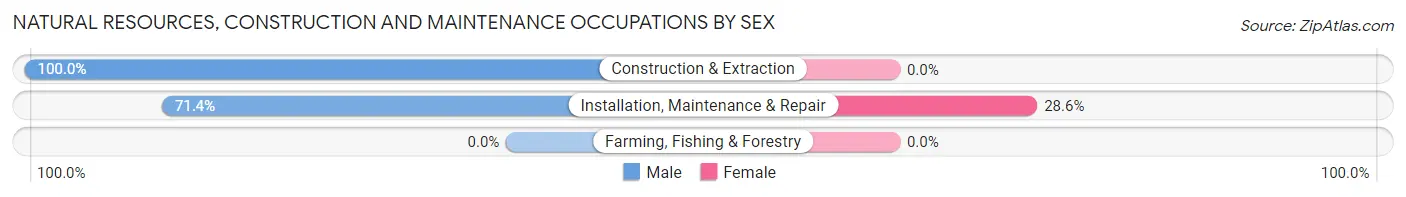
| Occupation | Male | Female |
| Farming, Fishing & Forestry | 0 (0.0%) | 0 (0.0%) |
| Construction & Extraction | 11 (100.0%) | 0 (0.0%) |
| Installation, Maintenance & Repair | 25 (71.4%) | 10 (28.6%) |
| Total (Category) | 36 (78.3%) | 10 (21.7%) |
| Total (Overall) | 252 (39.6%) | 385 (60.4%) |
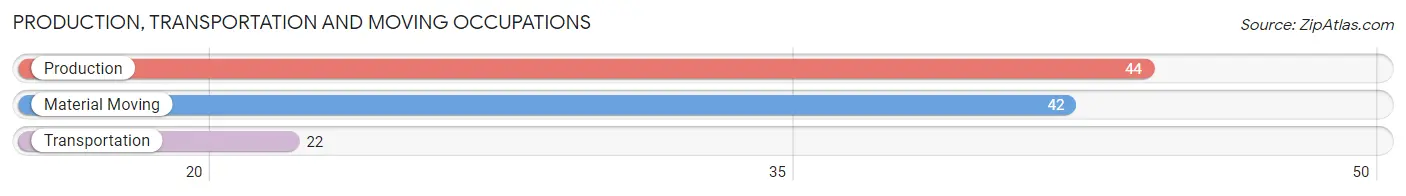
Production, Transportation and Moving Occupations
The most common Production, Transportation and Moving occupations in Richwood are Production (44 | 6.9%), Material Moving (42 | 6.6%), and Transportation (22 | 3.5%).
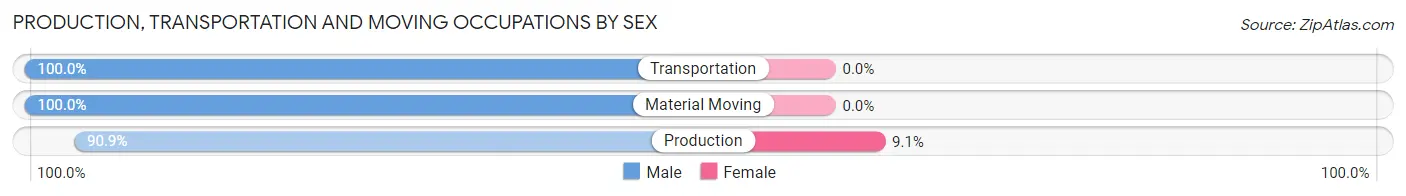
Production, Transportation and Moving Occupations by Sex
| Occupation | Male | Female |
| Production | 40 (90.9%) | 4 (9.1%) |
| Transportation | 22 (100.0%) | 0 (0.0%) |
| Material Moving | 42 (100.0%) | 0 (0.0%) |
| Total (Category) | 104 (96.3%) | 4 (3.7%) |
| Total (Overall) | 252 (39.6%) | 385 (60.4%) |
Employment Industries by Sex in Richwood
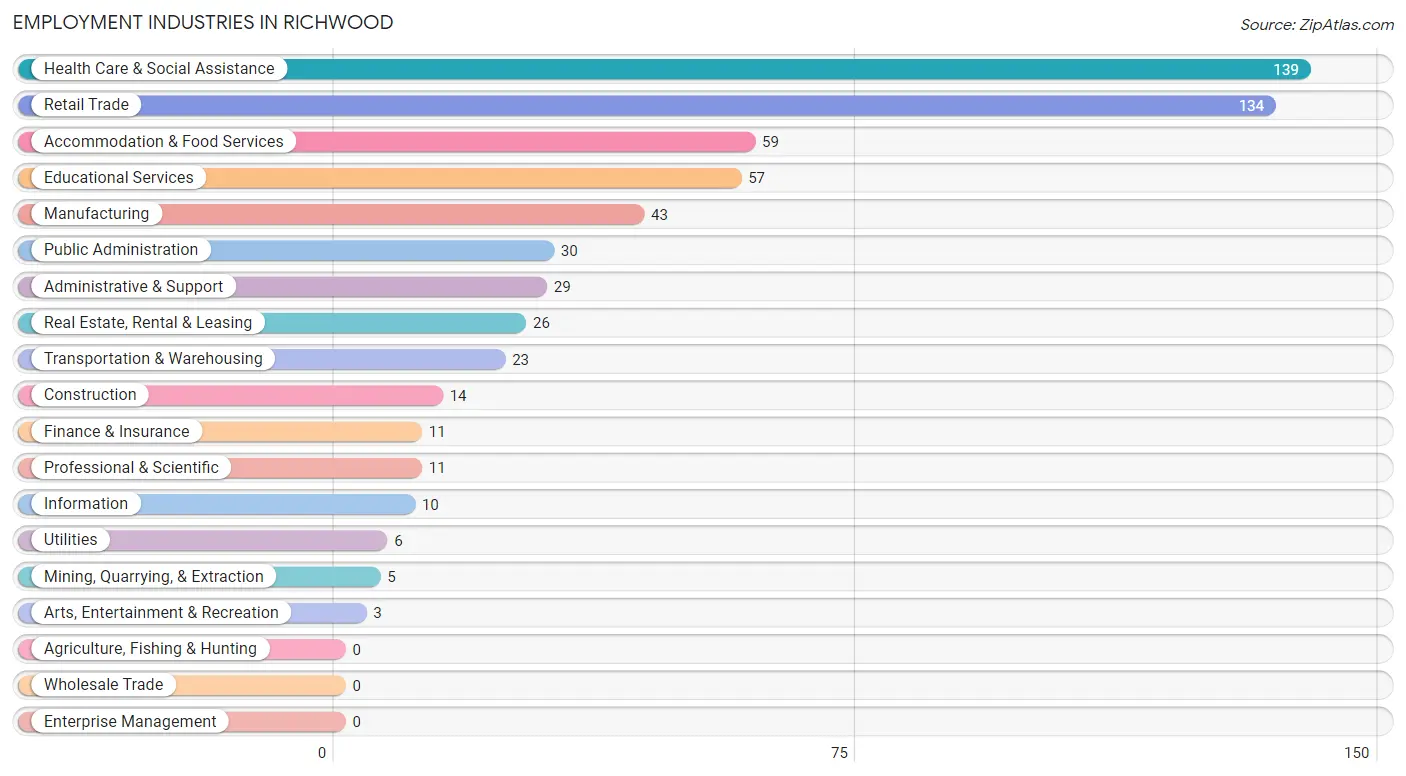
Employment Industries in Richwood
The major employment industries in Richwood include Health Care & Social Assistance (139 | 21.8%), Retail Trade (134 | 21.0%), Accommodation & Food Services (59 | 9.3%), Educational Services (57 | 8.9%), and Manufacturing (43 | 6.8%).
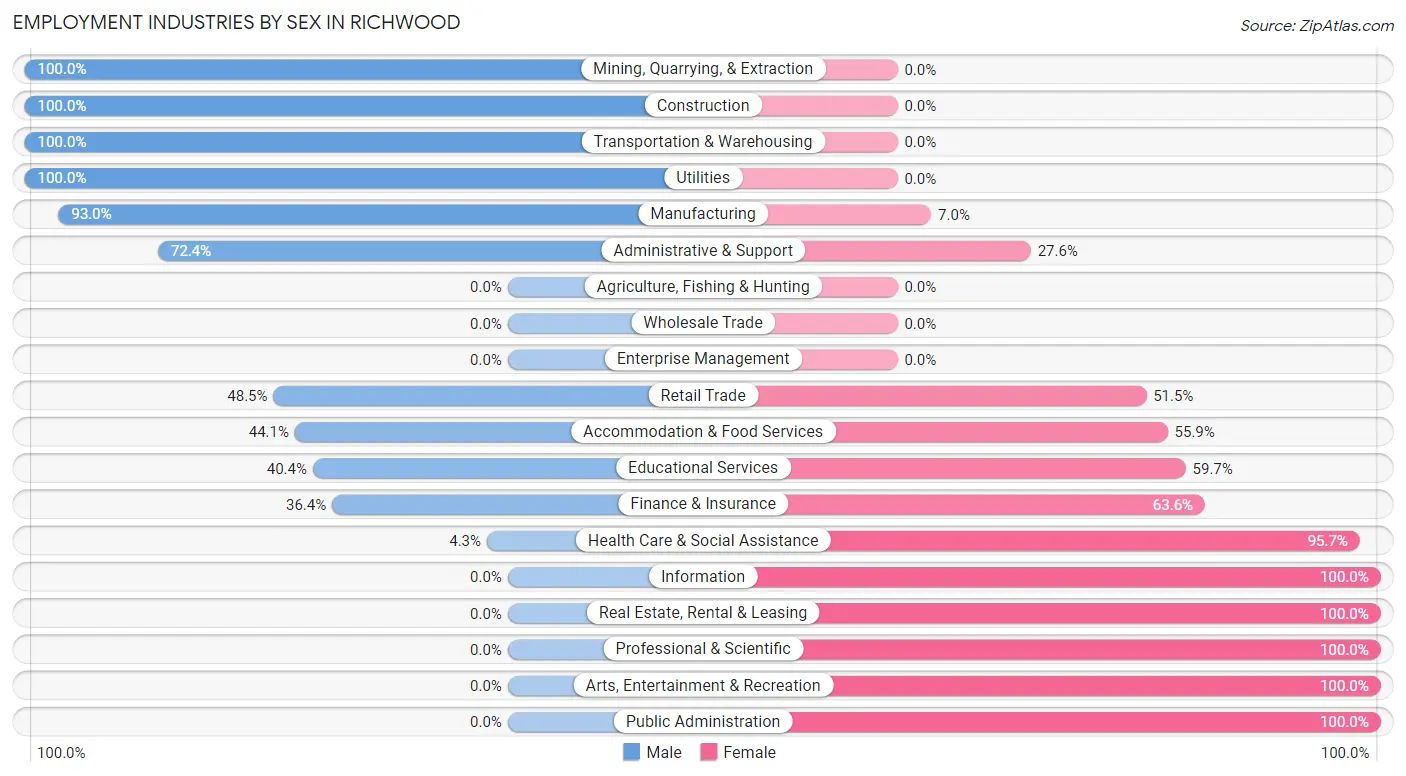
Employment Industries by Sex in Richwood
The Richwood industries that see more men than women are Mining, Quarrying, & Extraction (100.0%), Construction (100.0%), and Transportation & Warehousing (100.0%), whereas the industries that tend to have a higher number of women are Information (100.0%), Real Estate, Rental & Leasing (100.0%), and Professional & Scientific (100.0%).
| Industry | Male | Female |
| Agriculture, Fishing & Hunting | 0 (0.0%) | 0 (0.0%) |
| Mining, Quarrying, & Extraction | 5 (100.0%) | 0 (0.0%) |
| Construction | 14 (100.0%) | 0 (0.0%) |
| Manufacturing | 40 (93.0%) | 3 (7.0%) |
| Wholesale Trade | 0 (0.0%) | 0 (0.0%) |
| Retail Trade | 65 (48.5%) | 69 (51.5%) |
| Transportation & Warehousing | 23 (100.0%) | 0 (0.0%) |
| Utilities | 6 (100.0%) | 0 (0.0%) |
| Information | 0 (0.0%) | 10 (100.0%) |
| Finance & Insurance | 4 (36.4%) | 7 (63.6%) |
| Real Estate, Rental & Leasing | 0 (0.0%) | 26 (100.0%) |
| Professional & Scientific | 0 (0.0%) | 11 (100.0%) |
| Enterprise Management | 0 (0.0%) | 0 (0.0%) |
| Administrative & Support | 21 (72.4%) | 8 (27.6%) |
| Educational Services | 23 (40.4%) | 34 (59.7%) |
| Health Care & Social Assistance | 6 (4.3%) | 133 (95.7%) |
| Arts, Entertainment & Recreation | 0 (0.0%) | 3 (100.0%) |
| Accommodation & Food Services | 26 (44.1%) | 33 (55.9%) |
| Public Administration | 0 (0.0%) | 30 (100.0%) |
| Total | 252 (39.6%) | 385 (60.4%) |
Education in Richwood
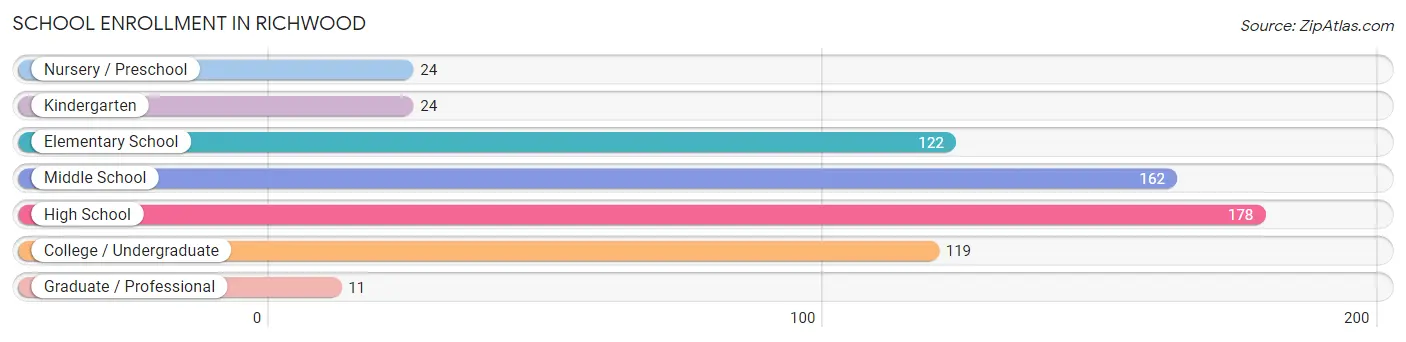
School Enrollment in Richwood
The most common levels of schooling among the 640 students in Richwood are high school (178 | 27.8%), middle school (162 | 25.3%), and elementary school (122 | 19.1%).
| School Level | # Students | % Students |
| Nursery / Preschool | 24 | 3.7% |
| Kindergarten | 24 | 3.7% |
| Elementary School | 122 | 19.1% |
| Middle School | 162 | 25.3% |
| High School | 178 | 27.8% |
| College / Undergraduate | 119 | 18.6% |
| Graduate / Professional | 11 | 1.7% |
| Total | 640 | 100.0% |
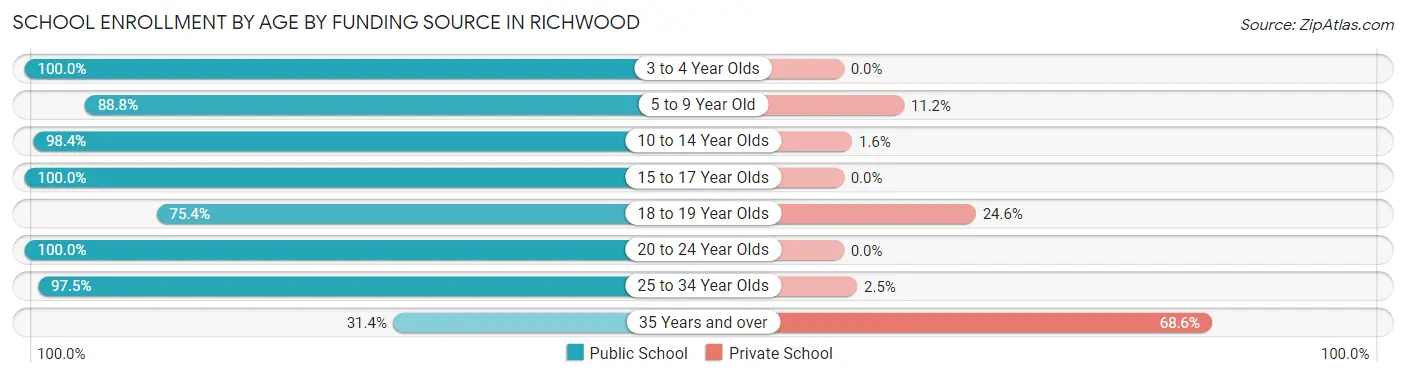
School Enrollment by Age by Funding Source in Richwood
Out of a total of 640 students who are enrolled in schools in Richwood, 80 (12.5%) attend a private institution, while the remaining 560 (87.5%) are enrolled in public schools. The age group of 35 years and over has the highest likelihood of being enrolled in private schools, with 48 (68.6% in the age bracket) enrolled. Conversely, the age group of 3 to 4 year olds has the lowest likelihood of being enrolled in a private school, with 24 (100.0% in the age bracket) attending a public institution.
| Age Bracket | Public School | Private School |
| 3 to 4 Year Olds | 24 (100.0%) | 0 (0.0%) |
| 5 to 9 Year Old | 103 (88.8%) | 13 (11.2%) |
| 10 to 14 Year Olds | 189 (98.4%) | 3 (1.6%) |
| 15 to 17 Year Olds | 120 (100.0%) | 0 (0.0%) |
| 18 to 19 Year Olds | 46 (75.4%) | 15 (24.6%) |
| 20 to 24 Year Olds | 17 (100.0%) | 0 (0.0%) |
| 25 to 34 Year Olds | 39 (97.5%) | 1 (2.5%) |
| 35 Years and over | 22 (31.4%) | 48 (68.6%) |
| Total | 560 (87.5%) | 80 (12.5%) |
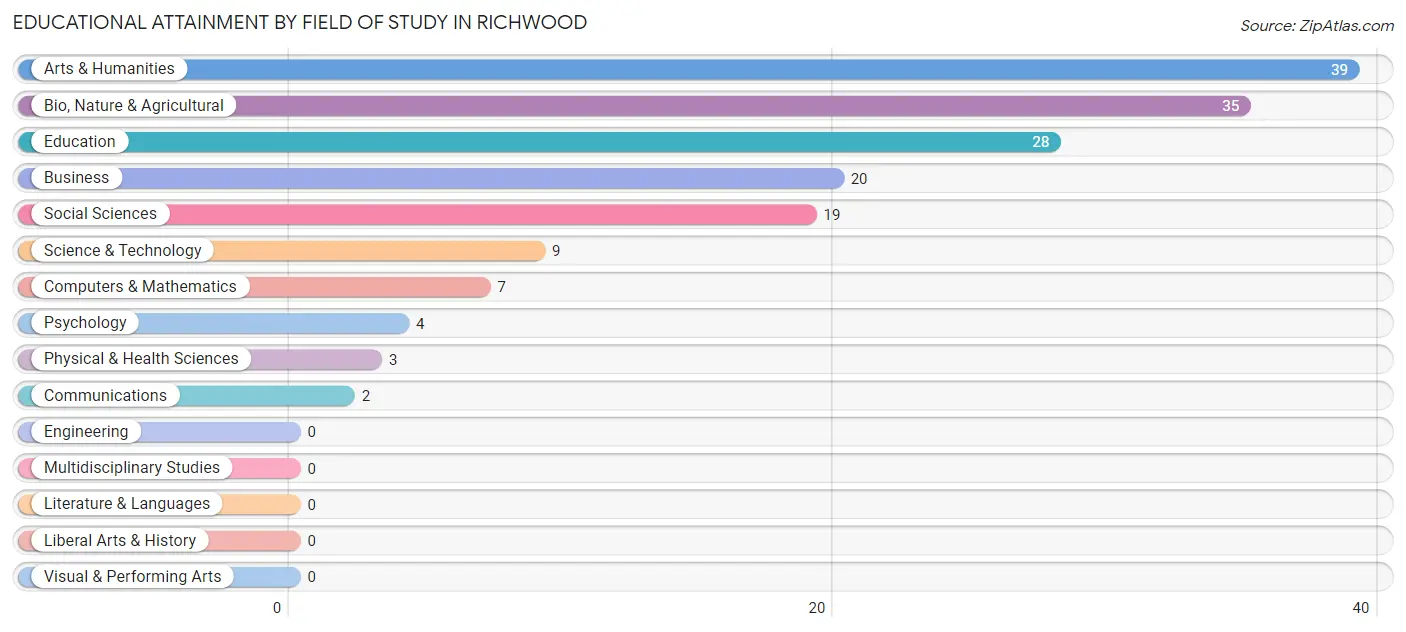
Educational Attainment by Field of Study in Richwood
Arts & humanities (39 | 23.5%), bio, nature & agricultural (35 | 21.1%), education (28 | 16.9%), business (20 | 12.0%), and social sciences (19 | 11.5%) are the most common fields of study among 166 individuals in Richwood who have obtained a bachelor's degree or higher.
| Field of Study | # Graduates | % Graduates |
| Computers & Mathematics | 7 | 4.2% |
| Bio, Nature & Agricultural | 35 | 21.1% |
| Physical & Health Sciences | 3 | 1.8% |
| Psychology | 4 | 2.4% |
| Social Sciences | 19 | 11.5% |
| Engineering | 0 | 0.0% |
| Multidisciplinary Studies | 0 | 0.0% |
| Science & Technology | 9 | 5.4% |
| Business | 20 | 12.0% |
| Education | 28 | 16.9% |
| Literature & Languages | 0 | 0.0% |
| Liberal Arts & History | 0 | 0.0% |
| Visual & Performing Arts | 0 | 0.0% |
| Communications | 2 | 1.2% |
| Arts & Humanities | 39 | 23.5% |
| Total | 166 | 100.0% |
Transportation & Commute in Richwood
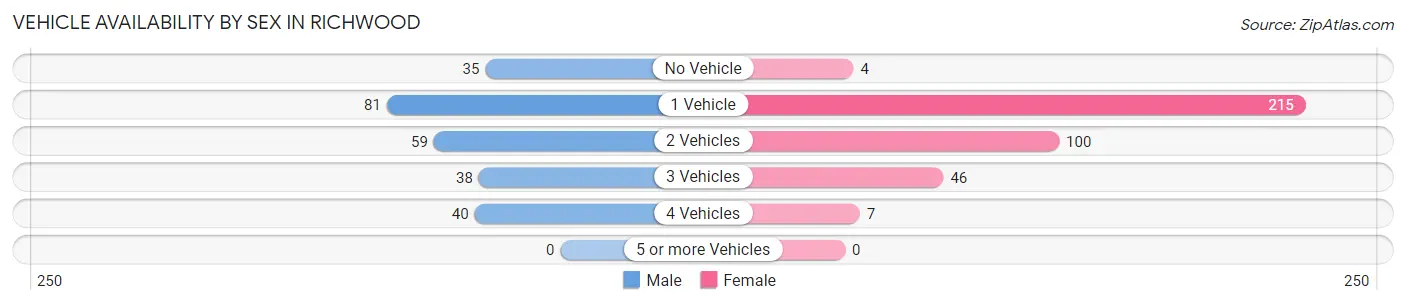
Vehicle Availability by Sex in Richwood
The most prevalent vehicle ownership categories in Richwood are males with 1 vehicle (81, accounting for 32.0%) and females with 1 vehicle (215, making up 21.8%).
| Vehicles Available | Male | Female |
| No Vehicle | 35 (13.8%) | 4 (1.1%) |
| 1 Vehicle | 81 (32.0%) | 215 (57.8%) |
| 2 Vehicles | 59 (23.3%) | 100 (26.9%) |
| 3 Vehicles | 38 (15.0%) | 46 (12.4%) |
| 4 Vehicles | 40 (15.8%) | 7 (1.9%) |
| 5 or more Vehicles | 0 (0.0%) | 0 (0.0%) |
| Total | 253 (100.0%) | 372 (100.0%) |
Commute Time in Richwood
The most frequently occuring commute durations in Richwood are 15 to 19 minutes (207 commuters, 34.2%), 10 to 14 minutes (114 commuters, 18.8%), and 20 to 24 minutes (97 commuters, 16.0%).
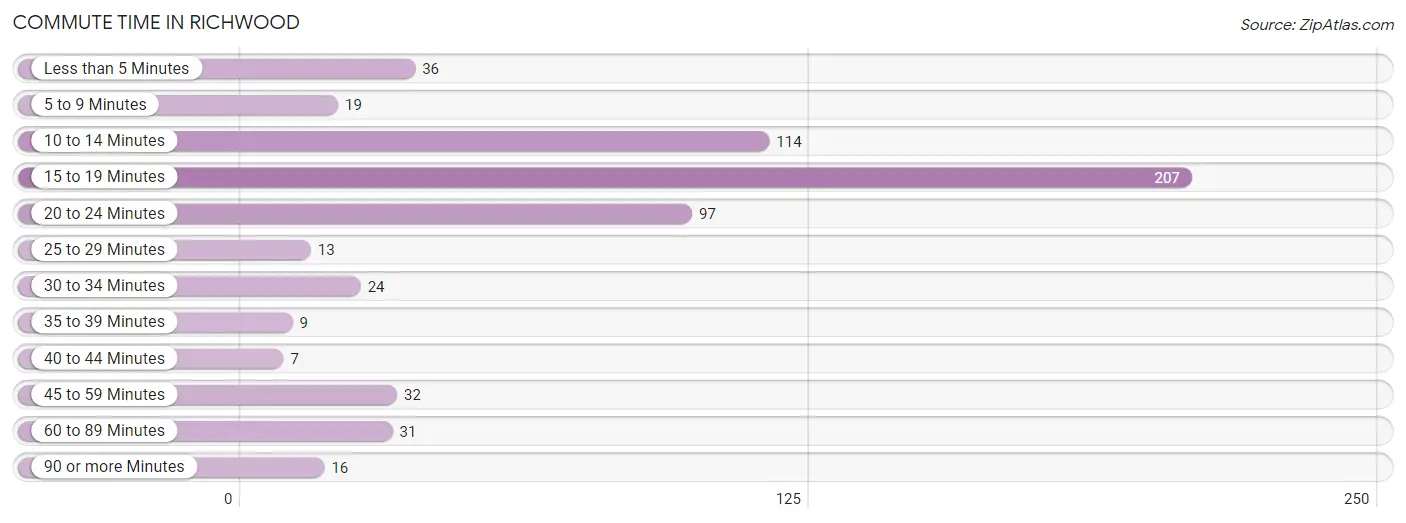
| Commute Time | # Commuters | % Commuters |
| Less than 5 Minutes | 36 | 5.9% |
| 5 to 9 Minutes | 19 | 3.1% |
| 10 to 14 Minutes | 114 | 18.8% |
| 15 to 19 Minutes | 207 | 34.2% |
| 20 to 24 Minutes | 97 | 16.0% |
| 25 to 29 Minutes | 13 | 2.1% |
| 30 to 34 Minutes | 24 | 4.0% |
| 35 to 39 Minutes | 9 | 1.5% |
| 40 to 44 Minutes | 7 | 1.2% |
| 45 to 59 Minutes | 32 | 5.3% |
| 60 to 89 Minutes | 31 | 5.1% |
| 90 or more Minutes | 16 | 2.6% |
Commute Time by Sex in Richwood
The most common commute times in Richwood are 15 to 19 minutes (114 commuters, 46.5%) for males and 15 to 19 minutes (93 commuters, 25.8%) for females.
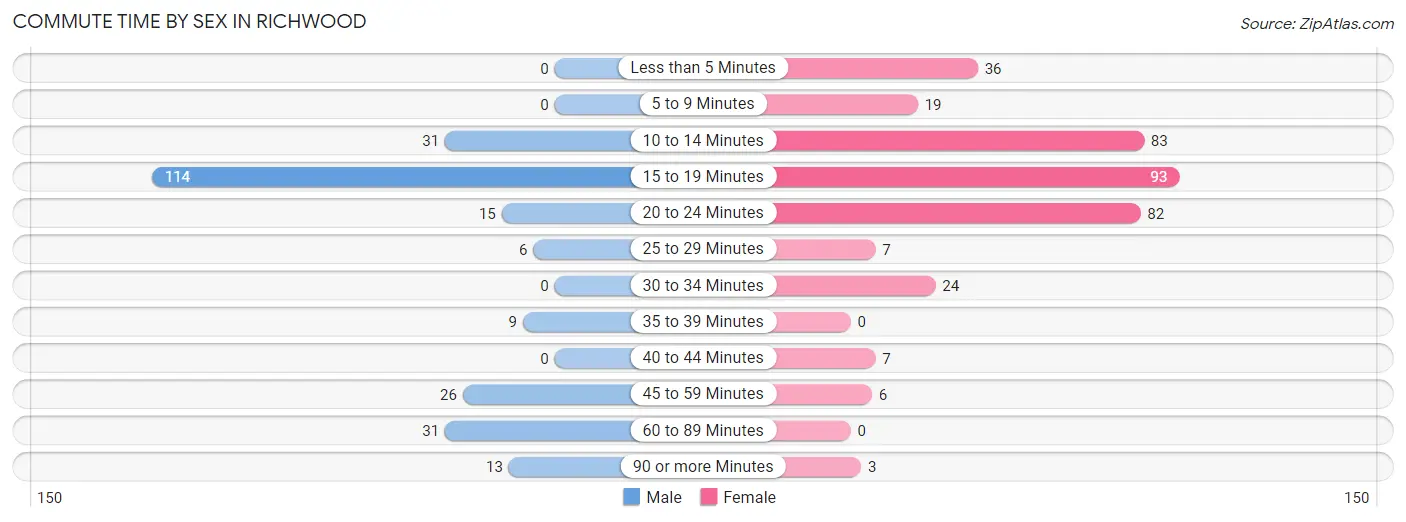
| Commute Time | Male | Female |
| Less than 5 Minutes | 0 (0.0%) | 36 (10.0%) |
| 5 to 9 Minutes | 0 (0.0%) | 19 (5.3%) |
| 10 to 14 Minutes | 31 (12.7%) | 83 (23.1%) |
| 15 to 19 Minutes | 114 (46.5%) | 93 (25.8%) |
| 20 to 24 Minutes | 15 (6.1%) | 82 (22.8%) |
| 25 to 29 Minutes | 6 (2.5%) | 7 (1.9%) |
| 30 to 34 Minutes | 0 (0.0%) | 24 (6.7%) |
| 35 to 39 Minutes | 9 (3.7%) | 0 (0.0%) |
| 40 to 44 Minutes | 0 (0.0%) | 7 (1.9%) |
| 45 to 59 Minutes | 26 (10.6%) | 6 (1.7%) |
| 60 to 89 Minutes | 31 (12.7%) | 0 (0.0%) |
| 90 or more Minutes | 13 (5.3%) | 3 (0.8%) |
Time of Departure to Work by Sex in Richwood
The most frequent times of departure to work in Richwood are 5:30 AM to 5:59 AM (63, 25.7%) for males and 7:30 AM to 7:59 AM (87, 24.2%) for females.
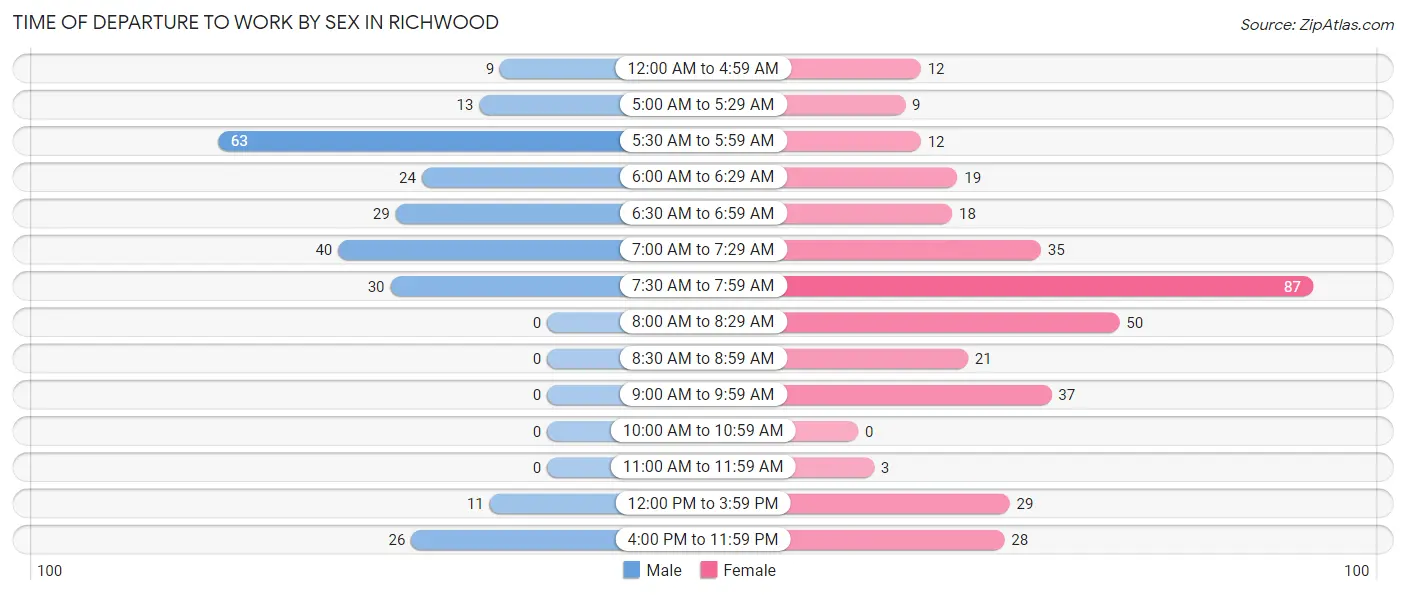
| Time of Departure | Male | Female |
| 12:00 AM to 4:59 AM | 9 (3.7%) | 12 (3.3%) |
| 5:00 AM to 5:29 AM | 13 (5.3%) | 9 (2.5%) |
| 5:30 AM to 5:59 AM | 63 (25.7%) | 12 (3.3%) |
| 6:00 AM to 6:29 AM | 24 (9.8%) | 19 (5.3%) |
| 6:30 AM to 6:59 AM | 29 (11.8%) | 18 (5.0%) |
| 7:00 AM to 7:29 AM | 40 (16.3%) | 35 (9.7%) |
| 7:30 AM to 7:59 AM | 30 (12.2%) | 87 (24.2%) |
| 8:00 AM to 8:29 AM | 0 (0.0%) | 50 (13.9%) |
| 8:30 AM to 8:59 AM | 0 (0.0%) | 21 (5.8%) |
| 9:00 AM to 9:59 AM | 0 (0.0%) | 37 (10.3%) |
| 10:00 AM to 10:59 AM | 0 (0.0%) | 0 (0.0%) |
| 11:00 AM to 11:59 AM | 0 (0.0%) | 3 (0.8%) |
| 12:00 PM to 3:59 PM | 11 (4.5%) | 29 (8.1%) |
| 4:00 PM to 11:59 PM | 26 (10.6%) | 28 (7.8%) |
| Total | 245 (100.0%) | 360 (100.0%) |
Housing Occupancy in Richwood
Occupancy by Ownership in Richwood
Of the total 687 dwellings in Richwood, owner-occupied units account for 226 (32.9%), while renter-occupied units make up 461 (67.1%).
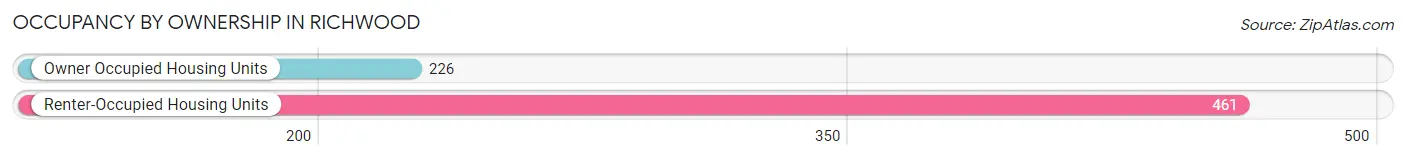
| Occupancy | # Housing Units | % Housing Units |
| Owner Occupied Housing Units | 226 | 32.9% |
| Renter-Occupied Housing Units | 461 | 67.1% |
| Total Occupied Housing Units | 687 | 100.0% |
Occupancy by Household Size in Richwood
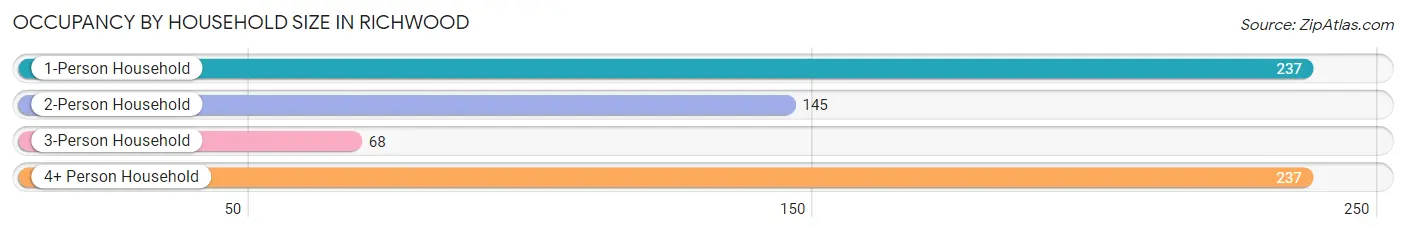
| Household Size | # Housing Units | % Housing Units |
| 1-Person Household | 237 | 34.5% |
| 2-Person Household | 145 | 21.1% |
| 3-Person Household | 68 | 9.9% |
| 4+ Person Household | 237 | 34.5% |
| Total Housing Units | 687 | 100.0% |
Occupancy by Ownership by Household Size in Richwood
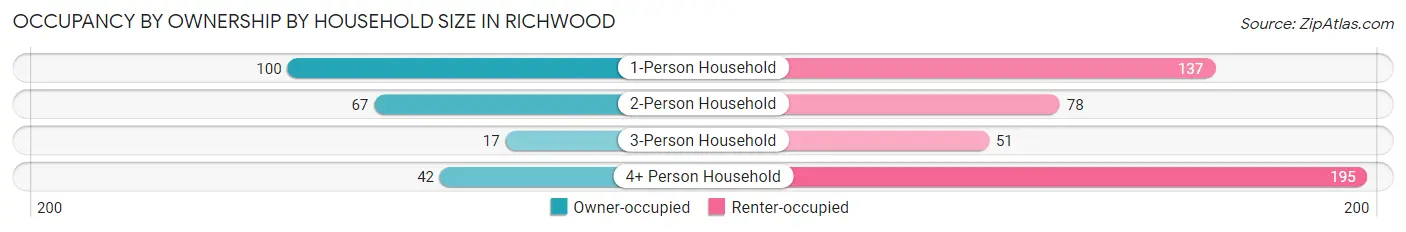
| Household Size | Owner-occupied | Renter-occupied |
| 1-Person Household | 100 (42.2%) | 137 (57.8%) |
| 2-Person Household | 67 (46.2%) | 78 (53.8%) |
| 3-Person Household | 17 (25.0%) | 51 (75.0%) |
| 4+ Person Household | 42 (17.7%) | 195 (82.3%) |
| Total Housing Units | 226 (32.9%) | 461 (67.1%) |
Occupancy by Educational Attainment in Richwood
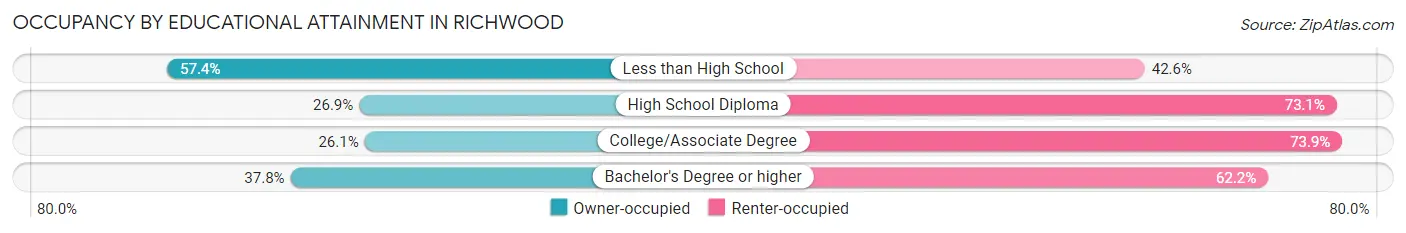
| Household Size | Owner-occupied | Renter-occupied |
| Less than High School | 66 (57.4%) | 49 (42.6%) |
| High School Diploma | 66 (26.9%) | 179 (73.1%) |
| College/Associate Degree | 66 (26.1%) | 187 (73.9%) |
| Bachelor's Degree or higher | 28 (37.8%) | 46 (62.2%) |
Occupancy by Age of Householder in Richwood
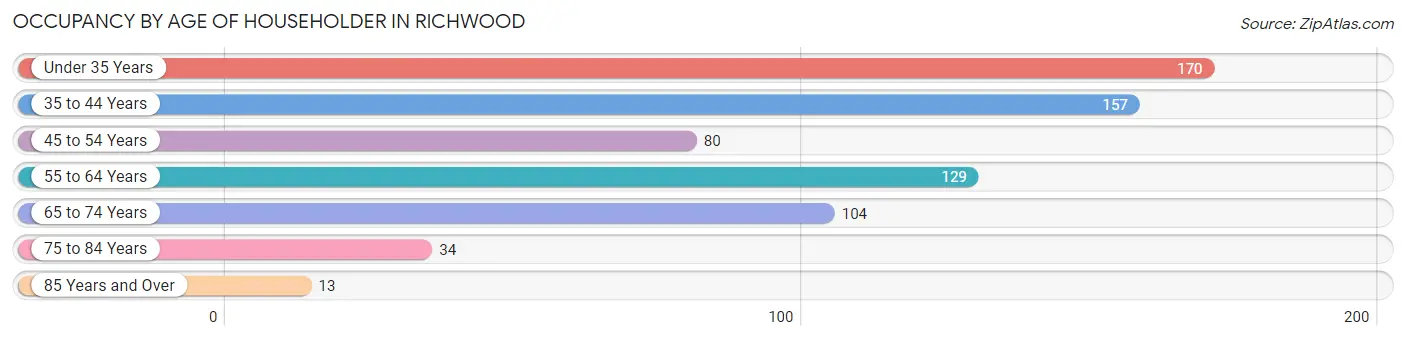
| Age Bracket | # Households | % Households |
| Under 35 Years | 170 | 24.7% |
| 35 to 44 Years | 157 | 22.9% |
| 45 to 54 Years | 80 | 11.6% |
| 55 to 64 Years | 129 | 18.8% |
| 65 to 74 Years | 104 | 15.1% |
| 75 to 84 Years | 34 | 5.0% |
| 85 Years and Over | 13 | 1.9% |
| Total | 687 | 100.0% |
Housing Finances in Richwood
Median Income by Occupancy in Richwood
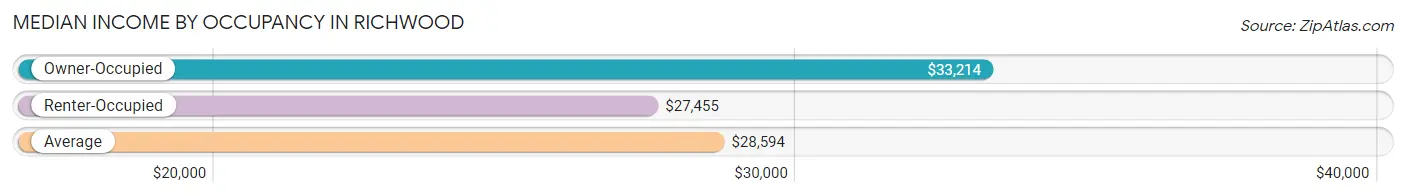
| Occupancy Type | # Households | Median Income |
| Owner-Occupied | 226 (32.9%) | $33,214 |
| Renter-Occupied | 461 (67.1%) | $27,455 |
| Average | 687 (100.0%) | $28,594 |
Occupancy by Householder Income Bracket in Richwood
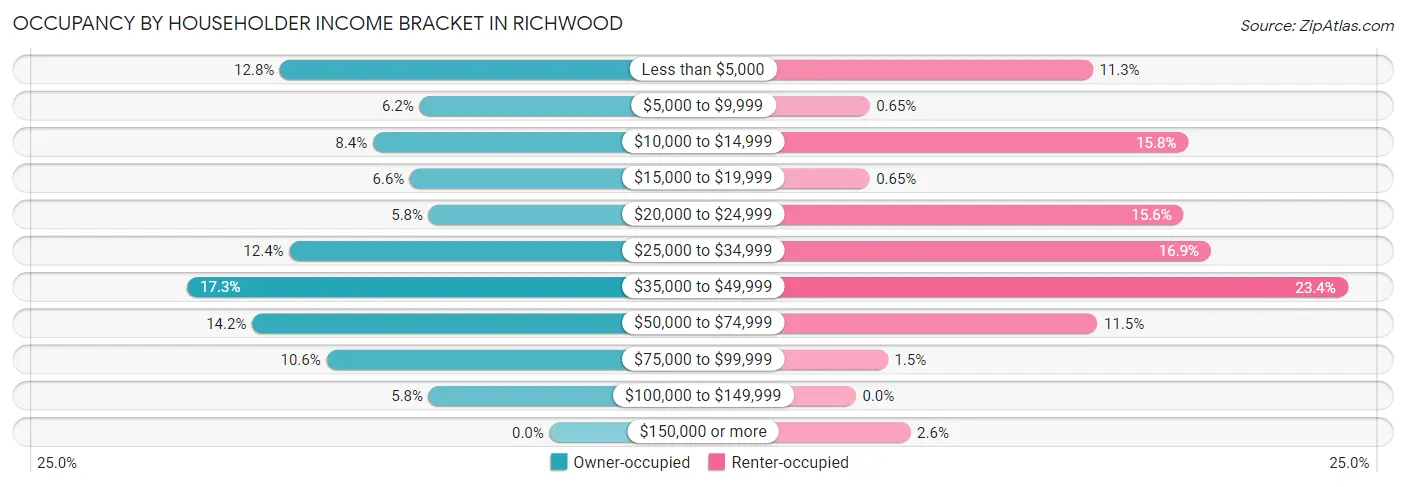
| Income Bracket | Owner-occupied | Renter-occupied |
| Less than $5,000 | 29 (12.8%) | 52 (11.3%) |
| $5,000 to $9,999 | 14 (6.2%) | 3 (0.6%) |
| $10,000 to $14,999 | 19 (8.4%) | 73 (15.8%) |
| $15,000 to $19,999 | 15 (6.6%) | 3 (0.6%) |
| $20,000 to $24,999 | 13 (5.8%) | 72 (15.6%) |
| $25,000 to $34,999 | 28 (12.4%) | 78 (16.9%) |
| $35,000 to $49,999 | 39 (17.3%) | 108 (23.4%) |
| $50,000 to $74,999 | 32 (14.2%) | 53 (11.5%) |
| $75,000 to $99,999 | 24 (10.6%) | 7 (1.5%) |
| $100,000 to $149,999 | 13 (5.8%) | 0 (0.0%) |
| $150,000 or more | 0 (0.0%) | 12 (2.6%) |
| Total | 226 (100.0%) | 461 (100.0%) |
Monthly Housing Cost Tiers in Richwood
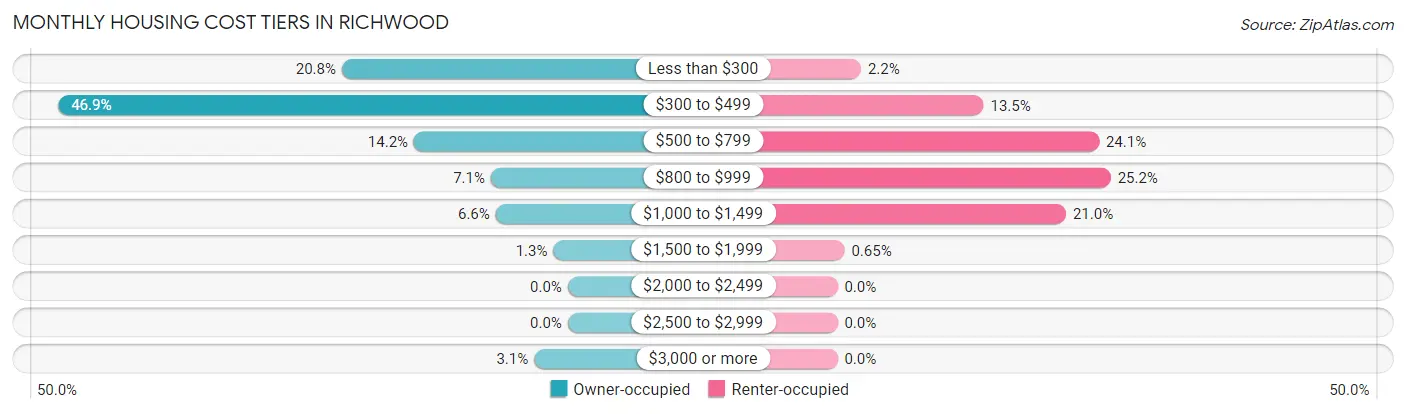
| Monthly Cost | Owner-occupied | Renter-occupied |
| Less than $300 | 47 (20.8%) | 10 (2.2%) |
| $300 to $499 | 106 (46.9%) | 62 (13.5%) |
| $500 to $799 | 32 (14.2%) | 111 (24.1%) |
| $800 to $999 | 16 (7.1%) | 116 (25.2%) |
| $1,000 to $1,499 | 15 (6.6%) | 97 (21.0%) |
| $1,500 to $1,999 | 3 (1.3%) | 3 (0.6%) |
| $2,000 to $2,499 | 0 (0.0%) | 0 (0.0%) |
| $2,500 to $2,999 | 0 (0.0%) | 0 (0.0%) |
| $3,000 or more | 7 (3.1%) | 0 (0.0%) |
| Total | 226 (100.0%) | 461 (100.0%) |
Physical Housing Characteristics in Richwood
Housing Structures in Richwood
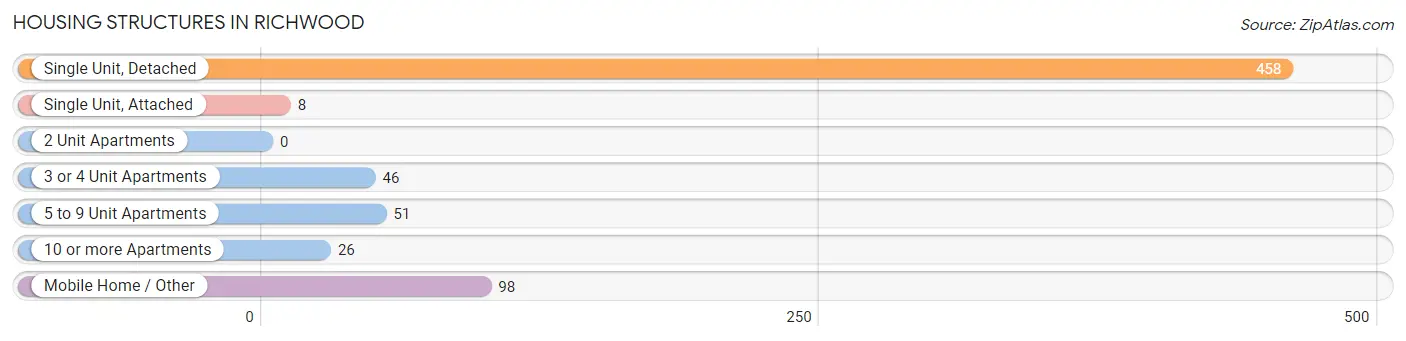
| Structure Type | # Housing Units | % Housing Units |
| Single Unit, Detached | 458 | 66.7% |
| Single Unit, Attached | 8 | 1.2% |
| 2 Unit Apartments | 0 | 0.0% |
| 3 or 4 Unit Apartments | 46 | 6.7% |
| 5 to 9 Unit Apartments | 51 | 7.4% |
| 10 or more Apartments | 26 | 3.8% |
| Mobile Home / Other | 98 | 14.3% |
| Total | 687 | 100.0% |
Housing Structures by Occupancy in Richwood
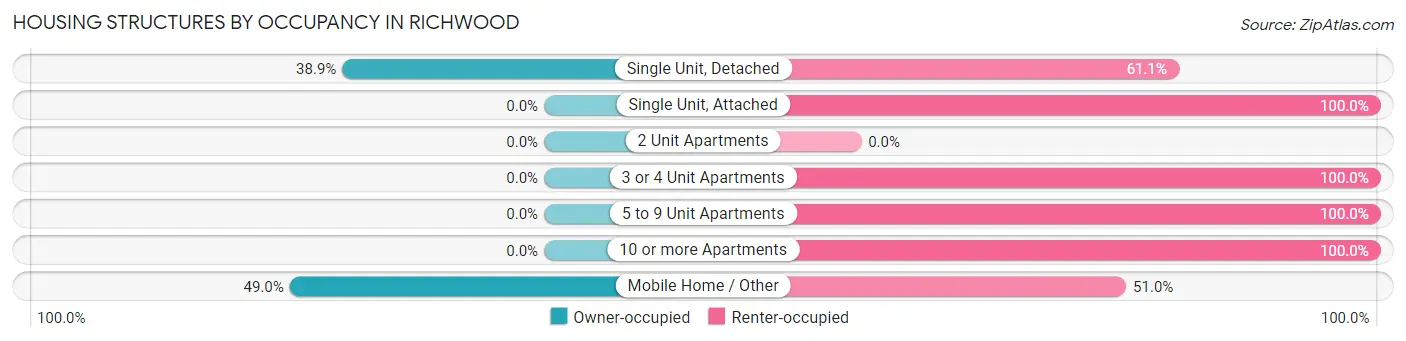
| Structure Type | Owner-occupied | Renter-occupied |
| Single Unit, Detached | 178 (38.9%) | 280 (61.1%) |
| Single Unit, Attached | 0 (0.0%) | 8 (100.0%) |
| 2 Unit Apartments | 0 (0.0%) | 0 (0.0%) |
| 3 or 4 Unit Apartments | 0 (0.0%) | 46 (100.0%) |
| 5 to 9 Unit Apartments | 0 (0.0%) | 51 (100.0%) |
| 10 or more Apartments | 0 (0.0%) | 26 (100.0%) |
| Mobile Home / Other | 48 (49.0%) | 50 (51.0%) |
| Total | 226 (32.9%) | 461 (67.1%) |
Housing Structures by Number of Rooms in Richwood
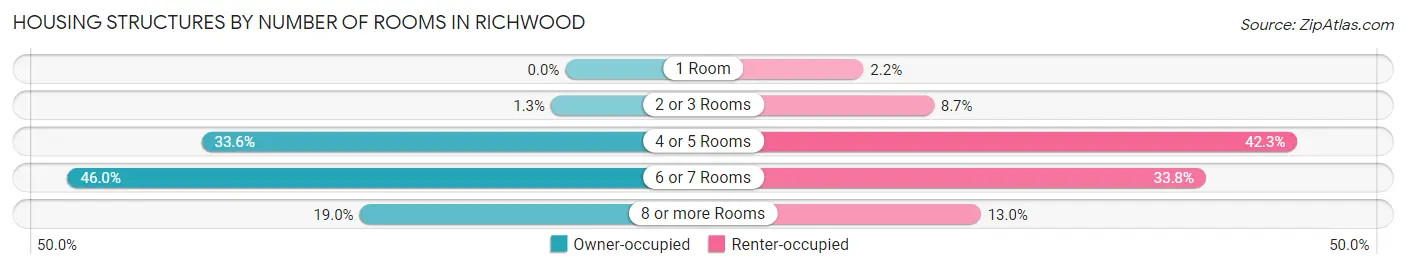
| Number of Rooms | Owner-occupied | Renter-occupied |
| 1 Room | 0 (0.0%) | 10 (2.2%) |
| 2 or 3 Rooms | 3 (1.3%) | 40 (8.7%) |
| 4 or 5 Rooms | 76 (33.6%) | 195 (42.3%) |
| 6 or 7 Rooms | 104 (46.0%) | 156 (33.8%) |
| 8 or more Rooms | 43 (19.0%) | 60 (13.0%) |
| Total | 226 (100.0%) | 461 (100.0%) |
Housing Structure by Heating Type in Richwood
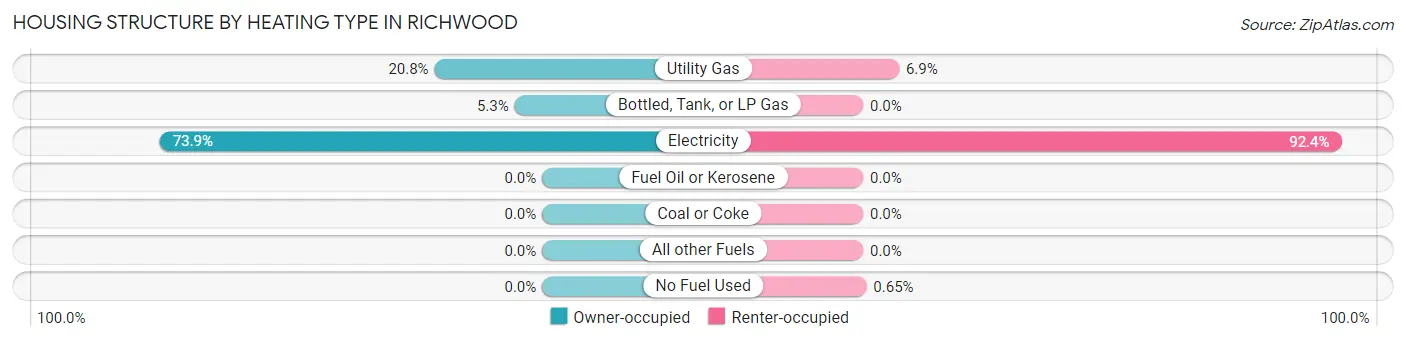
| Heating Type | Owner-occupied | Renter-occupied |
| Utility Gas | 47 (20.8%) | 32 (6.9%) |
| Bottled, Tank, or LP Gas | 12 (5.3%) | 0 (0.0%) |
| Electricity | 167 (73.9%) | 426 (92.4%) |
| Fuel Oil or Kerosene | 0 (0.0%) | 0 (0.0%) |
| Coal or Coke | 0 (0.0%) | 0 (0.0%) |
| All other Fuels | 0 (0.0%) | 0 (0.0%) |
| No Fuel Used | 0 (0.0%) | 3 (0.6%) |
| Total | 226 (100.0%) | 461 (100.0%) |
Household Vehicle Usage in Richwood
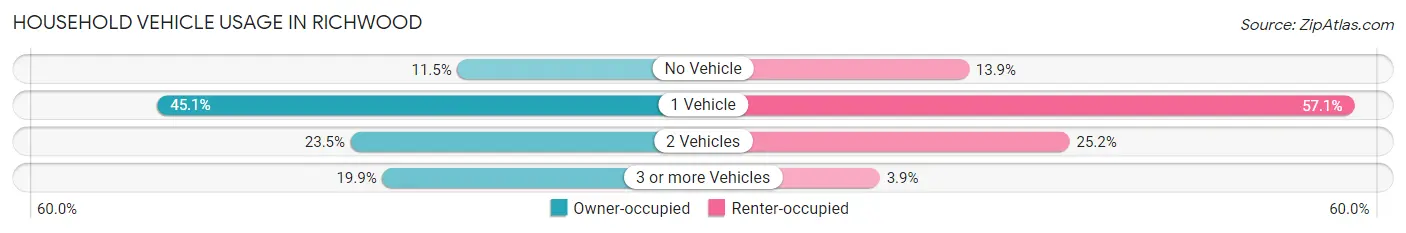
| Vehicles per Household | Owner-occupied | Renter-occupied |
| No Vehicle | 26 (11.5%) | 64 (13.9%) |
| 1 Vehicle | 102 (45.1%) | 263 (57.1%) |
| 2 Vehicles | 53 (23.4%) | 116 (25.2%) |
| 3 or more Vehicles | 45 (19.9%) | 18 (3.9%) |
| Total | 226 (100.0%) | 461 (100.0%) |
Real Estate & Mortgages in Richwood
Real Estate and Mortgage Overview in Richwood
| Characteristic | Without Mortgage | With Mortgage |
| Housing Units | 169 | 57 |
| Median Property Value | $49,100 | $75,900 |
| Median Household Income | $26,406 | $0 |
| Monthly Housing Costs | $372 | $0 |
| Real Estate Taxes | $199 | $17 |
Property Value by Mortgage Status in Richwood
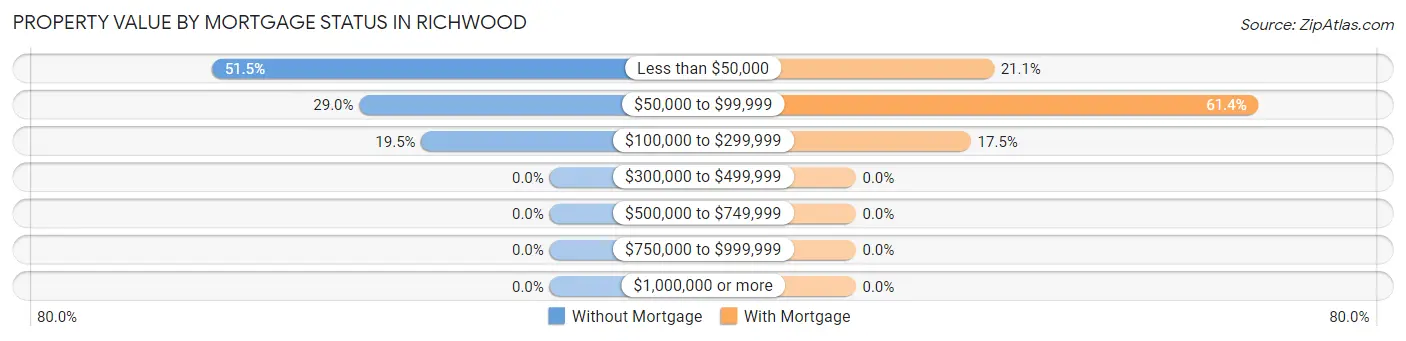
| Property Value | Without Mortgage | With Mortgage |
| Less than $50,000 | 87 (51.5%) | 12 (21.0%) |
| $50,000 to $99,999 | 49 (29.0%) | 35 (61.4%) |
| $100,000 to $299,999 | 33 (19.5%) | 10 (17.5%) |
| $300,000 to $499,999 | 0 (0.0%) | 0 (0.0%) |
| $500,000 to $749,999 | 0 (0.0%) | 0 (0.0%) |
| $750,000 to $999,999 | 0 (0.0%) | 0 (0.0%) |
| $1,000,000 or more | 0 (0.0%) | 0 (0.0%) |
| Total | 169 (100.0%) | 57 (100.0%) |
Household Income by Mortgage Status in Richwood
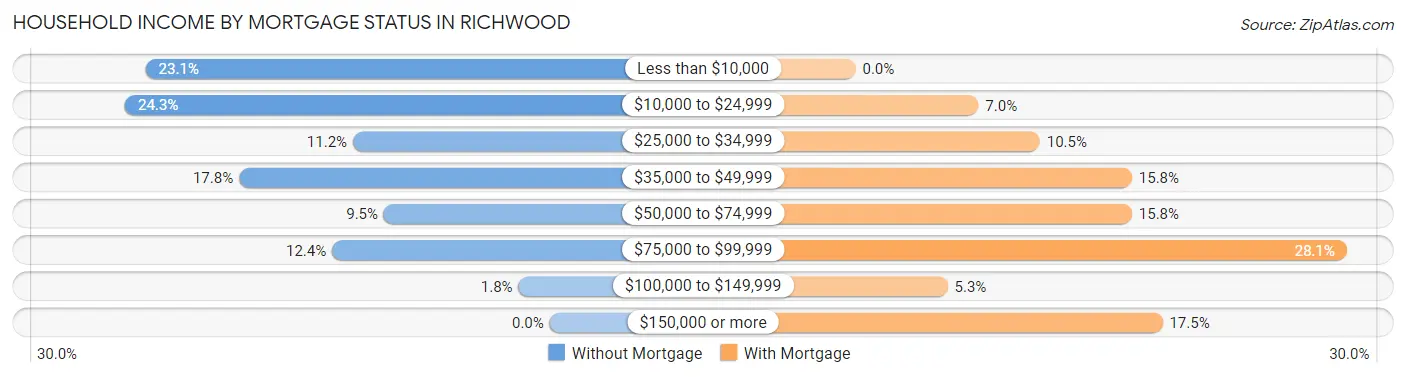
| Household Income | Without Mortgage | With Mortgage |
| Less than $10,000 | 39 (23.1%) | 0 (0.0%) |
| $10,000 to $24,999 | 41 (24.3%) | 4 (7.0%) |
| $25,000 to $34,999 | 19 (11.2%) | 6 (10.5%) |
| $35,000 to $49,999 | 30 (17.7%) | 9 (15.8%) |
| $50,000 to $74,999 | 16 (9.5%) | 9 (15.8%) |
| $75,000 to $99,999 | 21 (12.4%) | 16 (28.1%) |
| $100,000 to $149,999 | 3 (1.8%) | 3 (5.3%) |
| $150,000 or more | 0 (0.0%) | 10 (17.5%) |
| Total | 169 (100.0%) | 57 (100.0%) |
Property Value to Household Income Ratio in Richwood
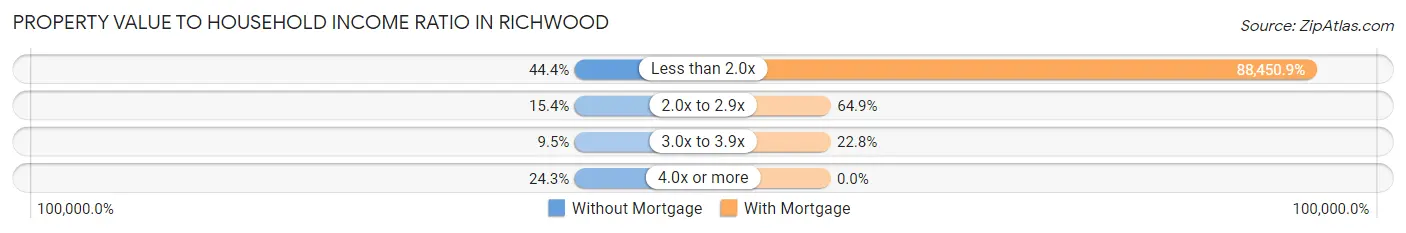
| Value-to-Income Ratio | Without Mortgage | With Mortgage |
| Less than 2.0x | 75 (44.4%) | 50,417 (88,450.9%) |
| 2.0x to 2.9x | 26 (15.4%) | 37 (64.9%) |
| 3.0x to 3.9x | 16 (9.5%) | 13 (22.8%) |
| 4.0x or more | 41 (24.3%) | 0 (0.0%) |
| Total | 169 (100.0%) | 57 (100.0%) |
Real Estate Taxes by Mortgage Status in Richwood
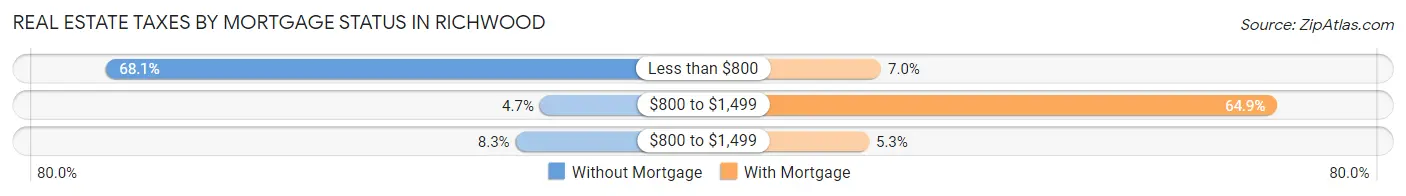
| Property Taxes | Without Mortgage | With Mortgage |
| Less than $800 | 115 (68.0%) | 4 (7.0%) |
| $800 to $1,499 | 8 (4.7%) | 37 (64.9%) |
| $800 to $1,499 | 14 (8.3%) | 3 (5.3%) |
| Total | 169 (100.0%) | 57 (100.0%) |
Health & Disability in Richwood
Health Insurance Coverage by Age in Richwood
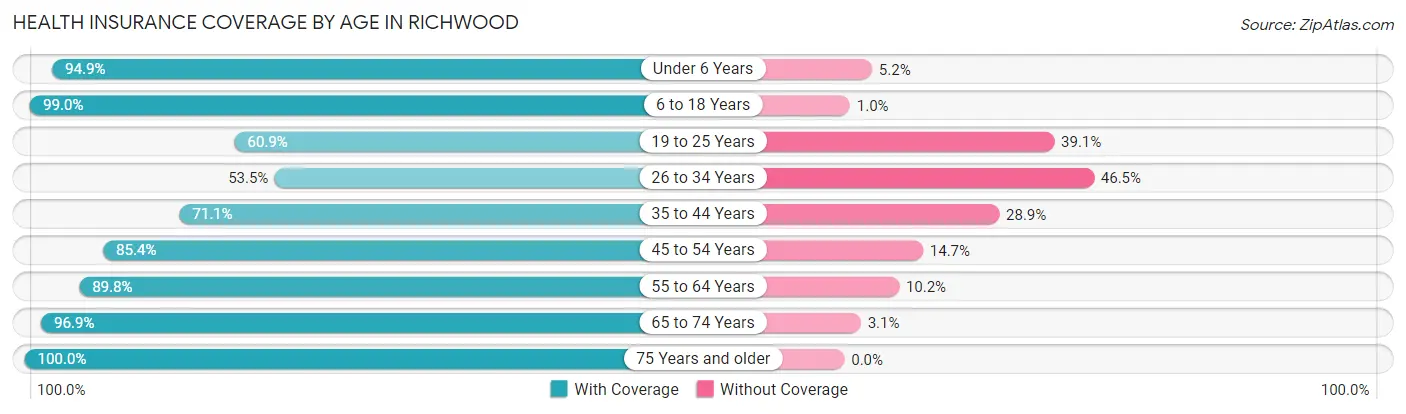
| Age Bracket | With Coverage | Without Coverage |
| Under 6 Years | 184 (94.9%) | 10 (5.1%) |
| 6 to 18 Years | 482 (99.0%) | 5 (1.0%) |
| 19 to 25 Years | 84 (60.9%) | 54 (39.1%) |
| 26 to 34 Years | 116 (53.5%) | 101 (46.5%) |
| 35 to 44 Years | 170 (71.1%) | 69 (28.9%) |
| 45 to 54 Years | 134 (85.4%) | 23 (14.6%) |
| 55 to 64 Years | 185 (89.8%) | 21 (10.2%) |
| 65 to 74 Years | 158 (96.9%) | 5 (3.1%) |
| 75 Years and older | 68 (100.0%) | 0 (0.0%) |
| Total | 1,581 (84.6%) | 288 (15.4%) |
Health Insurance Coverage by Citizenship Status in Richwood
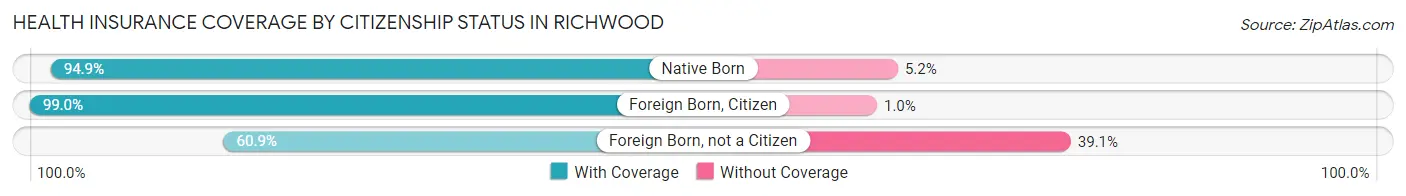
| Citizenship Status | With Coverage | Without Coverage |
| Native Born | 184 (94.9%) | 10 (5.1%) |
| Foreign Born, Citizen | 482 (99.0%) | 5 (1.0%) |
| Foreign Born, not a Citizen | 84 (60.9%) | 54 (39.1%) |
Health Insurance Coverage by Household Income in Richwood
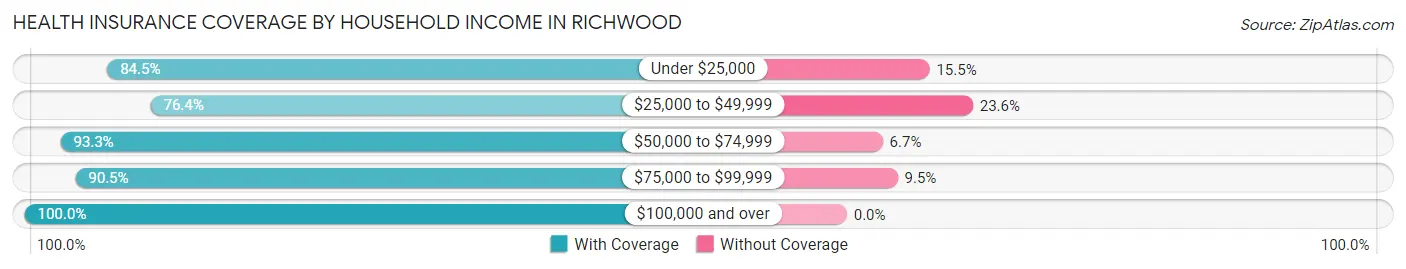
| Household Income | With Coverage | Without Coverage |
| Under $25,000 | 671 (84.5%) | 123 (15.5%) |
| $25,000 to $49,999 | 450 (76.4%) | 139 (23.6%) |
| $50,000 to $74,999 | 250 (93.3%) | 18 (6.7%) |
| $75,000 to $99,999 | 76 (90.5%) | 8 (9.5%) |
| $100,000 and over | 128 (100.0%) | 0 (0.0%) |
Public vs Private Health Insurance Coverage by Age in Richwood
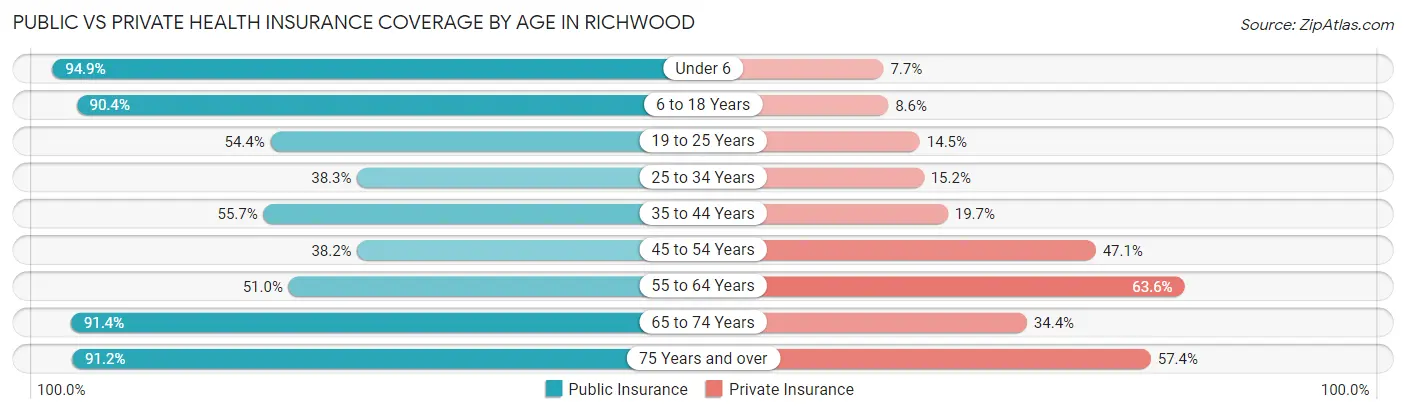
| Age Bracket | Public Insurance | Private Insurance |
| Under 6 | 184 (94.9%) | 15 (7.7%) |
| 6 to 18 Years | 440 (90.3%) | 42 (8.6%) |
| 19 to 25 Years | 75 (54.3%) | 20 (14.5%) |
| 25 to 34 Years | 83 (38.3%) | 33 (15.2%) |
| 35 to 44 Years | 133 (55.6%) | 47 (19.7%) |
| 45 to 54 Years | 60 (38.2%) | 74 (47.1%) |
| 55 to 64 Years | 105 (51.0%) | 131 (63.6%) |
| 65 to 74 Years | 149 (91.4%) | 56 (34.4%) |
| 75 Years and over | 62 (91.2%) | 39 (57.4%) |
| Total | 1,291 (69.1%) | 457 (24.4%) |
Disability Status by Sex by Age in Richwood
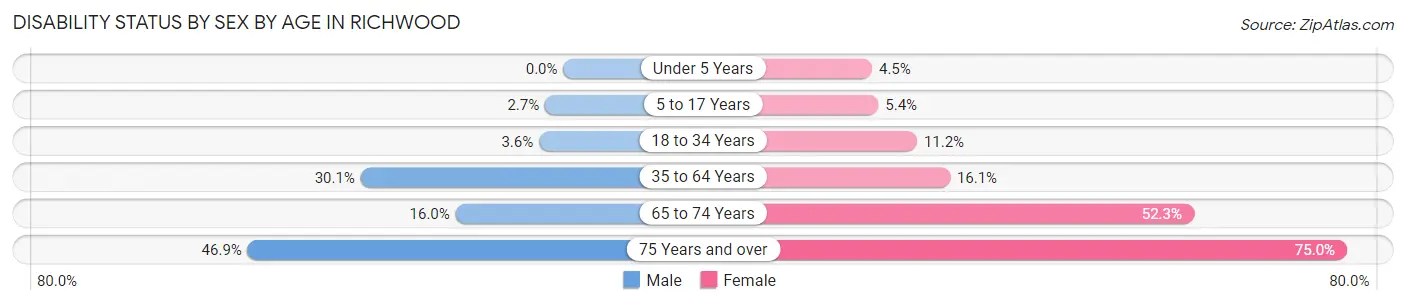
| Age Bracket | Male | Female |
| Under 5 Years | 0 (0.0%) | 4 (4.5%) |
| 5 to 17 Years | 5 (2.7%) | 15 (5.4%) |
| 18 to 34 Years | 6 (3.6%) | 26 (11.2%) |
| 35 to 64 Years | 65 (30.1%) | 62 (16.1%) |
| 65 to 74 Years | 12 (16.0%) | 46 (52.3%) |
| 75 Years and over | 15 (46.9%) | 27 (75.0%) |
Disability Class by Sex by Age in Richwood
Disability Class: Hearing Difficulty
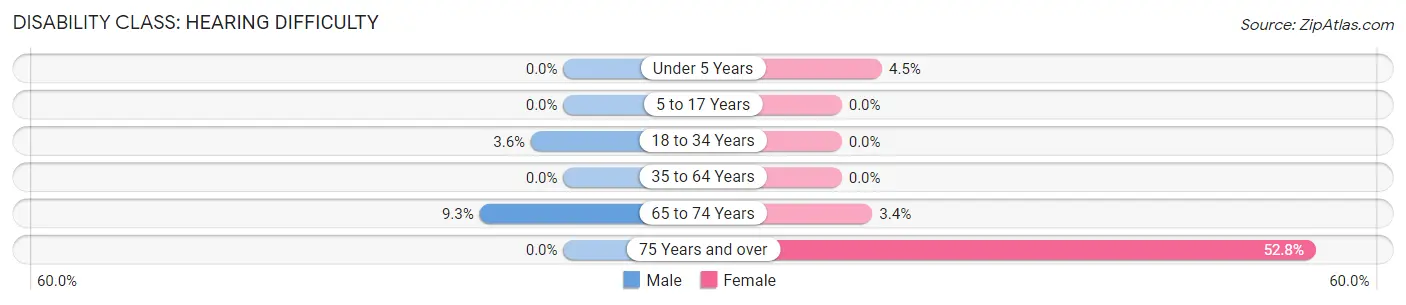
| Age Bracket | Male | Female |
| Under 5 Years | 0 (0.0%) | 4 (4.5%) |
| 5 to 17 Years | 0 (0.0%) | 0 (0.0%) |
| 18 to 34 Years | 6 (3.6%) | 0 (0.0%) |
| 35 to 64 Years | 0 (0.0%) | 0 (0.0%) |
| 65 to 74 Years | 7 (9.3%) | 3 (3.4%) |
| 75 Years and over | 0 (0.0%) | 19 (52.8%) |
Disability Class: Vision Difficulty
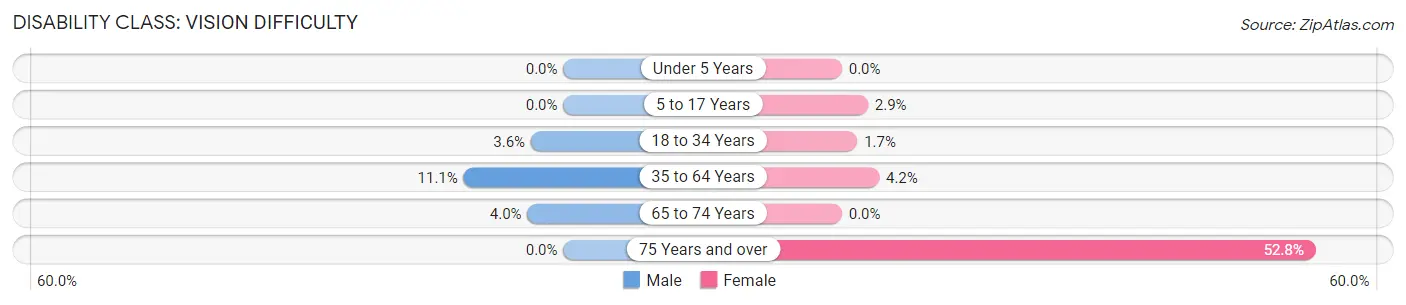
| Age Bracket | Male | Female |
| Under 5 Years | 0 (0.0%) | 0 (0.0%) |
| 5 to 17 Years | 0 (0.0%) | 8 (2.9%) |
| 18 to 34 Years | 6 (3.6%) | 4 (1.7%) |
| 35 to 64 Years | 24 (11.1%) | 16 (4.2%) |
| 65 to 74 Years | 3 (4.0%) | 0 (0.0%) |
| 75 Years and over | 0 (0.0%) | 19 (52.8%) |
Disability Class: Cognitive Difficulty
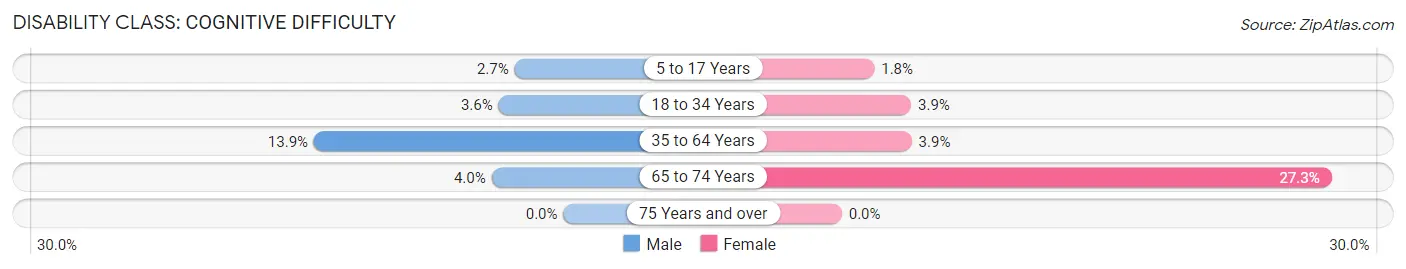
| Age Bracket | Male | Female |
| 5 to 17 Years | 5 (2.7%) | 5 (1.8%) |
| 18 to 34 Years | 6 (3.6%) | 9 (3.9%) |
| 35 to 64 Years | 30 (13.9%) | 15 (3.9%) |
| 65 to 74 Years | 3 (4.0%) | 24 (27.3%) |
| 75 Years and over | 0 (0.0%) | 0 (0.0%) |
Disability Class: Ambulatory Difficulty
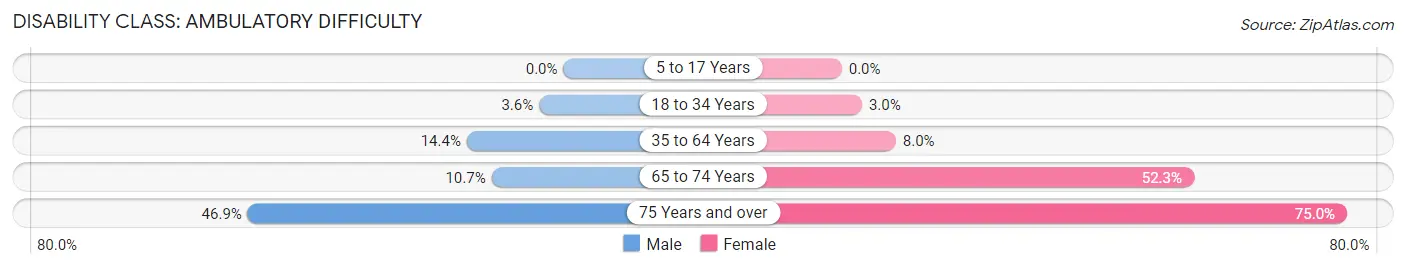
| Age Bracket | Male | Female |
| 5 to 17 Years | 0 (0.0%) | 0 (0.0%) |
| 18 to 34 Years | 6 (3.6%) | 7 (3.0%) |
| 35 to 64 Years | 31 (14.3%) | 31 (8.0%) |
| 65 to 74 Years | 8 (10.7%) | 46 (52.3%) |
| 75 Years and over | 15 (46.9%) | 27 (75.0%) |
Disability Class: Self-Care Difficulty
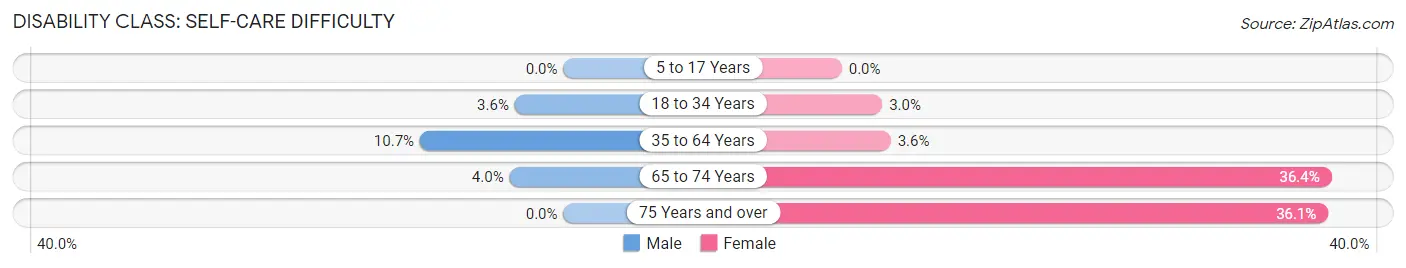
| Age Bracket | Male | Female |
| 5 to 17 Years | 0 (0.0%) | 0 (0.0%) |
| 18 to 34 Years | 6 (3.6%) | 7 (3.0%) |
| 35 to 64 Years | 23 (10.6%) | 14 (3.6%) |
| 65 to 74 Years | 3 (4.0%) | 32 (36.4%) |
| 75 Years and over | 0 (0.0%) | 13 (36.1%) |
Technology Access in Richwood
Computing Device Access in Richwood
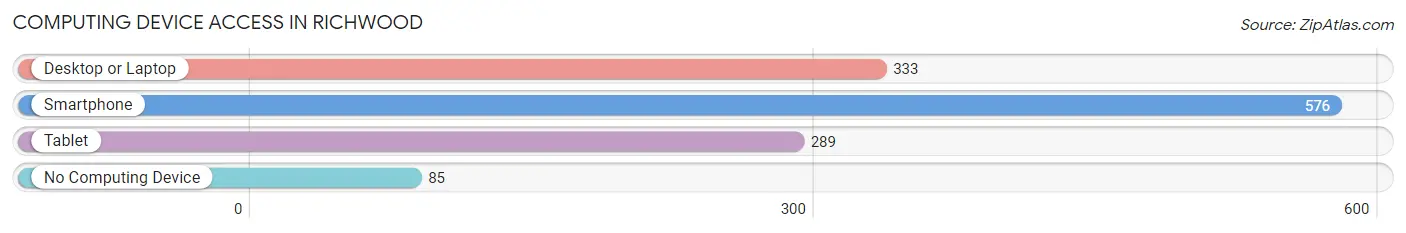
| Device Type | # Households | % Households |
| Desktop or Laptop | 333 | 48.5% |
| Smartphone | 576 | 83.8% |
| Tablet | 289 | 42.1% |
| No Computing Device | 85 | 12.4% |
| Total | 687 | 100.0% |
Internet Access in Richwood
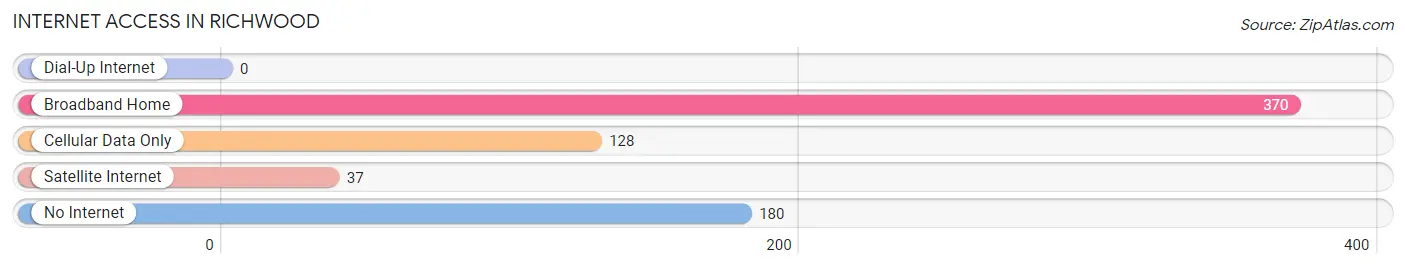
| Internet Type | # Households | % Households |
| Dial-Up Internet | 0 | 0.0% |
| Broadband Home | 370 | 53.9% |
| Cellular Data Only | 128 | 18.6% |
| Satellite Internet | 37 | 5.4% |
| No Internet | 180 | 26.2% |
| Total | 687 | 100.0% |
Richwood Summary
Richwood, Louisiana is a small town located in Ouachita Parish, Louisiana. It is situated on the banks of the Ouachita River, approximately 15 miles northeast of Monroe. Richwood is a rural community with a population of approximately 1,500 people.
History
Richwood was founded in 1845 by a group of settlers from the nearby town of Monroe. The town was named after the Richwood Plantation, which was owned by the family of one of the settlers. The plantation was located on the banks of the Ouachita River and was used to grow cotton and other crops.
In the late 1800s, Richwood became a popular destination for tourists and vacationers. The town was known for its beautiful scenery and its proximity to the river. It was also a popular spot for fishing and hunting.
In the early 1900s, Richwood began to experience a period of growth and development. The town was incorporated in 1909 and the first mayor was elected in 1910. During this time, the town saw the construction of several new businesses, including a bank, a hotel, and a general store.
In the 1950s, Richwood experienced a period of decline. The town’s population decreased and many of the businesses closed. In the late 1970s, the town began to experience a period of revitalization. The town was able to attract new businesses and residents, and the population began to grow again.
Geography
Richwood is located in Ouachita Parish, Louisiana. It is situated on the banks of the Ouachita River, approximately 15 miles northeast of Monroe. The town is surrounded by rolling hills and forests. The climate in Richwood is humid subtropical, with hot summers and mild winters.
Economy
The economy of Richwood is largely based on agriculture and tourism. The town is home to several farms, which produce a variety of crops, including cotton, soybeans, corn, and wheat. The town is also home to several tourist attractions, including the Richwood Plantation, which is a popular destination for visitors.
In addition to agriculture and tourism, Richwood is home to several small businesses, including restaurants, retail stores, and service providers. The town is also home to a number of manufacturing companies, which produce a variety of products, including furniture, clothing, and electronics.
Demographics
As of the 2010 census, the population of Richwood was 1,521. The racial makeup of the town was 79.3% White, 17.7% African American, 0.3% Native American, 0.2% Asian, 0.1% Pacific Islander, and 2.4% from other races. The median household income in Richwood was $31,250, and the median family income was $37,500.
Richwood is a small, rural town with a rich history and a bright future. The town is home to a diverse population and a vibrant economy. Richwood is a great place to live, work, and play.
Common Questions
What is Per Capita Income in Richwood?
Per Capita income in Richwood is $9,788.
What is the Median Family Income in Richwood?
Median Family Income in Richwood is $32,772.
What is the Median Household income in Richwood?
Median Household Income in Richwood is $28,594.
What is Income or Wage Gap in Richwood?
Income or Wage Gap in Richwood is 43.2%.
Women in Richwood earn 56.8 cents for every dollar earned by a man.
What is Inequality or Gini Index in Richwood?
Inequality or Gini Index in Richwood is 0.44.
What is the Total Population of Richwood?
Total Population of Richwood is 3,847.
What is the Total Male Population of Richwood?
Total Male Population of Richwood is 2,711.
What is the Total Female Population of Richwood?
Total Female Population of Richwood is 1,136.
What is the Ratio of Males per 100 Females in Richwood?
There are 238.64 Males per 100 Females in Richwood.
What is the Ratio of Females per 100 Males in Richwood?
There are 41.90 Females per 100 Males in Richwood.
What is the Median Population Age in Richwood?
Median Population Age in Richwood is 35.6 Years.
What is the Average Family Size in Richwood
Average Family Size in Richwood is 3.7 People.
What is the Average Household Size in Richwood
Average Household Size in Richwood is 2.7 People.
How Large is the Labor Force in Richwood?
There are 732 People in the Labor Forcein in Richwood.
What is the Percentage of People in the Labor Force in Richwood?
22.4% of People are in the Labor Force in Richwood.
What is the Unemployment Rate in Richwood?
Unemployment Rate in Richwood is 12.0%.