East Hodge, LA Map & Demographics
East Hodge Map
East Hodge Overview
$12,216
PER CAPITA INCOME
$25,114
AVG FAMILY INCOME
$25,568
AVG HOUSEHOLD INCOME
0.36
INEQUALITY / GINI INDEX
333
TOTAL POPULATION
145
MALE POPULATION
188
FEMALE POPULATION
77.13
MALES / 100 FEMALES
129.66
FEMALES / 100 MALES
30.6
MEDIAN AGE
3.9
AVG FAMILY SIZE
2.9
AVG HOUSEHOLD SIZE
85
LABOR FORCE [ PEOPLE ]
38.5%
PERCENT IN LABOR FORCE
Income in East Hodge
Income Overview in East Hodge
Per Capita Income in East Hodge is $12,216, while median incomes of families and households are $25,114 and $25,568 respectively.
| Characteristic | Number | Measure |
| Per Capita Income | 333 | $12,216 |
| Median Family Income | 73 | $25,114 |
| Mean Family Income | 73 | $28,964 |
| Median Household Income | 117 | $25,568 |
| Mean Household Income | 117 | $31,811 |
| Income Deficit | 73 | $0 |
| Wage / Income Gap (%) | 333 | 0.00% |
| Wage / Income Gap ($) | 333 | 100.00¢ per $1 |
| Gini / Inequality Index | 333 | 0.36 |
Earnings by Sex in East Hodge
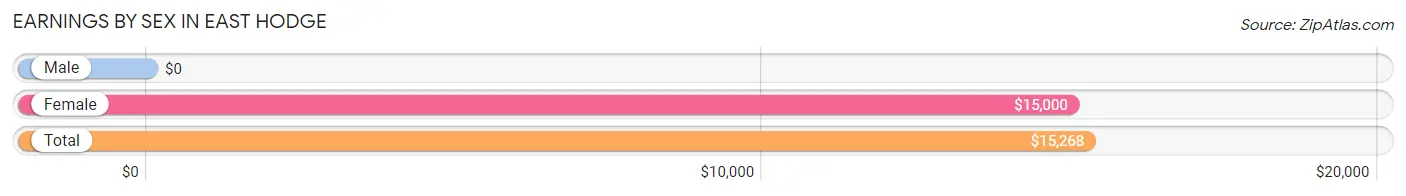
| Sex | Number | Average Earnings |
| Male | 24 (25.0%) | $0 |
| Female | 72 (75.0%) | $15,000 |
| Total | 96 (100.0%) | $15,268 |
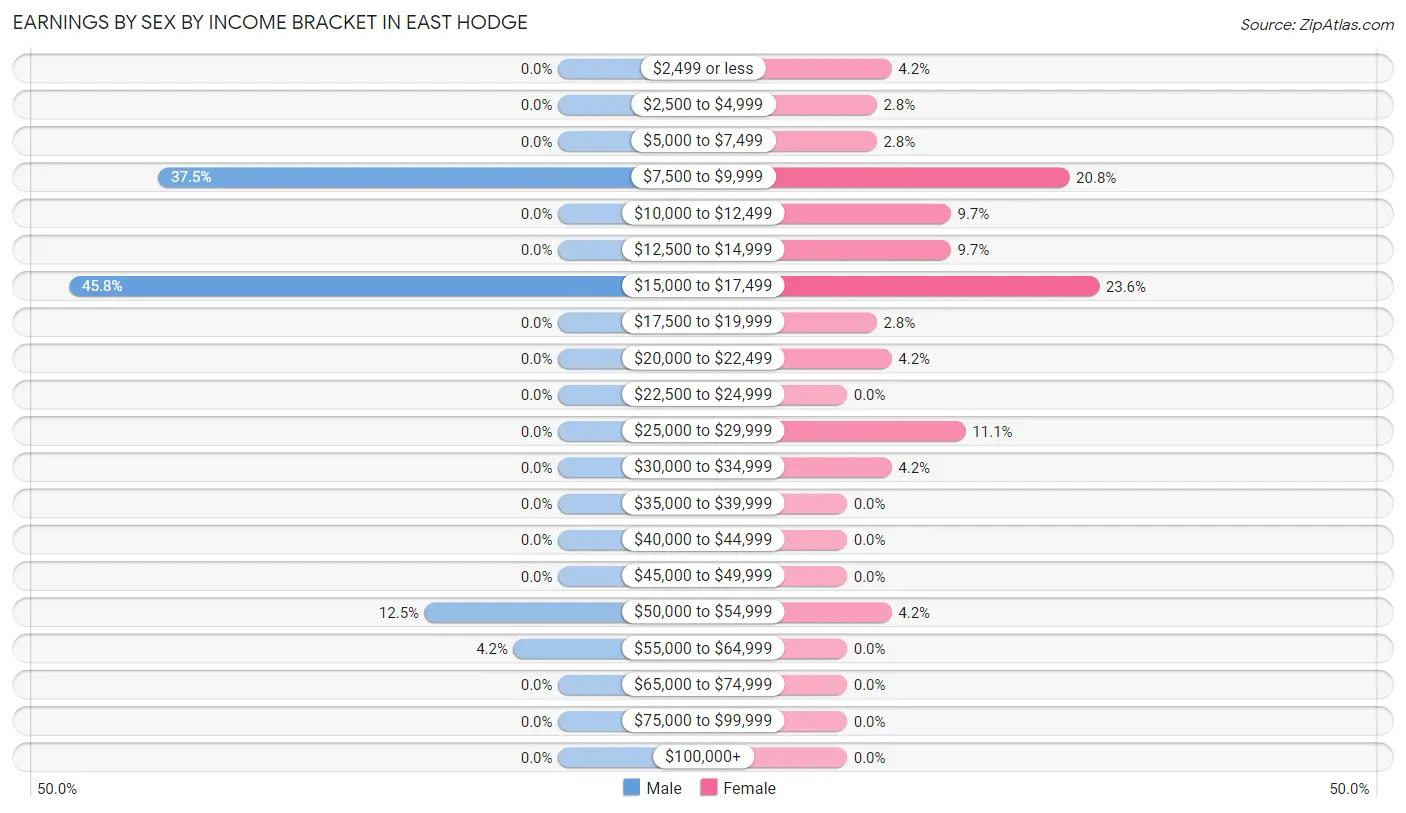
Earnings by Sex by Income Bracket in East Hodge
The most common earnings brackets in East Hodge are $15,000 to $17,499 for men (11 | 45.8%) and $15,000 to $17,499 for women (17 | 23.6%).
| Income | Male | Female |
| $2,499 or less | 0 (0.0%) | 3 (4.2%) |
| $2,500 to $4,999 | 0 (0.0%) | 2 (2.8%) |
| $5,000 to $7,499 | 0 (0.0%) | 2 (2.8%) |
| $7,500 to $9,999 | 9 (37.5%) | 15 (20.8%) |
| $10,000 to $12,499 | 0 (0.0%) | 7 (9.7%) |
| $12,500 to $14,999 | 0 (0.0%) | 7 (9.7%) |
| $15,000 to $17,499 | 11 (45.8%) | 17 (23.6%) |
| $17,500 to $19,999 | 0 (0.0%) | 2 (2.8%) |
| $20,000 to $22,499 | 0 (0.0%) | 3 (4.2%) |
| $22,500 to $24,999 | 0 (0.0%) | 0 (0.0%) |
| $25,000 to $29,999 | 0 (0.0%) | 8 (11.1%) |
| $30,000 to $34,999 | 0 (0.0%) | 3 (4.2%) |
| $35,000 to $39,999 | 0 (0.0%) | 0 (0.0%) |
| $40,000 to $44,999 | 0 (0.0%) | 0 (0.0%) |
| $45,000 to $49,999 | 0 (0.0%) | 0 (0.0%) |
| $50,000 to $54,999 | 3 (12.5%) | 3 (4.2%) |
| $55,000 to $64,999 | 1 (4.2%) | 0 (0.0%) |
| $65,000 to $74,999 | 0 (0.0%) | 0 (0.0%) |
| $75,000 to $99,999 | 0 (0.0%) | 0 (0.0%) |
| $100,000+ | 0 (0.0%) | 0 (0.0%) |
| Total | 24 (100.0%) | 72 (100.0%) |
Earnings by Sex by Educational Attainment in East Hodge
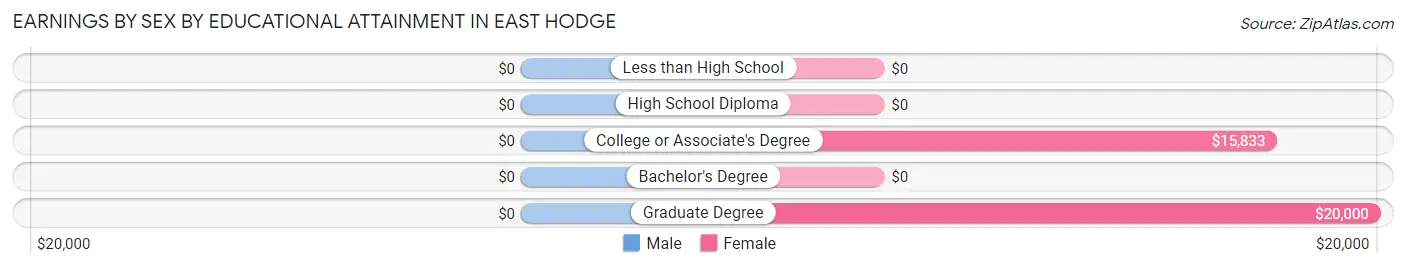
| Educational Attainment | Male Income | Female Income |
| Less than High School | - | - |
| High School Diploma | - | - |
| College or Associate's Degree | - | - |
| Bachelor's Degree | - | - |
| Graduate Degree | - | - |
| Total | - | - |
Family Income in East Hodge
Family Income Brackets in East Hodge
According to the East Hodge family income data, there are 20 families falling into the $15,000 to $24,999 income range, which is the most common income bracket and makes up 27.4% of all families.
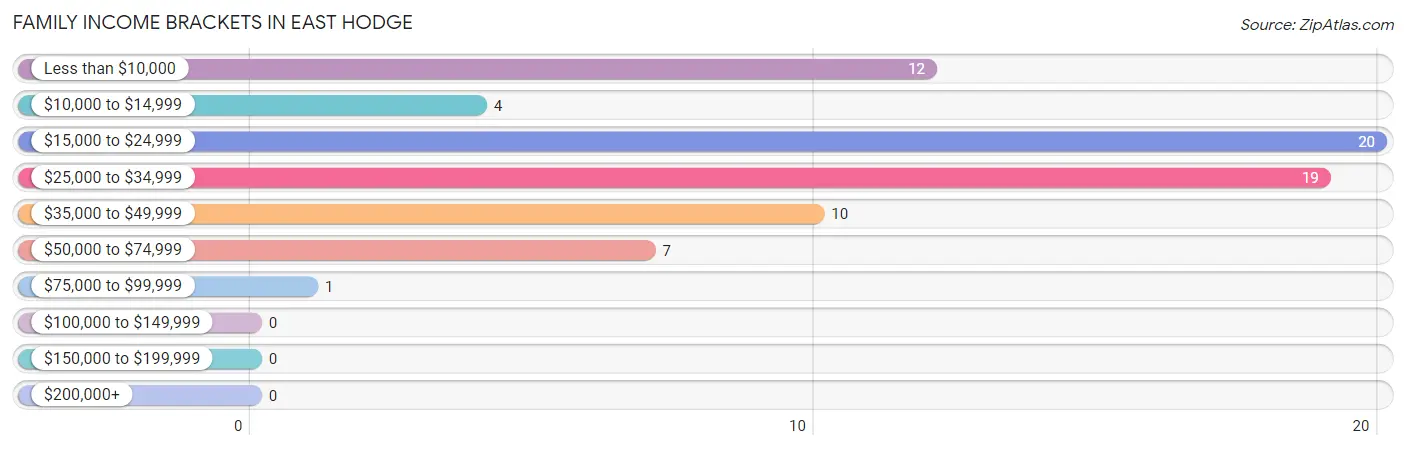
| Income Bracket | # Families | % Families |
| Less than $10,000 | 12 | 16.4% |
| $10,000 to $14,999 | 4 | 5.5% |
| $15,000 to $24,999 | 20 | 27.4% |
| $25,000 to $34,999 | 19 | 26.0% |
| $35,000 to $49,999 | 10 | 13.7% |
| $50,000 to $74,999 | 7 | 9.6% |
| $75,000 to $99,999 | 1 | 1.4% |
| $100,000 to $149,999 | 0 | 0.0% |
| $150,000 to $199,999 | 0 | 0.0% |
| $200,000+ | 0 | 0.0% |
Family Income by Famaliy Size in East Hodge
3-person families (19 | 26.0%) account for the highest median family income in East Hodge with $26,250 per family, while 2-person families (41 | 56.2%) have the highest median income of $12,344 per family member.
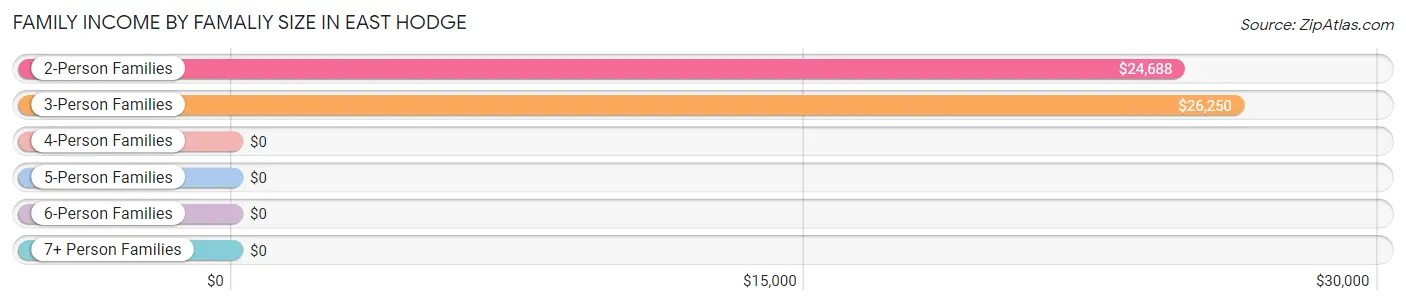
| Income Bracket | # Families | Median Income |
| 2-Person Families | 41 (56.2%) | $24,688 |
| 3-Person Families | 19 (26.0%) | $26,250 |
| 4-Person Families | 12 (16.4%) | $0 |
| 5-Person Families | 0 (0.0%) | $0 |
| 6-Person Families | 1 (1.4%) | $0 |
| 7+ Person Families | 0 (0.0%) | $0 |
| Total | 73 (100.0%) | $25,114 |
Family Income by Number of Earners in East Hodge
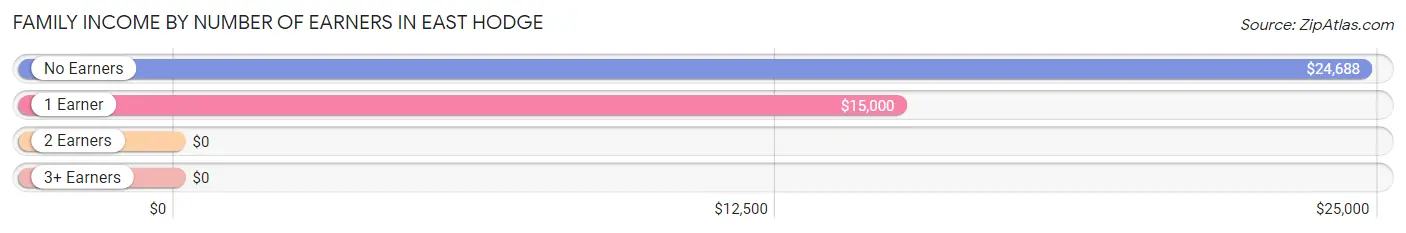
| Number of Earners | # Families | Median Income |
| No Earners | 29 (39.7%) | $24,688 |
| 1 Earner | 28 (38.4%) | $15,000 |
| 2 Earners | 16 (21.9%) | $0 |
| 3+ Earners | 0 (0.0%) | $0 |
| Total | 73 (100.0%) | $25,114 |
Household Income in East Hodge
Household Income Brackets in East Hodge
With 27 households falling in the category, the $15,000 to $24,999 income range is the most frequent in East Hodge, accounting for 23.1% of all households.
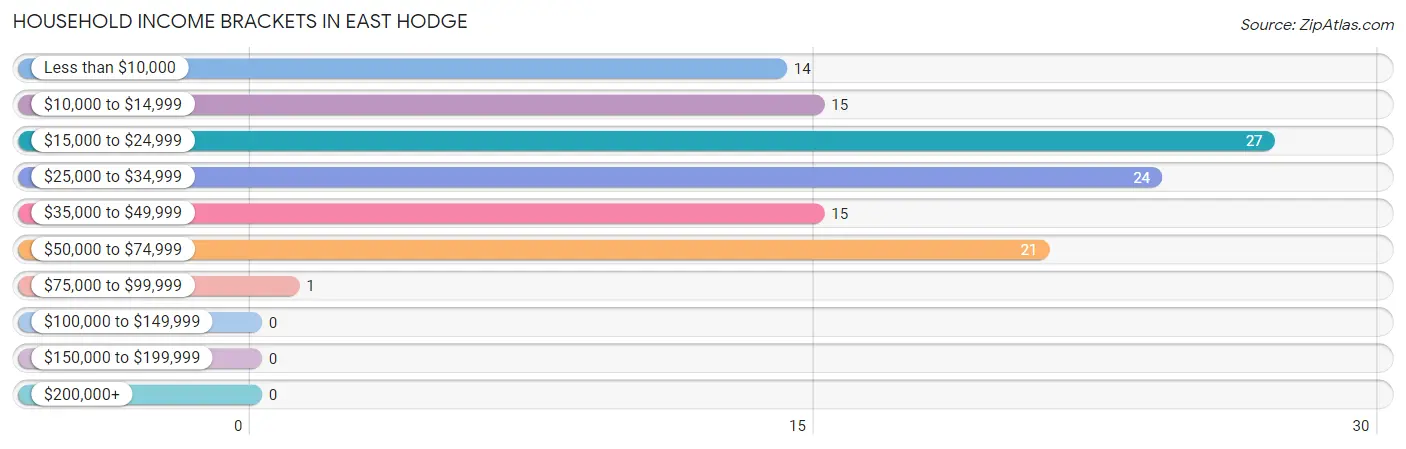
| Income Bracket | # Households | % Households |
| Less than $10,000 | 14 | 12.0% |
| $10,000 to $14,999 | 15 | 12.8% |
| $15,000 to $24,999 | 27 | 23.1% |
| $25,000 to $34,999 | 24 | 20.5% |
| $35,000 to $49,999 | 15 | 12.8% |
| $50,000 to $74,999 | 21 | 17.9% |
| $75,000 to $99,999 | 1 | 0.9% |
| $100,000 to $149,999 | 0 | 0.0% |
| $150,000 to $199,999 | 0 | 0.0% |
| $200,000+ | 0 | 0.0% |
Household Income by Householder Age in East Hodge
The median household income in East Hodge is $25,568, with the highest median household income of $29,583 found in the 65+ years age bracket for the primary householder. A total of 65 households (55.6%) fall into this category.
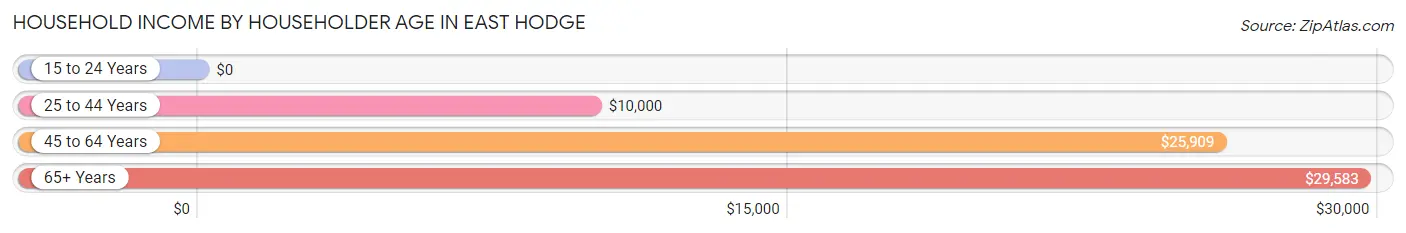
| Income Bracket | # Households | Median Income |
| 15 to 24 Years | 0 (0.0%) | $0 |
| 25 to 44 Years | 24 (20.5%) | $10,000 |
| 45 to 64 Years | 28 (23.9%) | $25,909 |
| 65+ Years | 65 (55.6%) | $29,583 |
| Total | 117 (100.0%) | $25,568 |
Poverty in East Hodge
Income Below Poverty by Sex and Age in East Hodge
With 37.9% poverty level for males and 52.7% for females among the residents of East Hodge, under 5 year old males and 5 year old females are the most vulnerable to poverty, with 10 males (100.0%) and 2 females (100.0%) in their respective age groups living below the poverty level.
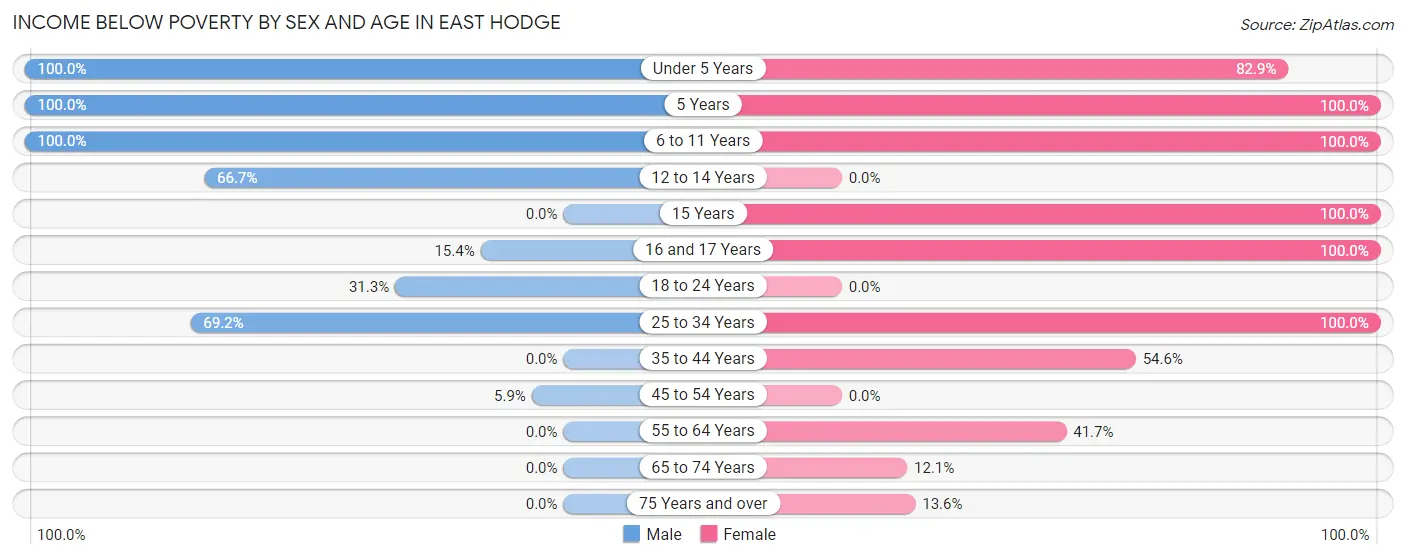
| Age Bracket | Male | Female |
| Under 5 Years | 10 (100.0%) | 29 (82.9%) |
| 5 Years | 7 (100.0%) | 2 (100.0%) |
| 6 to 11 Years | 13 (100.0%) | 29 (100.0%) |
| 12 to 14 Years | 8 (66.7%) | 0 (0.0%) |
| 15 Years | 0 (0.0%) | 4 (100.0%) |
| 16 and 17 Years | 2 (15.4%) | 3 (100.0%) |
| 18 to 24 Years | 5 (31.2%) | 0 (0.0%) |
| 25 to 34 Years | 9 (69.2%) | 14 (100.0%) |
| 35 to 44 Years | 0 (0.0%) | 6 (54.5%) |
| 45 to 54 Years | 1 (5.9%) | 0 (0.0%) |
| 55 to 64 Years | 0 (0.0%) | 5 (41.7%) |
| 65 to 74 Years | 0 (0.0%) | 4 (12.1%) |
| 75 Years and over | 0 (0.0%) | 3 (13.6%) |
| Total | 55 (37.9%) | 99 (52.7%) |
Income Above Poverty by Sex and Age in East Hodge
According to the poverty statistics in East Hodge, males aged 35 to 44 years and females aged 18 to 24 years are the age groups that are most secure financially, with 100.0% of males and 100.0% of females in these age groups living above the poverty line.
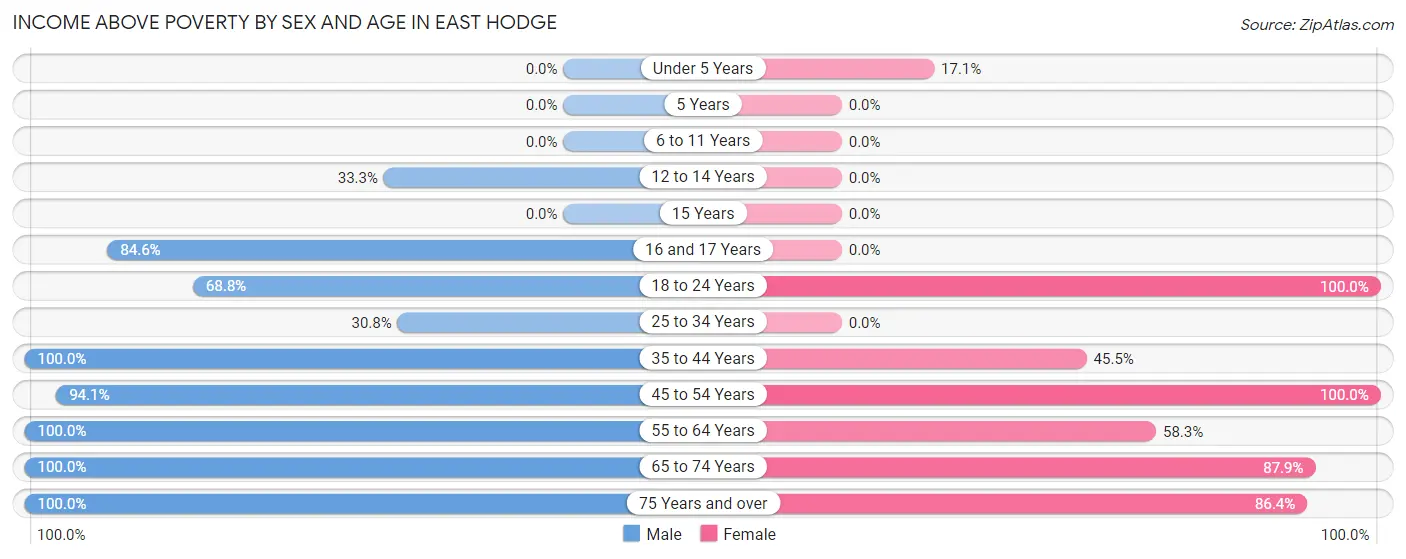
| Age Bracket | Male | Female |
| Under 5 Years | 0 (0.0%) | 6 (17.1%) |
| 5 Years | 0 (0.0%) | 0 (0.0%) |
| 6 to 11 Years | 0 (0.0%) | 0 (0.0%) |
| 12 to 14 Years | 4 (33.3%) | 0 (0.0%) |
| 15 Years | 0 (0.0%) | 0 (0.0%) |
| 16 and 17 Years | 11 (84.6%) | 0 (0.0%) |
| 18 to 24 Years | 11 (68.8%) | 14 (100.0%) |
| 25 to 34 Years | 4 (30.8%) | 0 (0.0%) |
| 35 to 44 Years | 6 (100.0%) | 5 (45.5%) |
| 45 to 54 Years | 16 (94.1%) | 9 (100.0%) |
| 55 to 64 Years | 7 (100.0%) | 7 (58.3%) |
| 65 to 74 Years | 15 (100.0%) | 29 (87.9%) |
| 75 Years and over | 16 (100.0%) | 19 (86.4%) |
| Total | 90 (62.1%) | 89 (47.3%) |
Income Below Poverty Among Married-Couple Families in East Hodge
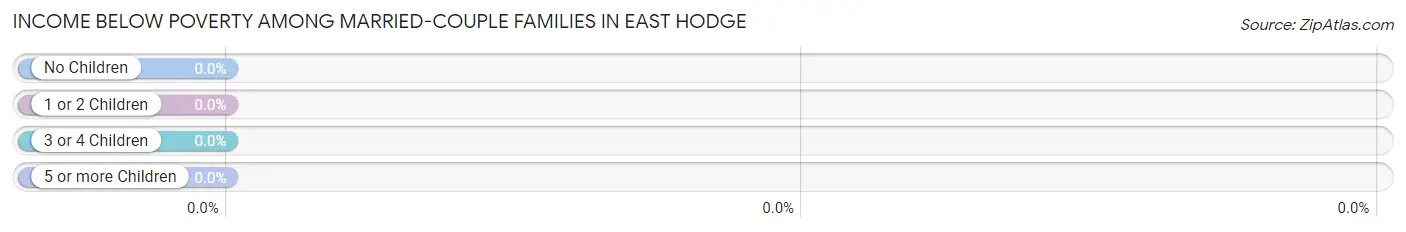
| Children | Above Poverty | Below Poverty |
| No Children | 21 (100.0%) | 0 (0.0%) |
| 1 or 2 Children | 11 (100.0%) | 0 (0.0%) |
| 3 or 4 Children | 0 (0.0%) | 0 (0.0%) |
| 5 or more Children | 0 (0.0%) | 0 (0.0%) |
| Total | 32 (100.0%) | 0 (0.0%) |
Income Below Poverty Among Single-Parent Households in East Hodge
According to the poverty data in East Hodge, 55.6% or 5 single-father households and 62.5% or 20 single-mother households are living below the poverty line. Among single-father households, those with 1 or 2 children have the highest poverty rate, with 4 households (100.0%) experiencing poverty. Likewise, among single-mother households, those with 3 or 4 children have the highest poverty rate, with 10 households (100.0%) falling below the poverty line.
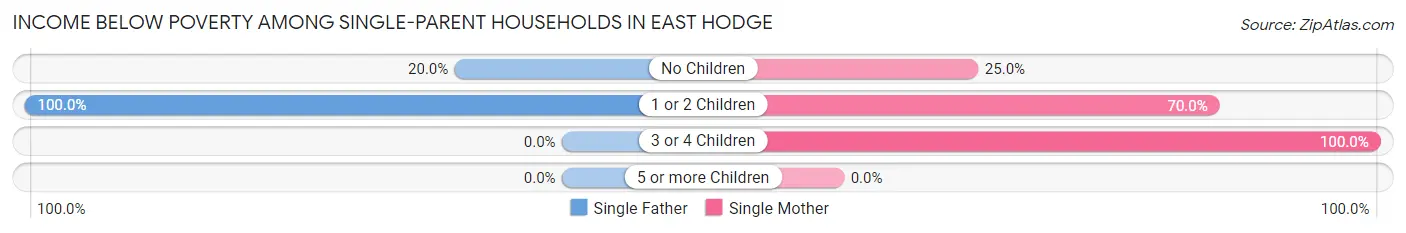
| Children | Single Father | Single Mother |
| No Children | 1 (20.0%) | 3 (25.0%) |
| 1 or 2 Children | 4 (100.0%) | 7 (70.0%) |
| 3 or 4 Children | 0 (0.0%) | 10 (100.0%) |
| 5 or more Children | 0 (0.0%) | 0 (0.0%) |
| Total | 5 (55.6%) | 20 (62.5%) |
Income Below Poverty Among Married-Couple vs Single-Parent Households in East Hodge
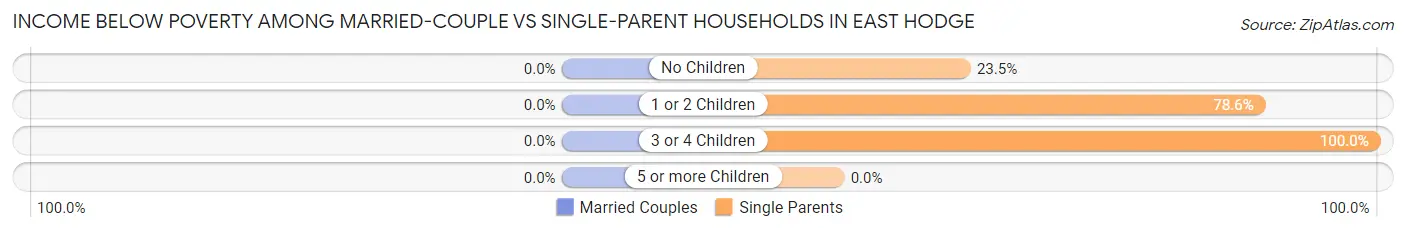
| Children | Married-Couple Families | Single-Parent Households |
| No Children | 0 (0.0%) | 4 (23.5%) |
| 1 or 2 Children | 0 (0.0%) | 11 (78.6%) |
| 3 or 4 Children | 0 (0.0%) | 10 (100.0%) |
| 5 or more Children | 0 (0.0%) | 0 (0.0%) |
| Total | 0 (0.0%) | 25 (61.0%) |
Race in East Hodge
The most populous races in East Hodge are Black / African American (332 | 99.7%), and Two or more Races (1 | 0.3%).
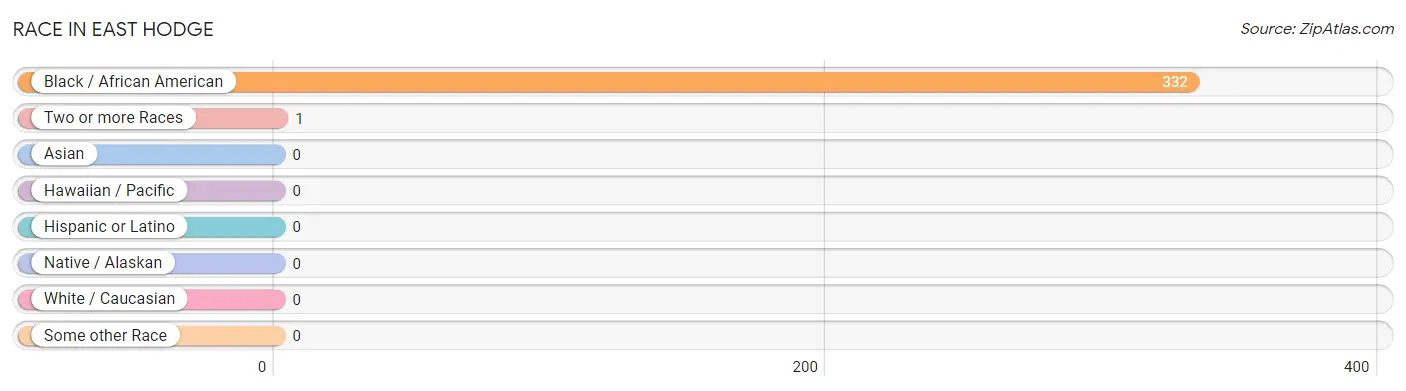
| Race | # Population | % Population |
| Asian | 0 | 0.0% |
| Black / African American | 332 | 99.7% |
| Hawaiian / Pacific | 0 | 0.0% |
| Hispanic or Latino | 0 | 0.0% |
| Native / Alaskan | 0 | 0.0% |
| White / Caucasian | 0 | 0.0% |
| Two or more Races | 1 | 0.3% |
| Some other Race | 0 | 0.0% |
| Total | 333 | 100.0% |
Ancestry in East Hodge
The most populous ancestries reported in East Hodge are American (19 | 5.7%), African (4 | 1.2%), Subsaharan African (4 | 1.2%), French (1 | 0.3%), and Irish (1 | 0.3%), together accounting for 8.7% of all East Hodge residents.
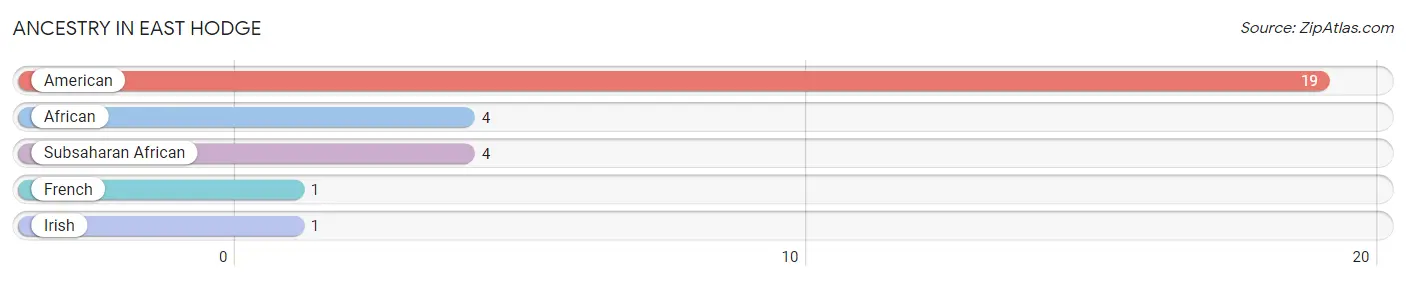
| Ancestry | # Population | % Population |
| African | 4 | 1.2% |
| American | 19 | 5.7% |
| French | 1 | 0.3% |
| Irish | 1 | 0.3% |
| Subsaharan African | 4 | 1.2% | View All 5 Rows |
Immigrants in East Hodge

| Immigration Origin | # Population | % Population | View All 0 Rows |
Sex and Age in East Hodge
Sex and Age in East Hodge
The most populous age groups in East Hodge are 15 to 19 Years (24 | 16.6%) for men and Under 5 Years (35 | 18.6%) for women.
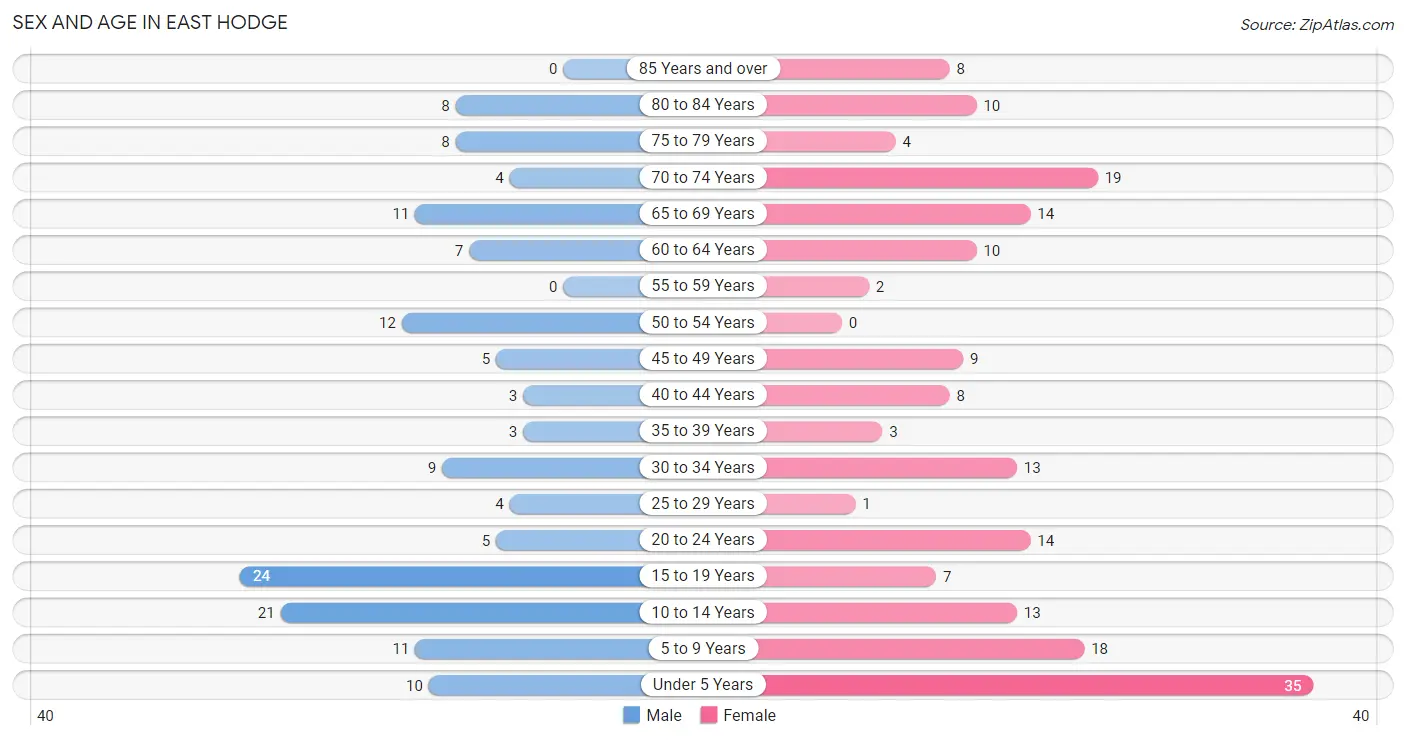
| Age Bracket | Male | Female |
| Under 5 Years | 10 (6.9%) | 35 (18.6%) |
| 5 to 9 Years | 11 (7.6%) | 18 (9.6%) |
| 10 to 14 Years | 21 (14.5%) | 13 (6.9%) |
| 15 to 19 Years | 24 (16.6%) | 7 (3.7%) |
| 20 to 24 Years | 5 (3.5%) | 14 (7.4%) |
| 25 to 29 Years | 4 (2.8%) | 1 (0.5%) |
| 30 to 34 Years | 9 (6.2%) | 13 (6.9%) |
| 35 to 39 Years | 3 (2.1%) | 3 (1.6%) |
| 40 to 44 Years | 3 (2.1%) | 8 (4.3%) |
| 45 to 49 Years | 5 (3.5%) | 9 (4.8%) |
| 50 to 54 Years | 12 (8.3%) | 0 (0.0%) |
| 55 to 59 Years | 0 (0.0%) | 2 (1.1%) |
| 60 to 64 Years | 7 (4.8%) | 10 (5.3%) |
| 65 to 69 Years | 11 (7.6%) | 14 (7.4%) |
| 70 to 74 Years | 4 (2.8%) | 19 (10.1%) |
| 75 to 79 Years | 8 (5.5%) | 4 (2.1%) |
| 80 to 84 Years | 8 (5.5%) | 10 (5.3%) |
| 85 Years and over | 0 (0.0%) | 8 (4.3%) |
| Total | 145 (100.0%) | 188 (100.0%) |
Families and Households in East Hodge
Median Family Size in East Hodge
The median family size in East Hodge is 3.93 persons per family, with single female/mother families (32 | 43.8%) accounting for the largest median family size of 5.63 persons per family. On the other hand, married-couple families (32 | 43.8%) represent the smallest median family size with 2.56 persons per family.
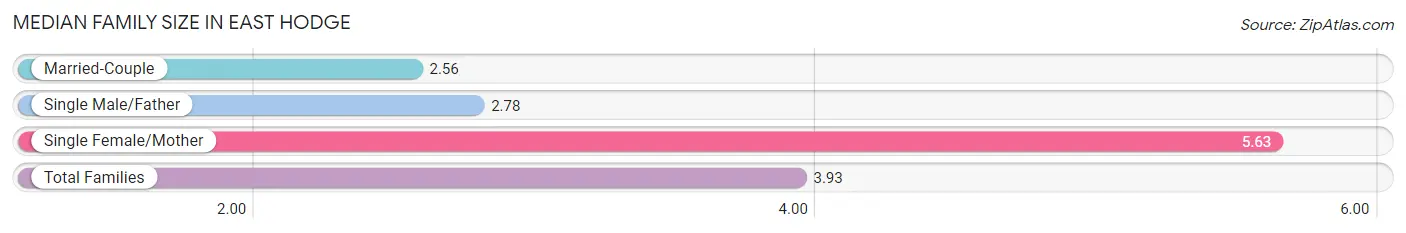
| Family Type | # Families | Family Size |
| Married-Couple | 32 (43.8%) | 2.56 |
| Single Male/Father | 9 (12.3%) | 2.78 |
| Single Female/Mother | 32 (43.8%) | 5.63 |
| Total Families | 73 (100.0%) | 3.93 |
Median Household Size in East Hodge
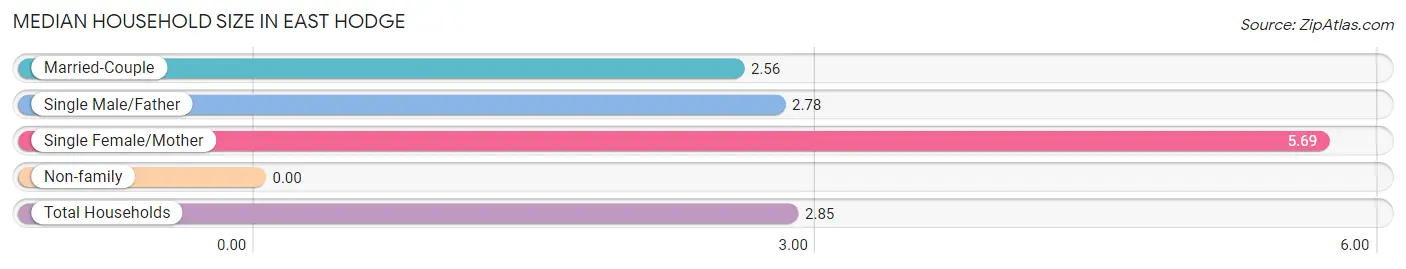
| Household Type | # Households | Household Size |
| Married-Couple | 32 (27.4%) | 2.56 |
| Single Male/Father | 9 (7.7%) | 2.78 |
| Single Female/Mother | 32 (27.4%) | 5.69 |
| Non-family | 44 (37.6%) | - |
| Total Households | 117 (100.0%) | 2.85 |
Household Size by Marriage Status in East Hodge
Out of a total of 117 households in East Hodge, 73 (62.4%) are family households, while 44 (37.6%) are nonfamily households. The most numerous type of family households are 2-person households, comprising 39, and the most common type of nonfamily households are 1-person households, comprising 44.
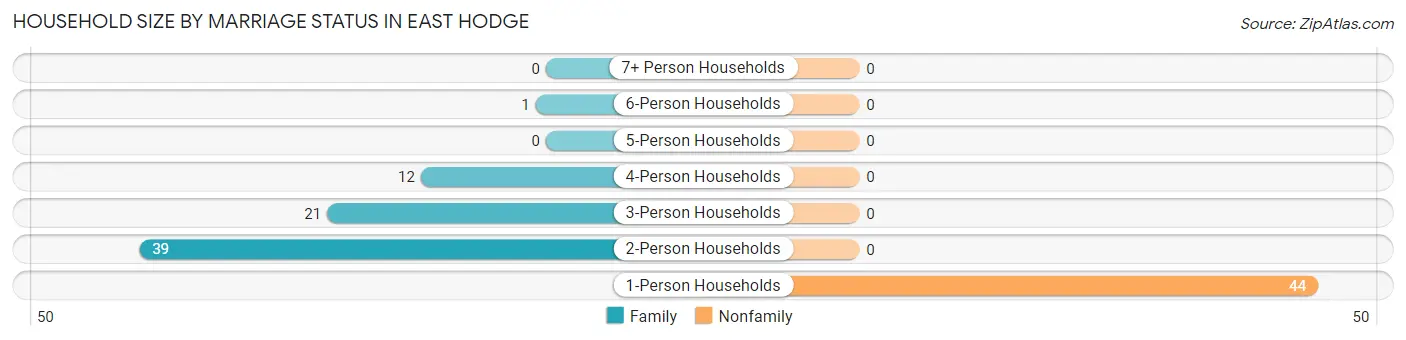
| Household Size | Family Households | Nonfamily Households |
| 1-Person Households | - | 44 (37.6%) |
| 2-Person Households | 39 (33.3%) | 0 (0.0%) |
| 3-Person Households | 21 (17.9%) | 0 (0.0%) |
| 4-Person Households | 12 (10.3%) | 0 (0.0%) |
| 5-Person Households | 0 (0.0%) | 0 (0.0%) |
| 6-Person Households | 1 (0.9%) | 0 (0.0%) |
| 7+ Person Households | 0 (0.0%) | 0 (0.0%) |
| Total | 73 (62.4%) | 44 (37.6%) |
Female Fertility in East Hodge
Fertility by Age in East Hodge
Average fertility rate in East Hodge is 18.0 births per 1,000 women. Women in the age bracket of 20 to 34 years have the highest fertility rate with 36.0 births per 1,000 women. Women in the age bracket of 20 to 34 years acount for 100.0% of all women with births.
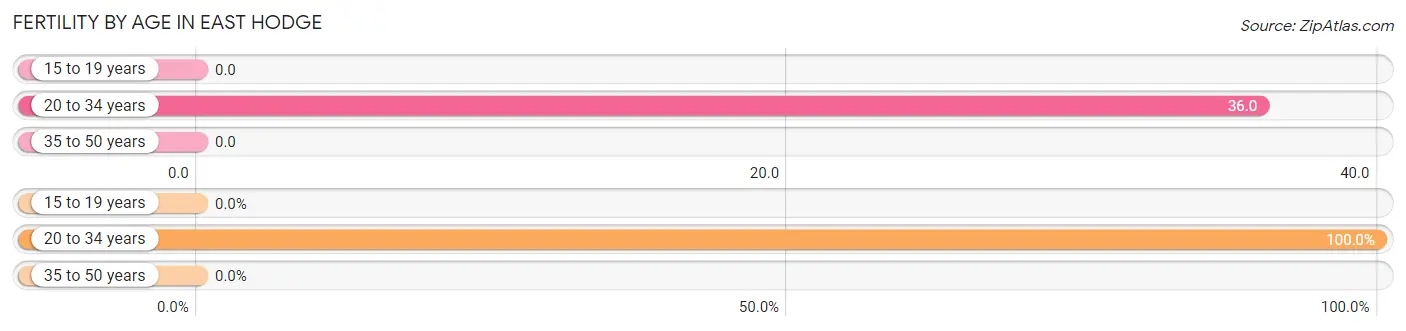
| Age Bracket | Women with Births | Births / 1,000 Women |
| 15 to 19 years | 0 (0.0%) | 0.0 |
| 20 to 34 years | 1 (100.0%) | 36.0 |
| 35 to 50 years | 0 (0.0%) | 0.0 |
| Total | 1 (100.0%) | 18.0 |
Fertility by Age by Marriage Status in East Hodge
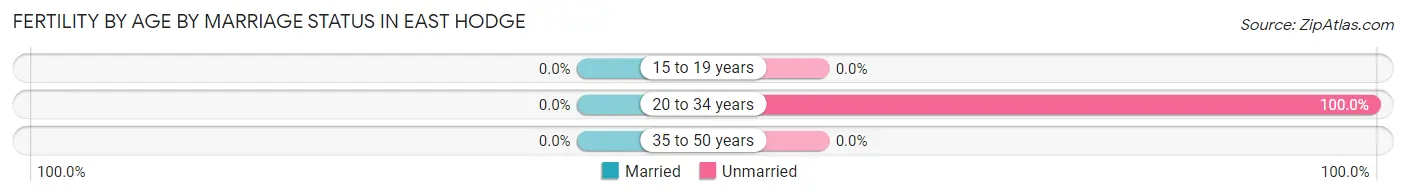
| Age Bracket | Married | Unmarried |
| 15 to 19 years | 0 (0.0%) | 0 (0.0%) |
| 20 to 34 years | 0 (0.0%) | 1 (100.0%) |
| 35 to 50 years | 0 (0.0%) | 0 (0.0%) |
| Total | 0 (0.0%) | 1 (100.0%) |
Fertility by Education in East Hodge
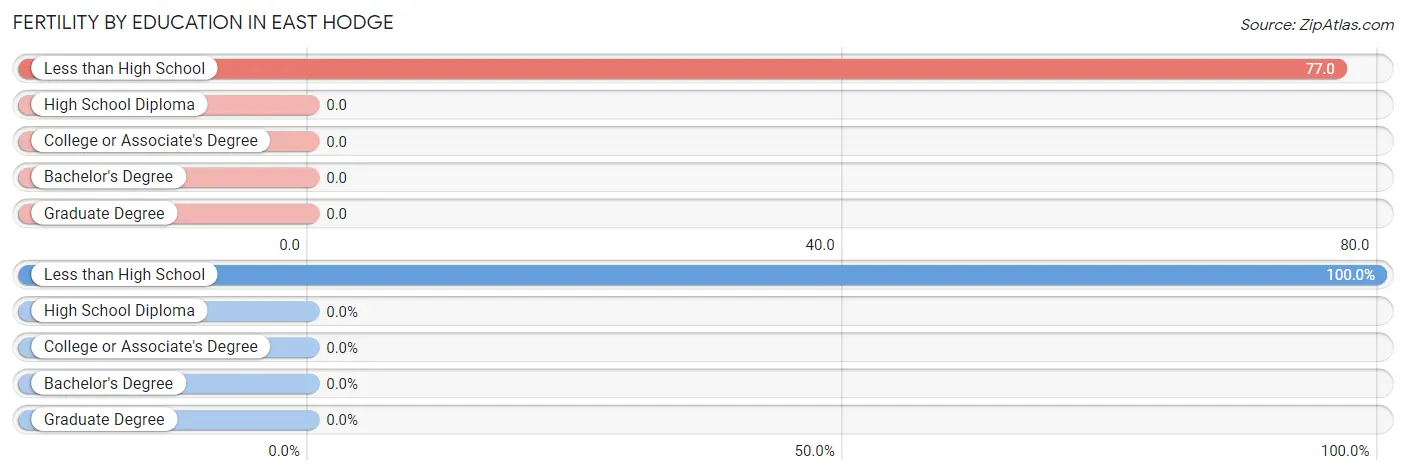
| Educational Attainment | Women with Births | Births / 1,000 Women |
| Less than High School | 1 (100.0%) | 77.0 |
| High School Diploma | 0 (0.0%) | 0.0 |
| College or Associate's Degree | 0 (0.0%) | 0.0 |
| Bachelor's Degree | 0 (0.0%) | 0.0 |
| Graduate Degree | 0 (0.0%) | 0.0 |
| Total | 1 (100.0%) | 18.0 |
Fertility by Education by Marriage Status in East Hodge
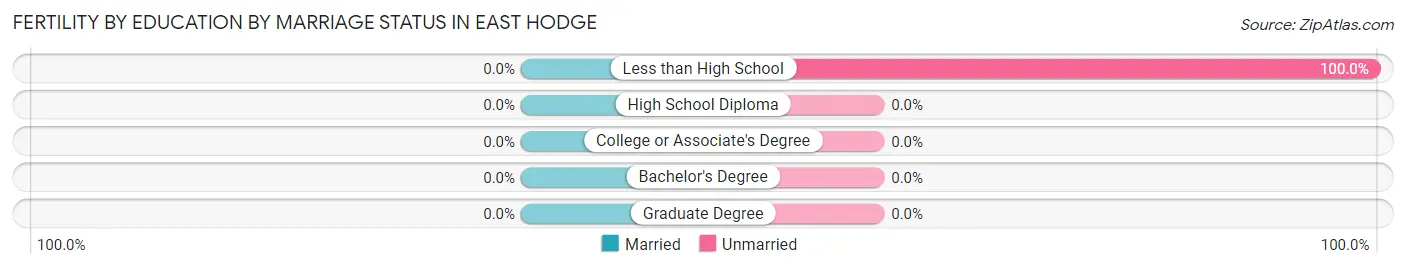
| Educational Attainment | Married | Unmarried |
| Less than High School | 0 (0.0%) | 1 (100.0%) |
| High School Diploma | 0 (0.0%) | 0 (0.0%) |
| College or Associate's Degree | 0 (0.0%) | 0 (0.0%) |
| Bachelor's Degree | 0 (0.0%) | 0 (0.0%) |
| Graduate Degree | 0 (0.0%) | 0 (0.0%) |
| Total | 0 (0.0%) | 1 (100.0%) |
Employment Characteristics in East Hodge
Employment by Class of Employer in East Hodge
Among the 83 employed individuals in East Hodge, private company employees (56 | 67.5%), state government employees (11 | 13.3%), and federal government employees (8 | 9.6%) make up the most common classes of employment.
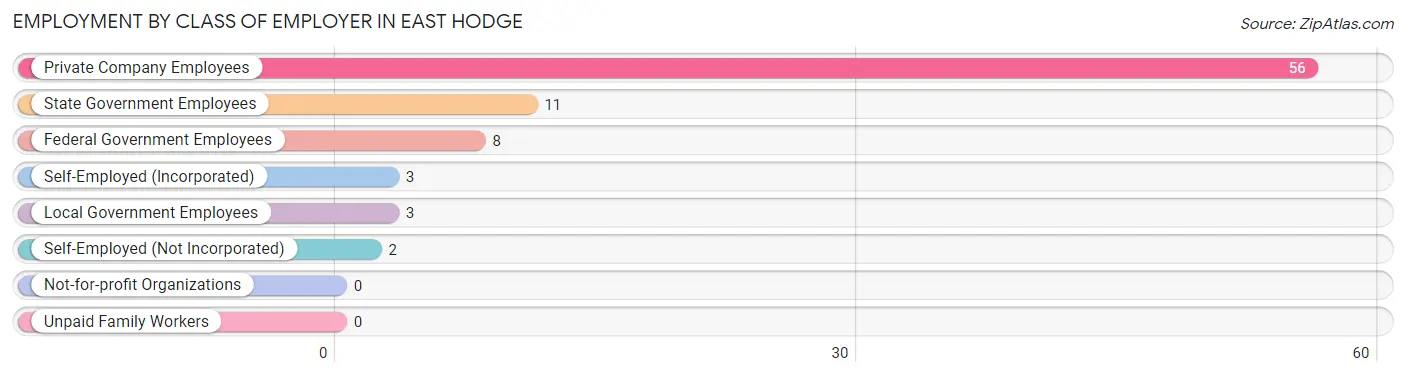
| Employer Class | # Employees | % Employees |
| Private Company Employees | 56 | 67.5% |
| Self-Employed (Incorporated) | 3 | 3.6% |
| Self-Employed (Not Incorporated) | 2 | 2.4% |
| Not-for-profit Organizations | 0 | 0.0% |
| Local Government Employees | 3 | 3.6% |
| State Government Employees | 11 | 13.3% |
| Federal Government Employees | 8 | 9.6% |
| Unpaid Family Workers | 0 | 0.0% |
| Total | 83 | 100.0% |
Employment Status by Age in East Hodge
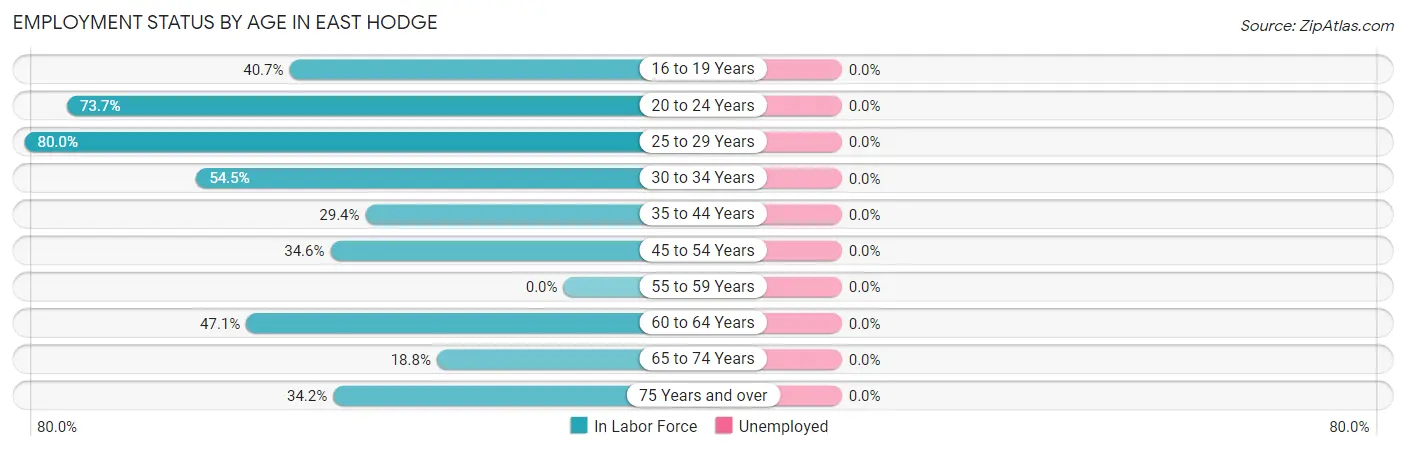
| Age Bracket | In Labor Force | Unemployed |
| 16 to 19 Years | 11 (40.7%) | 0 (0.0%) |
| 20 to 24 Years | 14 (73.7%) | 0 (0.0%) |
| 25 to 29 Years | 4 (80.0%) | 0 (0.0%) |
| 30 to 34 Years | 12 (54.5%) | 0 (0.0%) |
| 35 to 44 Years | 5 (29.4%) | 0 (0.0%) |
| 45 to 54 Years | 9 (34.6%) | 0 (0.0%) |
| 55 to 59 Years | 0 (0.0%) | 0 (0.0%) |
| 60 to 64 Years | 8 (47.1%) | 0 (0.0%) |
| 65 to 74 Years | 9 (18.8%) | 0 (0.0%) |
| 75 Years and over | 13 (34.2%) | 0 (0.0%) |
| Total | 85 (38.5%) | 0 (0.0%) |
Employment Status by Educational Attainment in East Hodge
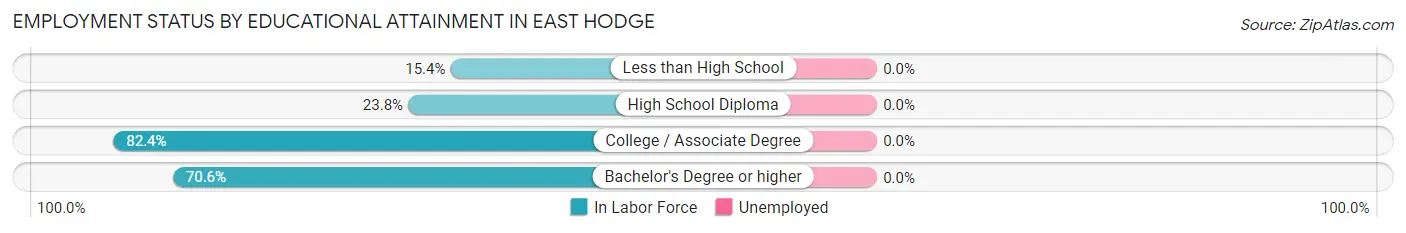
| Educational Attainment | In Labor Force | Unemployed |
| Less than High School | 2 (15.4%) | 0 (0.0%) |
| High School Diploma | 10 (23.8%) | 0 (0.0%) |
| College / Associate Degree | 14 (82.4%) | 0 (0.0%) |
| Bachelor's Degree or higher | 12 (70.6%) | 0 (0.0%) |
| Total | 38 (42.7%) | 0 (0.0%) |
Employment Occupations by Sex in East Hodge
Management, Business, Science and Arts Occupations
The most common Management, Business, Science and Arts occupations in East Hodge are Health Diagnosing & Treating (14 | 16.5%), Management (13 | 15.3%), Community & Social Service (13 | 15.3%), and Education Instruction & Library (13 | 15.3%).
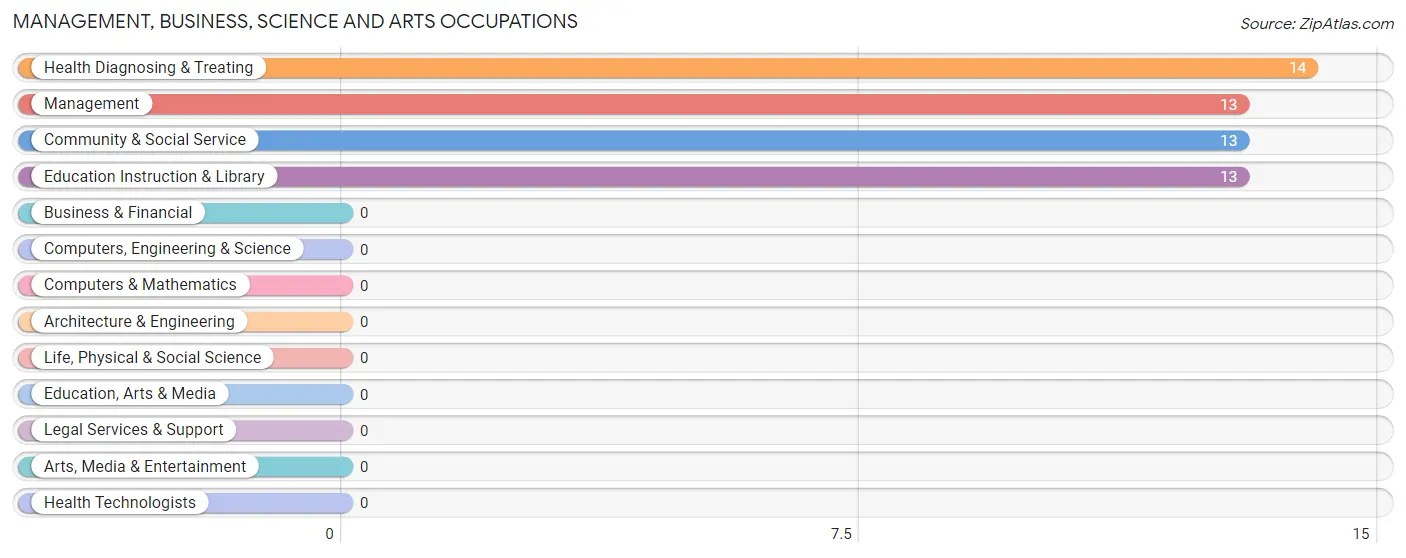
Management, Business, Science and Arts Occupations by Sex
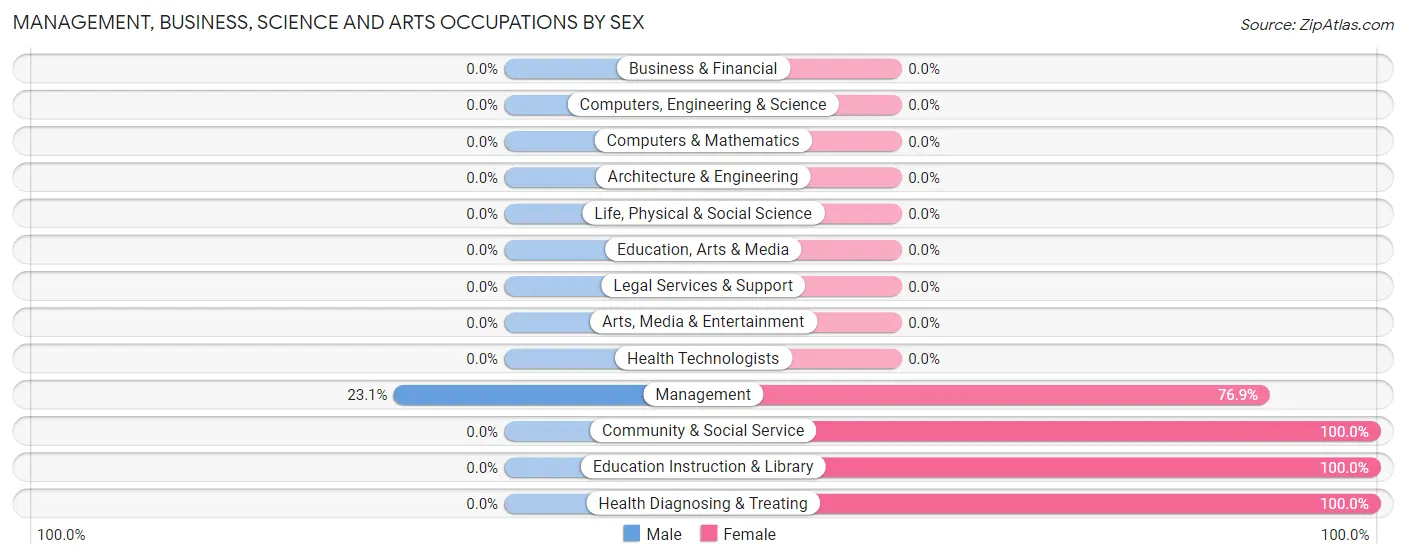
| Occupation | Male | Female |
| Management | 3 (23.1%) | 10 (76.9%) |
| Business & Financial | 0 (0.0%) | 0 (0.0%) |
| Computers, Engineering & Science | 0 (0.0%) | 0 (0.0%) |
| Computers & Mathematics | 0 (0.0%) | 0 (0.0%) |
| Architecture & Engineering | 0 (0.0%) | 0 (0.0%) |
| Life, Physical & Social Science | 0 (0.0%) | 0 (0.0%) |
| Community & Social Service | 0 (0.0%) | 13 (100.0%) |
| Education, Arts & Media | 0 (0.0%) | 0 (0.0%) |
| Legal Services & Support | 0 (0.0%) | 0 (0.0%) |
| Education Instruction & Library | 0 (0.0%) | 13 (100.0%) |
| Arts, Media & Entertainment | 0 (0.0%) | 0 (0.0%) |
| Health Diagnosing & Treating | 0 (0.0%) | 14 (100.0%) |
| Health Technologists | 0 (0.0%) | 0 (0.0%) |
| Total (Category) | 3 (7.5%) | 37 (92.5%) |
| Total (Overall) | 19 (22.4%) | 66 (77.6%) |
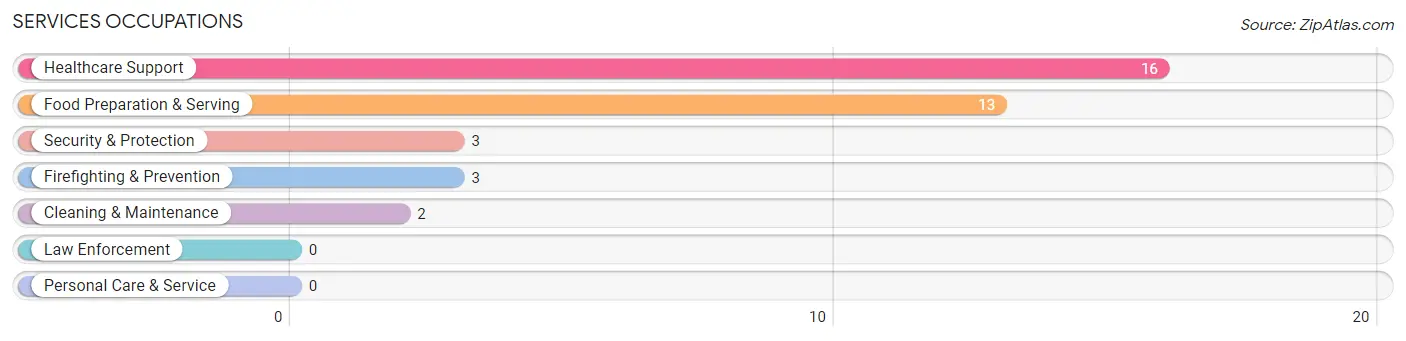
Services Occupations
The most common Services occupations in East Hodge are Healthcare Support (16 | 18.8%), Food Preparation & Serving (13 | 15.3%), Security & Protection (3 | 3.5%), Firefighting & Prevention (3 | 3.5%), and Cleaning & Maintenance (2 | 2.4%).
Services Occupations by Sex
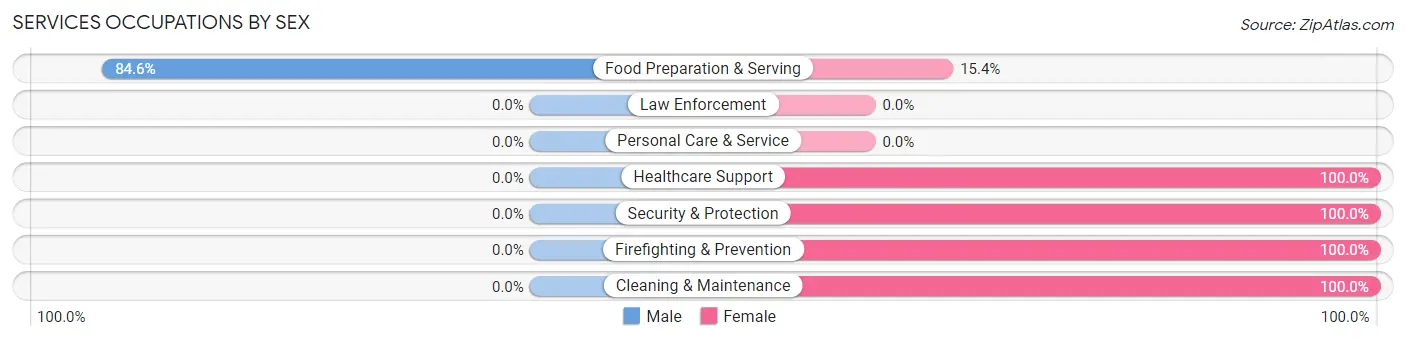
| Occupation | Male | Female |
| Healthcare Support | 0 (0.0%) | 16 (100.0%) |
| Security & Protection | 0 (0.0%) | 3 (100.0%) |
| Firefighting & Prevention | 0 (0.0%) | 3 (100.0%) |
| Law Enforcement | 0 (0.0%) | 0 (0.0%) |
| Food Preparation & Serving | 11 (84.6%) | 2 (15.4%) |
| Cleaning & Maintenance | 0 (0.0%) | 2 (100.0%) |
| Personal Care & Service | 0 (0.0%) | 0 (0.0%) |
| Total (Category) | 11 (32.4%) | 23 (67.6%) |
| Total (Overall) | 19 (22.4%) | 66 (77.6%) |
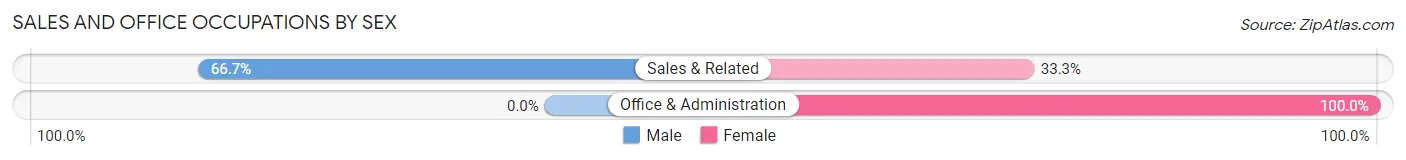
Sales and Office Occupations
The most common Sales and Office occupations in East Hodge are Sales & Related (6 | 7.1%), and Office & Administration (3 | 3.5%).
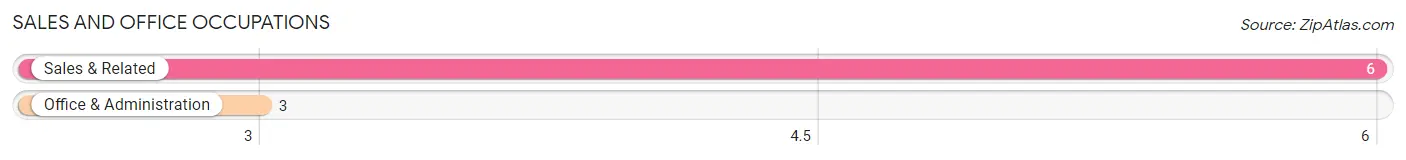
Sales and Office Occupations by Sex
| Occupation | Male | Female |
| Sales & Related | 4 (66.7%) | 2 (33.3%) |
| Office & Administration | 0 (0.0%) | 3 (100.0%) |
| Total (Category) | 4 (44.4%) | 5 (55.6%) |
| Total (Overall) | 19 (22.4%) | 66 (77.6%) |
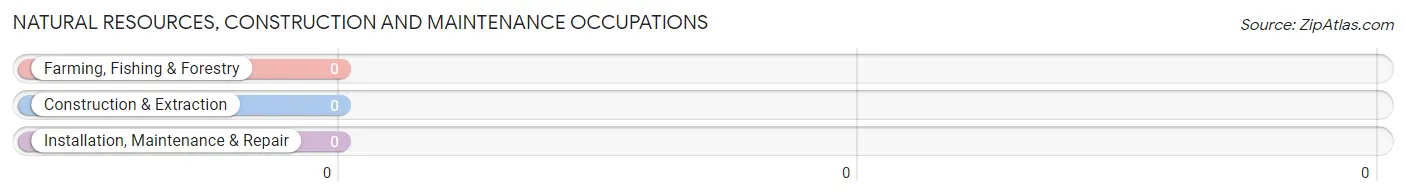
Natural Resources, Construction and Maintenance Occupations
Natural Resources, Construction and Maintenance Occupations by Sex
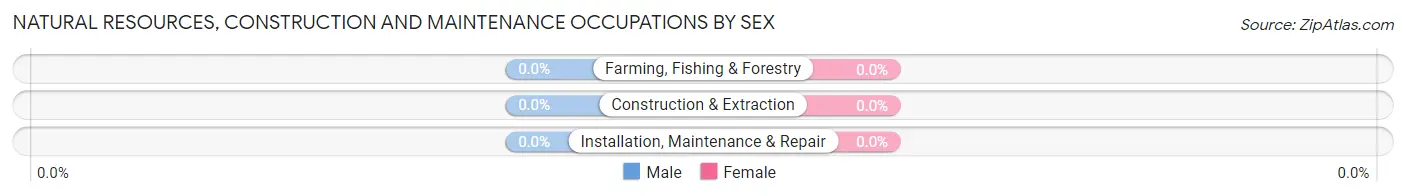
| Occupation | Male | Female |
| Farming, Fishing & Forestry | 0 (0.0%) | 0 (0.0%) |
| Construction & Extraction | 0 (0.0%) | 0 (0.0%) |
| Installation, Maintenance & Repair | 0 (0.0%) | 0 (0.0%) |
| Total (Category) | 0 (0.0%) | 0 (0.0%) |
| Total (Overall) | 19 (22.4%) | 66 (77.6%) |
Production, Transportation and Moving Occupations
The most common Production, Transportation and Moving occupations in East Hodge are Transportation (1 | 1.2%), and Material Moving (1 | 1.2%).
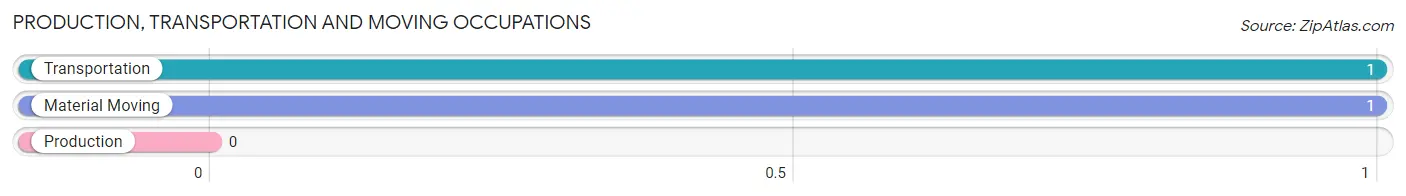
Production, Transportation and Moving Occupations by Sex
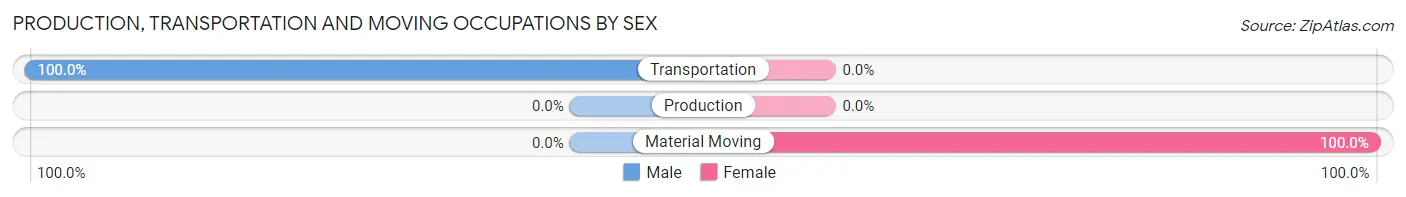
| Occupation | Male | Female |
| Production | 0 (0.0%) | 0 (0.0%) |
| Transportation | 1 (100.0%) | 0 (0.0%) |
| Material Moving | 0 (0.0%) | 1 (100.0%) |
| Total (Category) | 1 (50.0%) | 1 (50.0%) |
| Total (Overall) | 19 (22.4%) | 66 (77.6%) |
Employment Industries by Sex in East Hodge
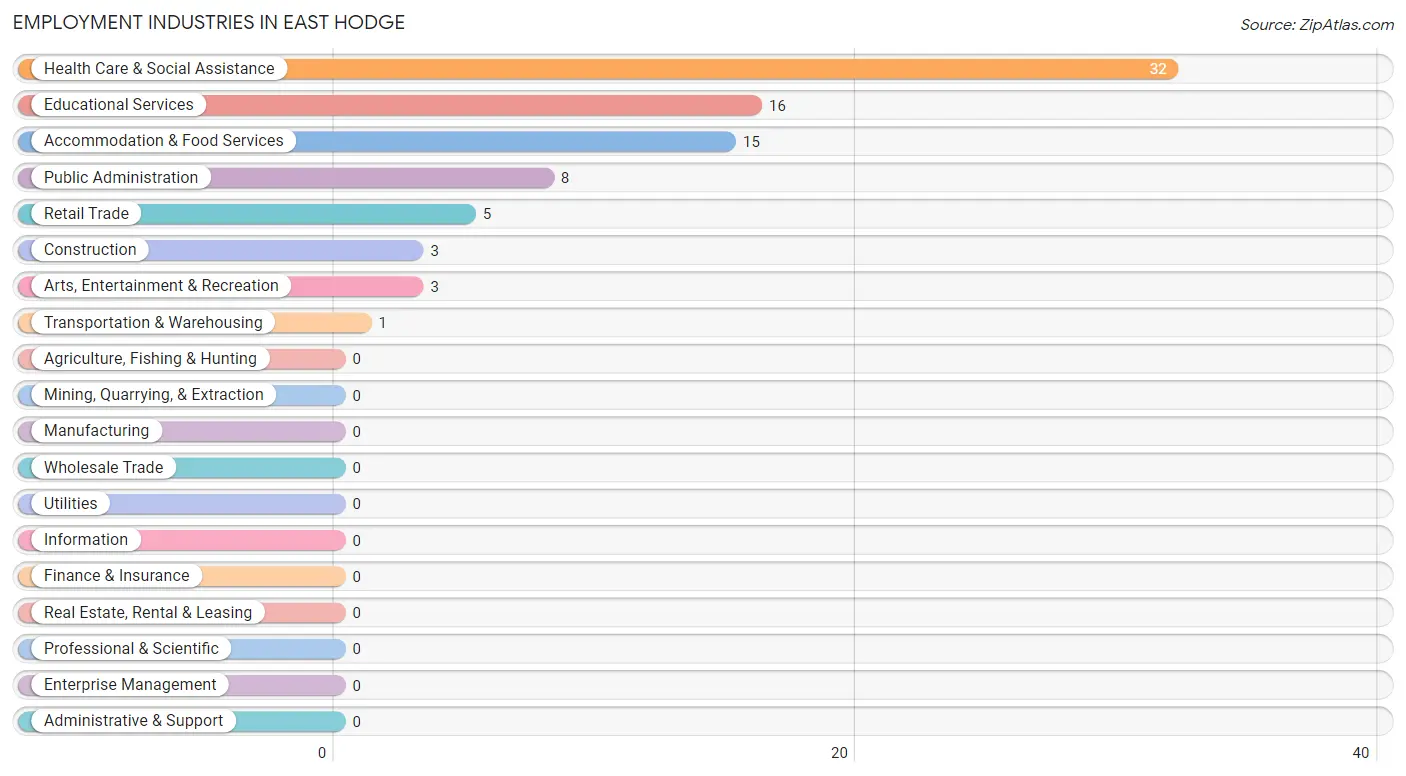
Employment Industries in East Hodge
The major employment industries in East Hodge include Health Care & Social Assistance (32 | 37.7%), Educational Services (16 | 18.8%), Accommodation & Food Services (15 | 17.6%), Public Administration (8 | 9.4%), and Retail Trade (5 | 5.9%).
Employment Industries by Sex in East Hodge
The East Hodge industries that see more men than women are Construction (100.0%), Transportation & Warehousing (100.0%), and Retail Trade (80.0%), whereas the industries that tend to have a higher number of women are Educational Services (100.0%), Health Care & Social Assistance (100.0%), and Arts, Entertainment & Recreation (100.0%).
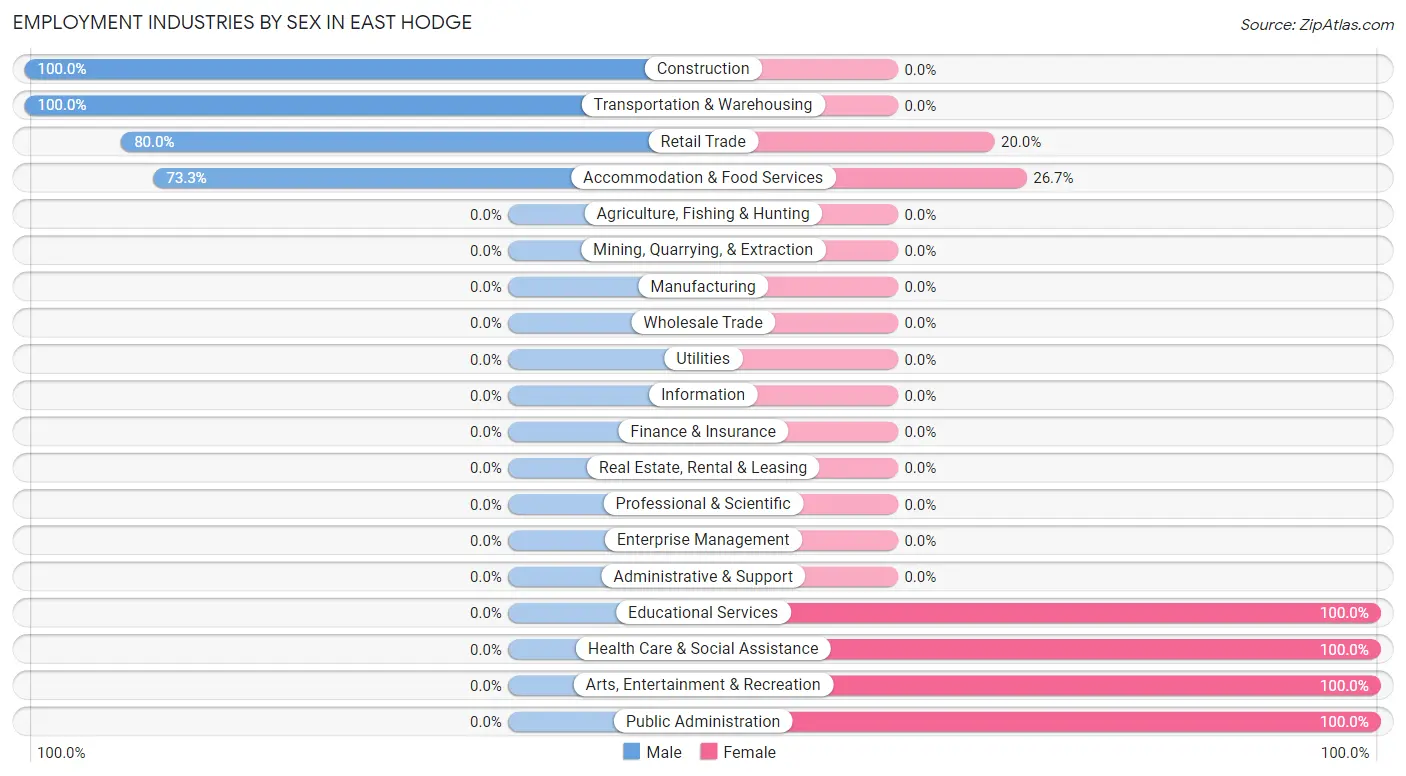
| Industry | Male | Female |
| Agriculture, Fishing & Hunting | 0 (0.0%) | 0 (0.0%) |
| Mining, Quarrying, & Extraction | 0 (0.0%) | 0 (0.0%) |
| Construction | 3 (100.0%) | 0 (0.0%) |
| Manufacturing | 0 (0.0%) | 0 (0.0%) |
| Wholesale Trade | 0 (0.0%) | 0 (0.0%) |
| Retail Trade | 4 (80.0%) | 1 (20.0%) |
| Transportation & Warehousing | 1 (100.0%) | 0 (0.0%) |
| Utilities | 0 (0.0%) | 0 (0.0%) |
| Information | 0 (0.0%) | 0 (0.0%) |
| Finance & Insurance | 0 (0.0%) | 0 (0.0%) |
| Real Estate, Rental & Leasing | 0 (0.0%) | 0 (0.0%) |
| Professional & Scientific | 0 (0.0%) | 0 (0.0%) |
| Enterprise Management | 0 (0.0%) | 0 (0.0%) |
| Administrative & Support | 0 (0.0%) | 0 (0.0%) |
| Educational Services | 0 (0.0%) | 16 (100.0%) |
| Health Care & Social Assistance | 0 (0.0%) | 32 (100.0%) |
| Arts, Entertainment & Recreation | 0 (0.0%) | 3 (100.0%) |
| Accommodation & Food Services | 11 (73.3%) | 4 (26.7%) |
| Public Administration | 0 (0.0%) | 8 (100.0%) |
| Total | 19 (22.4%) | 66 (77.6%) |
Education in East Hodge
School Enrollment in East Hodge
The most common levels of schooling among the 102 students in East Hodge are high school (43 | 42.2%), middle school (30 | 29.4%), and elementary school (20 | 19.6%).
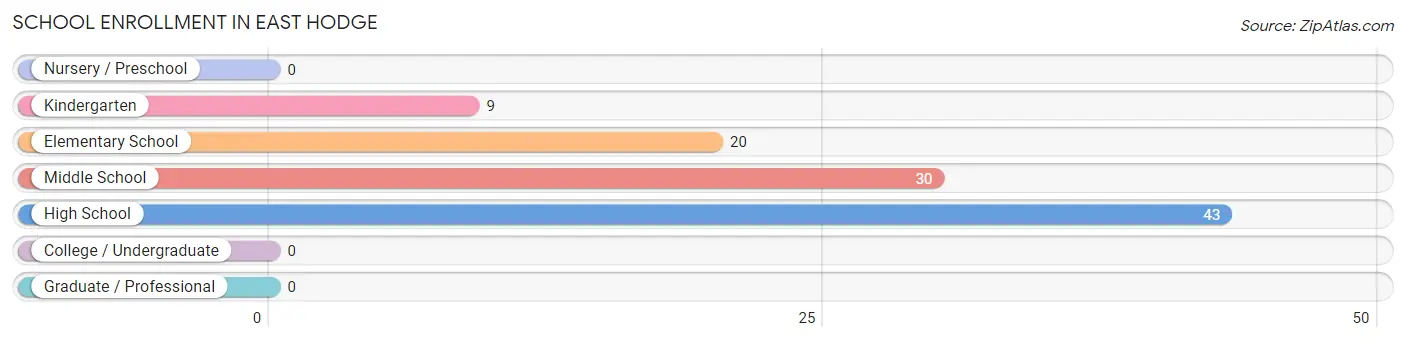
| School Level | # Students | % Students |
| Nursery / Preschool | 0 | 0.0% |
| Kindergarten | 9 | 8.8% |
| Elementary School | 20 | 19.6% |
| Middle School | 30 | 29.4% |
| High School | 43 | 42.2% |
| College / Undergraduate | 0 | 0.0% |
| Graduate / Professional | 0 | 0.0% |
| Total | 102 | 100.0% |
School Enrollment by Age by Funding Source in East Hodge
Out of a total of 102 students who are enrolled in schools in East Hodge, 5 (4.9%) attend a private institution, while the remaining 97 (95.1%) are enrolled in public schools. The age group of 18 to 19 year olds has the highest likelihood of being enrolled in private schools, with 5 (100.0% in the age bracket) enrolled. Conversely, the age group of 5 to 9 year old has the lowest likelihood of being enrolled in a private school, with 29 (100.0% in the age bracket) attending a public institution.
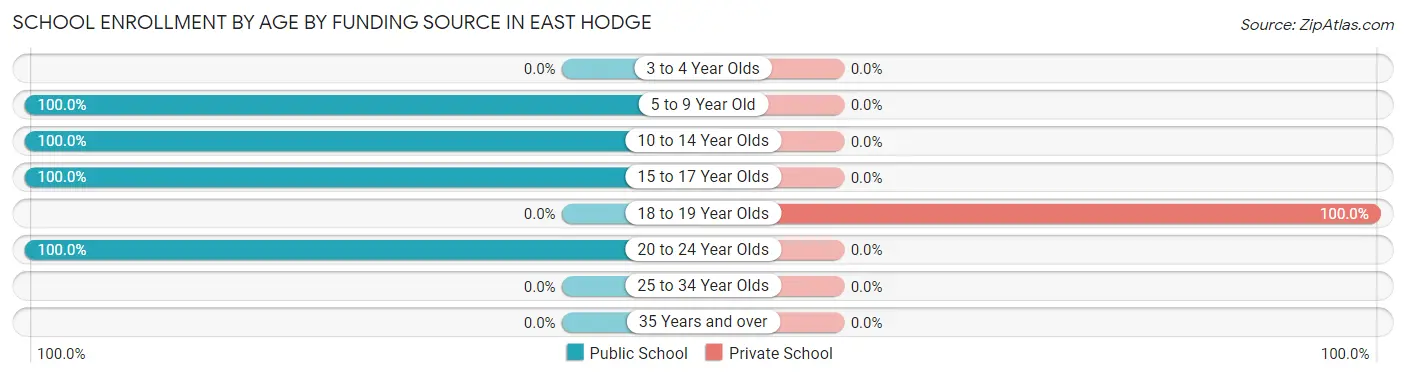
| Age Bracket | Public School | Private School |
| 3 to 4 Year Olds | 0 (0.0%) | 0 (0.0%) |
| 5 to 9 Year Old | 29 (100.0%) | 0 (0.0%) |
| 10 to 14 Year Olds | 34 (100.0%) | 0 (0.0%) |
| 15 to 17 Year Olds | 20 (100.0%) | 0 (0.0%) |
| 18 to 19 Year Olds | 0 (0.0%) | 5 (100.0%) |
| 20 to 24 Year Olds | 14 (100.0%) | 0 (0.0%) |
| 25 to 34 Year Olds | 0 (0.0%) | 0 (0.0%) |
| 35 Years and over | 0 (0.0%) | 0 (0.0%) |
| Total | 97 (95.1%) | 5 (4.9%) |
Educational Attainment by Field of Study in East Hodge
Education (15 | 35.7%), business (14 | 33.3%), physical & health sciences (5 | 11.9%), liberal arts & history (3 | 7.1%), and arts & humanities (3 | 7.1%) are the most common fields of study among 42 individuals in East Hodge who have obtained a bachelor's degree or higher.
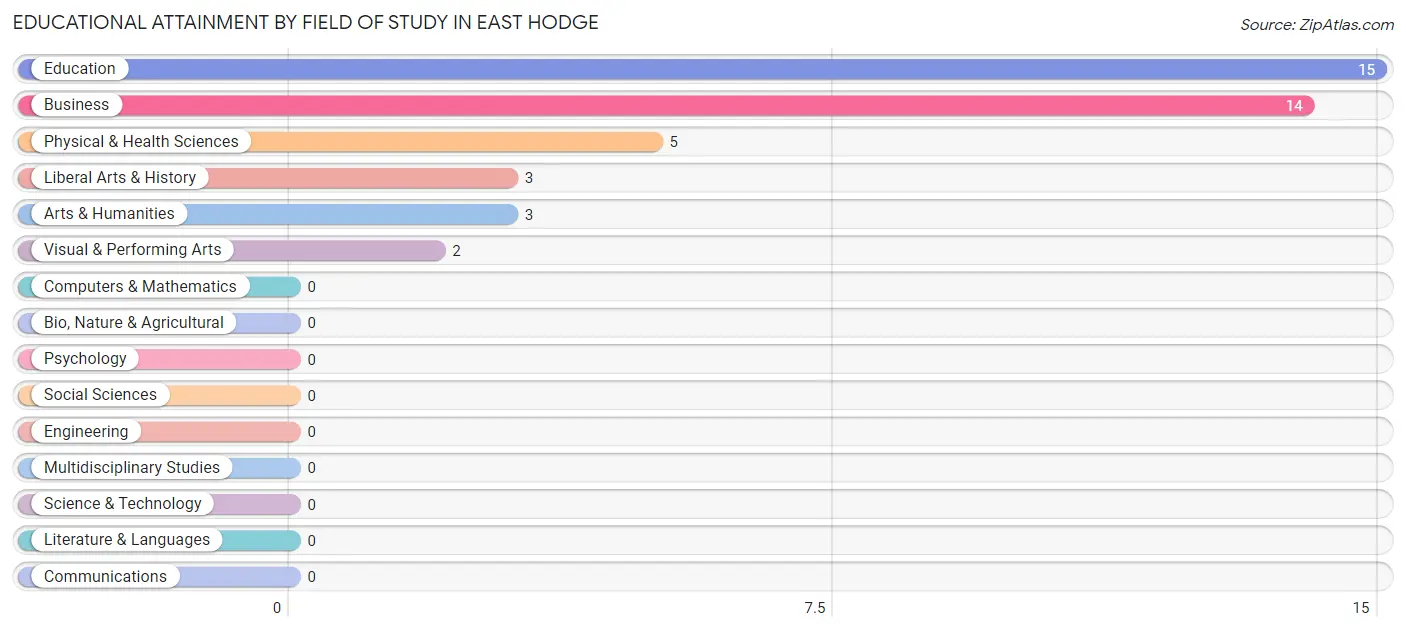
| Field of Study | # Graduates | % Graduates |
| Computers & Mathematics | 0 | 0.0% |
| Bio, Nature & Agricultural | 0 | 0.0% |
| Physical & Health Sciences | 5 | 11.9% |
| Psychology | 0 | 0.0% |
| Social Sciences | 0 | 0.0% |
| Engineering | 0 | 0.0% |
| Multidisciplinary Studies | 0 | 0.0% |
| Science & Technology | 0 | 0.0% |
| Business | 14 | 33.3% |
| Education | 15 | 35.7% |
| Literature & Languages | 0 | 0.0% |
| Liberal Arts & History | 3 | 7.1% |
| Visual & Performing Arts | 2 | 4.8% |
| Communications | 0 | 0.0% |
| Arts & Humanities | 3 | 7.1% |
| Total | 42 | 100.0% |
Transportation & Commute in East Hodge
Vehicle Availability by Sex in East Hodge
The most prevalent vehicle ownership categories in East Hodge are males with no vehicle (15, accounting for 78.9%) and females with no vehicle (9, making up 23.4%).
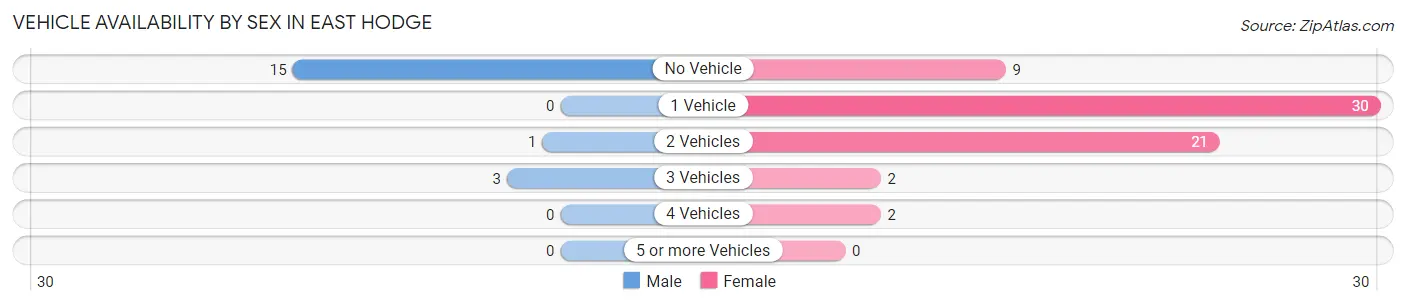
| Vehicles Available | Male | Female |
| No Vehicle | 15 (78.9%) | 9 (14.1%) |
| 1 Vehicle | 0 (0.0%) | 30 (46.9%) |
| 2 Vehicles | 1 (5.3%) | 21 (32.8%) |
| 3 Vehicles | 3 (15.8%) | 2 (3.1%) |
| 4 Vehicles | 0 (0.0%) | 2 (3.1%) |
| 5 or more Vehicles | 0 (0.0%) | 0 (0.0%) |
| Total | 19 (100.0%) | 64 (100.0%) |
Commute Time in East Hodge
The most frequently occuring commute durations in East Hodge are 5 to 9 minutes (39 commuters, 47.0%), 10 to 14 minutes (29 commuters, 34.9%), and less than 5 minutes (12 commuters, 14.5%).
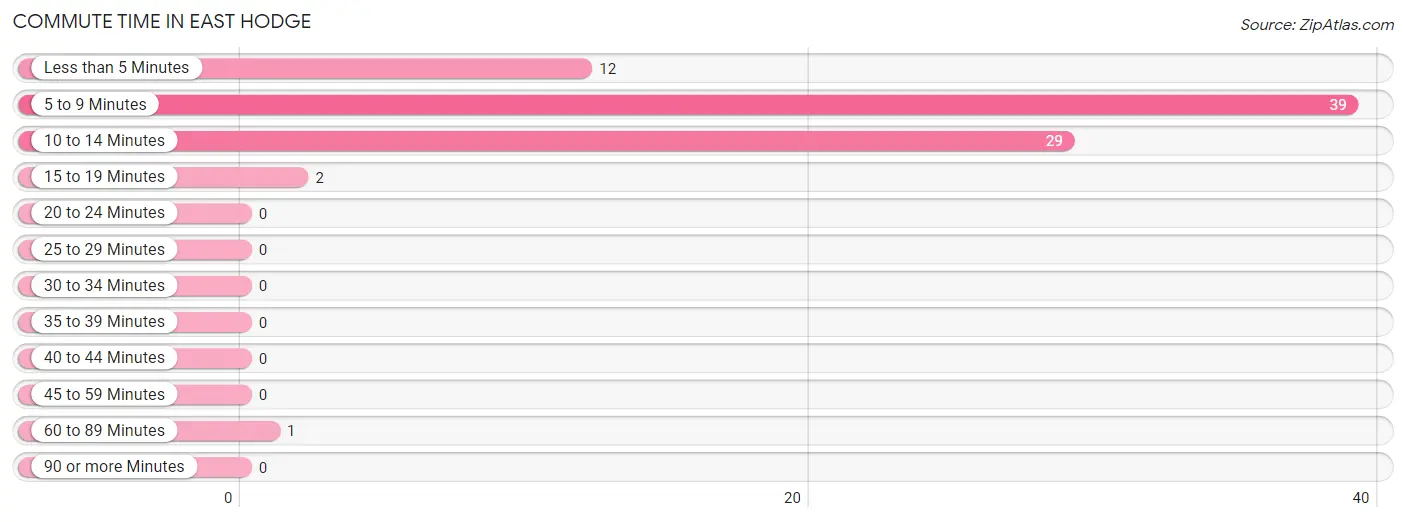
| Commute Time | # Commuters | % Commuters |
| Less than 5 Minutes | 12 | 14.5% |
| 5 to 9 Minutes | 39 | 47.0% |
| 10 to 14 Minutes | 29 | 34.9% |
| 15 to 19 Minutes | 2 | 2.4% |
| 20 to 24 Minutes | 0 | 0.0% |
| 25 to 29 Minutes | 0 | 0.0% |
| 30 to 34 Minutes | 0 | 0.0% |
| 35 to 39 Minutes | 0 | 0.0% |
| 40 to 44 Minutes | 0 | 0.0% |
| 45 to 59 Minutes | 0 | 0.0% |
| 60 to 89 Minutes | 1 | 1.2% |
| 90 or more Minutes | 0 | 0.0% |
Commute Time by Sex in East Hodge
The most common commute times in East Hodge are 5 to 9 minutes (15 commuters, 78.9%) for males and 10 to 14 minutes (26 commuters, 40.6%) for females.
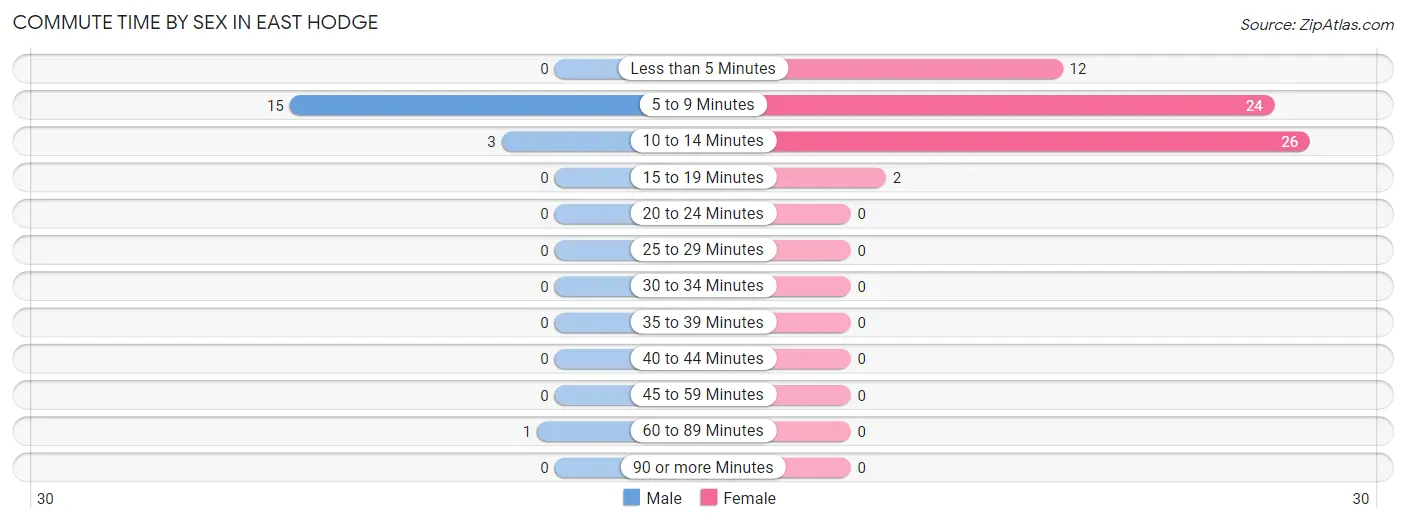
| Commute Time | Male | Female |
| Less than 5 Minutes | 0 (0.0%) | 12 (18.8%) |
| 5 to 9 Minutes | 15 (78.9%) | 24 (37.5%) |
| 10 to 14 Minutes | 3 (15.8%) | 26 (40.6%) |
| 15 to 19 Minutes | 0 (0.0%) | 2 (3.1%) |
| 20 to 24 Minutes | 0 (0.0%) | 0 (0.0%) |
| 25 to 29 Minutes | 0 (0.0%) | 0 (0.0%) |
| 30 to 34 Minutes | 0 (0.0%) | 0 (0.0%) |
| 35 to 39 Minutes | 0 (0.0%) | 0 (0.0%) |
| 40 to 44 Minutes | 0 (0.0%) | 0 (0.0%) |
| 45 to 59 Minutes | 0 (0.0%) | 0 (0.0%) |
| 60 to 89 Minutes | 1 (5.3%) | 0 (0.0%) |
| 90 or more Minutes | 0 (0.0%) | 0 (0.0%) |
Time of Departure to Work by Sex in East Hodge
The most frequent times of departure to work in East Hodge are 7:00 AM to 7:29 AM (11, 57.9%) for males and 12:00 PM to 3:59 PM (26, 40.6%) for females.
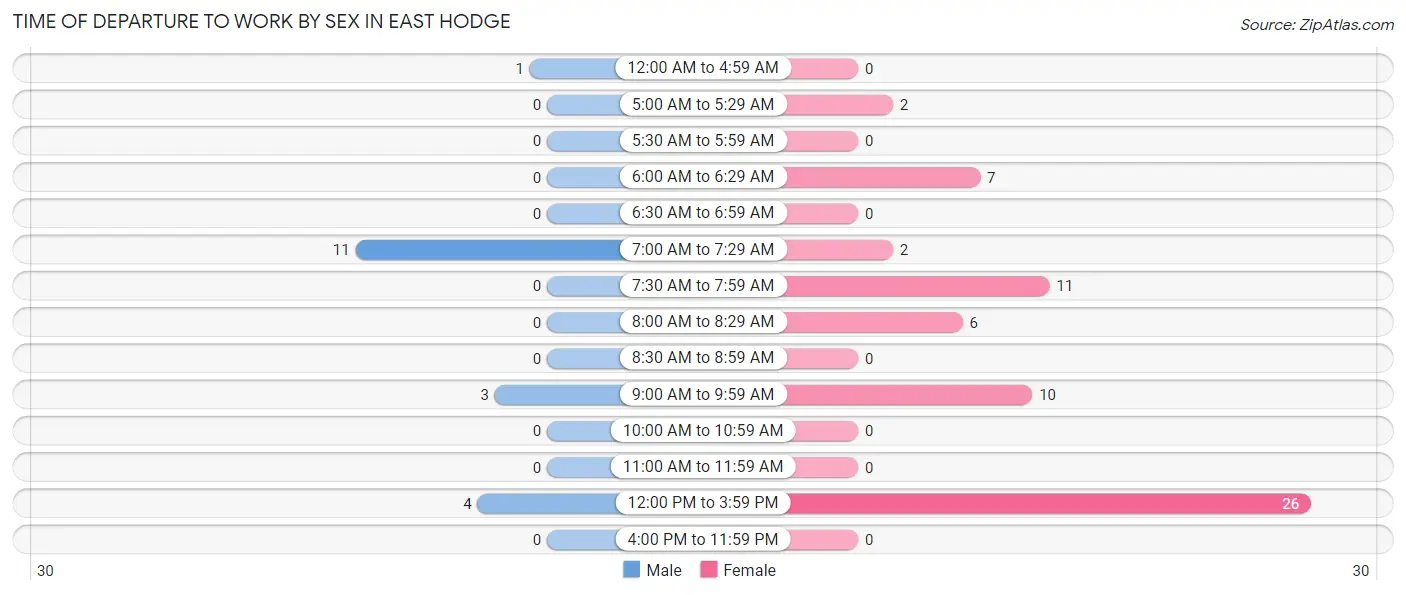
| Time of Departure | Male | Female |
| 12:00 AM to 4:59 AM | 1 (5.3%) | 0 (0.0%) |
| 5:00 AM to 5:29 AM | 0 (0.0%) | 2 (3.1%) |
| 5:30 AM to 5:59 AM | 0 (0.0%) | 0 (0.0%) |
| 6:00 AM to 6:29 AM | 0 (0.0%) | 7 (10.9%) |
| 6:30 AM to 6:59 AM | 0 (0.0%) | 0 (0.0%) |
| 7:00 AM to 7:29 AM | 11 (57.9%) | 2 (3.1%) |
| 7:30 AM to 7:59 AM | 0 (0.0%) | 11 (17.2%) |
| 8:00 AM to 8:29 AM | 0 (0.0%) | 6 (9.4%) |
| 8:30 AM to 8:59 AM | 0 (0.0%) | 0 (0.0%) |
| 9:00 AM to 9:59 AM | 3 (15.8%) | 10 (15.6%) |
| 10:00 AM to 10:59 AM | 0 (0.0%) | 0 (0.0%) |
| 11:00 AM to 11:59 AM | 0 (0.0%) | 0 (0.0%) |
| 12:00 PM to 3:59 PM | 4 (21.0%) | 26 (40.6%) |
| 4:00 PM to 11:59 PM | 0 (0.0%) | 0 (0.0%) |
| Total | 19 (100.0%) | 64 (100.0%) |
Housing Occupancy in East Hodge
Occupancy by Ownership in East Hodge
Of the total 117 dwellings in East Hodge, owner-occupied units account for 65 (55.6%), while renter-occupied units make up 52 (44.4%).
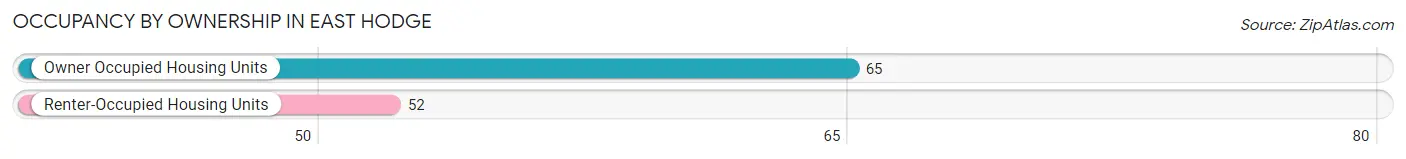
| Occupancy | # Housing Units | % Housing Units |
| Owner Occupied Housing Units | 65 | 55.6% |
| Renter-Occupied Housing Units | 52 | 44.4% |
| Total Occupied Housing Units | 117 | 100.0% |
Occupancy by Household Size in East Hodge
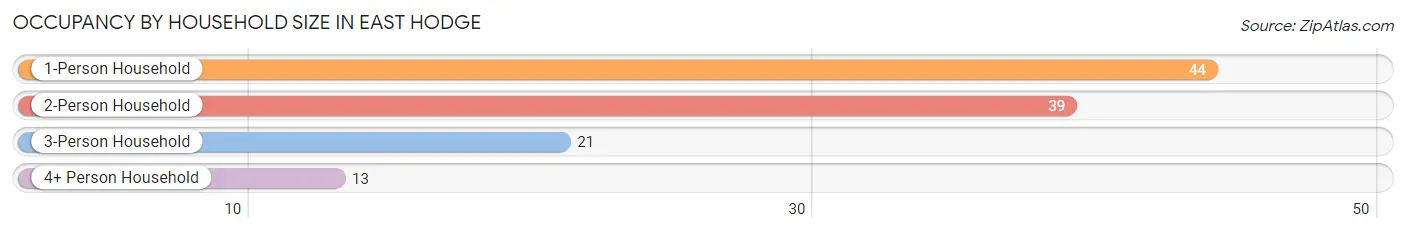
| Household Size | # Housing Units | % Housing Units |
| 1-Person Household | 44 | 37.6% |
| 2-Person Household | 39 | 33.3% |
| 3-Person Household | 21 | 17.9% |
| 4+ Person Household | 13 | 11.1% |
| Total Housing Units | 117 | 100.0% |
Occupancy by Ownership by Household Size in East Hodge
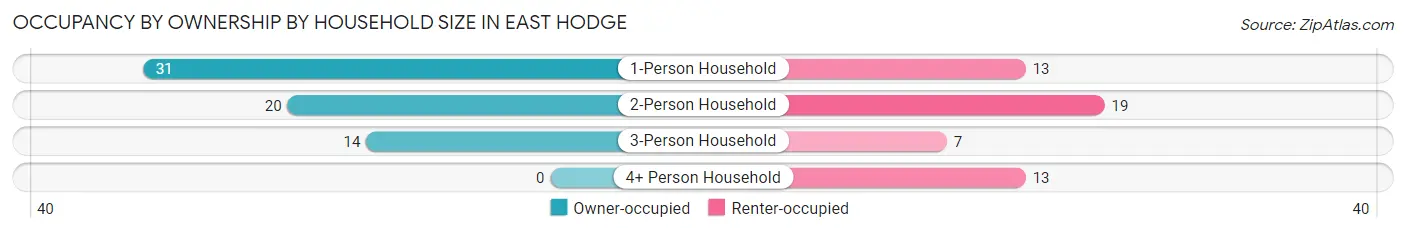
| Household Size | Owner-occupied | Renter-occupied |
| 1-Person Household | 31 (70.5%) | 13 (29.5%) |
| 2-Person Household | 20 (51.3%) | 19 (48.7%) |
| 3-Person Household | 14 (66.7%) | 7 (33.3%) |
| 4+ Person Household | 0 (0.0%) | 13 (100.0%) |
| Total Housing Units | 65 (55.6%) | 52 (44.4%) |
Occupancy by Educational Attainment in East Hodge
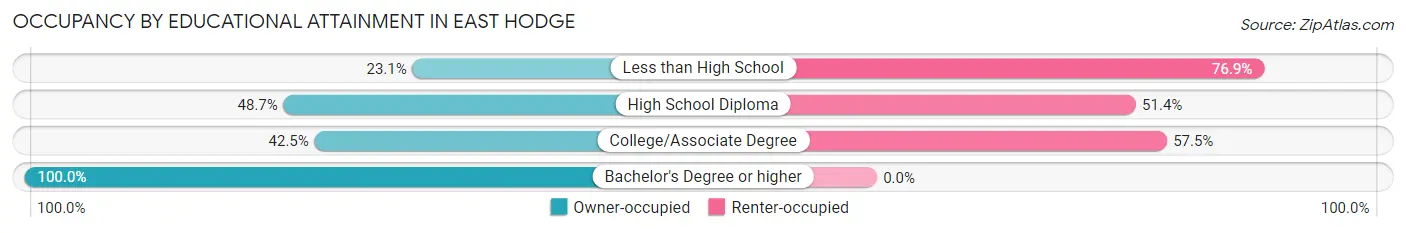
| Household Size | Owner-occupied | Renter-occupied |
| Less than High School | 3 (23.1%) | 10 (76.9%) |
| High School Diploma | 18 (48.6%) | 19 (51.3%) |
| College/Associate Degree | 17 (42.5%) | 23 (57.5%) |
| Bachelor's Degree or higher | 27 (100.0%) | 0 (0.0%) |
Occupancy by Age of Householder in East Hodge
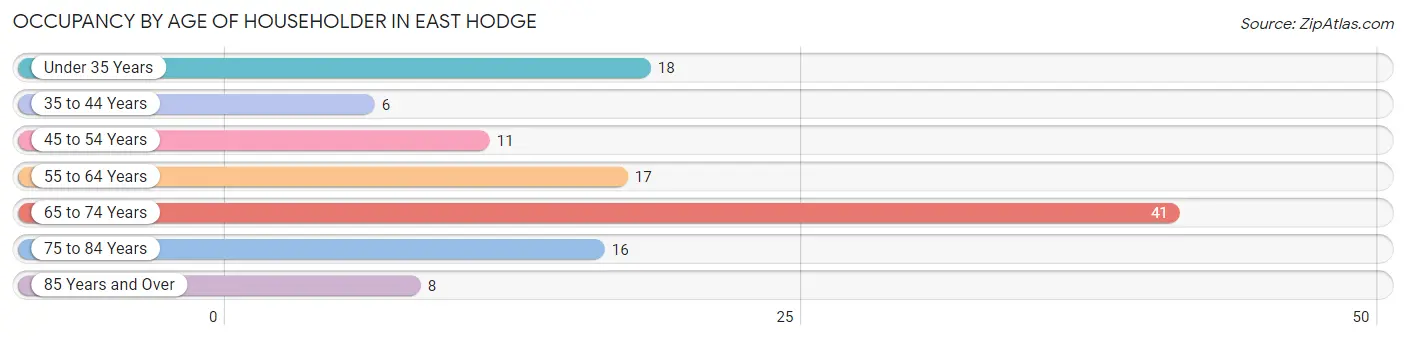
| Age Bracket | # Households | % Households |
| Under 35 Years | 18 | 15.4% |
| 35 to 44 Years | 6 | 5.1% |
| 45 to 54 Years | 11 | 9.4% |
| 55 to 64 Years | 17 | 14.5% |
| 65 to 74 Years | 41 | 35.0% |
| 75 to 84 Years | 16 | 13.7% |
| 85 Years and Over | 8 | 6.8% |
| Total | 117 | 100.0% |
Housing Finances in East Hodge
Median Income by Occupancy in East Hodge
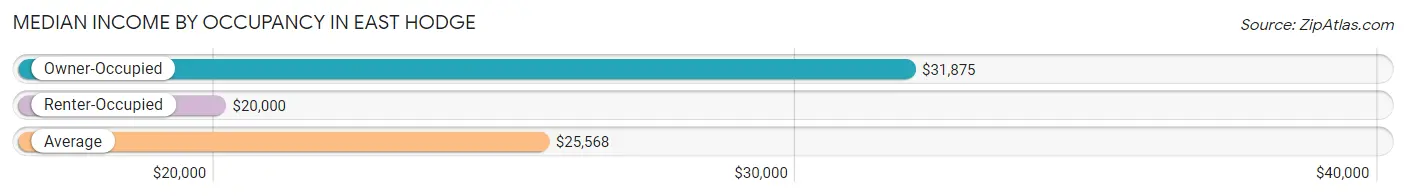
| Occupancy Type | # Households | Median Income |
| Owner-Occupied | 65 (55.6%) | $31,875 |
| Renter-Occupied | 52 (44.4%) | $20,000 |
| Average | 117 (100.0%) | $25,568 |
Occupancy by Householder Income Bracket in East Hodge
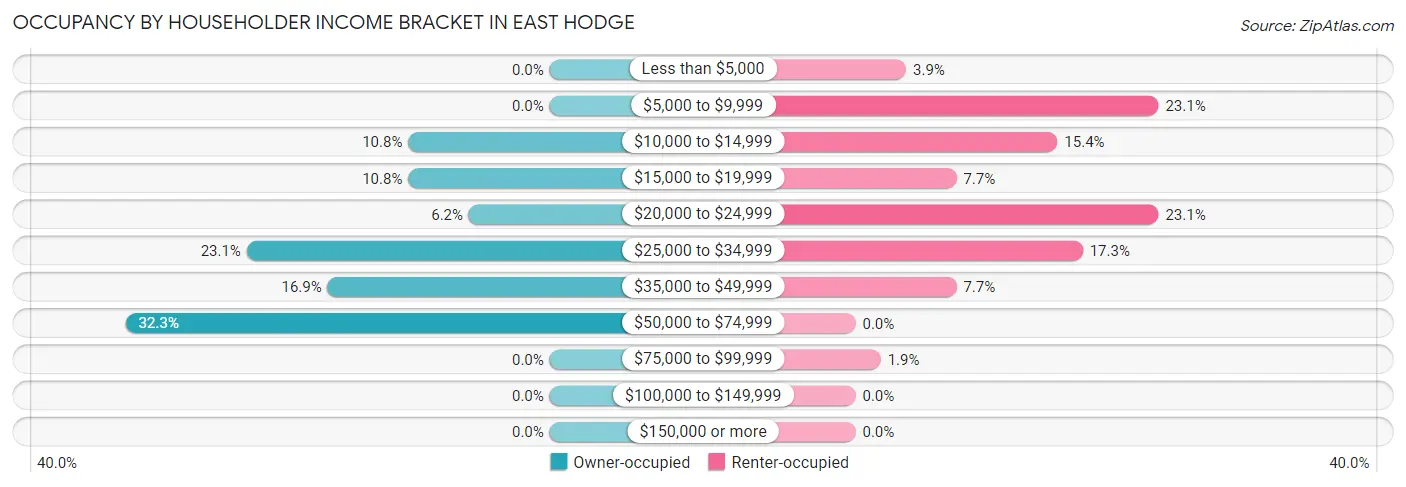
| Income Bracket | Owner-occupied | Renter-occupied |
| Less than $5,000 | 0 (0.0%) | 2 (3.8%) |
| $5,000 to $9,999 | 0 (0.0%) | 12 (23.1%) |
| $10,000 to $14,999 | 7 (10.8%) | 8 (15.4%) |
| $15,000 to $19,999 | 7 (10.8%) | 4 (7.7%) |
| $20,000 to $24,999 | 4 (6.1%) | 12 (23.1%) |
| $25,000 to $34,999 | 15 (23.1%) | 9 (17.3%) |
| $35,000 to $49,999 | 11 (16.9%) | 4 (7.7%) |
| $50,000 to $74,999 | 21 (32.3%) | 0 (0.0%) |
| $75,000 to $99,999 | 0 (0.0%) | 1 (1.9%) |
| $100,000 to $149,999 | 0 (0.0%) | 0 (0.0%) |
| $150,000 or more | 0 (0.0%) | 0 (0.0%) |
| Total | 65 (100.0%) | 52 (100.0%) |
Monthly Housing Cost Tiers in East Hodge
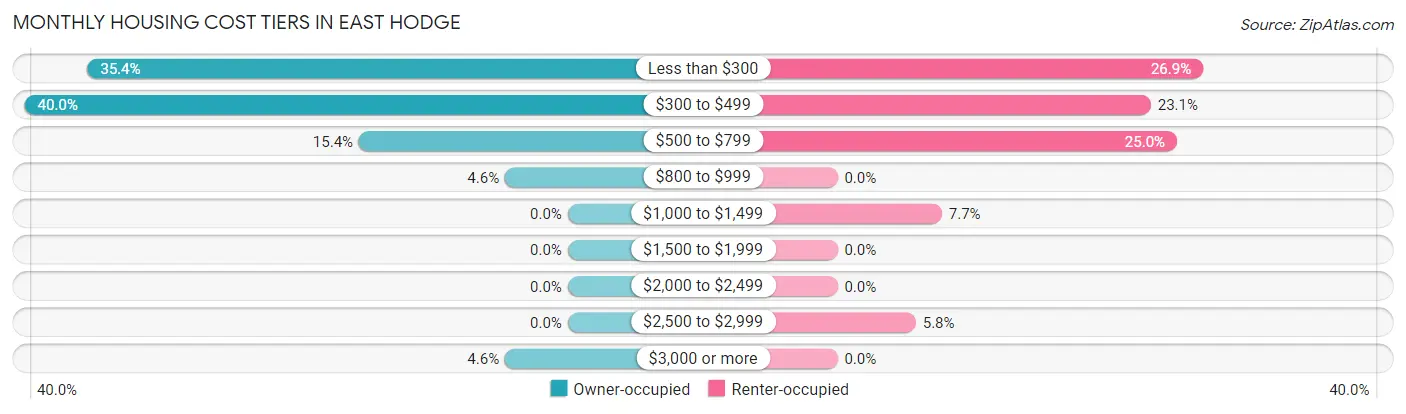
| Monthly Cost | Owner-occupied | Renter-occupied |
| Less than $300 | 23 (35.4%) | 14 (26.9%) |
| $300 to $499 | 26 (40.0%) | 12 (23.1%) |
| $500 to $799 | 10 (15.4%) | 13 (25.0%) |
| $800 to $999 | 3 (4.6%) | 0 (0.0%) |
| $1,000 to $1,499 | 0 (0.0%) | 4 (7.7%) |
| $1,500 to $1,999 | 0 (0.0%) | 0 (0.0%) |
| $2,000 to $2,499 | 0 (0.0%) | 0 (0.0%) |
| $2,500 to $2,999 | 0 (0.0%) | 3 (5.8%) |
| $3,000 or more | 3 (4.6%) | 0 (0.0%) |
| Total | 65 (100.0%) | 52 (100.0%) |
Physical Housing Characteristics in East Hodge
Housing Structures in East Hodge
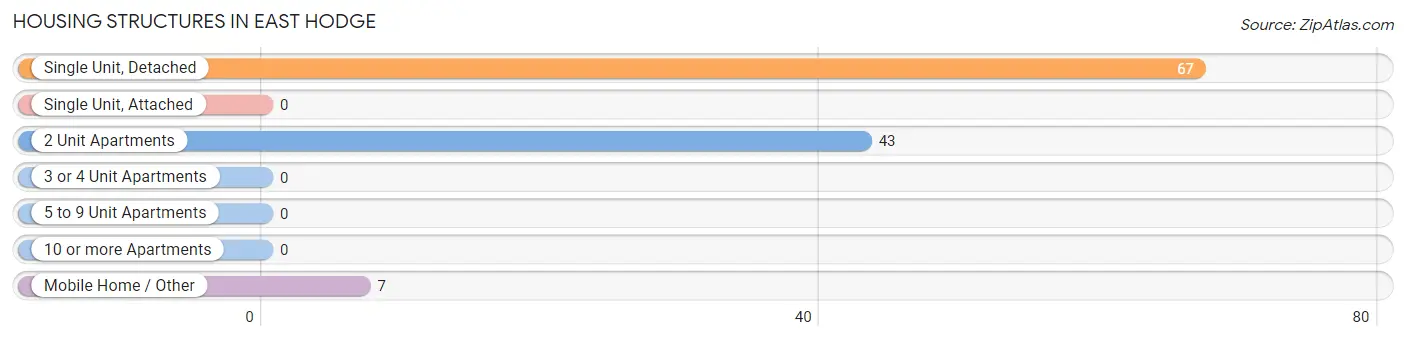
| Structure Type | # Housing Units | % Housing Units |
| Single Unit, Detached | 67 | 57.3% |
| Single Unit, Attached | 0 | 0.0% |
| 2 Unit Apartments | 43 | 36.7% |
| 3 or 4 Unit Apartments | 0 | 0.0% |
| 5 to 9 Unit Apartments | 0 | 0.0% |
| 10 or more Apartments | 0 | 0.0% |
| Mobile Home / Other | 7 | 6.0% |
| Total | 117 | 100.0% |
Housing Structures by Occupancy in East Hodge
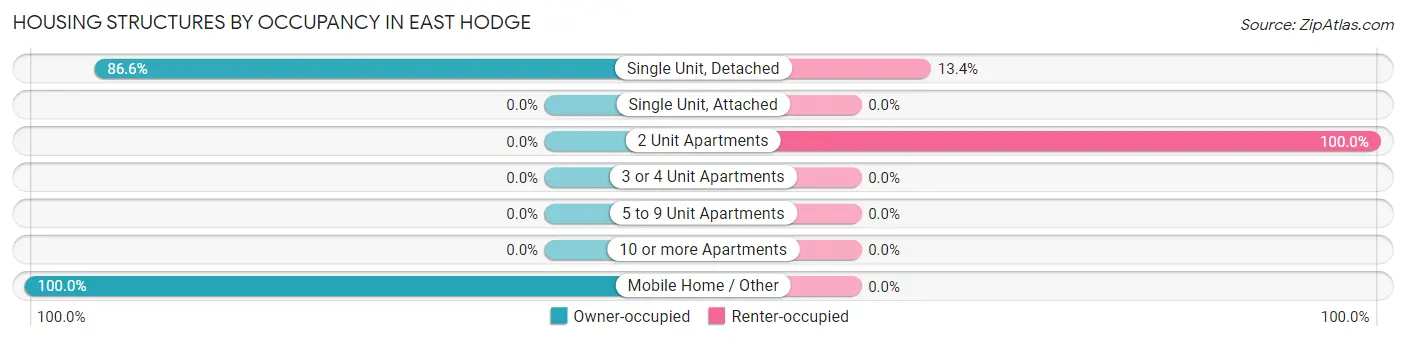
| Structure Type | Owner-occupied | Renter-occupied |
| Single Unit, Detached | 58 (86.6%) | 9 (13.4%) |
| Single Unit, Attached | 0 (0.0%) | 0 (0.0%) |
| 2 Unit Apartments | 0 (0.0%) | 43 (100.0%) |
| 3 or 4 Unit Apartments | 0 (0.0%) | 0 (0.0%) |
| 5 to 9 Unit Apartments | 0 (0.0%) | 0 (0.0%) |
| 10 or more Apartments | 0 (0.0%) | 0 (0.0%) |
| Mobile Home / Other | 7 (100.0%) | 0 (0.0%) |
| Total | 65 (55.6%) | 52 (44.4%) |
Housing Structures by Number of Rooms in East Hodge
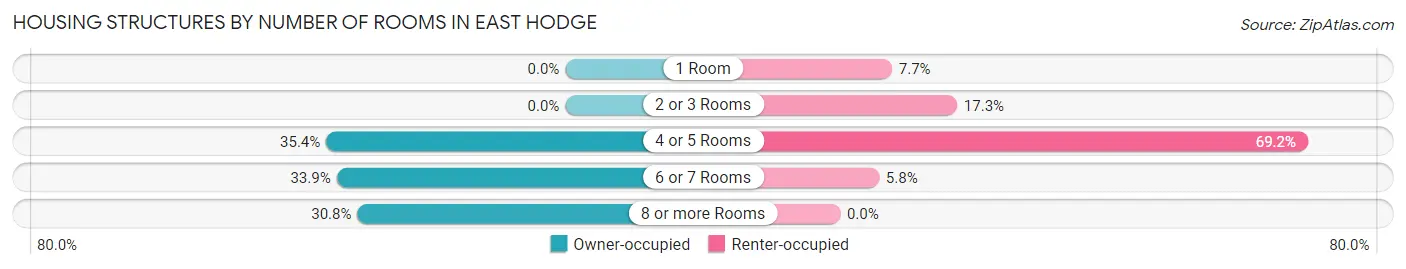
| Number of Rooms | Owner-occupied | Renter-occupied |
| 1 Room | 0 (0.0%) | 4 (7.7%) |
| 2 or 3 Rooms | 0 (0.0%) | 9 (17.3%) |
| 4 or 5 Rooms | 23 (35.4%) | 36 (69.2%) |
| 6 or 7 Rooms | 22 (33.9%) | 3 (5.8%) |
| 8 or more Rooms | 20 (30.8%) | 0 (0.0%) |
| Total | 65 (100.0%) | 52 (100.0%) |
Housing Structure by Heating Type in East Hodge
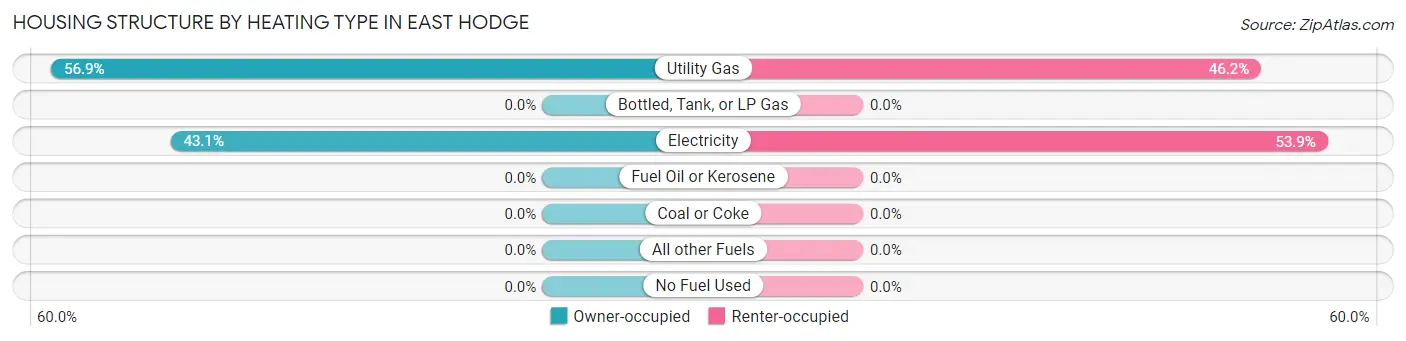
| Heating Type | Owner-occupied | Renter-occupied |
| Utility Gas | 37 (56.9%) | 24 (46.2%) |
| Bottled, Tank, or LP Gas | 0 (0.0%) | 0 (0.0%) |
| Electricity | 28 (43.1%) | 28 (53.8%) |
| Fuel Oil or Kerosene | 0 (0.0%) | 0 (0.0%) |
| Coal or Coke | 0 (0.0%) | 0 (0.0%) |
| All other Fuels | 0 (0.0%) | 0 (0.0%) |
| No Fuel Used | 0 (0.0%) | 0 (0.0%) |
| Total | 65 (100.0%) | 52 (100.0%) |
Household Vehicle Usage in East Hodge
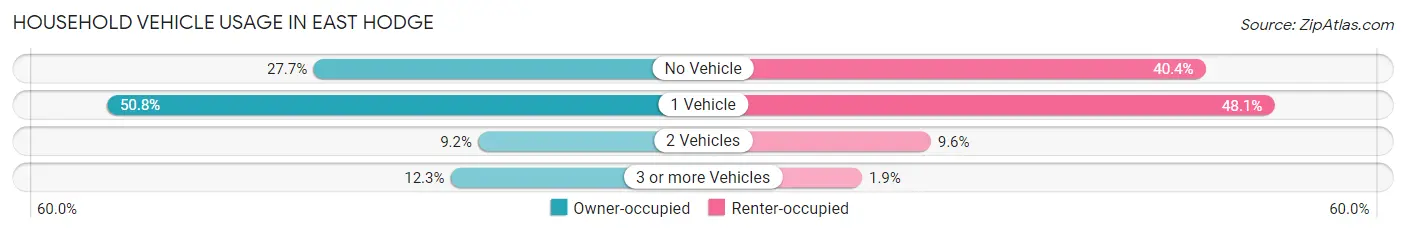
| Vehicles per Household | Owner-occupied | Renter-occupied |
| No Vehicle | 18 (27.7%) | 21 (40.4%) |
| 1 Vehicle | 33 (50.8%) | 25 (48.1%) |
| 2 Vehicles | 6 (9.2%) | 5 (9.6%) |
| 3 or more Vehicles | 8 (12.3%) | 1 (1.9%) |
| Total | 65 (100.0%) | 52 (100.0%) |
Real Estate & Mortgages in East Hodge
Real Estate and Mortgage Overview in East Hodge
| Characteristic | Without Mortgage | With Mortgage |
| Housing Units | 56 | 9 |
| Median Property Value | $67,800 | $0 |
| Median Household Income | $37,500 | $0 |
| Monthly Housing Costs | $358 | $0 |
| Real Estate Taxes | $233 | $5 |
Property Value by Mortgage Status in East Hodge
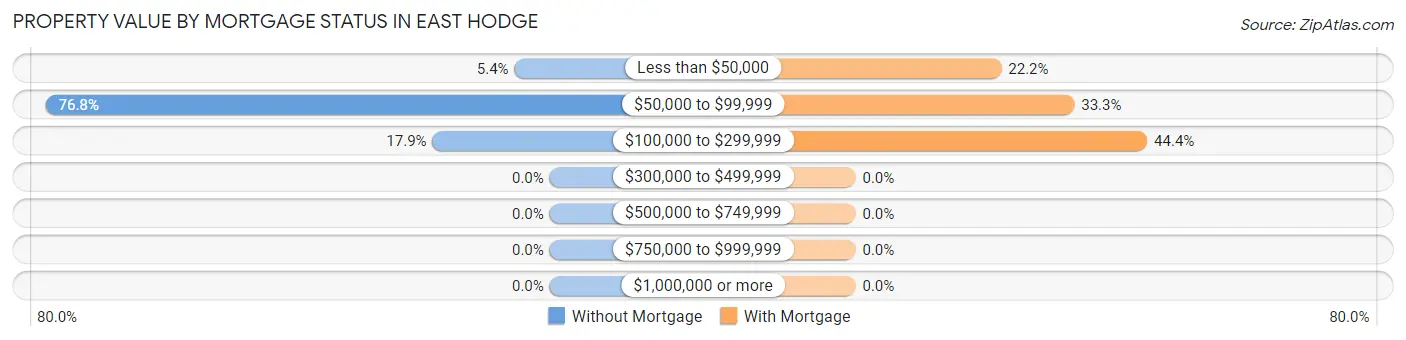
| Property Value | Without Mortgage | With Mortgage |
| Less than $50,000 | 3 (5.4%) | 2 (22.2%) |
| $50,000 to $99,999 | 43 (76.8%) | 3 (33.3%) |
| $100,000 to $299,999 | 10 (17.9%) | 4 (44.4%) |
| $300,000 to $499,999 | 0 (0.0%) | 0 (0.0%) |
| $500,000 to $749,999 | 0 (0.0%) | 0 (0.0%) |
| $750,000 to $999,999 | 0 (0.0%) | 0 (0.0%) |
| $1,000,000 or more | 0 (0.0%) | 0 (0.0%) |
| Total | 56 (100.0%) | 9 (100.0%) |
Household Income by Mortgage Status in East Hodge
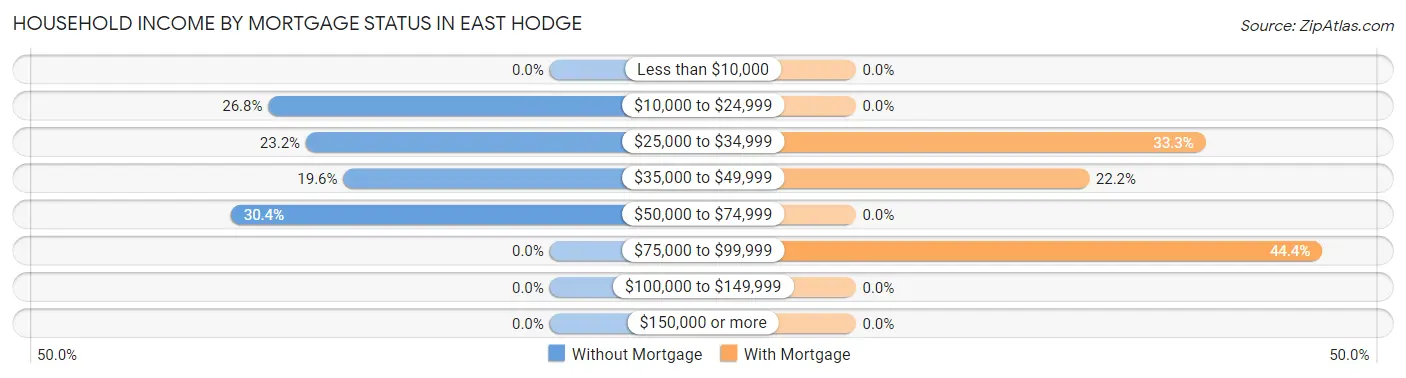
| Household Income | Without Mortgage | With Mortgage |
| Less than $10,000 | 0 (0.0%) | 0 (0.0%) |
| $10,000 to $24,999 | 15 (26.8%) | 0 (0.0%) |
| $25,000 to $34,999 | 13 (23.2%) | 3 (33.3%) |
| $35,000 to $49,999 | 11 (19.6%) | 2 (22.2%) |
| $50,000 to $74,999 | 17 (30.4%) | 0 (0.0%) |
| $75,000 to $99,999 | 0 (0.0%) | 4 (44.4%) |
| $100,000 to $149,999 | 0 (0.0%) | 0 (0.0%) |
| $150,000 or more | 0 (0.0%) | 0 (0.0%) |
| Total | 56 (100.0%) | 9 (100.0%) |
Property Value to Household Income Ratio in East Hodge
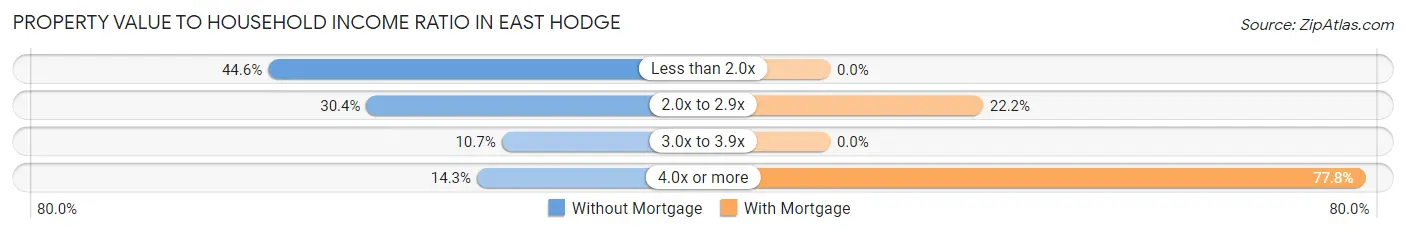
| Value-to-Income Ratio | Without Mortgage | With Mortgage |
| Less than 2.0x | 25 (44.6%) | 0 (0.0%) |
| 2.0x to 2.9x | 17 (30.4%) | 2 (22.2%) |
| 3.0x to 3.9x | 6 (10.7%) | 0 (0.0%) |
| 4.0x or more | 8 (14.3%) | 7 (77.8%) |
| Total | 56 (100.0%) | 9 (100.0%) |
Real Estate Taxes by Mortgage Status in East Hodge
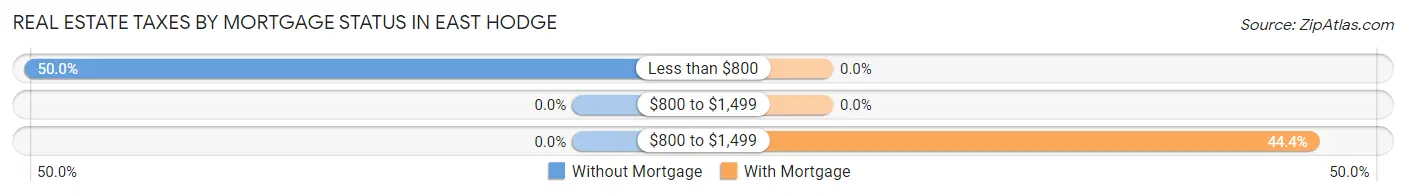
| Property Taxes | Without Mortgage | With Mortgage |
| Less than $800 | 28 (50.0%) | 0 (0.0%) |
| $800 to $1,499 | 0 (0.0%) | 0 (0.0%) |
| $800 to $1,499 | 0 (0.0%) | 4 (44.4%) |
| Total | 56 (100.0%) | 9 (100.0%) |
Health & Disability in East Hodge
Health Insurance Coverage by Age in East Hodge
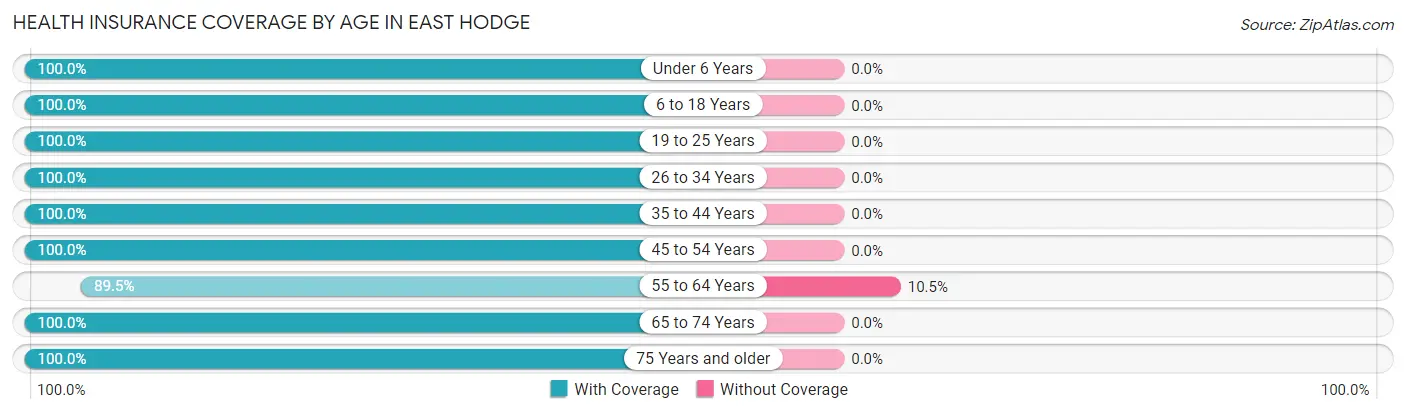
| Age Bracket | With Coverage | Without Coverage |
| Under 6 Years | 54 (100.0%) | 0 (0.0%) |
| 6 to 18 Years | 74 (100.0%) | 0 (0.0%) |
| 19 to 25 Years | 31 (100.0%) | 0 (0.0%) |
| 26 to 34 Years | 26 (100.0%) | 0 (0.0%) |
| 35 to 44 Years | 17 (100.0%) | 0 (0.0%) |
| 45 to 54 Years | 26 (100.0%) | 0 (0.0%) |
| 55 to 64 Years | 17 (89.5%) | 2 (10.5%) |
| 65 to 74 Years | 48 (100.0%) | 0 (0.0%) |
| 75 Years and older | 38 (100.0%) | 0 (0.0%) |
| Total | 331 (99.4%) | 2 (0.6%) |
Health Insurance Coverage by Citizenship Status in East Hodge
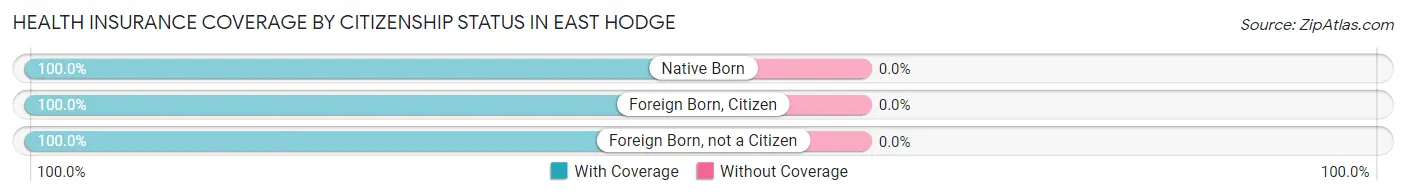
| Citizenship Status | With Coverage | Without Coverage |
| Native Born | 54 (100.0%) | 0 (0.0%) |
| Foreign Born, Citizen | 74 (100.0%) | 0 (0.0%) |
| Foreign Born, not a Citizen | 31 (100.0%) | 0 (0.0%) |
Health Insurance Coverage by Household Income in East Hodge
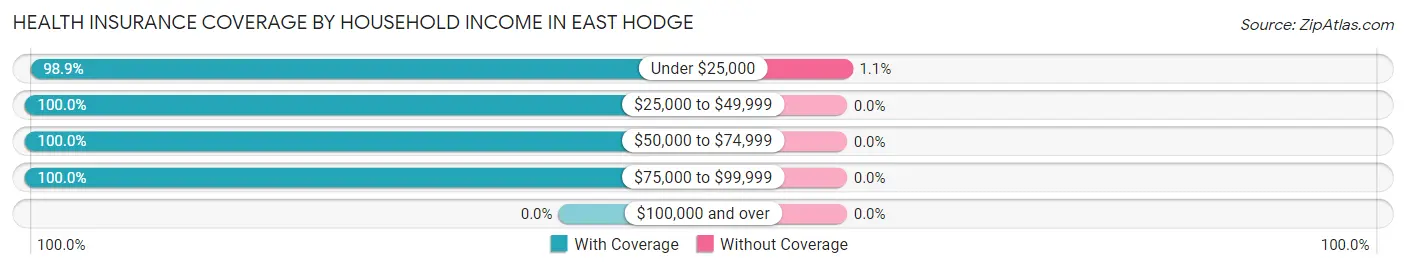
| Household Income | With Coverage | Without Coverage |
| Under $25,000 | 187 (98.9%) | 2 (1.1%) |
| $25,000 to $49,999 | 116 (100.0%) | 0 (0.0%) |
| $50,000 to $74,999 | 26 (100.0%) | 0 (0.0%) |
| $75,000 to $99,999 | 2 (100.0%) | 0 (0.0%) |
| $100,000 and over | 0 (0.0%) | 0 (0.0%) |
Public vs Private Health Insurance Coverage by Age in East Hodge

| Age Bracket | Public Insurance | Private Insurance |
| Under 6 | 54 (100.0%) | 0 (0.0%) |
| 6 to 18 Years | 74 (100.0%) | 0 (0.0%) |
| 19 to 25 Years | 31 (100.0%) | 0 (0.0%) |
| 25 to 34 Years | 25 (96.2%) | 1 (3.8%) |
| 35 to 44 Years | 12 (70.6%) | 5 (29.4%) |
| 45 to 54 Years | 25 (96.2%) | 1 (3.8%) |
| 55 to 64 Years | 16 (84.2%) | 6 (31.6%) |
| 65 to 74 Years | 48 (100.0%) | 14 (29.2%) |
| 75 Years and over | 38 (100.0%) | 10 (26.3%) |
| Total | 323 (97.0%) | 37 (11.1%) |
Disability Status by Sex by Age in East Hodge
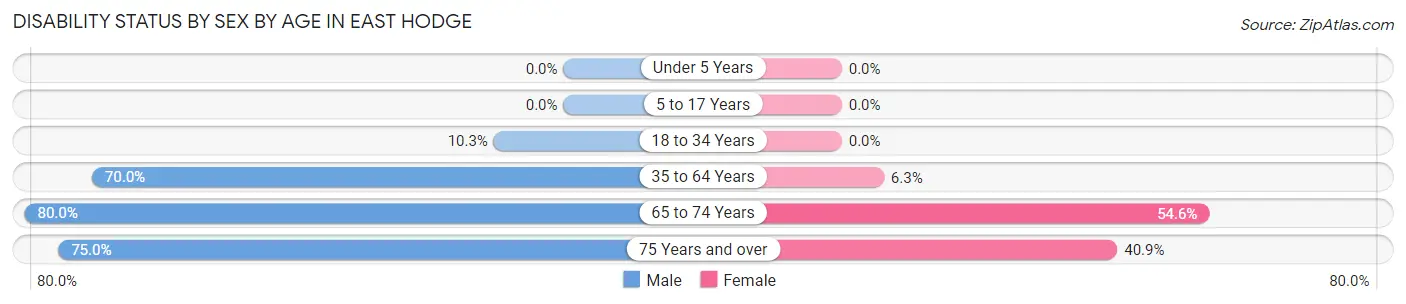
| Age Bracket | Male | Female |
| Under 5 Years | 0 (0.0%) | 0 (0.0%) |
| 5 to 17 Years | 0 (0.0%) | 0 (0.0%) |
| 18 to 34 Years | 3 (10.3%) | 0 (0.0%) |
| 35 to 64 Years | 21 (70.0%) | 2 (6.2%) |
| 65 to 74 Years | 12 (80.0%) | 18 (54.5%) |
| 75 Years and over | 12 (75.0%) | 9 (40.9%) |
Disability Class by Sex by Age in East Hodge
Disability Class: Hearing Difficulty
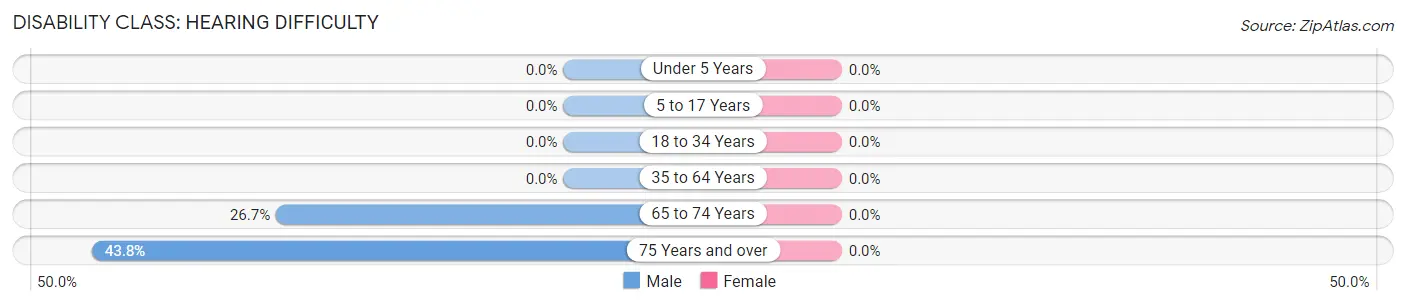
| Age Bracket | Male | Female |
| Under 5 Years | 0 (0.0%) | 0 (0.0%) |
| 5 to 17 Years | 0 (0.0%) | 0 (0.0%) |
| 18 to 34 Years | 0 (0.0%) | 0 (0.0%) |
| 35 to 64 Years | 0 (0.0%) | 0 (0.0%) |
| 65 to 74 Years | 4 (26.7%) | 0 (0.0%) |
| 75 Years and over | 7 (43.8%) | 0 (0.0%) |
Disability Class: Vision Difficulty
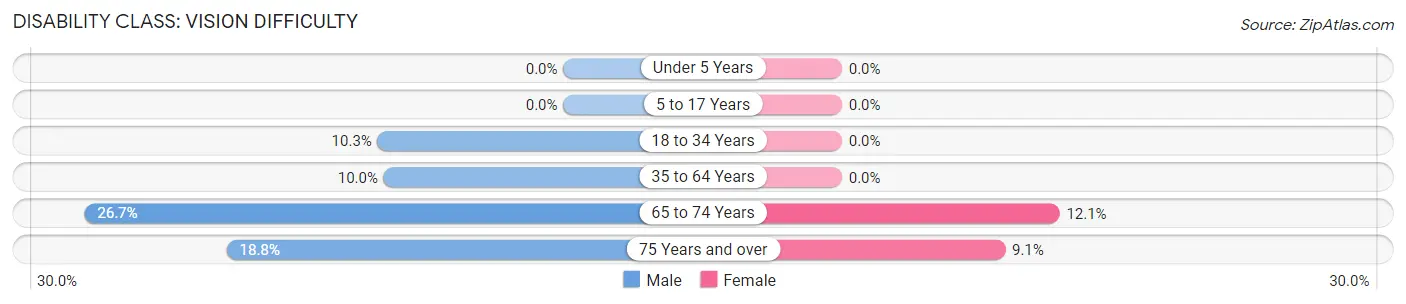
| Age Bracket | Male | Female |
| Under 5 Years | 0 (0.0%) | 0 (0.0%) |
| 5 to 17 Years | 0 (0.0%) | 0 (0.0%) |
| 18 to 34 Years | 3 (10.3%) | 0 (0.0%) |
| 35 to 64 Years | 3 (10.0%) | 0 (0.0%) |
| 65 to 74 Years | 4 (26.7%) | 4 (12.1%) |
| 75 Years and over | 3 (18.8%) | 2 (9.1%) |
Disability Class: Cognitive Difficulty
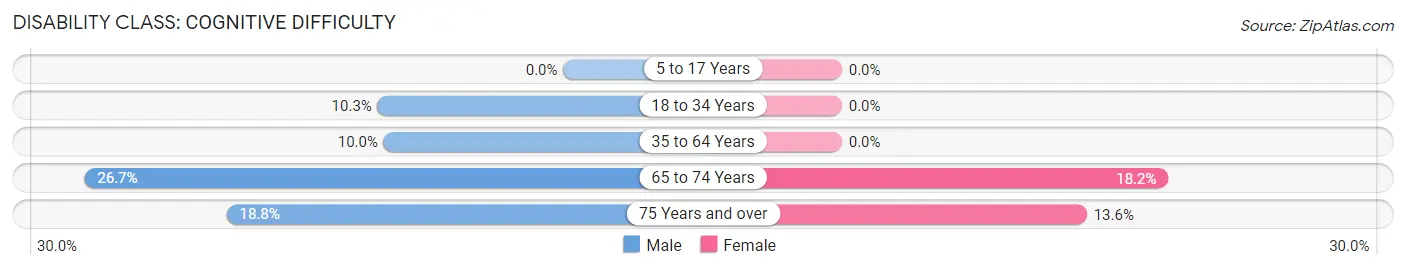
| Age Bracket | Male | Female |
| 5 to 17 Years | 0 (0.0%) | 0 (0.0%) |
| 18 to 34 Years | 3 (10.3%) | 0 (0.0%) |
| 35 to 64 Years | 3 (10.0%) | 0 (0.0%) |
| 65 to 74 Years | 4 (26.7%) | 6 (18.2%) |
| 75 Years and over | 3 (18.8%) | 3 (13.6%) |
Disability Class: Ambulatory Difficulty
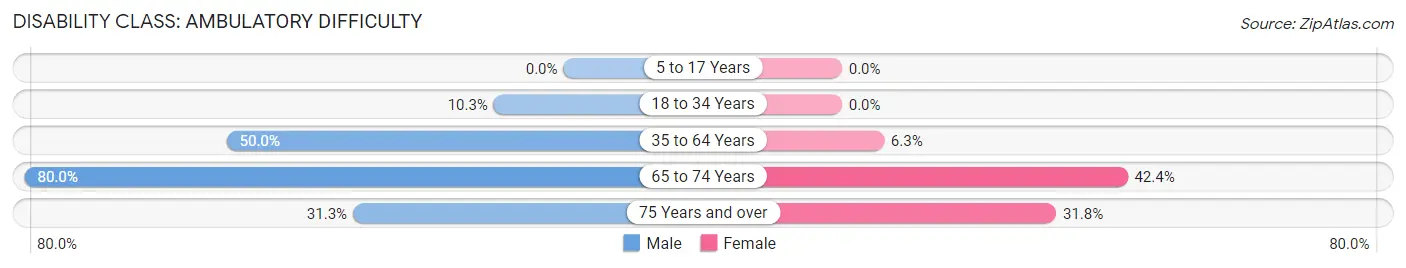
| Age Bracket | Male | Female |
| 5 to 17 Years | 0 (0.0%) | 0 (0.0%) |
| 18 to 34 Years | 3 (10.3%) | 0 (0.0%) |
| 35 to 64 Years | 15 (50.0%) | 2 (6.2%) |
| 65 to 74 Years | 12 (80.0%) | 14 (42.4%) |
| 75 Years and over | 5 (31.2%) | 7 (31.8%) |
Disability Class: Self-Care Difficulty
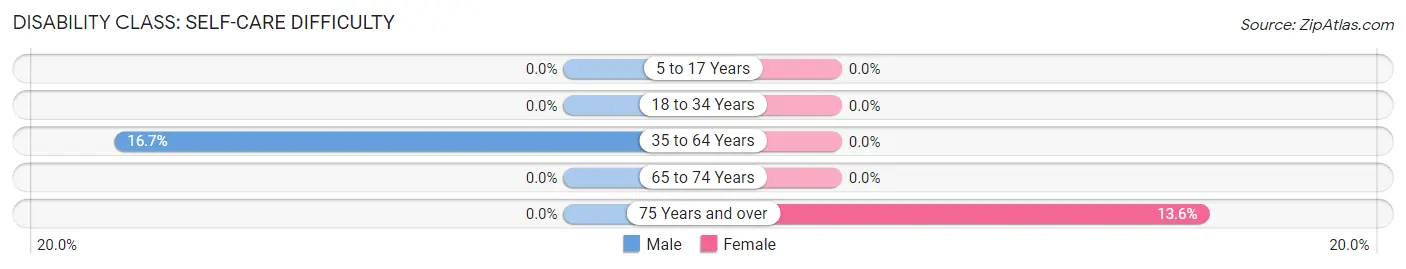
| Age Bracket | Male | Female |
| 5 to 17 Years | 0 (0.0%) | 0 (0.0%) |
| 18 to 34 Years | 0 (0.0%) | 0 (0.0%) |
| 35 to 64 Years | 5 (16.7%) | 0 (0.0%) |
| 65 to 74 Years | 0 (0.0%) | 0 (0.0%) |
| 75 Years and over | 0 (0.0%) | 3 (13.6%) |
Technology Access in East Hodge
Computing Device Access in East Hodge
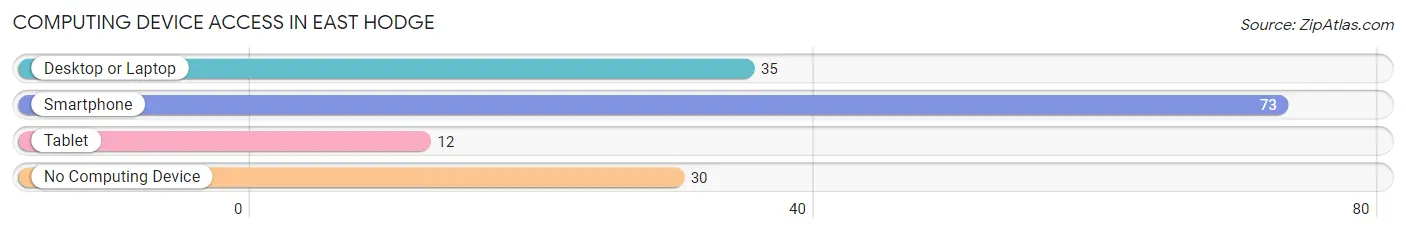
| Device Type | # Households | % Households |
| Desktop or Laptop | 35 | 29.9% |
| Smartphone | 73 | 62.4% |
| Tablet | 12 | 10.3% |
| No Computing Device | 30 | 25.6% |
| Total | 117 | 100.0% |
Internet Access in East Hodge

| Internet Type | # Households | % Households |
| Dial-Up Internet | 0 | 0.0% |
| Broadband Home | 20 | 17.1% |
| Cellular Data Only | 36 | 30.8% |
| Satellite Internet | 4 | 3.4% |
| No Internet | 54 | 46.2% |
| Total | 117 | 100.0% |
East Hodge Summary
East Hodge is a small unincorporated community located in Jackson Parish, Louisiana. It is situated approximately 8 miles east of Jonesboro, the parish seat. The population of East Hodge was estimated to be around 500 in 2020.
History
East Hodge was founded in the late 19th century by a group of settlers from the nearby town of Hodge. The settlers were looking for a place to settle and start a new life. The town was named after the original settlers, and the name has remained the same ever since.
East Hodge was a small farming community for many years, and the main crops grown were cotton, corn, and soybeans. The town also had a few small businesses, such as a general store, a blacksmith shop, and a sawmill.
In the early 20th century, East Hodge began to experience a population boom. This was due to the influx of new settlers from other parts of the state and the country. The population of East Hodge peaked in the 1950s, when it had a population of around 1,000 people.
Geography
East Hodge is located in the northern part of Jackson Parish, Louisiana. It is situated approximately 8 miles east of Jonesboro, the parish seat. The town is located on the banks of the Ouachita River, which is a major tributary of the Mississippi River.
The terrain of East Hodge is mostly flat, with some rolling hills. The town is surrounded by farmland and forests. The climate of East Hodge is humid subtropical, with hot summers and mild winters.
Economy
East Hodge is a small, rural community with a limited economy. The main industries in the town are agriculture and forestry. The town is home to several small farms, which grow cotton, corn, soybeans, and other crops. The town also has a few small businesses, such as a general store, a blacksmith shop, and a sawmill.
The town is also home to a few manufacturing companies, which produce furniture, clothing, and other goods. The town also has a few restaurants and bars, which serve local cuisine.
Demographics
East Hodge is a small, rural community with a population of around 500 people. The town is predominantly white, with a small African American population. The median household income in East Hodge is around $30,000, and the median home value is around $90,000. The town has a high rate of poverty, with around 25% of the population living below the poverty line.
Common Questions
What is Per Capita Income in East Hodge?
Per Capita income in East Hodge is $12,216.
What is the Median Family Income in East Hodge?
Median Family Income in East Hodge is $25,114.
What is the Median Household income in East Hodge?
Median Household Income in East Hodge is $25,568.
What is Inequality or Gini Index in East Hodge?
Inequality or Gini Index in East Hodge is 0.36.
What is the Total Population of East Hodge?
Total Population of East Hodge is 333.
What is the Total Male Population of East Hodge?
Total Male Population of East Hodge is 145.
What is the Total Female Population of East Hodge?
Total Female Population of East Hodge is 188.
What is the Ratio of Males per 100 Females in East Hodge?
There are 77.13 Males per 100 Females in East Hodge.
What is the Ratio of Females per 100 Males in East Hodge?
There are 129.66 Females per 100 Males in East Hodge.
What is the Median Population Age in East Hodge?
Median Population Age in East Hodge is 30.6 Years.
What is the Average Family Size in East Hodge
Average Family Size in East Hodge is 3.9 People.
What is the Average Household Size in East Hodge
Average Household Size in East Hodge is 2.9 People.
How Large is the Labor Force in East Hodge?
There are 85 People in the Labor Forcein in East Hodge.
What is the Percentage of People in the Labor Force in East Hodge?
38.5% of People are in the Labor Force in East Hodge.