Oakdale, LA Map & Demographics
Oakdale Map
Oakdale Overview
$21,406
PER CAPITA INCOME
$55,022
AVG FAMILY INCOME
$46,250
AVG HOUSEHOLD INCOME
11.3%
WAGE / INCOME GAP [ % ]
88.7¢/ $1
WAGE / INCOME GAP [ $ ]
0.51
INEQUALITY / GINI INDEX
6,701
TOTAL POPULATION
4,211
MALE POPULATION
2,490
FEMALE POPULATION
169.12
MALES / 100 FEMALES
59.13
FEMALES / 100 MALES
42.1
MEDIAN AGE
2.7
AVG FAMILY SIZE
2.4
AVG HOUSEHOLD SIZE
2,011
LABOR FORCE [ PEOPLE ]
35.1%
PERCENT IN LABOR FORCE
10.4%
UNEMPLOYMENT RATE
Oakdale Zip Codes
Oakdale Area Codes
Income in Oakdale
Income Overview in Oakdale
Per Capita Income in Oakdale is $21,406, while median incomes of families and households are $55,022 and $46,250 respectively.
| Characteristic | Number | Measure |
| Per Capita Income | 6,701 | $21,406 |
| Median Family Income | 1,411 | $55,022 |
| Mean Family Income | 1,411 | $78,601 |
| Median Household Income | 1,908 | $46,250 |
| Mean Household Income | 1,908 | $67,387 |
| Income Deficit | 1,411 | $0 |
| Wage / Income Gap (%) | 6,701 | 11.33% |
| Wage / Income Gap ($) | 6,701 | 88.67¢ per $1 |
| Gini / Inequality Index | 6,701 | 0.51 |
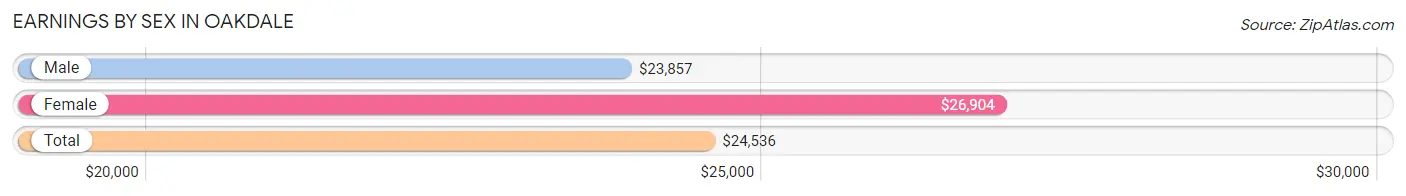
Earnings by Sex in Oakdale
Average Earnings in Oakdale are $24,536, $23,857 for men and $26,904 for women, a difference of 11.3%.
| Sex | Number | Average Earnings |
| Male | 1,575 (59.0%) | $23,857 |
| Female | 1,093 (41.0%) | $26,904 |
| Total | 2,668 (100.0%) | $24,536 |
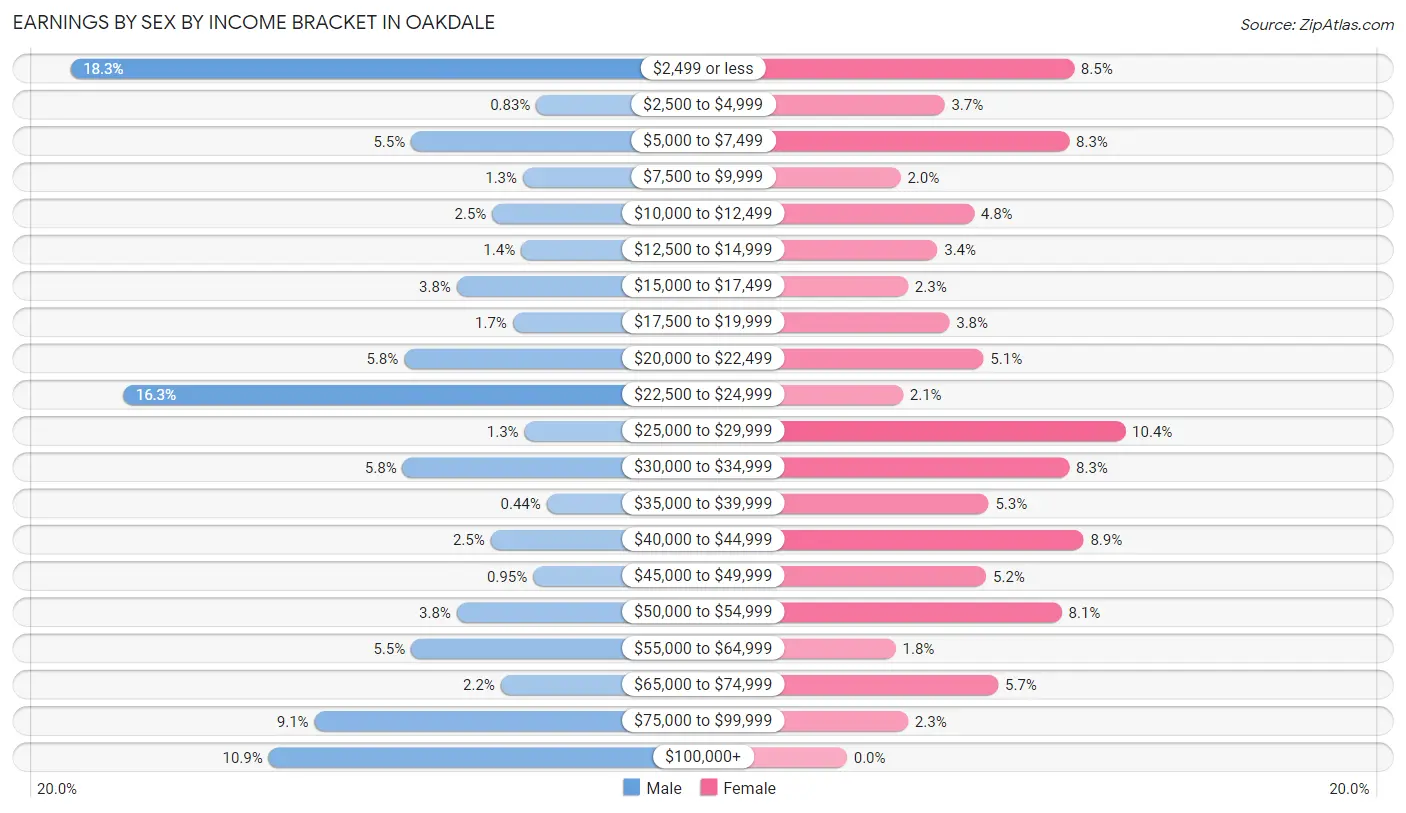
Earnings by Sex by Income Bracket in Oakdale
The most common earnings brackets in Oakdale are $2,499 or less for men (288 | 18.3%) and $25,000 to $29,999 for women (114 | 10.4%).
| Income | Male | Female |
| $2,499 or less | 288 (18.3%) | 93 (8.5%) |
| $2,500 to $4,999 | 13 (0.8%) | 40 (3.7%) |
| $5,000 to $7,499 | 87 (5.5%) | 91 (8.3%) |
| $7,500 to $9,999 | 21 (1.3%) | 22 (2.0%) |
| $10,000 to $12,499 | 39 (2.5%) | 52 (4.8%) |
| $12,500 to $14,999 | 22 (1.4%) | 37 (3.4%) |
| $15,000 to $17,499 | 60 (3.8%) | 25 (2.3%) |
| $17,500 to $19,999 | 27 (1.7%) | 42 (3.8%) |
| $20,000 to $22,499 | 91 (5.8%) | 56 (5.1%) |
| $22,500 to $24,999 | 257 (16.3%) | 23 (2.1%) |
| $25,000 to $29,999 | 20 (1.3%) | 114 (10.4%) |
| $30,000 to $34,999 | 92 (5.8%) | 91 (8.3%) |
| $35,000 to $39,999 | 7 (0.4%) | 58 (5.3%) |
| $40,000 to $44,999 | 40 (2.5%) | 97 (8.9%) |
| $45,000 to $49,999 | 15 (0.9%) | 57 (5.2%) |
| $50,000 to $54,999 | 60 (3.8%) | 88 (8.1%) |
| $55,000 to $64,999 | 87 (5.5%) | 20 (1.8%) |
| $65,000 to $74,999 | 34 (2.2%) | 62 (5.7%) |
| $75,000 to $99,999 | 144 (9.1%) | 25 (2.3%) |
| $100,000+ | 171 (10.9%) | 0 (0.0%) |
| Total | 1,575 (100.0%) | 1,093 (100.0%) |
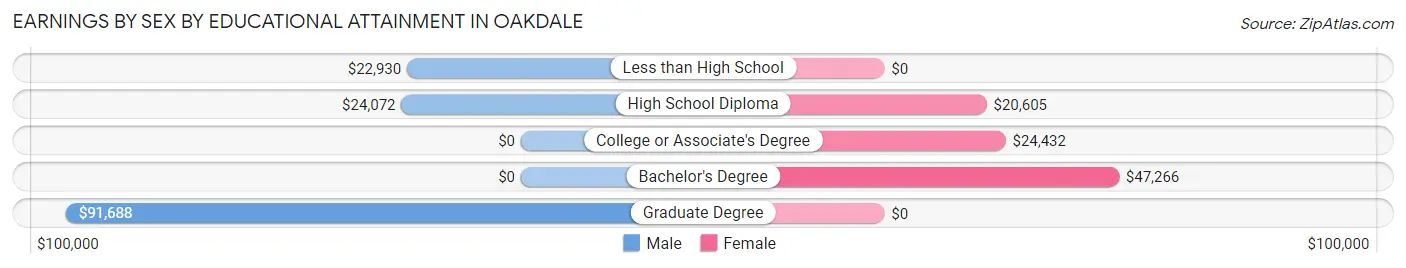
Earnings by Sex by Educational Attainment in Oakdale
Average earnings in Oakdale are $24,263 for men and $30,646 for women, a difference of 20.8%. Men with an educational attainment of graduate degree enjoy the highest average annual earnings of $91,688, while those with less than high school education earn the least with $22,930. Women with an educational attainment of bachelor's degree earn the most with the average annual earnings of $47,266, while those with high school diploma education have the smallest earnings of $20,605.
| Educational Attainment | Male Income | Female Income |
| Less than High School | $22,930 | $0 |
| High School Diploma | $24,072 | $20,605 |
| College or Associate's Degree | - | - |
| Bachelor's Degree | - | - |
| Graduate Degree | $91,688 | $0 |
| Total | $24,263 | $30,646 |
Family Income in Oakdale
Family Income Brackets in Oakdale
According to the Oakdale family income data, there are 439 families falling into the $50,000 to $74,999 income range, which is the most common income bracket and makes up 31.1% of all families. Conversely, the $200,000+ income bracket is the least frequent group with only 14 families (1.0%) belonging to this category.
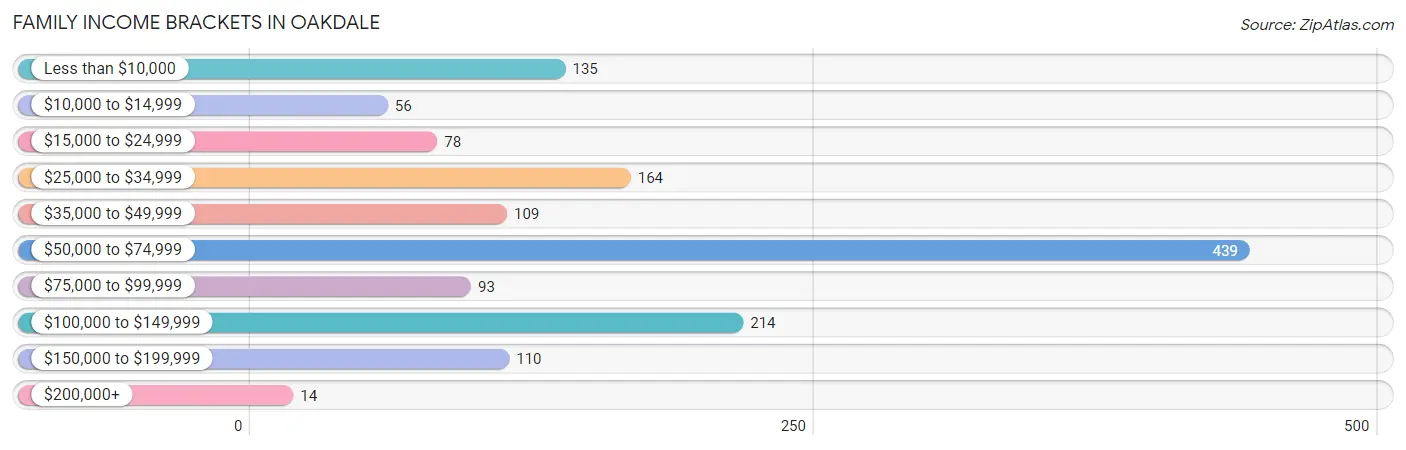
| Income Bracket | # Families | % Families |
| Less than $10,000 | 135 | 9.6% |
| $10,000 to $14,999 | 56 | 4.0% |
| $15,000 to $24,999 | 78 | 5.5% |
| $25,000 to $34,999 | 164 | 11.6% |
| $35,000 to $49,999 | 109 | 7.7% |
| $50,000 to $74,999 | 439 | 31.1% |
| $75,000 to $99,999 | 93 | 6.6% |
| $100,000 to $149,999 | 214 | 15.2% |
| $150,000 to $199,999 | 110 | 7.8% |
| $200,000+ | 14 | 1.0% |
Family Income by Famaliy Size in Oakdale
4-person families (159 | 11.3%) account for the highest median family income in Oakdale with $63,652 per family, while 2-person families (613 | 43.4%) have the highest median income of $26,646 per family member.
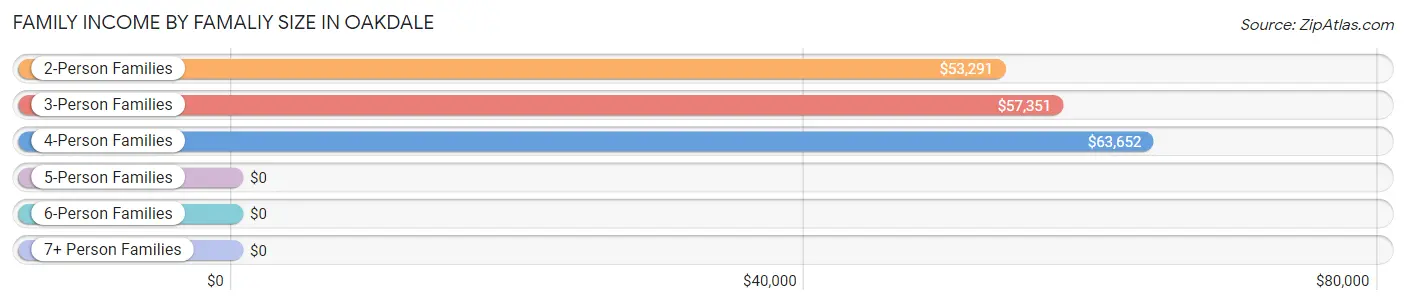
| Income Bracket | # Families | Median Income |
| 2-Person Families | 613 (43.4%) | $53,291 |
| 3-Person Families | 471 (33.4%) | $57,351 |
| 4-Person Families | 159 (11.3%) | $63,652 |
| 5-Person Families | 83 (5.9%) | $0 |
| 6-Person Families | 85 (6.0%) | $0 |
| 7+ Person Families | 0 (0.0%) | $0 |
| Total | 1,411 (100.0%) | $55,022 |
Family Income by Number of Earners in Oakdale
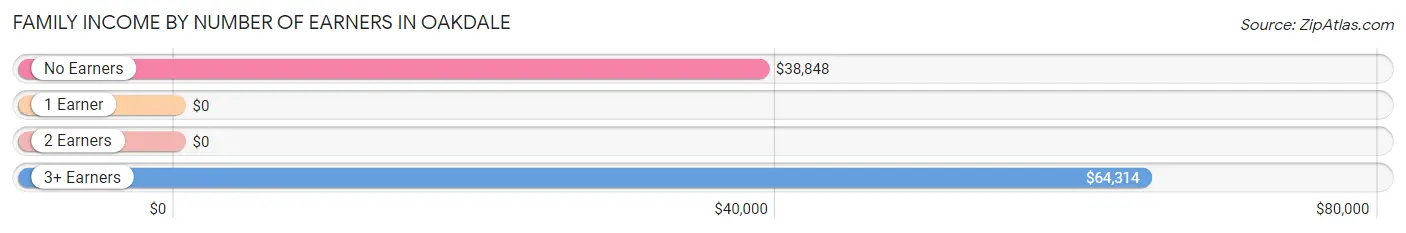
| Number of Earners | # Families | Median Income |
| No Earners | 377 (26.7%) | $38,848 |
| 1 Earner | 443 (31.4%) | $0 |
| 2 Earners | 517 (36.6%) | $0 |
| 3+ Earners | 74 (5.2%) | $64,314 |
| Total | 1,411 (100.0%) | $55,022 |
Household Income in Oakdale
Household Income Brackets in Oakdale
With 452 households falling in the category, the $50,000 to $74,999 income range is the most frequent in Oakdale, accounting for 23.7% of all households. In contrast, only 13 households (0.7%) fall into the $200,000+ income bracket, making it the least populous group.
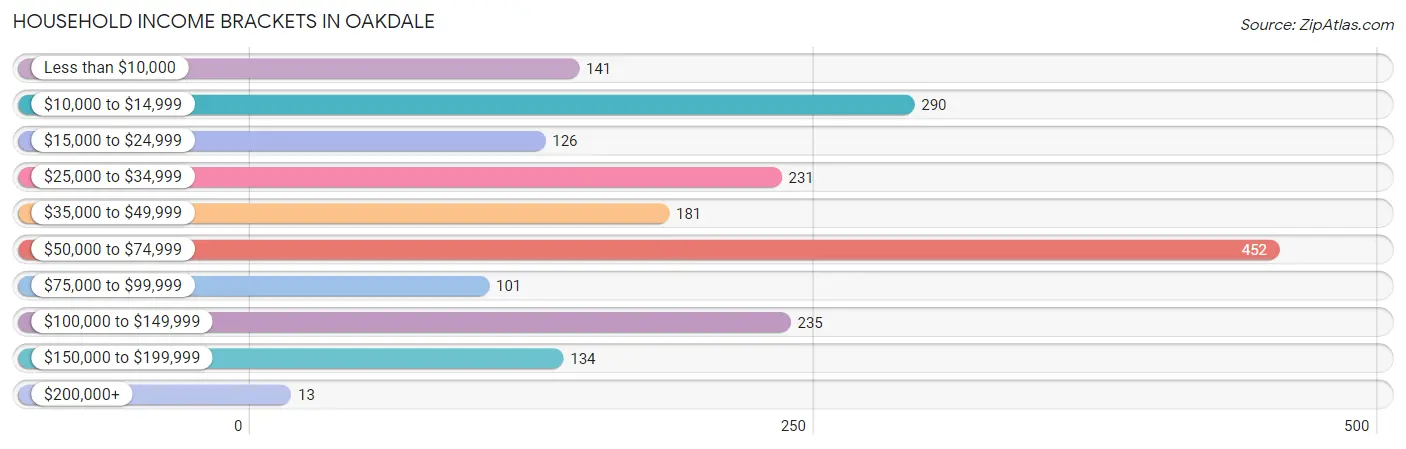
| Income Bracket | # Households | % Households |
| Less than $10,000 | 141 | 7.4% |
| $10,000 to $14,999 | 290 | 15.2% |
| $15,000 to $24,999 | 126 | 6.6% |
| $25,000 to $34,999 | 231 | 12.1% |
| $35,000 to $49,999 | 181 | 9.5% |
| $50,000 to $74,999 | 452 | 23.7% |
| $75,000 to $99,999 | 101 | 5.3% |
| $100,000 to $149,999 | 235 | 12.3% |
| $150,000 to $199,999 | 134 | 7.0% |
| $200,000+ | 13 | 0.7% |
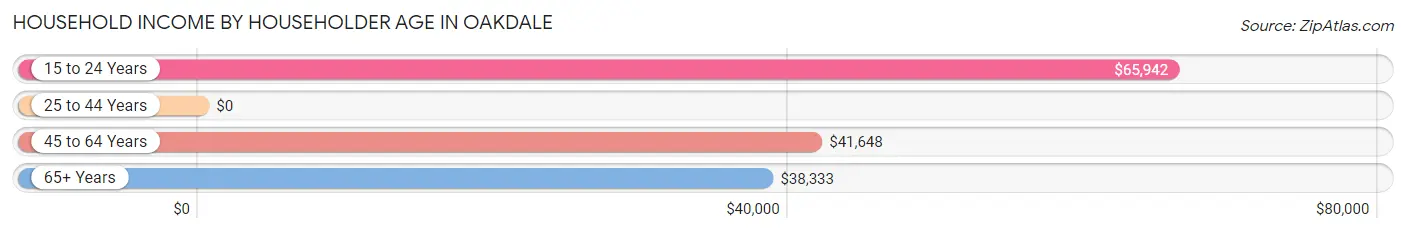
Household Income by Householder Age in Oakdale
The median household income in Oakdale is $46,250, with the highest median household income of $65,942 found in the 15 to 24 years age bracket for the primary householder. A total of 106 households (5.6%) fall into this category. Meanwhile, the 25 to 44 years age bracket for the primary householder has the lowest median household income of $0, with 557 households (29.2%) in this group.
| Income Bracket | # Households | Median Income |
| 15 to 24 Years | 106 (5.6%) | $65,942 |
| 25 to 44 Years | 557 (29.2%) | $0 |
| 45 to 64 Years | 555 (29.1%) | $41,648 |
| 65+ Years | 690 (36.2%) | $38,333 |
| Total | 1,908 (100.0%) | $46,250 |
Poverty in Oakdale
Income Below Poverty by Sex and Age in Oakdale
With 14.5% poverty level for males and 34.9% for females among the residents of Oakdale, 6 to 11 year old males and 5 year old females are the most vulnerable to poverty, with 92 males (46.9%) and 122 females (100.0%) in their respective age groups living below the poverty level.
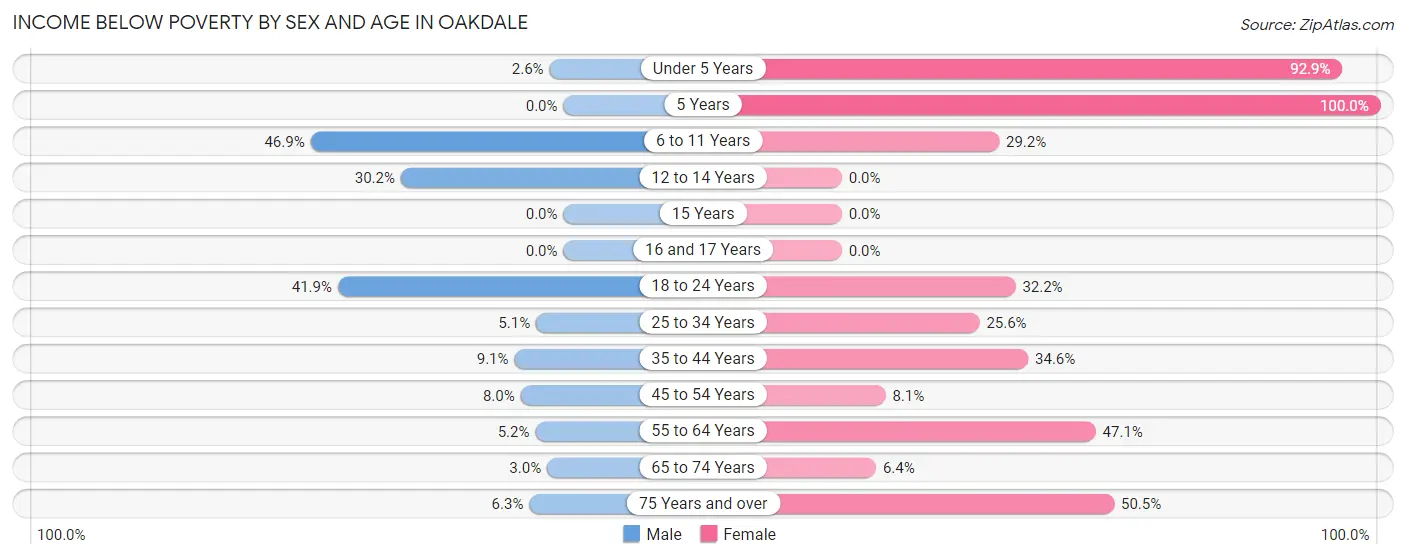
| Age Bracket | Male | Female |
| Under 5 Years | 3 (2.6%) | 144 (92.9%) |
| 5 Years | 0 (0.0%) | 122 (100.0%) |
| 6 to 11 Years | 92 (46.9%) | 54 (29.2%) |
| 12 to 14 Years | 35 (30.2%) | 0 (0.0%) |
| 15 Years | 0 (0.0%) | 0 (0.0%) |
| 16 and 17 Years | 0 (0.0%) | 0 (0.0%) |
| 18 to 24 Years | 90 (41.9%) | 78 (32.2%) |
| 25 to 34 Years | 12 (5.1%) | 104 (25.6%) |
| 35 to 44 Years | 20 (9.1%) | 74 (34.6%) |
| 45 to 54 Years | 19 (8.0%) | 18 (8.1%) |
| 55 to 64 Years | 10 (5.2%) | 147 (47.1%) |
| 65 to 74 Years | 9 (3.0%) | 24 (6.4%) |
| 75 Years and over | 14 (6.3%) | 96 (50.5%) |
| Total | 304 (14.5%) | 861 (34.9%) |
Income Above Poverty by Sex and Age in Oakdale
According to the poverty statistics in Oakdale, males aged 5 years and females aged 12 to 14 years are the age groups that are most secure financially, with 100.0% of males and 100.0% of females in these age groups living above the poverty line.
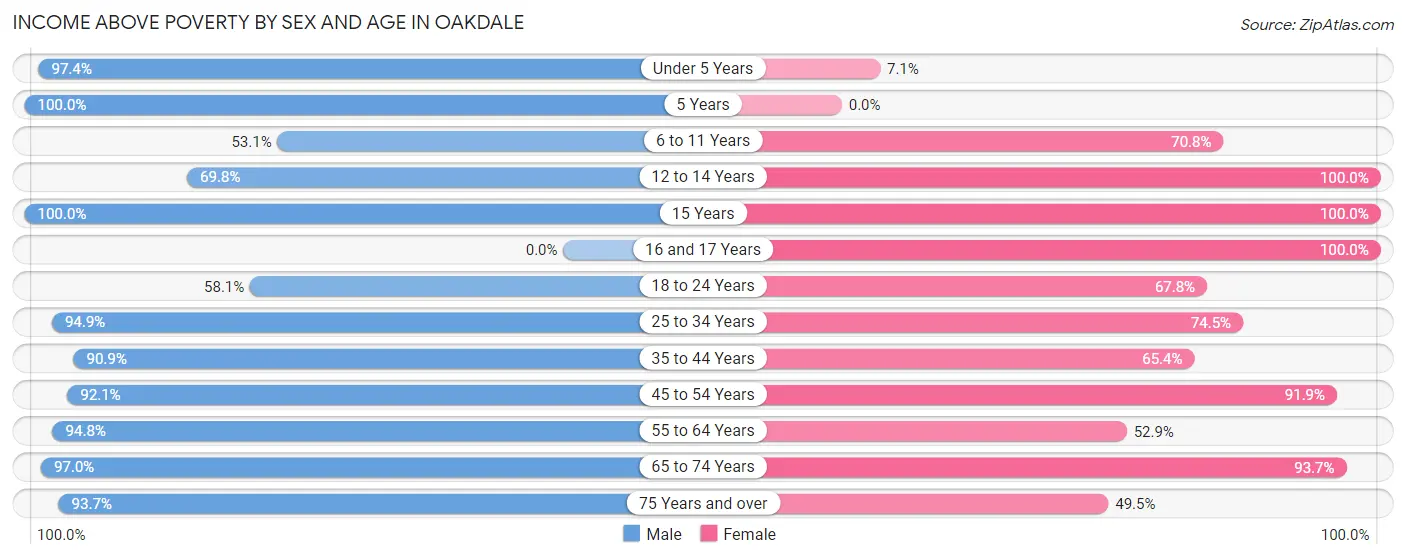
| Age Bracket | Male | Female |
| Under 5 Years | 113 (97.4%) | 11 (7.1%) |
| 5 Years | 24 (100.0%) | 0 (0.0%) |
| 6 to 11 Years | 104 (53.1%) | 131 (70.8%) |
| 12 to 14 Years | 81 (69.8%) | 23 (100.0%) |
| 15 Years | 22 (100.0%) | 7 (100.0%) |
| 16 and 17 Years | 0 (0.0%) | 8 (100.0%) |
| 18 to 24 Years | 125 (58.1%) | 164 (67.8%) |
| 25 to 34 Years | 224 (94.9%) | 303 (74.5%) |
| 35 to 44 Years | 200 (90.9%) | 140 (65.4%) |
| 45 to 54 Years | 220 (92.0%) | 204 (91.9%) |
| 55 to 64 Years | 182 (94.8%) | 165 (52.9%) |
| 65 to 74 Years | 287 (97.0%) | 354 (93.6%) |
| 75 Years and over | 207 (93.7%) | 94 (49.5%) |
| Total | 1,789 (85.5%) | 1,604 (65.1%) |
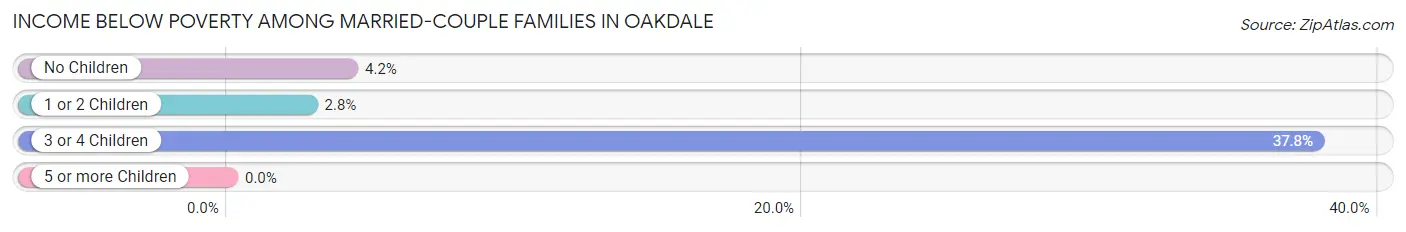
Income Below Poverty Among Married-Couple Families in Oakdale
The poverty statistics for married-couple families in Oakdale show that 6.5% or 60 of the total 925 families live below the poverty line. Families with 3 or 4 children have the highest poverty rate of 37.8%, comprising of 28 families. On the other hand, families with 1 or 2 children have the lowest poverty rate of 2.8%, which includes 7 families.
| Children | Above Poverty | Below Poverty |
| No Children | 573 (95.8%) | 25 (4.2%) |
| 1 or 2 Children | 246 (97.2%) | 7 (2.8%) |
| 3 or 4 Children | 46 (62.2%) | 28 (37.8%) |
| 5 or more Children | 0 (0.0%) | 0 (0.0%) |
| Total | 865 (93.5%) | 60 (6.5%) |
Income Below Poverty Among Single-Parent Households in Oakdale
According to the poverty data in Oakdale, 6.7% or 10 single-father households and 57.0% or 192 single-mother households are living below the poverty line. Among single-father households, those with no children have the highest poverty rate, with 10 households (12.0%) experiencing poverty. Likewise, among single-mother households, those with 5 or more children have the highest poverty rate, with 85 households (100.0%) falling below the poverty line.
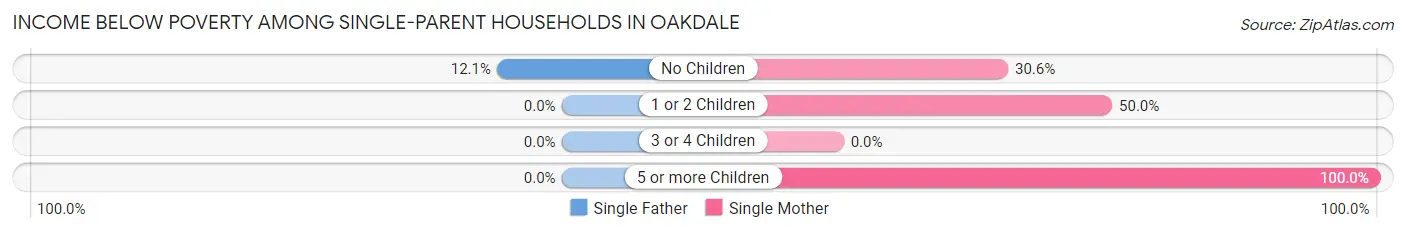
| Children | Single Father | Single Mother |
| No Children | 10 (12.0%) | 30 (30.6%) |
| 1 or 2 Children | 0 (0.0%) | 77 (50.0%) |
| 3 or 4 Children | 0 (0.0%) | 0 (0.0%) |
| 5 or more Children | 0 (0.0%) | 85 (100.0%) |
| Total | 10 (6.7%) | 192 (57.0%) |
Income Below Poverty Among Married-Couple vs Single-Parent Households in Oakdale
The poverty data for Oakdale shows that 60 of the married-couple family households (6.5%) and 202 of the single-parent households (41.6%) are living below the poverty level. Within the married-couple family households, those with 3 or 4 children have the highest poverty rate, with 28 households (37.8%) falling below the poverty line. Among the single-parent households, those with 5 or more children have the highest poverty rate, with 85 household (100.0%) living below poverty.
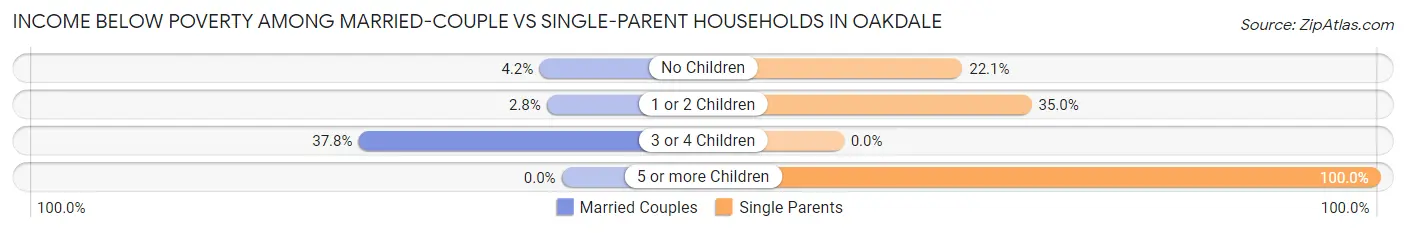
| Children | Married-Couple Families | Single-Parent Households |
| No Children | 25 (4.2%) | 40 (22.1%) |
| 1 or 2 Children | 7 (2.8%) | 77 (35.0%) |
| 3 or 4 Children | 28 (37.8%) | 0 (0.0%) |
| 5 or more Children | 0 (0.0%) | 85 (100.0%) |
| Total | 60 (6.5%) | 202 (41.6%) |
Race in Oakdale
The most populous races in Oakdale are White / Caucasian (4,278 | 63.8%), Black / African American (1,924 | 28.7%), and Hispanic or Latino (1,091 | 16.3%).
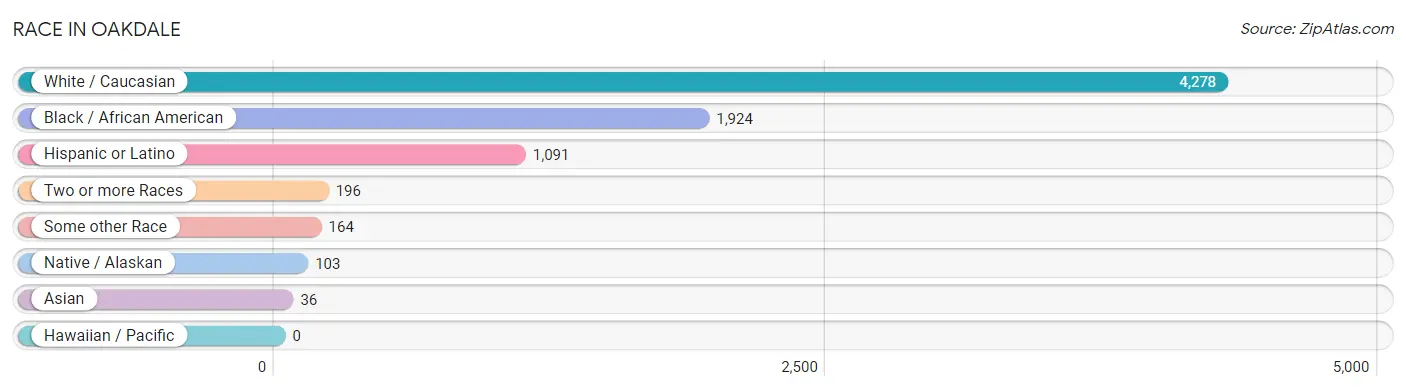
| Race | # Population | % Population |
| Asian | 36 | 0.5% |
| Black / African American | 1,924 | 28.7% |
| Hawaiian / Pacific | 0 | 0.0% |
| Hispanic or Latino | 1,091 | 16.3% |
| Native / Alaskan | 103 | 1.5% |
| White / Caucasian | 4,278 | 63.8% |
| Two or more Races | 196 | 2.9% |
| Some other Race | 164 | 2.5% |
| Total | 6,701 | 100.0% |
Ancestry in Oakdale
The most populous ancestries reported in Oakdale are Irish (719 | 10.7%), French (673 | 10.0%), Mexican (415 | 6.2%), English (413 | 6.2%), and American (212 | 3.2%), together accounting for 36.3% of all Oakdale residents.
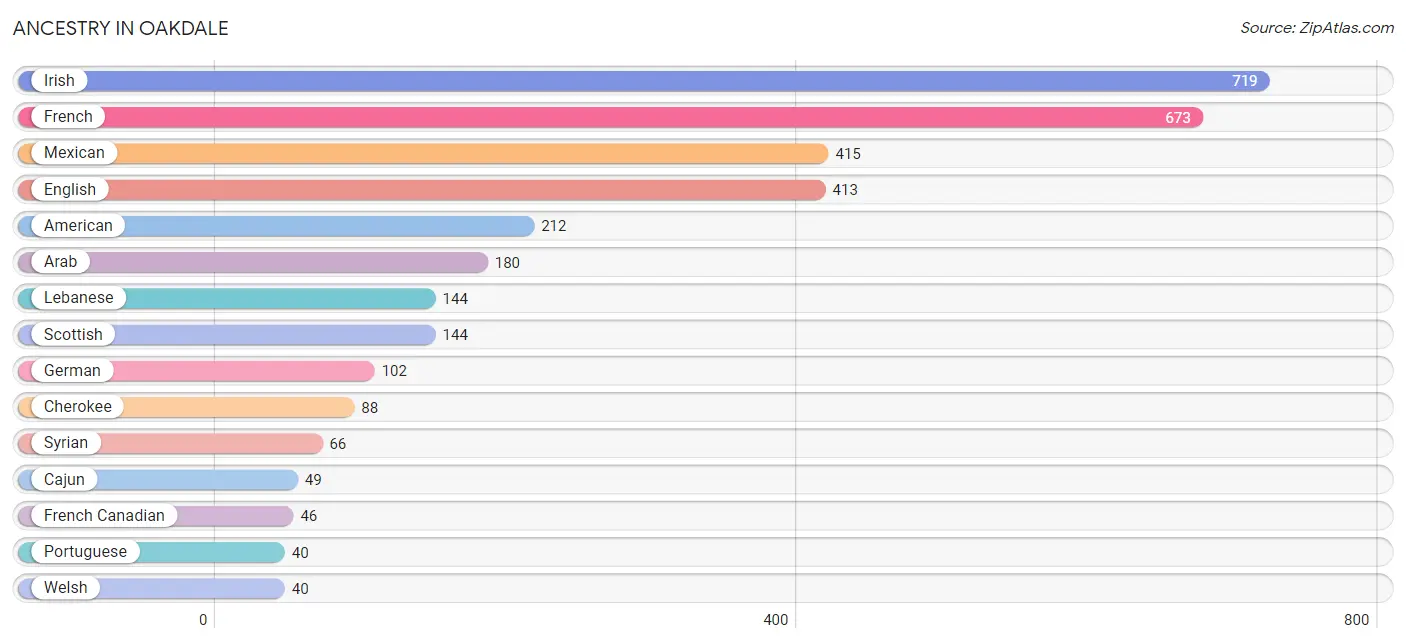
| Ancestry | # Population | % Population |
| African | 30 | 0.4% |
| American | 212 | 3.2% |
| Arab | 180 | 2.7% |
| British | 20 | 0.3% |
| Burmese | 5 | 0.1% |
| Cajun | 49 | 0.7% |
| Central American | 27 | 0.4% |
| Cherokee | 88 | 1.3% |
| Colombian | 37 | 0.5% |
| Eastern European | 32 | 0.5% |
| English | 413 | 6.2% |
| French | 673 | 10.0% |
| French Canadian | 46 | 0.7% |
| German | 102 | 1.5% |
| Honduran | 13 | 0.2% |
| Hungarian | 10 | 0.2% |
| Iranian | 12 | 0.2% |
| Irish | 719 | 10.7% |
| Italian | 34 | 0.5% |
| Jamaican | 7 | 0.1% |
| Lebanese | 144 | 2.1% |
| Mexican | 415 | 6.2% |
| Panamanian | 14 | 0.2% |
| Polish | 10 | 0.2% |
| Portuguese | 40 | 0.6% |
| Puerto Rican | 36 | 0.5% |
| Scotch-Irish | 19 | 0.3% |
| Scottish | 144 | 2.1% |
| South American | 37 | 0.5% |
| Spaniard | 2 | 0.0% |
| Subsaharan African | 30 | 0.4% |
| Swedish | 29 | 0.4% |
| Swiss | 2 | 0.0% |
| Syrian | 66 | 1.0% |
| Welsh | 40 | 0.6% | View All 35 Rows |
Immigrants in Oakdale
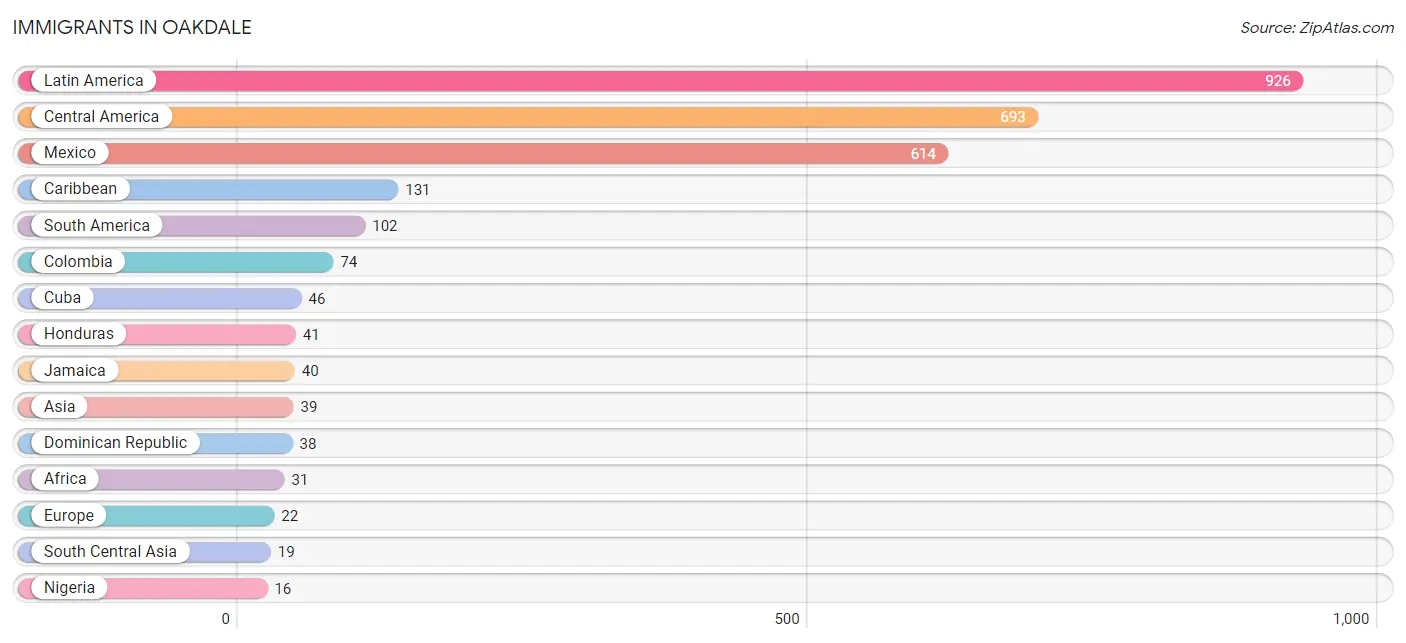
The most numerous immigrant groups reported in Oakdale came from Latin America (926 | 13.8%), Central America (693 | 10.3%), Mexico (614 | 9.2%), Caribbean (131 | 1.9%), and South America (102 | 1.5%), together accounting for 36.8% of all Oakdale residents.
| Immigration Origin | # Population | % Population |
| Africa | 31 | 0.5% |
| Asia | 39 | 0.6% |
| Australia | 6 | 0.1% |
| Bangladesh | 7 | 0.1% |
| Brazil | 9 | 0.1% |
| Caribbean | 131 | 1.9% |
| Central America | 693 | 10.3% |
| Colombia | 74 | 1.1% |
| Cuba | 46 | 0.7% |
| Dominican Republic | 38 | 0.6% |
| Eastern Africa | 7 | 0.1% |
| Eastern Asia | 5 | 0.1% |
| Eastern Europe | 14 | 0.2% |
| El Salvador | 15 | 0.2% |
| Europe | 22 | 0.3% |
| Germany | 8 | 0.1% |
| Guatemala | 9 | 0.1% |
| Haiti | 7 | 0.1% |
| Honduras | 41 | 0.6% |
| Iran | 12 | 0.2% |
| Jamaica | 40 | 0.6% |
| Korea | 5 | 0.1% |
| Laos | 8 | 0.1% |
| Latin America | 926 | 13.8% |
| Mexico | 614 | 9.2% |
| Nicaragua | 7 | 0.1% |
| Nigeria | 16 | 0.2% |
| Oceania | 6 | 0.1% |
| Panama | 7 | 0.1% |
| Peru | 7 | 0.1% |
| Romania | 14 | 0.2% |
| South Africa | 8 | 0.1% |
| South America | 102 | 1.5% |
| South Central Asia | 19 | 0.3% |
| South Eastern Asia | 15 | 0.2% |
| Venezuela | 12 | 0.2% |
| Vietnam | 7 | 0.1% |
| Western Africa | 16 | 0.2% |
| Western Europe | 8 | 0.1% |
| Zimbabwe | 7 | 0.1% | View All 40 Rows |
Sex and Age in Oakdale
Sex and Age in Oakdale
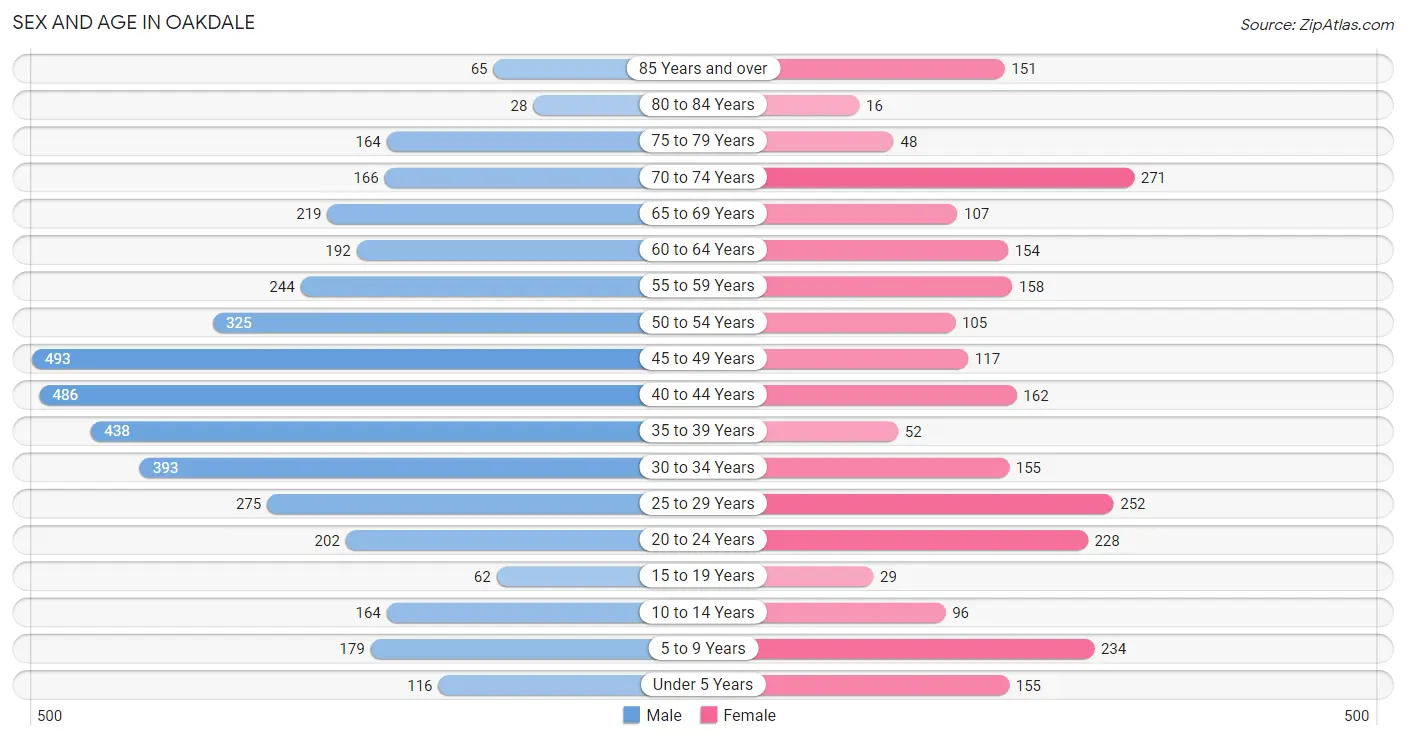
The most populous age groups in Oakdale are 45 to 49 Years (493 | 11.7%) for men and 70 to 74 Years (271 | 10.9%) for women.
| Age Bracket | Male | Female |
| Under 5 Years | 116 (2.8%) | 155 (6.2%) |
| 5 to 9 Years | 179 (4.3%) | 234 (9.4%) |
| 10 to 14 Years | 164 (3.9%) | 96 (3.9%) |
| 15 to 19 Years | 62 (1.5%) | 29 (1.2%) |
| 20 to 24 Years | 202 (4.8%) | 228 (9.2%) |
| 25 to 29 Years | 275 (6.5%) | 252 (10.1%) |
| 30 to 34 Years | 393 (9.3%) | 155 (6.2%) |
| 35 to 39 Years | 438 (10.4%) | 52 (2.1%) |
| 40 to 44 Years | 486 (11.5%) | 162 (6.5%) |
| 45 to 49 Years | 493 (11.7%) | 117 (4.7%) |
| 50 to 54 Years | 325 (7.7%) | 105 (4.2%) |
| 55 to 59 Years | 244 (5.8%) | 158 (6.4%) |
| 60 to 64 Years | 192 (4.6%) | 154 (6.2%) |
| 65 to 69 Years | 219 (5.2%) | 107 (4.3%) |
| 70 to 74 Years | 166 (3.9%) | 271 (10.9%) |
| 75 to 79 Years | 164 (3.9%) | 48 (1.9%) |
| 80 to 84 Years | 28 (0.7%) | 16 (0.6%) |
| 85 Years and over | 65 (1.5%) | 151 (6.1%) |
| Total | 4,211 (100.0%) | 2,490 (100.0%) |
Families and Households in Oakdale
Median Family Size in Oakdale
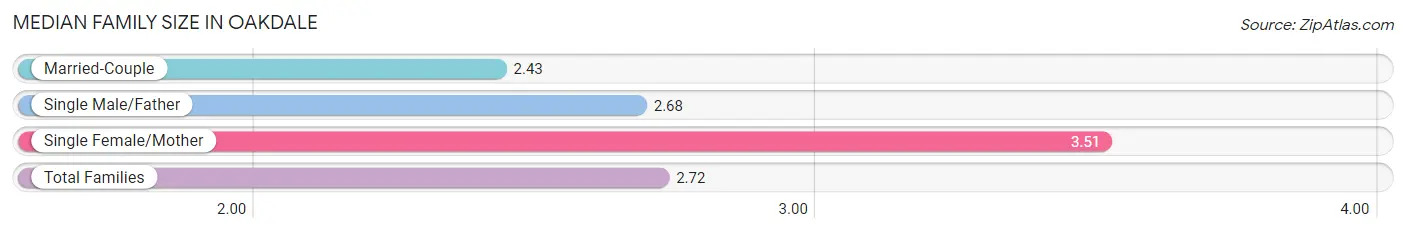
The median family size in Oakdale is 2.72 persons per family, with single female/mother families (337 | 23.9%) accounting for the largest median family size of 3.51 persons per family. On the other hand, married-couple families (925 | 65.6%) represent the smallest median family size with 2.43 persons per family.
| Family Type | # Families | Family Size |
| Married-Couple | 925 (65.6%) | 2.43 |
| Single Male/Father | 149 (10.6%) | 2.68 |
| Single Female/Mother | 337 (23.9%) | 3.51 |
| Total Families | 1,411 (100.0%) | 2.72 |
Median Household Size in Oakdale
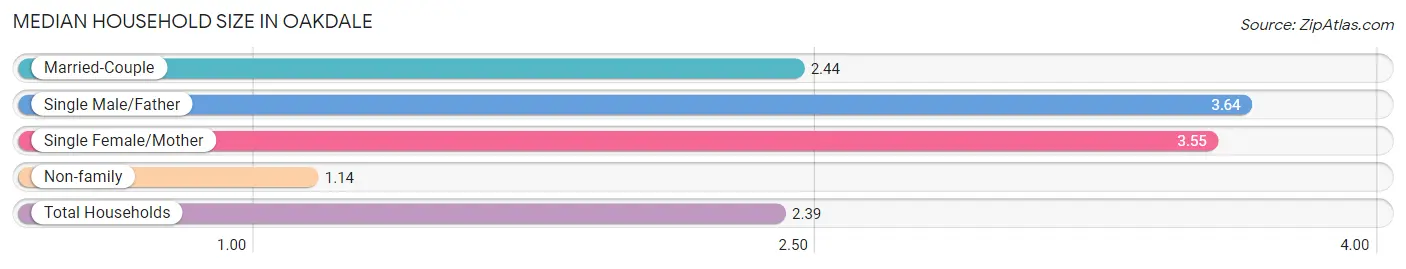
The median household size in Oakdale is 2.39 persons per household, with single male/father households (149 | 7.8%) accounting for the largest median household size of 3.64 persons per household. non-family households (497 | 26.1%) represent the smallest median household size with 1.14 persons per household.
| Household Type | # Households | Household Size |
| Married-Couple | 925 (48.5%) | 2.44 |
| Single Male/Father | 149 (7.8%) | 3.64 |
| Single Female/Mother | 337 (17.7%) | 3.55 |
| Non-family | 497 (26.1%) | 1.14 |
| Total Households | 1,908 (100.0%) | 2.39 |
Household Size by Marriage Status in Oakdale
Out of a total of 1,908 households in Oakdale, 1,411 (74.0%) are family households, while 497 (26.1%) are nonfamily households. The most numerous type of family households are 2-person households, comprising 583, and the most common type of nonfamily households are 1-person households, comprising 446.
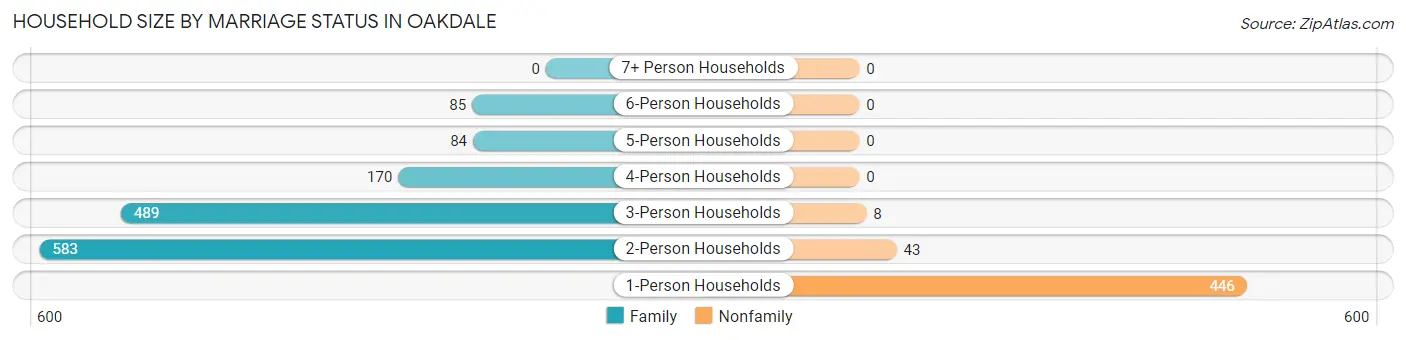
| Household Size | Family Households | Nonfamily Households |
| 1-Person Households | - | 446 (23.4%) |
| 2-Person Households | 583 (30.6%) | 43 (2.2%) |
| 3-Person Households | 489 (25.6%) | 8 (0.4%) |
| 4-Person Households | 170 (8.9%) | 0 (0.0%) |
| 5-Person Households | 84 (4.4%) | 0 (0.0%) |
| 6-Person Households | 85 (4.4%) | 0 (0.0%) |
| 7+ Person Households | 0 (0.0%) | 0 (0.0%) |
| Total | 1,411 (74.0%) | 497 (26.1%) |
Female Fertility in Oakdale
Fertility by Age in Oakdale
Average fertility rate in Oakdale is 39.0 births per 1,000 women. Women in the age bracket of 20 to 34 years have the highest fertility rate with 55.0 births per 1,000 women. Women in the age bracket of 20 to 34 years acount for 87.5% of all women with births.
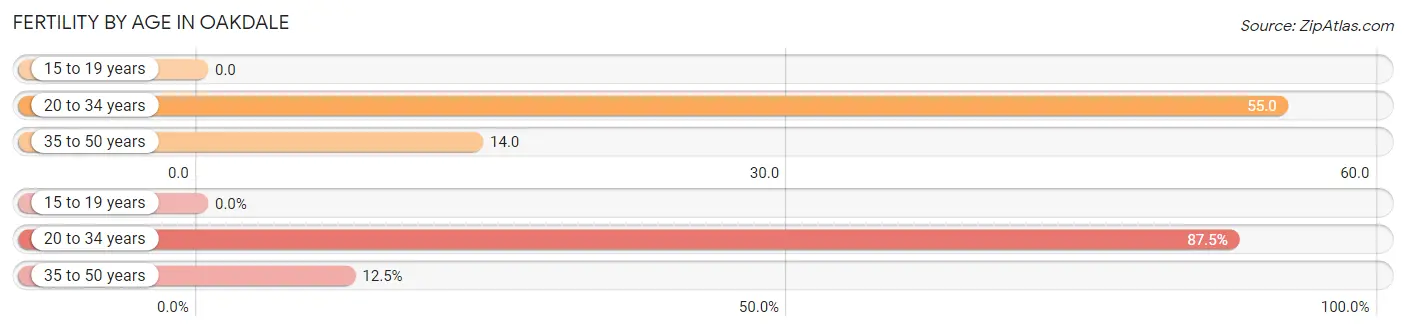
| Age Bracket | Women with Births | Births / 1,000 Women |
| 15 to 19 years | 0 (0.0%) | 0.0 |
| 20 to 34 years | 35 (87.5%) | 55.0 |
| 35 to 50 years | 5 (12.5%) | 14.0 |
| Total | 40 (100.0%) | 39.0 |
Fertility by Age by Marriage Status in Oakdale
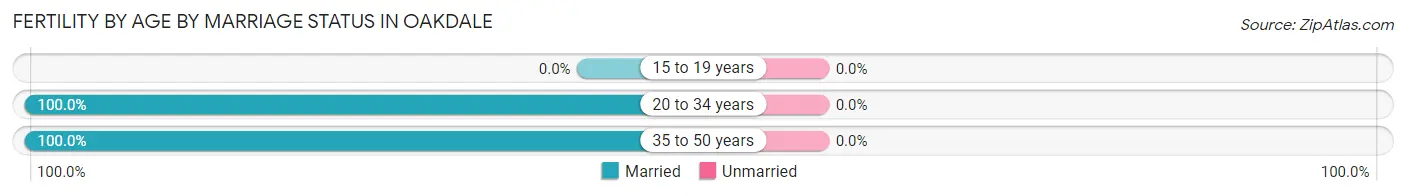
| Age Bracket | Married | Unmarried |
| 15 to 19 years | 0 (0.0%) | 0 (0.0%) |
| 20 to 34 years | 35 (100.0%) | 0 (0.0%) |
| 35 to 50 years | 5 (100.0%) | 0 (0.0%) |
| Total | 40 (100.0%) | 0 (0.0%) |
Fertility by Education in Oakdale
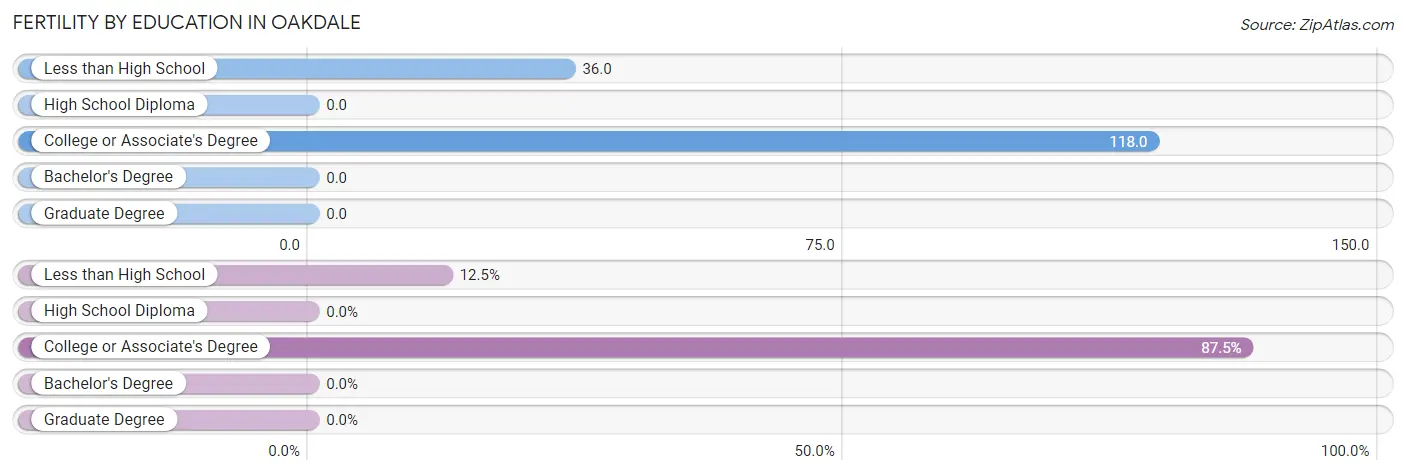
| Educational Attainment | Women with Births | Births / 1,000 Women |
| Less than High School | 5 (12.5%) | 36.0 |
| High School Diploma | 0 (0.0%) | 0.0 |
| College or Associate's Degree | 35 (87.5%) | 118.0 |
| Bachelor's Degree | 0 (0.0%) | 0.0 |
| Graduate Degree | 0 (0.0%) | 0.0 |
| Total | 40 (100.0%) | 39.0 |
Fertility by Education by Marriage Status in Oakdale
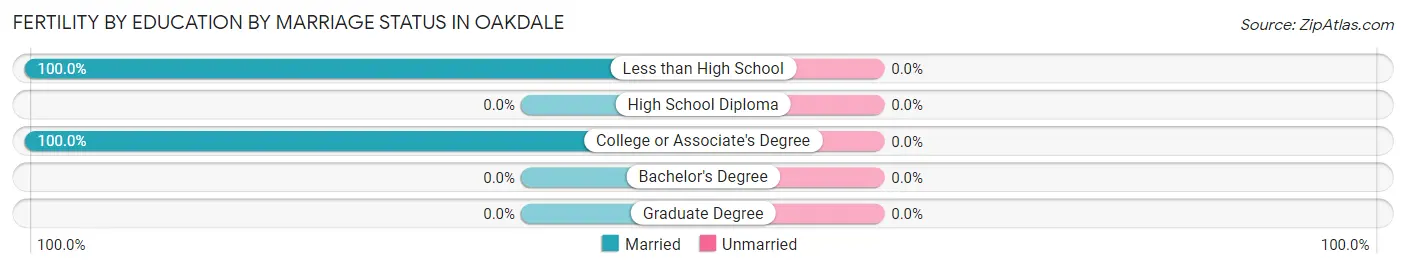
| Educational Attainment | Married | Unmarried |
| Less than High School | 5 (100.0%) | 0 (0.0%) |
| High School Diploma | 0 (0.0%) | 0 (0.0%) |
| College or Associate's Degree | 35 (100.0%) | 0 (0.0%) |
| Bachelor's Degree | 0 (0.0%) | 0 (0.0%) |
| Graduate Degree | 0 (0.0%) | 0 (0.0%) |
| Total | 40 (100.0%) | 0 (0.0%) |
Employment Characteristics in Oakdale
Employment by Class of Employer in Oakdale
Among the 1,776 employed individuals in Oakdale, private company employees (963 | 54.2%), self-employed (not incorporated) (255 | 14.4%), and federal government employees (179 | 10.1%) make up the most common classes of employment.
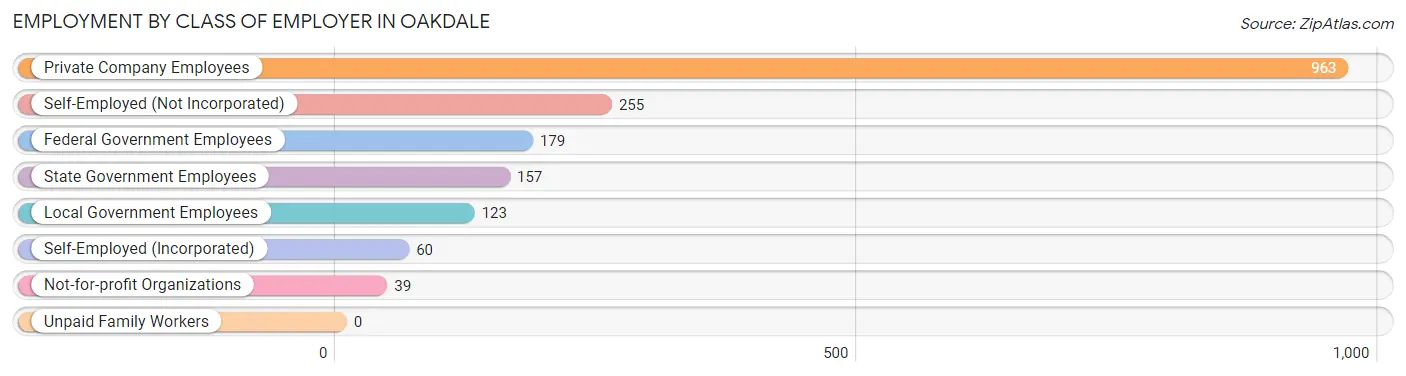
| Employer Class | # Employees | % Employees |
| Private Company Employees | 963 | 54.2% |
| Self-Employed (Incorporated) | 60 | 3.4% |
| Self-Employed (Not Incorporated) | 255 | 14.4% |
| Not-for-profit Organizations | 39 | 2.2% |
| Local Government Employees | 123 | 6.9% |
| State Government Employees | 157 | 8.8% |
| Federal Government Employees | 179 | 10.1% |
| Unpaid Family Workers | 0 | 0.0% |
| Total | 1,776 | 100.0% |
Employment Status by Age in Oakdale
According to the labor force statistics for Oakdale, out of the total population over 16 years of age (5,728), 35.1% or 2,011 individuals are in the labor force, with 10.4% or 209 of them unemployed. The age group with the highest labor force participation rate is 20 to 24 years, with 90.9% or 391 individuals in the labor force. Within the labor force, the 16 to 19 years age range has the highest percentage of unemployed individuals, with 100.0% or 40 of them being unemployed.
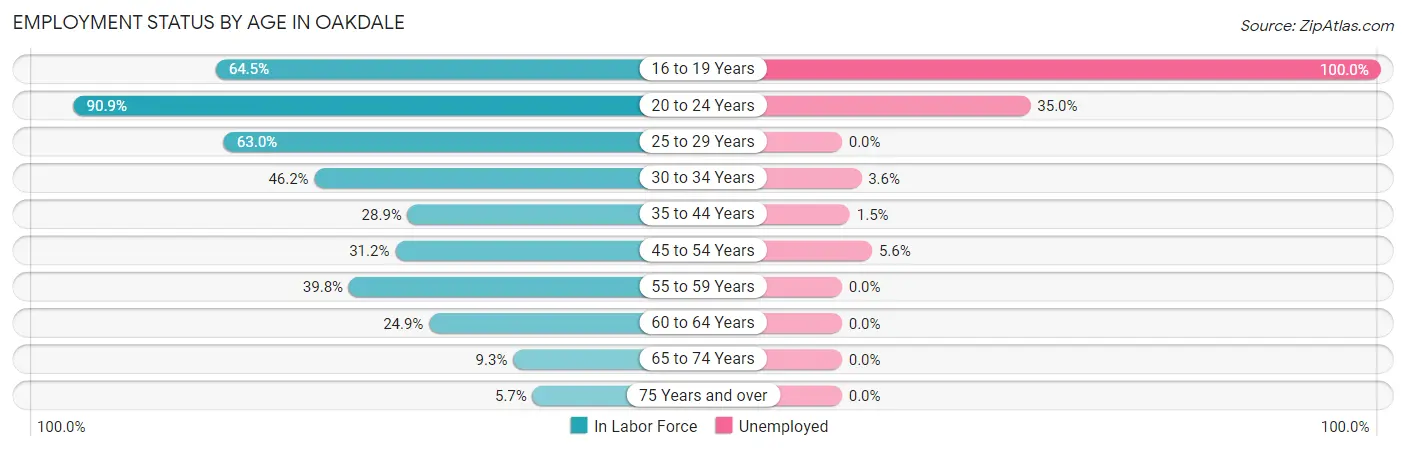
| Age Bracket | In Labor Force | Unemployed |
| 16 to 19 Years | 40 (64.5%) | 40 (100.0%) |
| 20 to 24 Years | 391 (90.9%) | 137 (35.0%) |
| 25 to 29 Years | 332 (63.0%) | 0 (0.0%) |
| 30 to 34 Years | 253 (46.2%) | 9 (3.6%) |
| 35 to 44 Years | 329 (28.9%) | 5 (1.5%) |
| 45 to 54 Years | 324 (31.2%) | 18 (5.6%) |
| 55 to 59 Years | 160 (39.8%) | 0 (0.0%) |
| 60 to 64 Years | 86 (24.9%) | 0 (0.0%) |
| 65 to 74 Years | 71 (9.3%) | 0 (0.0%) |
| 75 Years and over | 27 (5.7%) | 0 (0.0%) |
| Total | 2,011 (35.1%) | 209 (10.4%) |
Employment Status by Educational Attainment in Oakdale
According to labor force statistics for Oakdale, 37.1% of individuals (1,484) out of the total population between 25 and 64 years of age (4,001) are in the labor force, with 2.2% or 33 of them being unemployed. The group with the highest labor force participation rate are those with the educational attainment of bachelor's degree or higher, with 90.7% or 360 individuals in the labor force. Within the labor force, individuals with less than high school education have the highest percentage of unemployment, with 15.7% or 14 of them being unemployed.
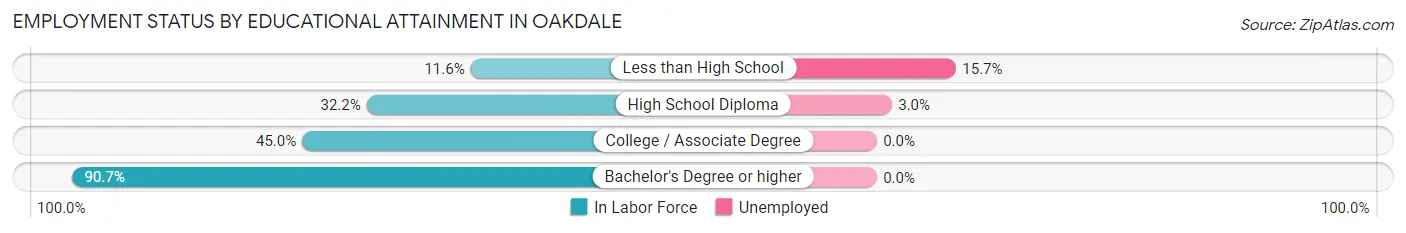
| Educational Attainment | In Labor Force | Unemployed |
| Less than High School | 89 (11.6%) | 121 (15.7%) |
| High School Diploma | 604 (32.2%) | 56 (3.0%) |
| College / Associate Degree | 431 (45.0%) | 0 (0.0%) |
| Bachelor's Degree or higher | 360 (90.7%) | 0 (0.0%) |
| Total | 1,484 (37.1%) | 88 (2.2%) |
Employment Occupations by Sex in Oakdale
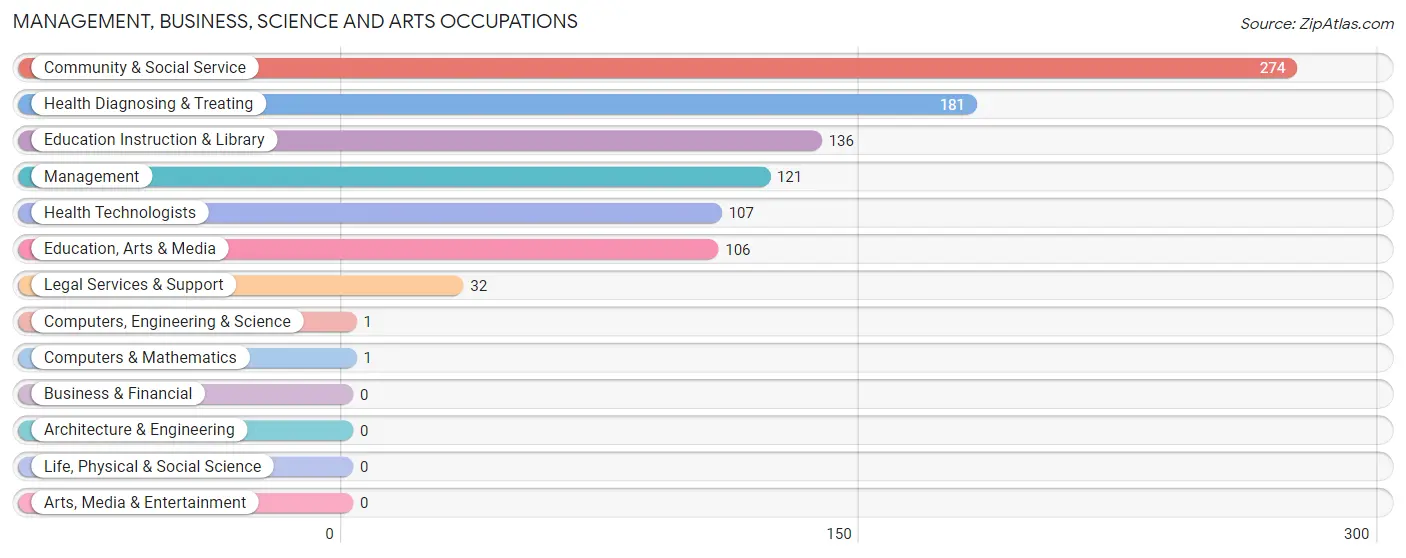
Management, Business, Science and Arts Occupations
The most common Management, Business, Science and Arts occupations in Oakdale are Community & Social Service (274 | 15.2%), Health Diagnosing & Treating (181 | 10.0%), Education Instruction & Library (136 | 7.5%), Management (121 | 6.7%), and Health Technologists (107 | 5.9%).
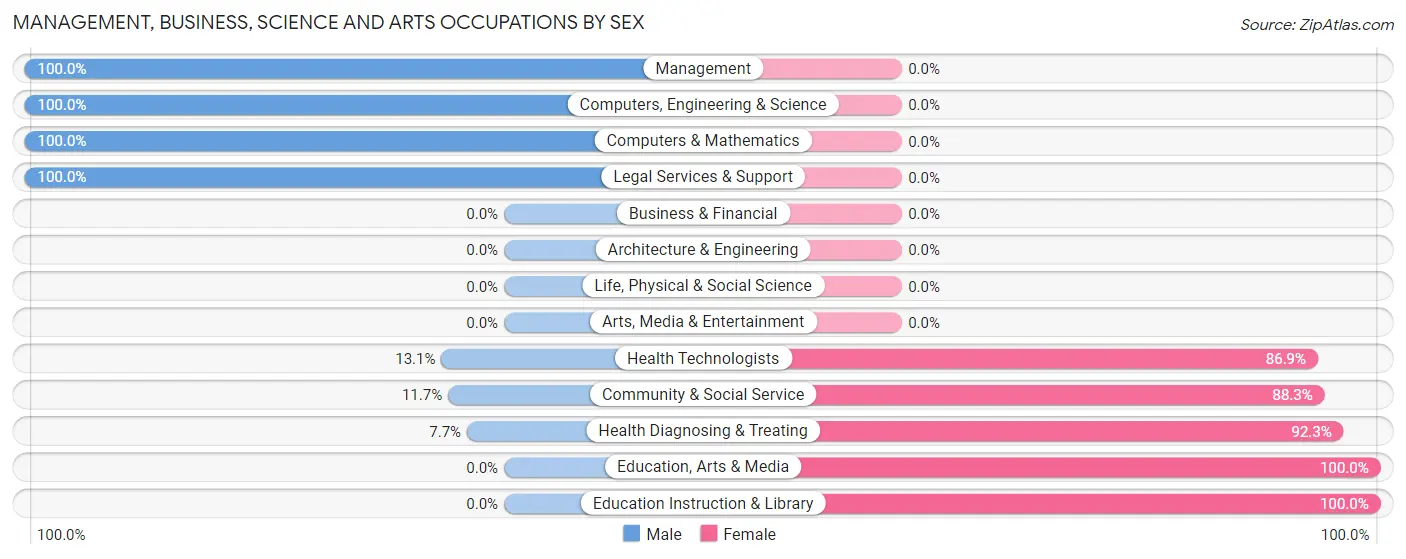
Management, Business, Science and Arts Occupations by Sex
Within the Management, Business, Science and Arts occupations in Oakdale, the most male-oriented occupations are Management (100.0%), Computers, Engineering & Science (100.0%), and Computers & Mathematics (100.0%), while the most female-oriented occupations are Education, Arts & Media (100.0%), Education Instruction & Library (100.0%), and Health Diagnosing & Treating (92.3%).
| Occupation | Male | Female |
| Management | 121 (100.0%) | 0 (0.0%) |
| Business & Financial | 0 (0.0%) | 0 (0.0%) |
| Computers, Engineering & Science | 1 (100.0%) | 0 (0.0%) |
| Computers & Mathematics | 1 (100.0%) | 0 (0.0%) |
| Architecture & Engineering | 0 (0.0%) | 0 (0.0%) |
| Life, Physical & Social Science | 0 (0.0%) | 0 (0.0%) |
| Community & Social Service | 32 (11.7%) | 242 (88.3%) |
| Education, Arts & Media | 0 (0.0%) | 106 (100.0%) |
| Legal Services & Support | 32 (100.0%) | 0 (0.0%) |
| Education Instruction & Library | 0 (0.0%) | 136 (100.0%) |
| Arts, Media & Entertainment | 0 (0.0%) | 0 (0.0%) |
| Health Diagnosing & Treating | 14 (7.7%) | 167 (92.3%) |
| Health Technologists | 14 (13.1%) | 93 (86.9%) |
| Total (Category) | 168 (29.1%) | 409 (70.9%) |
| Total (Overall) | 857 (47.5%) | 947 (52.5%) |
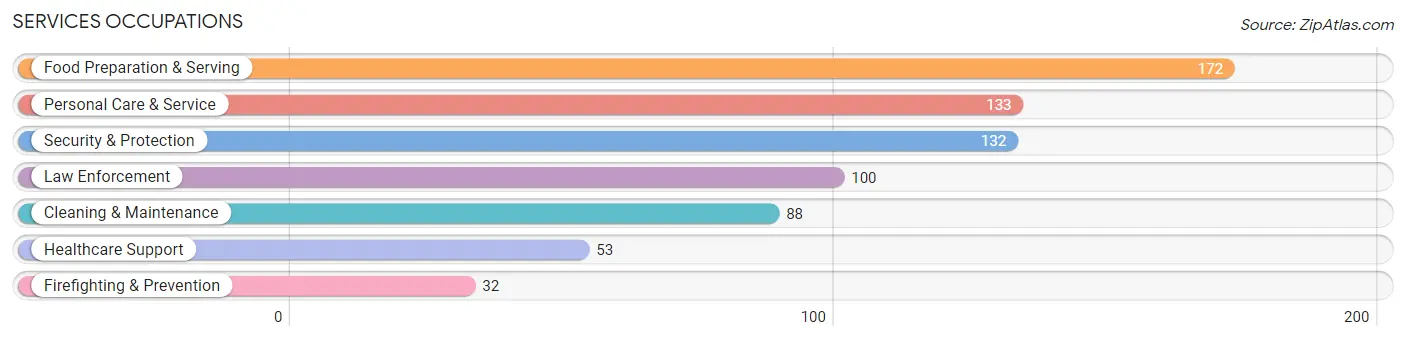
Services Occupations
The most common Services occupations in Oakdale are Food Preparation & Serving (172 | 9.5%), Personal Care & Service (133 | 7.4%), Security & Protection (132 | 7.3%), Law Enforcement (100 | 5.5%), and Cleaning & Maintenance (88 | 4.9%).
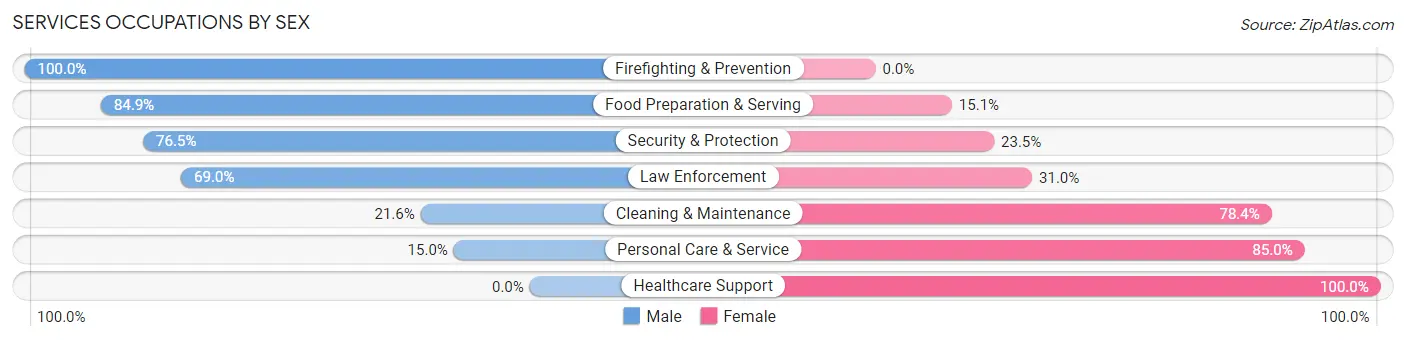
Services Occupations by Sex
Within the Services occupations in Oakdale, the most male-oriented occupations are Firefighting & Prevention (100.0%), Food Preparation & Serving (84.9%), and Security & Protection (76.5%), while the most female-oriented occupations are Healthcare Support (100.0%), Personal Care & Service (85.0%), and Cleaning & Maintenance (78.4%).
| Occupation | Male | Female |
| Healthcare Support | 0 (0.0%) | 53 (100.0%) |
| Security & Protection | 101 (76.5%) | 31 (23.5%) |
| Firefighting & Prevention | 32 (100.0%) | 0 (0.0%) |
| Law Enforcement | 69 (69.0%) | 31 (31.0%) |
| Food Preparation & Serving | 146 (84.9%) | 26 (15.1%) |
| Cleaning & Maintenance | 19 (21.6%) | 69 (78.4%) |
| Personal Care & Service | 20 (15.0%) | 113 (85.0%) |
| Total (Category) | 286 (49.5%) | 292 (50.5%) |
| Total (Overall) | 857 (47.5%) | 947 (52.5%) |
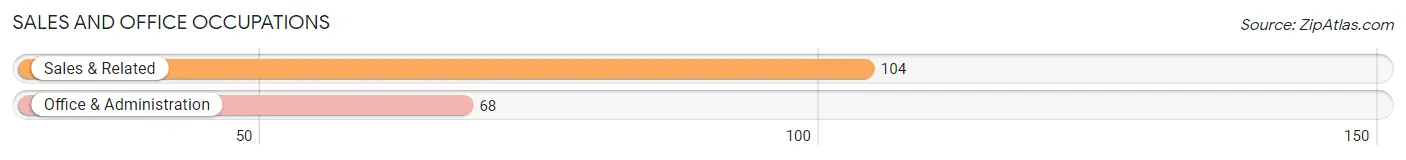
Sales and Office Occupations
The most common Sales and Office occupations in Oakdale are Sales & Related (104 | 5.8%), and Office & Administration (68 | 3.8%).
Sales and Office Occupations by Sex
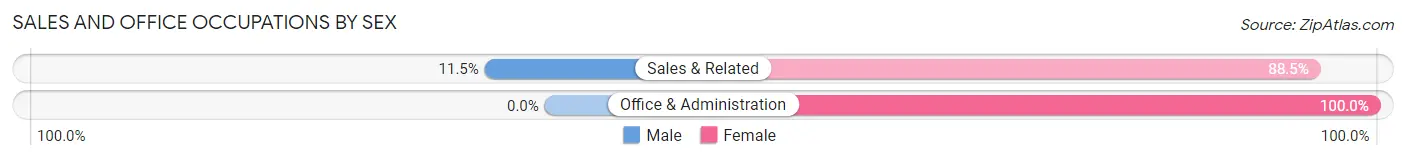
| Occupation | Male | Female |
| Sales & Related | 12 (11.5%) | 92 (88.5%) |
| Office & Administration | 0 (0.0%) | 68 (100.0%) |
| Total (Category) | 12 (7.0%) | 160 (93.0%) |
| Total (Overall) | 857 (47.5%) | 947 (52.5%) |
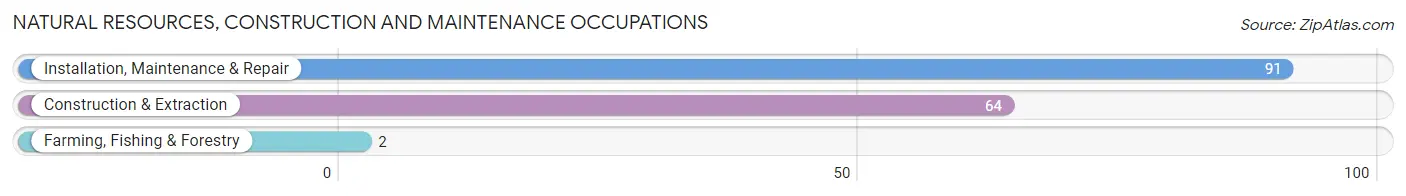
Natural Resources, Construction and Maintenance Occupations
The most common Natural Resources, Construction and Maintenance occupations in Oakdale are Installation, Maintenance & Repair (91 | 5.0%), Construction & Extraction (64 | 3.5%), and Farming, Fishing & Forestry (2 | 0.1%).
Natural Resources, Construction and Maintenance Occupations by Sex
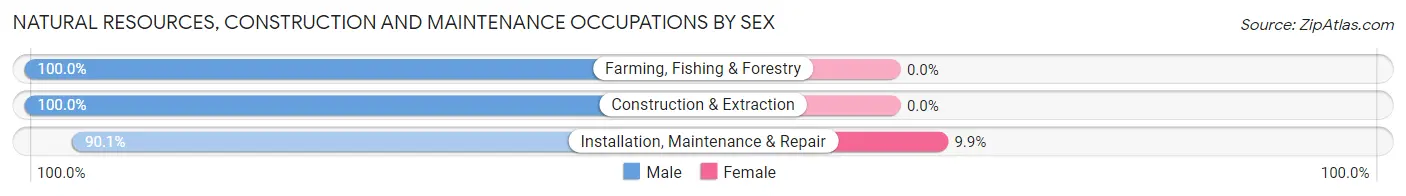
| Occupation | Male | Female |
| Farming, Fishing & Forestry | 2 (100.0%) | 0 (0.0%) |
| Construction & Extraction | 64 (100.0%) | 0 (0.0%) |
| Installation, Maintenance & Repair | 82 (90.1%) | 9 (9.9%) |
| Total (Category) | 148 (94.3%) | 9 (5.7%) |
| Total (Overall) | 857 (47.5%) | 947 (52.5%) |
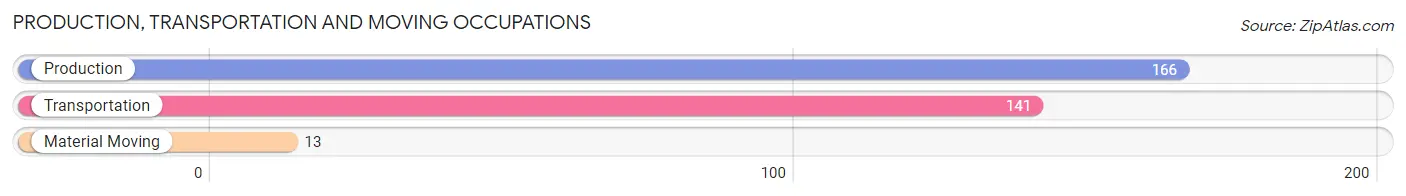
Production, Transportation and Moving Occupations
The most common Production, Transportation and Moving occupations in Oakdale are Production (166 | 9.2%), Transportation (141 | 7.8%), and Material Moving (13 | 0.7%).
Production, Transportation and Moving Occupations by Sex
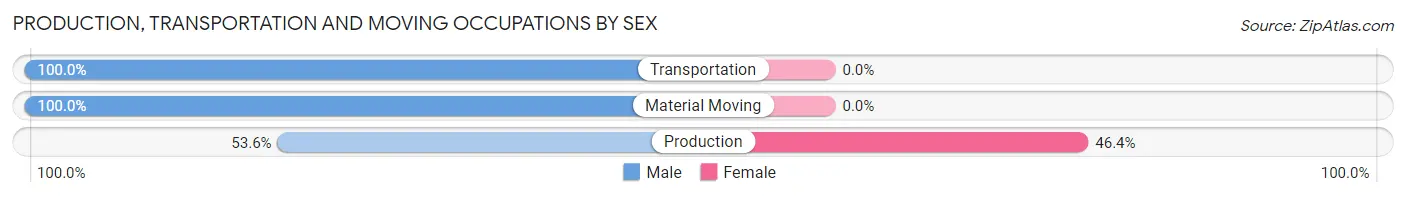
| Occupation | Male | Female |
| Production | 89 (53.6%) | 77 (46.4%) |
| Transportation | 141 (100.0%) | 0 (0.0%) |
| Material Moving | 13 (100.0%) | 0 (0.0%) |
| Total (Category) | 243 (75.9%) | 77 (24.1%) |
| Total (Overall) | 857 (47.5%) | 947 (52.5%) |
Employment Industries by Sex in Oakdale
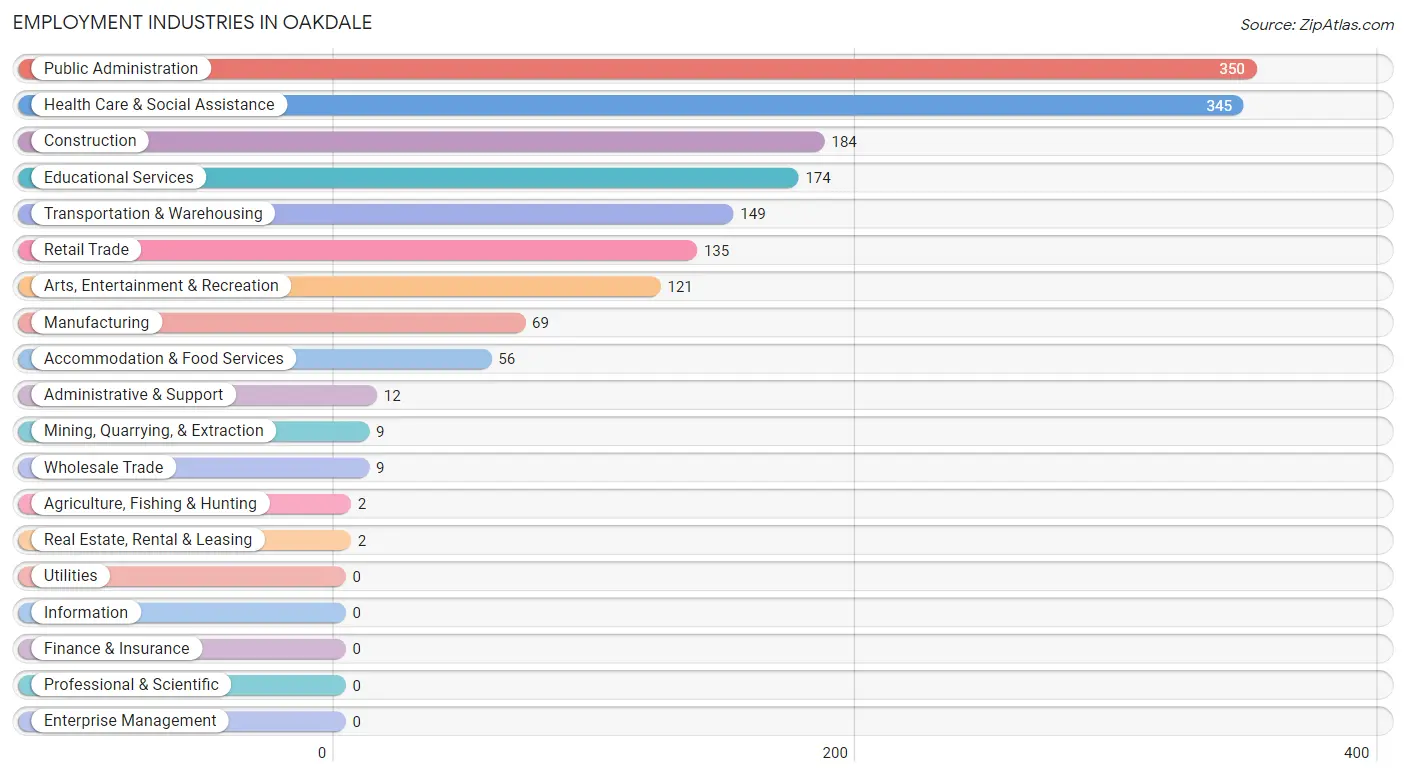
Employment Industries in Oakdale
The major employment industries in Oakdale include Public Administration (350 | 19.4%), Health Care & Social Assistance (345 | 19.1%), Construction (184 | 10.2%), Educational Services (174 | 9.7%), and Transportation & Warehousing (149 | 8.3%).
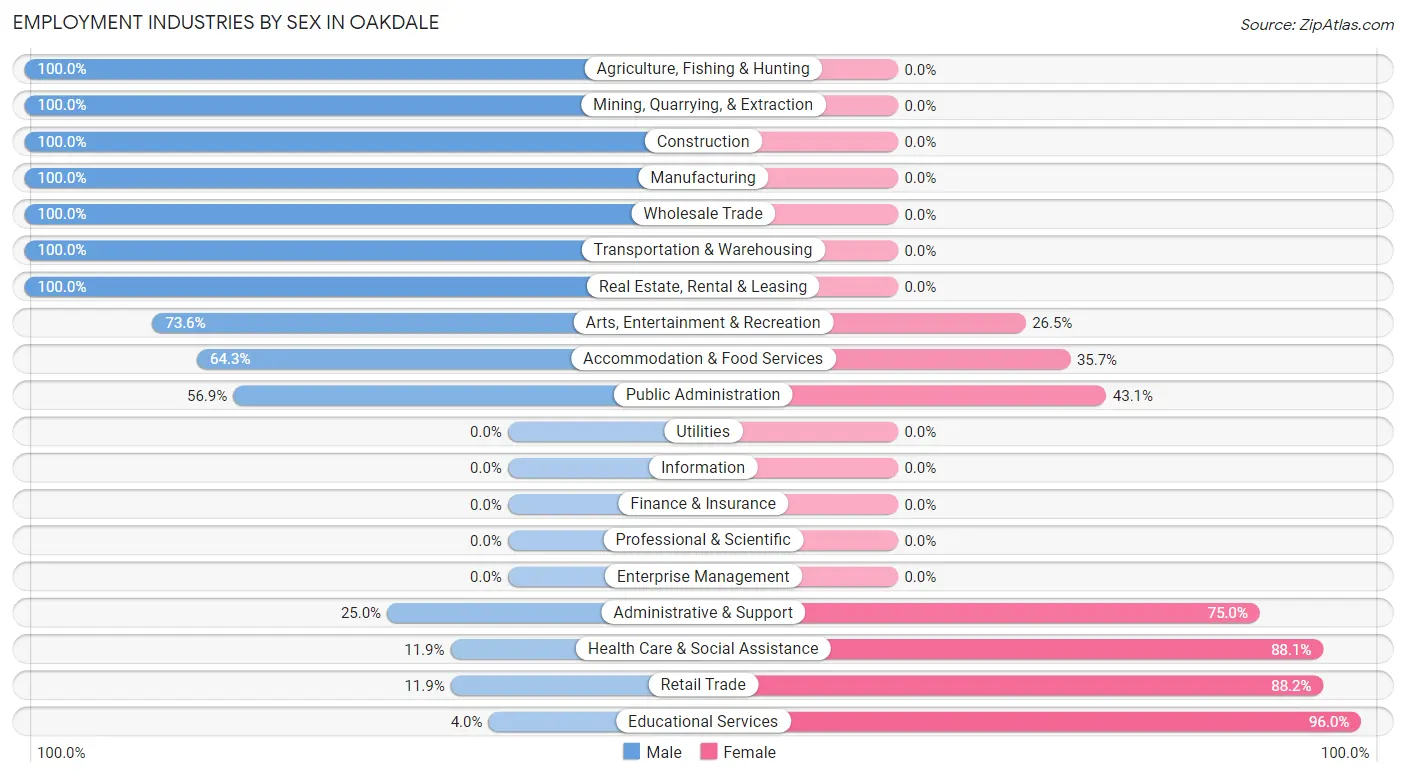
Employment Industries by Sex in Oakdale
The Oakdale industries that see more men than women are Agriculture, Fishing & Hunting (100.0%), Mining, Quarrying, & Extraction (100.0%), and Construction (100.0%), whereas the industries that tend to have a higher number of women are Educational Services (96.0%), Retail Trade (88.1%), and Health Care & Social Assistance (88.1%).
| Industry | Male | Female |
| Agriculture, Fishing & Hunting | 2 (100.0%) | 0 (0.0%) |
| Mining, Quarrying, & Extraction | 9 (100.0%) | 0 (0.0%) |
| Construction | 184 (100.0%) | 0 (0.0%) |
| Manufacturing | 69 (100.0%) | 0 (0.0%) |
| Wholesale Trade | 9 (100.0%) | 0 (0.0%) |
| Retail Trade | 16 (11.8%) | 119 (88.1%) |
| Transportation & Warehousing | 149 (100.0%) | 0 (0.0%) |
| Utilities | 0 (0.0%) | 0 (0.0%) |
| Information | 0 (0.0%) | 0 (0.0%) |
| Finance & Insurance | 0 (0.0%) | 0 (0.0%) |
| Real Estate, Rental & Leasing | 2 (100.0%) | 0 (0.0%) |
| Professional & Scientific | 0 (0.0%) | 0 (0.0%) |
| Enterprise Management | 0 (0.0%) | 0 (0.0%) |
| Administrative & Support | 3 (25.0%) | 9 (75.0%) |
| Educational Services | 7 (4.0%) | 167 (96.0%) |
| Health Care & Social Assistance | 41 (11.9%) | 304 (88.1%) |
| Arts, Entertainment & Recreation | 89 (73.6%) | 32 (26.5%) |
| Accommodation & Food Services | 36 (64.3%) | 20 (35.7%) |
| Public Administration | 199 (56.9%) | 151 (43.1%) |
| Total | 857 (47.5%) | 947 (52.5%) |
Education in Oakdale
School Enrollment in Oakdale
The most common levels of schooling among the 834 students in Oakdale are elementary school (286 | 34.3%), middle school (200 | 24.0%), and college / undergraduate (98 | 11.7%).
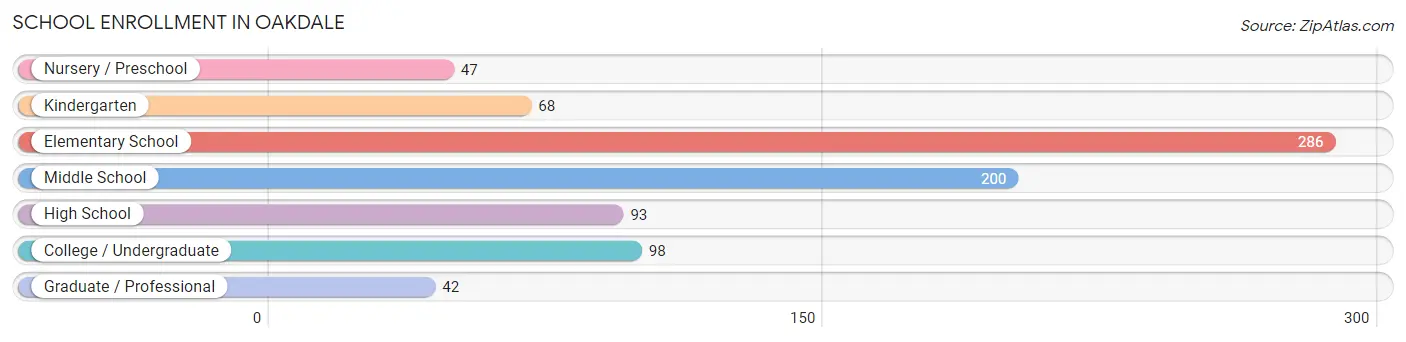
| School Level | # Students | % Students |
| Nursery / Preschool | 47 | 5.6% |
| Kindergarten | 68 | 8.2% |
| Elementary School | 286 | 34.3% |
| Middle School | 200 | 24.0% |
| High School | 93 | 11.2% |
| College / Undergraduate | 98 | 11.7% |
| Graduate / Professional | 42 | 5.0% |
| Total | 834 | 100.0% |
School Enrollment by Age by Funding Source in Oakdale
Out of a total of 834 students who are enrolled in schools in Oakdale, 50 (6.0%) attend a private institution, while the remaining 784 (94.0%) are enrolled in public schools. The age group of 35 years and over has the highest likelihood of being enrolled in private schools, with 36 (34.0% in the age bracket) enrolled. Conversely, the age group of 3 to 4 year olds has the lowest likelihood of being enrolled in a private school, with 14 (100.0% in the age bracket) attending a public institution.
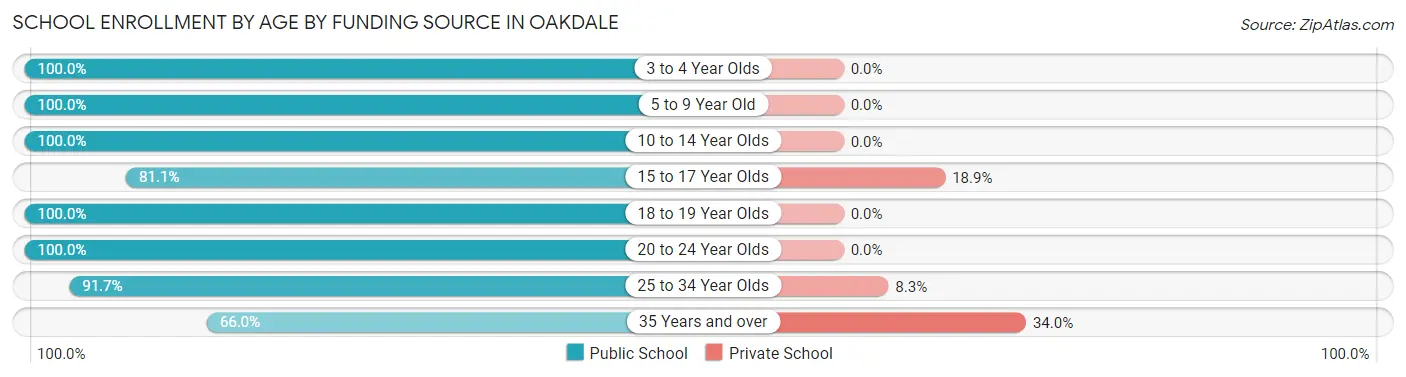
| Age Bracket | Public School | Private School |
| 3 to 4 Year Olds | 14 (100.0%) | 0 (0.0%) |
| 5 to 9 Year Old | 310 (100.0%) | 0 (0.0%) |
| 10 to 14 Year Olds | 260 (100.0%) | 0 (0.0%) |
| 15 to 17 Year Olds | 30 (81.1%) | 7 (18.9%) |
| 18 to 19 Year Olds | 17 (100.0%) | 0 (0.0%) |
| 20 to 24 Year Olds | 6 (100.0%) | 0 (0.0%) |
| 25 to 34 Year Olds | 77 (91.7%) | 7 (8.3%) |
| 35 Years and over | 70 (66.0%) | 36 (34.0%) |
| Total | 784 (94.0%) | 50 (6.0%) |
Educational Attainment by Field of Study in Oakdale
Business (113 | 20.2%), bio, nature & agricultural (110 | 19.6%), liberal arts & history (88 | 15.7%), communications (67 | 12.0%), and psychology (50 | 8.9%) are the most common fields of study among 560 individuals in Oakdale who have obtained a bachelor's degree or higher.
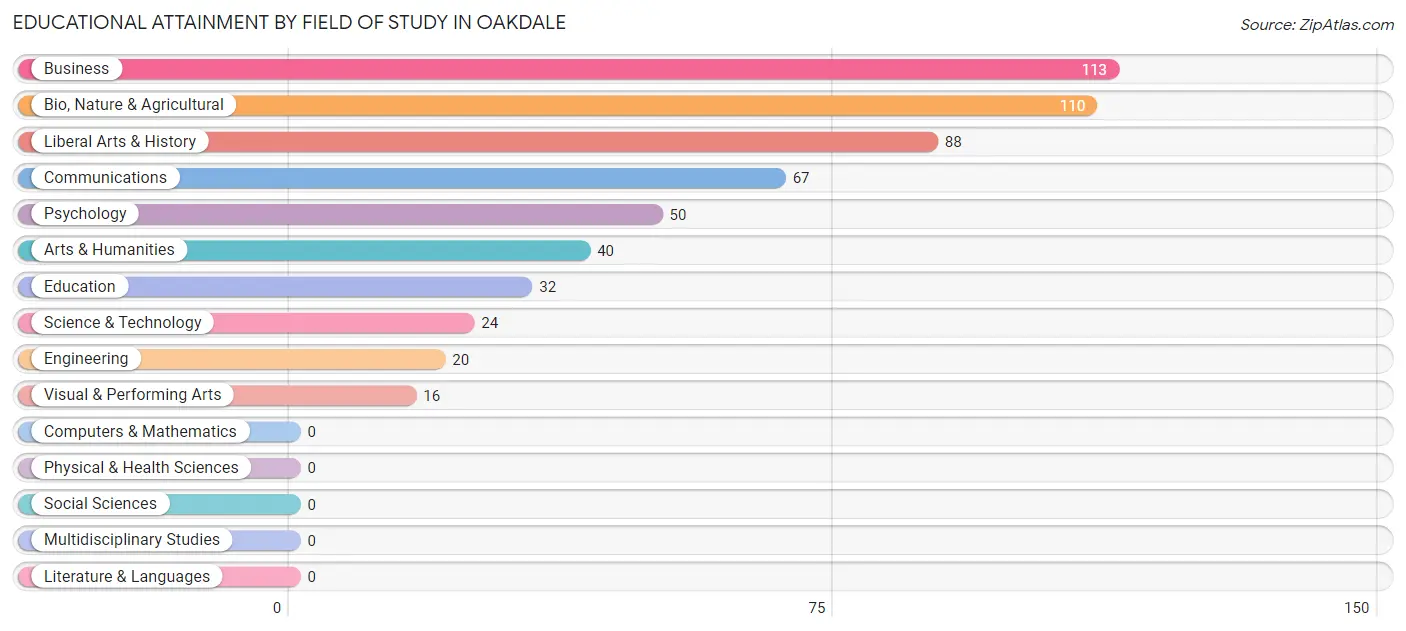
| Field of Study | # Graduates | % Graduates |
| Computers & Mathematics | 0 | 0.0% |
| Bio, Nature & Agricultural | 110 | 19.6% |
| Physical & Health Sciences | 0 | 0.0% |
| Psychology | 50 | 8.9% |
| Social Sciences | 0 | 0.0% |
| Engineering | 20 | 3.6% |
| Multidisciplinary Studies | 0 | 0.0% |
| Science & Technology | 24 | 4.3% |
| Business | 113 | 20.2% |
| Education | 32 | 5.7% |
| Literature & Languages | 0 | 0.0% |
| Liberal Arts & History | 88 | 15.7% |
| Visual & Performing Arts | 16 | 2.9% |
| Communications | 67 | 12.0% |
| Arts & Humanities | 40 | 7.1% |
| Total | 560 | 100.0% |
Transportation & Commute in Oakdale
Vehicle Availability by Sex in Oakdale
The most prevalent vehicle ownership categories in Oakdale are males with 2 vehicles (425, accounting for 49.6%) and females with 2 vehicles (584, making up 46.3%).
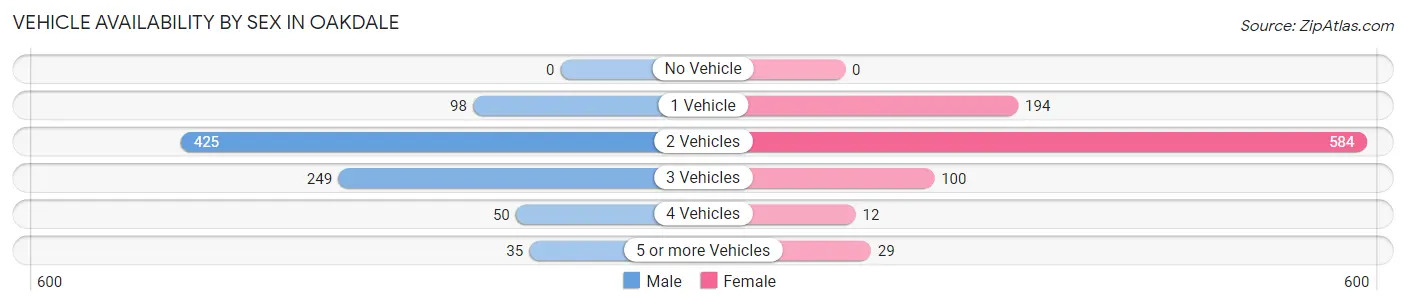
| Vehicles Available | Male | Female |
| No Vehicle | 0 (0.0%) | 0 (0.0%) |
| 1 Vehicle | 98 (11.4%) | 194 (21.1%) |
| 2 Vehicles | 425 (49.6%) | 584 (63.5%) |
| 3 Vehicles | 249 (29.0%) | 100 (10.9%) |
| 4 Vehicles | 50 (5.8%) | 12 (1.3%) |
| 5 or more Vehicles | 35 (4.1%) | 29 (3.2%) |
| Total | 857 (100.0%) | 919 (100.0%) |
Commute Time in Oakdale
The most frequently occuring commute durations in Oakdale are 5 to 9 minutes (232 commuters, 14.3%), 10 to 14 minutes (201 commuters, 12.4%), and 60 to 89 minutes (199 commuters, 12.3%).
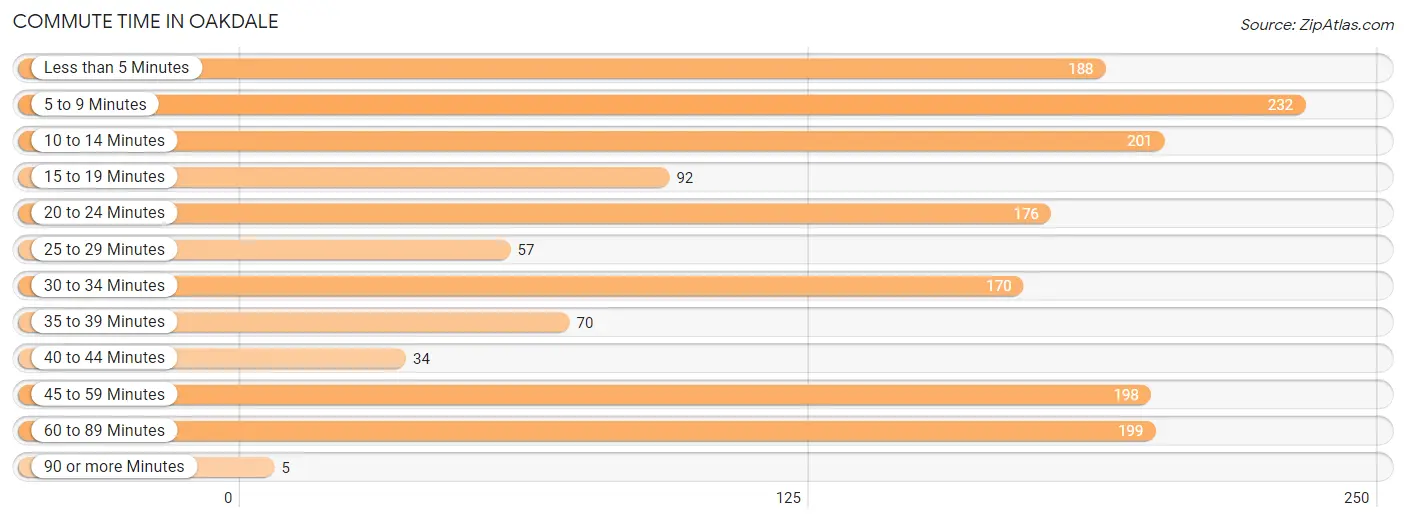
| Commute Time | # Commuters | % Commuters |
| Less than 5 Minutes | 188 | 11.6% |
| 5 to 9 Minutes | 232 | 14.3% |
| 10 to 14 Minutes | 201 | 12.4% |
| 15 to 19 Minutes | 92 | 5.7% |
| 20 to 24 Minutes | 176 | 10.8% |
| 25 to 29 Minutes | 57 | 3.5% |
| 30 to 34 Minutes | 170 | 10.5% |
| 35 to 39 Minutes | 70 | 4.3% |
| 40 to 44 Minutes | 34 | 2.1% |
| 45 to 59 Minutes | 198 | 12.2% |
| 60 to 89 Minutes | 199 | 12.3% |
| 90 or more Minutes | 5 | 0.3% |
Commute Time by Sex in Oakdale
The most common commute times in Oakdale are less than 5 minutes (159 commuters, 19.6%) for males and 45 to 59 minutes (197 commuters, 24.3%) for females.
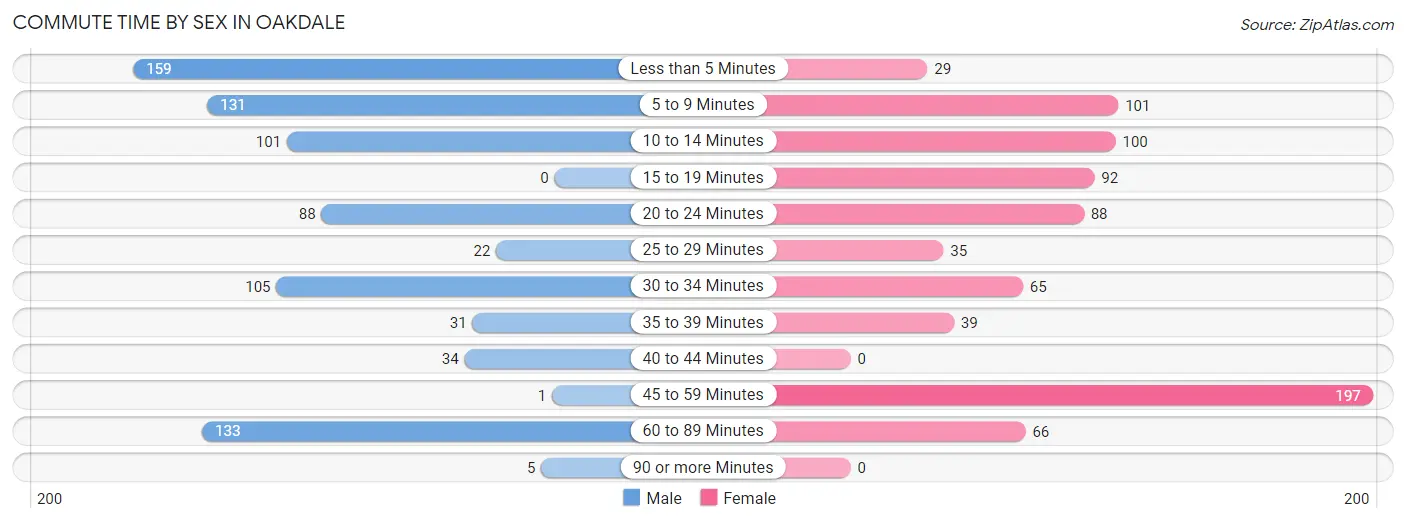
| Commute Time | Male | Female |
| Less than 5 Minutes | 159 (19.6%) | 29 (3.6%) |
| 5 to 9 Minutes | 131 (16.2%) | 101 (12.4%) |
| 10 to 14 Minutes | 101 (12.5%) | 100 (12.3%) |
| 15 to 19 Minutes | 0 (0.0%) | 92 (11.3%) |
| 20 to 24 Minutes | 88 (10.9%) | 88 (10.8%) |
| 25 to 29 Minutes | 22 (2.7%) | 35 (4.3%) |
| 30 to 34 Minutes | 105 (13.0%) | 65 (8.0%) |
| 35 to 39 Minutes | 31 (3.8%) | 39 (4.8%) |
| 40 to 44 Minutes | 34 (4.2%) | 0 (0.0%) |
| 45 to 59 Minutes | 1 (0.1%) | 197 (24.3%) |
| 60 to 89 Minutes | 133 (16.4%) | 66 (8.1%) |
| 90 or more Minutes | 5 (0.6%) | 0 (0.0%) |
Time of Departure to Work by Sex in Oakdale
The most frequent times of departure to work in Oakdale are 6:00 AM to 6:29 AM (201, 24.8%) for males and 7:30 AM to 7:59 AM (187, 23.0%) for females.
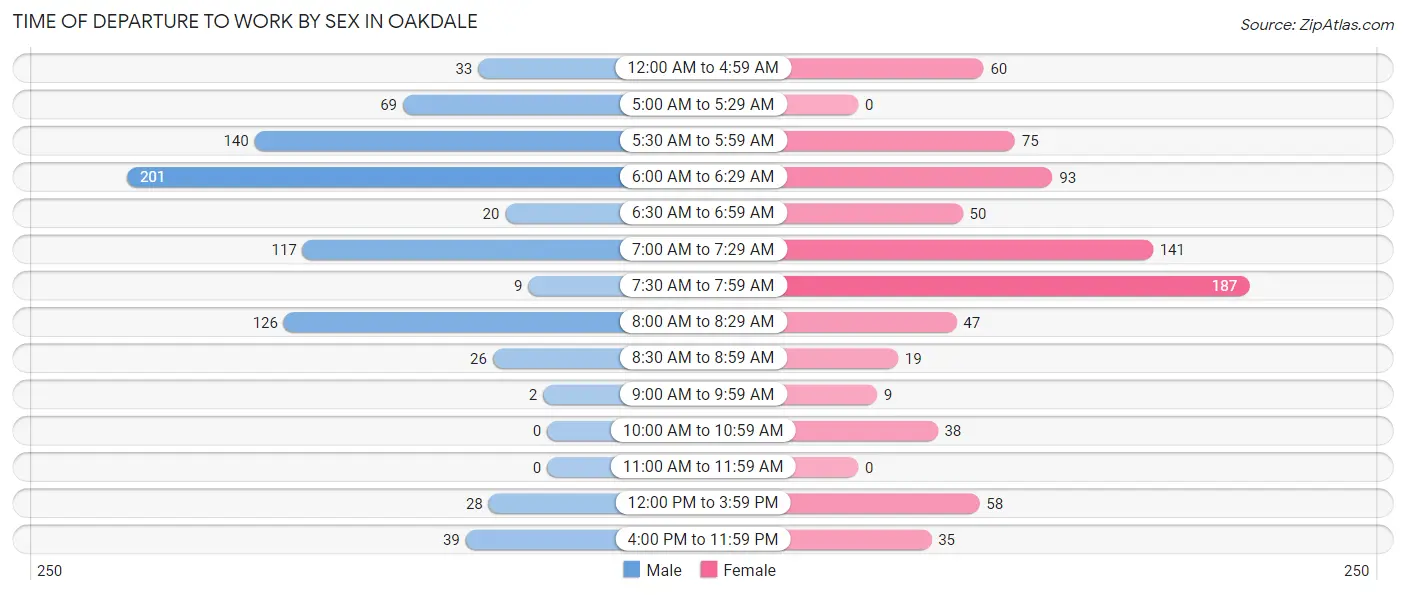
| Time of Departure | Male | Female |
| 12:00 AM to 4:59 AM | 33 (4.1%) | 60 (7.4%) |
| 5:00 AM to 5:29 AM | 69 (8.5%) | 0 (0.0%) |
| 5:30 AM to 5:59 AM | 140 (17.3%) | 75 (9.2%) |
| 6:00 AM to 6:29 AM | 201 (24.8%) | 93 (11.5%) |
| 6:30 AM to 6:59 AM | 20 (2.5%) | 50 (6.2%) |
| 7:00 AM to 7:29 AM | 117 (14.4%) | 141 (17.4%) |
| 7:30 AM to 7:59 AM | 9 (1.1%) | 187 (23.0%) |
| 8:00 AM to 8:29 AM | 126 (15.6%) | 47 (5.8%) |
| 8:30 AM to 8:59 AM | 26 (3.2%) | 19 (2.3%) |
| 9:00 AM to 9:59 AM | 2 (0.3%) | 9 (1.1%) |
| 10:00 AM to 10:59 AM | 0 (0.0%) | 38 (4.7%) |
| 11:00 AM to 11:59 AM | 0 (0.0%) | 0 (0.0%) |
| 12:00 PM to 3:59 PM | 28 (3.5%) | 58 (7.1%) |
| 4:00 PM to 11:59 PM | 39 (4.8%) | 35 (4.3%) |
| Total | 810 (100.0%) | 812 (100.0%) |
Housing Occupancy in Oakdale
Occupancy by Ownership in Oakdale
Of the total 1,908 dwellings in Oakdale, owner-occupied units account for 1,301 (68.2%), while renter-occupied units make up 607 (31.8%).
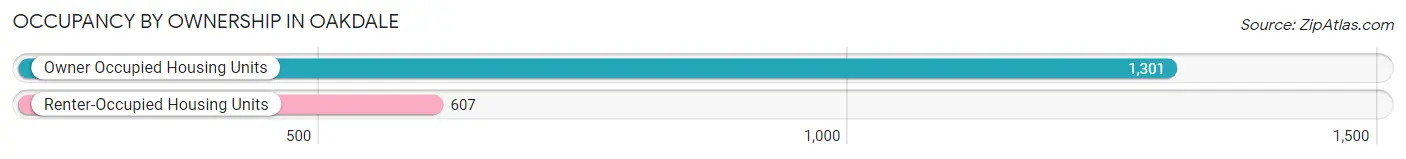
| Occupancy | # Housing Units | % Housing Units |
| Owner Occupied Housing Units | 1,301 | 68.2% |
| Renter-Occupied Housing Units | 607 | 31.8% |
| Total Occupied Housing Units | 1,908 | 100.0% |
Occupancy by Household Size in Oakdale
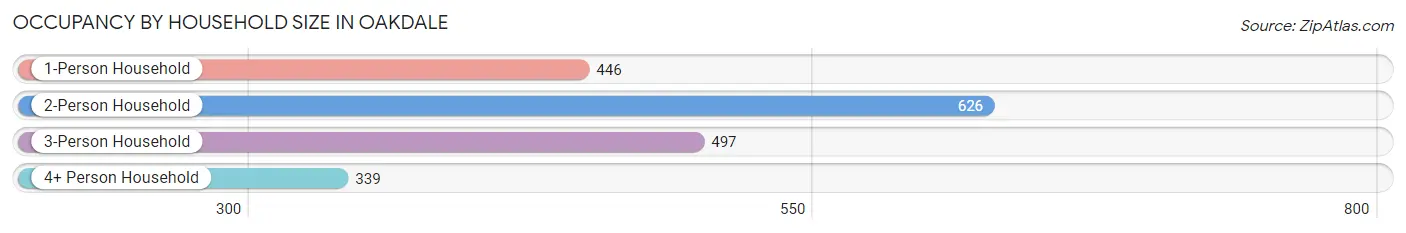
| Household Size | # Housing Units | % Housing Units |
| 1-Person Household | 446 | 23.4% |
| 2-Person Household | 626 | 32.8% |
| 3-Person Household | 497 | 26.1% |
| 4+ Person Household | 339 | 17.8% |
| Total Housing Units | 1,908 | 100.0% |
Occupancy by Ownership by Household Size in Oakdale
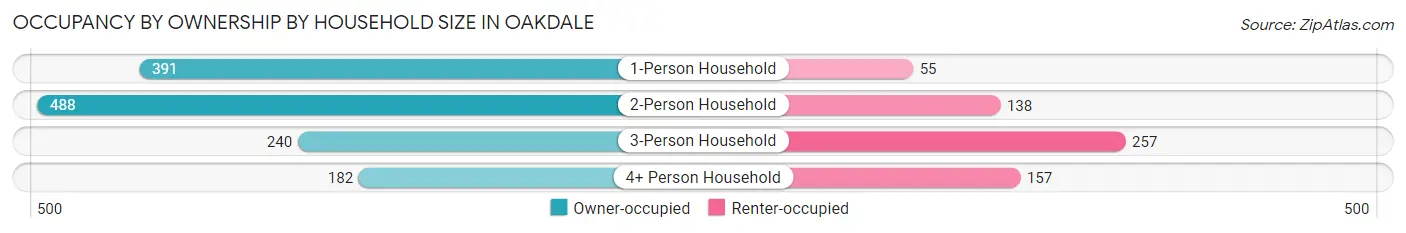
| Household Size | Owner-occupied | Renter-occupied |
| 1-Person Household | 391 (87.7%) | 55 (12.3%) |
| 2-Person Household | 488 (78.0%) | 138 (22.0%) |
| 3-Person Household | 240 (48.3%) | 257 (51.7%) |
| 4+ Person Household | 182 (53.7%) | 157 (46.3%) |
| Total Housing Units | 1,301 (68.2%) | 607 (31.8%) |
Occupancy by Educational Attainment in Oakdale
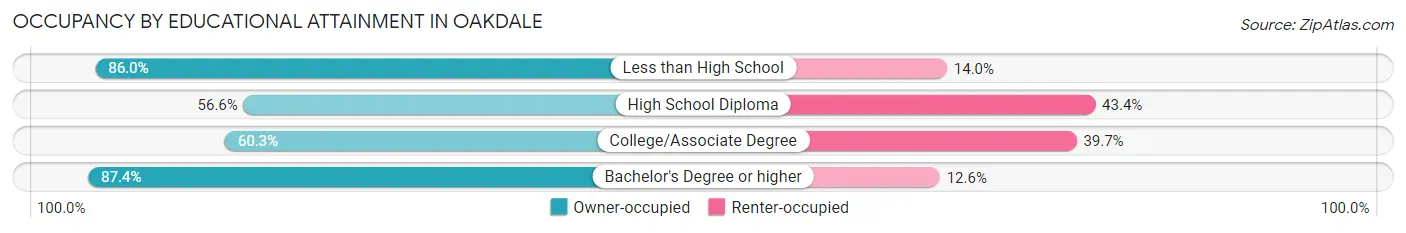
| Household Size | Owner-occupied | Renter-occupied |
| Less than High School | 374 (86.0%) | 61 (14.0%) |
| High School Diploma | 456 (56.6%) | 350 (43.4%) |
| College/Associate Degree | 249 (60.3%) | 164 (39.7%) |
| Bachelor's Degree or higher | 222 (87.4%) | 32 (12.6%) |
Occupancy by Age of Householder in Oakdale
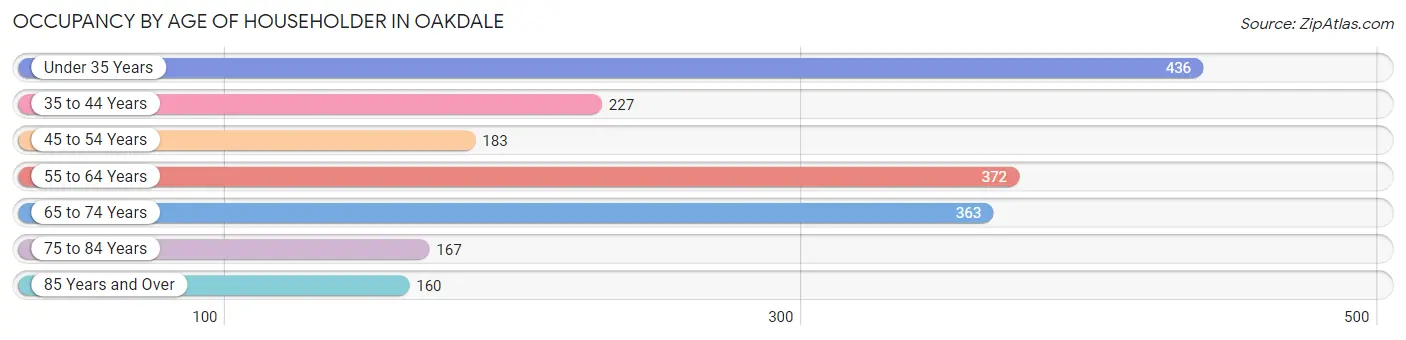
| Age Bracket | # Households | % Households |
| Under 35 Years | 436 | 22.9% |
| 35 to 44 Years | 227 | 11.9% |
| 45 to 54 Years | 183 | 9.6% |
| 55 to 64 Years | 372 | 19.5% |
| 65 to 74 Years | 363 | 19.0% |
| 75 to 84 Years | 167 | 8.7% |
| 85 Years and Over | 160 | 8.4% |
| Total | 1,908 | 100.0% |
Housing Finances in Oakdale
Median Income by Occupancy in Oakdale
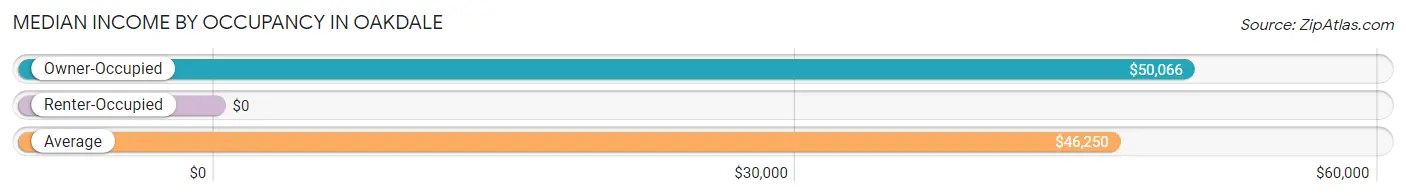
| Occupancy Type | # Households | Median Income |
| Owner-Occupied | 1,301 (68.2%) | $50,066 |
| Renter-Occupied | 607 (31.8%) | $0 |
| Average | 1,908 (100.0%) | $46,250 |
Occupancy by Householder Income Bracket in Oakdale
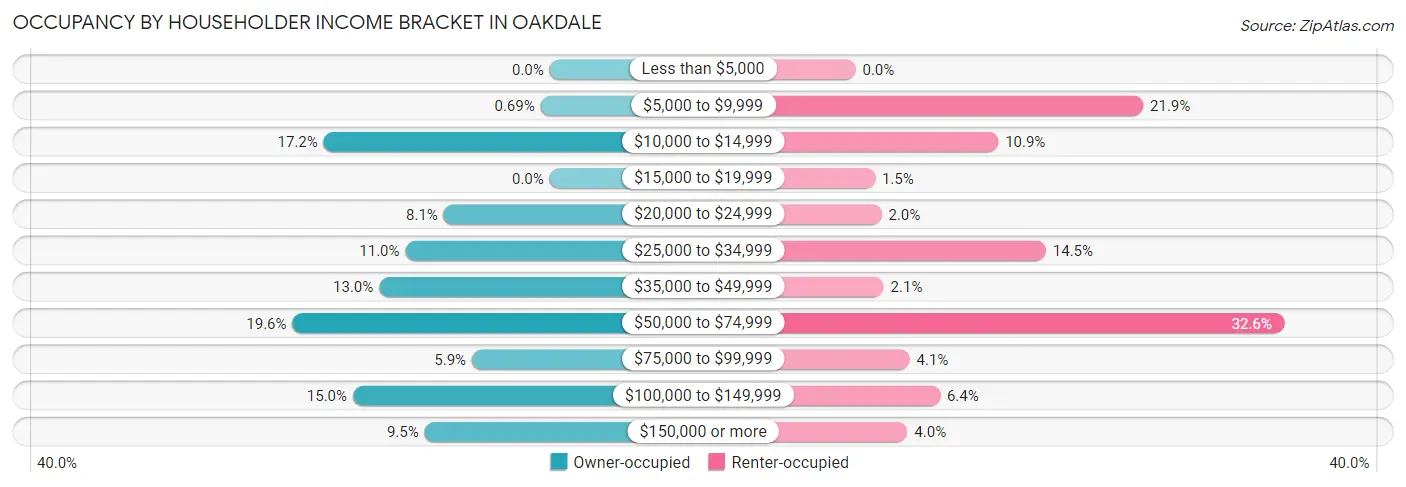
| Income Bracket | Owner-occupied | Renter-occupied |
| Less than $5,000 | 0 (0.0%) | 0 (0.0%) |
| $5,000 to $9,999 | 9 (0.7%) | 133 (21.9%) |
| $10,000 to $14,999 | 224 (17.2%) | 66 (10.9%) |
| $15,000 to $19,999 | 0 (0.0%) | 9 (1.5%) |
| $20,000 to $24,999 | 105 (8.1%) | 12 (2.0%) |
| $25,000 to $34,999 | 143 (11.0%) | 88 (14.5%) |
| $35,000 to $49,999 | 169 (13.0%) | 13 (2.1%) |
| $50,000 to $74,999 | 255 (19.6%) | 198 (32.6%) |
| $75,000 to $99,999 | 77 (5.9%) | 25 (4.1%) |
| $100,000 to $149,999 | 195 (15.0%) | 39 (6.4%) |
| $150,000 or more | 124 (9.5%) | 24 (4.0%) |
| Total | 1,301 (100.0%) | 607 (100.0%) |
Monthly Housing Cost Tiers in Oakdale
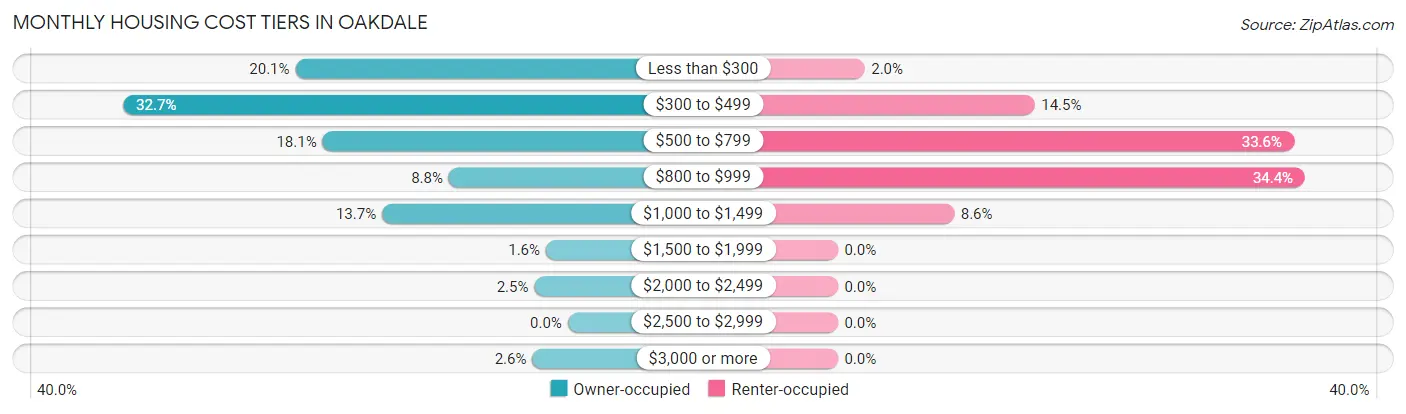
| Monthly Cost | Owner-occupied | Renter-occupied |
| Less than $300 | 261 (20.1%) | 12 (2.0%) |
| $300 to $499 | 426 (32.7%) | 88 (14.5%) |
| $500 to $799 | 235 (18.1%) | 204 (33.6%) |
| $800 to $999 | 114 (8.8%) | 209 (34.4%) |
| $1,000 to $1,499 | 178 (13.7%) | 52 (8.6%) |
| $1,500 to $1,999 | 21 (1.6%) | 0 (0.0%) |
| $2,000 to $2,499 | 32 (2.5%) | 0 (0.0%) |
| $2,500 to $2,999 | 0 (0.0%) | 0 (0.0%) |
| $3,000 or more | 34 (2.6%) | 0 (0.0%) |
| Total | 1,301 (100.0%) | 607 (100.0%) |
Physical Housing Characteristics in Oakdale
Housing Structures in Oakdale
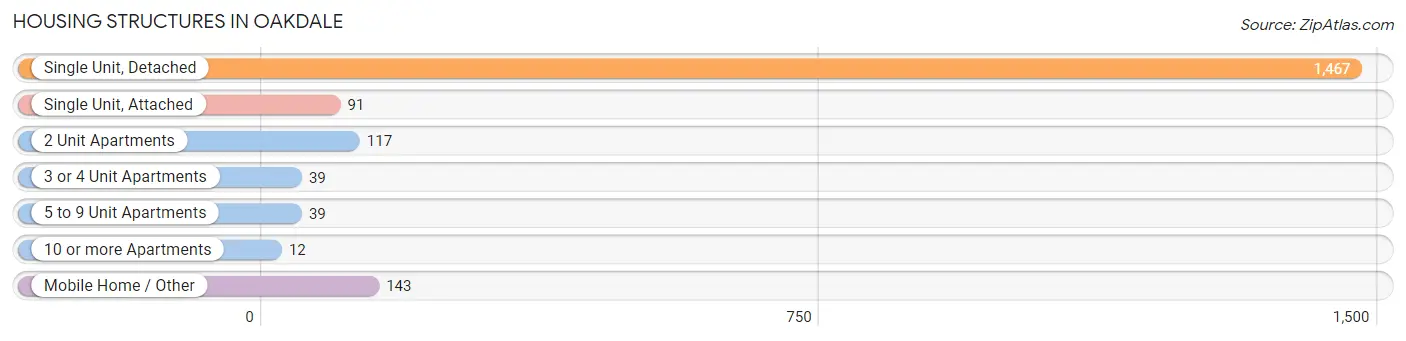
| Structure Type | # Housing Units | % Housing Units |
| Single Unit, Detached | 1,467 | 76.9% |
| Single Unit, Attached | 91 | 4.8% |
| 2 Unit Apartments | 117 | 6.1% |
| 3 or 4 Unit Apartments | 39 | 2.0% |
| 5 to 9 Unit Apartments | 39 | 2.0% |
| 10 or more Apartments | 12 | 0.6% |
| Mobile Home / Other | 143 | 7.5% |
| Total | 1,908 | 100.0% |
Housing Structures by Occupancy in Oakdale
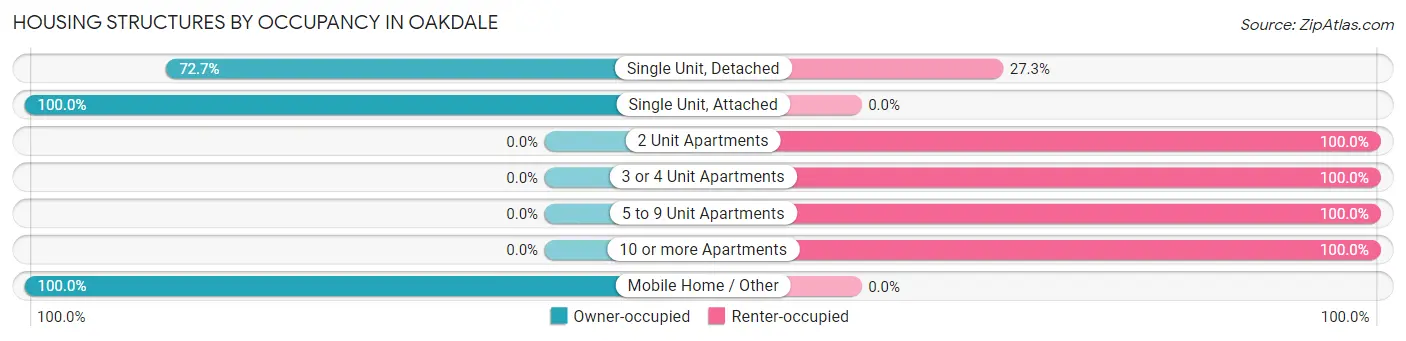
| Structure Type | Owner-occupied | Renter-occupied |
| Single Unit, Detached | 1,067 (72.7%) | 400 (27.3%) |
| Single Unit, Attached | 91 (100.0%) | 0 (0.0%) |
| 2 Unit Apartments | 0 (0.0%) | 117 (100.0%) |
| 3 or 4 Unit Apartments | 0 (0.0%) | 39 (100.0%) |
| 5 to 9 Unit Apartments | 0 (0.0%) | 39 (100.0%) |
| 10 or more Apartments | 0 (0.0%) | 12 (100.0%) |
| Mobile Home / Other | 143 (100.0%) | 0 (0.0%) |
| Total | 1,301 (68.2%) | 607 (31.8%) |
Housing Structures by Number of Rooms in Oakdale
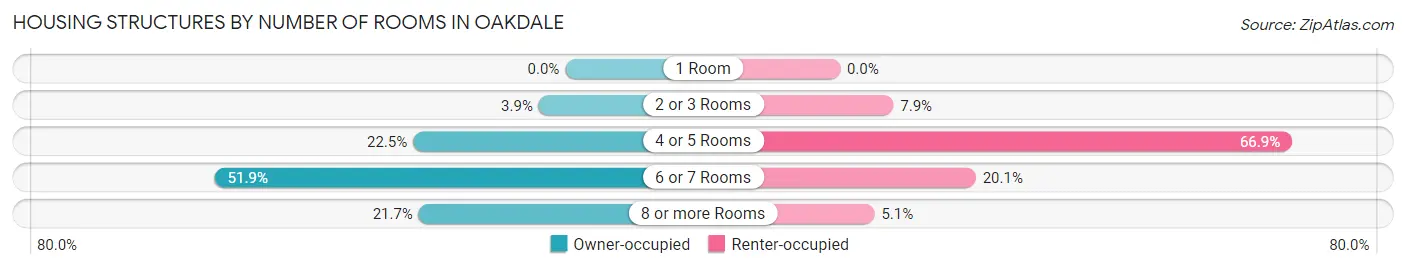
| Number of Rooms | Owner-occupied | Renter-occupied |
| 1 Room | 0 (0.0%) | 0 (0.0%) |
| 2 or 3 Rooms | 51 (3.9%) | 48 (7.9%) |
| 4 or 5 Rooms | 293 (22.5%) | 406 (66.9%) |
| 6 or 7 Rooms | 675 (51.9%) | 122 (20.1%) |
| 8 or more Rooms | 282 (21.7%) | 31 (5.1%) |
| Total | 1,301 (100.0%) | 607 (100.0%) |
Housing Structure by Heating Type in Oakdale
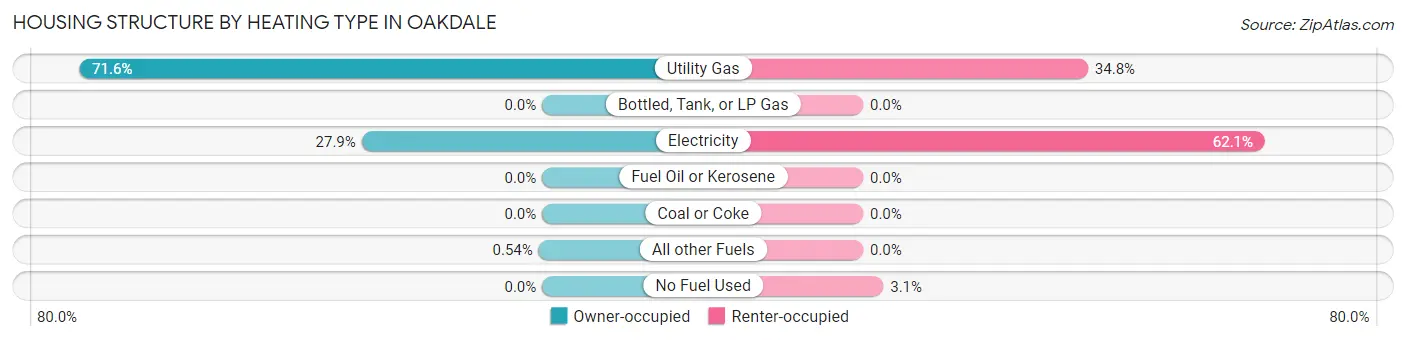
| Heating Type | Owner-occupied | Renter-occupied |
| Utility Gas | 931 (71.6%) | 211 (34.8%) |
| Bottled, Tank, or LP Gas | 0 (0.0%) | 0 (0.0%) |
| Electricity | 363 (27.9%) | 377 (62.1%) |
| Fuel Oil or Kerosene | 0 (0.0%) | 0 (0.0%) |
| Coal or Coke | 0 (0.0%) | 0 (0.0%) |
| All other Fuels | 7 (0.5%) | 0 (0.0%) |
| No Fuel Used | 0 (0.0%) | 19 (3.1%) |
| Total | 1,301 (100.0%) | 607 (100.0%) |
Household Vehicle Usage in Oakdale
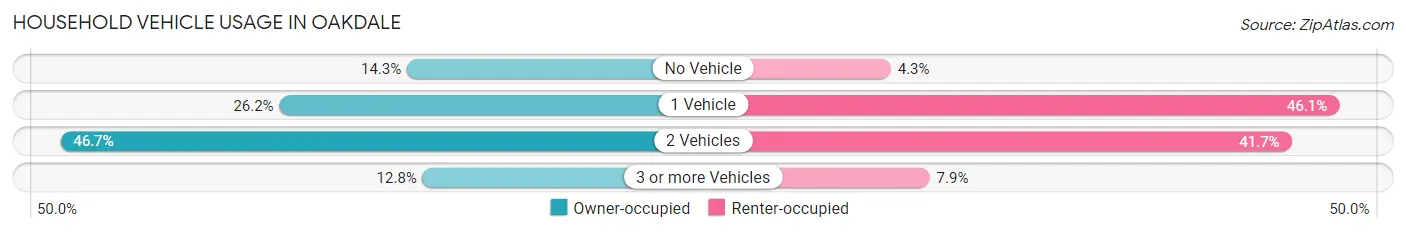
| Vehicles per Household | Owner-occupied | Renter-occupied |
| No Vehicle | 186 (14.3%) | 26 (4.3%) |
| 1 Vehicle | 341 (26.2%) | 280 (46.1%) |
| 2 Vehicles | 607 (46.7%) | 253 (41.7%) |
| 3 or more Vehicles | 167 (12.8%) | 48 (7.9%) |
| Total | 1,301 (100.0%) | 607 (100.0%) |
Real Estate & Mortgages in Oakdale
Real Estate and Mortgage Overview in Oakdale
| Characteristic | Without Mortgage | With Mortgage |
| Housing Units | 852 | 449 |
| Median Property Value | $81,900 | $120,500 |
| Median Household Income | $44,237 | $54 |
| Monthly Housing Costs | $372 | $21 |
| Real Estate Taxes | $199 | $30 |
Property Value by Mortgage Status in Oakdale
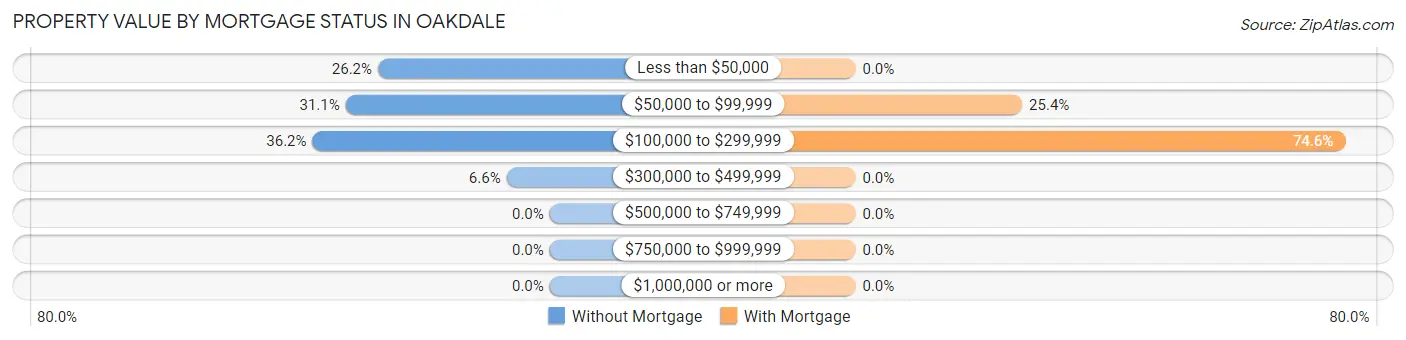
| Property Value | Without Mortgage | With Mortgage |
| Less than $50,000 | 223 (26.2%) | 0 (0.0%) |
| $50,000 to $99,999 | 265 (31.1%) | 114 (25.4%) |
| $100,000 to $299,999 | 308 (36.1%) | 335 (74.6%) |
| $300,000 to $499,999 | 56 (6.6%) | 0 (0.0%) |
| $500,000 to $749,999 | 0 (0.0%) | 0 (0.0%) |
| $750,000 to $999,999 | 0 (0.0%) | 0 (0.0%) |
| $1,000,000 or more | 0 (0.0%) | 0 (0.0%) |
| Total | 852 (100.0%) | 449 (100.0%) |
Household Income by Mortgage Status in Oakdale
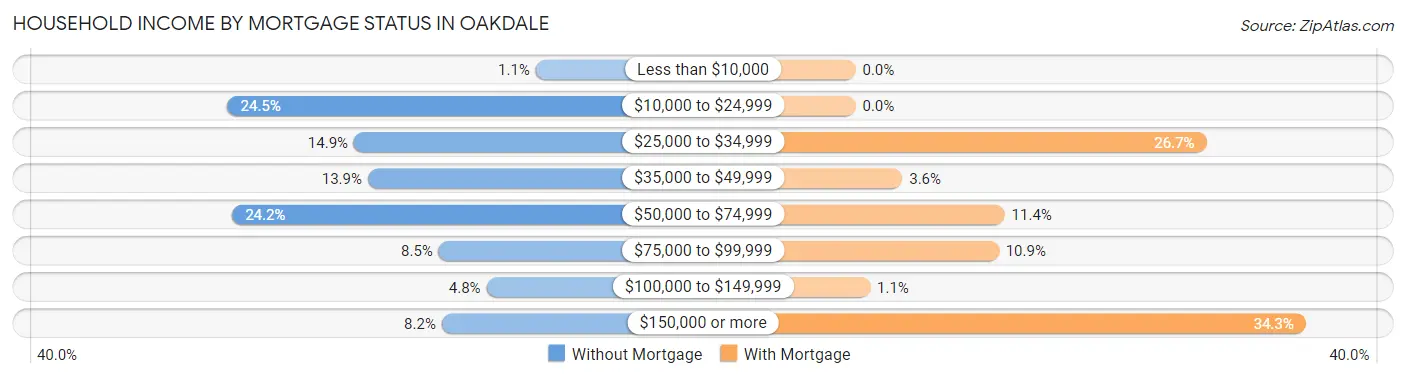
| Household Income | Without Mortgage | With Mortgage |
| Less than $10,000 | 9 (1.1%) | 0 (0.0%) |
| $10,000 to $24,999 | 209 (24.5%) | 0 (0.0%) |
| $25,000 to $34,999 | 127 (14.9%) | 120 (26.7%) |
| $35,000 to $49,999 | 118 (13.9%) | 16 (3.6%) |
| $50,000 to $74,999 | 206 (24.2%) | 51 (11.4%) |
| $75,000 to $99,999 | 72 (8.5%) | 49 (10.9%) |
| $100,000 to $149,999 | 41 (4.8%) | 5 (1.1%) |
| $150,000 or more | 70 (8.2%) | 154 (34.3%) |
| Total | 852 (100.0%) | 449 (100.0%) |
Property Value to Household Income Ratio in Oakdale
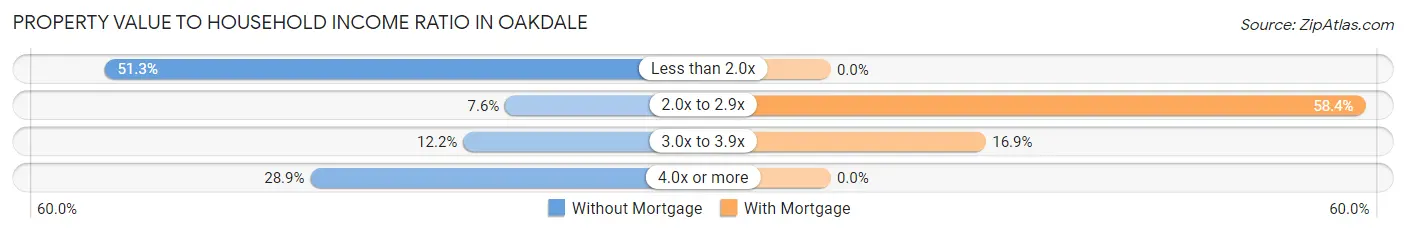
| Value-to-Income Ratio | Without Mortgage | With Mortgage |
| Less than 2.0x | 437 (51.3%) | 0 (0.0%) |
| 2.0x to 2.9x | 65 (7.6%) | 262 (58.4%) |
| 3.0x to 3.9x | 104 (12.2%) | 76 (16.9%) |
| 4.0x or more | 246 (28.9%) | 0 (0.0%) |
| Total | 852 (100.0%) | 449 (100.0%) |
Real Estate Taxes by Mortgage Status in Oakdale
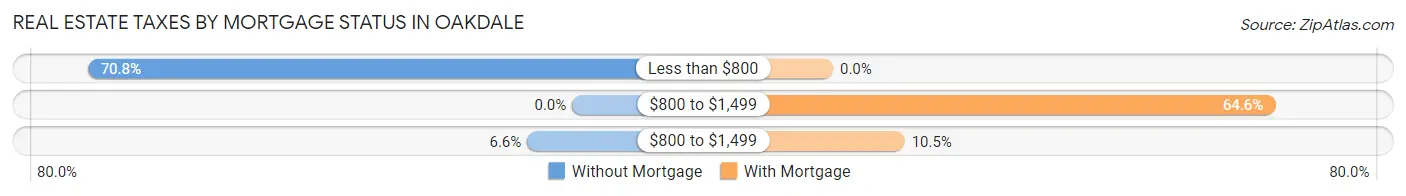
| Property Taxes | Without Mortgage | With Mortgage |
| Less than $800 | 603 (70.8%) | 0 (0.0%) |
| $800 to $1,499 | 0 (0.0%) | 290 (64.6%) |
| $800 to $1,499 | 56 (6.6%) | 47 (10.5%) |
| Total | 852 (100.0%) | 449 (100.0%) |
Health & Disability in Oakdale
Health Insurance Coverage by Age in Oakdale
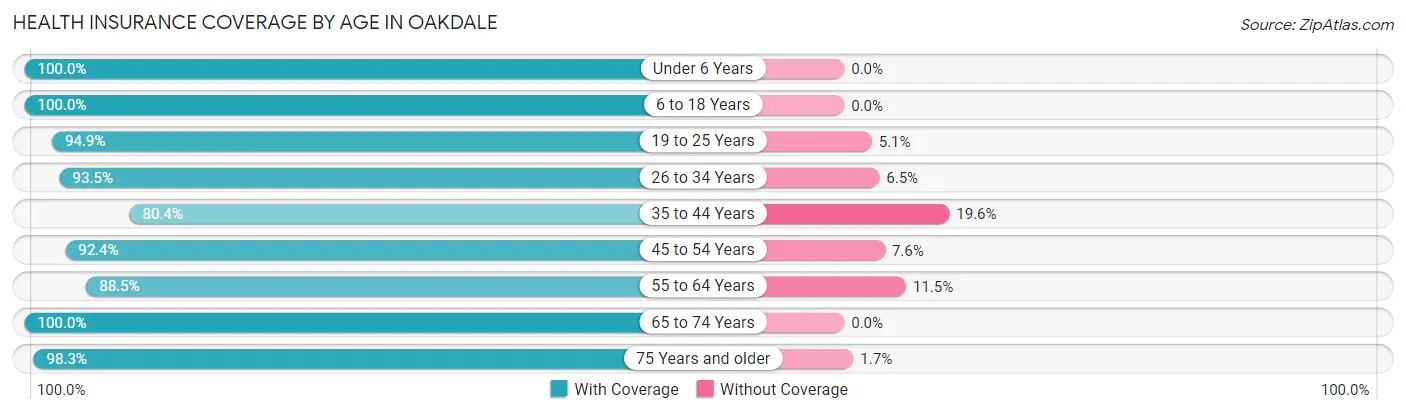
| Age Bracket | With Coverage | Without Coverage |
| Under 6 Years | 417 (100.0%) | 0 (0.0%) |
| 6 to 18 Years | 581 (100.0%) | 0 (0.0%) |
| 19 to 25 Years | 462 (94.9%) | 25 (5.1%) |
| 26 to 34 Years | 557 (93.5%) | 39 (6.5%) |
| 35 to 44 Years | 349 (80.4%) | 85 (19.6%) |
| 45 to 54 Years | 426 (92.4%) | 35 (7.6%) |
| 55 to 64 Years | 446 (88.5%) | 58 (11.5%) |
| 65 to 74 Years | 674 (100.0%) | 0 (0.0%) |
| 75 Years and older | 404 (98.3%) | 7 (1.7%) |
| Total | 4,316 (94.6%) | 249 (5.4%) |
Health Insurance Coverage by Citizenship Status in Oakdale
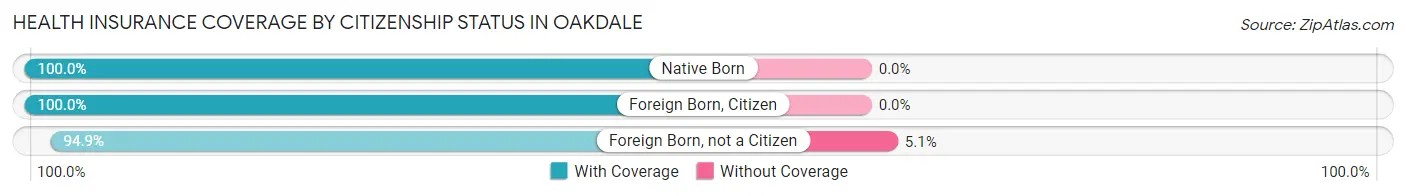
| Citizenship Status | With Coverage | Without Coverage |
| Native Born | 417 (100.0%) | 0 (0.0%) |
| Foreign Born, Citizen | 581 (100.0%) | 0 (0.0%) |
| Foreign Born, not a Citizen | 462 (94.9%) | 25 (5.1%) |
Health Insurance Coverage by Household Income in Oakdale
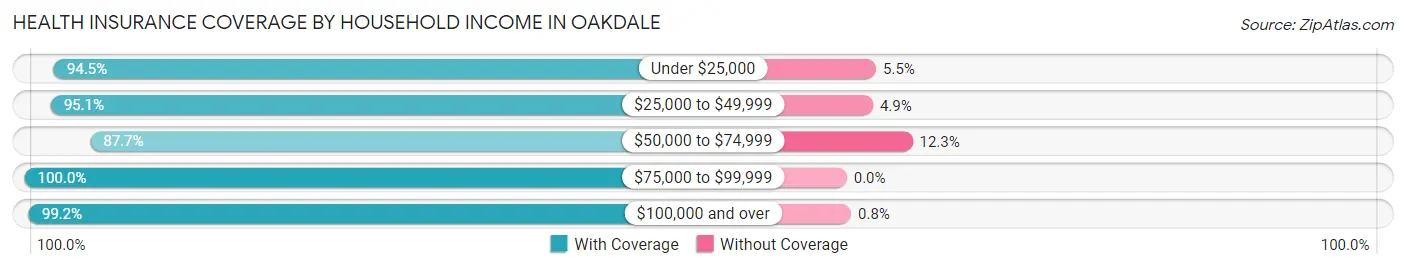
| Household Income | With Coverage | Without Coverage |
| Under $25,000 | 1,050 (94.5%) | 61 (5.5%) |
| $25,000 to $49,999 | 776 (95.1%) | 40 (4.9%) |
| $50,000 to $74,999 | 990 (87.7%) | 139 (12.3%) |
| $75,000 to $99,999 | 389 (100.0%) | 0 (0.0%) |
| $100,000 and over | 1,111 (99.2%) | 9 (0.8%) |
Public vs Private Health Insurance Coverage by Age in Oakdale
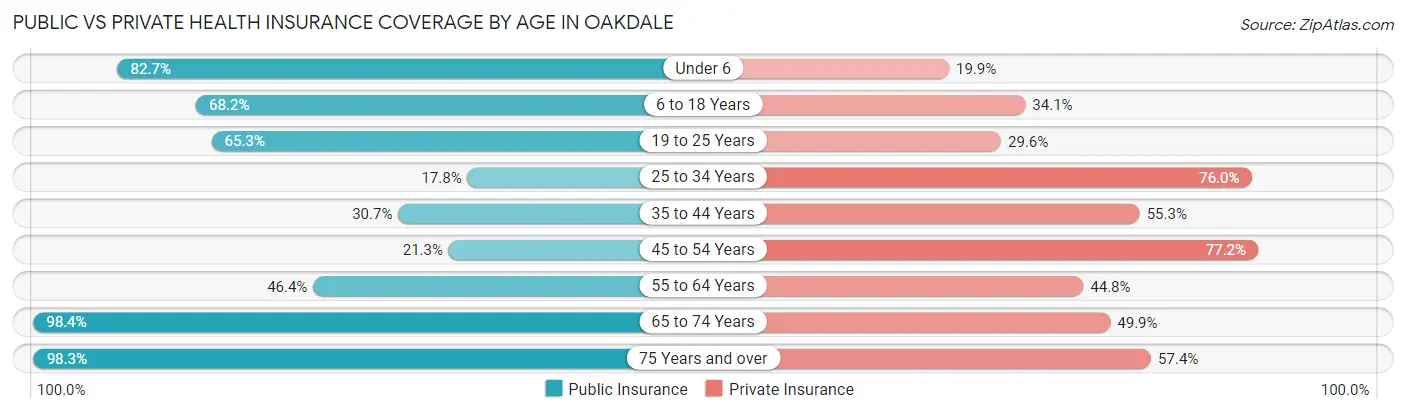
| Age Bracket | Public Insurance | Private Insurance |
| Under 6 | 345 (82.7%) | 83 (19.9%) |
| 6 to 18 Years | 396 (68.2%) | 198 (34.1%) |
| 19 to 25 Years | 318 (65.3%) | 144 (29.6%) |
| 25 to 34 Years | 106 (17.8%) | 453 (76.0%) |
| 35 to 44 Years | 133 (30.6%) | 240 (55.3%) |
| 45 to 54 Years | 98 (21.3%) | 356 (77.2%) |
| 55 to 64 Years | 234 (46.4%) | 226 (44.8%) |
| 65 to 74 Years | 663 (98.4%) | 336 (49.8%) |
| 75 Years and over | 404 (98.3%) | 236 (57.4%) |
| Total | 2,697 (59.1%) | 2,272 (49.8%) |
Disability Status by Sex by Age in Oakdale
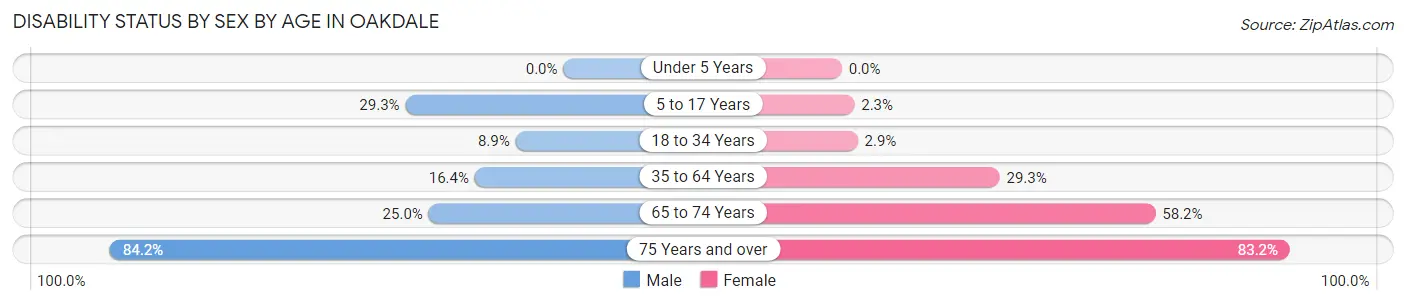
| Age Bracket | Male | Female |
| Under 5 Years | 0 (0.0%) | 0 (0.0%) |
| 5 to 17 Years | 107 (29.3%) | 8 (2.3%) |
| 18 to 34 Years | 40 (8.9%) | 19 (2.9%) |
| 35 to 64 Years | 107 (16.4%) | 219 (29.3%) |
| 65 to 74 Years | 74 (25.0%) | 220 (58.2%) |
| 75 Years and over | 186 (84.2%) | 158 (83.2%) |
Disability Class by Sex by Age in Oakdale
Disability Class: Hearing Difficulty
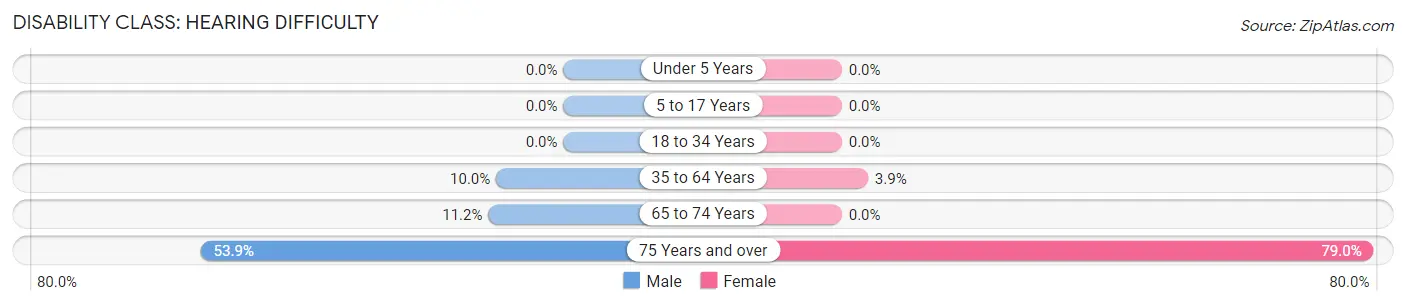
| Age Bracket | Male | Female |
| Under 5 Years | 0 (0.0%) | 0 (0.0%) |
| 5 to 17 Years | 0 (0.0%) | 0 (0.0%) |
| 18 to 34 Years | 0 (0.0%) | 0 (0.0%) |
| 35 to 64 Years | 65 (10.0%) | 29 (3.9%) |
| 65 to 74 Years | 33 (11.2%) | 0 (0.0%) |
| 75 Years and over | 119 (53.8%) | 150 (78.9%) |
Disability Class: Vision Difficulty
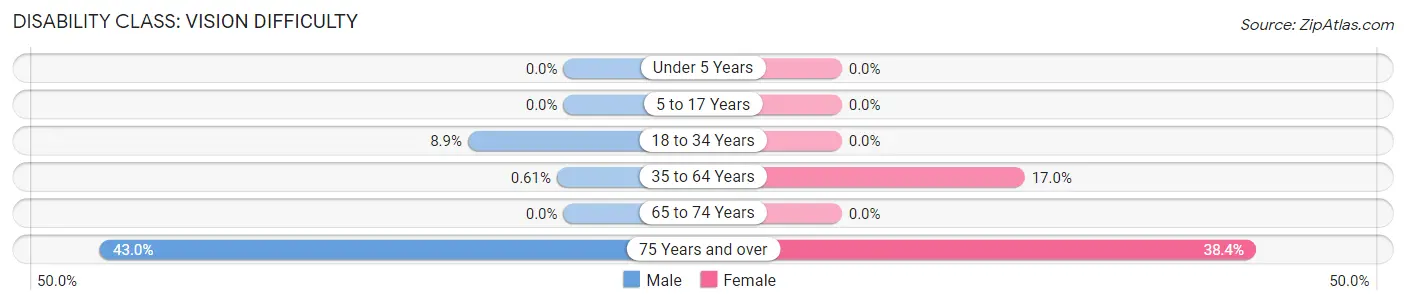
| Age Bracket | Male | Female |
| Under 5 Years | 0 (0.0%) | 0 (0.0%) |
| 5 to 17 Years | 0 (0.0%) | 0 (0.0%) |
| 18 to 34 Years | 40 (8.9%) | 0 (0.0%) |
| 35 to 64 Years | 4 (0.6%) | 127 (17.0%) |
| 65 to 74 Years | 0 (0.0%) | 0 (0.0%) |
| 75 Years and over | 95 (43.0%) | 73 (38.4%) |
Disability Class: Cognitive Difficulty
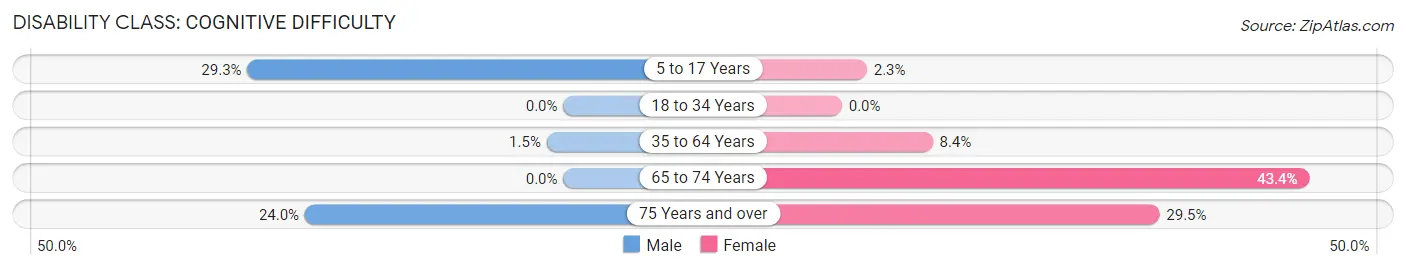
| Age Bracket | Male | Female |
| 5 to 17 Years | 107 (29.3%) | 8 (2.3%) |
| 18 to 34 Years | 0 (0.0%) | 0 (0.0%) |
| 35 to 64 Years | 10 (1.5%) | 63 (8.4%) |
| 65 to 74 Years | 0 (0.0%) | 164 (43.4%) |
| 75 Years and over | 53 (24.0%) | 56 (29.5%) |
Disability Class: Ambulatory Difficulty
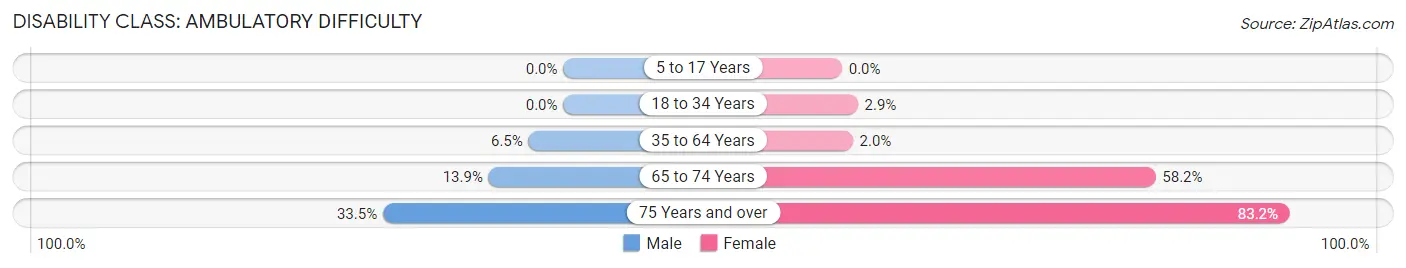
| Age Bracket | Male | Female |
| 5 to 17 Years | 0 (0.0%) | 0 (0.0%) |
| 18 to 34 Years | 0 (0.0%) | 19 (2.9%) |
| 35 to 64 Years | 42 (6.5%) | 15 (2.0%) |
| 65 to 74 Years | 41 (13.9%) | 220 (58.2%) |
| 75 Years and over | 74 (33.5%) | 158 (83.2%) |
Disability Class: Self-Care Difficulty
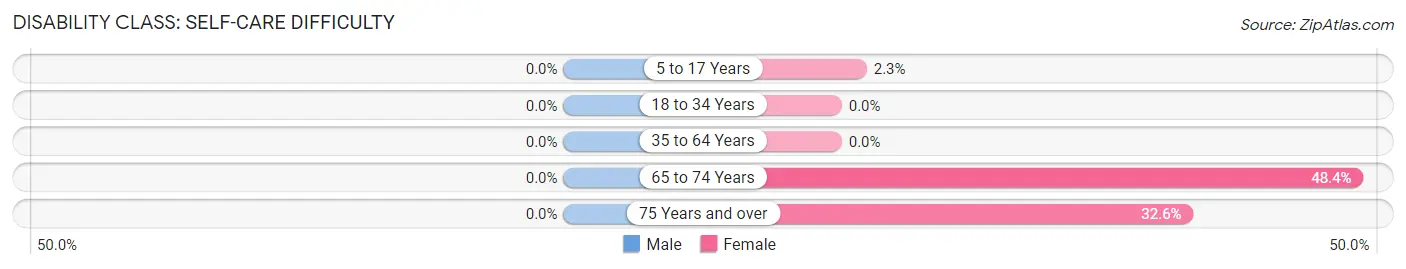
| Age Bracket | Male | Female |
| 5 to 17 Years | 0 (0.0%) | 8 (2.3%) |
| 18 to 34 Years | 0 (0.0%) | 0 (0.0%) |
| 35 to 64 Years | 0 (0.0%) | 0 (0.0%) |
| 65 to 74 Years | 0 (0.0%) | 183 (48.4%) |
| 75 Years and over | 0 (0.0%) | 62 (32.6%) |
Technology Access in Oakdale
Computing Device Access in Oakdale
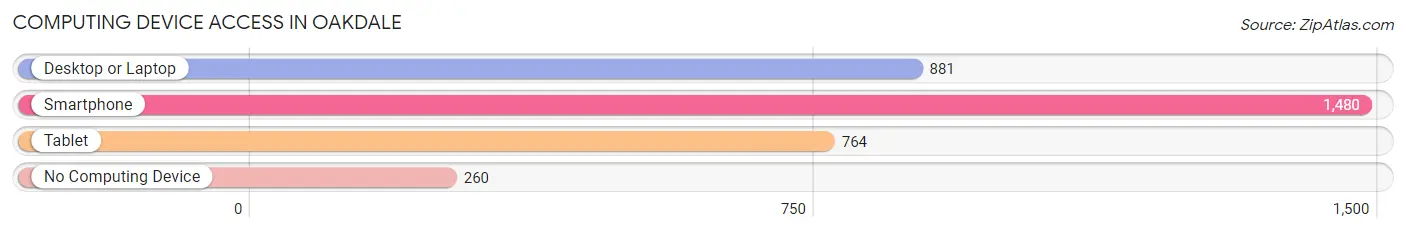
| Device Type | # Households | % Households |
| Desktop or Laptop | 881 | 46.2% |
| Smartphone | 1,480 | 77.6% |
| Tablet | 764 | 40.0% |
| No Computing Device | 260 | 13.6% |
| Total | 1,908 | 100.0% |
Internet Access in Oakdale
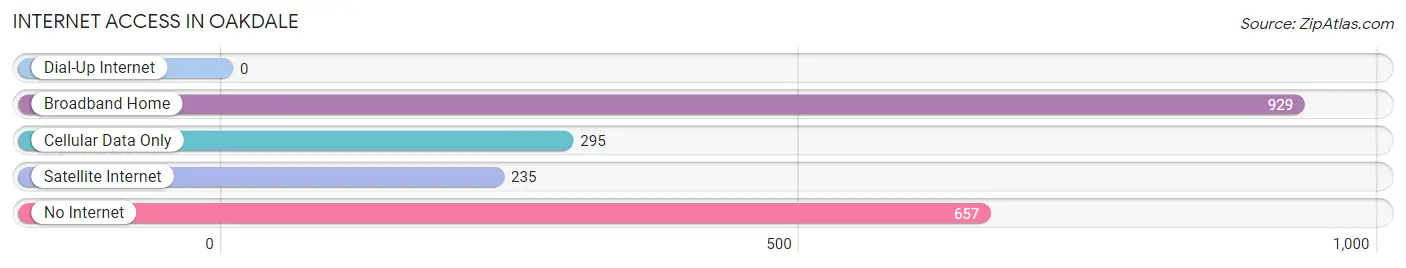
| Internet Type | # Households | % Households |
| Dial-Up Internet | 0 | 0.0% |
| Broadband Home | 929 | 48.7% |
| Cellular Data Only | 295 | 15.5% |
| Satellite Internet | 235 | 12.3% |
| No Internet | 657 | 34.4% |
| Total | 1,908 | 100.0% |
Oakdale Summary
Oakdale, Louisiana is a small city located in Allen Parish in the southwestern part of the state. It is situated on the banks of the Calcasieu River, about 30 miles east of Lake Charles. The city has a population of approximately 5,000 people and is the parish seat of Allen Parish.
Oakdale is a small city with a rich history. It was founded in 1883 by the Southern Pacific Railroad and was named after the nearby Oakdale Plantation. The city was incorporated in 1891 and has been the parish seat of Allen Parish since its inception. The city has a long history of timber and oil production, and it was once the largest producer of timber in the state.
Oakdale is located in the southwestern part of Louisiana, about 30 miles east of Lake Charles. The city is situated on the banks of the Calcasieu River, which is a major tributary of the Sabine River. The city is surrounded by a number of small towns and villages, including Kinder, Oberlin, and Reeves. The city is also close to the Sabine National Forest, which is a popular destination for outdoor recreation.
The economy of Oakdale is largely based on timber and oil production. The city is home to several timber mills and oil refineries, as well as a number of other businesses. The city is also home to a number of small businesses, including restaurants, retail stores, and service providers. The city is also home to a number of educational institutions, including a community college and a technical college.
The demographics of Oakdale are largely made up of white, African American, and Hispanic residents. The city has a median household income of $37,000, and the poverty rate is around 20%. The city has a high rate of unemployment, with around 10% of the population unemployed. The city also has a high rate of crime, with a crime rate that is higher than the national average.
Oakdale is a small city with a rich history and a diverse economy. The city is home to a number of businesses, educational institutions, and recreational opportunities. The city has a diverse population and a high rate of poverty and unemployment. Despite these challenges, the city is a vibrant and welcoming place to live and work.
Common Questions
What is Per Capita Income in Oakdale?
Per Capita income in Oakdale is $21,406.
What is the Median Family Income in Oakdale?
Median Family Income in Oakdale is $55,022.
What is the Median Household income in Oakdale?
Median Household Income in Oakdale is $46,250.
What is Income or Wage Gap in Oakdale?
Income or Wage Gap in Oakdale is 11.3%.
Women in Oakdale earn 88.7 cents for every dollar earned by a man.
What is Inequality or Gini Index in Oakdale?
Inequality or Gini Index in Oakdale is 0.51.
What is the Total Population of Oakdale?
Total Population of Oakdale is 6,701.
What is the Total Male Population of Oakdale?
Total Male Population of Oakdale is 4,211.
What is the Total Female Population of Oakdale?
Total Female Population of Oakdale is 2,490.
What is the Ratio of Males per 100 Females in Oakdale?
There are 169.12 Males per 100 Females in Oakdale.
What is the Ratio of Females per 100 Males in Oakdale?
There are 59.13 Females per 100 Males in Oakdale.
What is the Median Population Age in Oakdale?
Median Population Age in Oakdale is 42.1 Years.
What is the Average Family Size in Oakdale
Average Family Size in Oakdale is 2.7 People.
What is the Average Household Size in Oakdale
Average Household Size in Oakdale is 2.4 People.
How Large is the Labor Force in Oakdale?
There are 2,011 People in the Labor Forcein in Oakdale.
What is the Percentage of People in the Labor Force in Oakdale?
35.1% of People are in the Labor Force in Oakdale.
What is the Unemployment Rate in Oakdale?
Unemployment Rate in Oakdale is 10.4%.