Zip Codes with the Highest Percentage of Population Employed in Food Preparation & Serving in Bossier City, LA
RELATED REPORTS & OPTIONS
Food Preparation & Serving
Bossier City
Compare Zip Codes
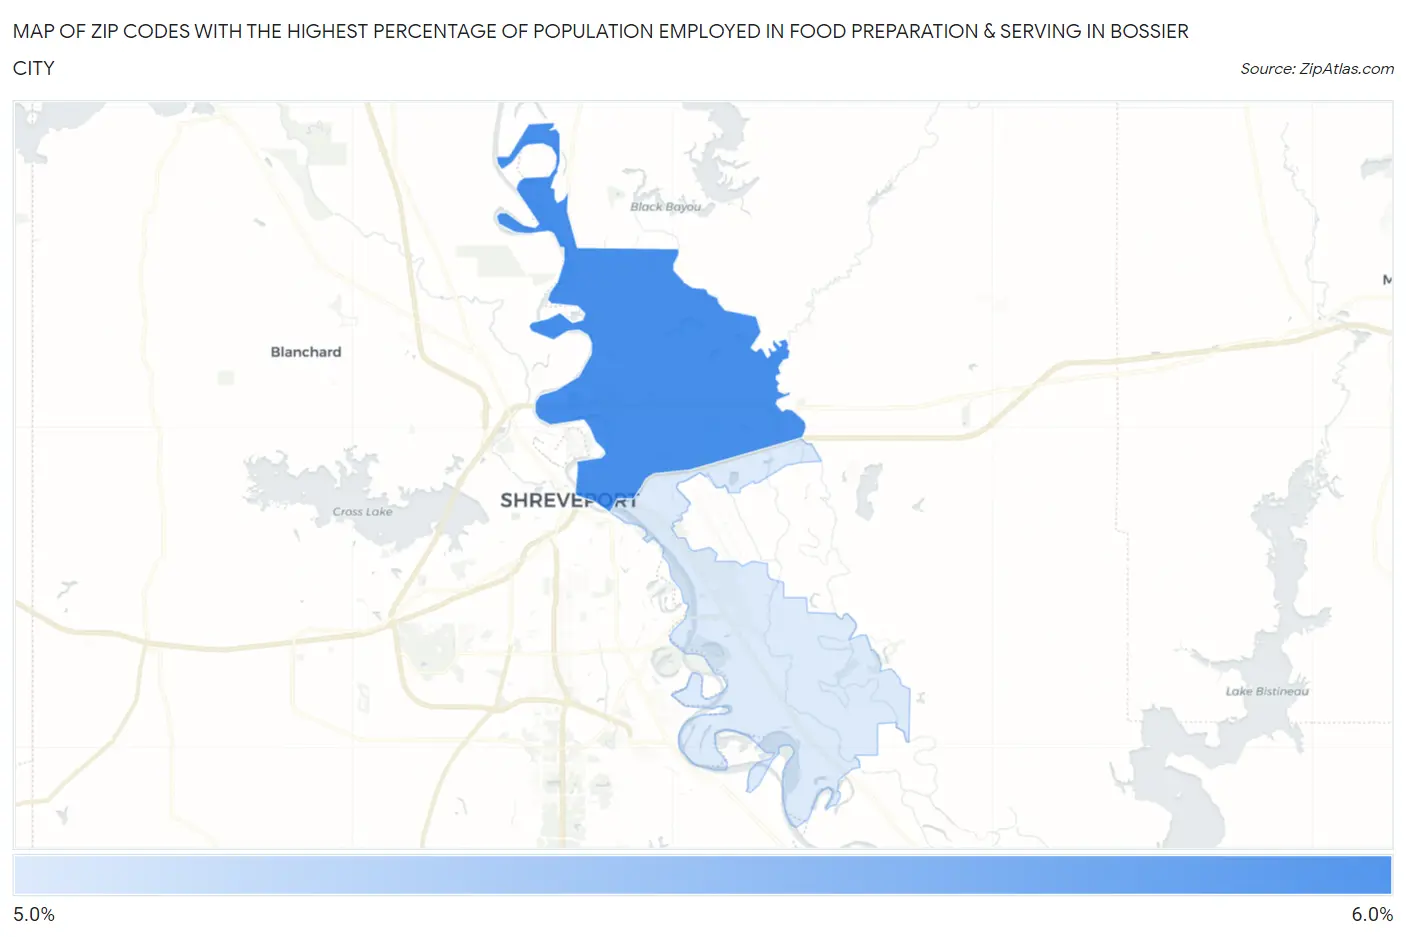
Map of Zip Codes with the Highest Percentage of Population Employed in Food Preparation & Serving in Bossier City
5.2%
5.5%
Zip Codes with the Highest Percentage of Population Employed in Food Preparation & Serving in Bossier City, LA
| Zip Code | % Employed | vs State | vs National | |
| 1. | 71111 | 5.5% | 6.0%(-0.588)#192 | 5.3%(+0.168)#11,207 |
| 2. | 71112 | 5.2% | 6.0%(-0.871)#210 | 5.3%(-0.116)#12,278 |
1
Common Questions
What are the Top Zip Codes with the Highest Percentage of Population Employed in Food Preparation & Serving in Bossier City, LA?
Top Zip Codes with the Highest Percentage of Population Employed in Food Preparation & Serving in Bossier City, LA are:
What zip code has the Highest Percentage of Population Employed in Food Preparation & Serving in Bossier City, LA?
71111 has the Highest Percentage of Population Employed in Food Preparation & Serving in Bossier City, LA with 5.5%.
What is the Percentage of Population Employed in Food Preparation & Serving in Bossier City, LA?
Percentage of Population Employed in Food Preparation & Serving in Bossier City is 6.7%.
What is the Percentage of Population Employed in Food Preparation & Serving in Louisiana?
Percentage of Population Employed in Food Preparation & Serving in Louisiana is 6.0%.
What is the Percentage of Population Employed in Food Preparation & Serving in the United States?
Percentage of Population Employed in Food Preparation & Serving in the United States is 5.3%.