Mermentau, LA Map & Demographics
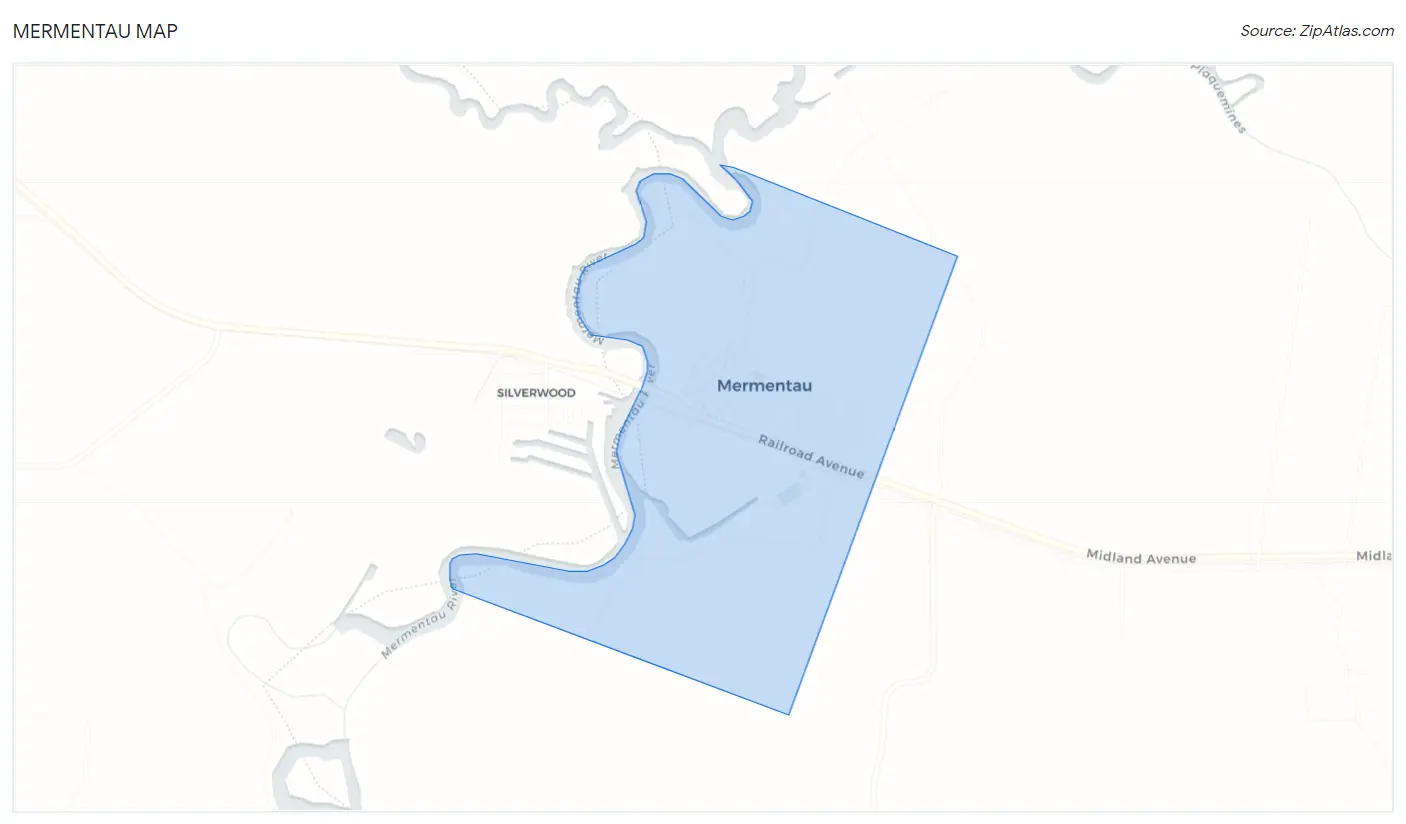
Mermentau Map
Mermentau Overview
$25,887
PER CAPITA INCOME
$110,694
AVG FAMILY INCOME
$110,213
AVG HOUSEHOLD INCOME
17.2%
WAGE / INCOME GAP [ % ]
82.8¢/ $1
WAGE / INCOME GAP [ $ ]
0.28
INEQUALITY / GINI INDEX
644
TOTAL POPULATION
241
MALE POPULATION
403
FEMALE POPULATION
59.80
MALES / 100 FEMALES
167.22
FEMALES / 100 MALES
62.6
MEDIAN AGE
2.0
AVG FAMILY SIZE
1.9
AVG HOUSEHOLD SIZE
149
LABOR FORCE [ PEOPLE ]
25.6%
PERCENT IN LABOR FORCE
Mermentau Zip Codes
Mermentau Area Codes
Income in Mermentau
Income Overview in Mermentau
Per Capita Income in Mermentau is $25,887, while median incomes of families and households are $110,694 and $110,213 respectively.
| Characteristic | Number | Measure |
| Per Capita Income | 644 | $25,887 |
| Median Family Income | 277 | $110,694 |
| Mean Family Income | 277 | $90,294 |
| Median Household Income | 340 | $110,213 |
| Mean Household Income | 340 | $78,686 |
| Income Deficit | 277 | $0 |
| Wage / Income Gap (%) | 644 | 17.21% |
| Wage / Income Gap ($) | 644 | 82.79¢ per $1 |
| Gini / Inequality Index | 644 | 0.28 |
Earnings by Sex in Mermentau
Average Earnings in Mermentau are $28,878, $29,390 for men and $24,333 for women, a difference of 17.2%.
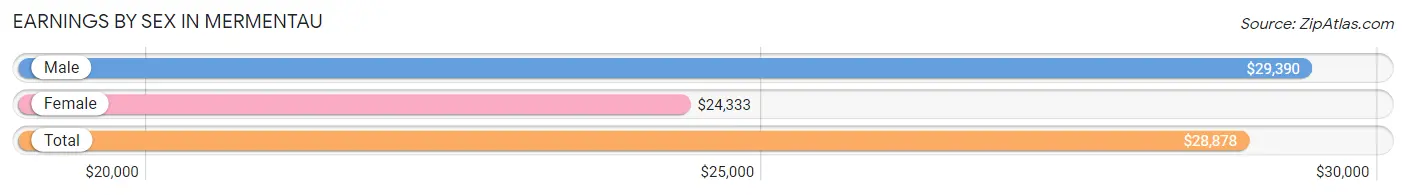
| Sex | Number | Average Earnings |
| Male | 128 (63.4%) | $29,390 |
| Female | 74 (36.6%) | $24,333 |
| Total | 202 (100.0%) | $28,878 |
Earnings by Sex by Income Bracket in Mermentau
The most common earnings brackets in Mermentau are $25,000 to $29,999 for men (41 | 32.0%) and $12,500 to $14,999 for women (20 | 27.0%).
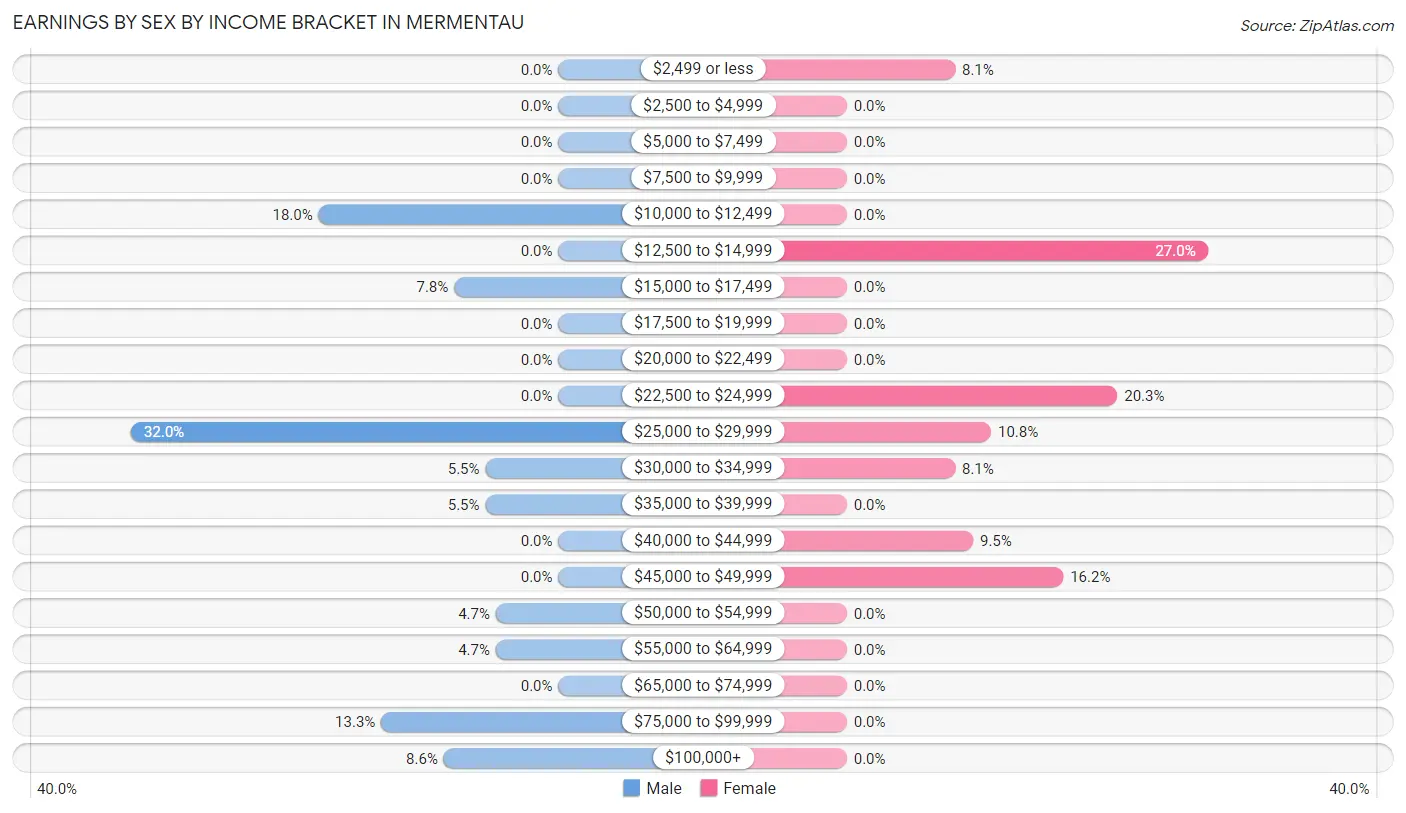
| Income | Male | Female |
| $2,499 or less | 0 (0.0%) | 6 (8.1%) |
| $2,500 to $4,999 | 0 (0.0%) | 0 (0.0%) |
| $5,000 to $7,499 | 0 (0.0%) | 0 (0.0%) |
| $7,500 to $9,999 | 0 (0.0%) | 0 (0.0%) |
| $10,000 to $12,499 | 23 (18.0%) | 0 (0.0%) |
| $12,500 to $14,999 | 0 (0.0%) | 20 (27.0%) |
| $15,000 to $17,499 | 10 (7.8%) | 0 (0.0%) |
| $17,500 to $19,999 | 0 (0.0%) | 0 (0.0%) |
| $20,000 to $22,499 | 0 (0.0%) | 0 (0.0%) |
| $22,500 to $24,999 | 0 (0.0%) | 15 (20.3%) |
| $25,000 to $29,999 | 41 (32.0%) | 8 (10.8%) |
| $30,000 to $34,999 | 7 (5.5%) | 6 (8.1%) |
| $35,000 to $39,999 | 7 (5.5%) | 0 (0.0%) |
| $40,000 to $44,999 | 0 (0.0%) | 7 (9.5%) |
| $45,000 to $49,999 | 0 (0.0%) | 12 (16.2%) |
| $50,000 to $54,999 | 6 (4.7%) | 0 (0.0%) |
| $55,000 to $64,999 | 6 (4.7%) | 0 (0.0%) |
| $65,000 to $74,999 | 0 (0.0%) | 0 (0.0%) |
| $75,000 to $99,999 | 17 (13.3%) | 0 (0.0%) |
| $100,000+ | 11 (8.6%) | 0 (0.0%) |
| Total | 128 (100.0%) | 74 (100.0%) |
Earnings by Sex by Educational Attainment in Mermentau
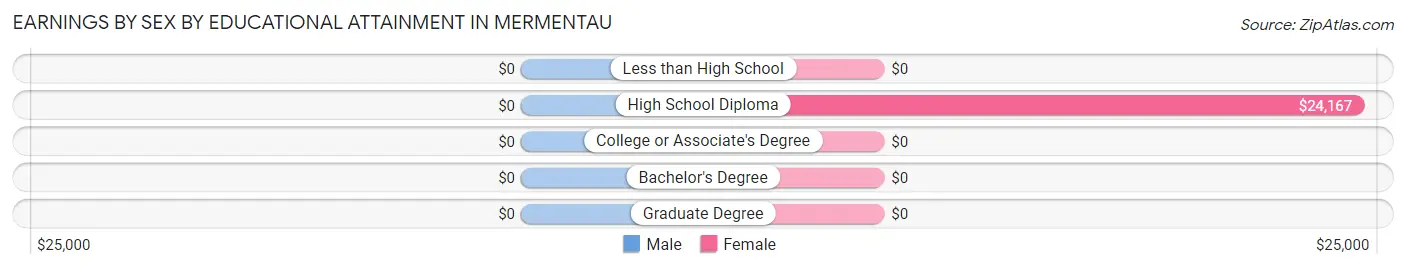
| Educational Attainment | Male Income | Female Income |
| Less than High School | - | - |
| High School Diploma | - | - |
| College or Associate's Degree | - | - |
| Bachelor's Degree | - | - |
| Graduate Degree | - | - |
| Total | $29,909 | $27,656 |
Family Income in Mermentau
Family Income Brackets in Mermentau
According to the Mermentau family income data, there are 186 families falling into the $100,000 to $149,999 income range, which is the most common income bracket and makes up 67.1% of all families.
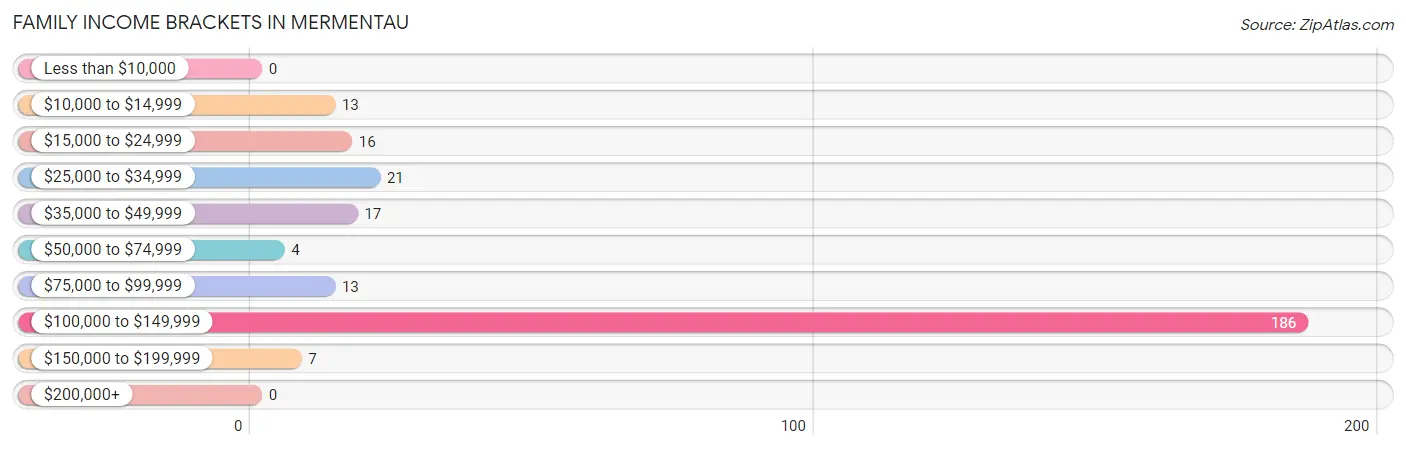
| Income Bracket | # Families | % Families |
| Less than $10,000 | 0 | 0.0% |
| $10,000 to $14,999 | 13 | 4.7% |
| $15,000 to $24,999 | 16 | 5.8% |
| $25,000 to $34,999 | 21 | 7.6% |
| $35,000 to $49,999 | 17 | 6.1% |
| $50,000 to $74,999 | 4 | 1.4% |
| $75,000 to $99,999 | 13 | 4.7% |
| $100,000 to $149,999 | 186 | 67.1% |
| $150,000 to $199,999 | 7 | 2.5% |
| $200,000+ | 0 | 0.0% |
Family Income by Famaliy Size in Mermentau
2-person families (237 | 85.6%) account for the highest median family income in Mermentau with $110,755 per family, while 2-person families (237 | 85.6%) have the highest median income of $55,378 per family member.
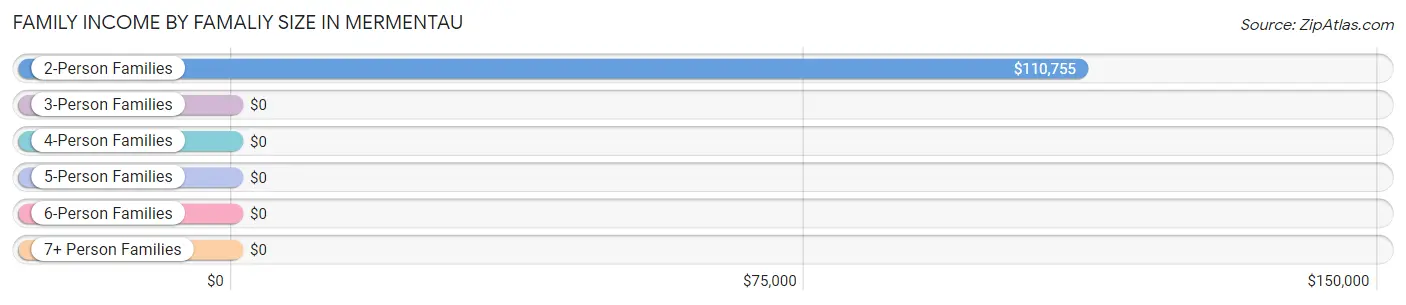
| Income Bracket | # Families | Median Income |
| 2-Person Families | 237 (85.6%) | $110,755 |
| 3-Person Families | 17 (6.1%) | $0 |
| 4-Person Families | 9 (3.3%) | $0 |
| 5-Person Families | 7 (2.5%) | $0 |
| 6-Person Families | 7 (2.5%) | $0 |
| 7+ Person Families | 0 (0.0%) | $0 |
| Total | 277 (100.0%) | $110,694 |
Family Income by Number of Earners in Mermentau
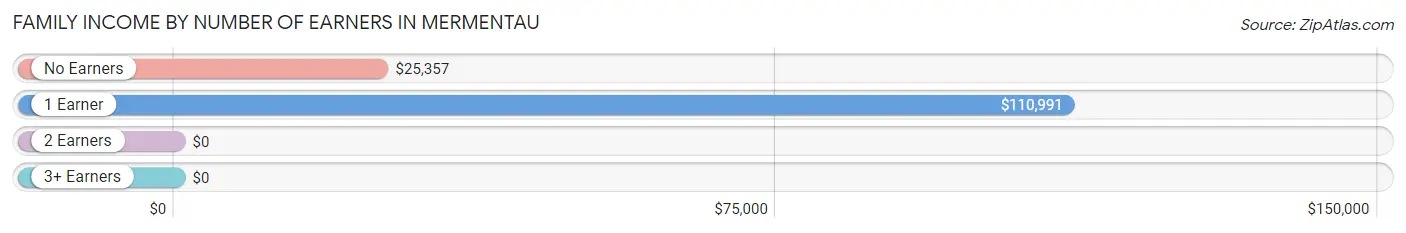
| Number of Earners | # Families | Median Income |
| No Earners | 22 (7.9%) | $25,357 |
| 1 Earner | 224 (80.9%) | $110,991 |
| 2 Earners | 24 (8.7%) | $0 |
| 3+ Earners | 7 (2.5%) | $0 |
| Total | 277 (100.0%) | $110,694 |
Household Income in Mermentau
Household Income Brackets in Mermentau
With 186 households falling in the category, the $100,000 to $149,999 income range is the most frequent in Mermentau, accounting for 54.7% of all households.
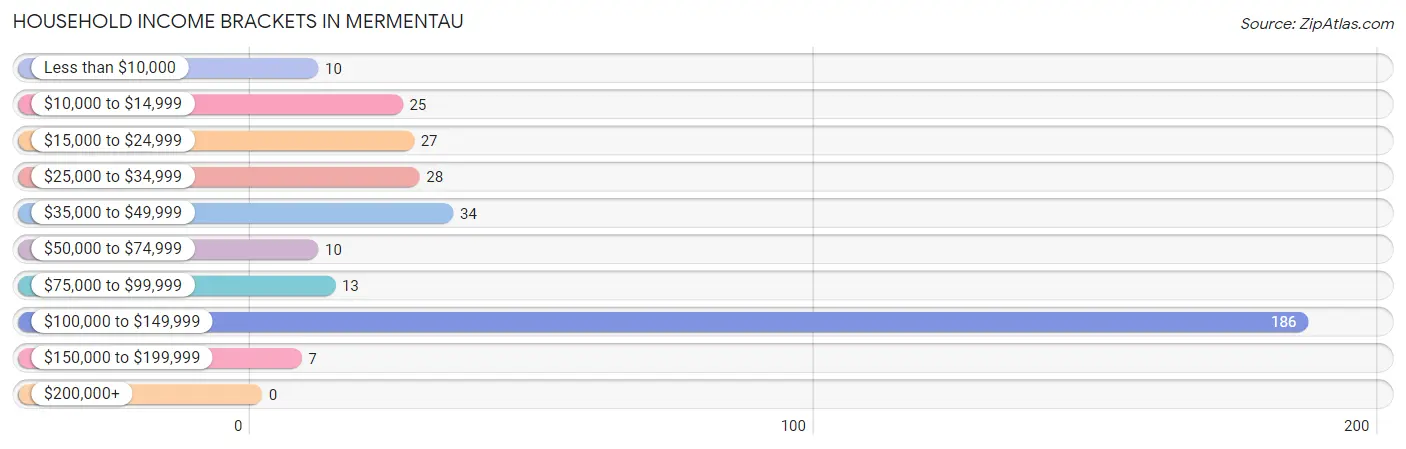
| Income Bracket | # Households | % Households |
| Less than $10,000 | 10 | 2.9% |
| $10,000 to $14,999 | 25 | 7.4% |
| $15,000 to $24,999 | 27 | 7.9% |
| $25,000 to $34,999 | 28 | 8.2% |
| $35,000 to $49,999 | 34 | 10.0% |
| $50,000 to $74,999 | 10 | 2.9% |
| $75,000 to $99,999 | 13 | 3.8% |
| $100,000 to $149,999 | 186 | 54.7% |
| $150,000 to $199,999 | 7 | 2.1% |
| $200,000+ | 0 | 0.0% |
Household Income by Householder Age in Mermentau
The median household income in Mermentau is $110,213, with the highest median household income of $110,861 found in the 65+ years age bracket for the primary householder. A total of 235 households (69.1%) fall into this category. Meanwhile, the 15 to 24 years age bracket for the primary householder has the lowest median household income of $0, with 9 households (2.6%) in this group.
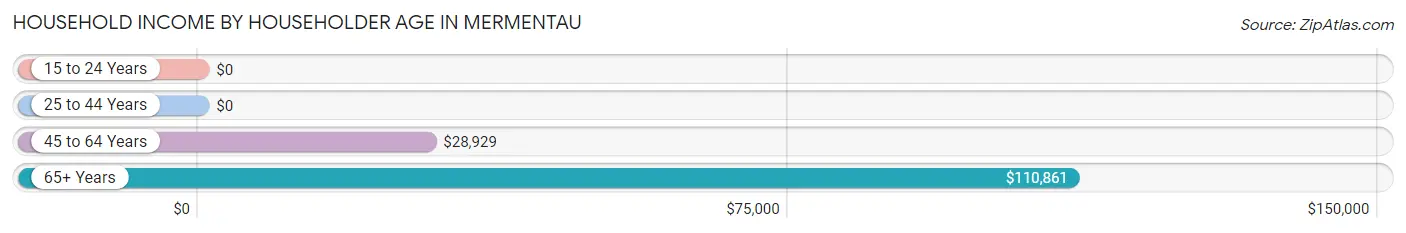
| Income Bracket | # Households | Median Income |
| 15 to 24 Years | 9 (2.6%) | $0 |
| 25 to 44 Years | 34 (10.0%) | $0 |
| 45 to 64 Years | 62 (18.2%) | $28,929 |
| 65+ Years | 235 (69.1%) | $110,861 |
| Total | 340 (100.0%) | $110,213 |
Poverty in Mermentau
Income Below Poverty by Sex and Age in Mermentau
With 22.8% poverty level for males and 17.1% for females among the residents of Mermentau, under 5 year old males and 5 year old females are the most vulnerable to poverty, with 9 males (100.0%) and 7 females (100.0%) in their respective age groups living below the poverty level.
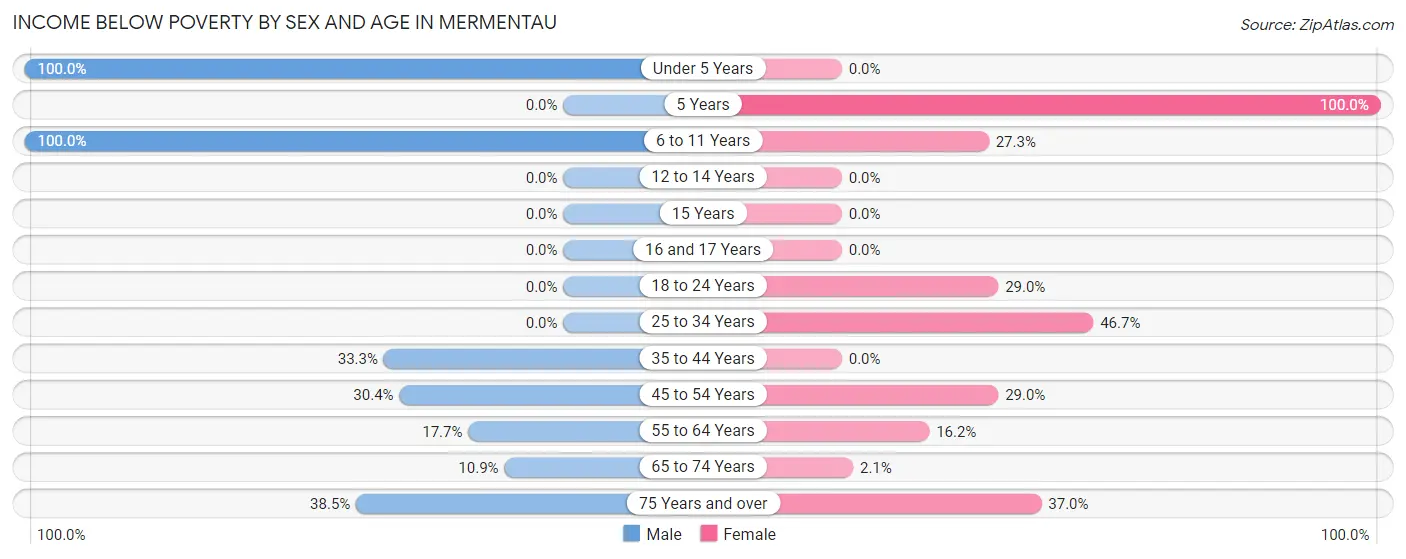
| Age Bracket | Male | Female |
| Under 5 Years | 9 (100.0%) | 0 (0.0%) |
| 5 Years | 0 (0.0%) | 7 (100.0%) |
| 6 to 11 Years | 7 (100.0%) | 3 (27.3%) |
| 12 to 14 Years | 0 (0.0%) | 0 (0.0%) |
| 15 Years | 0 (0.0%) | 0 (0.0%) |
| 16 and 17 Years | 0 (0.0%) | 0 (0.0%) |
| 18 to 24 Years | 0 (0.0%) | 9 (29.0%) |
| 25 to 34 Years | 0 (0.0%) | 21 (46.7%) |
| 35 to 44 Years | 14 (33.3%) | 0 (0.0%) |
| 45 to 54 Years | 7 (30.4%) | 9 (29.0%) |
| 55 to 64 Years | 6 (17.6%) | 6 (16.2%) |
| 65 to 74 Years | 7 (10.9%) | 4 (2.1%) |
| 75 Years and over | 5 (38.5%) | 10 (37.0%) |
| Total | 55 (22.8%) | 69 (17.1%) |
Income Above Poverty by Sex and Age in Mermentau
According to the poverty statistics in Mermentau, males aged 12 to 14 years and females aged 12 to 14 years are the age groups that are most secure financially, with 100.0% of males and 100.0% of females in these age groups living above the poverty line.
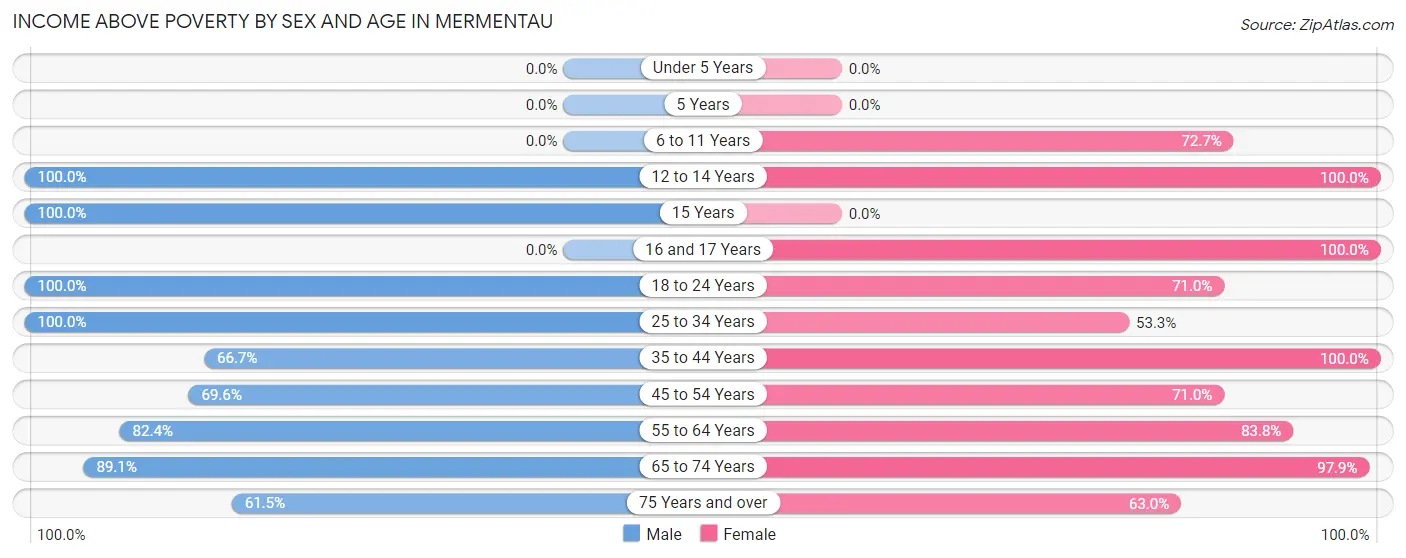
| Age Bracket | Male | Female |
| Under 5 Years | 0 (0.0%) | 0 (0.0%) |
| 5 Years | 0 (0.0%) | 0 (0.0%) |
| 6 to 11 Years | 0 (0.0%) | 8 (72.7%) |
| 12 to 14 Years | 11 (100.0%) | 7 (100.0%) |
| 15 Years | 10 (100.0%) | 0 (0.0%) |
| 16 and 17 Years | 0 (0.0%) | 5 (100.0%) |
| 18 to 24 Years | 21 (100.0%) | 22 (71.0%) |
| 25 to 34 Years | 7 (100.0%) | 24 (53.3%) |
| 35 to 44 Years | 28 (66.7%) | 11 (100.0%) |
| 45 to 54 Years | 16 (69.6%) | 22 (71.0%) |
| 55 to 64 Years | 28 (82.4%) | 31 (83.8%) |
| 65 to 74 Years | 57 (89.1%) | 187 (97.9%) |
| 75 Years and over | 8 (61.5%) | 17 (63.0%) |
| Total | 186 (77.2%) | 334 (82.9%) |
Income Below Poverty Among Married-Couple Families in Mermentau
The poverty statistics for married-couple families in Mermentau show that 2.8% or 6 of the total 217 families live below the poverty line. Families with no children have the highest poverty rate of 2.9%, comprising of 6 families. On the other hand, families with 1 or 2 children have the lowest poverty rate of 0.0%, which includes 0 families.
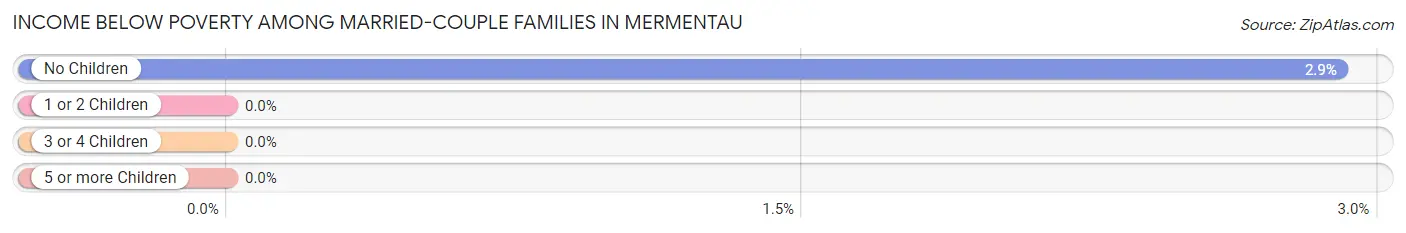
| Children | Above Poverty | Below Poverty |
| No Children | 201 (97.1%) | 6 (2.9%) |
| 1 or 2 Children | 10 (100.0%) | 0 (0.0%) |
| 3 or 4 Children | 0 (0.0%) | 0 (0.0%) |
| 5 or more Children | 0 (0.0%) | 0 (0.0%) |
| Total | 211 (97.2%) | 6 (2.8%) |
Income Below Poverty Among Single-Parent Households in Mermentau
According to the poverty data in Mermentau, 41.2% or 7 single-father households and 30.2% or 13 single-mother households are living below the poverty line. Among single-father households, those with 1 or 2 children have the highest poverty rate, with 7 households (70.0%) experiencing poverty. Likewise, among single-mother households, those with 1 or 2 children have the highest poverty rate, with 13 households (100.0%) falling below the poverty line.
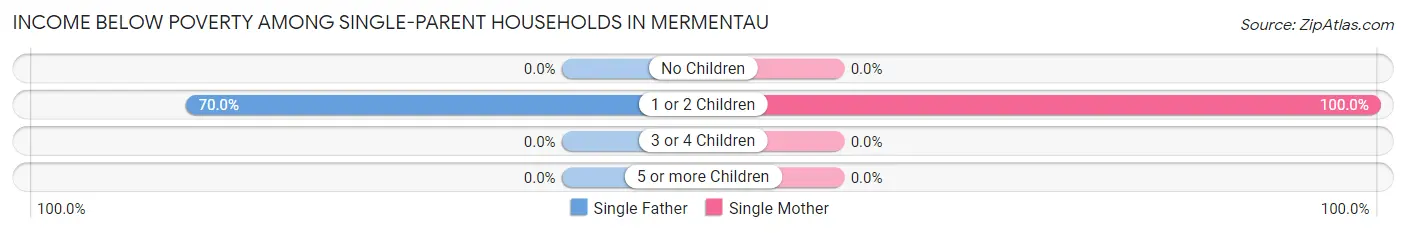
| Children | Single Father | Single Mother |
| No Children | 0 (0.0%) | 0 (0.0%) |
| 1 or 2 Children | 7 (70.0%) | 13 (100.0%) |
| 3 or 4 Children | 0 (0.0%) | 0 (0.0%) |
| 5 or more Children | 0 (0.0%) | 0 (0.0%) |
| Total | 7 (41.2%) | 13 (30.2%) |
Income Below Poverty Among Married-Couple vs Single-Parent Households in Mermentau
The poverty data for Mermentau shows that 6 of the married-couple family households (2.8%) and 20 of the single-parent households (33.3%) are living below the poverty level. Within the married-couple family households, those with no children have the highest poverty rate, with 6 households (2.9%) falling below the poverty line. Among the single-parent households, those with 1 or 2 children have the highest poverty rate, with 20 household (87.0%) living below poverty.
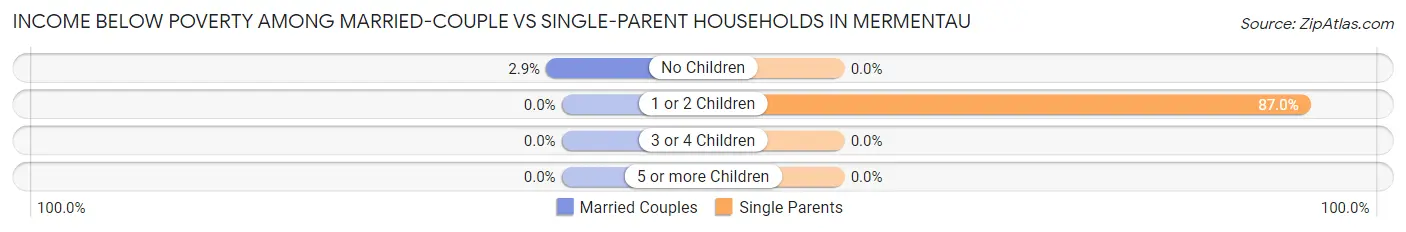
| Children | Married-Couple Families | Single-Parent Households |
| No Children | 6 (2.9%) | 0 (0.0%) |
| 1 or 2 Children | 0 (0.0%) | 20 (87.0%) |
| 3 or 4 Children | 0 (0.0%) | 0 (0.0%) |
| 5 or more Children | 0 (0.0%) | 0 (0.0%) |
| Total | 6 (2.8%) | 20 (33.3%) |
Race in Mermentau
The most populous races in Mermentau are White / Caucasian (512 | 79.5%), Black / African American (115 | 17.9%), and Two or more Races (17 | 2.6%).
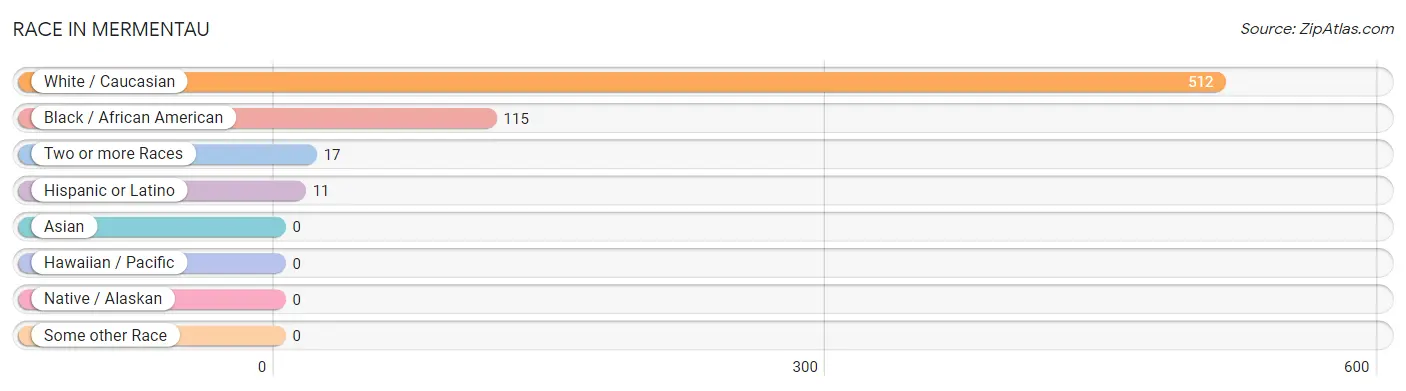
| Race | # Population | % Population |
| Asian | 0 | 0.0% |
| Black / African American | 115 | 17.9% |
| Hawaiian / Pacific | 0 | 0.0% |
| Hispanic or Latino | 11 | 1.7% |
| Native / Alaskan | 0 | 0.0% |
| White / Caucasian | 512 | 79.5% |
| Two or more Races | 17 | 2.6% |
| Some other Race | 0 | 0.0% |
| Total | 644 | 100.0% |
Ancestry in Mermentau
The most populous ancestries reported in Mermentau are French (91 | 14.1%), French Canadian (74 | 11.5%), American (30 | 4.7%), English (26 | 4.0%), and Canadian (14 | 2.2%), together accounting for 36.5% of all Mermentau residents.
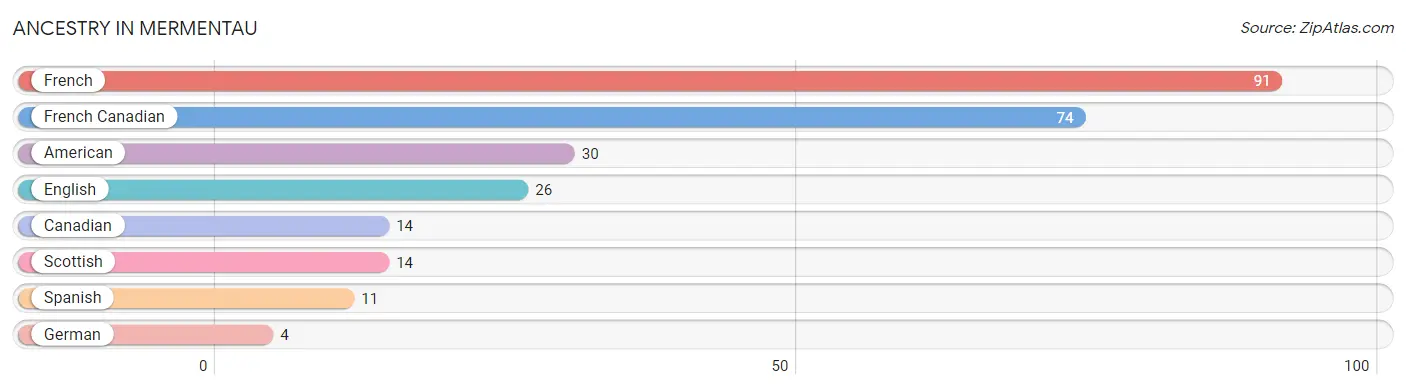
| Ancestry | # Population | % Population |
| American | 30 | 4.7% |
| Canadian | 14 | 2.2% |
| English | 26 | 4.0% |
| French | 91 | 14.1% |
| French Canadian | 74 | 11.5% |
| German | 4 | 0.6% |
| Scottish | 14 | 2.2% |
| Spanish | 11 | 1.7% | View All 8 Rows |
Immigrants in Mermentau

| Immigration Origin | # Population | % Population | View All 0 Rows |
Sex and Age in Mermentau
Sex and Age in Mermentau
The most populous age groups in Mermentau are 70 to 74 Years (45 | 18.7%) for men and 70 to 74 Years (183 | 45.4%) for women.
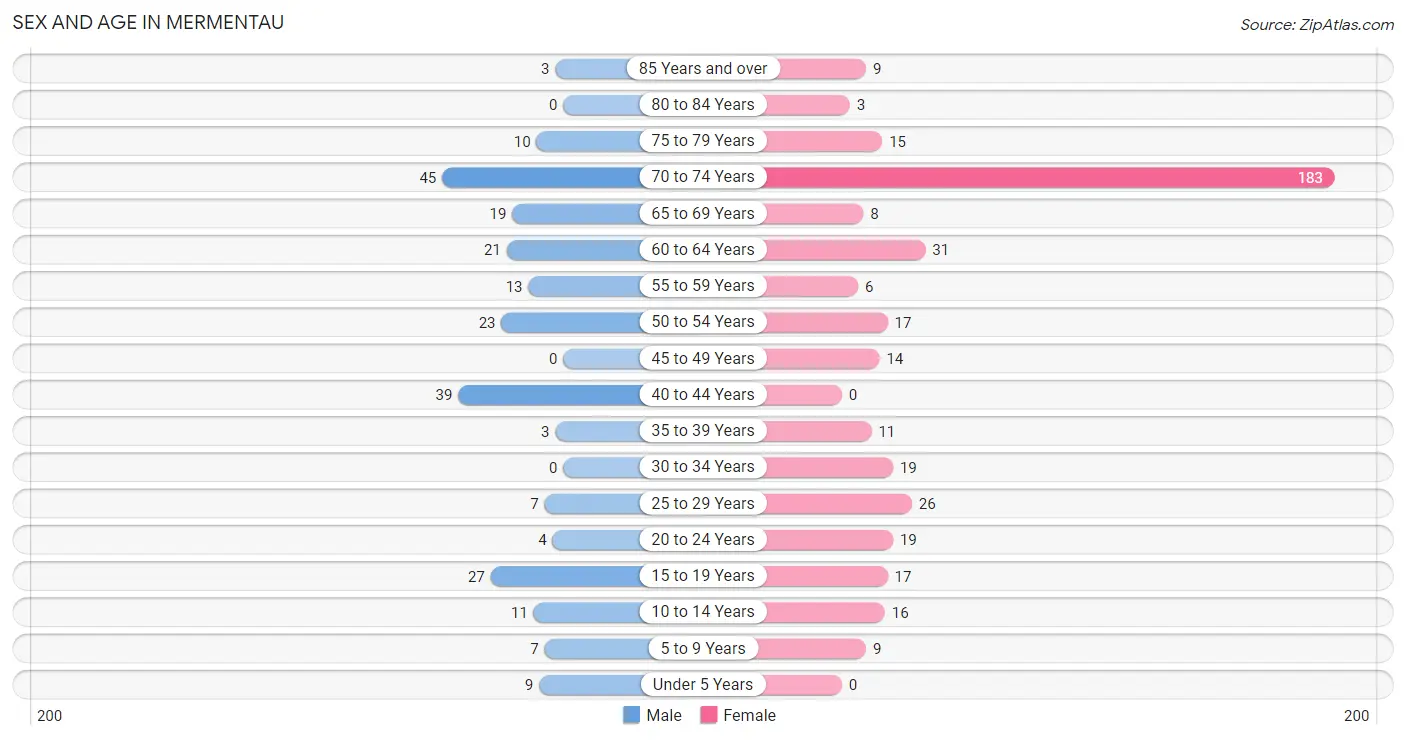
| Age Bracket | Male | Female |
| Under 5 Years | 9 (3.7%) | 0 (0.0%) |
| 5 to 9 Years | 7 (2.9%) | 9 (2.2%) |
| 10 to 14 Years | 11 (4.6%) | 16 (4.0%) |
| 15 to 19 Years | 27 (11.2%) | 17 (4.2%) |
| 20 to 24 Years | 4 (1.7%) | 19 (4.7%) |
| 25 to 29 Years | 7 (2.9%) | 26 (6.5%) |
| 30 to 34 Years | 0 (0.0%) | 19 (4.7%) |
| 35 to 39 Years | 3 (1.2%) | 11 (2.7%) |
| 40 to 44 Years | 39 (16.2%) | 0 (0.0%) |
| 45 to 49 Years | 0 (0.0%) | 14 (3.5%) |
| 50 to 54 Years | 23 (9.5%) | 17 (4.2%) |
| 55 to 59 Years | 13 (5.4%) | 6 (1.5%) |
| 60 to 64 Years | 21 (8.7%) | 31 (7.7%) |
| 65 to 69 Years | 19 (7.9%) | 8 (2.0%) |
| 70 to 74 Years | 45 (18.7%) | 183 (45.4%) |
| 75 to 79 Years | 10 (4.2%) | 15 (3.7%) |
| 80 to 84 Years | 0 (0.0%) | 3 (0.7%) |
| 85 Years and over | 3 (1.2%) | 9 (2.2%) |
| Total | 241 (100.0%) | 403 (100.0%) |
Families and Households in Mermentau
Median Family Size in Mermentau
The median family size in Mermentau is 2.00 persons per family, with single male/father families (17 | 6.1%) accounting for the largest median family size of 3.76 persons per family. On the other hand, married-couple families (217 | 78.3%) represent the smallest median family size with 1.65 persons per family.
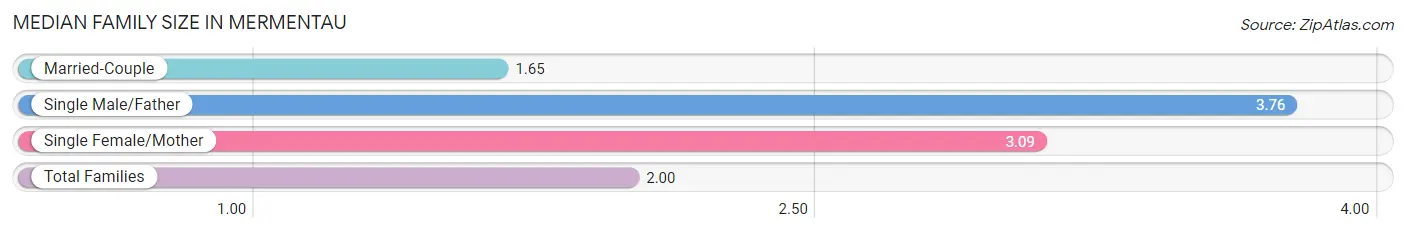
| Family Type | # Families | Family Size |
| Married-Couple | 217 (78.3%) | 1.65 |
| Single Male/Father | 17 (6.1%) | 3.76 |
| Single Female/Mother | 43 (15.5%) | 3.09 |
| Total Families | 277 (100.0%) | 2.00 |
Median Household Size in Mermentau
The median household size in Mermentau is 1.89 persons per household, with single male/father households (17 | 5.0%) accounting for the largest median household size of 3.76 persons per household. non-family households (63 | 18.5%) represent the smallest median household size with 1.43 persons per household.
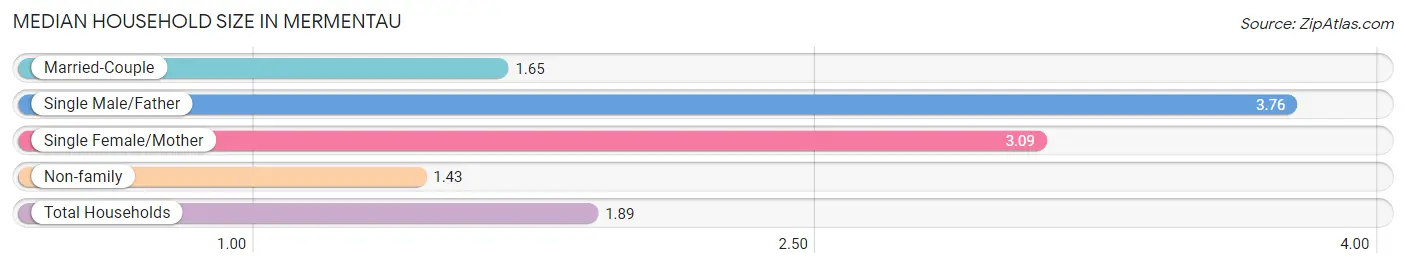
| Household Type | # Households | Household Size |
| Married-Couple | 217 (63.8%) | 1.65 |
| Single Male/Father | 17 (5.0%) | 3.76 |
| Single Female/Mother | 43 (12.7%) | 3.09 |
| Non-family | 63 (18.5%) | 1.43 |
| Total Households | 340 (100.0%) | 1.89 |
Household Size by Marriage Status in Mermentau
Out of a total of 340 households in Mermentau, 277 (81.5%) are family households, while 63 (18.5%) are nonfamily households. The most numerous type of family households are 2-person households, comprising 237, and the most common type of nonfamily households are 1-person households, comprising 51.
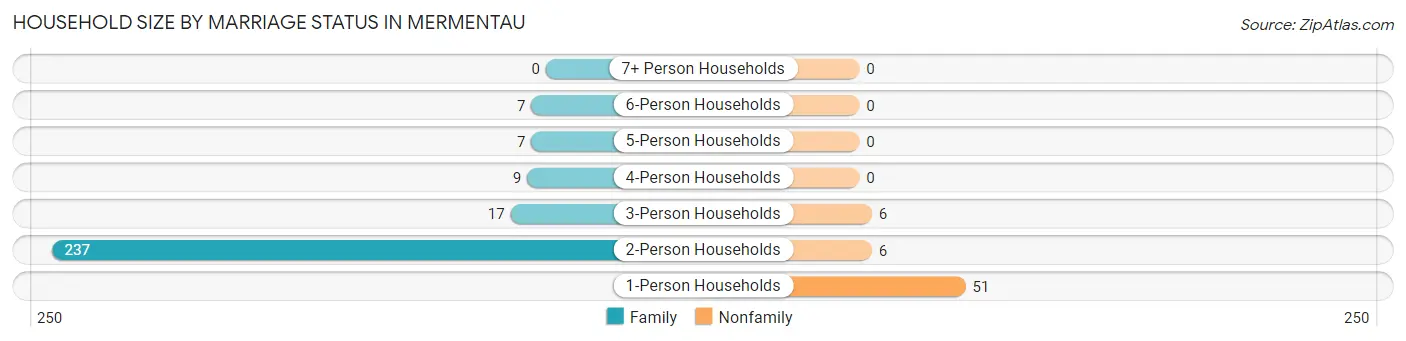
| Household Size | Family Households | Nonfamily Households |
| 1-Person Households | - | 51 (15.0%) |
| 2-Person Households | 237 (69.7%) | 6 (1.8%) |
| 3-Person Households | 17 (5.0%) | 6 (1.8%) |
| 4-Person Households | 9 (2.6%) | 0 (0.0%) |
| 5-Person Households | 7 (2.1%) | 0 (0.0%) |
| 6-Person Households | 7 (2.1%) | 0 (0.0%) |
| 7+ Person Households | 0 (0.0%) | 0 (0.0%) |
| Total | 277 (81.5%) | 63 (18.5%) |
Female Fertility in Mermentau
Fertility by Age in Mermentau
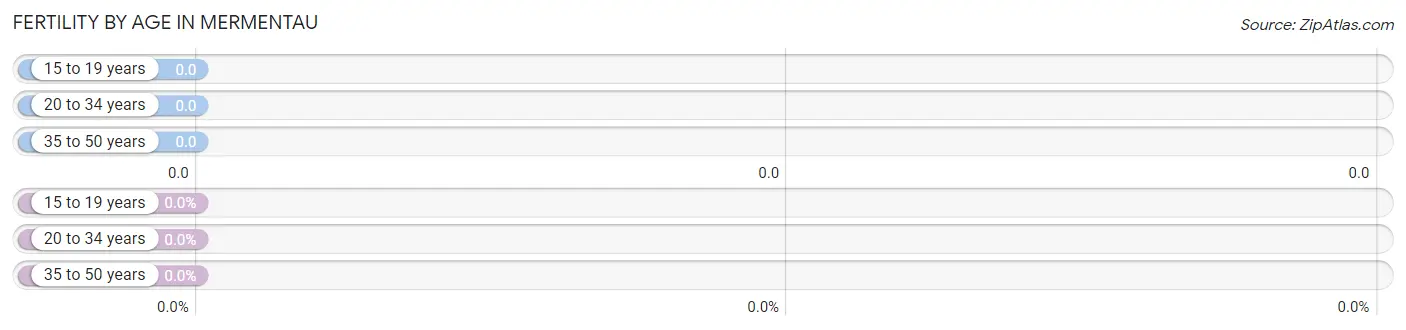
| Age Bracket | Women with Births | Births / 1,000 Women |
| 15 to 19 years | 0 (0.0%) | 0.0 |
| 20 to 34 years | 0 (0.0%) | 0.0 |
| 35 to 50 years | 0 (0.0%) | 0.0 |
| Total | 0 (0.0%) | 0.0 |
Fertility by Age by Marriage Status in Mermentau
| Age Bracket | Married | Unmarried |
| 15 to 19 years | 0 (0.0%) | 0 (0.0%) |
| 20 to 34 years | 0 (0.0%) | 0 (0.0%) |
| 35 to 50 years | 0 (0.0%) | 0 (0.0%) |
| Total | 0 (0.0%) | 0 (0.0%) |
Fertility by Education in Mermentau
| Educational Attainment | Women with Births | Births / 1,000 Women |
| Less than High School | 0 (0.0%) | 0.0 |
| High School Diploma | 0 (0.0%) | 0.0 |
| College or Associate's Degree | 0 (0.0%) | 0.0 |
| Bachelor's Degree | 0 (0.0%) | 0.0 |
| Graduate Degree | 0 (0.0%) | 0.0 |
| Total | 0 (0.0%) | 0.0 |
Fertility by Education by Marriage Status in Mermentau
| Educational Attainment | Married | Unmarried |
| Less than High School | 0 (0.0%) | 0 (0.0%) |
| High School Diploma | 0 (0.0%) | 0 (0.0%) |
| College or Associate's Degree | 0 (0.0%) | 0 (0.0%) |
| Bachelor's Degree | 0 (0.0%) | 0 (0.0%) |
| Graduate Degree | 0 (0.0%) | 0 (0.0%) |
| Total | 0 (0.0%) | 0 (0.0%) |
Employment Characteristics in Mermentau
Employment by Class of Employer in Mermentau
Among the 149 employed individuals in Mermentau, private company employees (139 | 93.3%), and not-for-profit organizations (10 | 6.7%) make up the most common classes of employment.
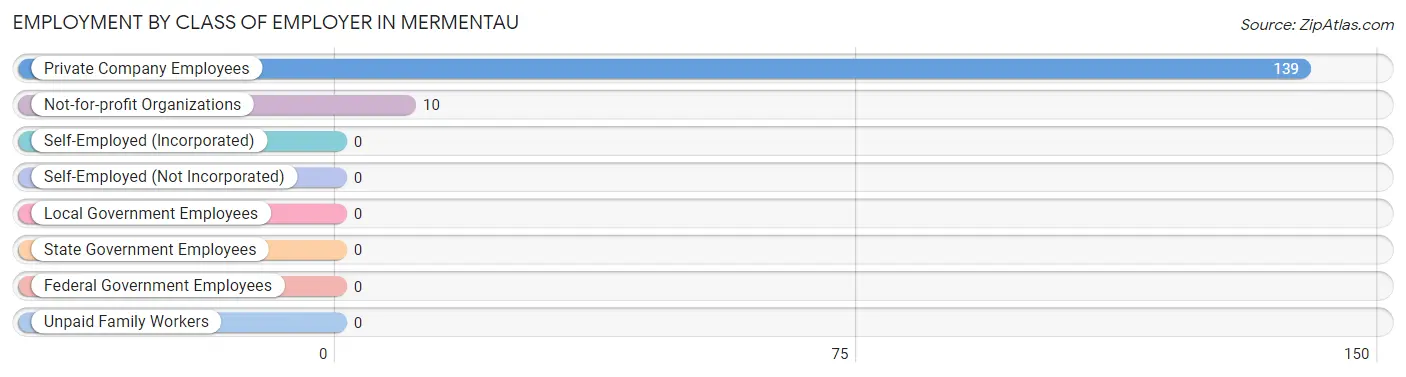
| Employer Class | # Employees | % Employees |
| Private Company Employees | 139 | 93.3% |
| Self-Employed (Incorporated) | 0 | 0.0% |
| Self-Employed (Not Incorporated) | 0 | 0.0% |
| Not-for-profit Organizations | 10 | 6.7% |
| Local Government Employees | 0 | 0.0% |
| State Government Employees | 0 | 0.0% |
| Federal Government Employees | 0 | 0.0% |
| Unpaid Family Workers | 0 | 0.0% |
| Total | 149 | 100.0% |
Employment Status by Age in Mermentau

| Age Bracket | In Labor Force | Unemployed |
| 16 to 19 Years | 17 (50.0%) | 0 (0.0%) |
| 20 to 24 Years | 9 (39.1%) | 0 (0.0%) |
| 25 to 29 Years | 7 (21.2%) | 0 (0.0%) |
| 30 to 34 Years | 19 (100.0%) | 0 (0.0%) |
| 35 to 44 Years | 35 (66.0%) | 0 (0.0%) |
| 45 to 54 Years | 35 (64.8%) | 0 (0.0%) |
| 55 to 59 Years | 13 (68.4%) | 0 (0.0%) |
| 60 to 64 Years | 14 (26.9%) | 0 (0.0%) |
| 65 to 74 Years | 0 (0.0%) | 0 (0.0%) |
| 75 Years and over | 0 (0.0%) | 0 (0.0%) |
| Total | 149 (25.6%) | 0 (0.0%) |
Employment Status by Educational Attainment in Mermentau
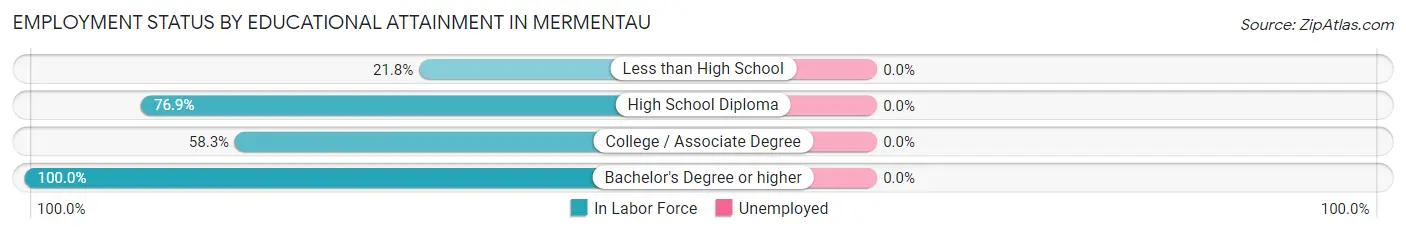
| Educational Attainment | In Labor Force | Unemployed |
| Less than High School | 19 (21.8%) | 0 (0.0%) |
| High School Diploma | 80 (76.9%) | 0 (0.0%) |
| College / Associate Degree | 21 (58.3%) | 0 (0.0%) |
| Bachelor's Degree or higher | 3 (100.0%) | 0 (0.0%) |
| Total | 123 (53.5%) | 0 (0.0%) |
Employment Occupations by Sex in Mermentau
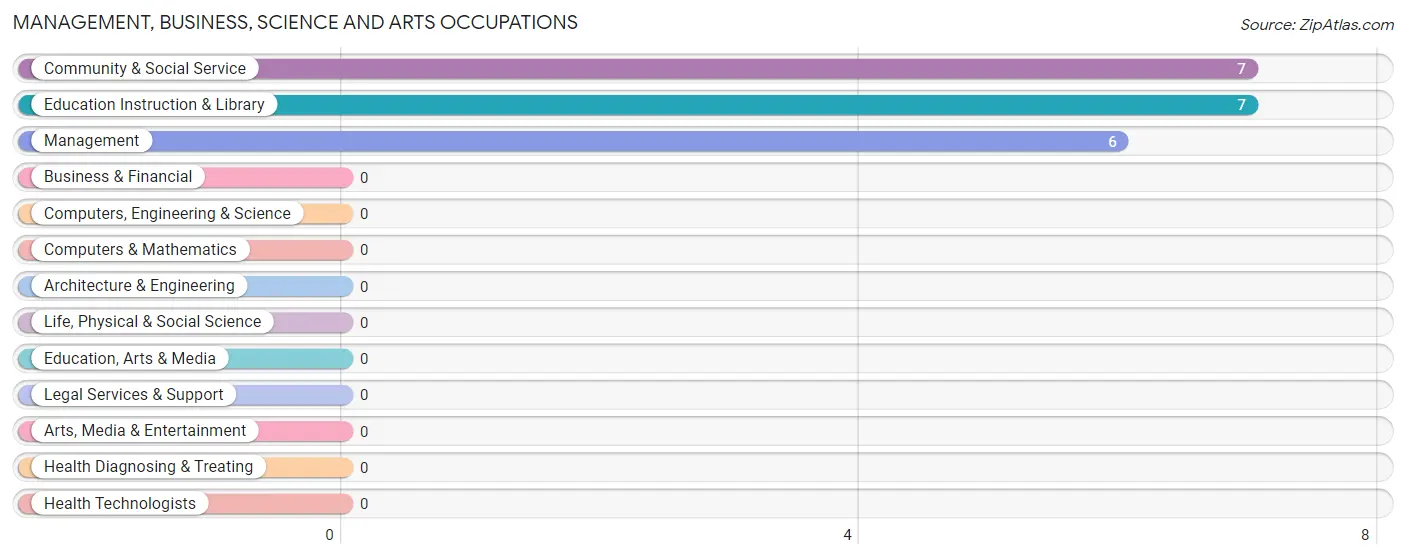
Management, Business, Science and Arts Occupations
The most common Management, Business, Science and Arts occupations in Mermentau are Community & Social Service (7 | 4.7%), Education Instruction & Library (7 | 4.7%), and Management (6 | 4.0%).
Management, Business, Science and Arts Occupations by Sex
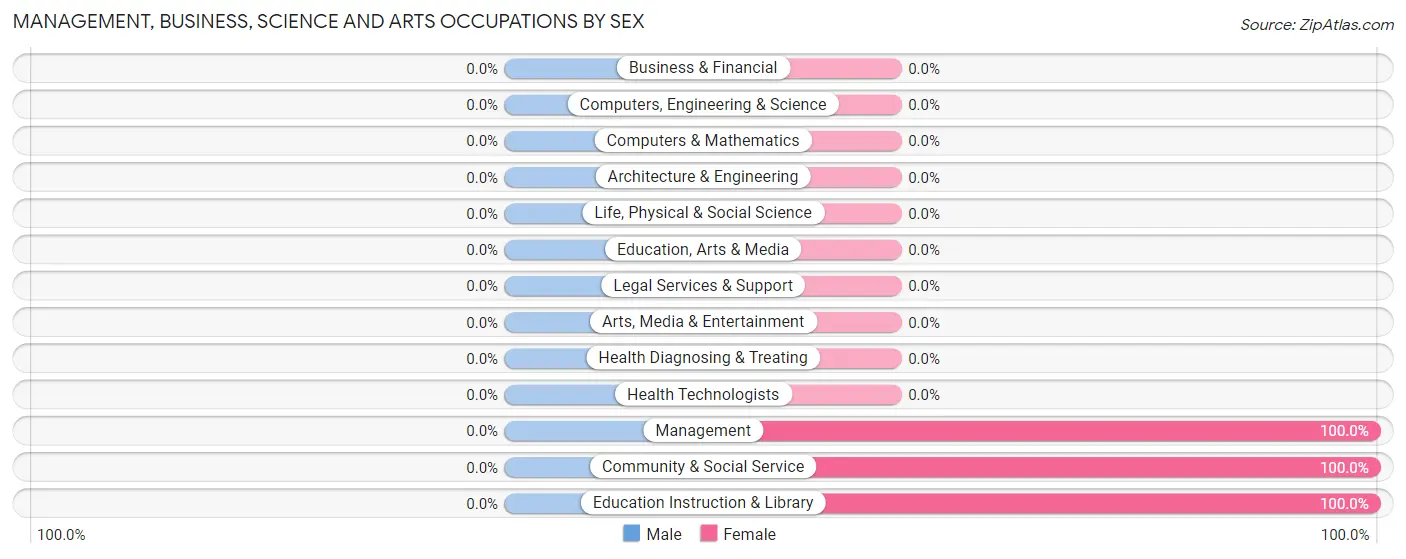
| Occupation | Male | Female |
| Management | 0 (0.0%) | 6 (100.0%) |
| Business & Financial | 0 (0.0%) | 0 (0.0%) |
| Computers, Engineering & Science | 0 (0.0%) | 0 (0.0%) |
| Computers & Mathematics | 0 (0.0%) | 0 (0.0%) |
| Architecture & Engineering | 0 (0.0%) | 0 (0.0%) |
| Life, Physical & Social Science | 0 (0.0%) | 0 (0.0%) |
| Community & Social Service | 0 (0.0%) | 7 (100.0%) |
| Education, Arts & Media | 0 (0.0%) | 0 (0.0%) |
| Legal Services & Support | 0 (0.0%) | 0 (0.0%) |
| Education Instruction & Library | 0 (0.0%) | 7 (100.0%) |
| Arts, Media & Entertainment | 0 (0.0%) | 0 (0.0%) |
| Health Diagnosing & Treating | 0 (0.0%) | 0 (0.0%) |
| Health Technologists | 0 (0.0%) | 0 (0.0%) |
| Total (Category) | 0 (0.0%) | 13 (100.0%) |
| Total (Overall) | 81 (54.4%) | 68 (45.6%) |
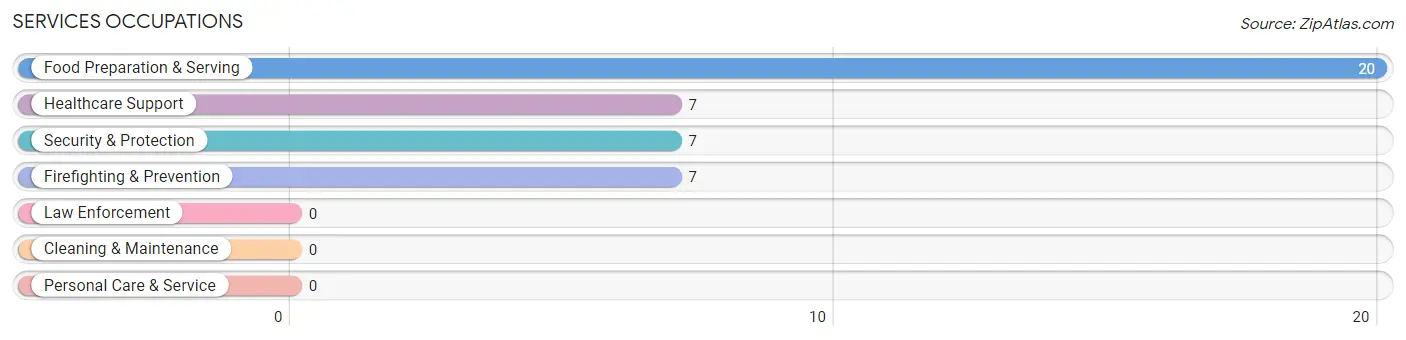
Services Occupations
The most common Services occupations in Mermentau are Food Preparation & Serving (20 | 13.4%), Healthcare Support (7 | 4.7%), Security & Protection (7 | 4.7%), and Firefighting & Prevention (7 | 4.7%).
Services Occupations by Sex
Within the Services occupations in Mermentau, the most male-oriented occupations are Security & Protection (100.0%), Firefighting & Prevention (100.0%), and Food Preparation & Serving (50.0%), while the most female-oriented occupations are Healthcare Support (100.0%), and Food Preparation & Serving (50.0%).
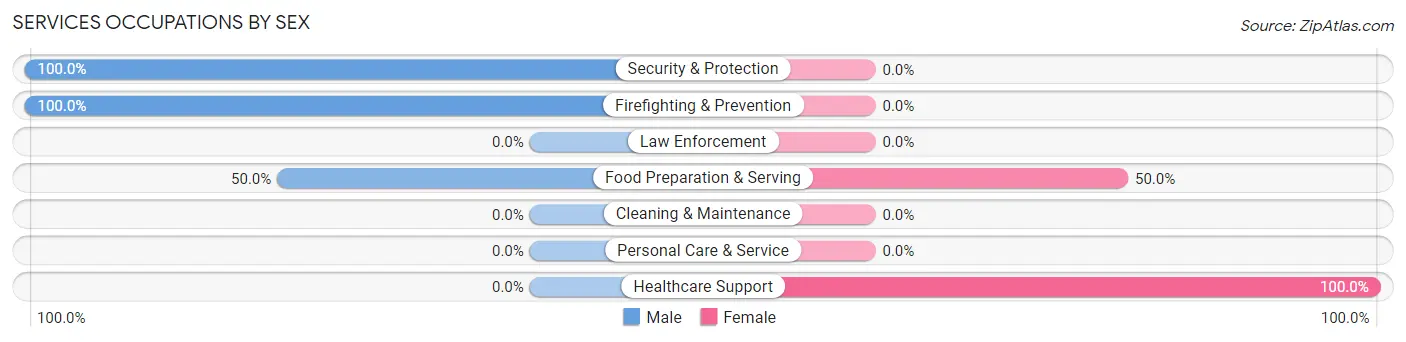
| Occupation | Male | Female |
| Healthcare Support | 0 (0.0%) | 7 (100.0%) |
| Security & Protection | 7 (100.0%) | 0 (0.0%) |
| Firefighting & Prevention | 7 (100.0%) | 0 (0.0%) |
| Law Enforcement | 0 (0.0%) | 0 (0.0%) |
| Food Preparation & Serving | 10 (50.0%) | 10 (50.0%) |
| Cleaning & Maintenance | 0 (0.0%) | 0 (0.0%) |
| Personal Care & Service | 0 (0.0%) | 0 (0.0%) |
| Total (Category) | 17 (50.0%) | 17 (50.0%) |
| Total (Overall) | 81 (54.4%) | 68 (45.6%) |
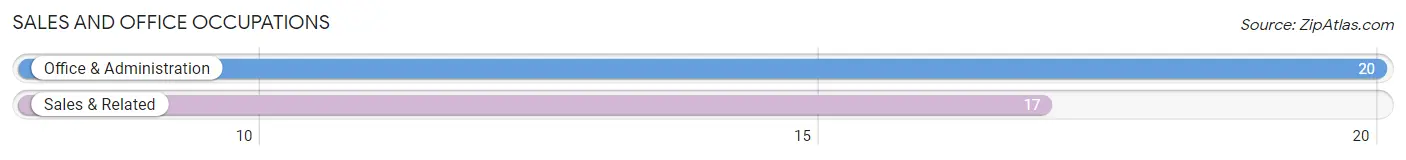
Sales and Office Occupations
The most common Sales and Office occupations in Mermentau are Office & Administration (20 | 13.4%), and Sales & Related (17 | 11.4%).
Sales and Office Occupations by Sex
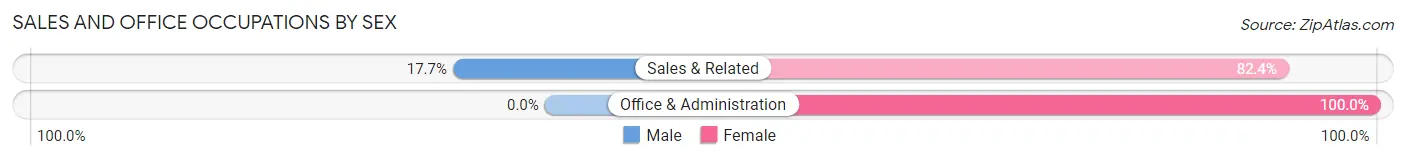
| Occupation | Male | Female |
| Sales & Related | 3 (17.6%) | 14 (82.4%) |
| Office & Administration | 0 (0.0%) | 20 (100.0%) |
| Total (Category) | 3 (8.1%) | 34 (91.9%) |
| Total (Overall) | 81 (54.4%) | 68 (45.6%) |
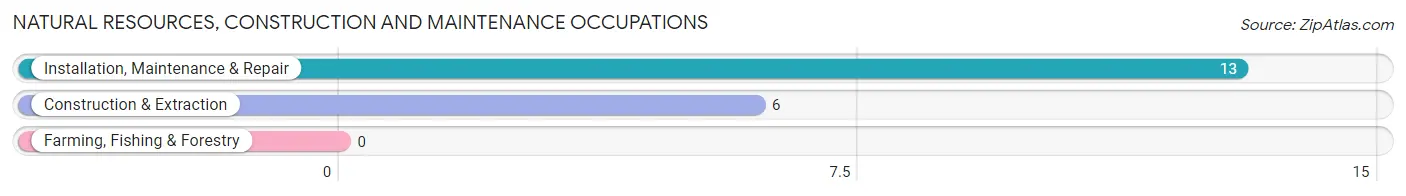
Natural Resources, Construction and Maintenance Occupations
The most common Natural Resources, Construction and Maintenance occupations in Mermentau are Installation, Maintenance & Repair (13 | 8.7%), and Construction & Extraction (6 | 4.0%).
Natural Resources, Construction and Maintenance Occupations by Sex
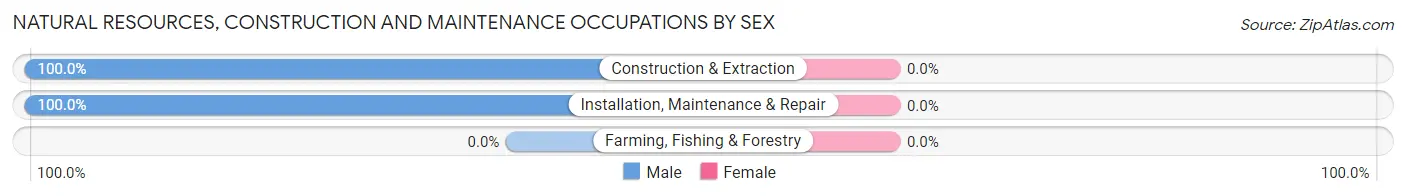
| Occupation | Male | Female |
| Farming, Fishing & Forestry | 0 (0.0%) | 0 (0.0%) |
| Construction & Extraction | 6 (100.0%) | 0 (0.0%) |
| Installation, Maintenance & Repair | 13 (100.0%) | 0 (0.0%) |
| Total (Category) | 19 (100.0%) | 0 (0.0%) |
| Total (Overall) | 81 (54.4%) | 68 (45.6%) |
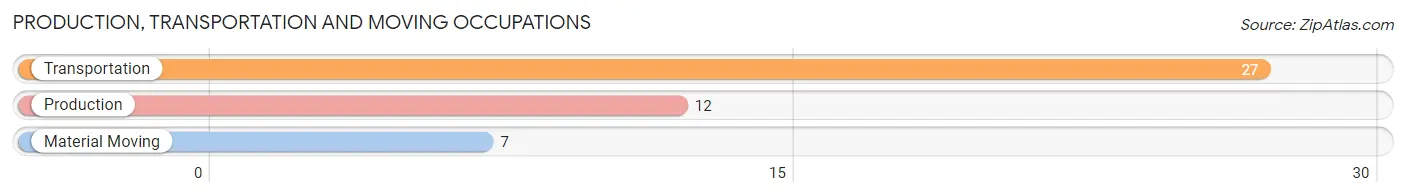
Production, Transportation and Moving Occupations
The most common Production, Transportation and Moving occupations in Mermentau are Transportation (27 | 18.1%), Production (12 | 8.1%), and Material Moving (7 | 4.7%).
Production, Transportation and Moving Occupations by Sex
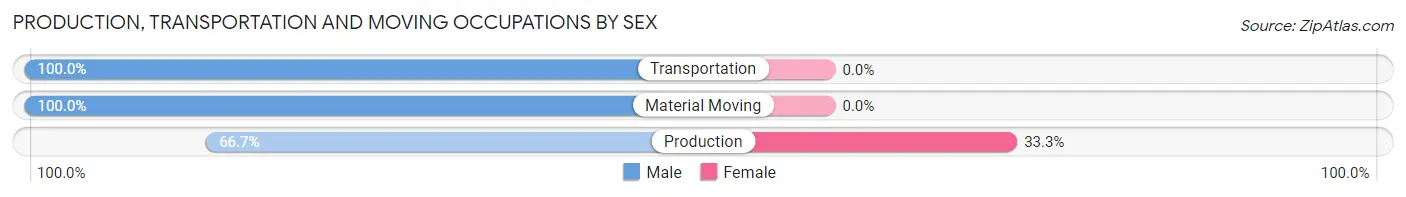
| Occupation | Male | Female |
| Production | 8 (66.7%) | 4 (33.3%) |
| Transportation | 27 (100.0%) | 0 (0.0%) |
| Material Moving | 7 (100.0%) | 0 (0.0%) |
| Total (Category) | 42 (91.3%) | 4 (8.7%) |
| Total (Overall) | 81 (54.4%) | 68 (45.6%) |
Employment Industries by Sex in Mermentau
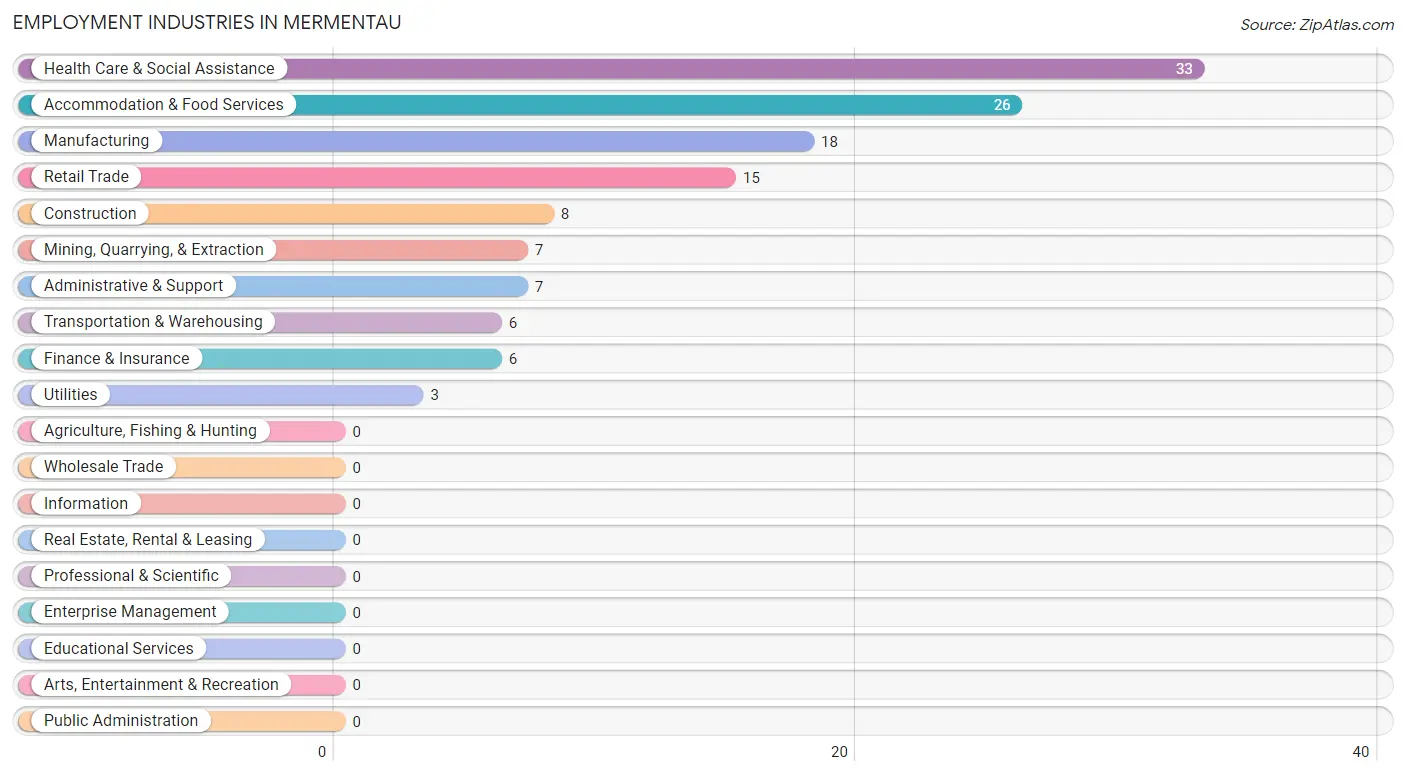
Employment Industries in Mermentau
The major employment industries in Mermentau include Health Care & Social Assistance (33 | 22.2%), Accommodation & Food Services (26 | 17.4%), Manufacturing (18 | 12.1%), Retail Trade (15 | 10.1%), and Construction (8 | 5.4%).
Employment Industries by Sex in Mermentau
The Mermentau industries that see more men than women are Mining, Quarrying, & Extraction (100.0%), Construction (100.0%), and Transportation & Warehousing (100.0%), whereas the industries that tend to have a higher number of women are Finance & Insurance (100.0%), Health Care & Social Assistance (100.0%), and Accommodation & Food Services (61.5%).
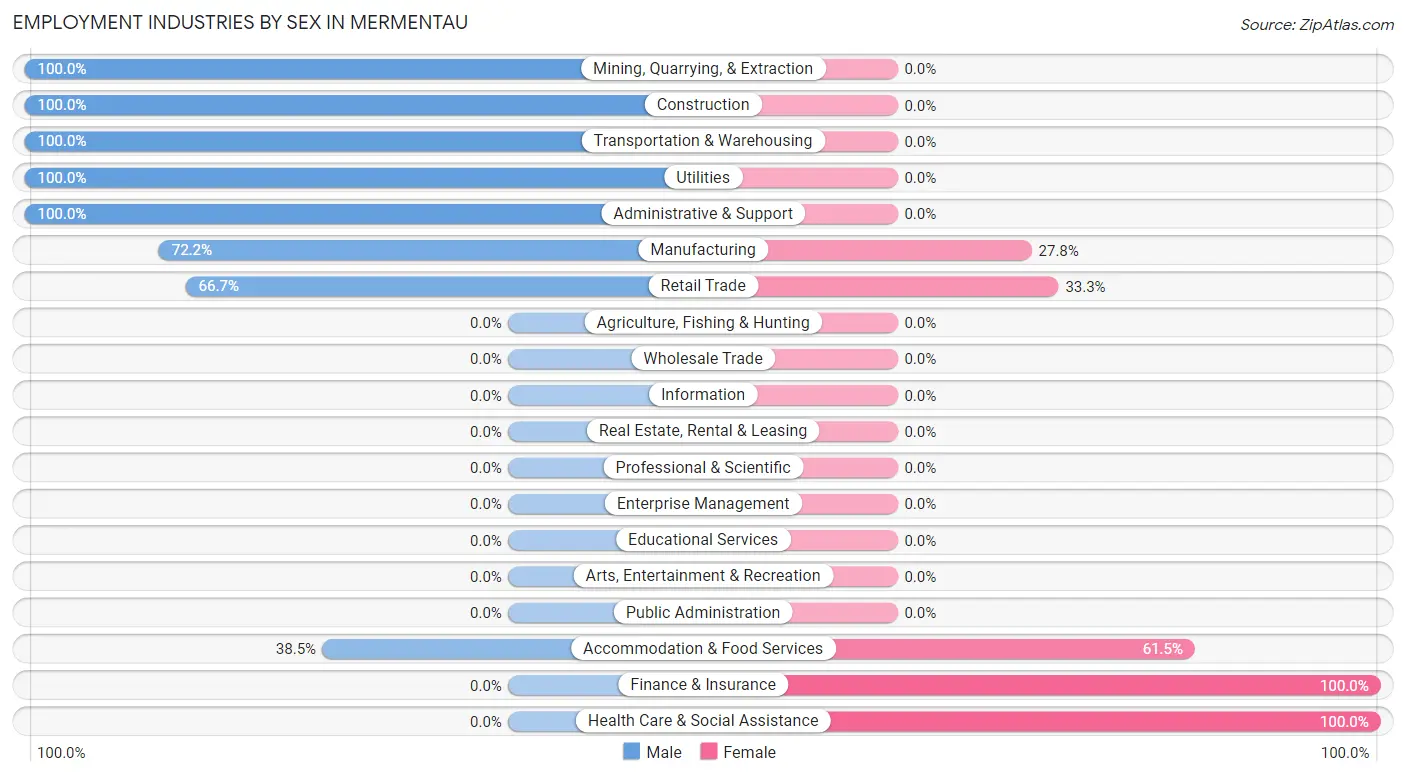
| Industry | Male | Female |
| Agriculture, Fishing & Hunting | 0 (0.0%) | 0 (0.0%) |
| Mining, Quarrying, & Extraction | 7 (100.0%) | 0 (0.0%) |
| Construction | 8 (100.0%) | 0 (0.0%) |
| Manufacturing | 13 (72.2%) | 5 (27.8%) |
| Wholesale Trade | 0 (0.0%) | 0 (0.0%) |
| Retail Trade | 10 (66.7%) | 5 (33.3%) |
| Transportation & Warehousing | 6 (100.0%) | 0 (0.0%) |
| Utilities | 3 (100.0%) | 0 (0.0%) |
| Information | 0 (0.0%) | 0 (0.0%) |
| Finance & Insurance | 0 (0.0%) | 6 (100.0%) |
| Real Estate, Rental & Leasing | 0 (0.0%) | 0 (0.0%) |
| Professional & Scientific | 0 (0.0%) | 0 (0.0%) |
| Enterprise Management | 0 (0.0%) | 0 (0.0%) |
| Administrative & Support | 7 (100.0%) | 0 (0.0%) |
| Educational Services | 0 (0.0%) | 0 (0.0%) |
| Health Care & Social Assistance | 0 (0.0%) | 33 (100.0%) |
| Arts, Entertainment & Recreation | 0 (0.0%) | 0 (0.0%) |
| Accommodation & Food Services | 10 (38.5%) | 16 (61.5%) |
| Public Administration | 0 (0.0%) | 0 (0.0%) |
| Total | 81 (54.4%) | 68 (45.6%) |
Education in Mermentau
School Enrollment in Mermentau
The most common levels of schooling among the 79 students in Mermentau are middle school (27 | 34.2%), college / undergraduate (19 | 24.0%), and high school (15 | 19.0%).
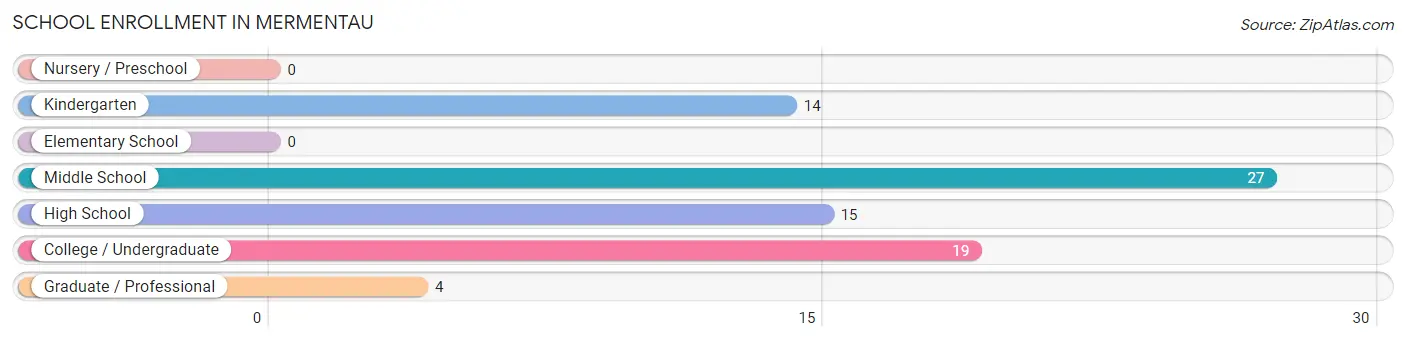
| School Level | # Students | % Students |
| Nursery / Preschool | 0 | 0.0% |
| Kindergarten | 14 | 17.7% |
| Elementary School | 0 | 0.0% |
| Middle School | 27 | 34.2% |
| High School | 15 | 19.0% |
| College / Undergraduate | 19 | 24.0% |
| Graduate / Professional | 4 | 5.1% |
| Total | 79 | 100.0% |
School Enrollment by Age by Funding Source in Mermentau
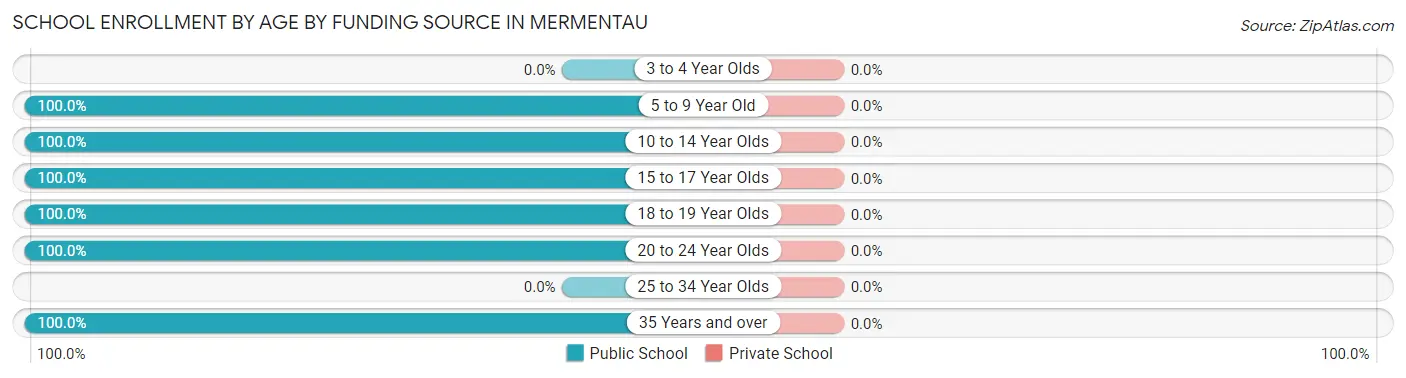
| Age Bracket | Public School | Private School |
| 3 to 4 Year Olds | 0 (0.0%) | 0 (0.0%) |
| 5 to 9 Year Old | 14 (100.0%) | 0 (0.0%) |
| 10 to 14 Year Olds | 27 (100.0%) | 0 (0.0%) |
| 15 to 17 Year Olds | 15 (100.0%) | 0 (0.0%) |
| 18 to 19 Year Olds | 12 (100.0%) | 0 (0.0%) |
| 20 to 24 Year Olds | 4 (100.0%) | 0 (0.0%) |
| 25 to 34 Year Olds | 0 (0.0%) | 0 (0.0%) |
| 35 Years and over | 7 (100.0%) | 0 (0.0%) |
| Total | 79 (100.0%) | 0 (0.0%) |
Educational Attainment by Field of Study in Mermentau
Physical & health sciences (164 | 84.5%), literature & languages (11 | 5.7%), arts & humanities (11 | 5.7%), business (5 | 2.6%), and liberal arts & history (3 | 1.5%) are the most common fields of study among 194 individuals in Mermentau who have obtained a bachelor's degree or higher.
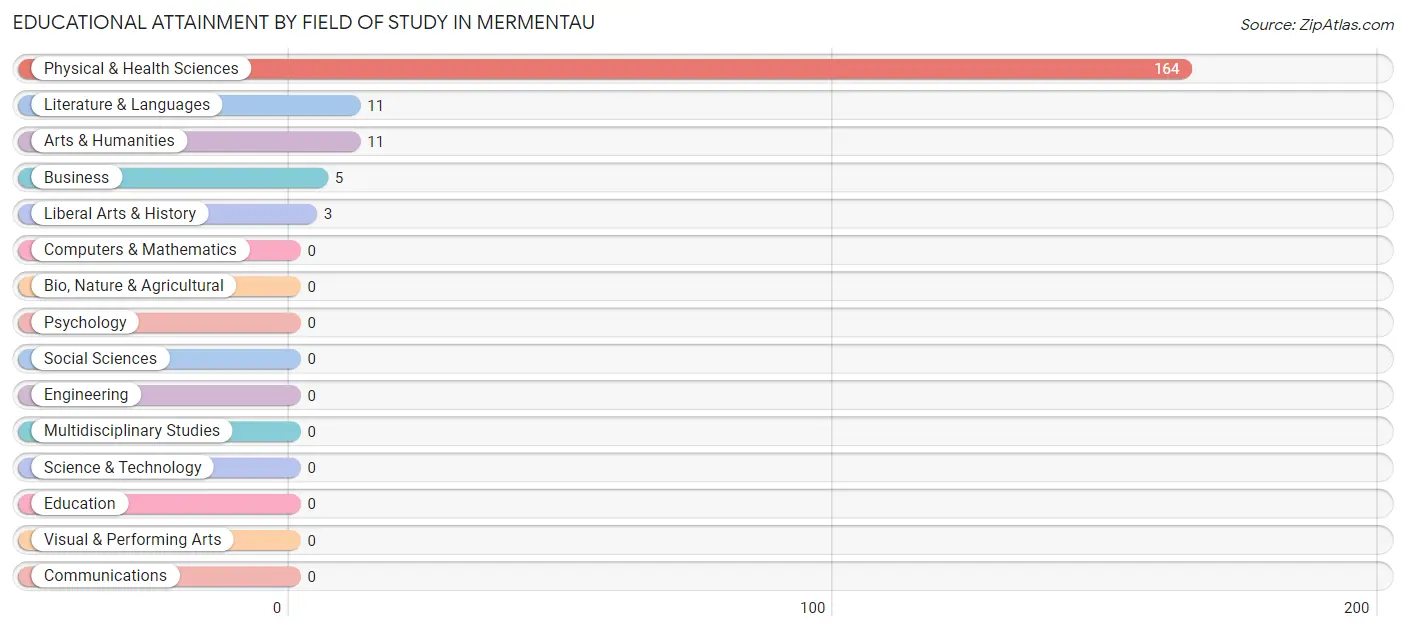
| Field of Study | # Graduates | % Graduates |
| Computers & Mathematics | 0 | 0.0% |
| Bio, Nature & Agricultural | 0 | 0.0% |
| Physical & Health Sciences | 164 | 84.5% |
| Psychology | 0 | 0.0% |
| Social Sciences | 0 | 0.0% |
| Engineering | 0 | 0.0% |
| Multidisciplinary Studies | 0 | 0.0% |
| Science & Technology | 0 | 0.0% |
| Business | 5 | 2.6% |
| Education | 0 | 0.0% |
| Literature & Languages | 11 | 5.7% |
| Liberal Arts & History | 3 | 1.5% |
| Visual & Performing Arts | 0 | 0.0% |
| Communications | 0 | 0.0% |
| Arts & Humanities | 11 | 5.7% |
| Total | 194 | 100.0% |
Transportation & Commute in Mermentau
Vehicle Availability by Sex in Mermentau
The most prevalent vehicle ownership categories in Mermentau are males with 2 vehicles (49, accounting for 60.5%) and females with 2 vehicles (17, making up 72.1%).
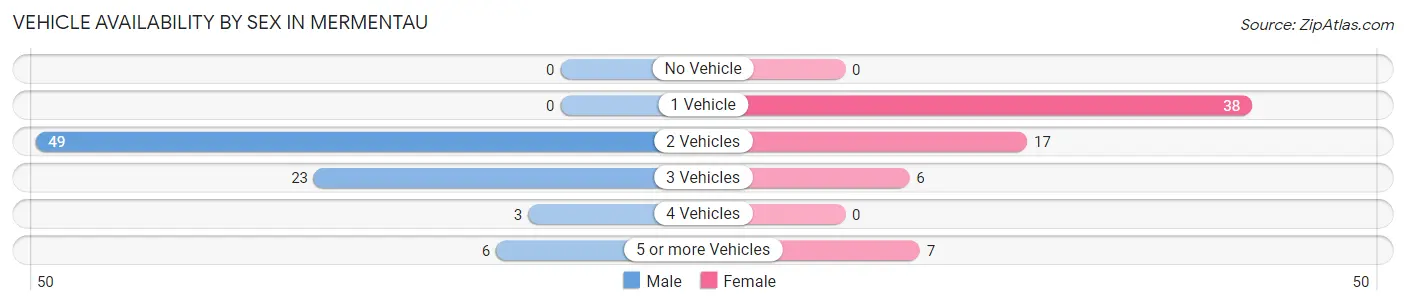
| Vehicles Available | Male | Female |
| No Vehicle | 0 (0.0%) | 0 (0.0%) |
| 1 Vehicle | 0 (0.0%) | 38 (55.9%) |
| 2 Vehicles | 49 (60.5%) | 17 (25.0%) |
| 3 Vehicles | 23 (28.4%) | 6 (8.8%) |
| 4 Vehicles | 3 (3.7%) | 0 (0.0%) |
| 5 or more Vehicles | 6 (7.4%) | 7 (10.3%) |
| Total | 81 (100.0%) | 68 (100.0%) |
Commute Time in Mermentau
The most frequently occuring commute durations in Mermentau are 15 to 19 minutes (51 commuters, 34.2%), 5 to 9 minutes (28 commuters, 18.8%), and 10 to 14 minutes (20 commuters, 13.4%).
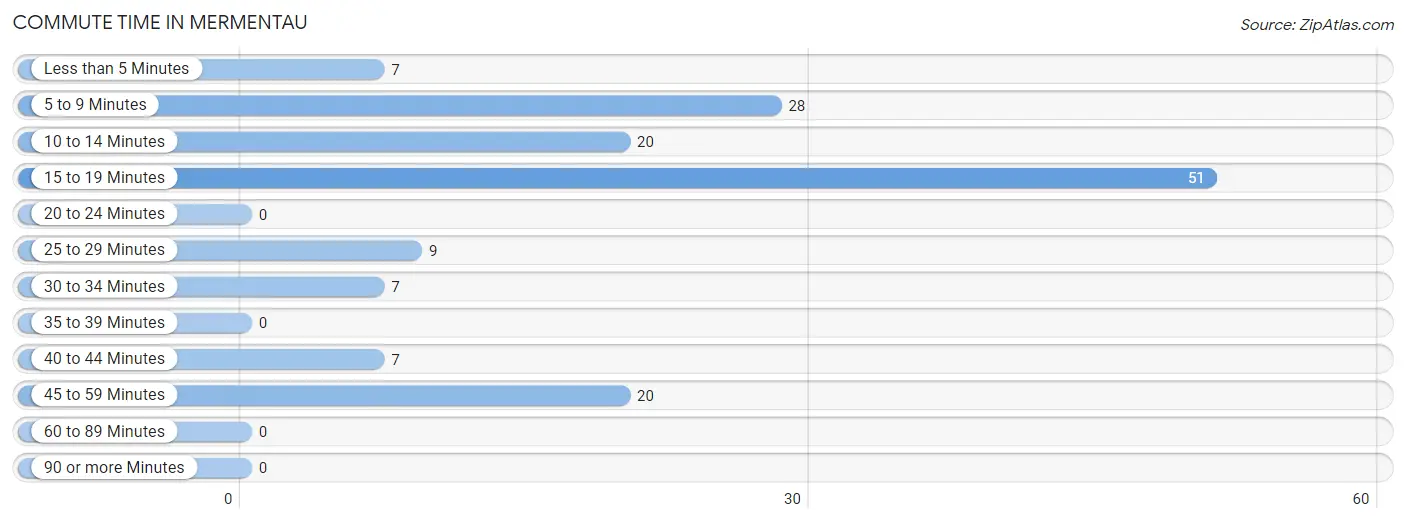
| Commute Time | # Commuters | % Commuters |
| Less than 5 Minutes | 7 | 4.7% |
| 5 to 9 Minutes | 28 | 18.8% |
| 10 to 14 Minutes | 20 | 13.4% |
| 15 to 19 Minutes | 51 | 34.2% |
| 20 to 24 Minutes | 0 | 0.0% |
| 25 to 29 Minutes | 9 | 6.0% |
| 30 to 34 Minutes | 7 | 4.7% |
| 35 to 39 Minutes | 0 | 0.0% |
| 40 to 44 Minutes | 7 | 4.7% |
| 45 to 59 Minutes | 20 | 13.4% |
| 60 to 89 Minutes | 0 | 0.0% |
| 90 or more Minutes | 0 | 0.0% |
Commute Time by Sex in Mermentau
The most common commute times in Mermentau are 15 to 19 minutes (33 commuters, 40.7%) for males and 15 to 19 minutes (18 commuters, 26.5%) for females.
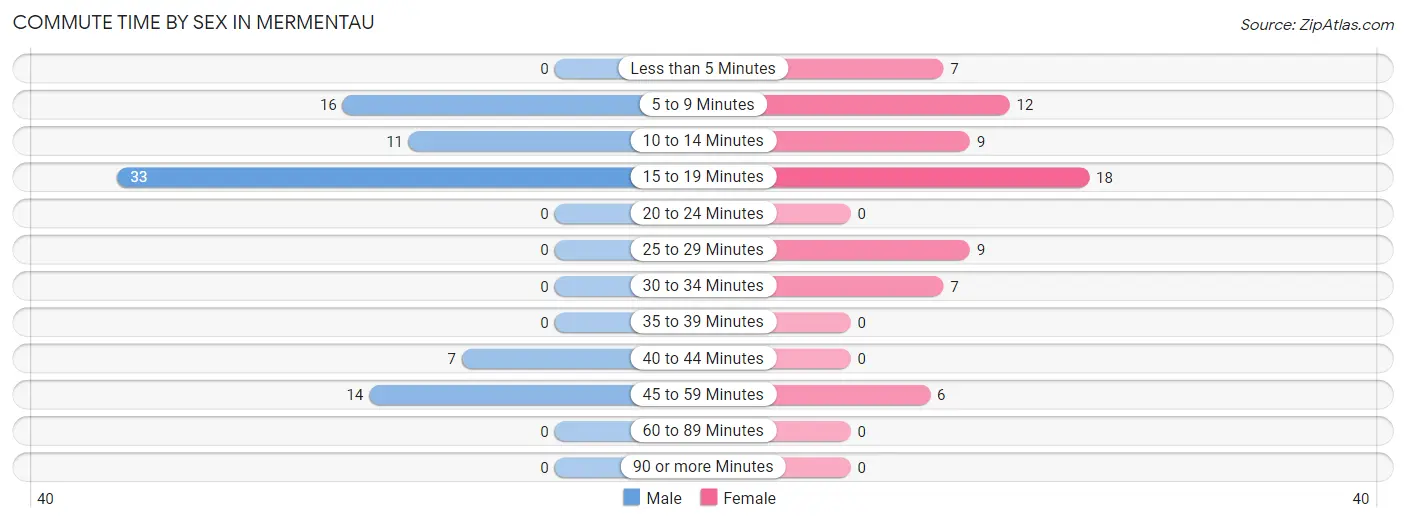
| Commute Time | Male | Female |
| Less than 5 Minutes | 0 (0.0%) | 7 (10.3%) |
| 5 to 9 Minutes | 16 (19.8%) | 12 (17.6%) |
| 10 to 14 Minutes | 11 (13.6%) | 9 (13.2%) |
| 15 to 19 Minutes | 33 (40.7%) | 18 (26.5%) |
| 20 to 24 Minutes | 0 (0.0%) | 0 (0.0%) |
| 25 to 29 Minutes | 0 (0.0%) | 9 (13.2%) |
| 30 to 34 Minutes | 0 (0.0%) | 7 (10.3%) |
| 35 to 39 Minutes | 0 (0.0%) | 0 (0.0%) |
| 40 to 44 Minutes | 7 (8.6%) | 0 (0.0%) |
| 45 to 59 Minutes | 14 (17.3%) | 6 (8.8%) |
| 60 to 89 Minutes | 0 (0.0%) | 0 (0.0%) |
| 90 or more Minutes | 0 (0.0%) | 0 (0.0%) |
Time of Departure to Work by Sex in Mermentau
The most frequent times of departure to work in Mermentau are 5:00 AM to 5:29 AM (23, 28.4%) for males and 5:30 AM to 5:59 AM (22, 32.4%) for females.
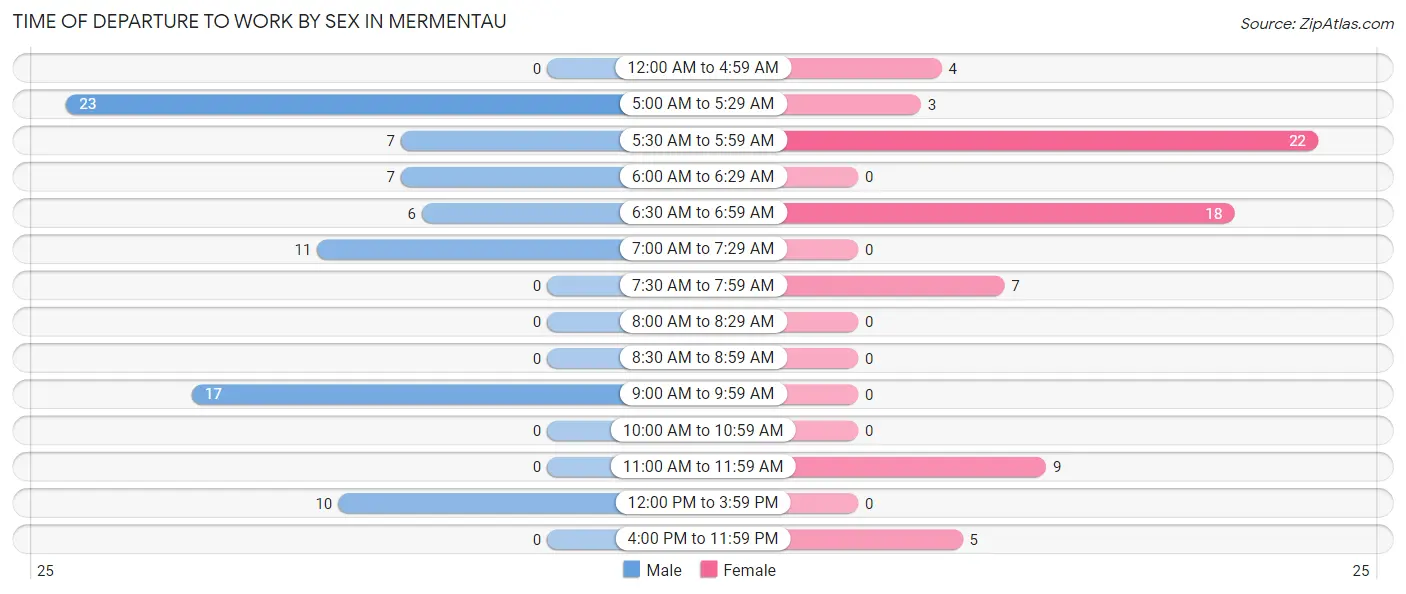
| Time of Departure | Male | Female |
| 12:00 AM to 4:59 AM | 0 (0.0%) | 4 (5.9%) |
| 5:00 AM to 5:29 AM | 23 (28.4%) | 3 (4.4%) |
| 5:30 AM to 5:59 AM | 7 (8.6%) | 22 (32.4%) |
| 6:00 AM to 6:29 AM | 7 (8.6%) | 0 (0.0%) |
| 6:30 AM to 6:59 AM | 6 (7.4%) | 18 (26.5%) |
| 7:00 AM to 7:29 AM | 11 (13.6%) | 0 (0.0%) |
| 7:30 AM to 7:59 AM | 0 (0.0%) | 7 (10.3%) |
| 8:00 AM to 8:29 AM | 0 (0.0%) | 0 (0.0%) |
| 8:30 AM to 8:59 AM | 0 (0.0%) | 0 (0.0%) |
| 9:00 AM to 9:59 AM | 17 (21.0%) | 0 (0.0%) |
| 10:00 AM to 10:59 AM | 0 (0.0%) | 0 (0.0%) |
| 11:00 AM to 11:59 AM | 0 (0.0%) | 9 (13.2%) |
| 12:00 PM to 3:59 PM | 10 (12.3%) | 0 (0.0%) |
| 4:00 PM to 11:59 PM | 0 (0.0%) | 5 (7.3%) |
| Total | 81 (100.0%) | 68 (100.0%) |
Housing Occupancy in Mermentau
Occupancy by Ownership in Mermentau
Of the total 340 dwellings in Mermentau, owner-occupied units account for 259 (76.2%), while renter-occupied units make up 81 (23.8%).
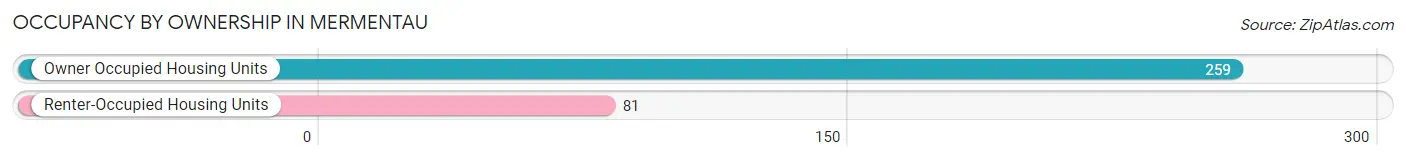
| Occupancy | # Housing Units | % Housing Units |
| Owner Occupied Housing Units | 259 | 76.2% |
| Renter-Occupied Housing Units | 81 | 23.8% |
| Total Occupied Housing Units | 340 | 100.0% |
Occupancy by Household Size in Mermentau
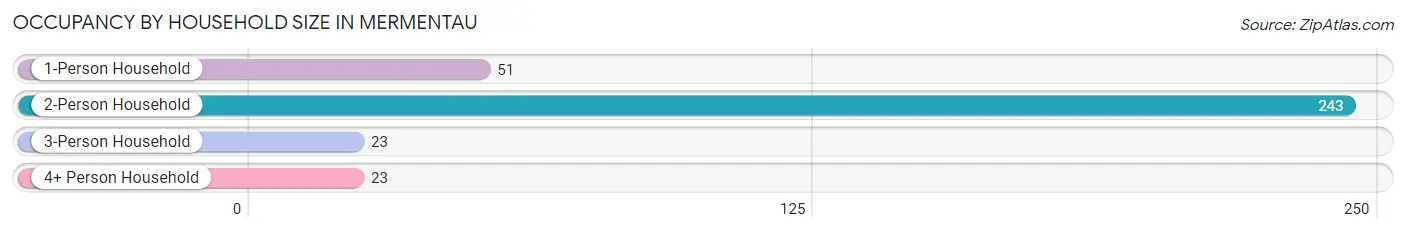
| Household Size | # Housing Units | % Housing Units |
| 1-Person Household | 51 | 15.0% |
| 2-Person Household | 243 | 71.5% |
| 3-Person Household | 23 | 6.8% |
| 4+ Person Household | 23 | 6.8% |
| Total Housing Units | 340 | 100.0% |
Occupancy by Ownership by Household Size in Mermentau
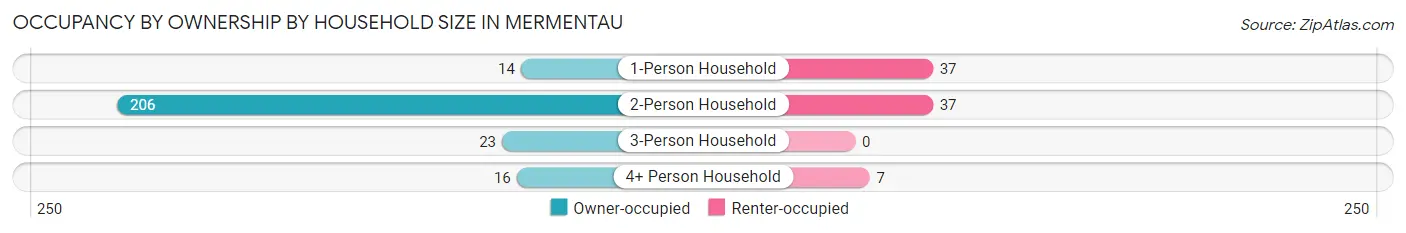
| Household Size | Owner-occupied | Renter-occupied |
| 1-Person Household | 14 (27.5%) | 37 (72.6%) |
| 2-Person Household | 206 (84.8%) | 37 (15.2%) |
| 3-Person Household | 23 (100.0%) | 0 (0.0%) |
| 4+ Person Household | 16 (69.6%) | 7 (30.4%) |
| Total Housing Units | 259 (76.2%) | 81 (23.8%) |
Occupancy by Educational Attainment in Mermentau
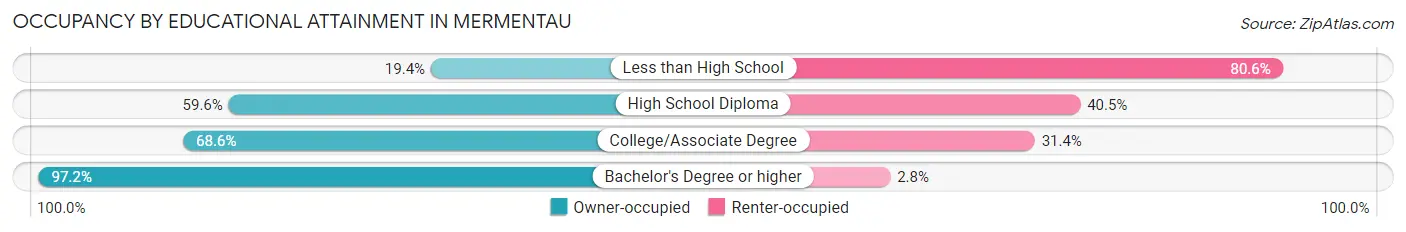
| Household Size | Owner-occupied | Renter-occupied |
| Less than High School | 7 (19.4%) | 29 (80.6%) |
| High School Diploma | 53 (59.6%) | 36 (40.5%) |
| College/Associate Degree | 24 (68.6%) | 11 (31.4%) |
| Bachelor's Degree or higher | 175 (97.2%) | 5 (2.8%) |
Occupancy by Age of Householder in Mermentau
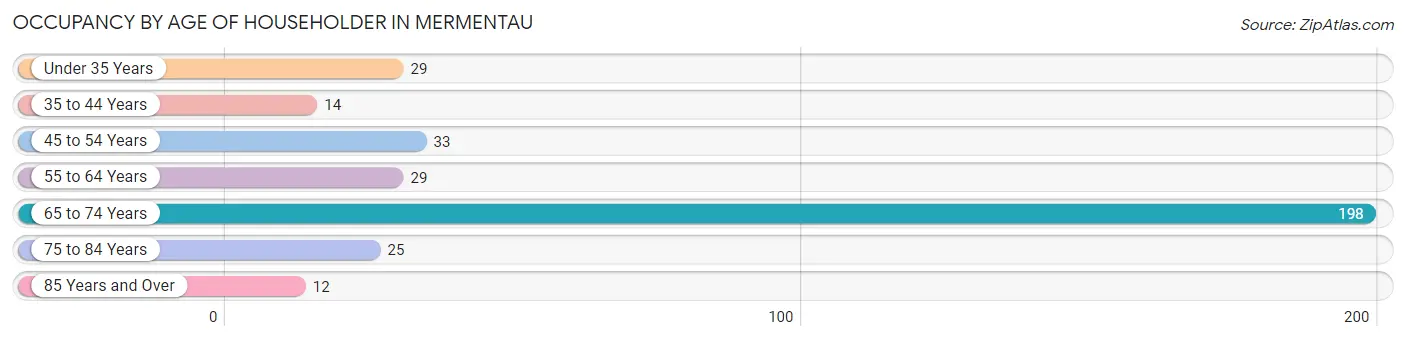
| Age Bracket | # Households | % Households |
| Under 35 Years | 29 | 8.5% |
| 35 to 44 Years | 14 | 4.1% |
| 45 to 54 Years | 33 | 9.7% |
| 55 to 64 Years | 29 | 8.5% |
| 65 to 74 Years | 198 | 58.2% |
| 75 to 84 Years | 25 | 7.3% |
| 85 Years and Over | 12 | 3.5% |
| Total | 340 | 100.0% |
Housing Finances in Mermentau
Median Income by Occupancy in Mermentau
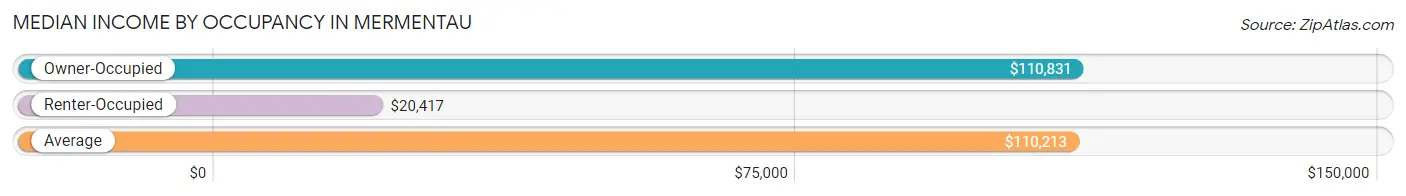
| Occupancy Type | # Households | Median Income |
| Owner-Occupied | 259 (76.2%) | $110,831 |
| Renter-Occupied | 81 (23.8%) | $20,417 |
| Average | 340 (100.0%) | $110,213 |
Occupancy by Householder Income Bracket in Mermentau
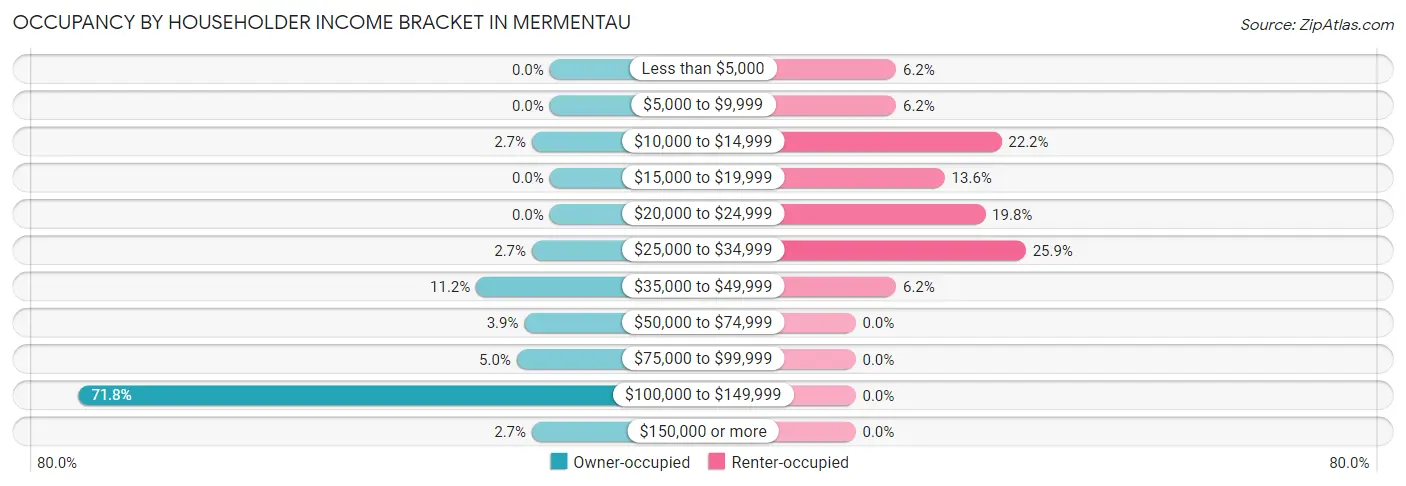
| Income Bracket | Owner-occupied | Renter-occupied |
| Less than $5,000 | 0 (0.0%) | 5 (6.2%) |
| $5,000 to $9,999 | 0 (0.0%) | 5 (6.2%) |
| $10,000 to $14,999 | 7 (2.7%) | 18 (22.2%) |
| $15,000 to $19,999 | 0 (0.0%) | 11 (13.6%) |
| $20,000 to $24,999 | 0 (0.0%) | 16 (19.8%) |
| $25,000 to $34,999 | 7 (2.7%) | 21 (25.9%) |
| $35,000 to $49,999 | 29 (11.2%) | 5 (6.2%) |
| $50,000 to $74,999 | 10 (3.9%) | 0 (0.0%) |
| $75,000 to $99,999 | 13 (5.0%) | 0 (0.0%) |
| $100,000 to $149,999 | 186 (71.8%) | 0 (0.0%) |
| $150,000 or more | 7 (2.7%) | 0 (0.0%) |
| Total | 259 (100.0%) | 81 (100.0%) |
Monthly Housing Cost Tiers in Mermentau
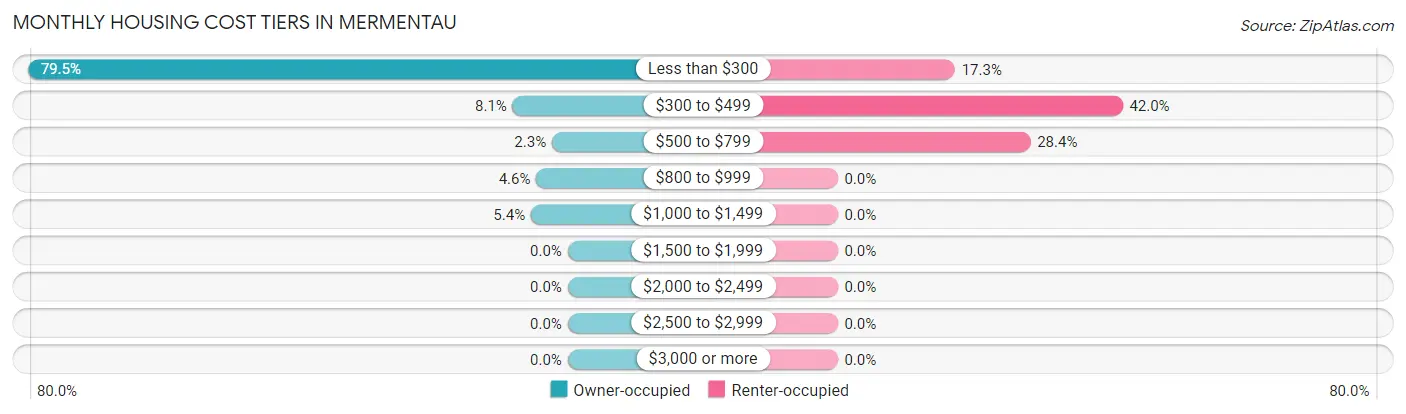
| Monthly Cost | Owner-occupied | Renter-occupied |
| Less than $300 | 206 (79.5%) | 14 (17.3%) |
| $300 to $499 | 21 (8.1%) | 34 (42.0%) |
| $500 to $799 | 6 (2.3%) | 23 (28.4%) |
| $800 to $999 | 12 (4.6%) | 0 (0.0%) |
| $1,000 to $1,499 | 14 (5.4%) | 0 (0.0%) |
| $1,500 to $1,999 | 0 (0.0%) | 0 (0.0%) |
| $2,000 to $2,499 | 0 (0.0%) | 0 (0.0%) |
| $2,500 to $2,999 | 0 (0.0%) | 0 (0.0%) |
| $3,000 or more | 0 (0.0%) | 0 (0.0%) |
| Total | 259 (100.0%) | 81 (100.0%) |
Physical Housing Characteristics in Mermentau
Housing Structures in Mermentau
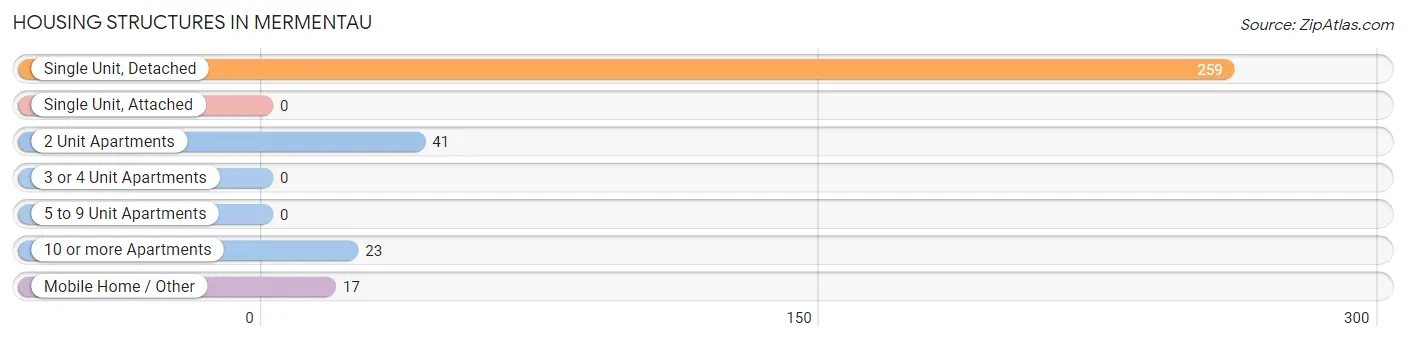
| Structure Type | # Housing Units | % Housing Units |
| Single Unit, Detached | 259 | 76.2% |
| Single Unit, Attached | 0 | 0.0% |
| 2 Unit Apartments | 41 | 12.1% |
| 3 or 4 Unit Apartments | 0 | 0.0% |
| 5 to 9 Unit Apartments | 0 | 0.0% |
| 10 or more Apartments | 23 | 6.8% |
| Mobile Home / Other | 17 | 5.0% |
| Total | 340 | 100.0% |
Housing Structures by Occupancy in Mermentau
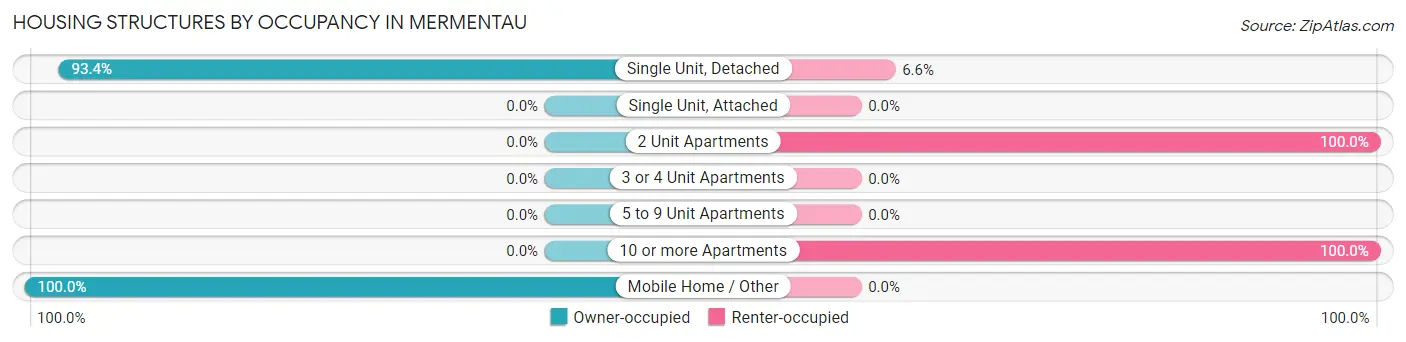
| Structure Type | Owner-occupied | Renter-occupied |
| Single Unit, Detached | 242 (93.4%) | 17 (6.6%) |
| Single Unit, Attached | 0 (0.0%) | 0 (0.0%) |
| 2 Unit Apartments | 0 (0.0%) | 41 (100.0%) |
| 3 or 4 Unit Apartments | 0 (0.0%) | 0 (0.0%) |
| 5 to 9 Unit Apartments | 0 (0.0%) | 0 (0.0%) |
| 10 or more Apartments | 0 (0.0%) | 23 (100.0%) |
| Mobile Home / Other | 17 (100.0%) | 0 (0.0%) |
| Total | 259 (76.2%) | 81 (23.8%) |
Housing Structures by Number of Rooms in Mermentau
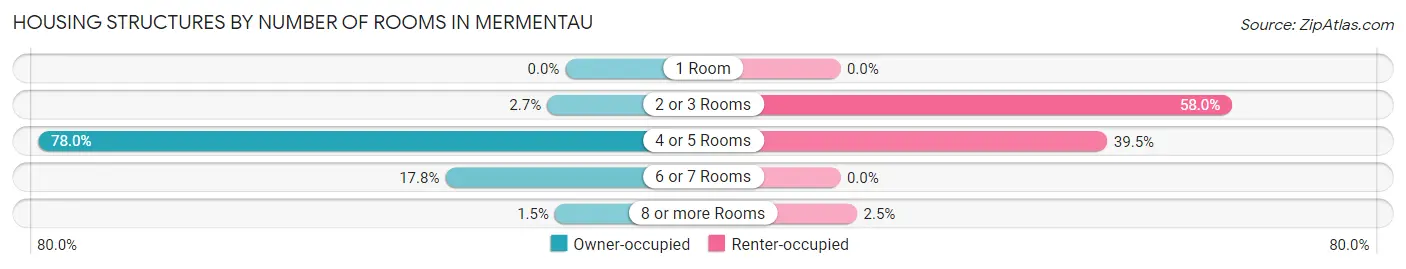
| Number of Rooms | Owner-occupied | Renter-occupied |
| 1 Room | 0 (0.0%) | 0 (0.0%) |
| 2 or 3 Rooms | 7 (2.7%) | 47 (58.0%) |
| 4 or 5 Rooms | 202 (78.0%) | 32 (39.5%) |
| 6 or 7 Rooms | 46 (17.8%) | 0 (0.0%) |
| 8 or more Rooms | 4 (1.5%) | 2 (2.5%) |
| Total | 259 (100.0%) | 81 (100.0%) |
Housing Structure by Heating Type in Mermentau
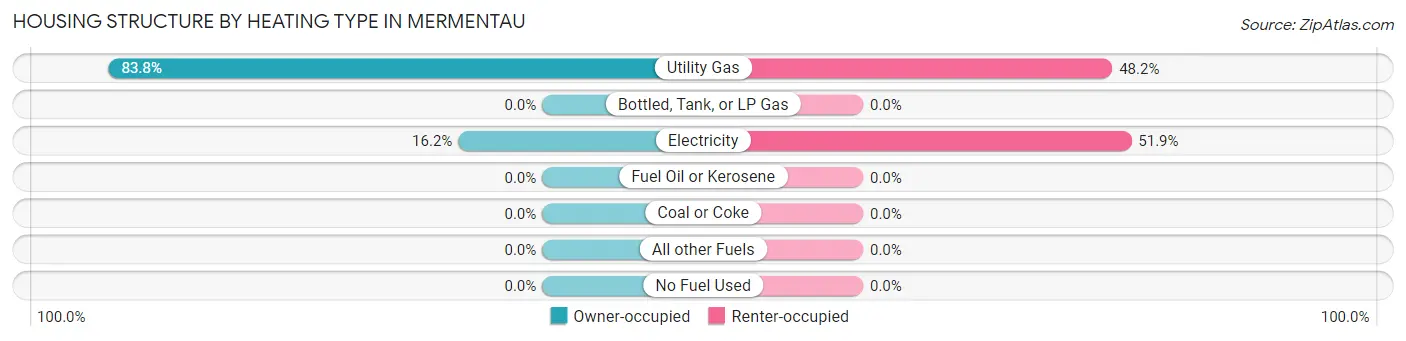
| Heating Type | Owner-occupied | Renter-occupied |
| Utility Gas | 217 (83.8%) | 39 (48.1%) |
| Bottled, Tank, or LP Gas | 0 (0.0%) | 0 (0.0%) |
| Electricity | 42 (16.2%) | 42 (51.8%) |
| Fuel Oil or Kerosene | 0 (0.0%) | 0 (0.0%) |
| Coal or Coke | 0 (0.0%) | 0 (0.0%) |
| All other Fuels | 0 (0.0%) | 0 (0.0%) |
| No Fuel Used | 0 (0.0%) | 0 (0.0%) |
| Total | 259 (100.0%) | 81 (100.0%) |
Household Vehicle Usage in Mermentau
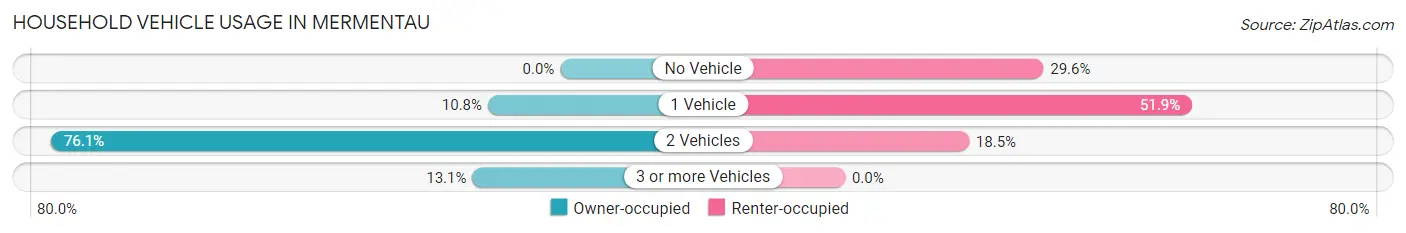
| Vehicles per Household | Owner-occupied | Renter-occupied |
| No Vehicle | 0 (0.0%) | 24 (29.6%) |
| 1 Vehicle | 28 (10.8%) | 42 (51.8%) |
| 2 Vehicles | 197 (76.1%) | 15 (18.5%) |
| 3 or more Vehicles | 34 (13.1%) | 0 (0.0%) |
| Total | 259 (100.0%) | 81 (100.0%) |
Real Estate & Mortgages in Mermentau
Real Estate and Mortgage Overview in Mermentau
| Characteristic | Without Mortgage | With Mortgage |
| Housing Units | 236 | 23 |
| Median Property Value | $56,500 | $95,000 |
| Median Household Income | $110,899 | $7 |
| Monthly Housing Costs | $228 | $0 |
| Real Estate Taxes | $199 | $9 |
Property Value by Mortgage Status in Mermentau
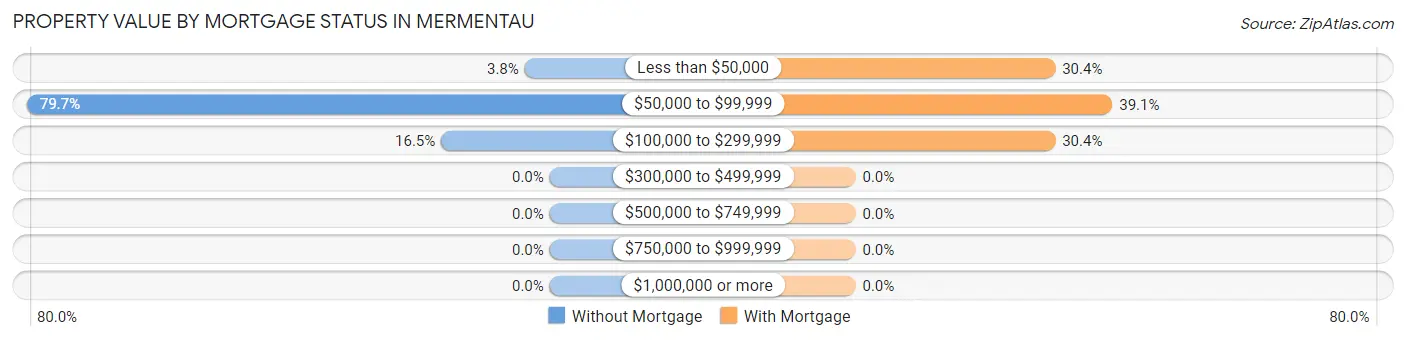
| Property Value | Without Mortgage | With Mortgage |
| Less than $50,000 | 9 (3.8%) | 7 (30.4%) |
| $50,000 to $99,999 | 188 (79.7%) | 9 (39.1%) |
| $100,000 to $299,999 | 39 (16.5%) | 7 (30.4%) |
| $300,000 to $499,999 | 0 (0.0%) | 0 (0.0%) |
| $500,000 to $749,999 | 0 (0.0%) | 0 (0.0%) |
| $750,000 to $999,999 | 0 (0.0%) | 0 (0.0%) |
| $1,000,000 or more | 0 (0.0%) | 0 (0.0%) |
| Total | 236 (100.0%) | 23 (100.0%) |
Household Income by Mortgage Status in Mermentau
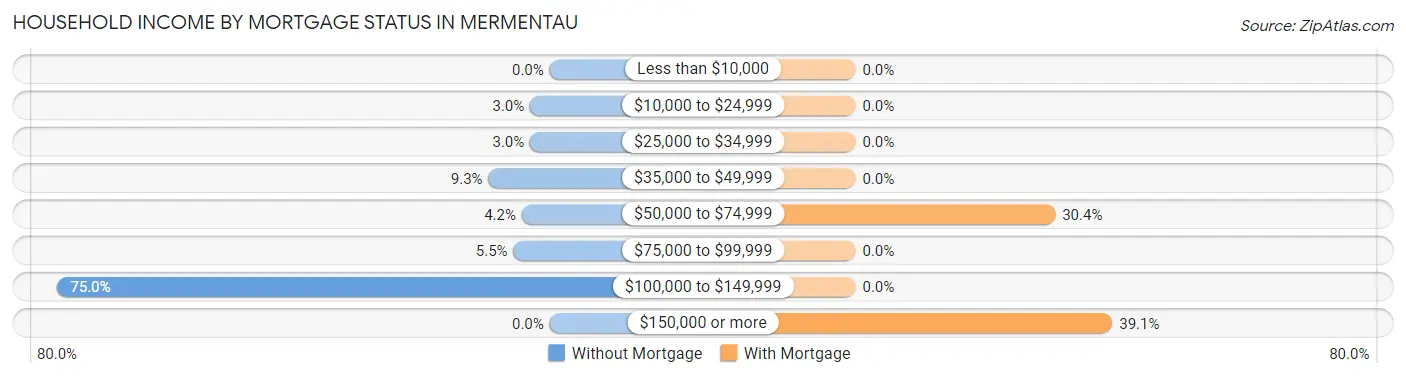
| Household Income | Without Mortgage | With Mortgage |
| Less than $10,000 | 0 (0.0%) | 0 (0.0%) |
| $10,000 to $24,999 | 7 (3.0%) | 0 (0.0%) |
| $25,000 to $34,999 | 7 (3.0%) | 0 (0.0%) |
| $35,000 to $49,999 | 22 (9.3%) | 0 (0.0%) |
| $50,000 to $74,999 | 10 (4.2%) | 7 (30.4%) |
| $75,000 to $99,999 | 13 (5.5%) | 0 (0.0%) |
| $100,000 to $149,999 | 177 (75.0%) | 0 (0.0%) |
| $150,000 or more | 0 (0.0%) | 9 (39.1%) |
| Total | 236 (100.0%) | 23 (100.0%) |
Property Value to Household Income Ratio in Mermentau
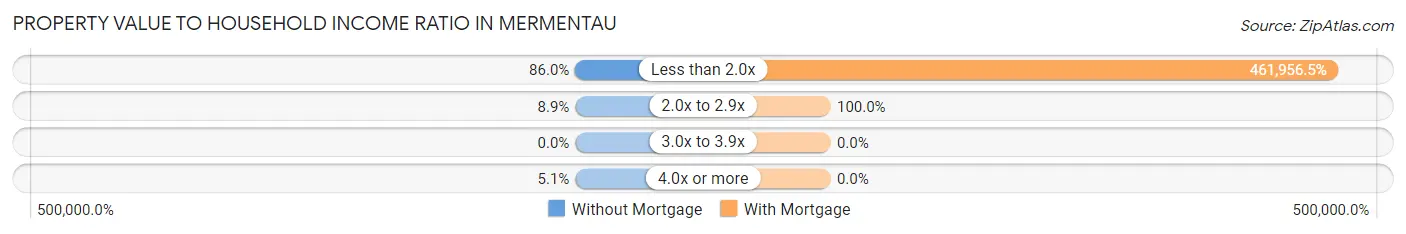
| Value-to-Income Ratio | Without Mortgage | With Mortgage |
| Less than 2.0x | 203 (86.0%) | 106,250 (461,956.5%) |
| 2.0x to 2.9x | 21 (8.9%) | 23 (100.0%) |
| 3.0x to 3.9x | 0 (0.0%) | 0 (0.0%) |
| 4.0x or more | 12 (5.1%) | 0 (0.0%) |
| Total | 236 (100.0%) | 23 (100.0%) |
Real Estate Taxes by Mortgage Status in Mermentau
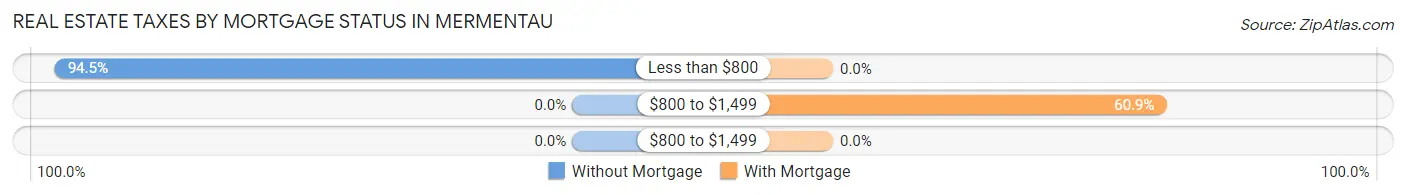
| Property Taxes | Without Mortgage | With Mortgage |
| Less than $800 | 223 (94.5%) | 0 (0.0%) |
| $800 to $1,499 | 0 (0.0%) | 14 (60.9%) |
| $800 to $1,499 | 0 (0.0%) | 0 (0.0%) |
| Total | 236 (100.0%) | 23 (100.0%) |
Health & Disability in Mermentau
Health Insurance Coverage by Age in Mermentau
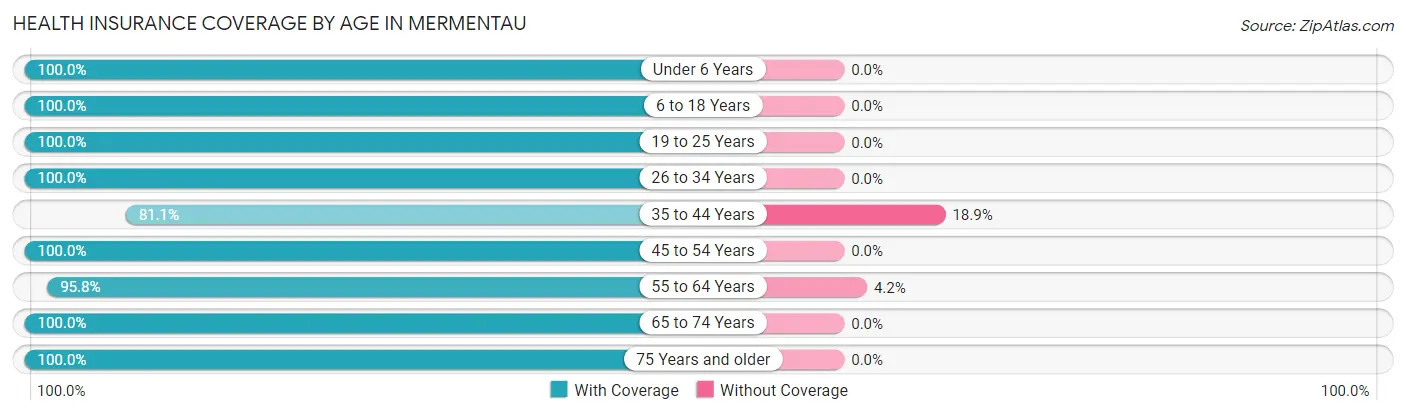
| Age Bracket | With Coverage | Without Coverage |
| Under 6 Years | 16 (100.0%) | 0 (0.0%) |
| 6 to 18 Years | 80 (100.0%) | 0 (0.0%) |
| 19 to 25 Years | 32 (100.0%) | 0 (0.0%) |
| 26 to 34 Years | 43 (100.0%) | 0 (0.0%) |
| 35 to 44 Years | 43 (81.1%) | 10 (18.9%) |
| 45 to 54 Years | 54 (100.0%) | 0 (0.0%) |
| 55 to 64 Years | 68 (95.8%) | 3 (4.2%) |
| 65 to 74 Years | 255 (100.0%) | 0 (0.0%) |
| 75 Years and older | 40 (100.0%) | 0 (0.0%) |
| Total | 631 (98.0%) | 13 (2.0%) |
Health Insurance Coverage by Citizenship Status in Mermentau
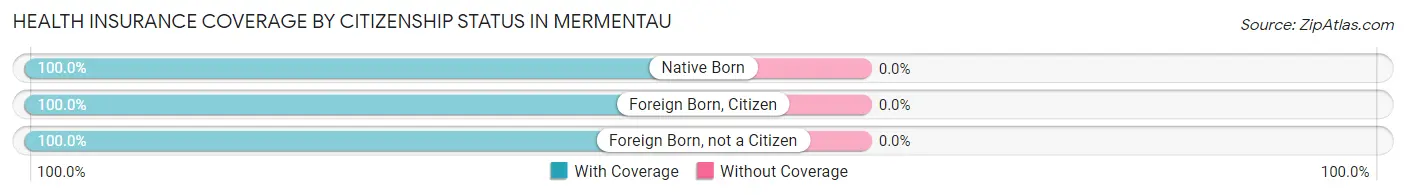
| Citizenship Status | With Coverage | Without Coverage |
| Native Born | 16 (100.0%) | 0 (0.0%) |
| Foreign Born, Citizen | 80 (100.0%) | 0 (0.0%) |
| Foreign Born, not a Citizen | 32 (100.0%) | 0 (0.0%) |
Health Insurance Coverage by Household Income in Mermentau
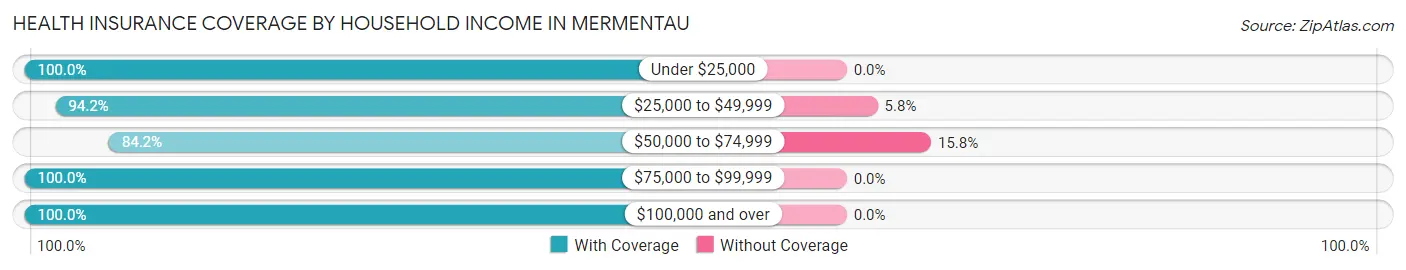
| Household Income | With Coverage | Without Coverage |
| Under $25,000 | 113 (100.0%) | 0 (0.0%) |
| $25,000 to $49,999 | 163 (94.2%) | 10 (5.8%) |
| $50,000 to $74,999 | 16 (84.2%) | 3 (15.8%) |
| $75,000 to $99,999 | 32 (100.0%) | 0 (0.0%) |
| $100,000 and over | 307 (100.0%) | 0 (0.0%) |
Public vs Private Health Insurance Coverage by Age in Mermentau
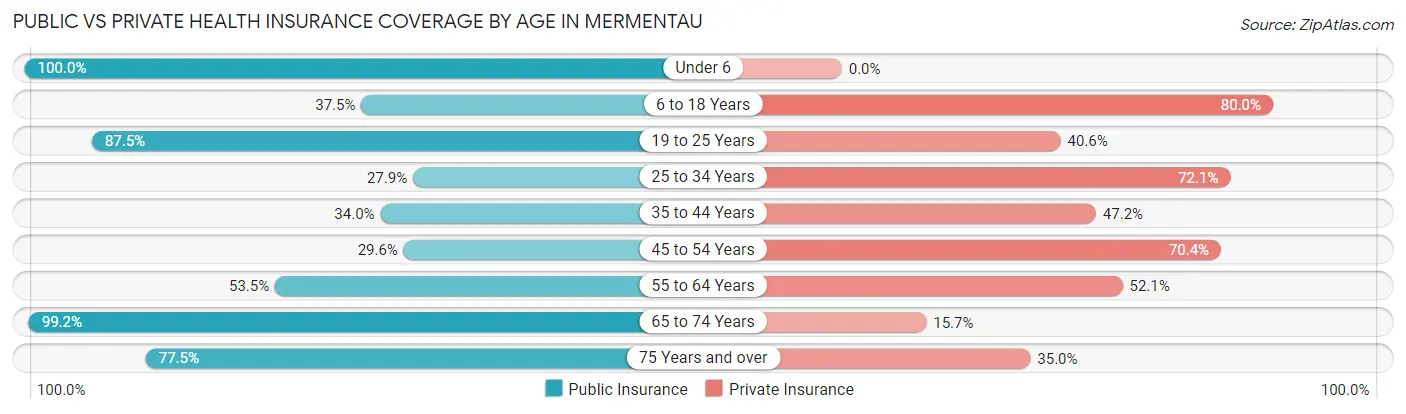
| Age Bracket | Public Insurance | Private Insurance |
| Under 6 | 16 (100.0%) | 0 (0.0%) |
| 6 to 18 Years | 30 (37.5%) | 64 (80.0%) |
| 19 to 25 Years | 28 (87.5%) | 13 (40.6%) |
| 25 to 34 Years | 12 (27.9%) | 31 (72.1%) |
| 35 to 44 Years | 18 (34.0%) | 25 (47.2%) |
| 45 to 54 Years | 16 (29.6%) | 38 (70.4%) |
| 55 to 64 Years | 38 (53.5%) | 37 (52.1%) |
| 65 to 74 Years | 253 (99.2%) | 40 (15.7%) |
| 75 Years and over | 31 (77.5%) | 14 (35.0%) |
| Total | 442 (68.6%) | 262 (40.7%) |
Disability Status by Sex by Age in Mermentau
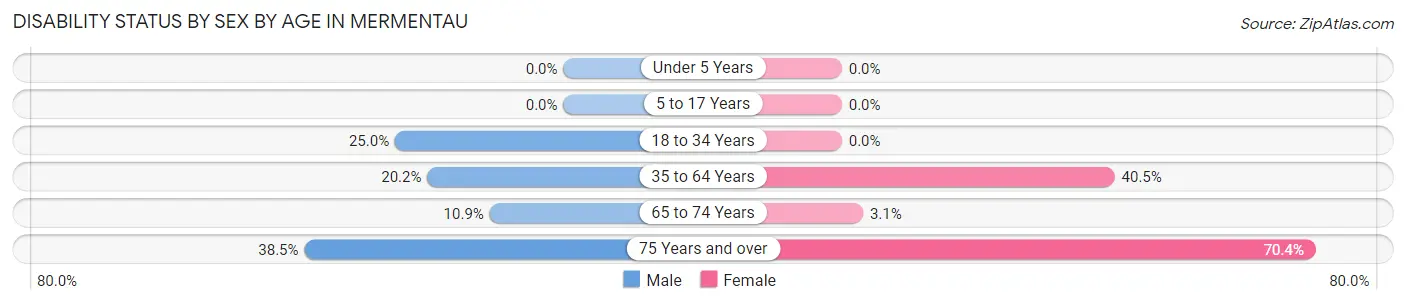
| Age Bracket | Male | Female |
| Under 5 Years | 0 (0.0%) | 0 (0.0%) |
| 5 to 17 Years | 0 (0.0%) | 0 (0.0%) |
| 18 to 34 Years | 7 (25.0%) | 0 (0.0%) |
| 35 to 64 Years | 20 (20.2%) | 32 (40.5%) |
| 65 to 74 Years | 7 (10.9%) | 6 (3.1%) |
| 75 Years and over | 5 (38.5%) | 19 (70.4%) |
Disability Class by Sex by Age in Mermentau
Disability Class: Hearing Difficulty
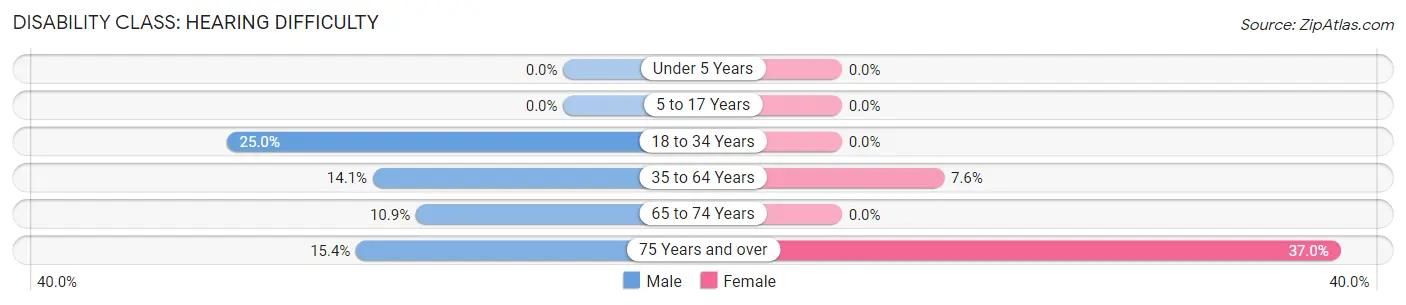
| Age Bracket | Male | Female |
| Under 5 Years | 0 (0.0%) | 0 (0.0%) |
| 5 to 17 Years | 0 (0.0%) | 0 (0.0%) |
| 18 to 34 Years | 7 (25.0%) | 0 (0.0%) |
| 35 to 64 Years | 14 (14.1%) | 6 (7.6%) |
| 65 to 74 Years | 7 (10.9%) | 0 (0.0%) |
| 75 Years and over | 2 (15.4%) | 10 (37.0%) |
Disability Class: Vision Difficulty
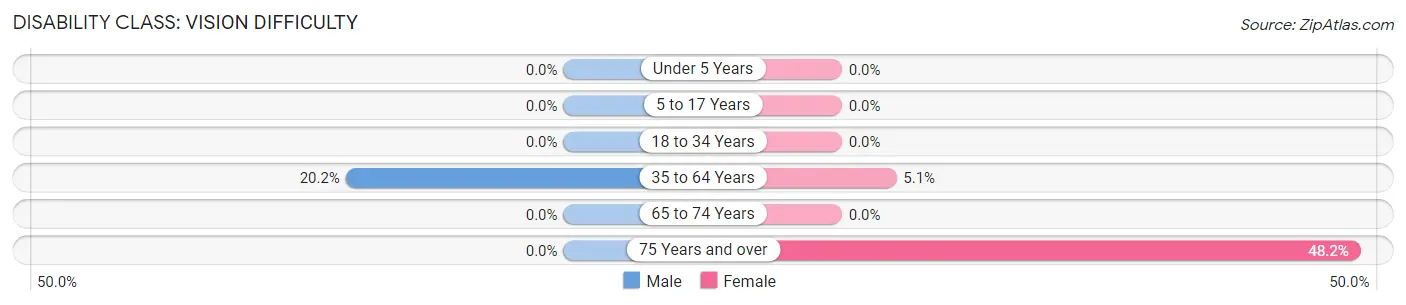
| Age Bracket | Male | Female |
| Under 5 Years | 0 (0.0%) | 0 (0.0%) |
| 5 to 17 Years | 0 (0.0%) | 0 (0.0%) |
| 18 to 34 Years | 0 (0.0%) | 0 (0.0%) |
| 35 to 64 Years | 20 (20.2%) | 4 (5.1%) |
| 65 to 74 Years | 0 (0.0%) | 0 (0.0%) |
| 75 Years and over | 0 (0.0%) | 13 (48.1%) |
Disability Class: Cognitive Difficulty
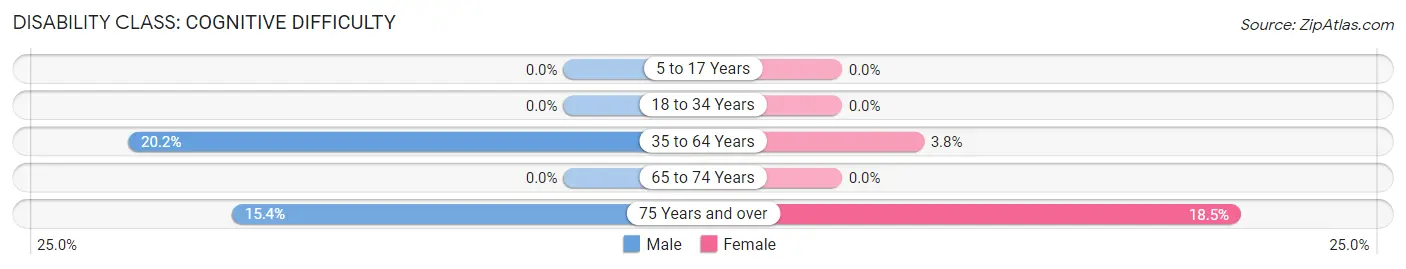
| Age Bracket | Male | Female |
| 5 to 17 Years | 0 (0.0%) | 0 (0.0%) |
| 18 to 34 Years | 0 (0.0%) | 0 (0.0%) |
| 35 to 64 Years | 20 (20.2%) | 3 (3.8%) |
| 65 to 74 Years | 0 (0.0%) | 0 (0.0%) |
| 75 Years and over | 2 (15.4%) | 5 (18.5%) |
Disability Class: Ambulatory Difficulty
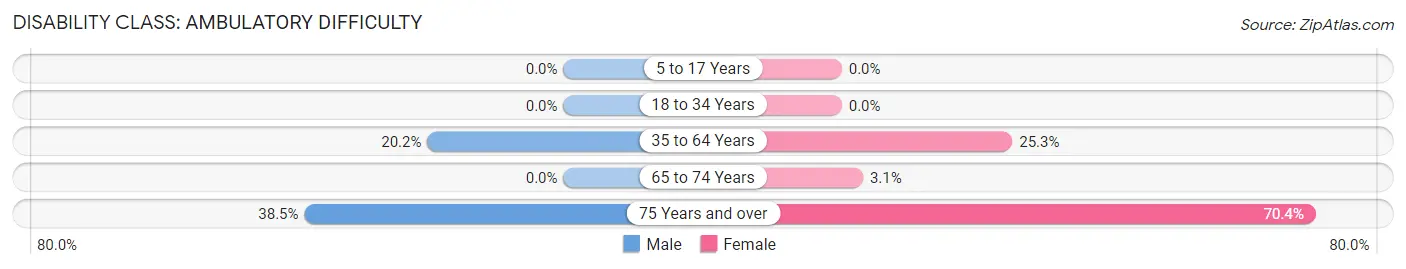
| Age Bracket | Male | Female |
| 5 to 17 Years | 0 (0.0%) | 0 (0.0%) |
| 18 to 34 Years | 0 (0.0%) | 0 (0.0%) |
| 35 to 64 Years | 20 (20.2%) | 20 (25.3%) |
| 65 to 74 Years | 0 (0.0%) | 6 (3.1%) |
| 75 Years and over | 5 (38.5%) | 19 (70.4%) |
Disability Class: Self-Care Difficulty
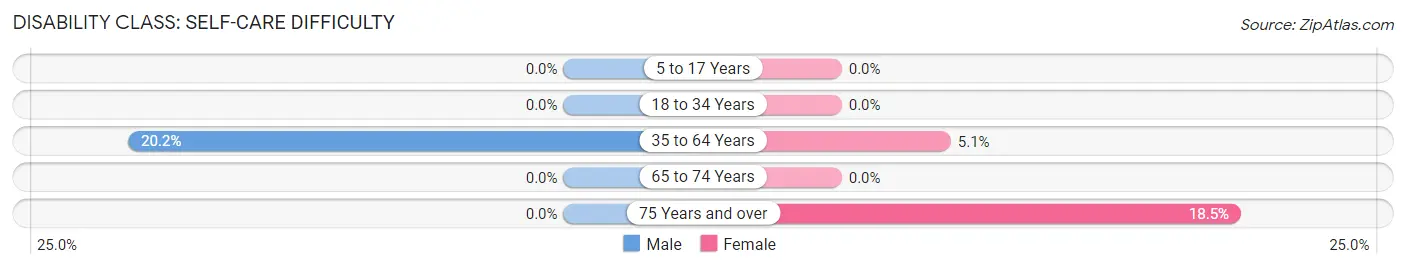
| Age Bracket | Male | Female |
| 5 to 17 Years | 0 (0.0%) | 0 (0.0%) |
| 18 to 34 Years | 0 (0.0%) | 0 (0.0%) |
| 35 to 64 Years | 20 (20.2%) | 4 (5.1%) |
| 65 to 74 Years | 0 (0.0%) | 0 (0.0%) |
| 75 Years and over | 0 (0.0%) | 5 (18.5%) |
Technology Access in Mermentau
Computing Device Access in Mermentau
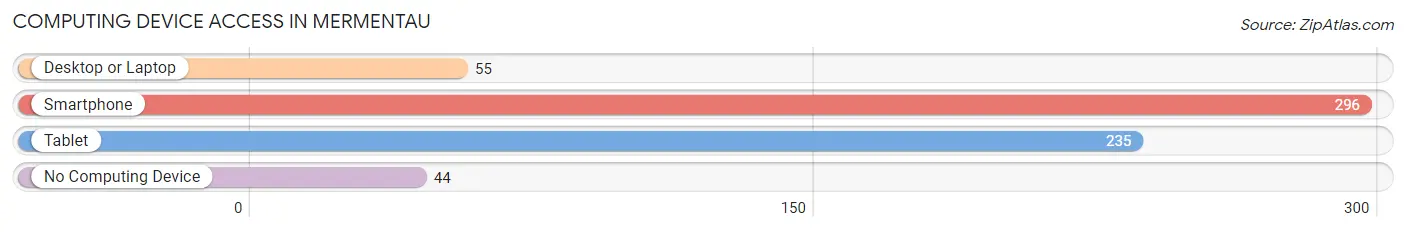
| Device Type | # Households | % Households |
| Desktop or Laptop | 55 | 16.2% |
| Smartphone | 296 | 87.1% |
| Tablet | 235 | 69.1% |
| No Computing Device | 44 | 12.9% |
| Total | 340 | 100.0% |
Internet Access in Mermentau
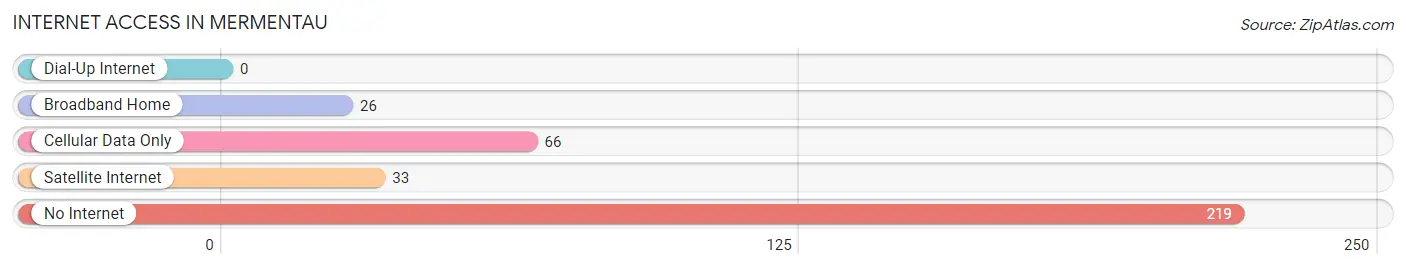
| Internet Type | # Households | % Households |
| Dial-Up Internet | 0 | 0.0% |
| Broadband Home | 26 | 7.6% |
| Cellular Data Only | 66 | 19.4% |
| Satellite Internet | 33 | 9.7% |
| No Internet | 219 | 64.4% |
| Total | 340 | 100.0% |
Mermentau Summary
Mermentau is a small town located in the southwestern part of Louisiana, in the United States. It is situated in the parish of Acadia, and is part of the larger Lafayette metropolitan area. The town has a population of around 1,000 people, and is known for its rich history and culture.
History
The area that is now Mermentau was first settled by the Attakapas Indians in the late 1700s. The town was officially founded in 1845, when a group of French settlers arrived in the area. The town was named after the nearby Mermentau River, which was named after the Attakapas chief, Mermentau.
The town grew slowly over the years, and by the early 1900s, it had become a thriving agricultural community. The town was home to several cotton plantations, as well as a number of small businesses.
In the 1950s, the town began to experience a decline in population, as many of its residents moved away in search of better opportunities. However, in recent years, the town has seen a resurgence in population, as more people have moved to the area in search of a quieter, more rural lifestyle.
Geography
Mermentau is located in the southwestern part of Louisiana, in the United States. It is situated in the parish of Acadia, and is part of the larger Lafayette metropolitan area. The town is located on the banks of the Mermentau River, and is surrounded by swampland and marshland.
The town has a total area of 1.2 square miles, all of which is land. The town is located at an elevation of 28 feet above sea level.
Economy
The economy of Mermentau is largely based on agriculture. The town is home to several cotton plantations, as well as a number of small businesses. The town also has a number of restaurants and shops, which cater to both locals and tourists.
The town is also home to a number of small manufacturing companies, which produce a variety of products, including furniture, clothing, and electronics.
Demographics
As of the 2010 census, the population of Mermentau was 1,000 people. The town has a population density of 833 people per square mile. The racial makeup of the town is 79.2% White, 17.2% African American, 0.7% Native American, 0.3% Asian, and 2.6% from other races.
The median household income in Mermentau is $31,250, and the median family income is $37,500. The town has a poverty rate of 22.2%.
Conclusion
Mermentau is a small town located in the southwestern part of Louisiana, in the United States. It is situated in the parish of Acadia, and is part of the larger Lafayette metropolitan area. The town has a population of around 1,000 people, and is known for its rich history and culture. The economy of Mermentau is largely based on agriculture, and the town is home to several cotton plantations, as well as a number of small businesses. The racial makeup of the town is 79.2% White, 17.2% African American, 0.7% Native American, 0.3% Asian, and 2.6% from other races. The median household income in Mermentau is $31,250, and the median family income is $37,500. The town has a poverty rate of 22.2%.
Common Questions
What is Per Capita Income in Mermentau?
Per Capita income in Mermentau is $25,887.
What is the Median Family Income in Mermentau?
Median Family Income in Mermentau is $110,694.
What is the Median Household income in Mermentau?
Median Household Income in Mermentau is $110,213.
What is Income or Wage Gap in Mermentau?
Income or Wage Gap in Mermentau is 17.2%.
Women in Mermentau earn 82.8 cents for every dollar earned by a man.
What is Inequality or Gini Index in Mermentau?
Inequality or Gini Index in Mermentau is 0.28.
What is the Total Population of Mermentau?
Total Population of Mermentau is 644.
What is the Total Male Population of Mermentau?
Total Male Population of Mermentau is 241.
What is the Total Female Population of Mermentau?
Total Female Population of Mermentau is 403.
What is the Ratio of Males per 100 Females in Mermentau?
There are 59.80 Males per 100 Females in Mermentau.
What is the Ratio of Females per 100 Males in Mermentau?
There are 167.22 Females per 100 Males in Mermentau.
What is the Median Population Age in Mermentau?
Median Population Age in Mermentau is 62.6 Years.
What is the Average Family Size in Mermentau
Average Family Size in Mermentau is 2.0 People.
What is the Average Household Size in Mermentau
Average Household Size in Mermentau is 1.9 People.
How Large is the Labor Force in Mermentau?
There are 149 People in the Labor Forcein in Mermentau.
What is the Percentage of People in the Labor Force in Mermentau?
25.6% of People are in the Labor Force in Mermentau.