Patterson, LA Map & Demographics
Patterson Map
Patterson Overview
$20,229
PER CAPITA INCOME
$54,375
AVG FAMILY INCOME
$46,189
AVG HOUSEHOLD INCOME
49.0%
WAGE / INCOME GAP [ % ]
51.0¢/ $1
WAGE / INCOME GAP [ $ ]
0.46
INEQUALITY / GINI INDEX
5,868
TOTAL POPULATION
2,661
MALE POPULATION
3,207
FEMALE POPULATION
82.97
MALES / 100 FEMALES
120.52
FEMALES / 100 MALES
31.9
MEDIAN AGE
3.9
AVG FAMILY SIZE
3.0
AVG HOUSEHOLD SIZE
2,292
LABOR FORCE [ PEOPLE ]
54.5%
PERCENT IN LABOR FORCE
2.4%
UNEMPLOYMENT RATE
Patterson Zip Codes
Income in Patterson
Income Overview in Patterson
Per Capita Income in Patterson is $20,229, while median incomes of families and households are $54,375 and $46,189 respectively.
| Characteristic | Number | Measure |
| Per Capita Income | 5,868 | $20,229 |
| Median Family Income | 1,265 | $54,375 |
| Mean Family Income | 1,265 | $74,223 |
| Median Household Income | 1,939 | $46,189 |
| Mean Household Income | 1,939 | $62,629 |
| Income Deficit | 1,265 | $0 |
| Wage / Income Gap (%) | 5,868 | 48.96% |
| Wage / Income Gap ($) | 5,868 | 51.04¢ per $1 |
| Gini / Inequality Index | 5,868 | 0.46 |
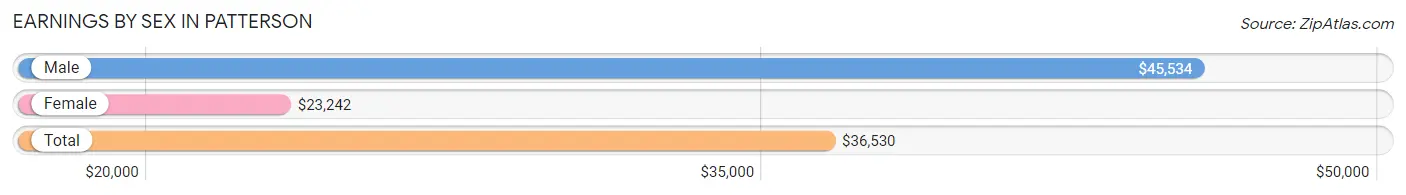
Earnings by Sex in Patterson
Average Earnings in Patterson are $36,530, $45,534 for men and $23,242 for women, a difference of 49.0%.
| Sex | Number | Average Earnings |
| Male | 1,196 (51.4%) | $45,534 |
| Female | 1,131 (48.6%) | $23,242 |
| Total | 2,327 (100.0%) | $36,530 |
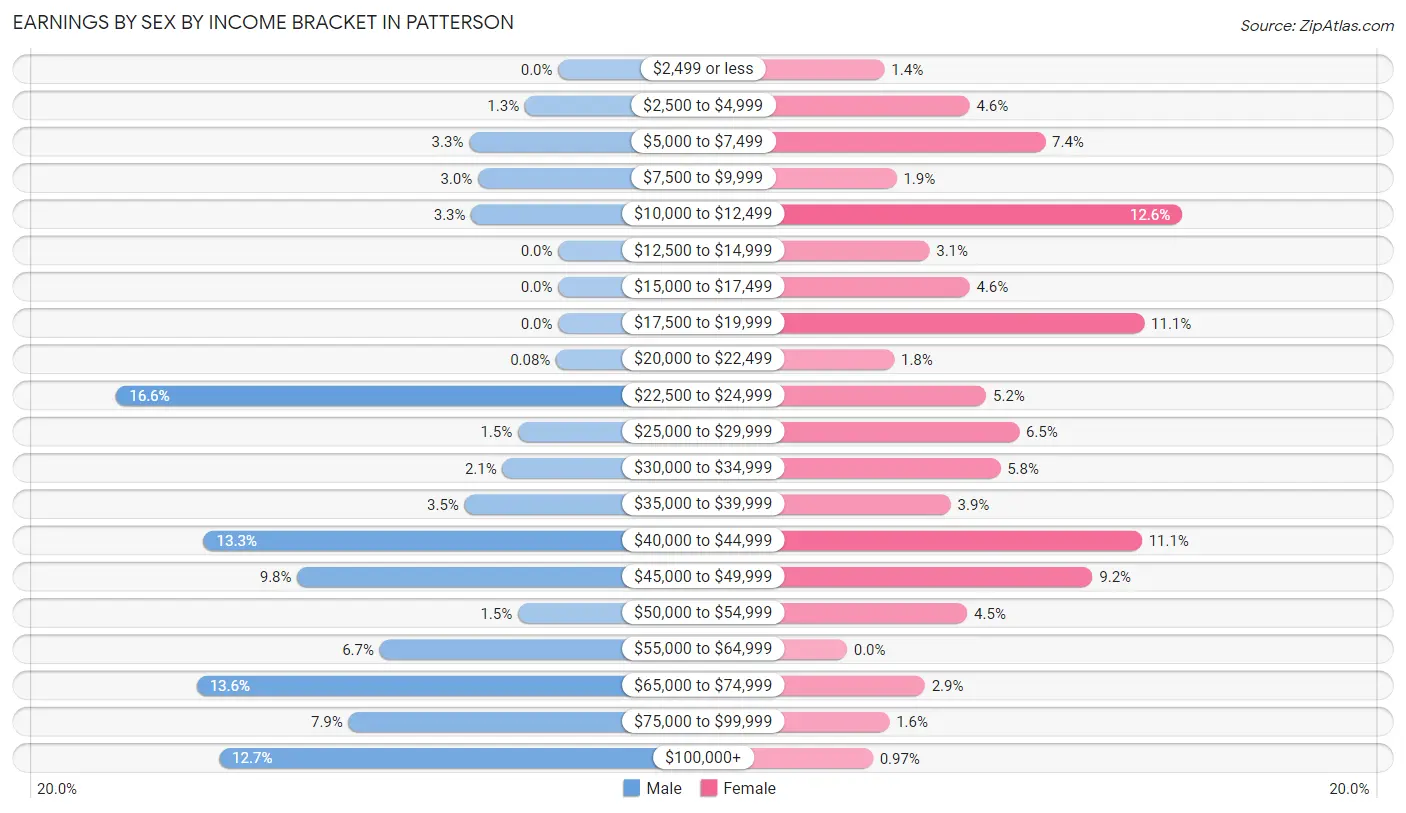
Earnings by Sex by Income Bracket in Patterson
The most common earnings brackets in Patterson are $22,500 to $24,999 for men (198 | 16.6%) and $10,000 to $12,499 for women (142 | 12.6%).
| Income | Male | Female |
| $2,499 or less | 0 (0.0%) | 16 (1.4%) |
| $2,500 to $4,999 | 15 (1.3%) | 52 (4.6%) |
| $5,000 to $7,499 | 40 (3.3%) | 84 (7.4%) |
| $7,500 to $9,999 | 36 (3.0%) | 21 (1.9%) |
| $10,000 to $12,499 | 39 (3.3%) | 142 (12.6%) |
| $12,500 to $14,999 | 0 (0.0%) | 35 (3.1%) |
| $15,000 to $17,499 | 0 (0.0%) | 52 (4.6%) |
| $17,500 to $19,999 | 0 (0.0%) | 126 (11.1%) |
| $20,000 to $22,499 | 1 (0.1%) | 20 (1.8%) |
| $22,500 to $24,999 | 198 (16.6%) | 59 (5.2%) |
| $25,000 to $29,999 | 18 (1.5%) | 73 (6.5%) |
| $30,000 to $34,999 | 25 (2.1%) | 65 (5.8%) |
| $35,000 to $39,999 | 42 (3.5%) | 44 (3.9%) |
| $40,000 to $44,999 | 159 (13.3%) | 125 (11.1%) |
| $45,000 to $49,999 | 117 (9.8%) | 104 (9.2%) |
| $50,000 to $54,999 | 18 (1.5%) | 51 (4.5%) |
| $55,000 to $64,999 | 80 (6.7%) | 0 (0.0%) |
| $65,000 to $74,999 | 162 (13.6%) | 33 (2.9%) |
| $75,000 to $99,999 | 94 (7.9%) | 18 (1.6%) |
| $100,000+ | 152 (12.7%) | 11 (1.0%) |
| Total | 1,196 (100.0%) | 1,131 (100.0%) |
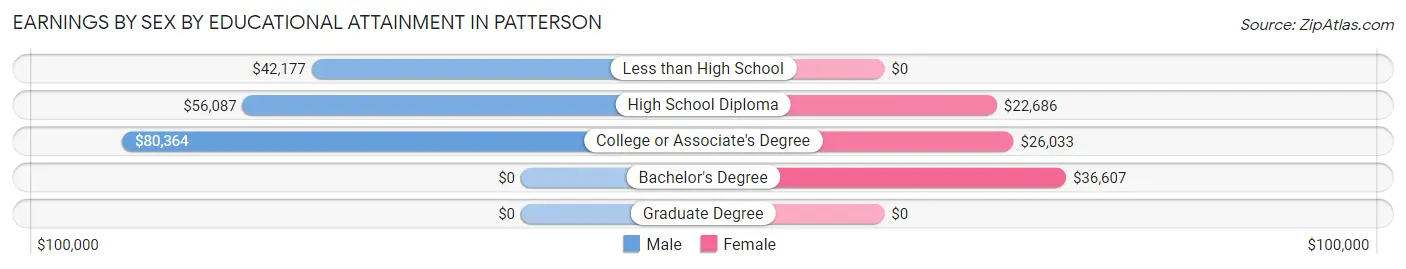
Earnings by Sex by Educational Attainment in Patterson
Average earnings in Patterson are $46,934 for men and $23,962 for women, a difference of 48.9%. Men with an educational attainment of college or associate's degree enjoy the highest average annual earnings of $80,364, while those with less than high school education earn the least with $42,177. Women with an educational attainment of bachelor's degree earn the most with the average annual earnings of $36,607, while those with high school diploma education have the smallest earnings of $22,686.
| Educational Attainment | Male Income | Female Income |
| Less than High School | $42,177 | $0 |
| High School Diploma | $56,087 | $22,686 |
| College or Associate's Degree | $80,364 | $26,033 |
| Bachelor's Degree | - | - |
| Graduate Degree | - | - |
| Total | $46,934 | $23,962 |
Family Income in Patterson
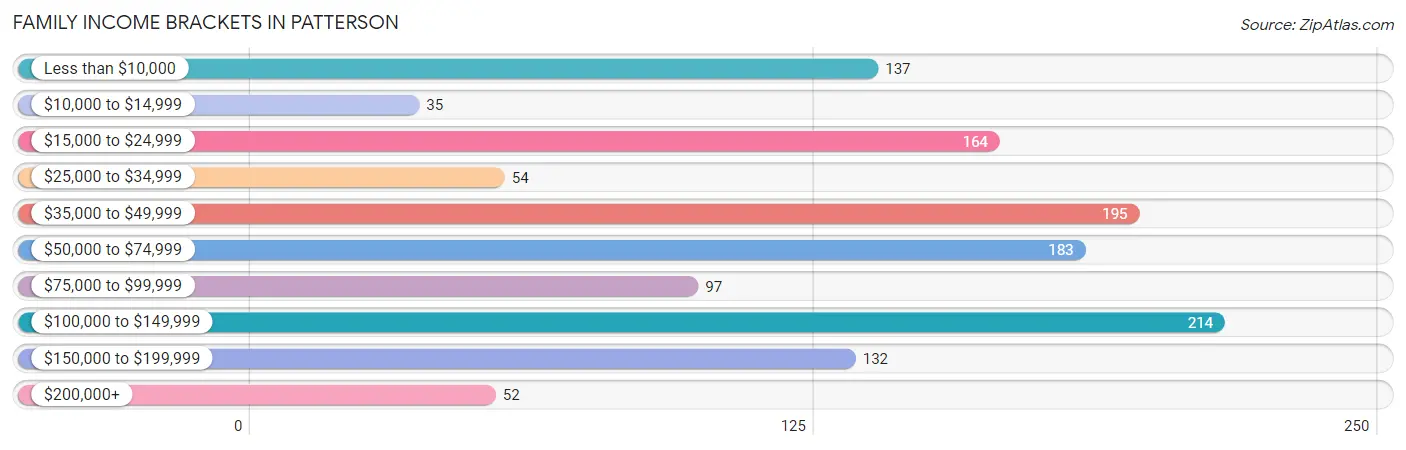
Family Income Brackets in Patterson
According to the Patterson family income data, there are 214 families falling into the $100,000 to $149,999 income range, which is the most common income bracket and makes up 16.9% of all families. Conversely, the $10,000 to $14,999 income bracket is the least frequent group with only 35 families (2.8%) belonging to this category.
| Income Bracket | # Families | % Families |
| Less than $10,000 | 137 | 10.8% |
| $10,000 to $14,999 | 35 | 2.8% |
| $15,000 to $24,999 | 164 | 13.0% |
| $25,000 to $34,999 | 54 | 4.3% |
| $35,000 to $49,999 | 195 | 15.4% |
| $50,000 to $74,999 | 183 | 14.5% |
| $75,000 to $99,999 | 97 | 7.7% |
| $100,000 to $149,999 | 214 | 16.9% |
| $150,000 to $199,999 | 132 | 10.4% |
| $200,000+ | 52 | 4.1% |
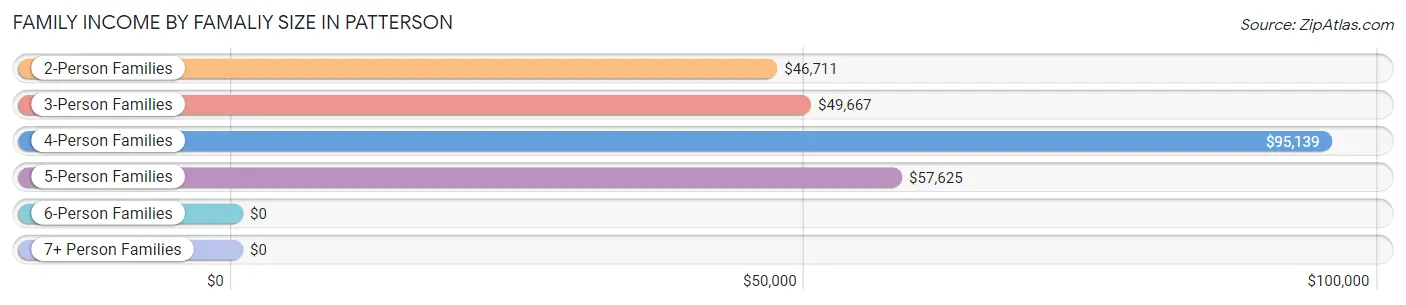
Family Income by Famaliy Size in Patterson
4-person families (381 | 30.1%) account for the highest median family income in Patterson with $95,139 per family, while 4-person families (381 | 30.1%) have the highest median income of $23,785 per family member.
| Income Bracket | # Families | Median Income |
| 2-Person Families | 364 (28.8%) | $46,711 |
| 3-Person Families | 326 (25.8%) | $49,667 |
| 4-Person Families | 381 (30.1%) | $95,139 |
| 5-Person Families | 183 (14.5%) | $57,625 |
| 6-Person Families | 11 (0.9%) | $0 |
| 7+ Person Families | 0 (0.0%) | $0 |
| Total | 1,265 (100.0%) | $54,375 |
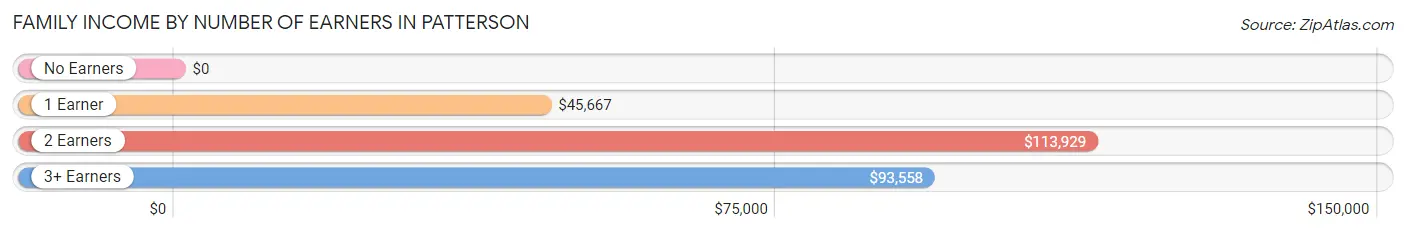
Family Income by Number of Earners in Patterson
| Number of Earners | # Families | Median Income |
| No Earners | 160 (12.7%) | $0 |
| 1 Earner | 581 (45.9%) | $45,667 |
| 2 Earners | 452 (35.7%) | $113,929 |
| 3+ Earners | 72 (5.7%) | $93,558 |
| Total | 1,265 (100.0%) | $54,375 |
Household Income in Patterson
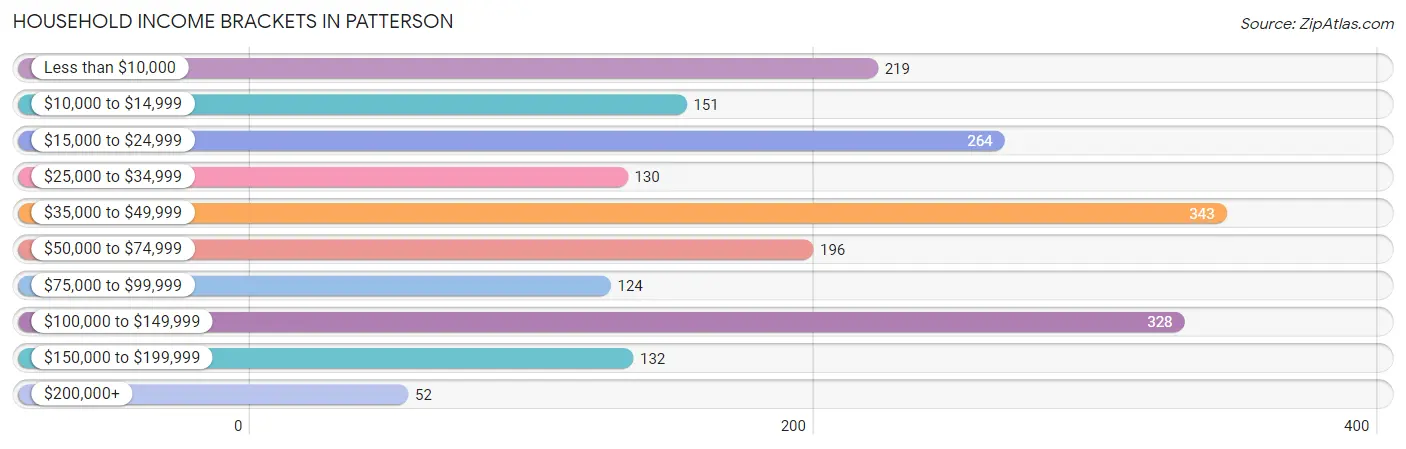
Household Income Brackets in Patterson
With 343 households falling in the category, the $35,000 to $49,999 income range is the most frequent in Patterson, accounting for 17.7% of all households. In contrast, only 52 households (2.7%) fall into the $200,000+ income bracket, making it the least populous group.
| Income Bracket | # Households | % Households |
| Less than $10,000 | 219 | 11.3% |
| $10,000 to $14,999 | 151 | 7.8% |
| $15,000 to $24,999 | 264 | 13.6% |
| $25,000 to $34,999 | 130 | 6.7% |
| $35,000 to $49,999 | 343 | 17.7% |
| $50,000 to $74,999 | 196 | 10.1% |
| $75,000 to $99,999 | 124 | 6.4% |
| $100,000 to $149,999 | 328 | 16.9% |
| $150,000 to $199,999 | 132 | 6.8% |
| $200,000+ | 52 | 2.7% |
Household Income by Householder Age in Patterson
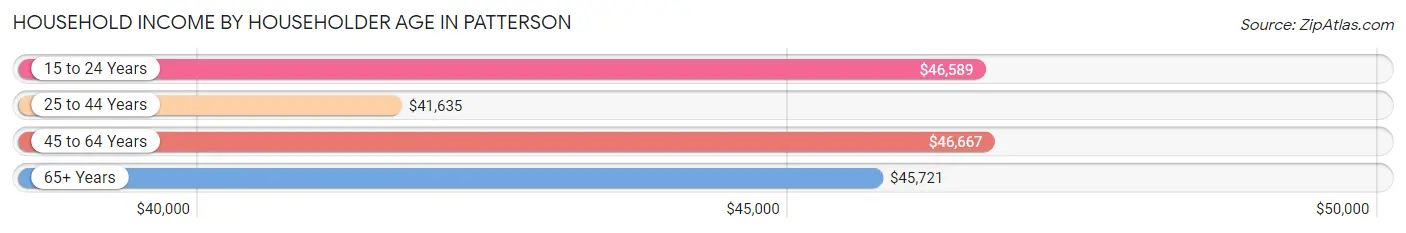
The median household income in Patterson is $46,189, with the highest median household income of $46,667 found in the 45 to 64 years age bracket for the primary householder. A total of 698 households (36.0%) fall into this category. Meanwhile, the 25 to 44 years age bracket for the primary householder has the lowest median household income of $41,635, with 759 households (39.1%) in this group.
| Income Bracket | # Households | Median Income |
| 15 to 24 Years | 89 (4.6%) | $46,589 |
| 25 to 44 Years | 759 (39.1%) | $41,635 |
| 45 to 64 Years | 698 (36.0%) | $46,667 |
| 65+ Years | 393 (20.3%) | $45,721 |
| Total | 1,939 (100.0%) | $46,189 |
Poverty in Patterson
Income Below Poverty by Sex and Age in Patterson
With 25.3% poverty level for males and 32.2% for females among the residents of Patterson, 18 to 24 year old males and 12 to 14 year old females are the most vulnerable to poverty, with 167 males (54.0%) and 115 females (66.9%) in their respective age groups living below the poverty level.
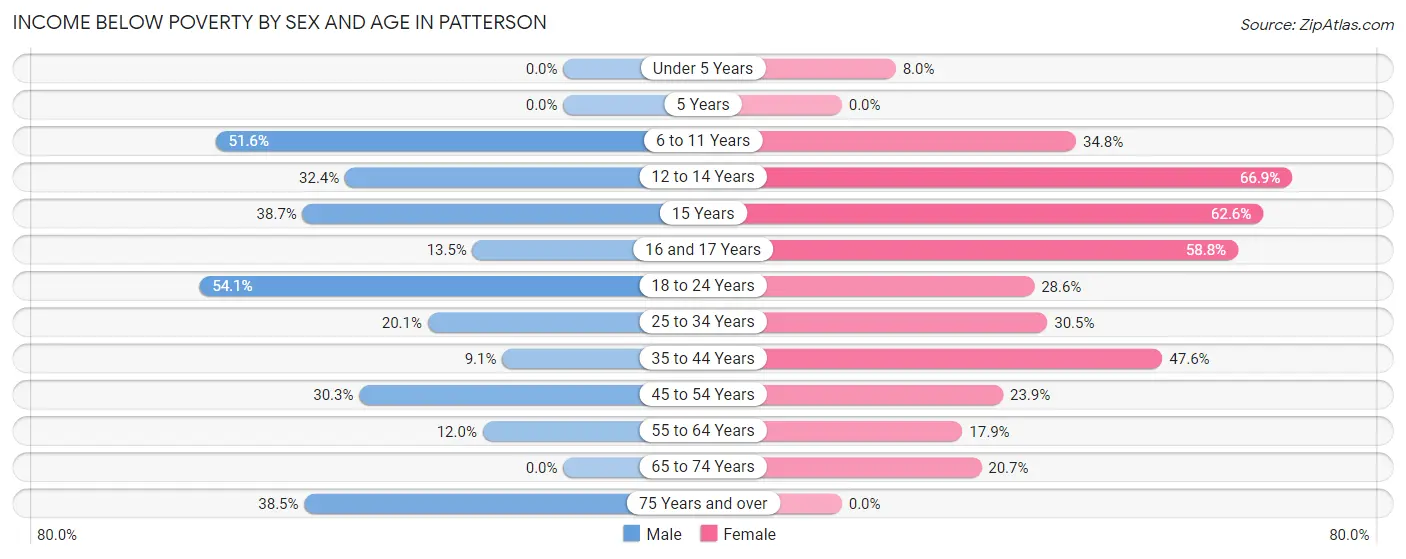
| Age Bracket | Male | Female |
| Under 5 Years | 0 (0.0%) | 31 (8.0%) |
| 5 Years | 0 (0.0%) | 0 (0.0%) |
| 6 to 11 Years | 127 (51.6%) | 64 (34.8%) |
| 12 to 14 Years | 82 (32.4%) | 115 (66.9%) |
| 15 Years | 24 (38.7%) | 142 (62.6%) |
| 16 and 17 Years | 7 (13.5%) | 80 (58.8%) |
| 18 to 24 Years | 167 (54.0%) | 54 (28.6%) |
| 25 to 34 Years | 63 (20.1%) | 141 (30.5%) |
| 35 to 44 Years | 35 (9.1%) | 199 (47.6%) |
| 45 to 54 Years | 90 (30.3%) | 102 (23.9%) |
| 55 to 64 Years | 28 (12.0%) | 53 (17.9%) |
| 65 to 74 Years | 0 (0.0%) | 35 (20.7%) |
| 75 Years and over | 35 (38.5%) | 0 (0.0%) |
| Total | 658 (25.3%) | 1,016 (32.2%) |
Income Above Poverty by Sex and Age in Patterson
According to the poverty statistics in Patterson, males aged under 5 years and females aged 5 years are the age groups that are most secure financially, with 100.0% of males and 100.0% of females in these age groups living above the poverty line.
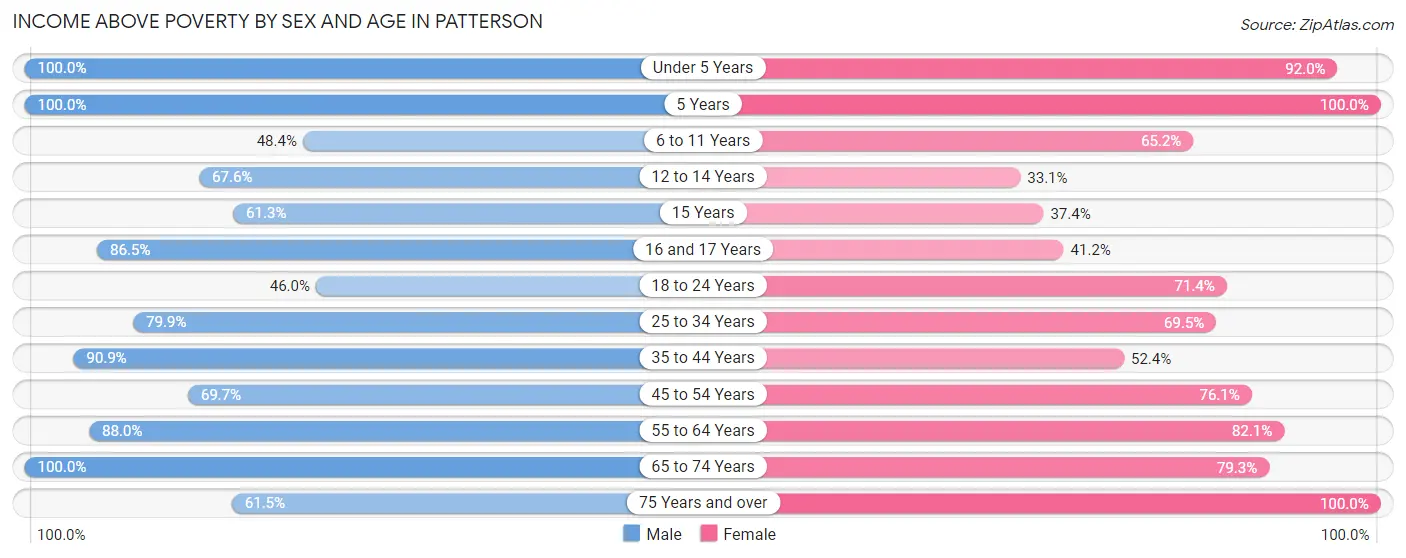
| Age Bracket | Male | Female |
| Under 5 Years | 36 (100.0%) | 356 (92.0%) |
| 5 Years | 49 (100.0%) | 45 (100.0%) |
| 6 to 11 Years | 119 (48.4%) | 120 (65.2%) |
| 12 to 14 Years | 171 (67.6%) | 57 (33.1%) |
| 15 Years | 38 (61.3%) | 85 (37.4%) |
| 16 and 17 Years | 45 (86.5%) | 56 (41.2%) |
| 18 to 24 Years | 142 (46.0%) | 135 (71.4%) |
| 25 to 34 Years | 250 (79.9%) | 321 (69.5%) |
| 35 to 44 Years | 351 (90.9%) | 219 (52.4%) |
| 45 to 54 Years | 207 (69.7%) | 324 (76.1%) |
| 55 to 64 Years | 206 (88.0%) | 243 (82.1%) |
| 65 to 74 Years | 277 (100.0%) | 134 (79.3%) |
| 75 Years and over | 56 (61.5%) | 46 (100.0%) |
| Total | 1,947 (74.7%) | 2,141 (67.8%) |
Income Below Poverty Among Married-Couple Families in Patterson
The poverty statistics for married-couple families in Patterson show that 9.7% or 83 of the total 854 families live below the poverty line. Families with 1 or 2 children have the highest poverty rate of 22.0%, comprising of 83 families. On the other hand, families with no children have the lowest poverty rate of 0.0%, which includes 0 families.
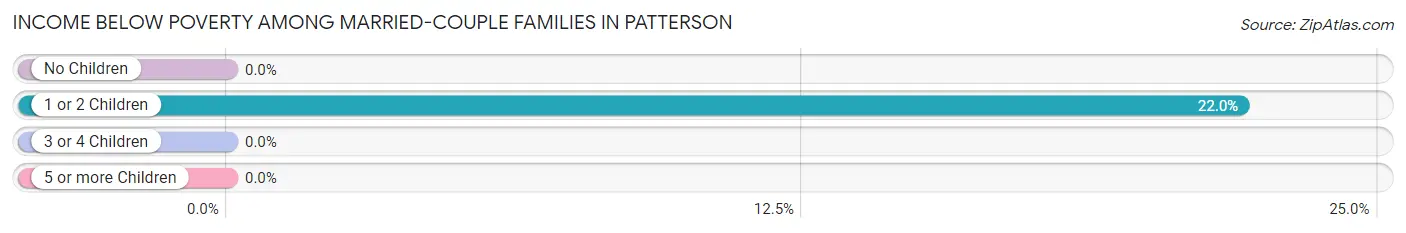
| Children | Above Poverty | Below Poverty |
| No Children | 372 (100.0%) | 0 (0.0%) |
| 1 or 2 Children | 294 (78.0%) | 83 (22.0%) |
| 3 or 4 Children | 105 (100.0%) | 0 (0.0%) |
| 5 or more Children | 0 (0.0%) | 0 (0.0%) |
| Total | 771 (90.3%) | 83 (9.7%) |
Income Below Poverty Among Single-Parent Households in Patterson
According to the poverty data in Patterson, 43.1% or 25 single-father households and 67.1% or 237 single-mother households are living below the poverty line. Among single-father households, those with no children have the highest poverty rate, with 17 households (54.8%) experiencing poverty. Likewise, among single-mother households, those with 1 or 2 children have the highest poverty rate, with 151 households (85.3%) falling below the poverty line.
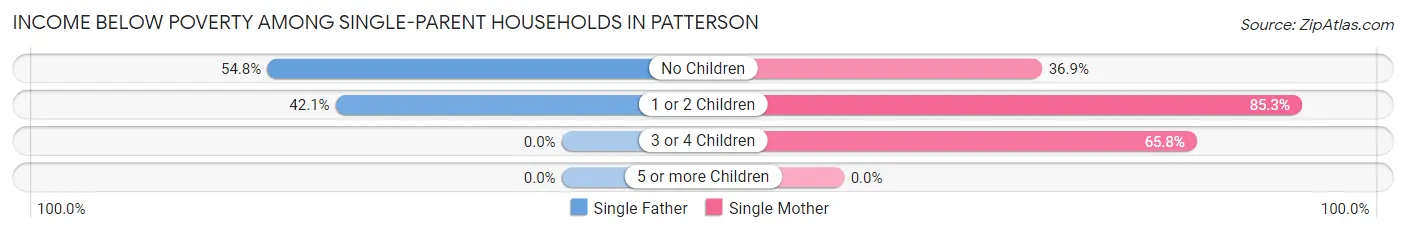
| Children | Single Father | Single Mother |
| No Children | 17 (54.8%) | 38 (36.9%) |
| 1 or 2 Children | 8 (42.1%) | 151 (85.3%) |
| 3 or 4 Children | 0 (0.0%) | 48 (65.7%) |
| 5 or more Children | 0 (0.0%) | 0 (0.0%) |
| Total | 25 (43.1%) | 237 (67.1%) |
Income Below Poverty Among Married-Couple vs Single-Parent Households in Patterson
The poverty data for Patterson shows that 83 of the married-couple family households (9.7%) and 262 of the single-parent households (63.7%) are living below the poverty level. Within the married-couple family households, those with 1 or 2 children have the highest poverty rate, with 83 households (22.0%) falling below the poverty line. Among the single-parent households, those with 1 or 2 children have the highest poverty rate, with 159 household (81.1%) living below poverty.
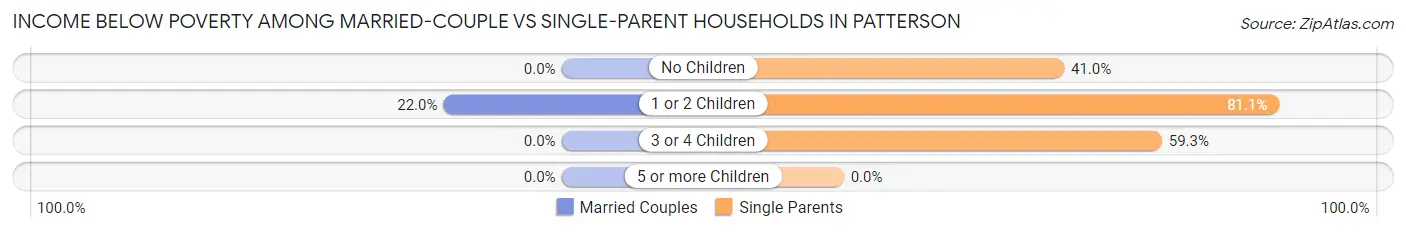
| Children | Married-Couple Families | Single-Parent Households |
| No Children | 0 (0.0%) | 55 (41.0%) |
| 1 or 2 Children | 83 (22.0%) | 159 (81.1%) |
| 3 or 4 Children | 0 (0.0%) | 48 (59.3%) |
| 5 or more Children | 0 (0.0%) | 0 (0.0%) |
| Total | 83 (9.7%) | 262 (63.7%) |
Race in Patterson
The most populous races in Patterson are White / Caucasian (2,976 | 50.7%), Black / African American (2,403 | 40.9%), and Two or more Races (312 | 5.3%).
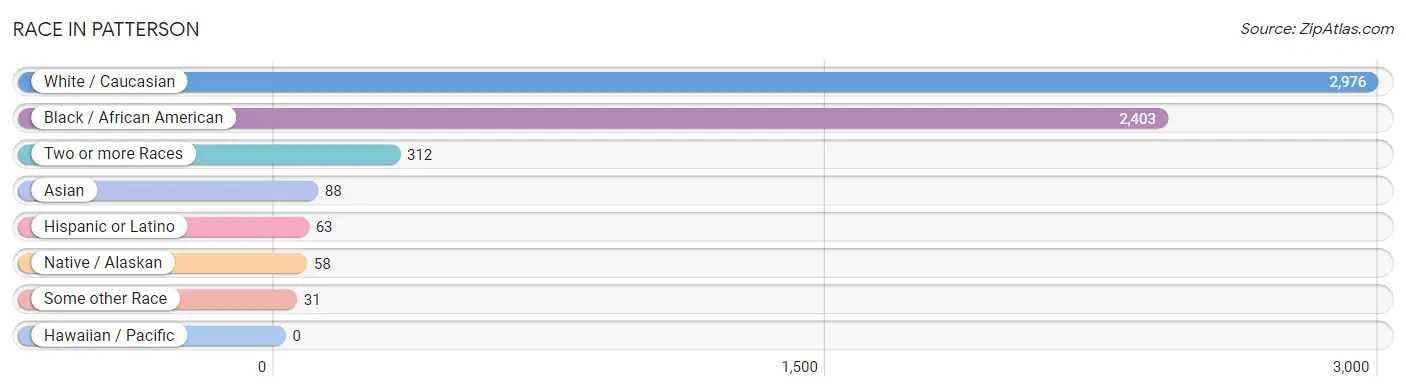
| Race | # Population | % Population |
| Asian | 88 | 1.5% |
| Black / African American | 2,403 | 40.9% |
| Hawaiian / Pacific | 0 | 0.0% |
| Hispanic or Latino | 63 | 1.1% |
| Native / Alaskan | 58 | 1.0% |
| White / Caucasian | 2,976 | 50.7% |
| Two or more Races | 312 | 5.3% |
| Some other Race | 31 | 0.5% |
| Total | 5,868 | 100.0% |
Ancestry in Patterson
The most populous ancestries reported in Patterson are French (440 | 7.5%), American (273 | 4.6%), German (168 | 2.9%), English (162 | 2.8%), and Italian (147 | 2.5%), together accounting for 20.3% of all Patterson residents.
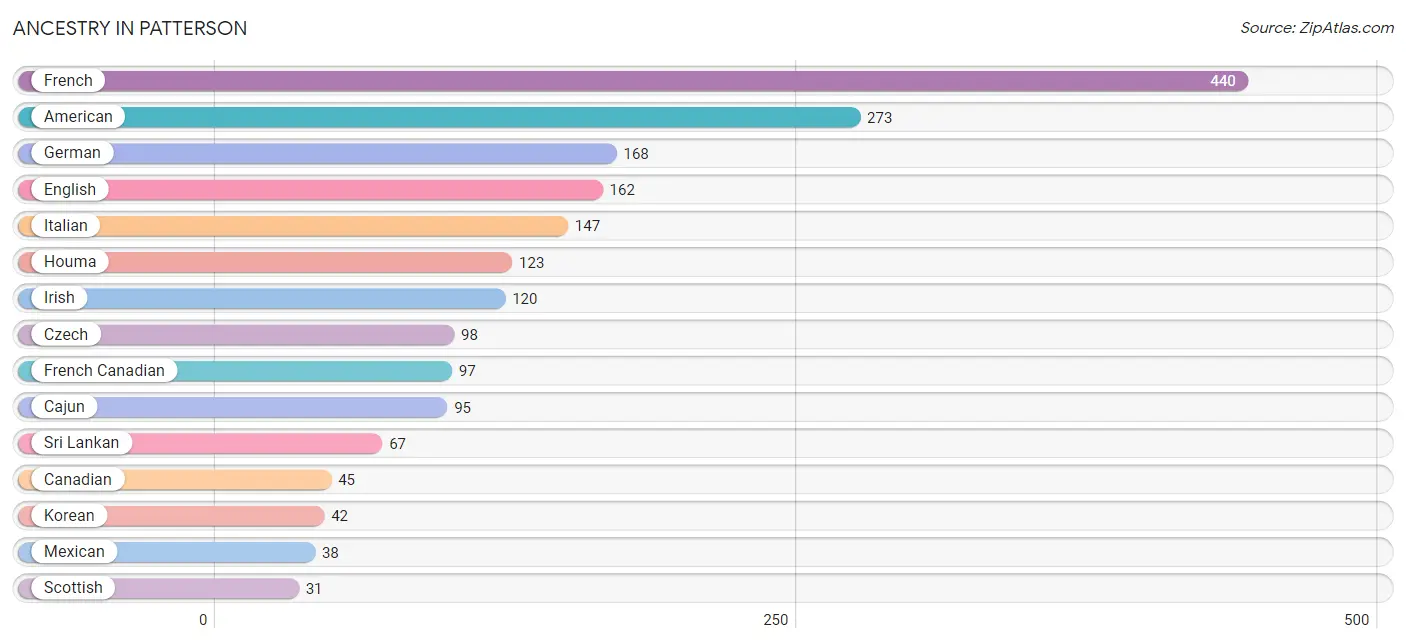
| Ancestry | # Population | % Population |
| African | 5 | 0.1% |
| American | 273 | 4.6% |
| Arab | 10 | 0.2% |
| Cajun | 95 | 1.6% |
| Canadian | 45 | 0.8% |
| Central American | 11 | 0.2% |
| Czech | 98 | 1.7% |
| Dutch | 11 | 0.2% |
| English | 162 | 2.8% |
| European | 9 | 0.2% |
| French | 440 | 7.5% |
| French Canadian | 97 | 1.7% |
| German | 168 | 2.9% |
| Houma | 123 | 2.1% |
| Irish | 120 | 2.0% |
| Italian | 147 | 2.5% |
| Korean | 42 | 0.7% |
| Lebanese | 10 | 0.2% |
| Mexican | 38 | 0.6% |
| Nicaraguan | 11 | 0.2% |
| Norwegian | 1 | 0.0% |
| Polish | 9 | 0.2% |
| Scotch-Irish | 8 | 0.1% |
| Scottish | 31 | 0.5% |
| Sri Lankan | 67 | 1.1% |
| Subsaharan African | 5 | 0.1% | View All 26 Rows |
Immigrants in Patterson
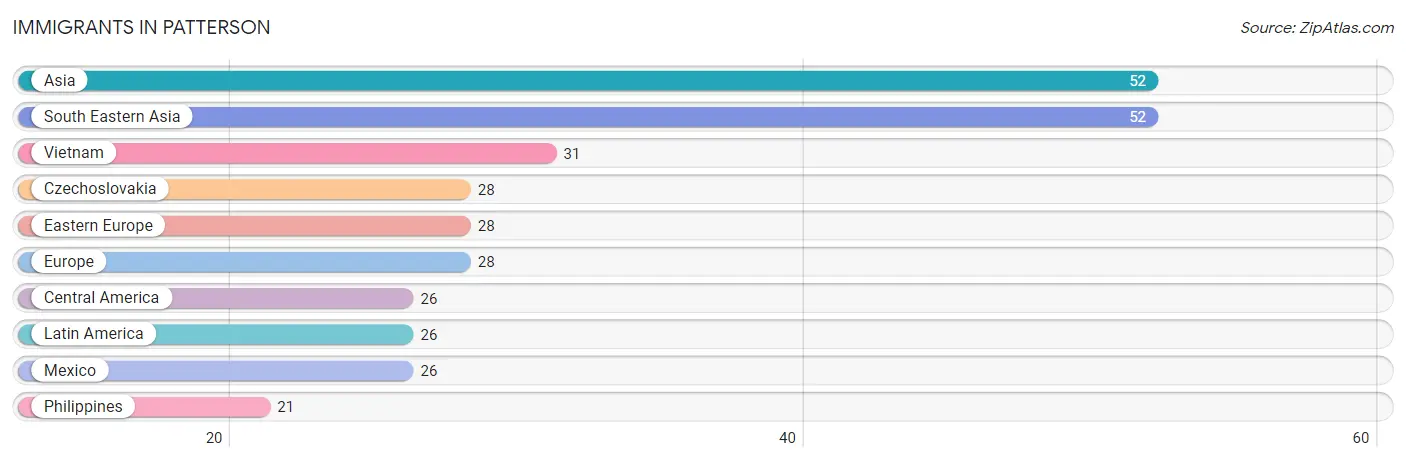
The most numerous immigrant groups reported in Patterson came from Asia (52 | 0.9%), South Eastern Asia (52 | 0.9%), Vietnam (31 | 0.5%), Czechoslovakia (28 | 0.5%), and Eastern Europe (28 | 0.5%), together accounting for 3.3% of all Patterson residents.
| Immigration Origin | # Population | % Population |
| Asia | 52 | 0.9% |
| Central America | 26 | 0.4% |
| Czechoslovakia | 28 | 0.5% |
| Eastern Europe | 28 | 0.5% |
| Europe | 28 | 0.5% |
| Latin America | 26 | 0.4% |
| Mexico | 26 | 0.4% |
| Philippines | 21 | 0.4% |
| South Eastern Asia | 52 | 0.9% |
| Vietnam | 31 | 0.5% | View All 10 Rows |
Sex and Age in Patterson
Sex and Age in Patterson
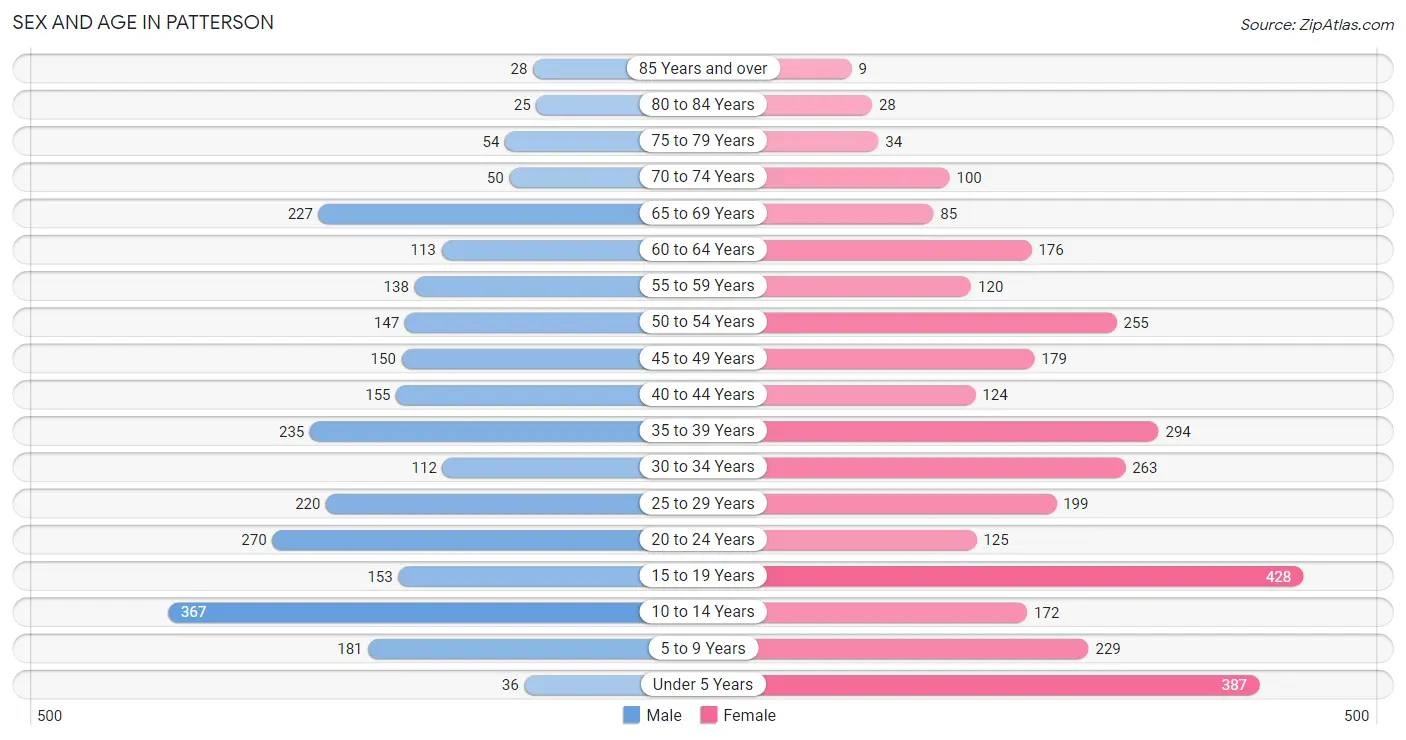
The most populous age groups in Patterson are 10 to 14 Years (367 | 13.8%) for men and 15 to 19 Years (428 | 13.4%) for women.
| Age Bracket | Male | Female |
| Under 5 Years | 36 (1.3%) | 387 (12.1%) |
| 5 to 9 Years | 181 (6.8%) | 229 (7.1%) |
| 10 to 14 Years | 367 (13.8%) | 172 (5.4%) |
| 15 to 19 Years | 153 (5.8%) | 428 (13.4%) |
| 20 to 24 Years | 270 (10.2%) | 125 (3.9%) |
| 25 to 29 Years | 220 (8.3%) | 199 (6.2%) |
| 30 to 34 Years | 112 (4.2%) | 263 (8.2%) |
| 35 to 39 Years | 235 (8.8%) | 294 (9.2%) |
| 40 to 44 Years | 155 (5.8%) | 124 (3.9%) |
| 45 to 49 Years | 150 (5.6%) | 179 (5.6%) |
| 50 to 54 Years | 147 (5.5%) | 255 (8.0%) |
| 55 to 59 Years | 138 (5.2%) | 120 (3.7%) |
| 60 to 64 Years | 113 (4.3%) | 176 (5.5%) |
| 65 to 69 Years | 227 (8.5%) | 85 (2.6%) |
| 70 to 74 Years | 50 (1.9%) | 100 (3.1%) |
| 75 to 79 Years | 54 (2.0%) | 34 (1.1%) |
| 80 to 84 Years | 25 (0.9%) | 28 (0.9%) |
| 85 Years and over | 28 (1.1%) | 9 (0.3%) |
| Total | 2,661 (100.0%) | 3,207 (100.0%) |
Families and Households in Patterson
Median Family Size in Patterson
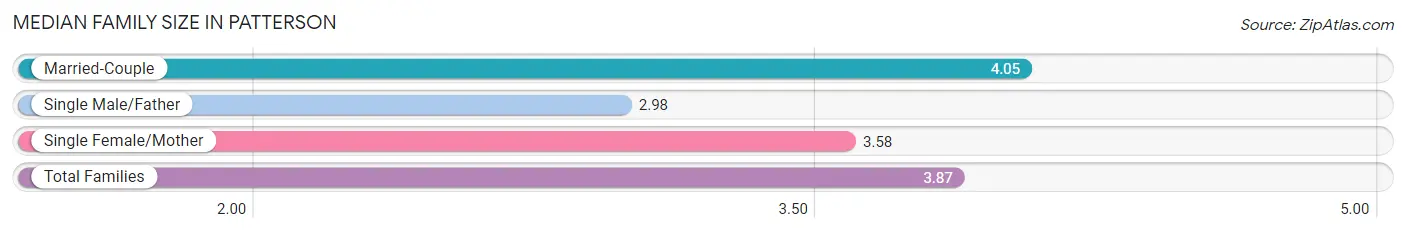
The median family size in Patterson is 3.87 persons per family, with married-couple families (854 | 67.5%) accounting for the largest median family size of 4.05 persons per family. On the other hand, single male/father families (58 | 4.6%) represent the smallest median family size with 2.98 persons per family.
| Family Type | # Families | Family Size |
| Married-Couple | 854 (67.5%) | 4.05 |
| Single Male/Father | 58 (4.6%) | 2.98 |
| Single Female/Mother | 353 (27.9%) | 3.58 |
| Total Families | 1,265 (100.0%) | 3.87 |
Median Household Size in Patterson
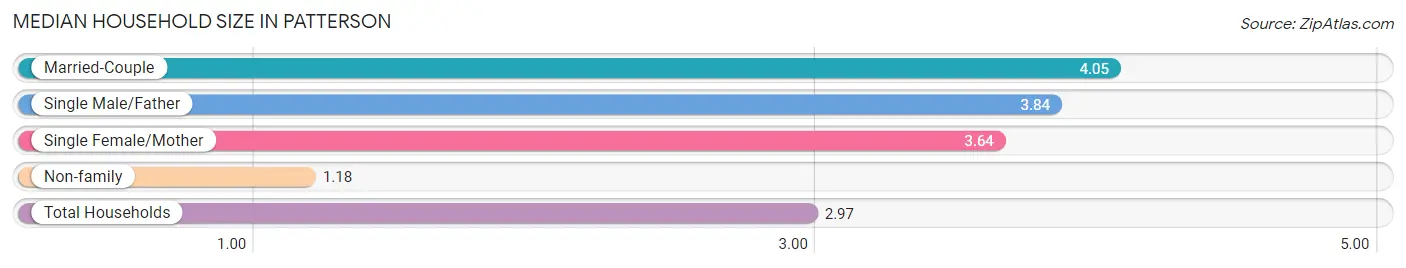
The median household size in Patterson is 2.97 persons per household, with married-couple households (854 | 44.0%) accounting for the largest median household size of 4.05 persons per household. non-family households (674 | 34.8%) represent the smallest median household size with 1.18 persons per household.
| Household Type | # Households | Household Size |
| Married-Couple | 854 (44.0%) | 4.05 |
| Single Male/Father | 58 (3.0%) | 3.84 |
| Single Female/Mother | 353 (18.2%) | 3.64 |
| Non-family | 674 (34.8%) | 1.18 |
| Total Households | 1,939 (100.0%) | 2.97 |
Household Size by Marriage Status in Patterson
Out of a total of 1,939 households in Patterson, 1,265 (65.2%) are family households, while 674 (34.8%) are nonfamily households. The most numerous type of family households are 4-person households, comprising 365, and the most common type of nonfamily households are 1-person households, comprising 512.
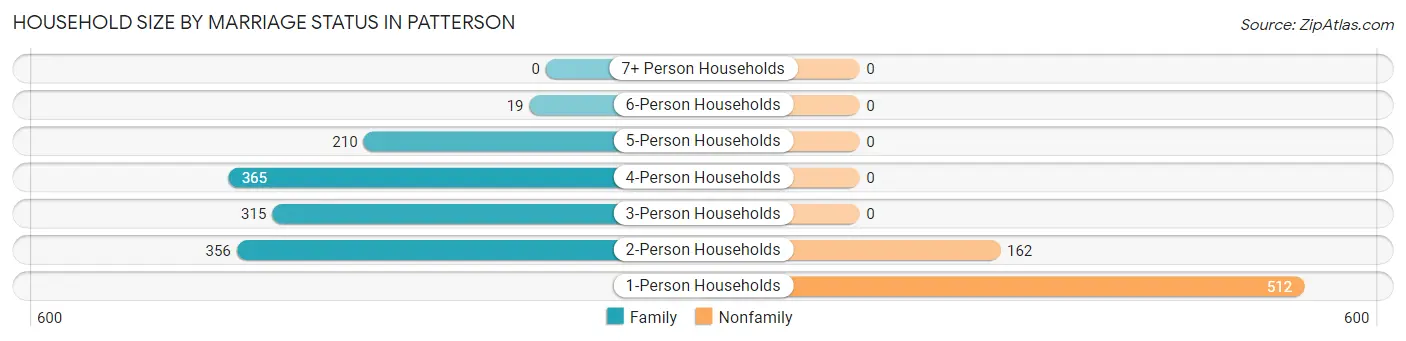
| Household Size | Family Households | Nonfamily Households |
| 1-Person Households | - | 512 (26.4%) |
| 2-Person Households | 356 (18.4%) | 162 (8.4%) |
| 3-Person Households | 315 (16.3%) | 0 (0.0%) |
| 4-Person Households | 365 (18.8%) | 0 (0.0%) |
| 5-Person Households | 210 (10.8%) | 0 (0.0%) |
| 6-Person Households | 19 (1.0%) | 0 (0.0%) |
| 7+ Person Households | 0 (0.0%) | 0 (0.0%) |
| Total | 1,265 (65.2%) | 674 (34.8%) |
Female Fertility in Patterson
Fertility by Age in Patterson
Average fertility rate in Patterson is 16.0 births per 1,000 women. Women in the age bracket of 20 to 34 years have the highest fertility rate with 46.0 births per 1,000 women. Women in the age bracket of 20 to 34 years acount for 100.0% of all women with births.
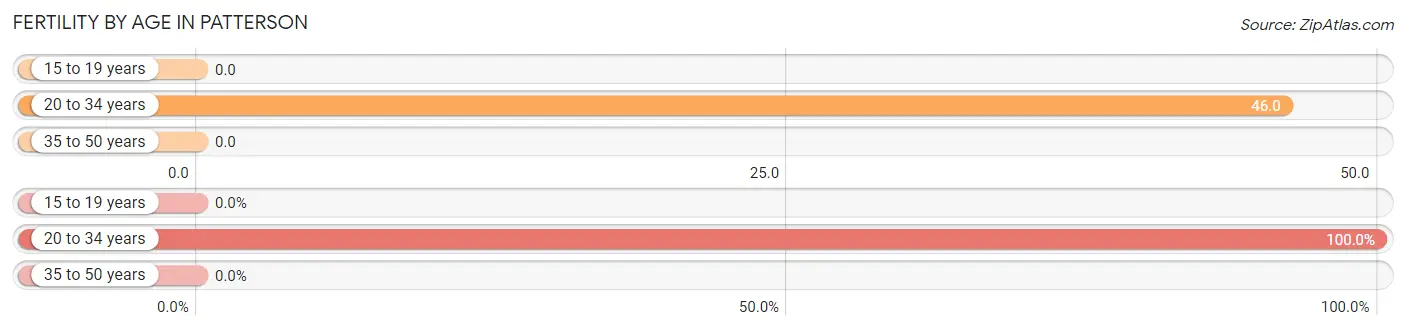
| Age Bracket | Women with Births | Births / 1,000 Women |
| 15 to 19 years | 0 (0.0%) | 0.0 |
| 20 to 34 years | 27 (100.0%) | 46.0 |
| 35 to 50 years | 0 (0.0%) | 0.0 |
| Total | 27 (100.0%) | 16.0 |
Fertility by Age by Marriage Status in Patterson
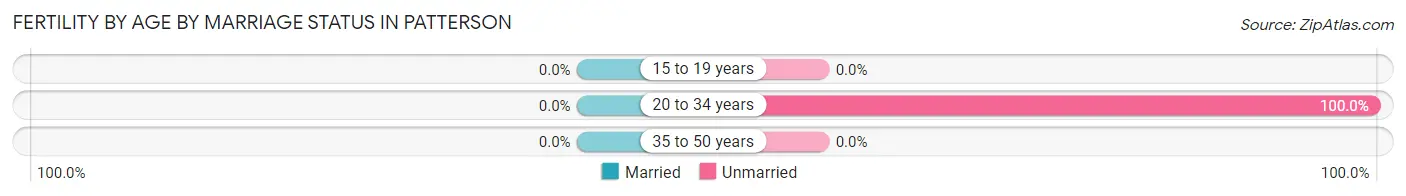
| Age Bracket | Married | Unmarried |
| 15 to 19 years | 0 (0.0%) | 0 (0.0%) |
| 20 to 34 years | 0 (0.0%) | 27 (100.0%) |
| 35 to 50 years | 0 (0.0%) | 0 (0.0%) |
| Total | 0 (0.0%) | 27 (100.0%) |
Fertility by Education in Patterson
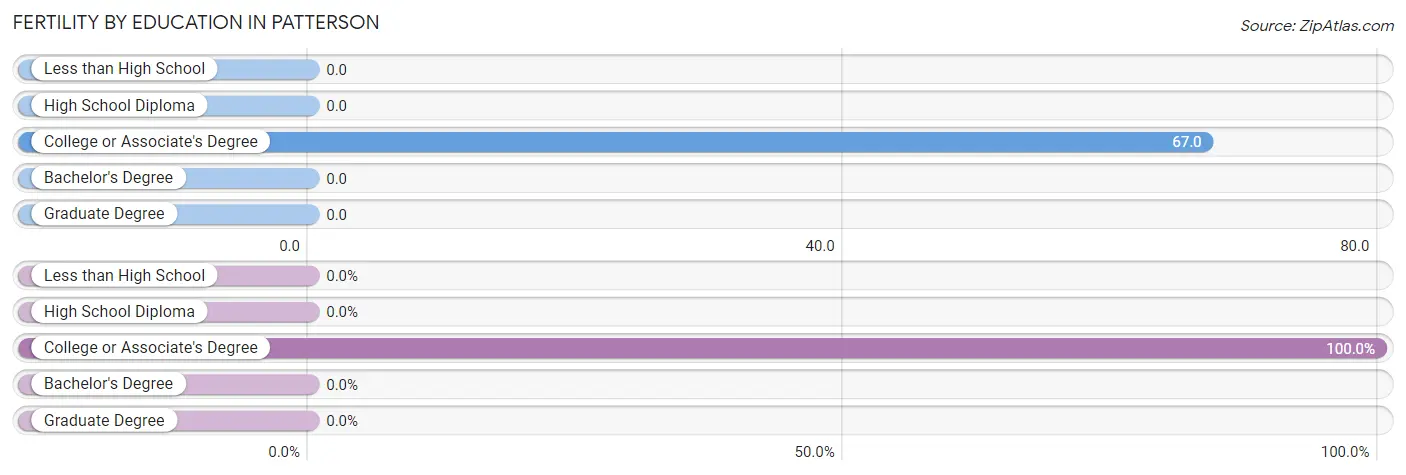
| Educational Attainment | Women with Births | Births / 1,000 Women |
| Less than High School | 0 (0.0%) | 0.0 |
| High School Diploma | 0 (0.0%) | 0.0 |
| College or Associate's Degree | 27 (100.0%) | 67.0 |
| Bachelor's Degree | 0 (0.0%) | 0.0 |
| Graduate Degree | 0 (0.0%) | 0.0 |
| Total | 27 (100.0%) | 16.0 |
Fertility by Education by Marriage Status in Patterson
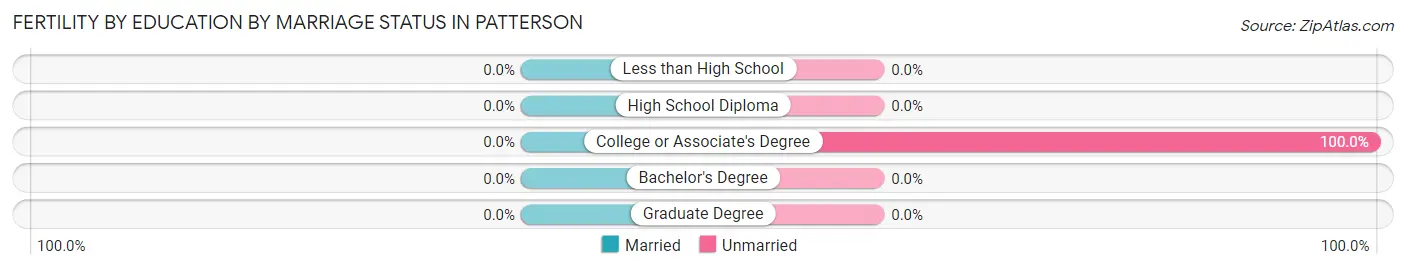
| Educational Attainment | Married | Unmarried |
| Less than High School | 0 (0.0%) | 0 (0.0%) |
| High School Diploma | 0 (0.0%) | 0 (0.0%) |
| College or Associate's Degree | 0 (0.0%) | 27 (100.0%) |
| Bachelor's Degree | 0 (0.0%) | 0 (0.0%) |
| Graduate Degree | 0 (0.0%) | 0 (0.0%) |
| Total | 0 (0.0%) | 27 (100.0%) |
Employment Characteristics in Patterson
Employment by Class of Employer in Patterson
Among the 2,196 employed individuals in Patterson, private company employees (1,585 | 72.2%), self-employed (not incorporated) (228 | 10.4%), and state government employees (151 | 6.9%) make up the most common classes of employment.
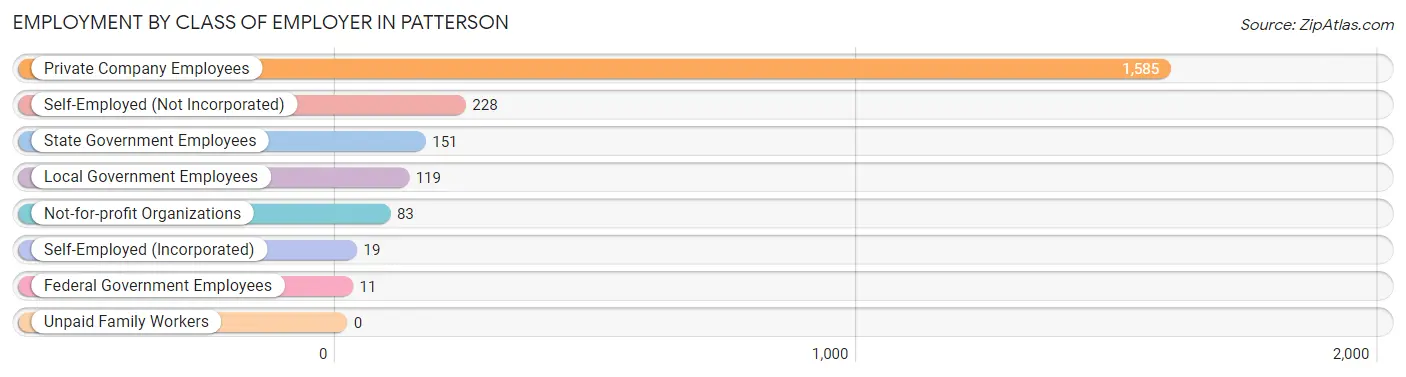
| Employer Class | # Employees | % Employees |
| Private Company Employees | 1,585 | 72.2% |
| Self-Employed (Incorporated) | 19 | 0.9% |
| Self-Employed (Not Incorporated) | 228 | 10.4% |
| Not-for-profit Organizations | 83 | 3.8% |
| Local Government Employees | 119 | 5.4% |
| State Government Employees | 151 | 6.9% |
| Federal Government Employees | 11 | 0.5% |
| Unpaid Family Workers | 0 | 0.0% |
| Total | 2,196 | 100.0% |
Employment Status by Age in Patterson
According to the labor force statistics for Patterson, out of the total population over 16 years of age (4,206), 54.5% or 2,292 individuals are in the labor force, with 2.4% or 55 of them unemployed. The age group with the highest labor force participation rate is 30 to 34 years, with 76.0% or 285 individuals in the labor force. Within the labor force, the 16 to 19 years age range has the highest percentage of unemployed individuals, with 31.3% or 21 of them being unemployed.
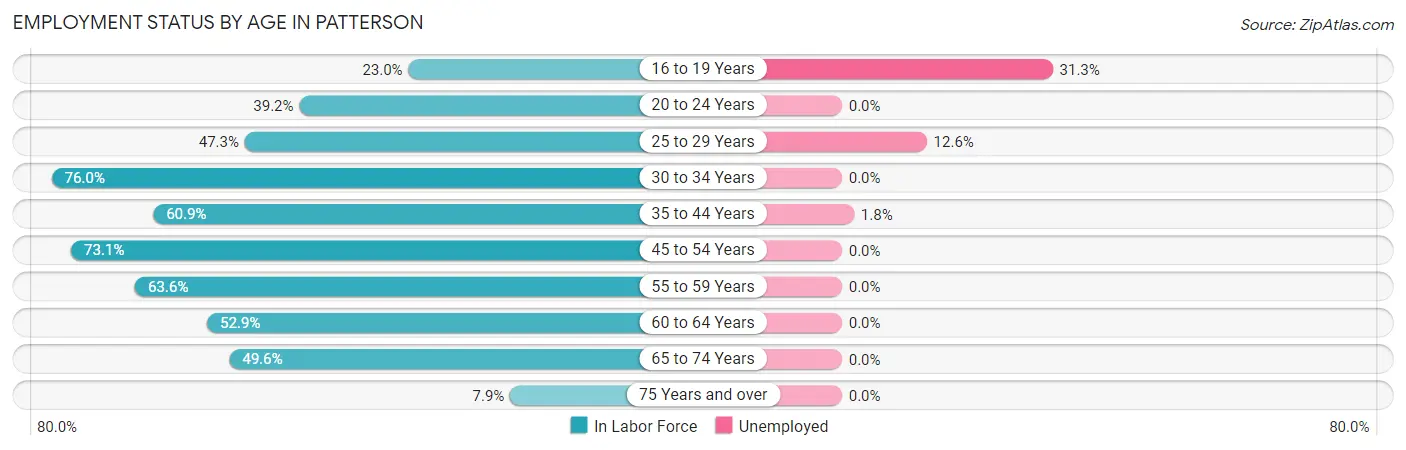
| Age Bracket | In Labor Force | Unemployed |
| 16 to 19 Years | 67 (23.0%) | 21 (31.3%) |
| 20 to 24 Years | 155 (39.2%) | 0 (0.0%) |
| 25 to 29 Years | 198 (47.3%) | 25 (12.6%) |
| 30 to 34 Years | 285 (76.0%) | 0 (0.0%) |
| 35 to 44 Years | 492 (60.9%) | 9 (1.8%) |
| 45 to 54 Years | 534 (73.1%) | 0 (0.0%) |
| 55 to 59 Years | 164 (63.6%) | 0 (0.0%) |
| 60 to 64 Years | 153 (52.9%) | 0 (0.0%) |
| 65 to 74 Years | 229 (49.6%) | 0 (0.0%) |
| 75 Years and over | 14 (7.9%) | 0 (0.0%) |
| Total | 2,292 (54.5%) | 55 (2.4%) |
Employment Status by Educational Attainment in Patterson
According to labor force statistics for Patterson, 63.4% of individuals (1,826) out of the total population between 25 and 64 years of age (2,880) are in the labor force, with 1.9% or 35 of them being unemployed. The group with the highest labor force participation rate are those with the educational attainment of bachelor's degree or higher, with 84.3% or 177 individuals in the labor force. Within the labor force, individuals with college / associate degree education have the highest percentage of unemployment, with 4.3% or 25 of them being unemployed.
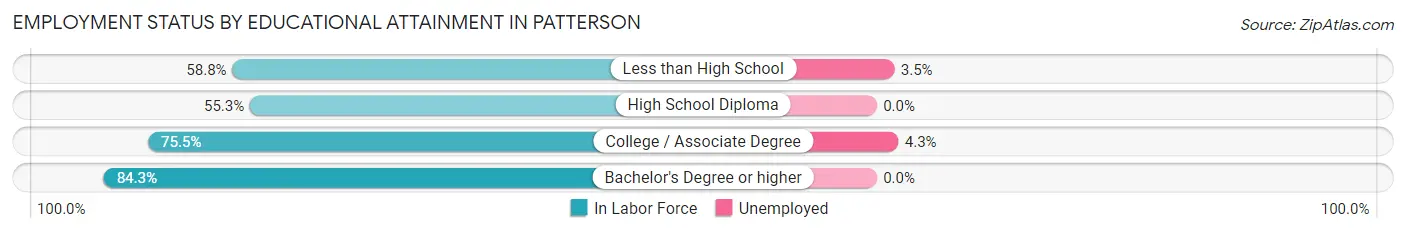
| Educational Attainment | In Labor Force | Unemployed |
| Less than High School | 257 (58.8%) | 15 (3.5%) |
| High School Diploma | 807 (55.3%) | 0 (0.0%) |
| College / Associate Degree | 584 (75.5%) | 33 (4.3%) |
| Bachelor's Degree or higher | 177 (84.3%) | 0 (0.0%) |
| Total | 1,826 (63.4%) | 55 (1.9%) |
Employment Occupations by Sex in Patterson
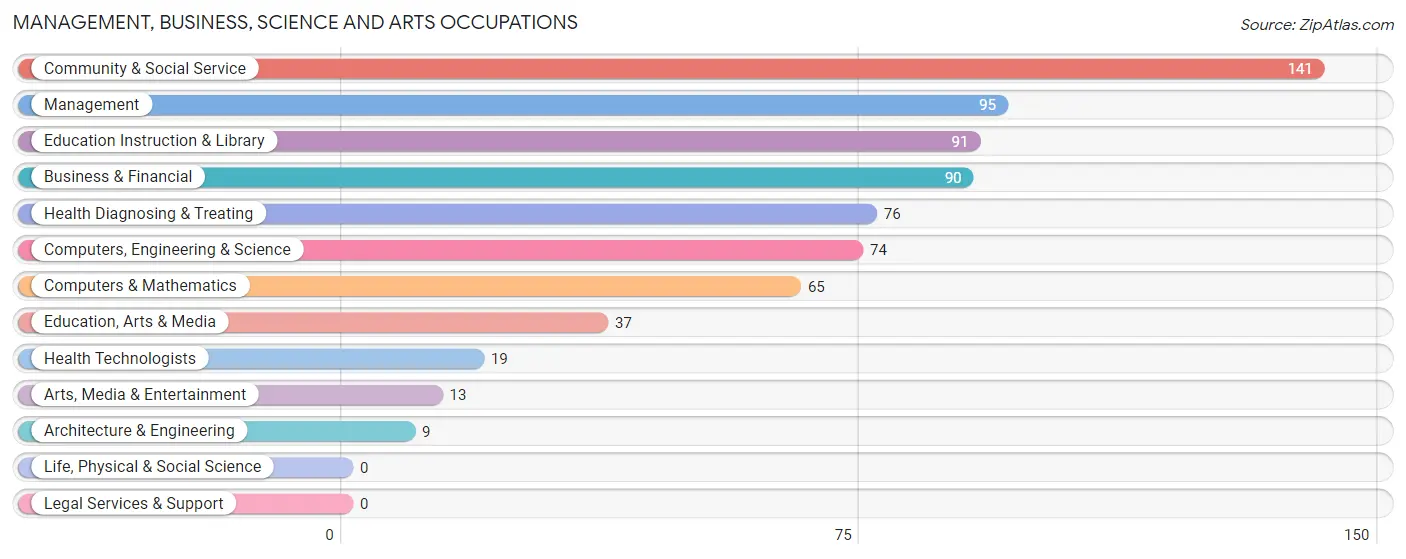
Management, Business, Science and Arts Occupations
The most common Management, Business, Science and Arts occupations in Patterson are Community & Social Service (141 | 6.3%), Management (95 | 4.3%), Education Instruction & Library (91 | 4.1%), Business & Financial (90 | 4.0%), and Health Diagnosing & Treating (76 | 3.4%).
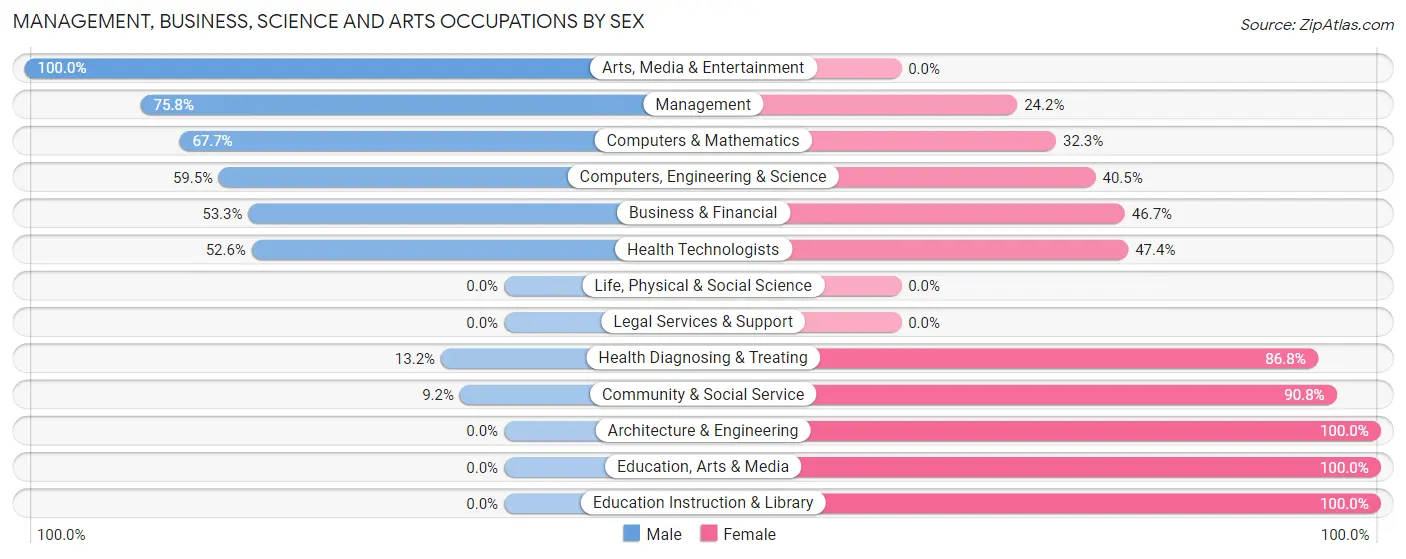
Management, Business, Science and Arts Occupations by Sex
Within the Management, Business, Science and Arts occupations in Patterson, the most male-oriented occupations are Arts, Media & Entertainment (100.0%), Management (75.8%), and Computers & Mathematics (67.7%), while the most female-oriented occupations are Architecture & Engineering (100.0%), Education, Arts & Media (100.0%), and Education Instruction & Library (100.0%).
| Occupation | Male | Female |
| Management | 72 (75.8%) | 23 (24.2%) |
| Business & Financial | 48 (53.3%) | 42 (46.7%) |
| Computers, Engineering & Science | 44 (59.5%) | 30 (40.5%) |
| Computers & Mathematics | 44 (67.7%) | 21 (32.3%) |
| Architecture & Engineering | 0 (0.0%) | 9 (100.0%) |
| Life, Physical & Social Science | 0 (0.0%) | 0 (0.0%) |
| Community & Social Service | 13 (9.2%) | 128 (90.8%) |
| Education, Arts & Media | 0 (0.0%) | 37 (100.0%) |
| Legal Services & Support | 0 (0.0%) | 0 (0.0%) |
| Education Instruction & Library | 0 (0.0%) | 91 (100.0%) |
| Arts, Media & Entertainment | 13 (100.0%) | 0 (0.0%) |
| Health Diagnosing & Treating | 10 (13.2%) | 66 (86.8%) |
| Health Technologists | 10 (52.6%) | 9 (47.4%) |
| Total (Category) | 187 (39.3%) | 289 (60.7%) |
| Total (Overall) | 1,145 (51.2%) | 1,091 (48.8%) |
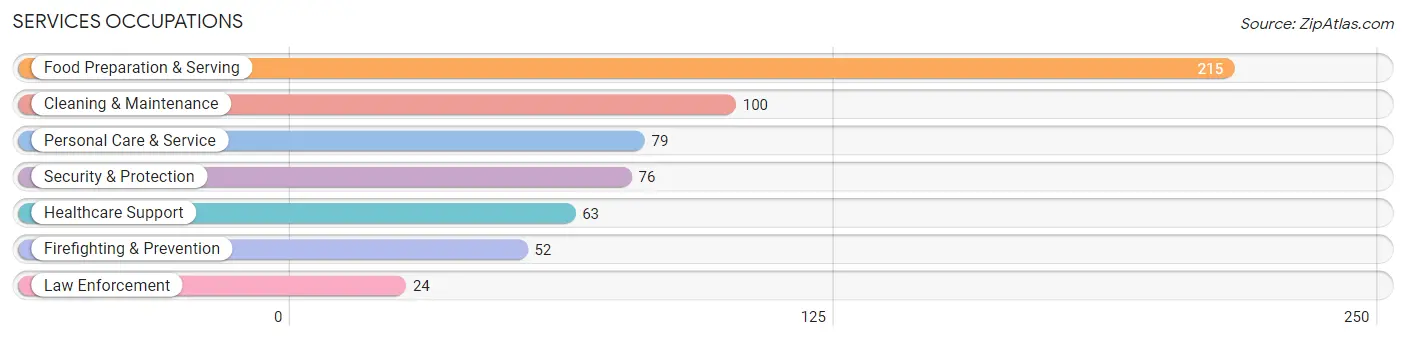
Services Occupations
The most common Services occupations in Patterson are Food Preparation & Serving (215 | 9.6%), Cleaning & Maintenance (100 | 4.5%), Personal Care & Service (79 | 3.5%), Security & Protection (76 | 3.4%), and Healthcare Support (63 | 2.8%).
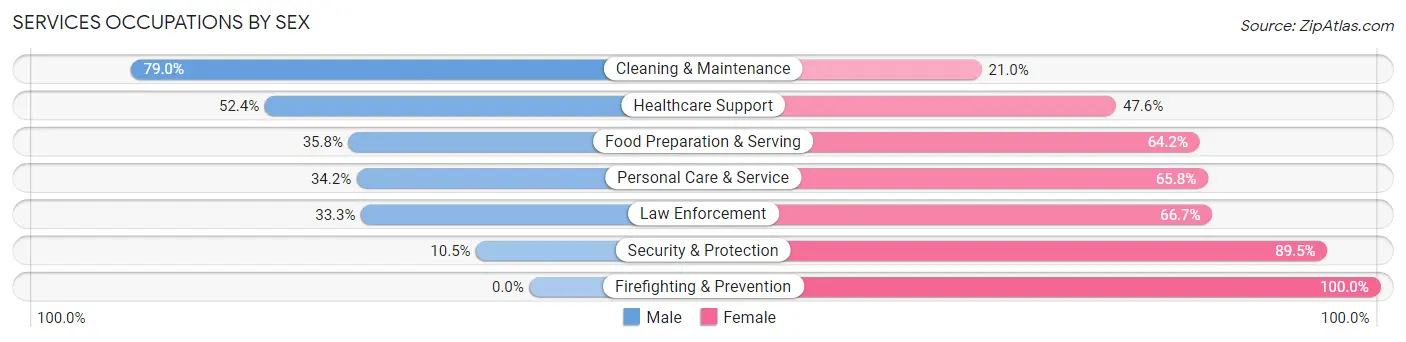
Services Occupations by Sex
Within the Services occupations in Patterson, the most male-oriented occupations are Cleaning & Maintenance (79.0%), Healthcare Support (52.4%), and Food Preparation & Serving (35.8%), while the most female-oriented occupations are Firefighting & Prevention (100.0%), Security & Protection (89.5%), and Law Enforcement (66.7%).
| Occupation | Male | Female |
| Healthcare Support | 33 (52.4%) | 30 (47.6%) |
| Security & Protection | 8 (10.5%) | 68 (89.5%) |
| Firefighting & Prevention | 0 (0.0%) | 52 (100.0%) |
| Law Enforcement | 8 (33.3%) | 16 (66.7%) |
| Food Preparation & Serving | 77 (35.8%) | 138 (64.2%) |
| Cleaning & Maintenance | 79 (79.0%) | 21 (21.0%) |
| Personal Care & Service | 27 (34.2%) | 52 (65.8%) |
| Total (Category) | 224 (42.0%) | 309 (58.0%) |
| Total (Overall) | 1,145 (51.2%) | 1,091 (48.8%) |
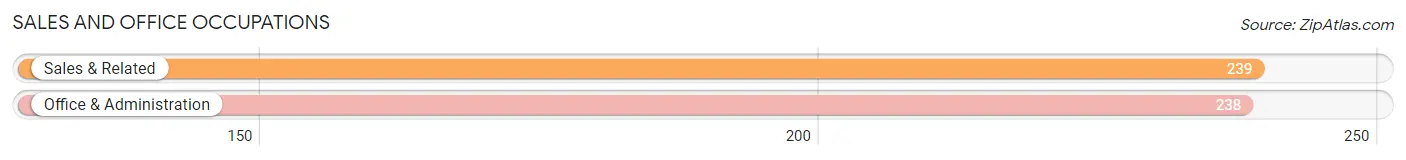
Sales and Office Occupations
The most common Sales and Office occupations in Patterson are Sales & Related (239 | 10.7%), and Office & Administration (238 | 10.6%).
Sales and Office Occupations by Sex
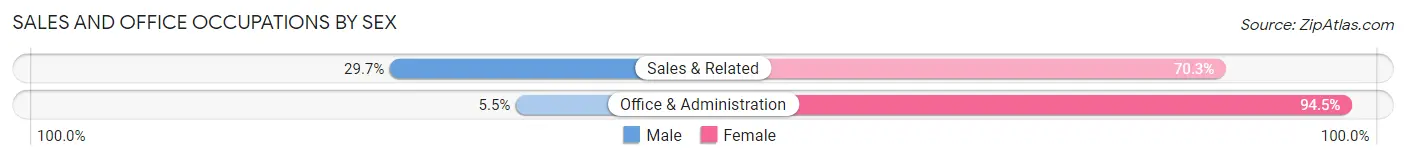
| Occupation | Male | Female |
| Sales & Related | 71 (29.7%) | 168 (70.3%) |
| Office & Administration | 13 (5.5%) | 225 (94.5%) |
| Total (Category) | 84 (17.6%) | 393 (82.4%) |
| Total (Overall) | 1,145 (51.2%) | 1,091 (48.8%) |
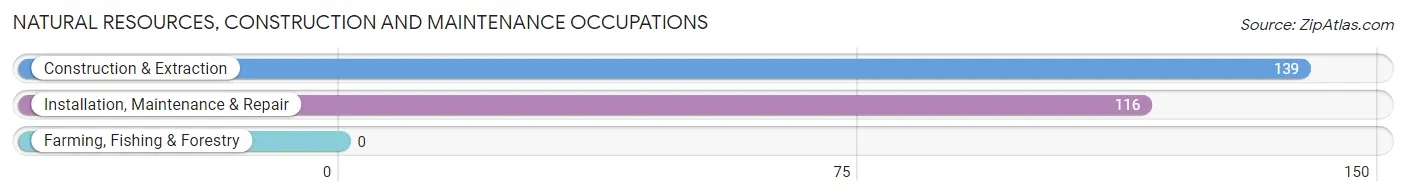
Natural Resources, Construction and Maintenance Occupations
The most common Natural Resources, Construction and Maintenance occupations in Patterson are Construction & Extraction (139 | 6.2%), and Installation, Maintenance & Repair (116 | 5.2%).
Natural Resources, Construction and Maintenance Occupations by Sex
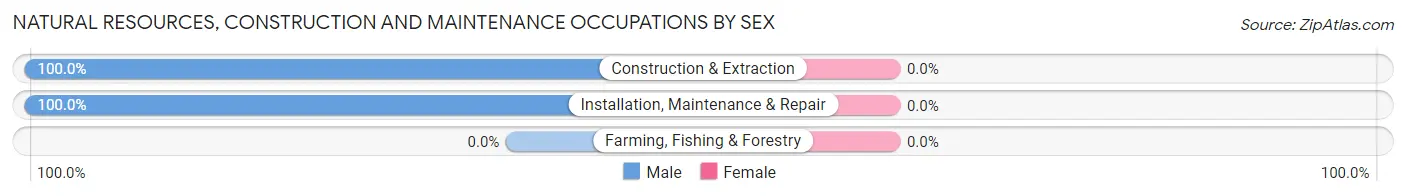
| Occupation | Male | Female |
| Farming, Fishing & Forestry | 0 (0.0%) | 0 (0.0%) |
| Construction & Extraction | 139 (100.0%) | 0 (0.0%) |
| Installation, Maintenance & Repair | 116 (100.0%) | 0 (0.0%) |
| Total (Category) | 255 (100.0%) | 0 (0.0%) |
| Total (Overall) | 1,145 (51.2%) | 1,091 (48.8%) |
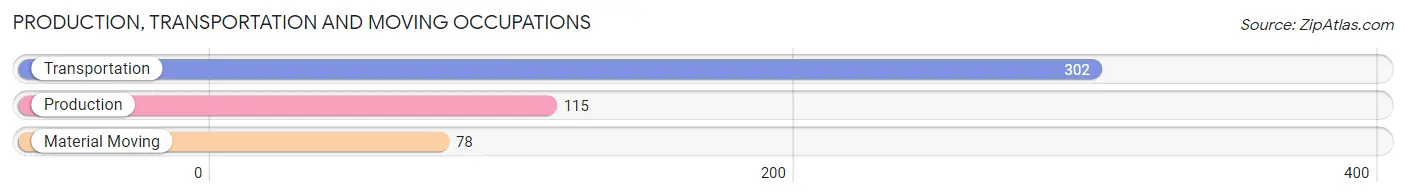
Production, Transportation and Moving Occupations
The most common Production, Transportation and Moving occupations in Patterson are Transportation (302 | 13.5%), Production (115 | 5.1%), and Material Moving (78 | 3.5%).
Production, Transportation and Moving Occupations by Sex
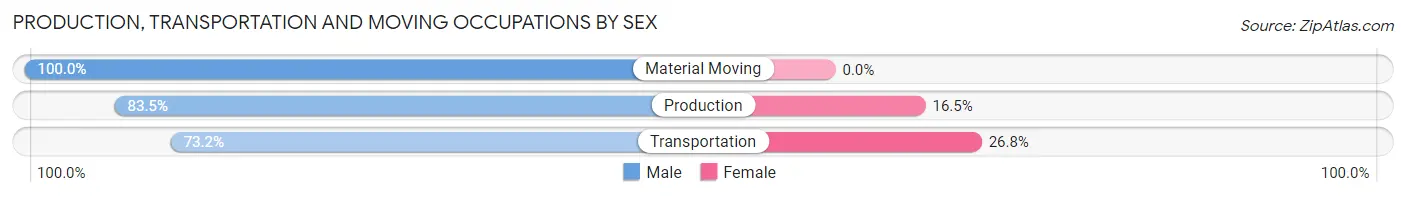
| Occupation | Male | Female |
| Production | 96 (83.5%) | 19 (16.5%) |
| Transportation | 221 (73.2%) | 81 (26.8%) |
| Material Moving | 78 (100.0%) | 0 (0.0%) |
| Total (Category) | 395 (79.8%) | 100 (20.2%) |
| Total (Overall) | 1,145 (51.2%) | 1,091 (48.8%) |
Employment Industries by Sex in Patterson
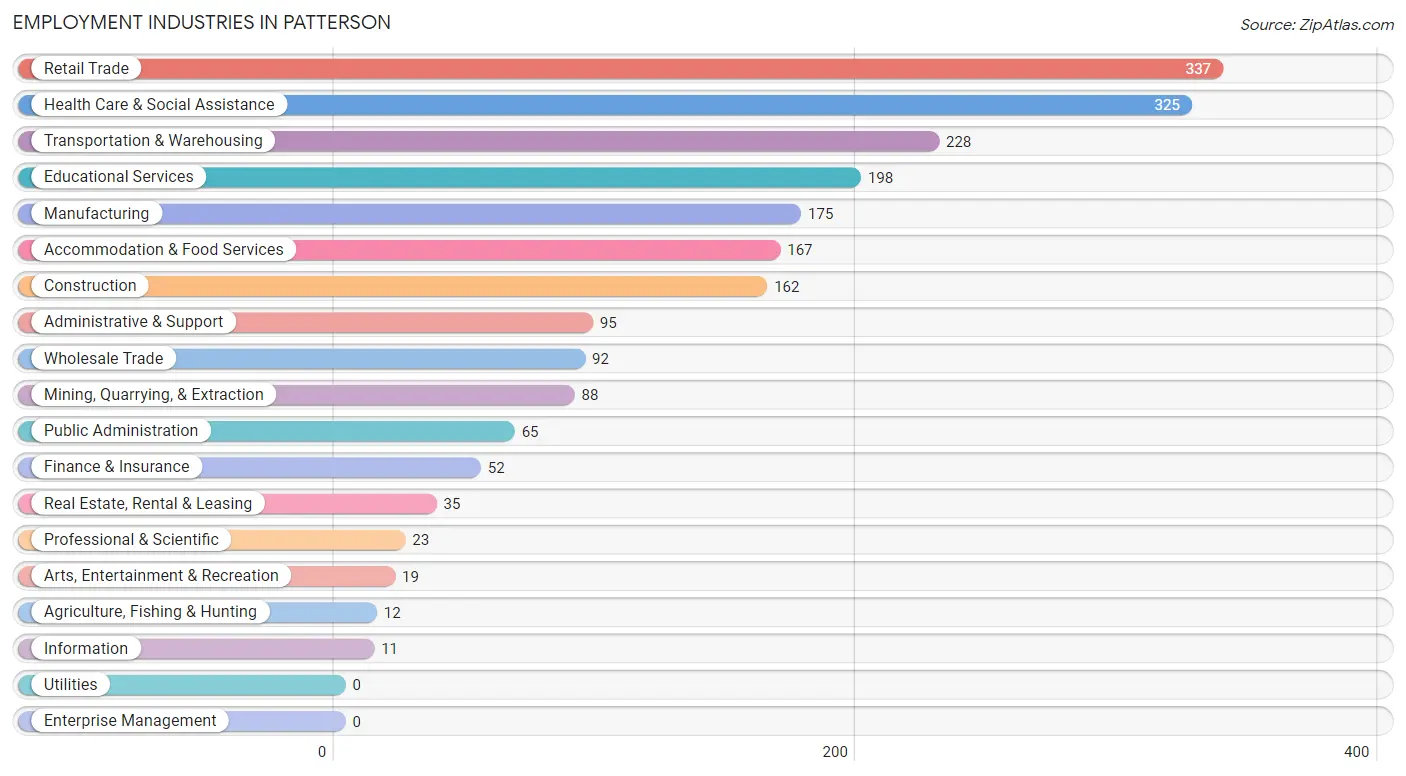
Employment Industries in Patterson
The major employment industries in Patterson include Retail Trade (337 | 15.1%), Health Care & Social Assistance (325 | 14.5%), Transportation & Warehousing (228 | 10.2%), Educational Services (198 | 8.9%), and Manufacturing (175 | 7.8%).
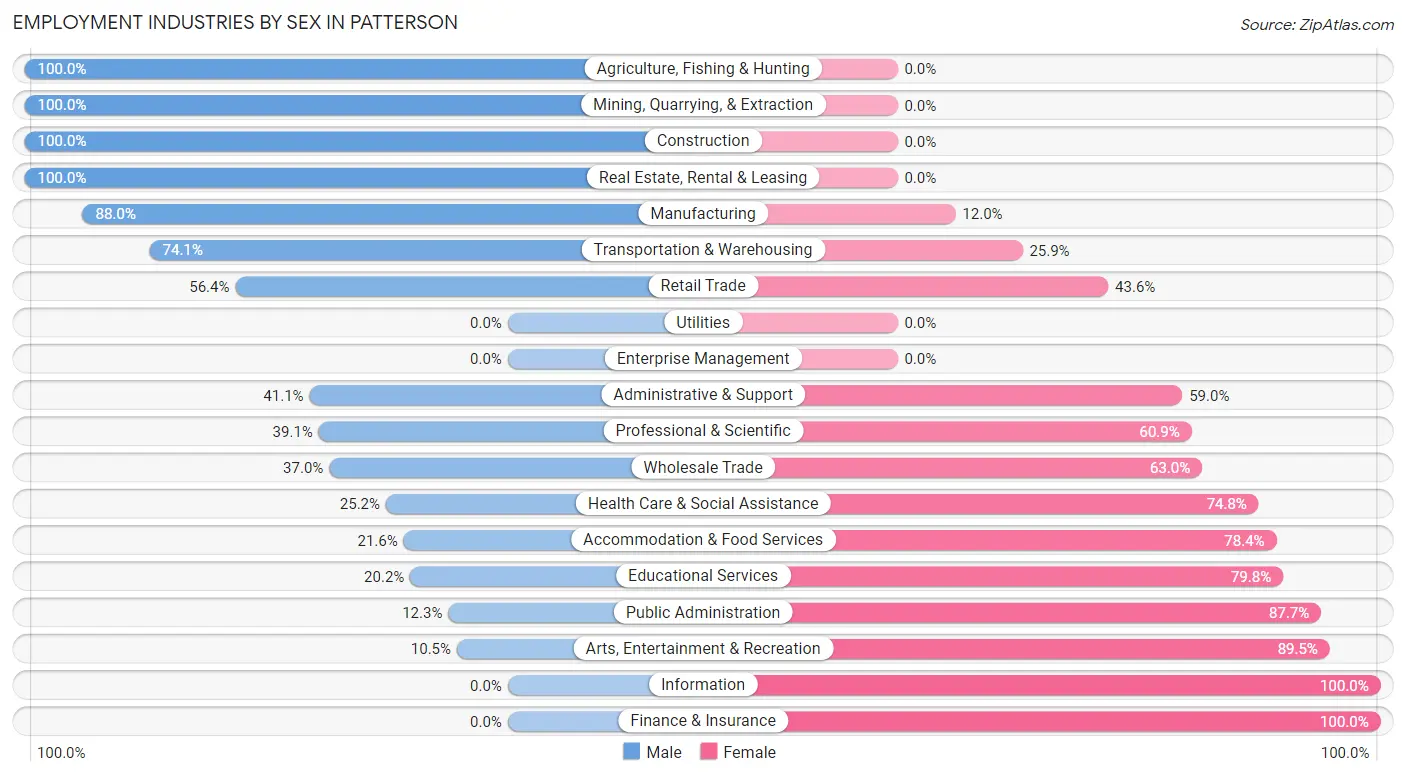
Employment Industries by Sex in Patterson
The Patterson industries that see more men than women are Agriculture, Fishing & Hunting (100.0%), Mining, Quarrying, & Extraction (100.0%), and Construction (100.0%), whereas the industries that tend to have a higher number of women are Information (100.0%), Finance & Insurance (100.0%), and Arts, Entertainment & Recreation (89.5%).
| Industry | Male | Female |
| Agriculture, Fishing & Hunting | 12 (100.0%) | 0 (0.0%) |
| Mining, Quarrying, & Extraction | 88 (100.0%) | 0 (0.0%) |
| Construction | 162 (100.0%) | 0 (0.0%) |
| Manufacturing | 154 (88.0%) | 21 (12.0%) |
| Wholesale Trade | 34 (37.0%) | 58 (63.0%) |
| Retail Trade | 190 (56.4%) | 147 (43.6%) |
| Transportation & Warehousing | 169 (74.1%) | 59 (25.9%) |
| Utilities | 0 (0.0%) | 0 (0.0%) |
| Information | 0 (0.0%) | 11 (100.0%) |
| Finance & Insurance | 0 (0.0%) | 52 (100.0%) |
| Real Estate, Rental & Leasing | 35 (100.0%) | 0 (0.0%) |
| Professional & Scientific | 9 (39.1%) | 14 (60.9%) |
| Enterprise Management | 0 (0.0%) | 0 (0.0%) |
| Administrative & Support | 39 (41.0%) | 56 (59.0%) |
| Educational Services | 40 (20.2%) | 158 (79.8%) |
| Health Care & Social Assistance | 82 (25.2%) | 243 (74.8%) |
| Arts, Entertainment & Recreation | 2 (10.5%) | 17 (89.5%) |
| Accommodation & Food Services | 36 (21.6%) | 131 (78.4%) |
| Public Administration | 8 (12.3%) | 57 (87.7%) |
| Total | 1,145 (51.2%) | 1,091 (48.8%) |
Education in Patterson
School Enrollment in Patterson
The most common levels of schooling among the 1,677 students in Patterson are middle school (501 | 29.9%), high school (446 | 26.6%), and elementary school (392 | 23.4%).
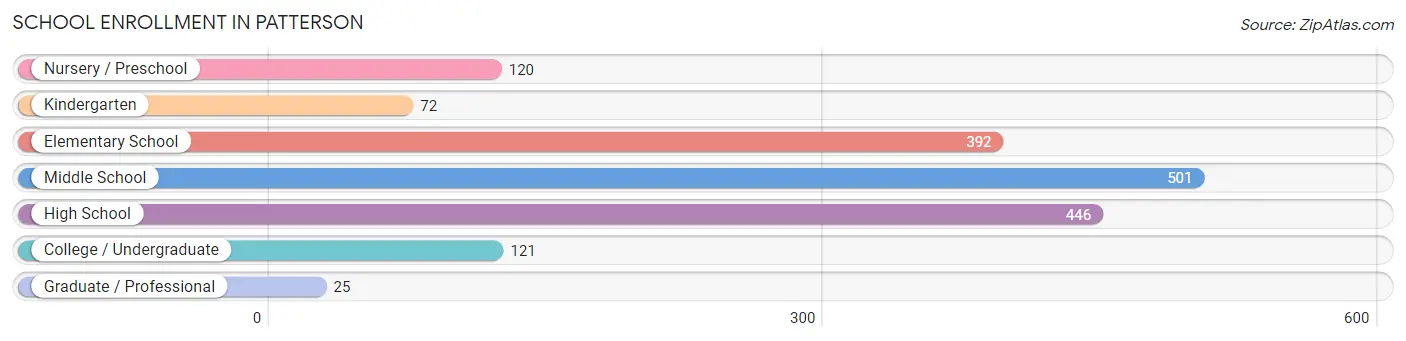
| School Level | # Students | % Students |
| Nursery / Preschool | 120 | 7.2% |
| Kindergarten | 72 | 4.3% |
| Elementary School | 392 | 23.4% |
| Middle School | 501 | 29.9% |
| High School | 446 | 26.6% |
| College / Undergraduate | 121 | 7.2% |
| Graduate / Professional | 25 | 1.5% |
| Total | 1,677 | 100.0% |
School Enrollment by Age by Funding Source in Patterson
Out of a total of 1,677 students who are enrolled in schools in Patterson, 211 (12.6%) attend a private institution, while the remaining 1,466 (87.4%) are enrolled in public schools. The age group of 3 to 4 year olds has the highest likelihood of being enrolled in private schools, with 36 (45.0% in the age bracket) enrolled. Conversely, the age group of 18 to 19 year olds has the lowest likelihood of being enrolled in a private school, with 34 (100.0% in the age bracket) attending a public institution.
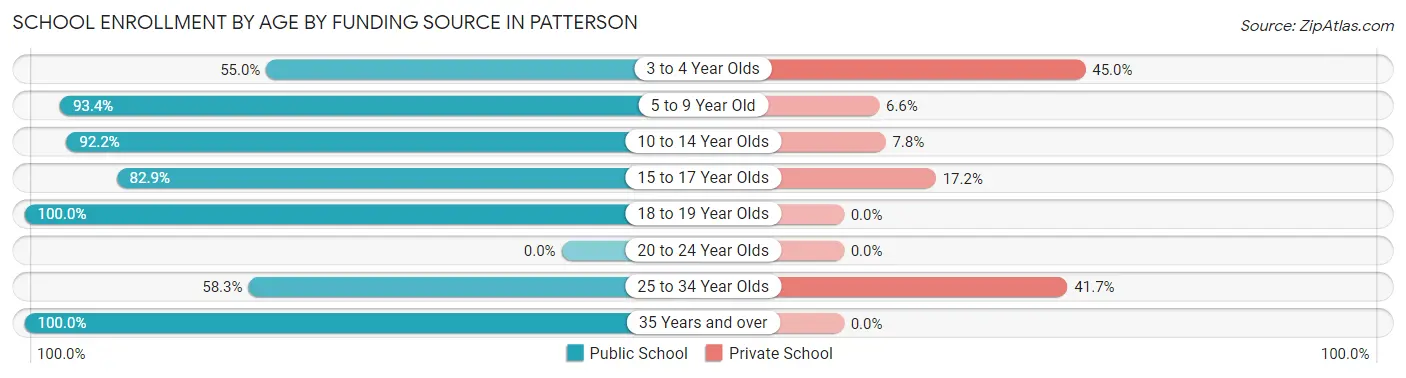
| Age Bracket | Public School | Private School |
| 3 to 4 Year Olds | 44 (55.0%) | 36 (45.0%) |
| 5 to 9 Year Old | 383 (93.4%) | 27 (6.6%) |
| 10 to 14 Year Olds | 497 (92.2%) | 42 (7.8%) |
| 15 to 17 Year Olds | 396 (82.9%) | 82 (17.2%) |
| 18 to 19 Year Olds | 34 (100.0%) | 0 (0.0%) |
| 20 to 24 Year Olds | 0 (0.0%) | 0 (0.0%) |
| 25 to 34 Year Olds | 35 (58.3%) | 25 (41.7%) |
| 35 Years and over | 76 (100.0%) | 0 (0.0%) |
| Total | 1,466 (87.4%) | 211 (12.6%) |
Educational Attainment by Field of Study in Patterson
Education (56 | 22.8%), liberal arts & history (39 | 15.9%), computers & mathematics (35 | 14.2%), psychology (25 | 10.2%), and business (20 | 8.1%) are the most common fields of study among 246 individuals in Patterson who have obtained a bachelor's degree or higher.
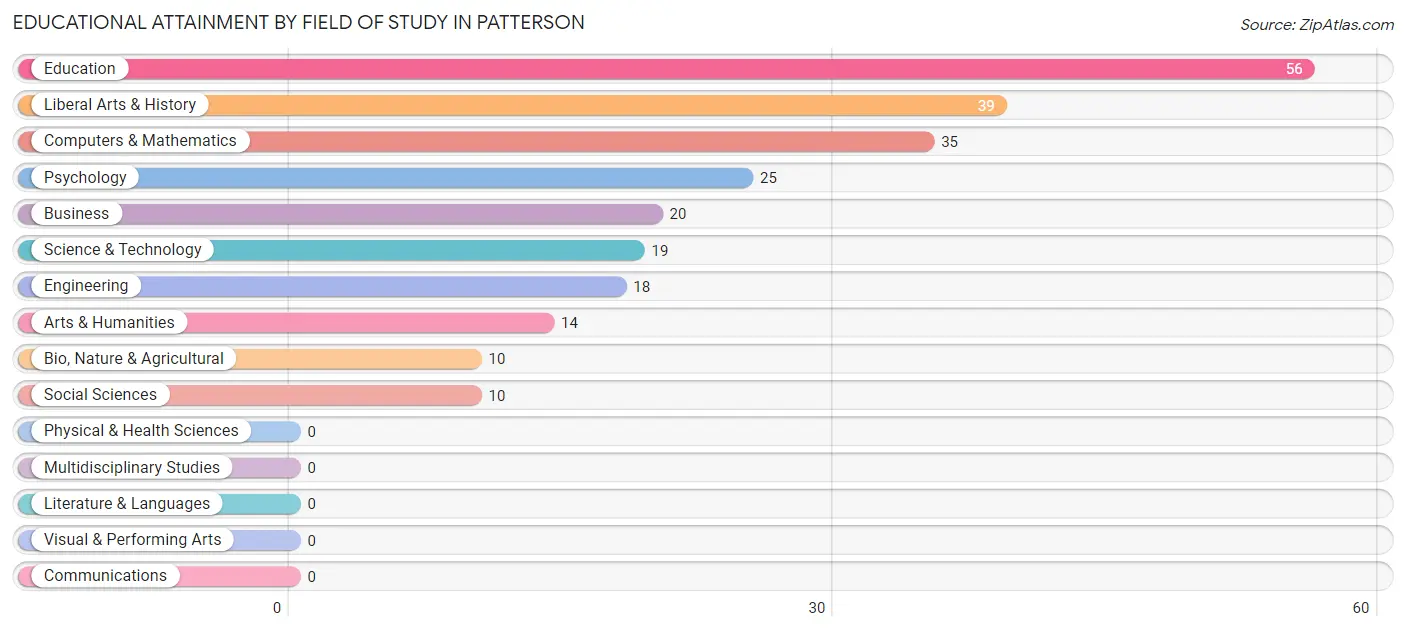
| Field of Study | # Graduates | % Graduates |
| Computers & Mathematics | 35 | 14.2% |
| Bio, Nature & Agricultural | 10 | 4.1% |
| Physical & Health Sciences | 0 | 0.0% |
| Psychology | 25 | 10.2% |
| Social Sciences | 10 | 4.1% |
| Engineering | 18 | 7.3% |
| Multidisciplinary Studies | 0 | 0.0% |
| Science & Technology | 19 | 7.7% |
| Business | 20 | 8.1% |
| Education | 56 | 22.8% |
| Literature & Languages | 0 | 0.0% |
| Liberal Arts & History | 39 | 15.9% |
| Visual & Performing Arts | 0 | 0.0% |
| Communications | 0 | 0.0% |
| Arts & Humanities | 14 | 5.7% |
| Total | 246 | 100.0% |
Transportation & Commute in Patterson
Vehicle Availability by Sex in Patterson
The most prevalent vehicle ownership categories in Patterson are males with 2 vehicles (346, accounting for 30.2%) and females with 2 vehicles (407, making up 32.9%).
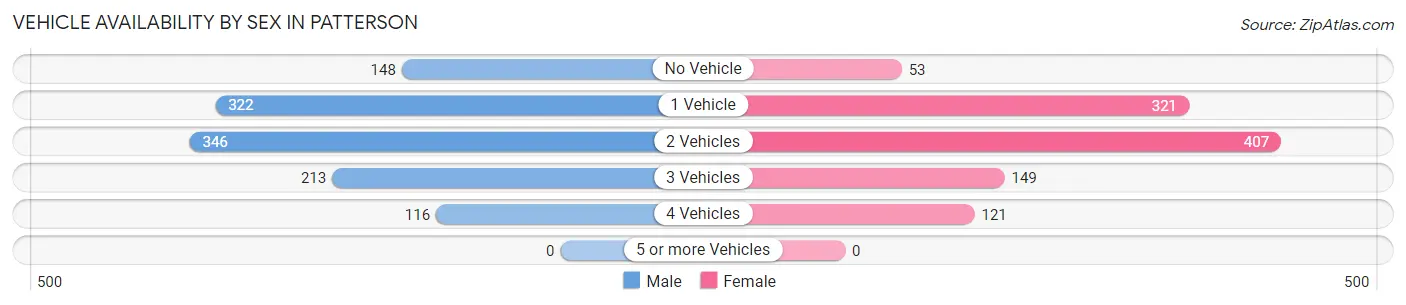
| Vehicles Available | Male | Female |
| No Vehicle | 148 (12.9%) | 53 (5.0%) |
| 1 Vehicle | 322 (28.1%) | 321 (30.5%) |
| 2 Vehicles | 346 (30.2%) | 407 (38.7%) |
| 3 Vehicles | 213 (18.6%) | 149 (14.2%) |
| 4 Vehicles | 116 (10.1%) | 121 (11.5%) |
| 5 or more Vehicles | 0 (0.0%) | 0 (0.0%) |
| Total | 1,145 (100.0%) | 1,051 (100.0%) |
Commute Time in Patterson
The most frequently occuring commute durations in Patterson are 5 to 9 minutes (360 commuters, 17.5%), 20 to 24 minutes (324 commuters, 15.8%), and 10 to 14 minutes (315 commuters, 15.3%).
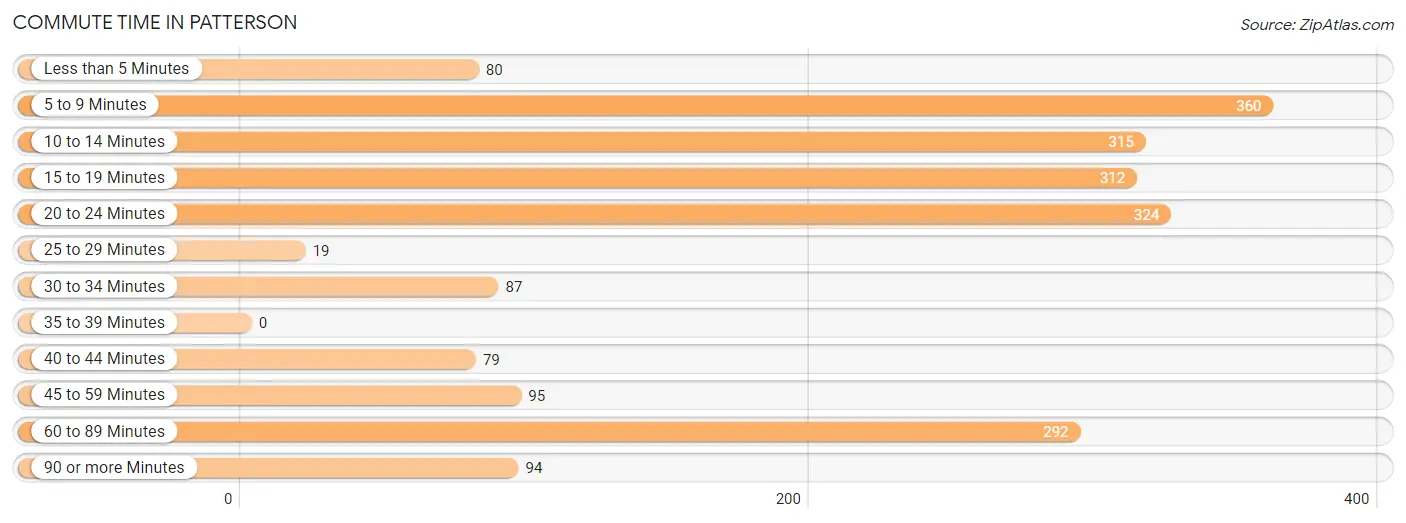
| Commute Time | # Commuters | % Commuters |
| Less than 5 Minutes | 80 | 3.9% |
| 5 to 9 Minutes | 360 | 17.5% |
| 10 to 14 Minutes | 315 | 15.3% |
| 15 to 19 Minutes | 312 | 15.2% |
| 20 to 24 Minutes | 324 | 15.8% |
| 25 to 29 Minutes | 19 | 0.9% |
| 30 to 34 Minutes | 87 | 4.2% |
| 35 to 39 Minutes | 0 | 0.0% |
| 40 to 44 Minutes | 79 | 3.8% |
| 45 to 59 Minutes | 95 | 4.6% |
| 60 to 89 Minutes | 292 | 14.2% |
| 90 or more Minutes | 94 | 4.6% |
Commute Time by Sex in Patterson
The most common commute times in Patterson are 60 to 89 minutes (209 commuters, 18.9%) for males and 15 to 19 minutes (200 commuters, 21.0%) for females.
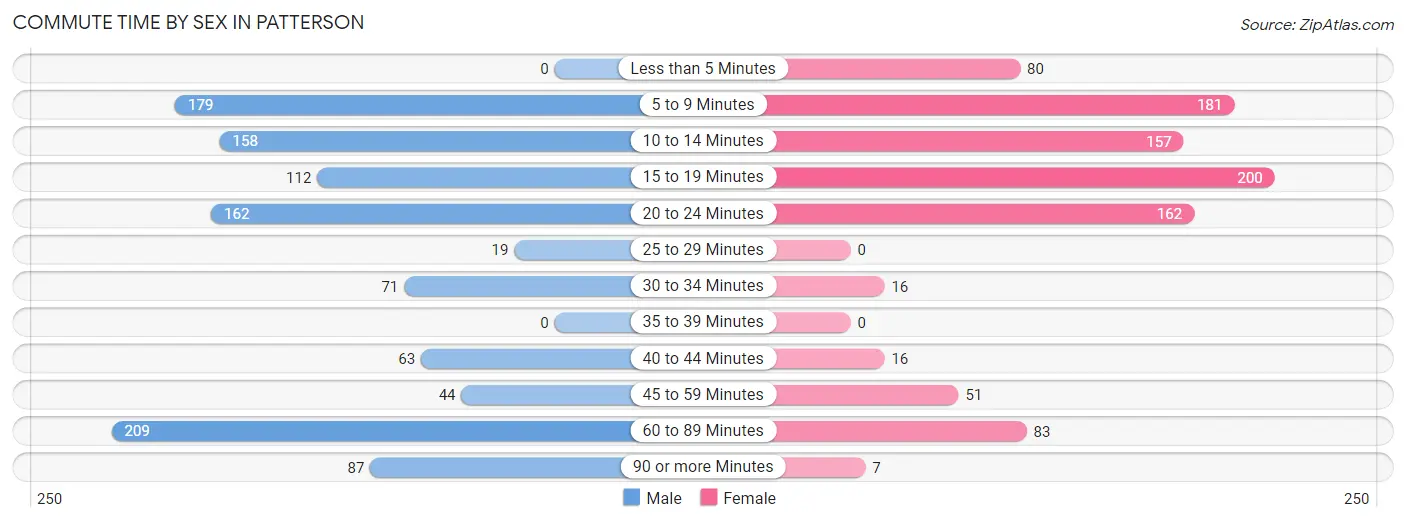
| Commute Time | Male | Female |
| Less than 5 Minutes | 0 (0.0%) | 80 (8.4%) |
| 5 to 9 Minutes | 179 (16.2%) | 181 (19.0%) |
| 10 to 14 Minutes | 158 (14.3%) | 157 (16.5%) |
| 15 to 19 Minutes | 112 (10.1%) | 200 (21.0%) |
| 20 to 24 Minutes | 162 (14.7%) | 162 (17.0%) |
| 25 to 29 Minutes | 19 (1.7%) | 0 (0.0%) |
| 30 to 34 Minutes | 71 (6.4%) | 16 (1.7%) |
| 35 to 39 Minutes | 0 (0.0%) | 0 (0.0%) |
| 40 to 44 Minutes | 63 (5.7%) | 16 (1.7%) |
| 45 to 59 Minutes | 44 (4.0%) | 51 (5.3%) |
| 60 to 89 Minutes | 209 (18.9%) | 83 (8.7%) |
| 90 or more Minutes | 87 (7.9%) | 7 (0.7%) |
Time of Departure to Work by Sex in Patterson
The most frequent times of departure to work in Patterson are 7:00 AM to 7:29 AM (299, 27.1%) for males and 7:00 AM to 7:29 AM (381, 40.0%) for females.
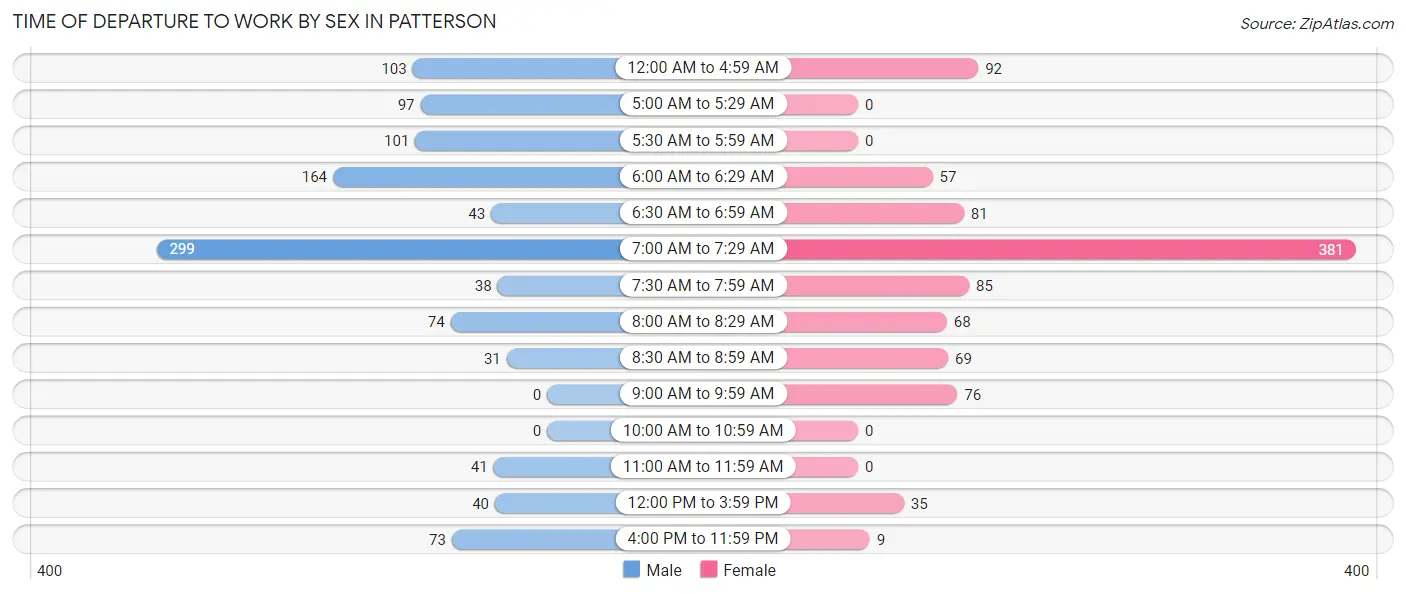
| Time of Departure | Male | Female |
| 12:00 AM to 4:59 AM | 103 (9.3%) | 92 (9.7%) |
| 5:00 AM to 5:29 AM | 97 (8.8%) | 0 (0.0%) |
| 5:30 AM to 5:59 AM | 101 (9.1%) | 0 (0.0%) |
| 6:00 AM to 6:29 AM | 164 (14.9%) | 57 (6.0%) |
| 6:30 AM to 6:59 AM | 43 (3.9%) | 81 (8.5%) |
| 7:00 AM to 7:29 AM | 299 (27.1%) | 381 (40.0%) |
| 7:30 AM to 7:59 AM | 38 (3.4%) | 85 (8.9%) |
| 8:00 AM to 8:29 AM | 74 (6.7%) | 68 (7.1%) |
| 8:30 AM to 8:59 AM | 31 (2.8%) | 69 (7.2%) |
| 9:00 AM to 9:59 AM | 0 (0.0%) | 76 (8.0%) |
| 10:00 AM to 10:59 AM | 0 (0.0%) | 0 (0.0%) |
| 11:00 AM to 11:59 AM | 41 (3.7%) | 0 (0.0%) |
| 12:00 PM to 3:59 PM | 40 (3.6%) | 35 (3.7%) |
| 4:00 PM to 11:59 PM | 73 (6.6%) | 9 (0.9%) |
| Total | 1,104 (100.0%) | 953 (100.0%) |
Housing Occupancy in Patterson
Occupancy by Ownership in Patterson
Of the total 1,939 dwellings in Patterson, owner-occupied units account for 1,074 (55.4%), while renter-occupied units make up 865 (44.6%).
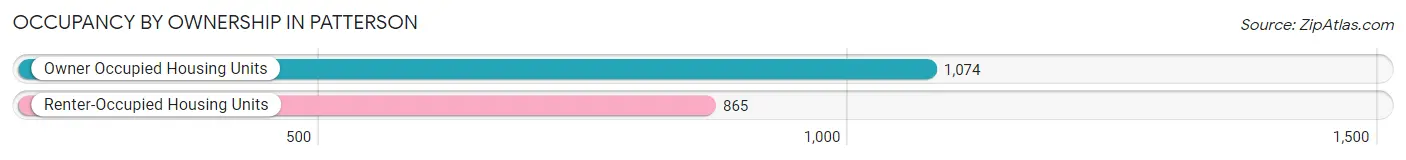
| Occupancy | # Housing Units | % Housing Units |
| Owner Occupied Housing Units | 1,074 | 55.4% |
| Renter-Occupied Housing Units | 865 | 44.6% |
| Total Occupied Housing Units | 1,939 | 100.0% |
Occupancy by Household Size in Patterson
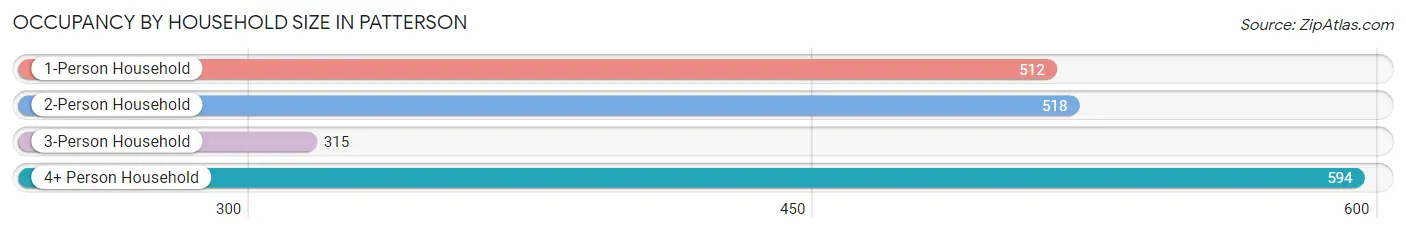
| Household Size | # Housing Units | % Housing Units |
| 1-Person Household | 512 | 26.4% |
| 2-Person Household | 518 | 26.7% |
| 3-Person Household | 315 | 16.3% |
| 4+ Person Household | 594 | 30.6% |
| Total Housing Units | 1,939 | 100.0% |
Occupancy by Ownership by Household Size in Patterson
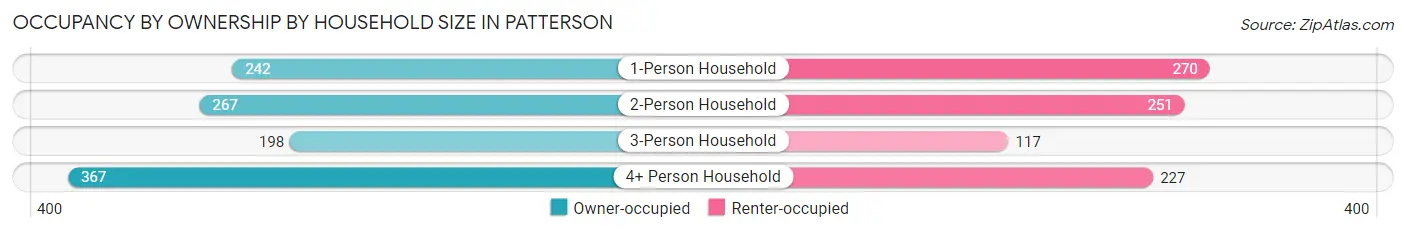
| Household Size | Owner-occupied | Renter-occupied |
| 1-Person Household | 242 (47.3%) | 270 (52.7%) |
| 2-Person Household | 267 (51.5%) | 251 (48.5%) |
| 3-Person Household | 198 (62.9%) | 117 (37.1%) |
| 4+ Person Household | 367 (61.8%) | 227 (38.2%) |
| Total Housing Units | 1,074 (55.4%) | 865 (44.6%) |
Occupancy by Educational Attainment in Patterson
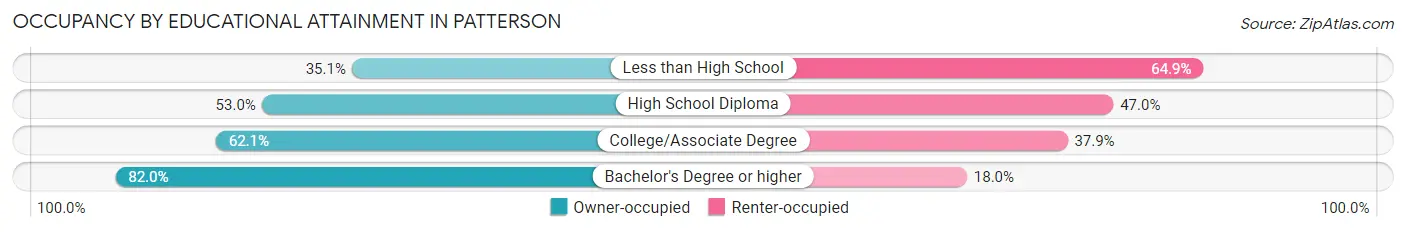
| Household Size | Owner-occupied | Renter-occupied |
| Less than High School | 91 (35.1%) | 168 (64.9%) |
| High School Diploma | 557 (53.0%) | 494 (47.0%) |
| College/Associate Degree | 280 (62.1%) | 171 (37.9%) |
| Bachelor's Degree or higher | 146 (82.0%) | 32 (18.0%) |
Occupancy by Age of Householder in Patterson
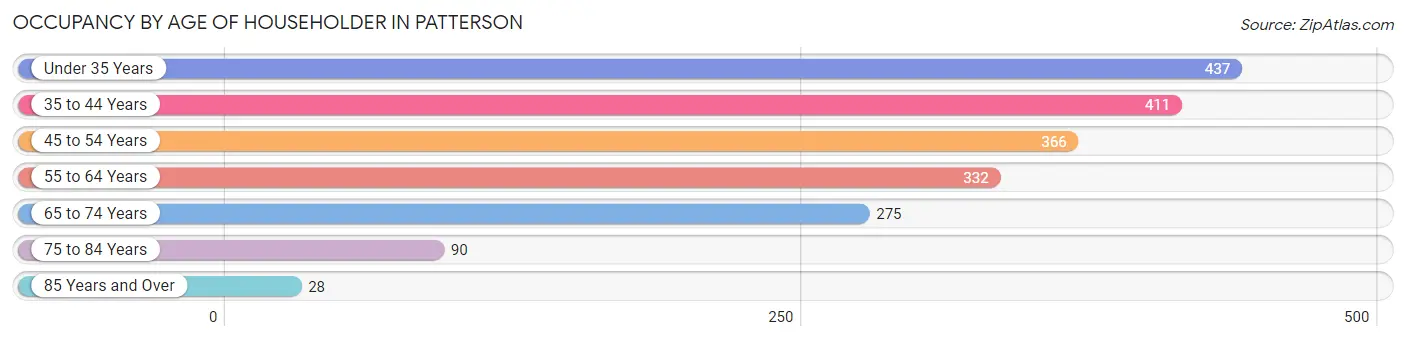
| Age Bracket | # Households | % Households |
| Under 35 Years | 437 | 22.5% |
| 35 to 44 Years | 411 | 21.2% |
| 45 to 54 Years | 366 | 18.9% |
| 55 to 64 Years | 332 | 17.1% |
| 65 to 74 Years | 275 | 14.2% |
| 75 to 84 Years | 90 | 4.6% |
| 85 Years and Over | 28 | 1.4% |
| Total | 1,939 | 100.0% |
Housing Finances in Patterson
Median Income by Occupancy in Patterson
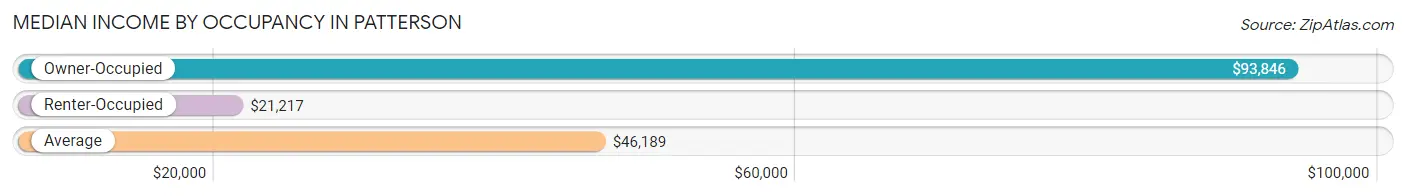
| Occupancy Type | # Households | Median Income |
| Owner-Occupied | 1,074 (55.4%) | $93,846 |
| Renter-Occupied | 865 (44.6%) | $21,217 |
| Average | 1,939 (100.0%) | $46,189 |
Occupancy by Householder Income Bracket in Patterson
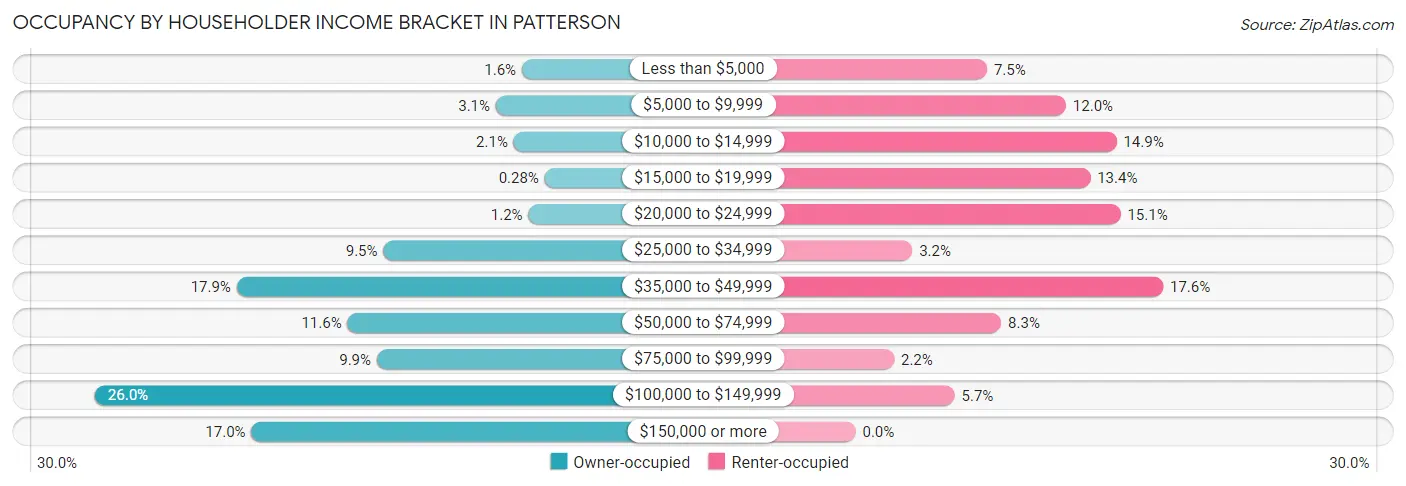
| Income Bracket | Owner-occupied | Renter-occupied |
| Less than $5,000 | 17 (1.6%) | 65 (7.5%) |
| $5,000 to $9,999 | 33 (3.1%) | 104 (12.0%) |
| $10,000 to $14,999 | 22 (2.1%) | 129 (14.9%) |
| $15,000 to $19,999 | 3 (0.3%) | 116 (13.4%) |
| $20,000 to $24,999 | 13 (1.2%) | 131 (15.1%) |
| $25,000 to $34,999 | 102 (9.5%) | 28 (3.2%) |
| $35,000 to $49,999 | 192 (17.9%) | 152 (17.6%) |
| $50,000 to $74,999 | 124 (11.6%) | 72 (8.3%) |
| $75,000 to $99,999 | 106 (9.9%) | 19 (2.2%) |
| $100,000 to $149,999 | 279 (26.0%) | 49 (5.7%) |
| $150,000 or more | 183 (17.0%) | 0 (0.0%) |
| Total | 1,074 (100.0%) | 865 (100.0%) |
Monthly Housing Cost Tiers in Patterson
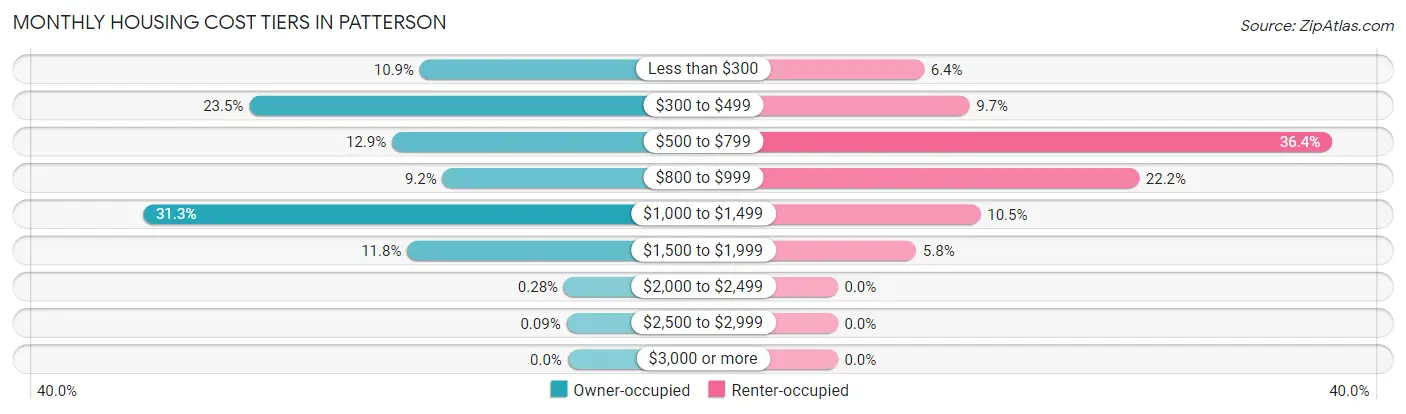
| Monthly Cost | Owner-occupied | Renter-occupied |
| Less than $300 | 117 (10.9%) | 55 (6.4%) |
| $300 to $499 | 252 (23.5%) | 84 (9.7%) |
| $500 to $799 | 139 (12.9%) | 315 (36.4%) |
| $800 to $999 | 99 (9.2%) | 192 (22.2%) |
| $1,000 to $1,499 | 336 (31.3%) | 91 (10.5%) |
| $1,500 to $1,999 | 127 (11.8%) | 50 (5.8%) |
| $2,000 to $2,499 | 3 (0.3%) | 0 (0.0%) |
| $2,500 to $2,999 | 1 (0.1%) | 0 (0.0%) |
| $3,000 or more | 0 (0.0%) | 0 (0.0%) |
| Total | 1,074 (100.0%) | 865 (100.0%) |
Physical Housing Characteristics in Patterson
Housing Structures in Patterson
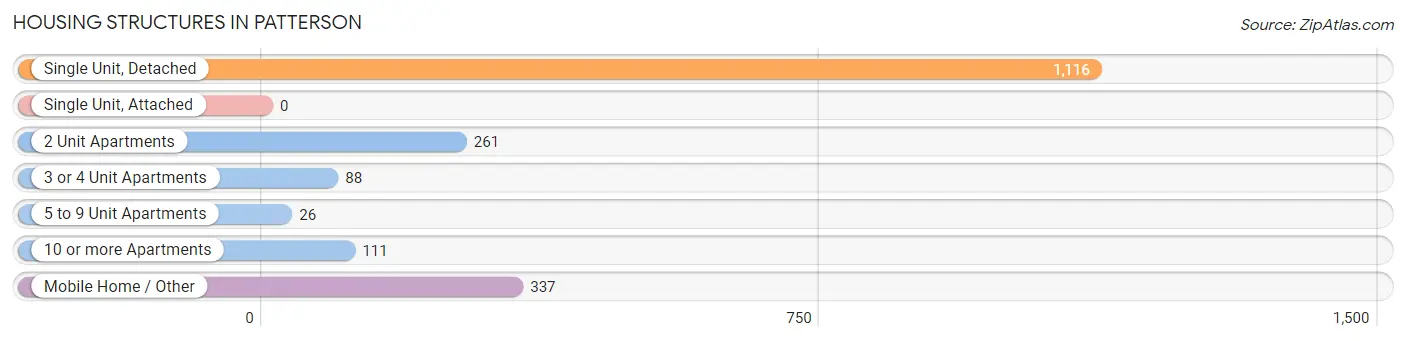
| Structure Type | # Housing Units | % Housing Units |
| Single Unit, Detached | 1,116 | 57.6% |
| Single Unit, Attached | 0 | 0.0% |
| 2 Unit Apartments | 261 | 13.5% |
| 3 or 4 Unit Apartments | 88 | 4.5% |
| 5 to 9 Unit Apartments | 26 | 1.3% |
| 10 or more Apartments | 111 | 5.7% |
| Mobile Home / Other | 337 | 17.4% |
| Total | 1,939 | 100.0% |
Housing Structures by Occupancy in Patterson
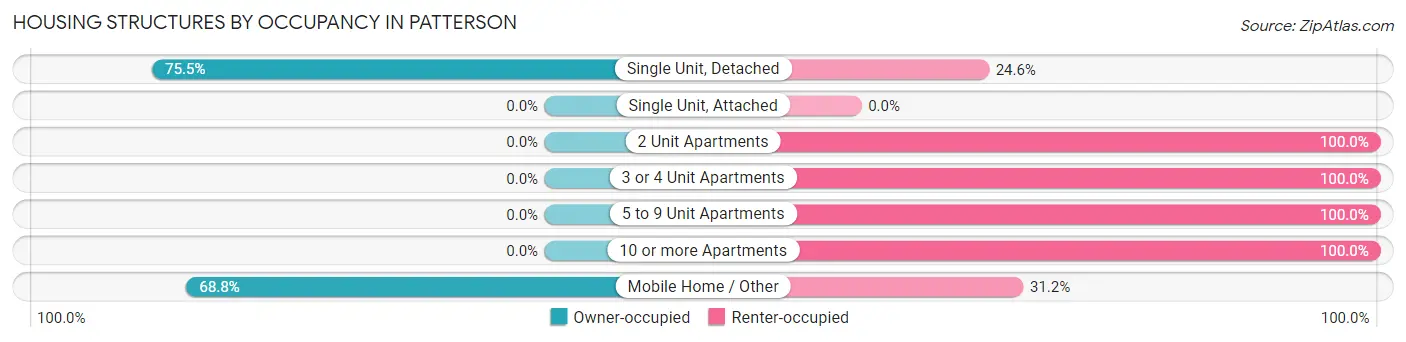
| Structure Type | Owner-occupied | Renter-occupied |
| Single Unit, Detached | 842 (75.4%) | 274 (24.5%) |
| Single Unit, Attached | 0 (0.0%) | 0 (0.0%) |
| 2 Unit Apartments | 0 (0.0%) | 261 (100.0%) |
| 3 or 4 Unit Apartments | 0 (0.0%) | 88 (100.0%) |
| 5 to 9 Unit Apartments | 0 (0.0%) | 26 (100.0%) |
| 10 or more Apartments | 0 (0.0%) | 111 (100.0%) |
| Mobile Home / Other | 232 (68.8%) | 105 (31.2%) |
| Total | 1,074 (55.4%) | 865 (44.6%) |
Housing Structures by Number of Rooms in Patterson
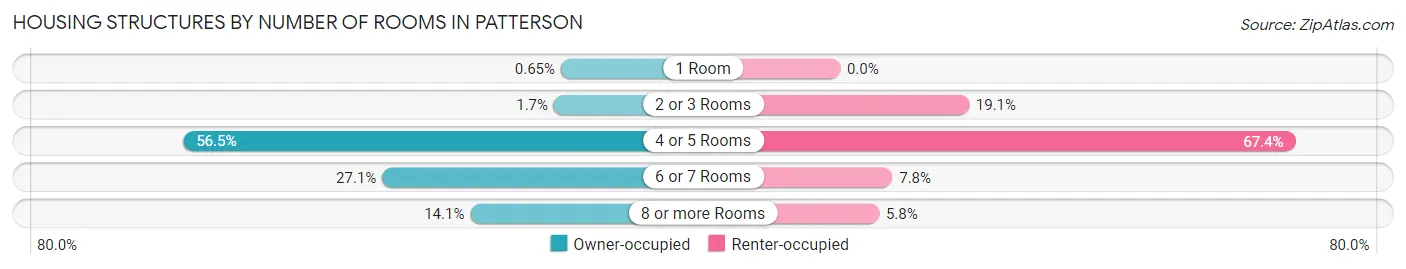
| Number of Rooms | Owner-occupied | Renter-occupied |
| 1 Room | 7 (0.6%) | 0 (0.0%) |
| 2 or 3 Rooms | 18 (1.7%) | 165 (19.1%) |
| 4 or 5 Rooms | 607 (56.5%) | 583 (67.4%) |
| 6 or 7 Rooms | 291 (27.1%) | 67 (7.7%) |
| 8 or more Rooms | 151 (14.1%) | 50 (5.8%) |
| Total | 1,074 (100.0%) | 865 (100.0%) |
Housing Structure by Heating Type in Patterson
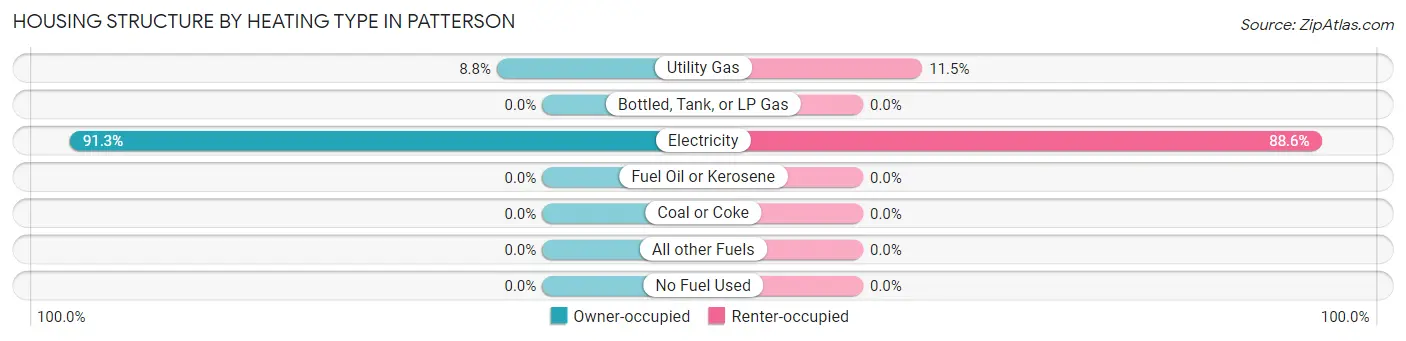
| Heating Type | Owner-occupied | Renter-occupied |
| Utility Gas | 94 (8.7%) | 99 (11.5%) |
| Bottled, Tank, or LP Gas | 0 (0.0%) | 0 (0.0%) |
| Electricity | 980 (91.2%) | 766 (88.5%) |
| Fuel Oil or Kerosene | 0 (0.0%) | 0 (0.0%) |
| Coal or Coke | 0 (0.0%) | 0 (0.0%) |
| All other Fuels | 0 (0.0%) | 0 (0.0%) |
| No Fuel Used | 0 (0.0%) | 0 (0.0%) |
| Total | 1,074 (100.0%) | 865 (100.0%) |
Household Vehicle Usage in Patterson
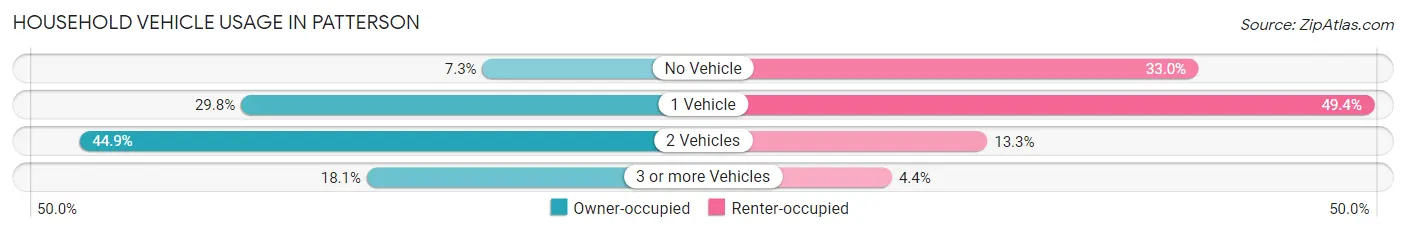
| Vehicles per Household | Owner-occupied | Renter-occupied |
| No Vehicle | 78 (7.3%) | 285 (33.0%) |
| 1 Vehicle | 320 (29.8%) | 427 (49.4%) |
| 2 Vehicles | 482 (44.9%) | 115 (13.3%) |
| 3 or more Vehicles | 194 (18.1%) | 38 (4.4%) |
| Total | 1,074 (100.0%) | 865 (100.0%) |
Real Estate & Mortgages in Patterson
Real Estate and Mortgage Overview in Patterson
| Characteristic | Without Mortgage | With Mortgage |
| Housing Units | 491 | 583 |
| Median Property Value | $88,000 | $174,100 |
| Median Household Income | - | - |
| Monthly Housing Costs | $377 | $0 |
| Real Estate Taxes | $199 | $118 |
Property Value by Mortgage Status in Patterson
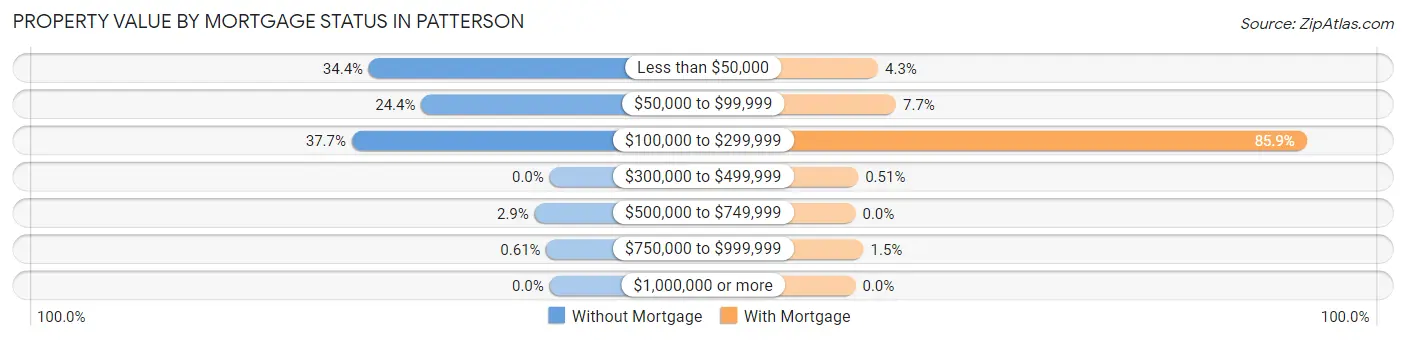
| Property Value | Without Mortgage | With Mortgage |
| Less than $50,000 | 169 (34.4%) | 25 (4.3%) |
| $50,000 to $99,999 | 120 (24.4%) | 45 (7.7%) |
| $100,000 to $299,999 | 185 (37.7%) | 501 (85.9%) |
| $300,000 to $499,999 | 0 (0.0%) | 3 (0.5%) |
| $500,000 to $749,999 | 14 (2.9%) | 0 (0.0%) |
| $750,000 to $999,999 | 3 (0.6%) | 9 (1.5%) |
| $1,000,000 or more | 0 (0.0%) | 0 (0.0%) |
| Total | 491 (100.0%) | 583 (100.0%) |
Household Income by Mortgage Status in Patterson
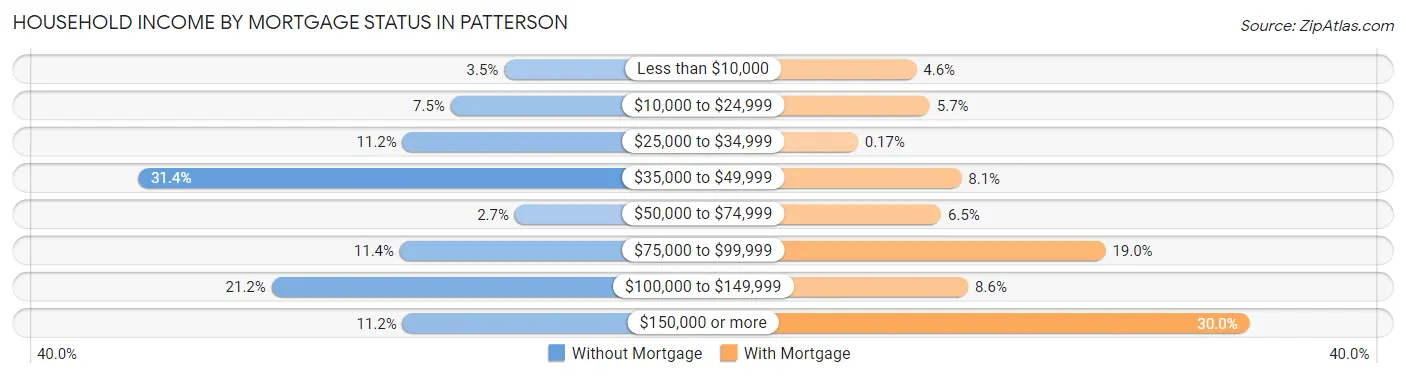
| Household Income | Without Mortgage | With Mortgage |
| Less than $10,000 | 17 (3.5%) | 27 (4.6%) |
| $10,000 to $24,999 | 37 (7.5%) | 33 (5.7%) |
| $25,000 to $34,999 | 55 (11.2%) | 1 (0.2%) |
| $35,000 to $49,999 | 154 (31.4%) | 47 (8.1%) |
| $50,000 to $74,999 | 13 (2.6%) | 38 (6.5%) |
| $75,000 to $99,999 | 56 (11.4%) | 111 (19.0%) |
| $100,000 to $149,999 | 104 (21.2%) | 50 (8.6%) |
| $150,000 or more | 55 (11.2%) | 175 (30.0%) |
| Total | 491 (100.0%) | 583 (100.0%) |
Property Value to Household Income Ratio in Patterson
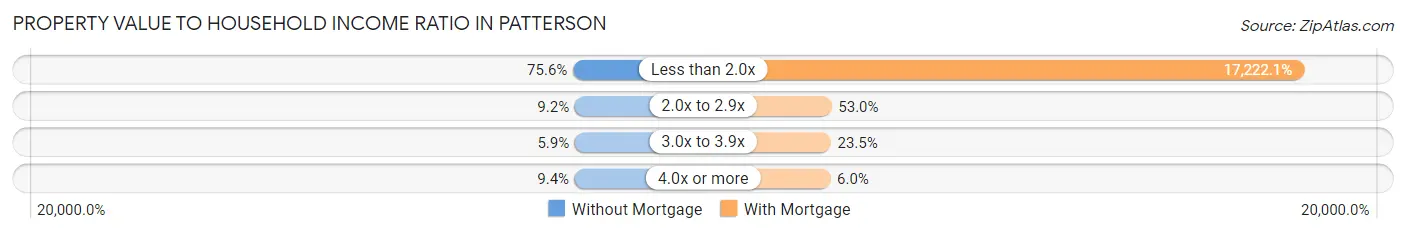
| Value-to-Income Ratio | Without Mortgage | With Mortgage |
| Less than 2.0x | 371 (75.6%) | 100,405 (17,222.1%) |
| 2.0x to 2.9x | 45 (9.2%) | 309 (53.0%) |
| 3.0x to 3.9x | 29 (5.9%) | 137 (23.5%) |
| 4.0x or more | 46 (9.4%) | 35 (6.0%) |
| Total | 491 (100.0%) | 583 (100.0%) |
Real Estate Taxes by Mortgage Status in Patterson
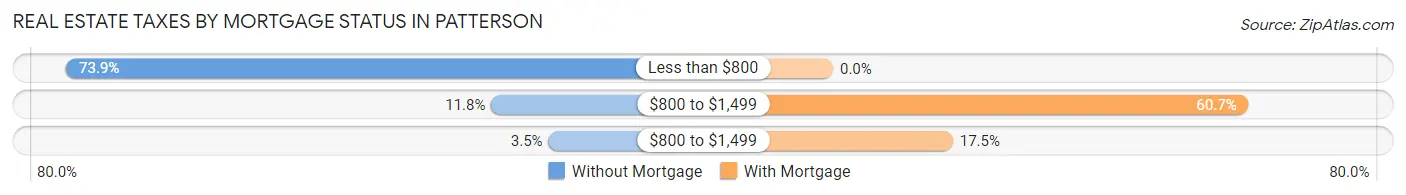
| Property Taxes | Without Mortgage | With Mortgage |
| Less than $800 | 363 (73.9%) | 0 (0.0%) |
| $800 to $1,499 | 58 (11.8%) | 354 (60.7%) |
| $800 to $1,499 | 17 (3.5%) | 102 (17.5%) |
| Total | 491 (100.0%) | 583 (100.0%) |
Health & Disability in Patterson
Health Insurance Coverage by Age in Patterson
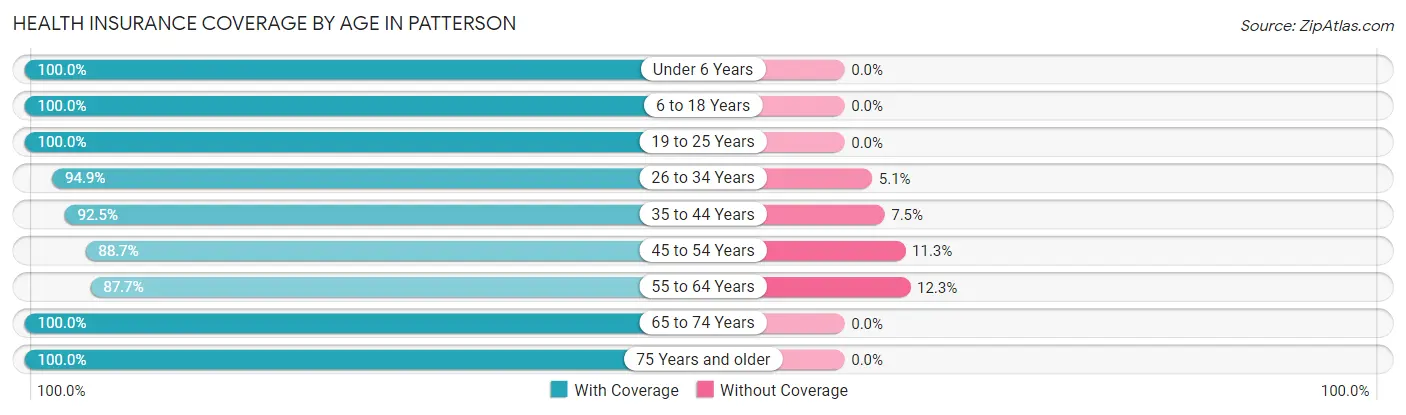
| Age Bracket | With Coverage | Without Coverage |
| Under 6 Years | 517 (100.0%) | 0 (0.0%) |
| 6 to 18 Years | 1,366 (100.0%) | 0 (0.0%) |
| 19 to 25 Years | 538 (100.0%) | 0 (0.0%) |
| 26 to 34 Years | 665 (94.9%) | 36 (5.1%) |
| 35 to 44 Years | 744 (92.5%) | 60 (7.5%) |
| 45 to 54 Years | 641 (88.7%) | 82 (11.3%) |
| 55 to 64 Years | 465 (87.7%) | 65 (12.3%) |
| 65 to 74 Years | 446 (100.0%) | 0 (0.0%) |
| 75 Years and older | 137 (100.0%) | 0 (0.0%) |
| Total | 5,519 (95.8%) | 243 (4.2%) |
Health Insurance Coverage by Citizenship Status in Patterson
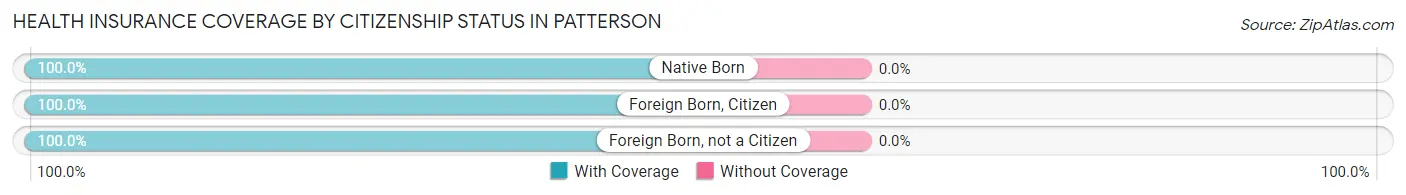
| Citizenship Status | With Coverage | Without Coverage |
| Native Born | 517 (100.0%) | 0 (0.0%) |
| Foreign Born, Citizen | 1,366 (100.0%) | 0 (0.0%) |
| Foreign Born, not a Citizen | 538 (100.0%) | 0 (0.0%) |
Health Insurance Coverage by Household Income in Patterson
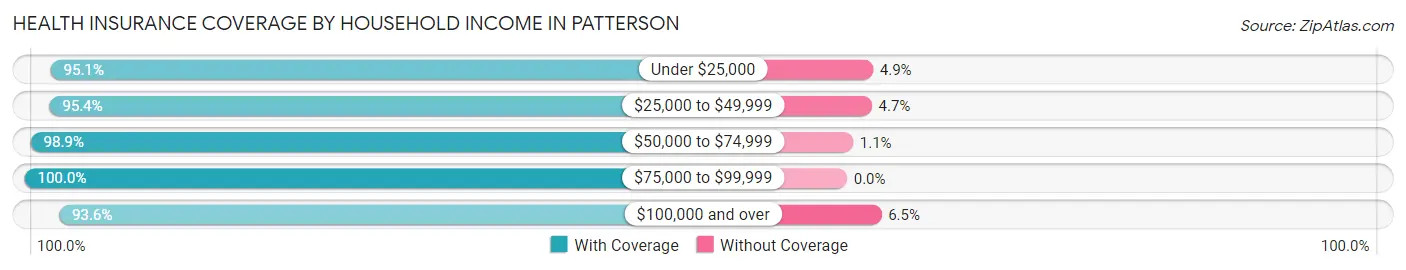
| Household Income | With Coverage | Without Coverage |
| Under $25,000 | 1,540 (95.1%) | 79 (4.9%) |
| $25,000 to $49,999 | 1,087 (95.4%) | 53 (4.6%) |
| $50,000 to $74,999 | 960 (98.9%) | 11 (1.1%) |
| $75,000 to $99,999 | 481 (100.0%) | 0 (0.0%) |
| $100,000 and over | 1,451 (93.5%) | 100 (6.5%) |
Public vs Private Health Insurance Coverage by Age in Patterson
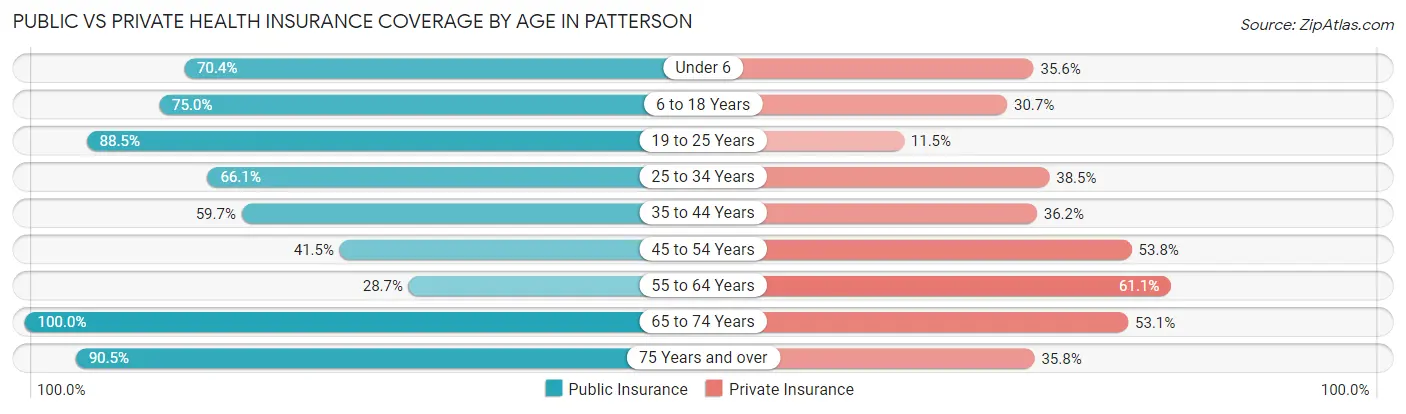
| Age Bracket | Public Insurance | Private Insurance |
| Under 6 | 364 (70.4%) | 184 (35.6%) |
| 6 to 18 Years | 1,025 (75.0%) | 419 (30.7%) |
| 19 to 25 Years | 476 (88.5%) | 62 (11.5%) |
| 25 to 34 Years | 463 (66.0%) | 270 (38.5%) |
| 35 to 44 Years | 480 (59.7%) | 291 (36.2%) |
| 45 to 54 Years | 300 (41.5%) | 389 (53.8%) |
| 55 to 64 Years | 152 (28.7%) | 324 (61.1%) |
| 65 to 74 Years | 446 (100.0%) | 237 (53.1%) |
| 75 Years and over | 124 (90.5%) | 49 (35.8%) |
| Total | 3,830 (66.5%) | 2,225 (38.6%) |
Disability Status by Sex by Age in Patterson
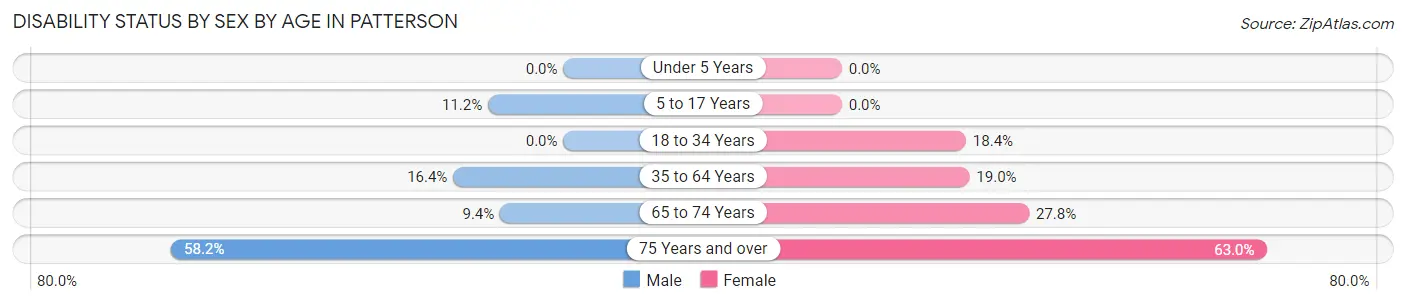
| Age Bracket | Male | Female |
| Under 5 Years | 0 (0.0%) | 0 (0.0%) |
| 5 to 17 Years | 74 (11.2%) | 0 (0.0%) |
| 18 to 34 Years | 0 (0.0%) | 120 (18.4%) |
| 35 to 64 Years | 150 (16.4%) | 216 (19.0%) |
| 65 to 74 Years | 26 (9.4%) | 47 (27.8%) |
| 75 Years and over | 53 (58.2%) | 29 (63.0%) |
Disability Class by Sex by Age in Patterson
Disability Class: Hearing Difficulty
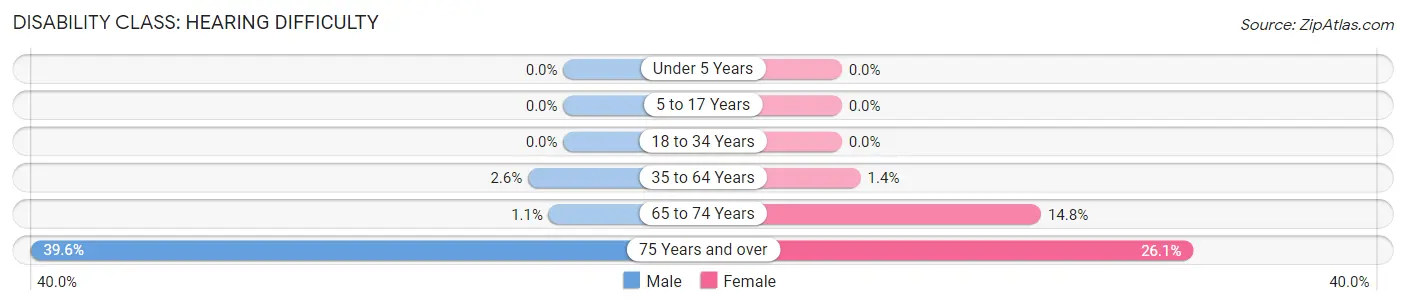
| Age Bracket | Male | Female |
| Under 5 Years | 0 (0.0%) | 0 (0.0%) |
| 5 to 17 Years | 0 (0.0%) | 0 (0.0%) |
| 18 to 34 Years | 0 (0.0%) | 0 (0.0%) |
| 35 to 64 Years | 24 (2.6%) | 16 (1.4%) |
| 65 to 74 Years | 3 (1.1%) | 25 (14.8%) |
| 75 Years and over | 36 (39.6%) | 12 (26.1%) |
Disability Class: Vision Difficulty
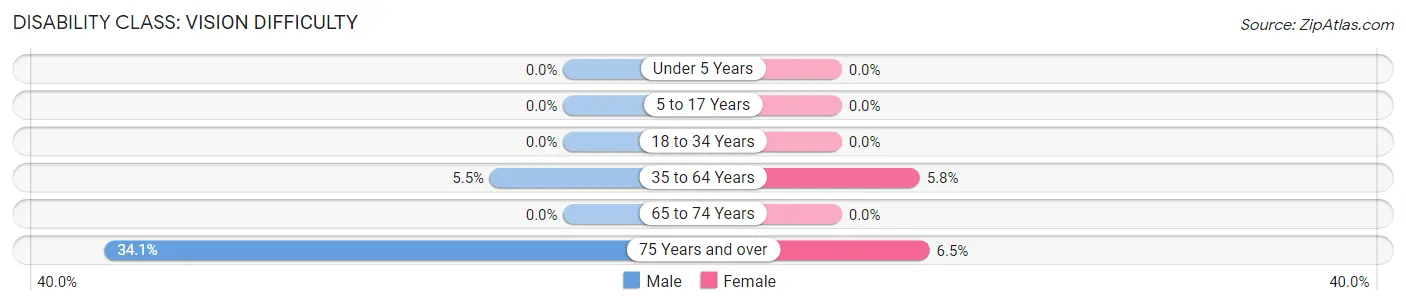
| Age Bracket | Male | Female |
| Under 5 Years | 0 (0.0%) | 0 (0.0%) |
| 5 to 17 Years | 0 (0.0%) | 0 (0.0%) |
| 18 to 34 Years | 0 (0.0%) | 0 (0.0%) |
| 35 to 64 Years | 50 (5.4%) | 66 (5.8%) |
| 65 to 74 Years | 0 (0.0%) | 0 (0.0%) |
| 75 Years and over | 31 (34.1%) | 3 (6.5%) |
Disability Class: Cognitive Difficulty
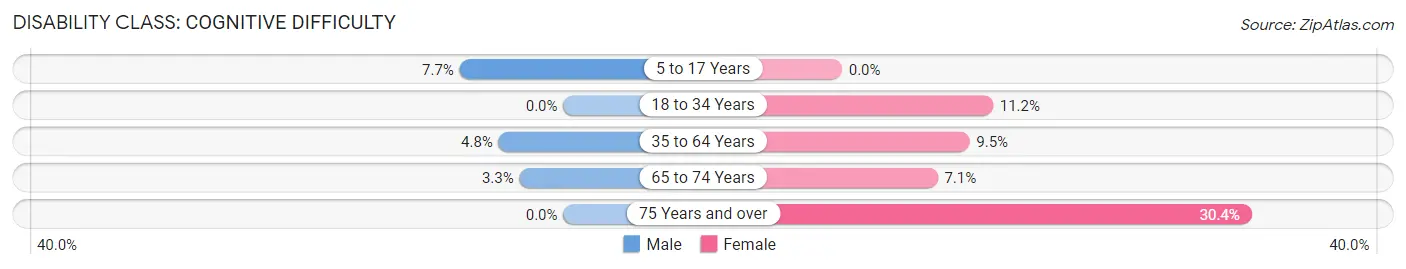
| Age Bracket | Male | Female |
| 5 to 17 Years | 51 (7.7%) | 0 (0.0%) |
| 18 to 34 Years | 0 (0.0%) | 73 (11.2%) |
| 35 to 64 Years | 44 (4.8%) | 108 (9.5%) |
| 65 to 74 Years | 9 (3.3%) | 12 (7.1%) |
| 75 Years and over | 0 (0.0%) | 14 (30.4%) |
Disability Class: Ambulatory Difficulty
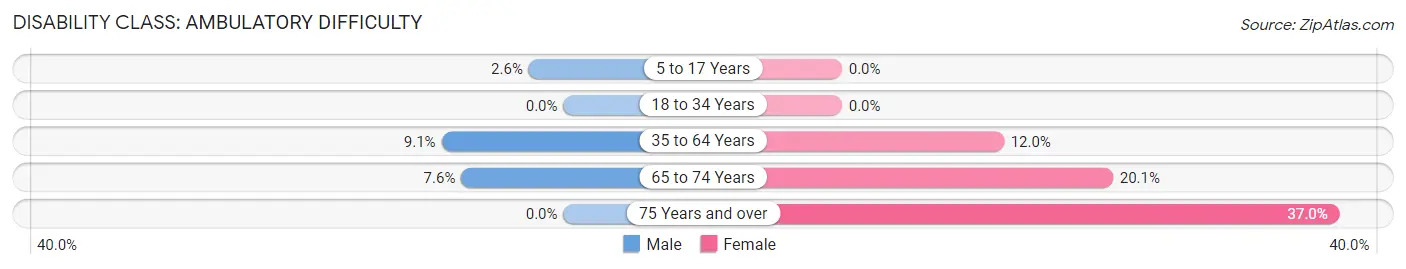
| Age Bracket | Male | Female |
| 5 to 17 Years | 17 (2.6%) | 0 (0.0%) |
| 18 to 34 Years | 0 (0.0%) | 0 (0.0%) |
| 35 to 64 Years | 83 (9.0%) | 137 (12.0%) |
| 65 to 74 Years | 21 (7.6%) | 34 (20.1%) |
| 75 Years and over | 0 (0.0%) | 17 (37.0%) |
Disability Class: Self-Care Difficulty
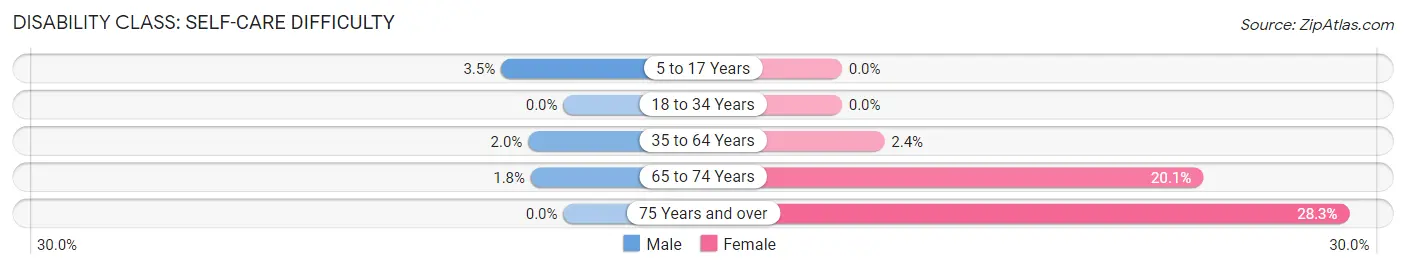
| Age Bracket | Male | Female |
| 5 to 17 Years | 23 (3.5%) | 0 (0.0%) |
| 18 to 34 Years | 0 (0.0%) | 0 (0.0%) |
| 35 to 64 Years | 18 (2.0%) | 27 (2.4%) |
| 65 to 74 Years | 5 (1.8%) | 34 (20.1%) |
| 75 Years and over | 0 (0.0%) | 13 (28.3%) |
Technology Access in Patterson
Computing Device Access in Patterson
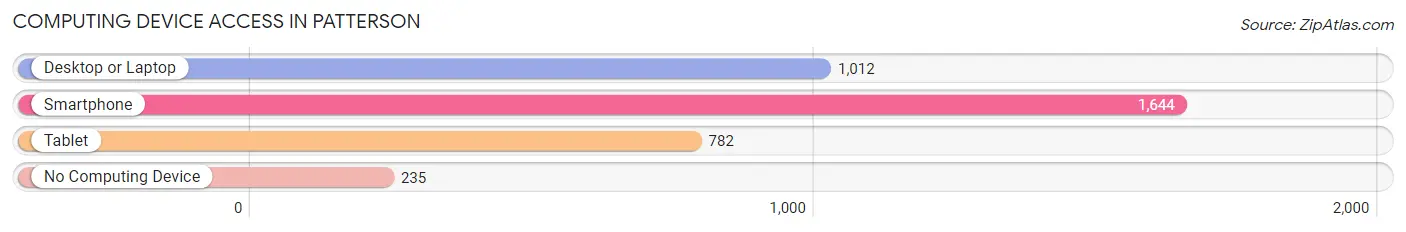
| Device Type | # Households | % Households |
| Desktop or Laptop | 1,012 | 52.2% |
| Smartphone | 1,644 | 84.8% |
| Tablet | 782 | 40.3% |
| No Computing Device | 235 | 12.1% |
| Total | 1,939 | 100.0% |
Internet Access in Patterson
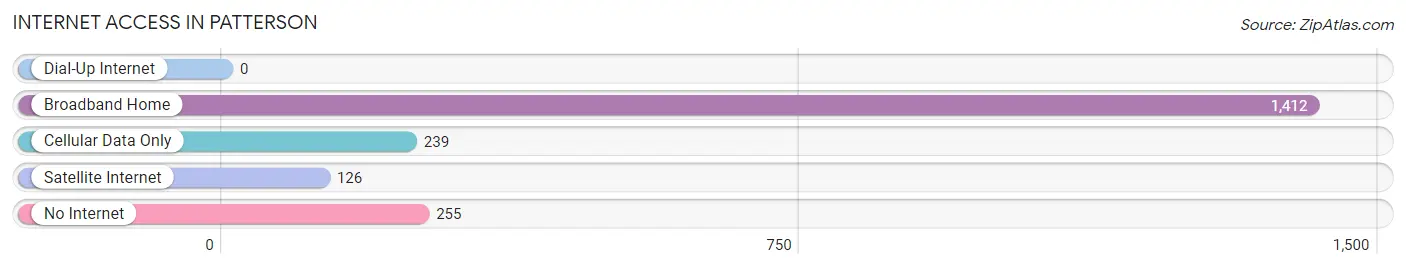
| Internet Type | # Households | % Households |
| Dial-Up Internet | 0 | 0.0% |
| Broadband Home | 1,412 | 72.8% |
| Cellular Data Only | 239 | 12.3% |
| Satellite Internet | 126 | 6.5% |
| No Internet | 255 | 13.2% |
| Total | 1,939 | 100.0% |
Patterson Summary
Patterson is a city located in St. Mary Parish, Louisiana. It is situated on the banks of the Atchafalaya River, approximately 40 miles southwest of Baton Rouge. The city was founded in 1883 and is named after Captain Robert Patterson, a Confederate veteran who served in the Civil War. Patterson is known for its rich history, diverse geography, and vibrant economy.
History
Patterson was founded in 1883 by Captain Robert Patterson, a Confederate veteran who served in the Civil War. The city was originally known as “Pattersonville” and was a small farming community. In the early 1900s, the city began to grow and develop as the railroad industry expanded in the area. The city was officially incorporated in 1912 and was named after its founder.
In the 1920s, Patterson experienced a period of growth and development as the oil industry began to take off in the area. The city was home to several oil refineries and became a major hub for the industry. The city also experienced a population boom during this time, as many people moved to the area to take advantage of the economic opportunities.
In the 1950s, Patterson experienced a period of decline as the oil industry began to decline. The city’s population decreased and many businesses closed. However, the city was able to rebound in the 1960s and 1970s as the fishing industry began to take off in the area. The city is now home to several seafood processing plants and is a major hub for the industry.
Geography
Patterson is located in St. Mary Parish, Louisiana, approximately 40 miles southwest of Baton Rouge. The city is situated on the banks of the Atchafalaya River and is surrounded by marshland and swampland. The city is also located near the Gulf of Mexico, which provides access to the city’s many fishing and seafood processing plants.
The city has a humid subtropical climate, with hot and humid summers and mild winters. The average annual temperature is around 70 degrees Fahrenheit. The city receives an average of 60 inches of rain per year, with most of the rain falling in the summer months.
Economy
Patterson’s economy is largely based on the fishing and seafood processing industries. The city is home to several seafood processing plants, which employ a large number of people in the area. The city is also home to several oil refineries, which provide jobs for many people in the area.
In addition to the fishing and oil industries, Patterson is also home to several other businesses, including retail stores, restaurants, and hotels. The city is also home to several manufacturing plants, which produce a variety of products, including furniture, clothing, and electronics.
Demographics
As of the 2010 census, Patterson had a population of 6,906. The city has a diverse population, with people of various ethnic backgrounds, including African American, Hispanic, and Asian. The median household income in the city is $37,000, and the median age is 37. The city has a high rate of poverty, with nearly 30% of the population living below the poverty line.
Common Questions
What is Per Capita Income in Patterson?
Per Capita income in Patterson is $20,229.
What is the Median Family Income in Patterson?
Median Family Income in Patterson is $54,375.
What is the Median Household income in Patterson?
Median Household Income in Patterson is $46,189.
What is Income or Wage Gap in Patterson?
Income or Wage Gap in Patterson is 49.0%.
Women in Patterson earn 51.0 cents for every dollar earned by a man.
What is Inequality or Gini Index in Patterson?
Inequality or Gini Index in Patterson is 0.46.
What is the Total Population of Patterson?
Total Population of Patterson is 5,868.
What is the Total Male Population of Patterson?
Total Male Population of Patterson is 2,661.
What is the Total Female Population of Patterson?
Total Female Population of Patterson is 3,207.
What is the Ratio of Males per 100 Females in Patterson?
There are 82.97 Males per 100 Females in Patterson.
What is the Ratio of Females per 100 Males in Patterson?
There are 120.52 Females per 100 Males in Patterson.
What is the Median Population Age in Patterson?
Median Population Age in Patterson is 31.9 Years.
What is the Average Family Size in Patterson
Average Family Size in Patterson is 3.9 People.
What is the Average Household Size in Patterson
Average Household Size in Patterson is 3.0 People.
How Large is the Labor Force in Patterson?
There are 2,292 People in the Labor Forcein in Patterson.
What is the Percentage of People in the Labor Force in Patterson?
54.5% of People are in the Labor Force in Patterson.
What is the Unemployment Rate in Patterson?
Unemployment Rate in Patterson is 2.4%.