Chauvin, LA Map & Demographics
Chauvin Map
Chauvin Overview
$19,665
PER CAPITA INCOME
$75,379
AVG FAMILY INCOME
$49,280
AVG HOUSEHOLD INCOME
0.42
INEQUALITY / GINI INDEX
2,511
TOTAL POPULATION
1,388
MALE POPULATION
1,123
FEMALE POPULATION
123.60
MALES / 100 FEMALES
80.91
FEMALES / 100 MALES
33.4
MEDIAN AGE
3.5
AVG FAMILY SIZE
3.0
AVG HOUSEHOLD SIZE
1,070
LABOR FORCE [ PEOPLE ]
50.5%
PERCENT IN LABOR FORCE
10.5%
UNEMPLOYMENT RATE
Chauvin Zip Codes
Chauvin Area Codes
Income in Chauvin
Income Overview in Chauvin
Per Capita Income in Chauvin is $19,665, while median incomes of families and households are $75,379 and $49,280 respectively.
| Characteristic | Number | Measure |
| Per Capita Income | 2,511 | $19,665 |
| Median Family Income | 604 | $75,379 |
| Mean Family Income | 604 | $72,378 |
| Median Household Income | 848 | $49,280 |
| Mean Household Income | 848 | $59,927 |
| Income Deficit | 604 | $0 |
| Wage / Income Gap (%) | 2,511 | 0.00% |
| Wage / Income Gap ($) | 2,511 | 100.00¢ per $1 |
| Gini / Inequality Index | 2,511 | 0.42 |
Earnings by Sex in Chauvin
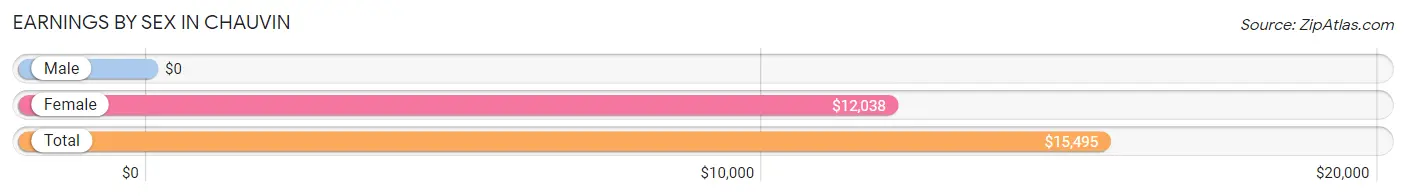
| Sex | Number | Average Earnings |
| Male | 626 (61.6%) | $0 |
| Female | 391 (38.5%) | $12,038 |
| Total | 1,017 (100.0%) | $15,495 |
Earnings by Sex by Income Bracket in Chauvin
The most common earnings brackets in Chauvin are $10,000 to $12,499 for men (199 | 31.8%) and $7,500 to $9,999 for women (97 | 24.8%).
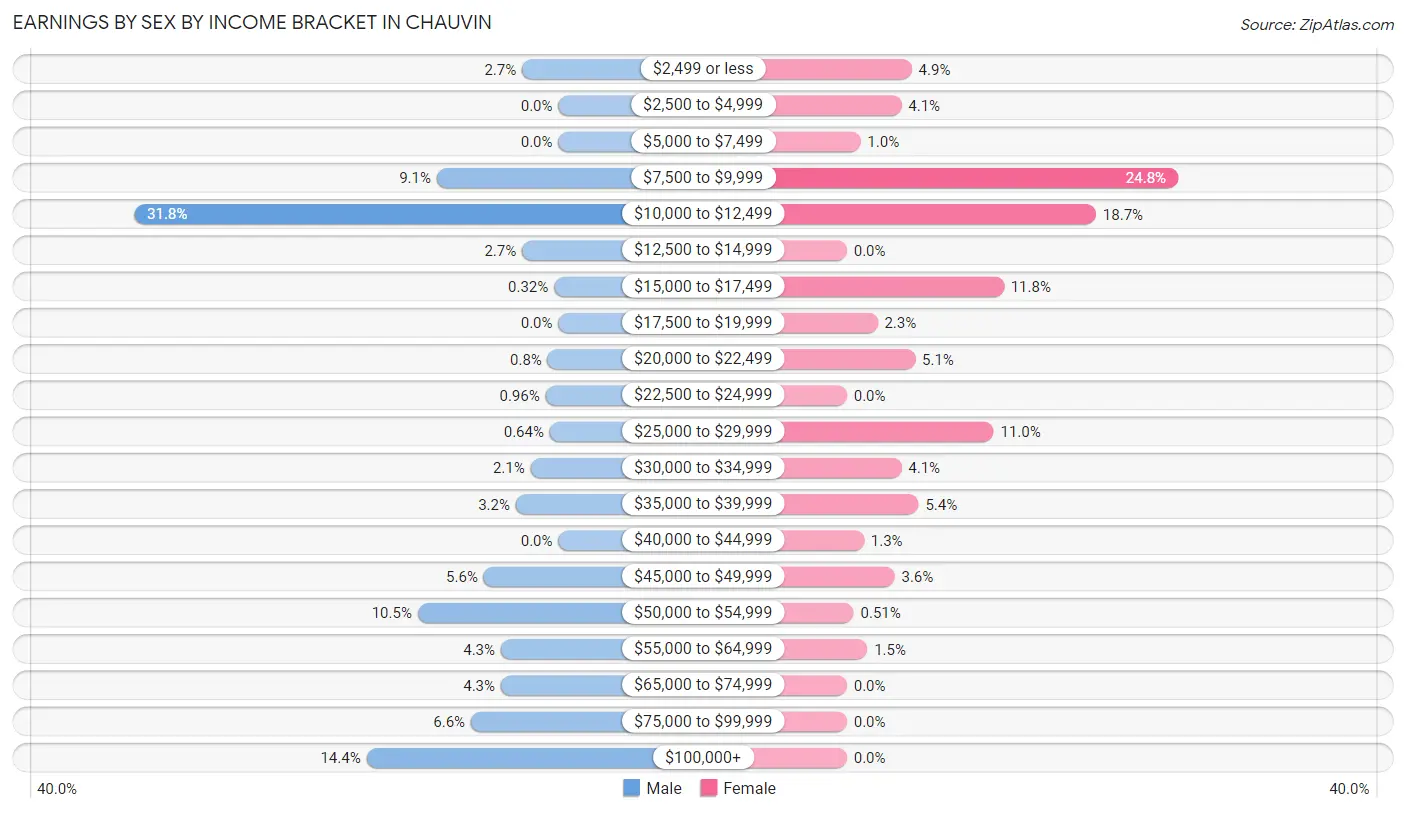
| Income | Male | Female |
| $2,499 or less | 17 (2.7%) | 19 (4.9%) |
| $2,500 to $4,999 | 0 (0.0%) | 16 (4.1%) |
| $5,000 to $7,499 | 0 (0.0%) | 4 (1.0%) |
| $7,500 to $9,999 | 57 (9.1%) | 97 (24.8%) |
| $10,000 to $12,499 | 199 (31.8%) | 73 (18.7%) |
| $12,500 to $14,999 | 17 (2.7%) | 0 (0.0%) |
| $15,000 to $17,499 | 2 (0.3%) | 46 (11.8%) |
| $17,500 to $19,999 | 0 (0.0%) | 9 (2.3%) |
| $20,000 to $22,499 | 5 (0.8%) | 20 (5.1%) |
| $22,500 to $24,999 | 6 (1.0%) | 0 (0.0%) |
| $25,000 to $29,999 | 4 (0.6%) | 43 (11.0%) |
| $30,000 to $34,999 | 13 (2.1%) | 16 (4.1%) |
| $35,000 to $39,999 | 20 (3.2%) | 21 (5.4%) |
| $40,000 to $44,999 | 0 (0.0%) | 5 (1.3%) |
| $45,000 to $49,999 | 35 (5.6%) | 14 (3.6%) |
| $50,000 to $54,999 | 66 (10.5%) | 2 (0.5%) |
| $55,000 to $64,999 | 27 (4.3%) | 6 (1.5%) |
| $65,000 to $74,999 | 27 (4.3%) | 0 (0.0%) |
| $75,000 to $99,999 | 41 (6.6%) | 0 (0.0%) |
| $100,000+ | 90 (14.4%) | 0 (0.0%) |
| Total | 626 (100.0%) | 391 (100.0%) |
Earnings by Sex by Educational Attainment in Chauvin
Average earnings in Chauvin are $53,504 for men and $21,063 for women, a difference of 60.6%. Men with an educational attainment of high school diploma enjoy the highest average annual earnings of $54,659, while those with college or associate's degree education earn the least with $11,560. Women with an educational attainment of high school diploma earn the most with the average annual earnings of $18,333, while those with high school diploma education have the smallest earnings of $18,333.
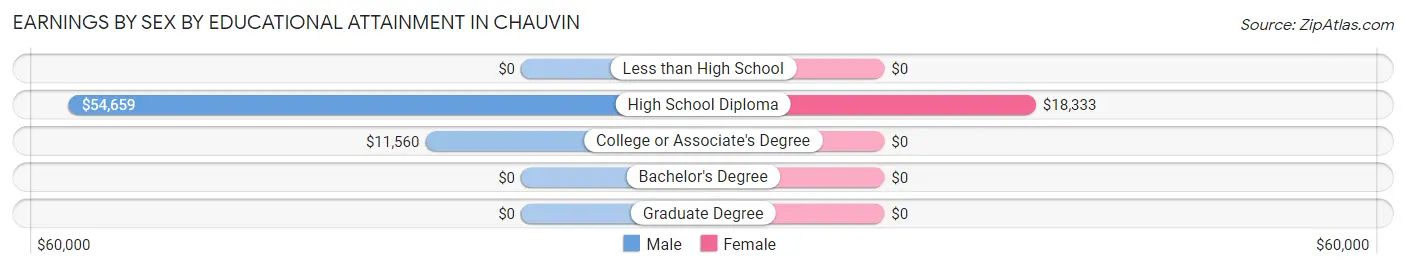
| Educational Attainment | Male Income | Female Income |
| Less than High School | - | - |
| High School Diploma | $54,659 | $18,333 |
| College or Associate's Degree | $11,560 | $0 |
| Bachelor's Degree | - | - |
| Graduate Degree | - | - |
| Total | $53,504 | $21,063 |
Family Income in Chauvin
Family Income Brackets in Chauvin
According to the Chauvin family income data, there are 155 families falling into the $100,000 to $149,999 income range, which is the most common income bracket and makes up 25.7% of all families.
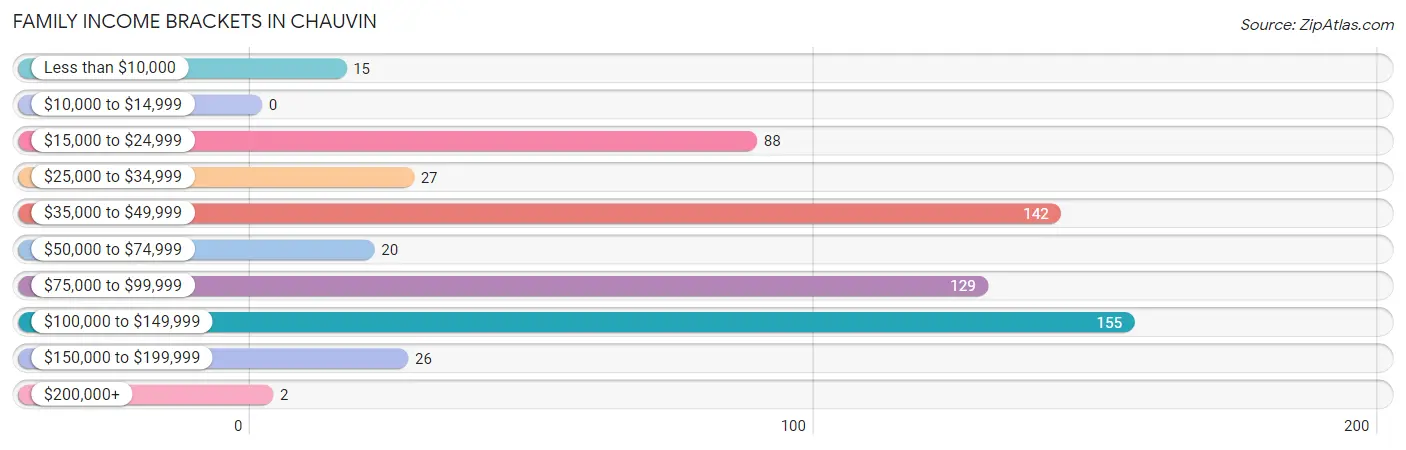
| Income Bracket | # Families | % Families |
| Less than $10,000 | 15 | 2.5% |
| $10,000 to $14,999 | 0 | 0.0% |
| $15,000 to $24,999 | 88 | 14.6% |
| $25,000 to $34,999 | 27 | 4.5% |
| $35,000 to $49,999 | 142 | 23.5% |
| $50,000 to $74,999 | 20 | 3.3% |
| $75,000 to $99,999 | 129 | 21.4% |
| $100,000 to $149,999 | 155 | 25.7% |
| $150,000 to $199,999 | 26 | 4.3% |
| $200,000+ | 2 | 0.3% |
Family Income by Famaliy Size in Chauvin
7+ person families (72 | 11.9%) account for the highest median family income in Chauvin with $106,434 per family, while 4-person families (87 | 14.4%) have the highest median income of $19,105 per family member.
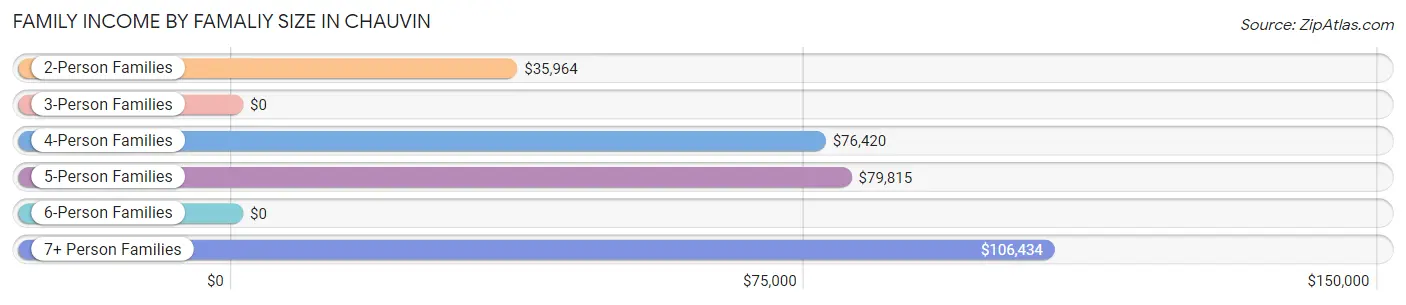
| Income Bracket | # Families | Median Income |
| 2-Person Families | 253 (41.9%) | $35,964 |
| 3-Person Families | 100 (16.6%) | $0 |
| 4-Person Families | 87 (14.4%) | $76,420 |
| 5-Person Families | 54 (8.9%) | $79,815 |
| 6-Person Families | 38 (6.3%) | $0 |
| 7+ Person Families | 72 (11.9%) | $106,434 |
| Total | 604 (100.0%) | $75,379 |
Family Income by Number of Earners in Chauvin
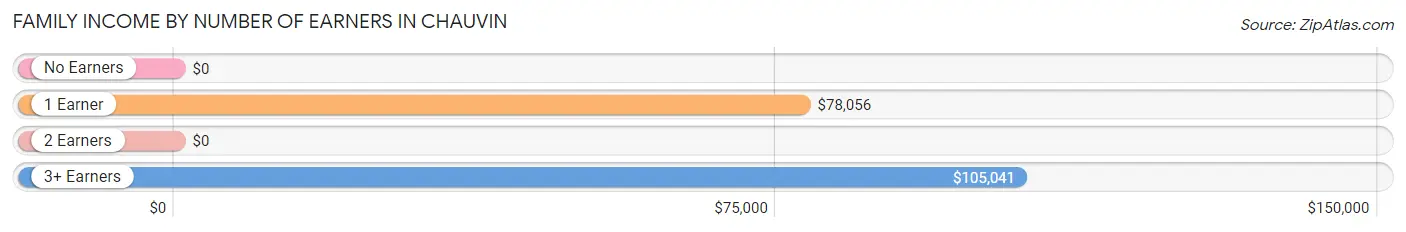
| Number of Earners | # Families | Median Income |
| No Earners | 178 (29.5%) | $0 |
| 1 Earner | 218 (36.1%) | $78,056 |
| 2 Earners | 50 (8.3%) | $0 |
| 3+ Earners | 158 (26.2%) | $105,041 |
| Total | 604 (100.0%) | $75,379 |
Household Income in Chauvin
Household Income Brackets in Chauvin
With 163 households falling in the category, the $75,000 to $99,999 income range is the most frequent in Chauvin, accounting for 19.2% of all households. In contrast, only 2 households (0.2%) fall into the $200,000+ income bracket, making it the least populous group.
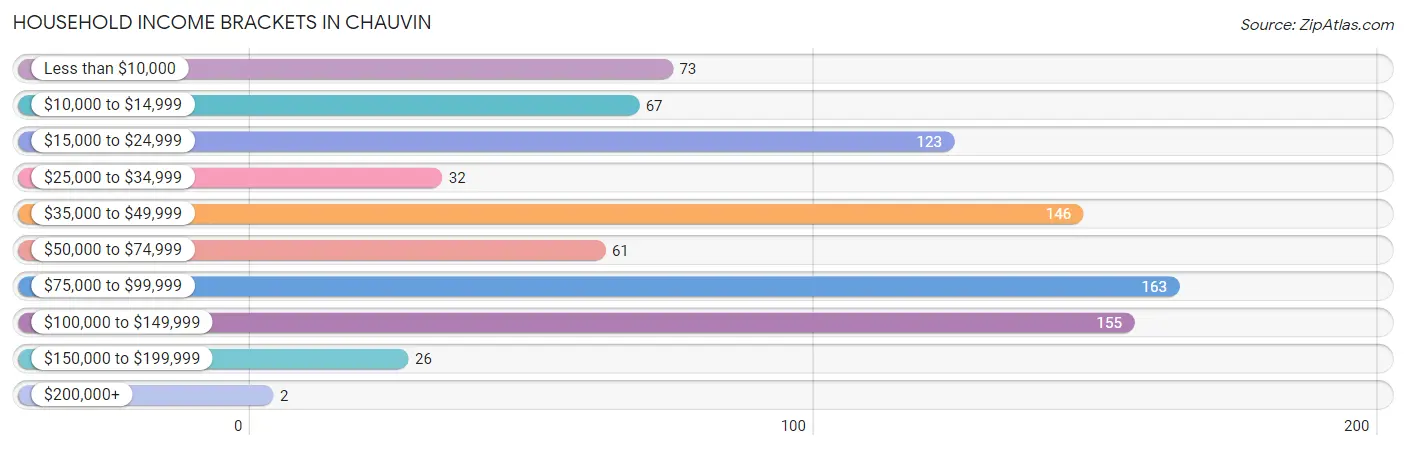
| Income Bracket | # Households | % Households |
| Less than $10,000 | 73 | 8.6% |
| $10,000 to $14,999 | 67 | 7.9% |
| $15,000 to $24,999 | 123 | 14.5% |
| $25,000 to $34,999 | 32 | 3.8% |
| $35,000 to $49,999 | 146 | 17.2% |
| $50,000 to $74,999 | 61 | 7.2% |
| $75,000 to $99,999 | 163 | 19.2% |
| $100,000 to $149,999 | 155 | 18.3% |
| $150,000 to $199,999 | 26 | 3.1% |
| $200,000+ | 2 | 0.2% |
Household Income by Householder Age in Chauvin
The median household income in Chauvin is $49,280, with the highest median household income of $117,083 found in the 25 to 44 years age bracket for the primary householder. A total of 151 households (17.8%) fall into this category. Meanwhile, the 15 to 24 years age bracket for the primary householder has the lowest median household income of $0, with 37 households (4.4%) in this group.
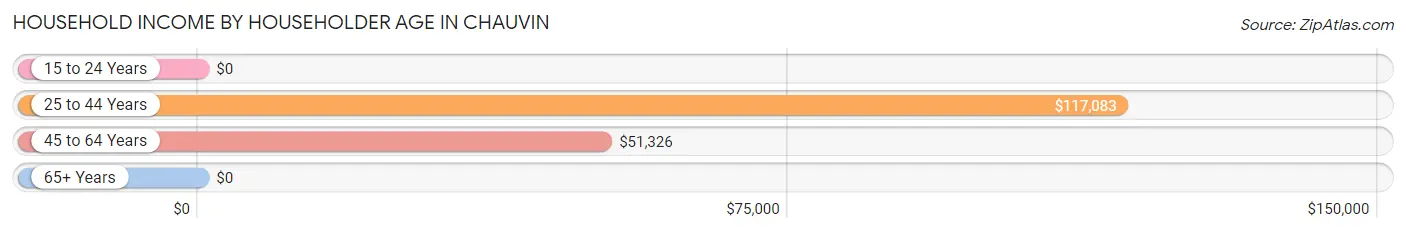
| Income Bracket | # Households | Median Income |
| 15 to 24 Years | 37 (4.4%) | $0 |
| 25 to 44 Years | 151 (17.8%) | $117,083 |
| 45 to 64 Years | 355 (41.9%) | $51,326 |
| 65+ Years | 305 (36.0%) | $0 |
| Total | 848 (100.0%) | $49,280 |
Poverty in Chauvin
Income Below Poverty by Sex and Age in Chauvin
With 10.6% poverty level for males and 21.1% for females among the residents of Chauvin, 55 to 64 year old males and 5 year old females are the most vulnerable to poverty, with 112 males (37.7%) and 2 females (100.0%) in their respective age groups living below the poverty level.
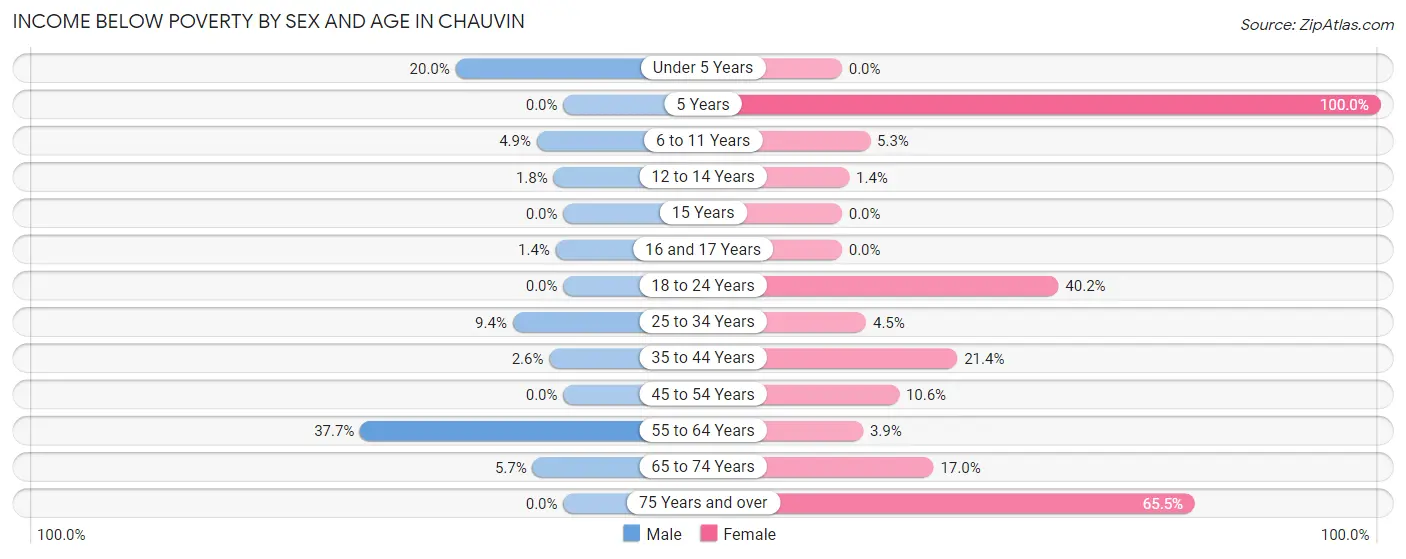
| Age Bracket | Male | Female |
| Under 5 Years | 2 (20.0%) | 0 (0.0%) |
| 5 Years | 0 (0.0%) | 2 (100.0%) |
| 6 to 11 Years | 6 (4.9%) | 2 (5.3%) |
| 12 to 14 Years | 2 (1.8%) | 1 (1.3%) |
| 15 Years | 0 (0.0%) | 0 (0.0%) |
| 16 and 17 Years | 2 (1.4%) | 0 (0.0%) |
| 18 to 24 Years | 0 (0.0%) | 76 (40.2%) |
| 25 to 34 Years | 17 (9.4%) | 5 (4.5%) |
| 35 to 44 Years | 2 (2.6%) | 9 (21.4%) |
| 45 to 54 Years | 0 (0.0%) | 19 (10.6%) |
| 55 to 64 Years | 112 (37.7%) | 7 (3.9%) |
| 65 to 74 Years | 4 (5.7%) | 16 (17.0%) |
| 75 Years and over | 0 (0.0%) | 97 (65.5%) |
| Total | 147 (10.6%) | 234 (21.1%) |
Income Above Poverty by Sex and Age in Chauvin
According to the poverty statistics in Chauvin, males aged 5 years and females aged 15 years are the age groups that are most secure financially, with 100.0% of males and 100.0% of females in these age groups living above the poverty line.
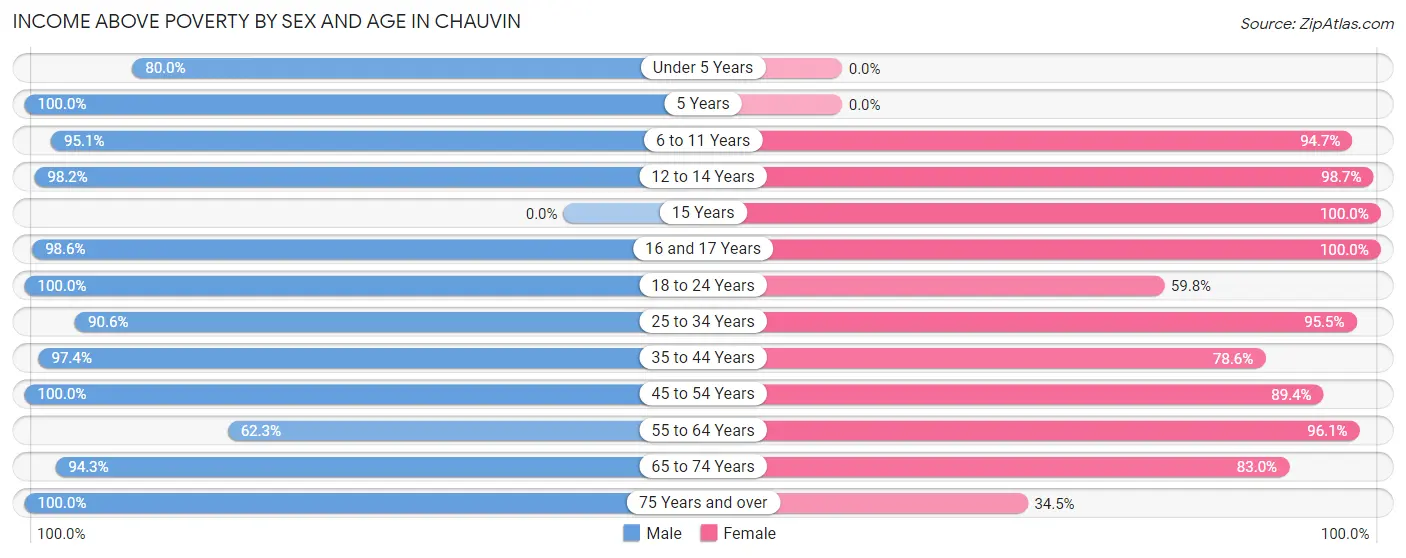
| Age Bracket | Male | Female |
| Under 5 Years | 8 (80.0%) | 0 (0.0%) |
| 5 Years | 5 (100.0%) | 0 (0.0%) |
| 6 to 11 Years | 116 (95.1%) | 36 (94.7%) |
| 12 to 14 Years | 108 (98.2%) | 73 (98.7%) |
| 15 Years | 0 (0.0%) | 19 (100.0%) |
| 16 and 17 Years | 139 (98.6%) | 37 (100.0%) |
| 18 to 24 Years | 257 (100.0%) | 113 (59.8%) |
| 25 to 34 Years | 164 (90.6%) | 106 (95.5%) |
| 35 to 44 Years | 75 (97.4%) | 33 (78.6%) |
| 45 to 54 Years | 48 (100.0%) | 160 (89.4%) |
| 55 to 64 Years | 185 (62.3%) | 171 (96.1%) |
| 65 to 74 Years | 66 (94.3%) | 78 (83.0%) |
| 75 Years and over | 70 (100.0%) | 51 (34.5%) |
| Total | 1,241 (89.4%) | 877 (78.9%) |
Income Below Poverty Among Married-Couple Families in Chauvin
The poverty statistics for married-couple families in Chauvin show that 3.6% or 15 of the total 421 families live below the poverty line. Families with no children have the highest poverty rate of 8.8%, comprising of 15 families. On the other hand, families with 1 or 2 children have the lowest poverty rate of 0.0%, which includes 0 families.
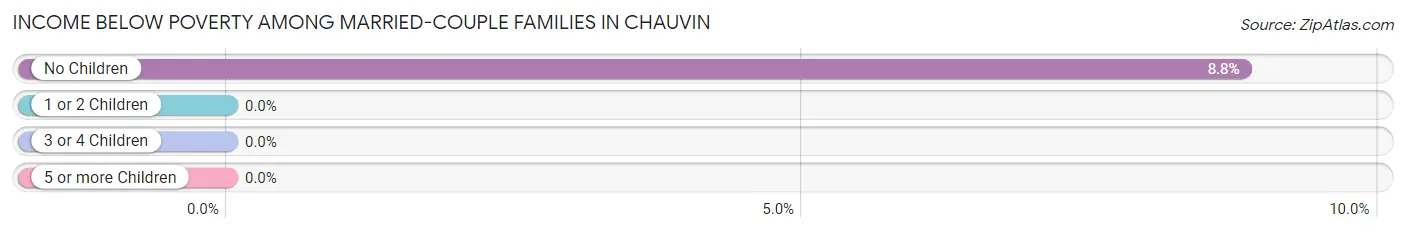
| Children | Above Poverty | Below Poverty |
| No Children | 155 (91.2%) | 15 (8.8%) |
| 1 or 2 Children | 98 (100.0%) | 0 (0.0%) |
| 3 or 4 Children | 153 (100.0%) | 0 (0.0%) |
| 5 or more Children | 0 (0.0%) | 0 (0.0%) |
| Total | 406 (96.4%) | 15 (3.6%) |
Income Below Poverty Among Single-Parent Households in Chauvin
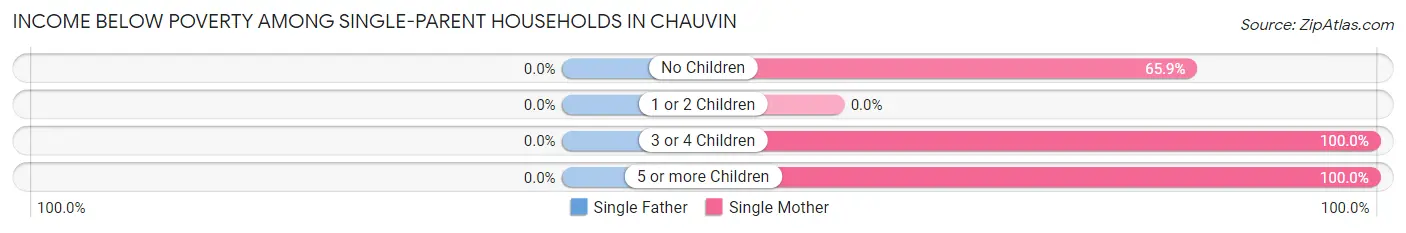
| Children | Single Father | Single Mother |
| No Children | 0 (0.0%) | 83 (65.9%) |
| 1 or 2 Children | 0 (0.0%) | 0 (0.0%) |
| 3 or 4 Children | 0 (0.0%) | 2 (100.0%) |
| 5 or more Children | 0 (0.0%) | 1 (100.0%) |
| Total | 0 (0.0%) | 86 (56.2%) |
Income Below Poverty Among Married-Couple vs Single-Parent Households in Chauvin
The poverty data for Chauvin shows that 15 of the married-couple family households (3.6%) and 86 of the single-parent households (47.0%) are living below the poverty level. Within the married-couple family households, those with no children have the highest poverty rate, with 15 households (8.8%) falling below the poverty line. Among the single-parent households, those with 5 or more children have the highest poverty rate, with 1 household (100.0%) living below poverty.
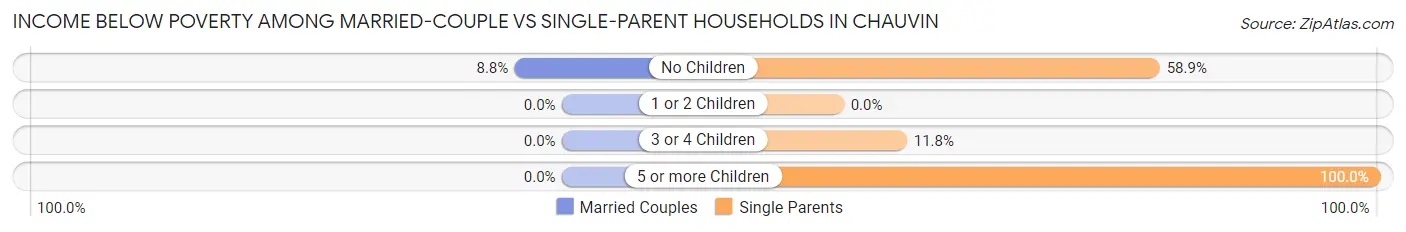
| Children | Married-Couple Families | Single-Parent Households |
| No Children | 15 (8.8%) | 83 (58.9%) |
| 1 or 2 Children | 0 (0.0%) | 0 (0.0%) |
| 3 or 4 Children | 0 (0.0%) | 2 (11.8%) |
| 5 or more Children | 0 (0.0%) | 1 (100.0%) |
| Total | 15 (3.6%) | 86 (47.0%) |
Race in Chauvin
The most populous races in Chauvin are White / Caucasian (2,151 | 85.7%), Native / Alaskan (220 | 8.8%), and Two or more Races (138 | 5.5%).
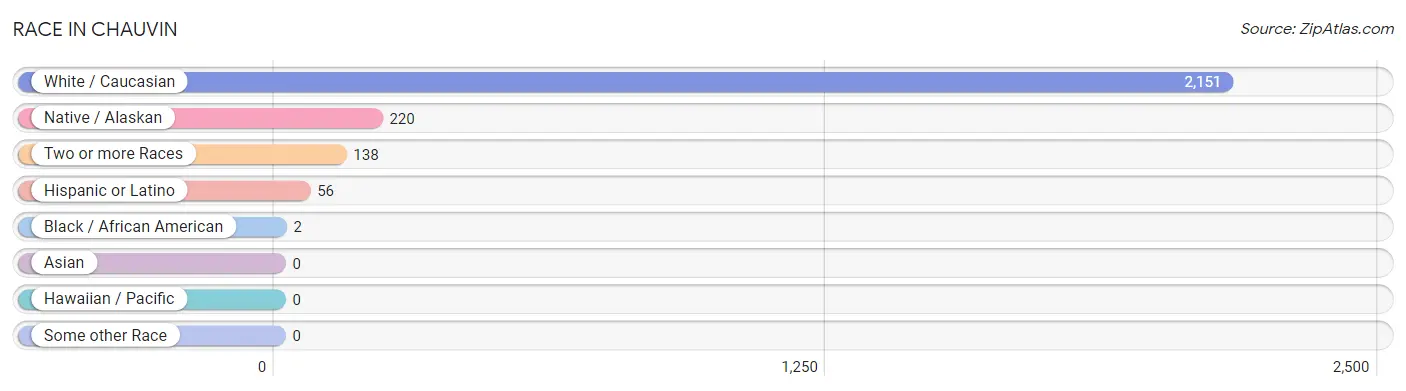
| Race | # Population | % Population |
| Asian | 0 | 0.0% |
| Black / African American | 2 | 0.1% |
| Hawaiian / Pacific | 0 | 0.0% |
| Hispanic or Latino | 56 | 2.2% |
| Native / Alaskan | 220 | 8.8% |
| White / Caucasian | 2,151 | 85.7% |
| Two or more Races | 138 | 5.5% |
| Some other Race | 0 | 0.0% |
| Total | 2,511 | 100.0% |
Ancestry in Chauvin
The most populous ancestries reported in Chauvin are French (509 | 20.3%), French Canadian (399 | 15.9%), Houma (247 | 9.8%), English (110 | 4.4%), and American (107 | 4.3%), together accounting for 54.6% of all Chauvin residents.
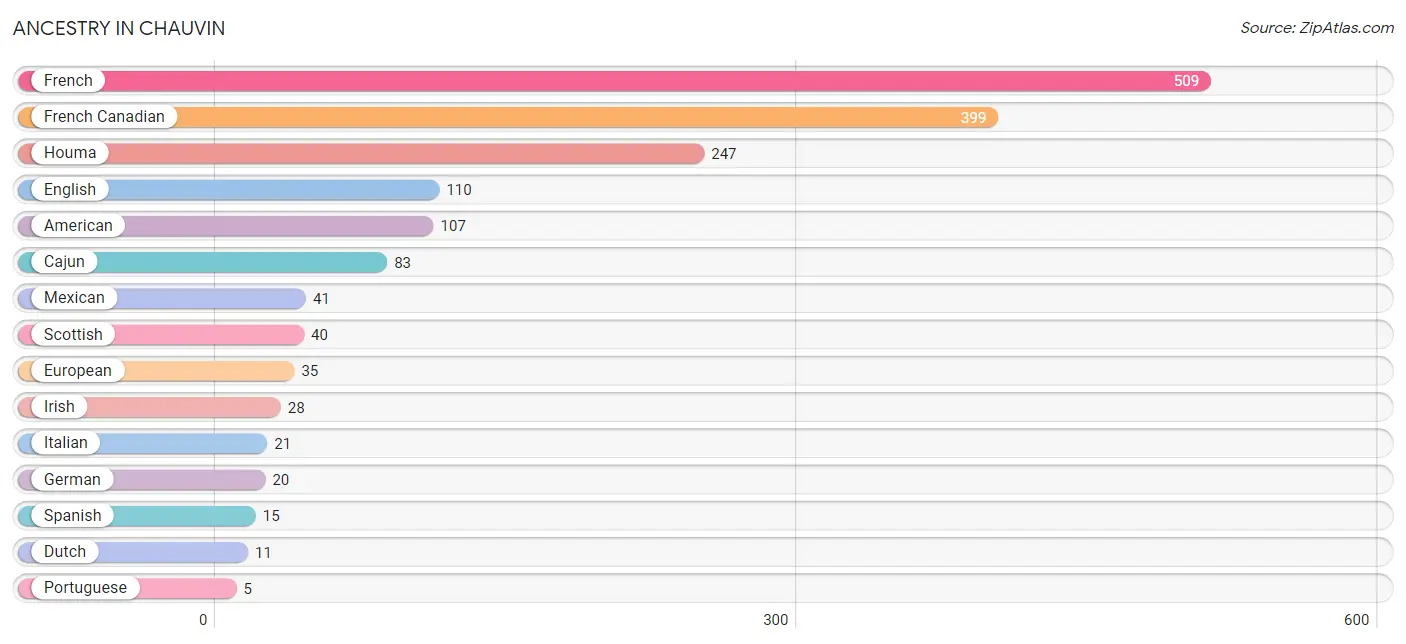
| Ancestry | # Population | % Population |
| American | 107 | 4.3% |
| Cajun | 83 | 3.3% |
| Dutch | 11 | 0.4% |
| English | 110 | 4.4% |
| European | 35 | 1.4% |
| French | 509 | 20.3% |
| French Canadian | 399 | 15.9% |
| German | 20 | 0.8% |
| Houma | 247 | 9.8% |
| Irish | 28 | 1.1% |
| Italian | 21 | 0.8% |
| Mexican | 41 | 1.6% |
| Portuguese | 5 | 0.2% |
| Scottish | 40 | 1.6% |
| Spanish | 15 | 0.6% | View All 15 Rows |
Immigrants in Chauvin

| Immigration Origin | # Population | % Population | View All 0 Rows |
Sex and Age in Chauvin
Sex and Age in Chauvin
The most populous age groups in Chauvin are 15 to 19 Years (225 | 16.2%) for men and 20 to 24 Years (187 | 16.7%) for women.
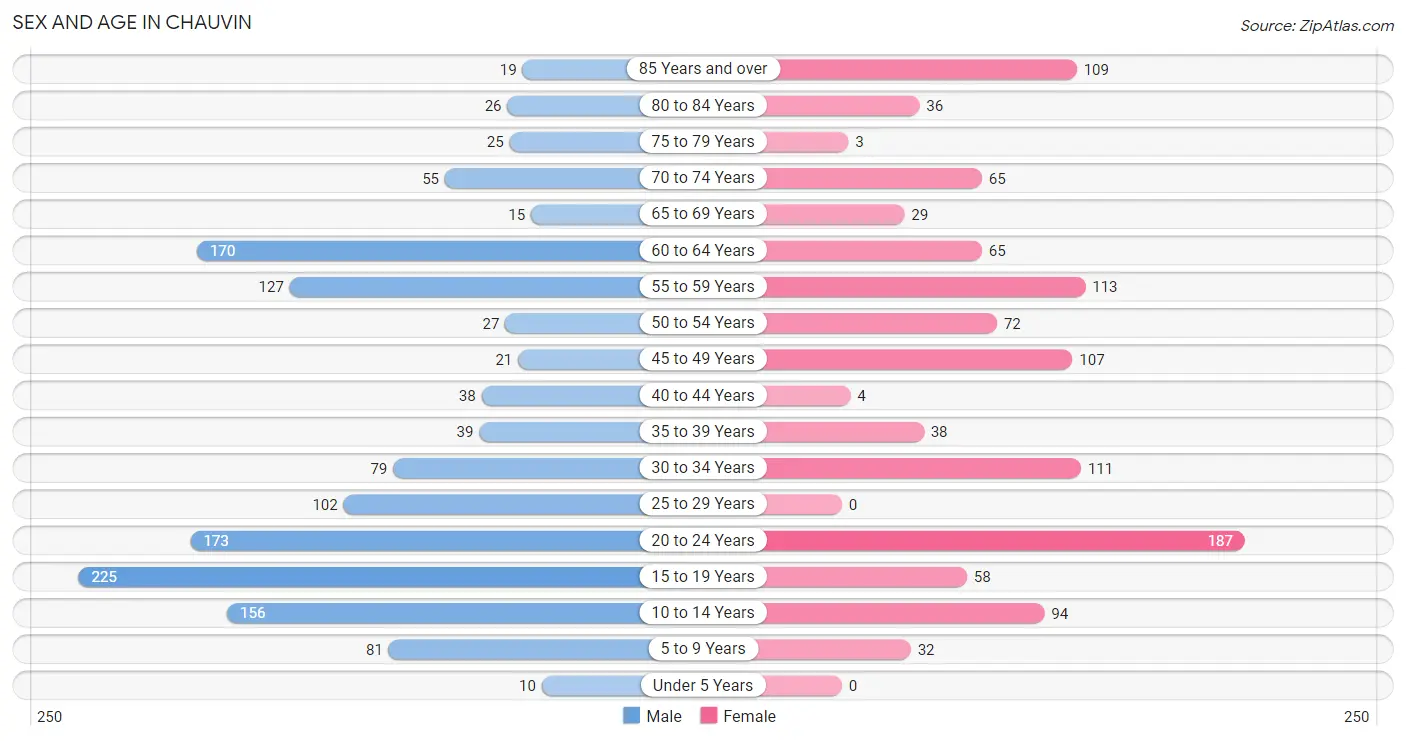
| Age Bracket | Male | Female |
| Under 5 Years | 10 (0.7%) | 0 (0.0%) |
| 5 to 9 Years | 81 (5.8%) | 32 (2.9%) |
| 10 to 14 Years | 156 (11.2%) | 94 (8.4%) |
| 15 to 19 Years | 225 (16.2%) | 58 (5.2%) |
| 20 to 24 Years | 173 (12.5%) | 187 (16.7%) |
| 25 to 29 Years | 102 (7.3%) | 0 (0.0%) |
| 30 to 34 Years | 79 (5.7%) | 111 (9.9%) |
| 35 to 39 Years | 39 (2.8%) | 38 (3.4%) |
| 40 to 44 Years | 38 (2.7%) | 4 (0.4%) |
| 45 to 49 Years | 21 (1.5%) | 107 (9.5%) |
| 50 to 54 Years | 27 (1.9%) | 72 (6.4%) |
| 55 to 59 Years | 127 (9.1%) | 113 (10.1%) |
| 60 to 64 Years | 170 (12.2%) | 65 (5.8%) |
| 65 to 69 Years | 15 (1.1%) | 29 (2.6%) |
| 70 to 74 Years | 55 (4.0%) | 65 (5.8%) |
| 75 to 79 Years | 25 (1.8%) | 3 (0.3%) |
| 80 to 84 Years | 26 (1.9%) | 36 (3.2%) |
| 85 Years and over | 19 (1.4%) | 109 (9.7%) |
| Total | 1,388 (100.0%) | 1,123 (100.0%) |
Families and Households in Chauvin
Median Family Size in Chauvin
The median family size in Chauvin is 3.55 persons per family, with married-couple families (421 | 69.7%) accounting for the largest median family size of 4.15 persons per family. On the other hand, single female/mother families (153 | 25.3%) represent the smallest median family size with 1.97 persons per family.
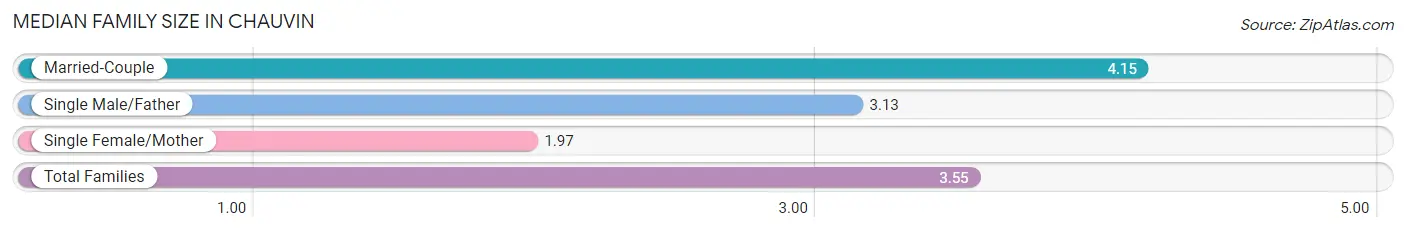
| Family Type | # Families | Family Size |
| Married-Couple | 421 (69.7%) | 4.15 |
| Single Male/Father | 30 (5.0%) | 3.13 |
| Single Female/Mother | 153 (25.3%) | 1.97 |
| Total Families | 604 (100.0%) | 3.55 |
Median Household Size in Chauvin
The median household size in Chauvin is 2.96 persons per household, with married-couple households (421 | 49.6%) accounting for the largest median household size of 4.33 persons per household. non-family households (244 | 28.8%) represent the smallest median household size with 1.03 persons per household.
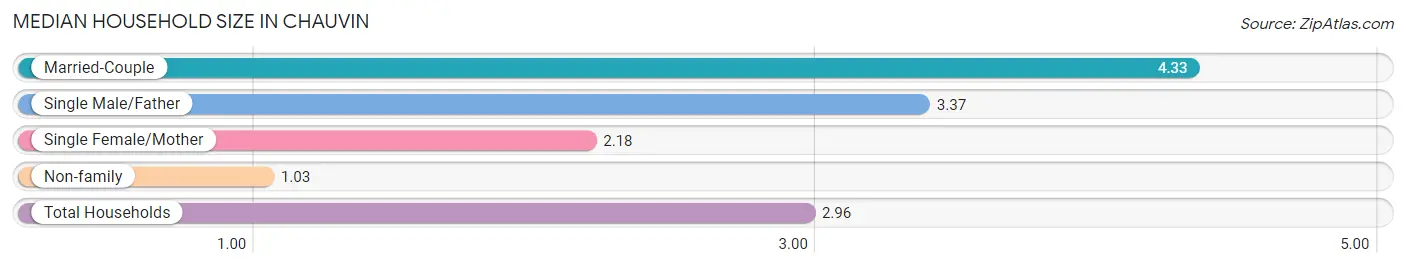
| Household Type | # Households | Household Size |
| Married-Couple | 421 (49.6%) | 4.33 |
| Single Male/Father | 30 (3.5%) | 3.37 |
| Single Female/Mother | 153 (18.0%) | 2.18 |
| Non-family | 244 (28.8%) | 1.03 |
| Total Households | 848 (100.0%) | 2.96 |
Household Size by Marriage Status in Chauvin
Out of a total of 848 households in Chauvin, 604 (71.2%) are family households, while 244 (28.8%) are nonfamily households. The most numerous type of family households are 2-person households, comprising 239, and the most common type of nonfamily households are 1-person households, comprising 236.
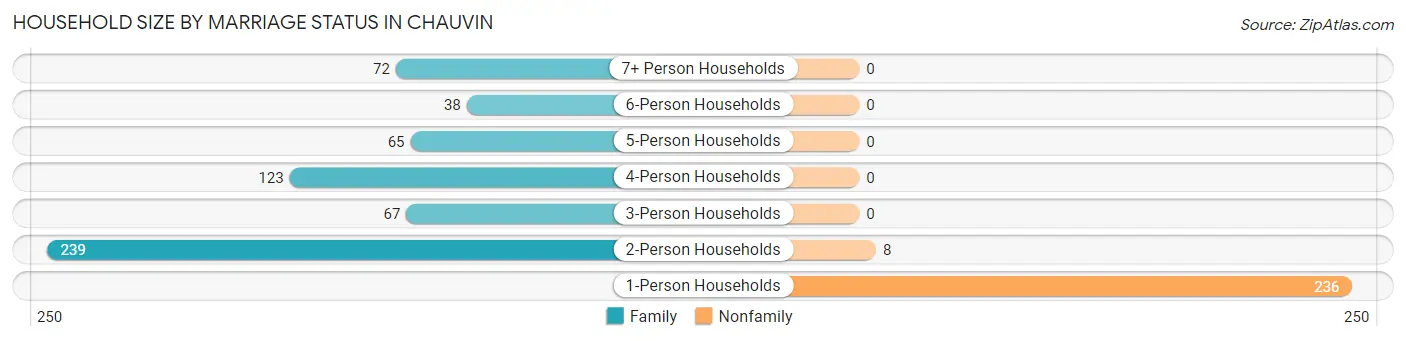
| Household Size | Family Households | Nonfamily Households |
| 1-Person Households | - | 236 (27.8%) |
| 2-Person Households | 239 (28.2%) | 8 (0.9%) |
| 3-Person Households | 67 (7.9%) | 0 (0.0%) |
| 4-Person Households | 123 (14.5%) | 0 (0.0%) |
| 5-Person Households | 65 (7.7%) | 0 (0.0%) |
| 6-Person Households | 38 (4.5%) | 0 (0.0%) |
| 7+ Person Households | 72 (8.5%) | 0 (0.0%) |
| Total | 604 (71.2%) | 244 (28.8%) |
Female Fertility in Chauvin
Fertility by Age in Chauvin
| Age Bracket | Women with Births | Births / 1,000 Women |
| 15 to 19 years | 0 (0.0%) | 0.0 |
| 20 to 34 years | 0 (0.0%) | 0.0 |
| 35 to 50 years | 0 (0.0%) | 0.0 |
| Total | 0 (0.0%) | 0.0 |
Fertility by Age by Marriage Status in Chauvin
| Age Bracket | Married | Unmarried |
| 15 to 19 years | 0 (0.0%) | 0 (0.0%) |
| 20 to 34 years | 0 (0.0%) | 0 (0.0%) |
| 35 to 50 years | 0 (0.0%) | 0 (0.0%) |
| Total | 0 (0.0%) | 0 (0.0%) |
Fertility by Education in Chauvin
| Educational Attainment | Women with Births | Births / 1,000 Women |
| Less than High School | 0 (0.0%) | 0.0 |
| High School Diploma | 0 (0.0%) | 0.0 |
| College or Associate's Degree | 0 (0.0%) | 0.0 |
| Bachelor's Degree | 0 (0.0%) | 0.0 |
| Graduate Degree | 0 (0.0%) | 0.0 |
| Total | 0 (0.0%) | 0.0 |
Fertility by Education by Marriage Status in Chauvin
| Educational Attainment | Married | Unmarried |
| Less than High School | 0 (0.0%) | 0 (0.0%) |
| High School Diploma | 0 (0.0%) | 0 (0.0%) |
| College or Associate's Degree | 0 (0.0%) | 0 (0.0%) |
| Bachelor's Degree | 0 (0.0%) | 0 (0.0%) |
| Graduate Degree | 0 (0.0%) | 0 (0.0%) |
| Total | 0 (0.0%) | 0 (0.0%) |
Employment Characteristics in Chauvin
Employment by Class of Employer in Chauvin
Among the 953 employed individuals in Chauvin, private company employees (626 | 65.7%), state government employees (137 | 14.4%), and local government employees (93 | 9.8%) make up the most common classes of employment.
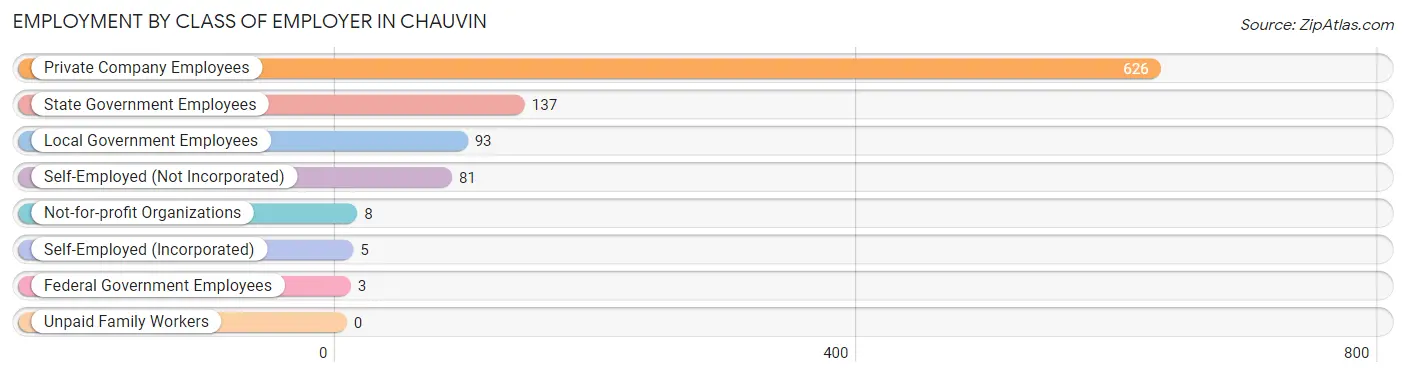
| Employer Class | # Employees | % Employees |
| Private Company Employees | 626 | 65.7% |
| Self-Employed (Incorporated) | 5 | 0.5% |
| Self-Employed (Not Incorporated) | 81 | 8.5% |
| Not-for-profit Organizations | 8 | 0.8% |
| Local Government Employees | 93 | 9.8% |
| State Government Employees | 137 | 14.4% |
| Federal Government Employees | 3 | 0.3% |
| Unpaid Family Workers | 0 | 0.0% |
| Total | 953 | 100.0% |
Employment Status by Age in Chauvin
According to the labor force statistics for Chauvin, out of the total population over 16 years of age (2,119), 50.5% or 1,070 individuals are in the labor force, with 10.5% or 112 of them unemployed. The age group with the highest labor force participation rate is 20 to 24 years, with 100.0% or 360 individuals in the labor force. Within the labor force, the 16 to 19 years age range has the highest percentage of unemployed individuals, with 50.0% or 41 of them being unemployed.
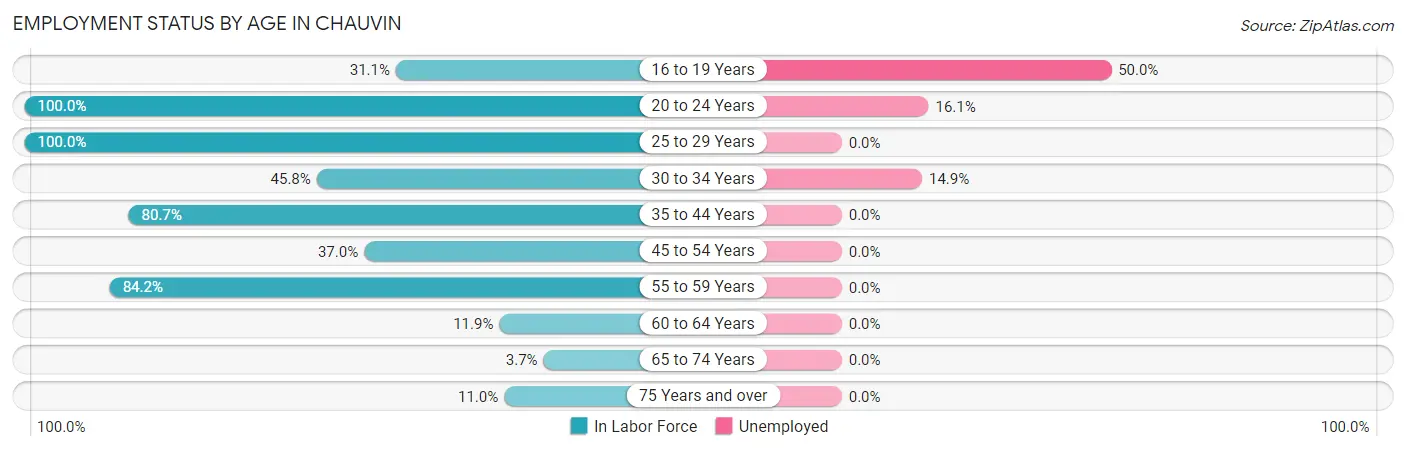
| Age Bracket | In Labor Force | Unemployed |
| 16 to 19 Years | 82 (31.1%) | 41 (50.0%) |
| 20 to 24 Years | 360 (100.0%) | 58 (16.1%) |
| 25 to 29 Years | 102 (100.0%) | 0 (0.0%) |
| 30 to 34 Years | 87 (45.8%) | 13 (14.9%) |
| 35 to 44 Years | 96 (80.7%) | 0 (0.0%) |
| 45 to 54 Years | 84 (37.0%) | 0 (0.0%) |
| 55 to 59 Years | 202 (84.2%) | 0 (0.0%) |
| 60 to 64 Years | 28 (11.9%) | 0 (0.0%) |
| 65 to 74 Years | 6 (3.7%) | 0 (0.0%) |
| 75 Years and over | 24 (11.0%) | 0 (0.0%) |
| Total | 1,070 (50.5%) | 112 (10.5%) |
Employment Status by Educational Attainment in Chauvin
According to labor force statistics for Chauvin, 53.8% of individuals (599) out of the total population between 25 and 64 years of age (1,113) are in the labor force, with 2.2% or 13 of them being unemployed. The group with the highest labor force participation rate are those with the educational attainment of bachelor's degree or higher, with 100.0% or 24 individuals in the labor force. Within the labor force, individuals with less than high school education have the highest percentage of unemployment, with 15.5% or 13 of them being unemployed.
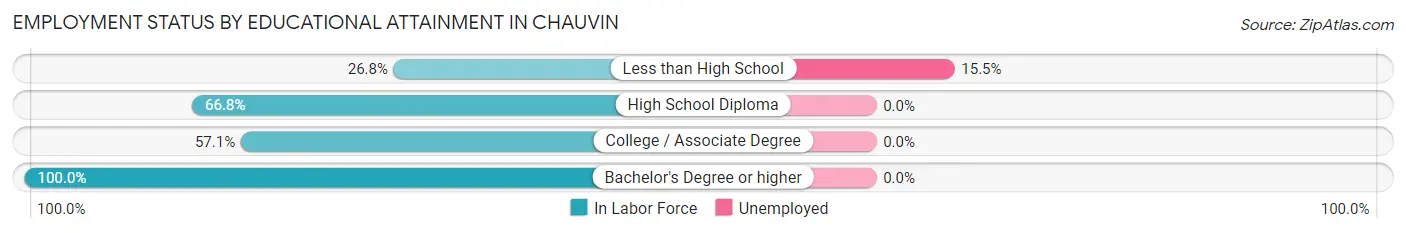
| Educational Attainment | In Labor Force | Unemployed |
| Less than High School | 84 (26.8%) | 49 (15.5%) |
| High School Diploma | 334 (66.8%) | 0 (0.0%) |
| College / Associate Degree | 157 (57.1%) | 0 (0.0%) |
| Bachelor's Degree or higher | 24 (100.0%) | 0 (0.0%) |
| Total | 599 (53.8%) | 24 (2.2%) |
Employment Occupations by Sex in Chauvin
Management, Business, Science and Arts Occupations
The most common Management, Business, Science and Arts occupations in Chauvin are Community & Social Service (81 | 8.5%), Education Instruction & Library (81 | 8.5%), Management (11 | 1.1%), Computers, Engineering & Science (11 | 1.1%), and Computers & Mathematics (11 | 1.1%).
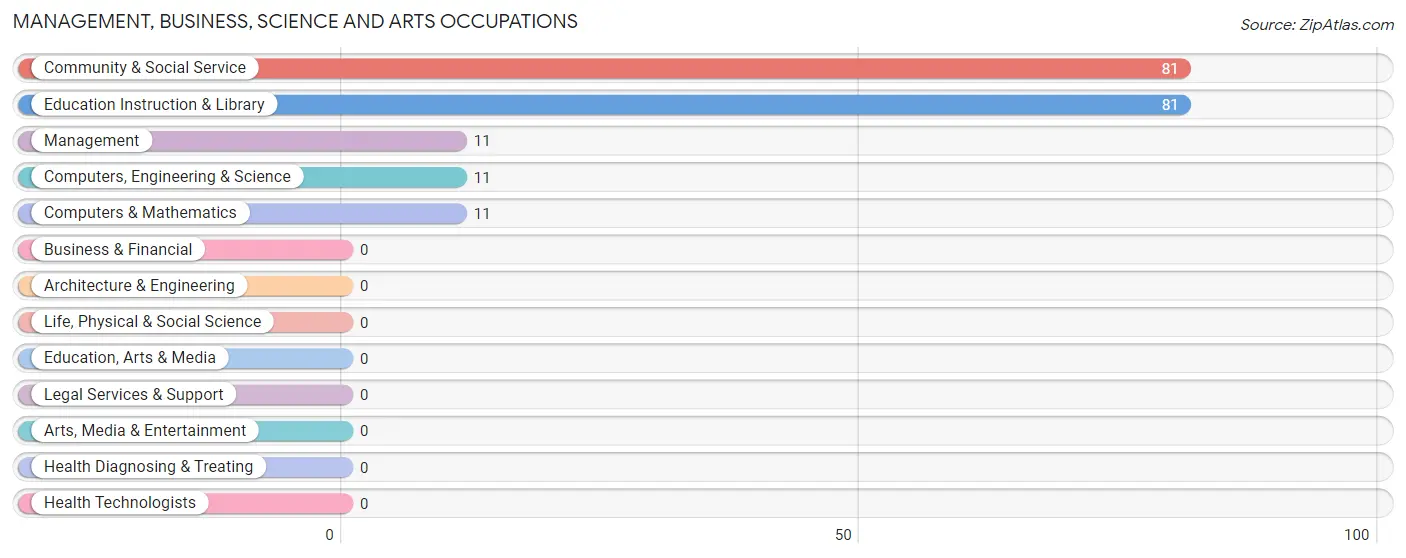
Management, Business, Science and Arts Occupations by Sex
Within the Management, Business, Science and Arts occupations in Chauvin, the most male-oriented occupations are Management (100.0%), Computers, Engineering & Science (100.0%), and Computers & Mathematics (100.0%), while the most female-oriented occupations are Community & Social Service (23.5%), and Education Instruction & Library (23.5%).
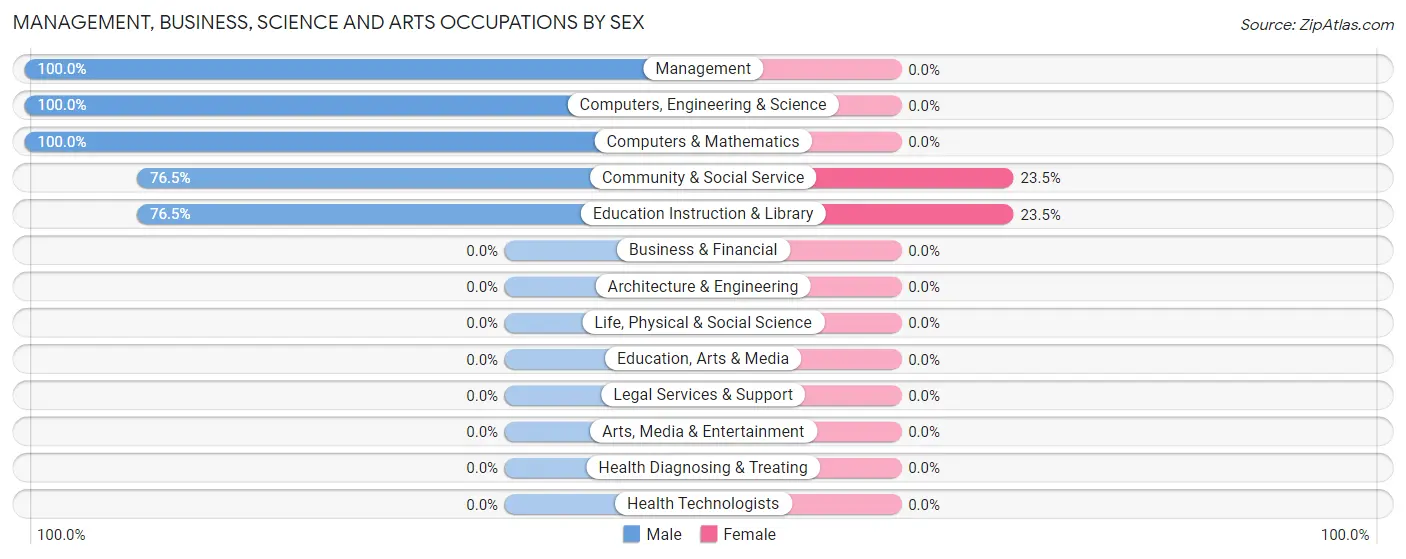
| Occupation | Male | Female |
| Management | 11 (100.0%) | 0 (0.0%) |
| Business & Financial | 0 (0.0%) | 0 (0.0%) |
| Computers, Engineering & Science | 11 (100.0%) | 0 (0.0%) |
| Computers & Mathematics | 11 (100.0%) | 0 (0.0%) |
| Architecture & Engineering | 0 (0.0%) | 0 (0.0%) |
| Life, Physical & Social Science | 0 (0.0%) | 0 (0.0%) |
| Community & Social Service | 62 (76.5%) | 19 (23.5%) |
| Education, Arts & Media | 0 (0.0%) | 0 (0.0%) |
| Legal Services & Support | 0 (0.0%) | 0 (0.0%) |
| Education Instruction & Library | 62 (76.5%) | 19 (23.5%) |
| Arts, Media & Entertainment | 0 (0.0%) | 0 (0.0%) |
| Health Diagnosing & Treating | 0 (0.0%) | 0 (0.0%) |
| Health Technologists | 0 (0.0%) | 0 (0.0%) |
| Total (Category) | 84 (81.6%) | 19 (18.4%) |
| Total (Overall) | 591 (61.6%) | 368 (38.4%) |
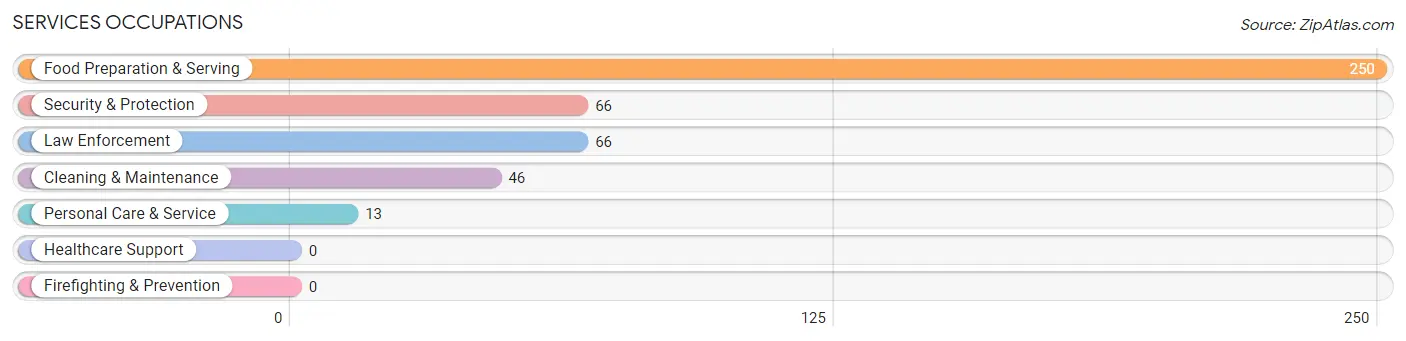
Services Occupations
The most common Services occupations in Chauvin are Food Preparation & Serving (250 | 26.1%), Security & Protection (66 | 6.9%), Law Enforcement (66 | 6.9%), Cleaning & Maintenance (46 | 4.8%), and Personal Care & Service (13 | 1.4%).
Services Occupations by Sex
Within the Services occupations in Chauvin, the most male-oriented occupations are Security & Protection (100.0%), Law Enforcement (100.0%), and Cleaning & Maintenance (87.0%), while the most female-oriented occupations are Personal Care & Service (100.0%), Food Preparation & Serving (69.2%), and Cleaning & Maintenance (13.0%).
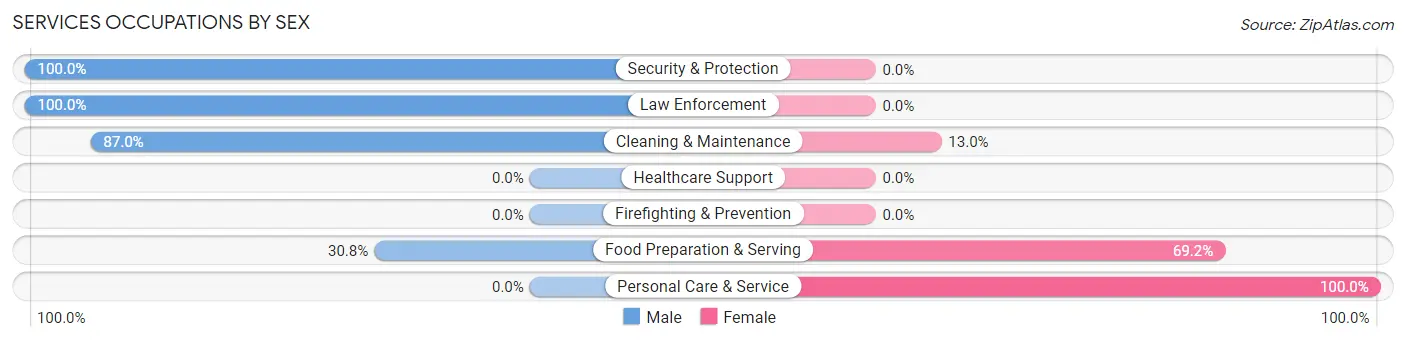
| Occupation | Male | Female |
| Healthcare Support | 0 (0.0%) | 0 (0.0%) |
| Security & Protection | 66 (100.0%) | 0 (0.0%) |
| Firefighting & Prevention | 0 (0.0%) | 0 (0.0%) |
| Law Enforcement | 66 (100.0%) | 0 (0.0%) |
| Food Preparation & Serving | 77 (30.8%) | 173 (69.2%) |
| Cleaning & Maintenance | 40 (87.0%) | 6 (13.0%) |
| Personal Care & Service | 0 (0.0%) | 13 (100.0%) |
| Total (Category) | 183 (48.8%) | 192 (51.2%) |
| Total (Overall) | 591 (61.6%) | 368 (38.4%) |
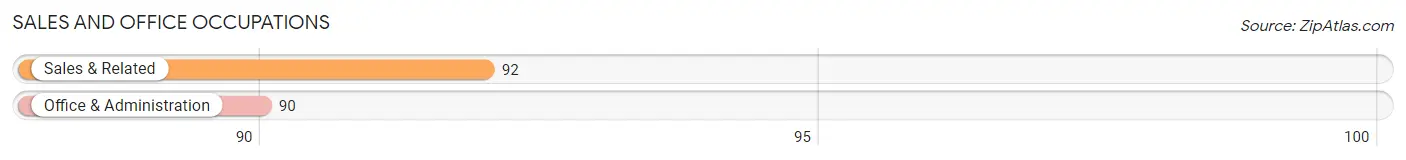
Sales and Office Occupations
The most common Sales and Office occupations in Chauvin are Sales & Related (92 | 9.6%), and Office & Administration (90 | 9.4%).
Sales and Office Occupations by Sex

| Occupation | Male | Female |
| Sales & Related | 38 (41.3%) | 54 (58.7%) |
| Office & Administration | 0 (0.0%) | 90 (100.0%) |
| Total (Category) | 38 (20.9%) | 144 (79.1%) |
| Total (Overall) | 591 (61.6%) | 368 (38.4%) |
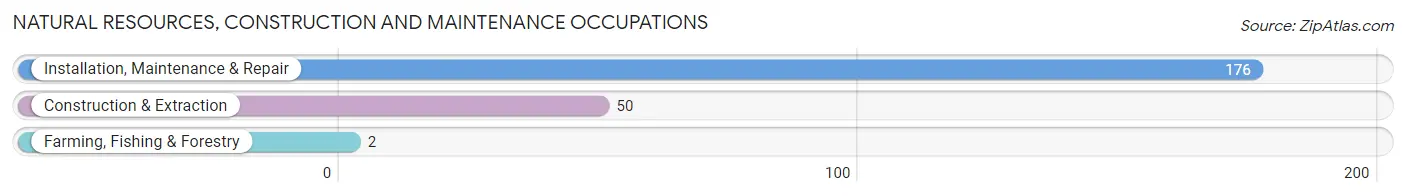
Natural Resources, Construction and Maintenance Occupations
The most common Natural Resources, Construction and Maintenance occupations in Chauvin are Installation, Maintenance & Repair (176 | 18.3%), Construction & Extraction (50 | 5.2%), and Farming, Fishing & Forestry (2 | 0.2%).
Natural Resources, Construction and Maintenance Occupations by Sex
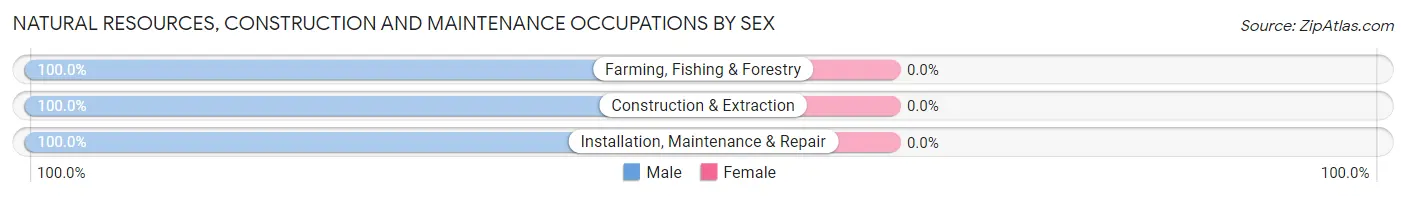
| Occupation | Male | Female |
| Farming, Fishing & Forestry | 2 (100.0%) | 0 (0.0%) |
| Construction & Extraction | 50 (100.0%) | 0 (0.0%) |
| Installation, Maintenance & Repair | 176 (100.0%) | 0 (0.0%) |
| Total (Category) | 228 (100.0%) | 0 (0.0%) |
| Total (Overall) | 591 (61.6%) | 368 (38.4%) |
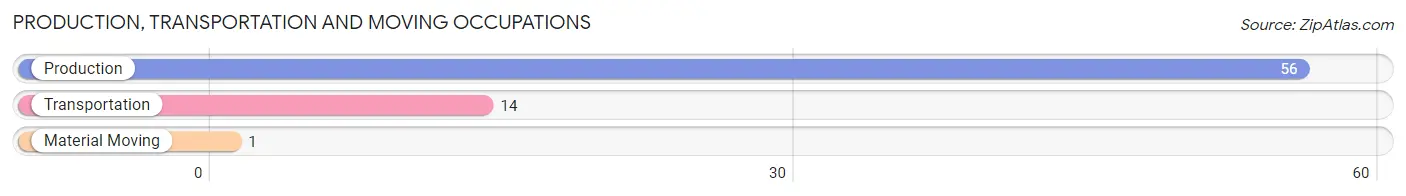
Production, Transportation and Moving Occupations
The most common Production, Transportation and Moving occupations in Chauvin are Production (56 | 5.8%), Transportation (14 | 1.5%), and Material Moving (1 | 0.1%).
Production, Transportation and Moving Occupations by Sex
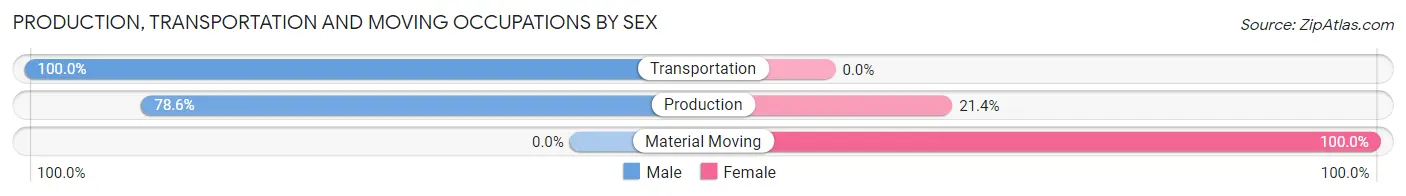
| Occupation | Male | Female |
| Production | 44 (78.6%) | 12 (21.4%) |
| Transportation | 14 (100.0%) | 0 (0.0%) |
| Material Moving | 0 (0.0%) | 1 (100.0%) |
| Total (Category) | 58 (81.7%) | 13 (18.3%) |
| Total (Overall) | 591 (61.6%) | 368 (38.4%) |
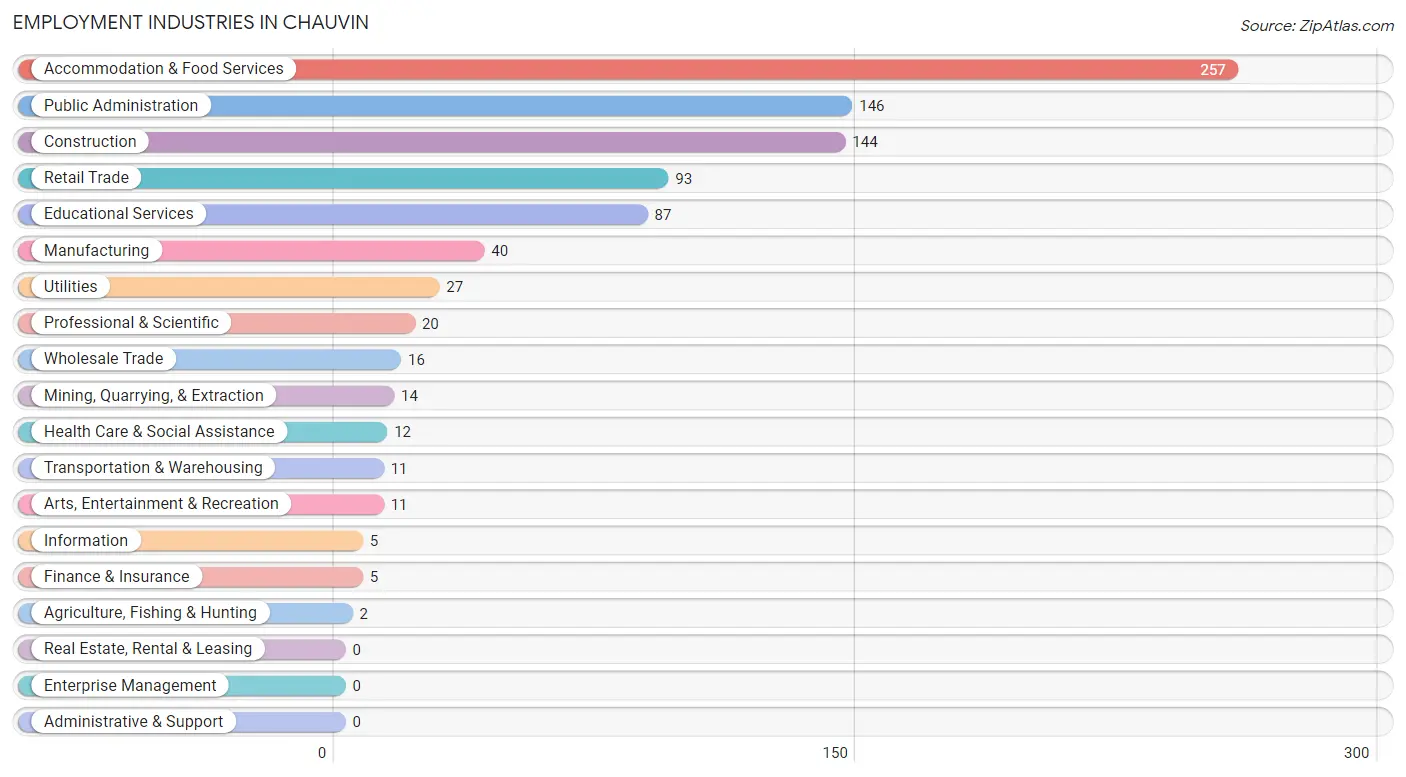
Employment Industries by Sex in Chauvin
Employment Industries in Chauvin
The major employment industries in Chauvin include Accommodation & Food Services (257 | 26.8%), Public Administration (146 | 15.2%), Construction (144 | 15.0%), Retail Trade (93 | 9.7%), and Educational Services (87 | 9.1%).
Employment Industries by Sex in Chauvin
The Chauvin industries that see more men than women are Agriculture, Fishing & Hunting (100.0%), Mining, Quarrying, & Extraction (100.0%), and Transportation & Warehousing (100.0%), whereas the industries that tend to have a higher number of women are Finance & Insurance (100.0%), Health Care & Social Assistance (100.0%), and Arts, Entertainment & Recreation (100.0%).
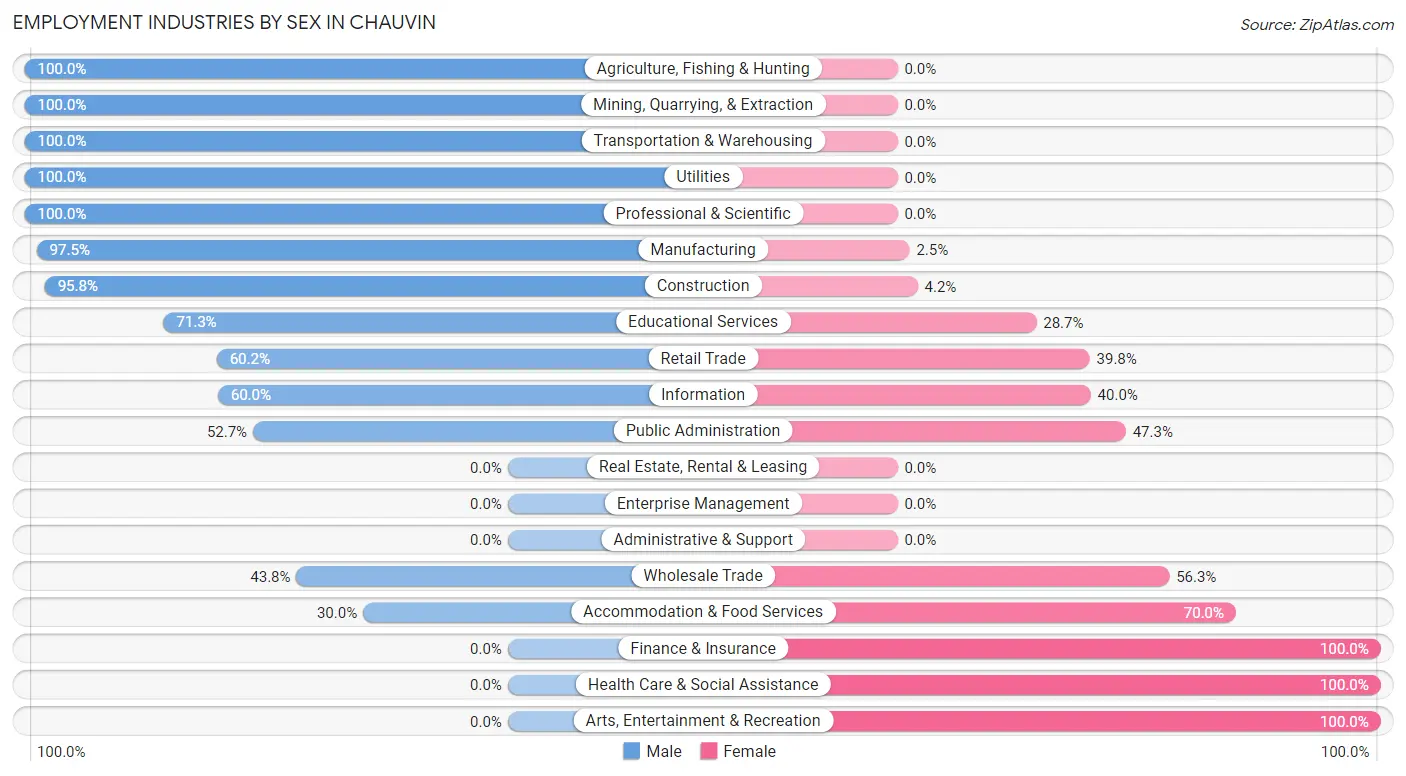
| Industry | Male | Female |
| Agriculture, Fishing & Hunting | 2 (100.0%) | 0 (0.0%) |
| Mining, Quarrying, & Extraction | 14 (100.0%) | 0 (0.0%) |
| Construction | 138 (95.8%) | 6 (4.2%) |
| Manufacturing | 39 (97.5%) | 1 (2.5%) |
| Wholesale Trade | 7 (43.8%) | 9 (56.2%) |
| Retail Trade | 56 (60.2%) | 37 (39.8%) |
| Transportation & Warehousing | 11 (100.0%) | 0 (0.0%) |
| Utilities | 27 (100.0%) | 0 (0.0%) |
| Information | 3 (60.0%) | 2 (40.0%) |
| Finance & Insurance | 0 (0.0%) | 5 (100.0%) |
| Real Estate, Rental & Leasing | 0 (0.0%) | 0 (0.0%) |
| Professional & Scientific | 20 (100.0%) | 0 (0.0%) |
| Enterprise Management | 0 (0.0%) | 0 (0.0%) |
| Administrative & Support | 0 (0.0%) | 0 (0.0%) |
| Educational Services | 62 (71.3%) | 25 (28.7%) |
| Health Care & Social Assistance | 0 (0.0%) | 12 (100.0%) |
| Arts, Entertainment & Recreation | 0 (0.0%) | 11 (100.0%) |
| Accommodation & Food Services | 77 (30.0%) | 180 (70.0%) |
| Public Administration | 77 (52.7%) | 69 (47.3%) |
| Total | 591 (61.6%) | 368 (38.4%) |
Education in Chauvin
School Enrollment in Chauvin
The most common levels of schooling among the 696 students in Chauvin are high school (246 | 35.3%), middle school (180 | 25.9%), and elementary school (135 | 19.4%).
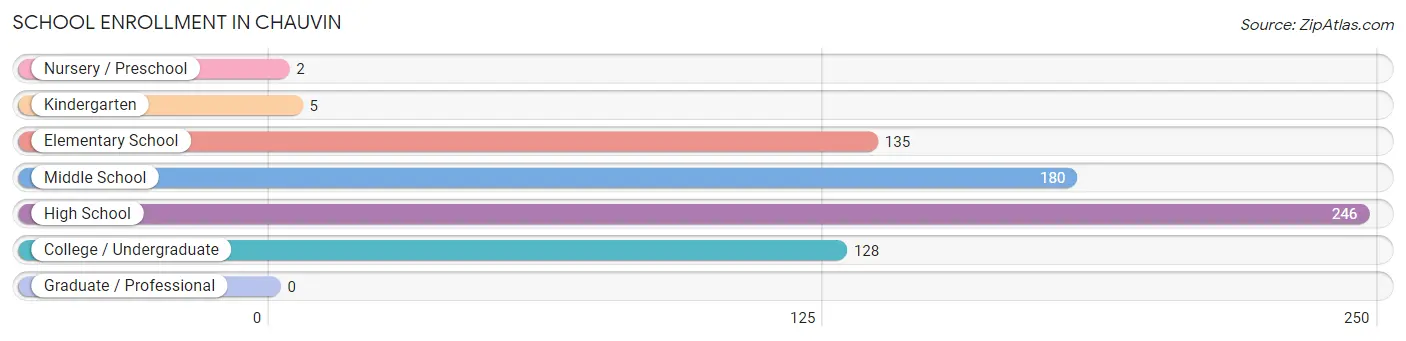
| School Level | # Students | % Students |
| Nursery / Preschool | 2 | 0.3% |
| Kindergarten | 5 | 0.7% |
| Elementary School | 135 | 19.4% |
| Middle School | 180 | 25.9% |
| High School | 246 | 35.3% |
| College / Undergraduate | 128 | 18.4% |
| Graduate / Professional | 0 | 0.0% |
| Total | 696 | 100.0% |
School Enrollment by Age by Funding Source in Chauvin
Out of a total of 696 students who are enrolled in schools in Chauvin, 42 (6.0%) attend a private institution, while the remaining 654 (94.0%) are enrolled in public schools. The age group of 15 to 17 year olds has the highest likelihood of being enrolled in private schools, with 19 (11.5% in the age bracket) enrolled. Conversely, the age group of 5 to 9 year old has the lowest likelihood of being enrolled in a private school, with 113 (100.0% in the age bracket) attending a public institution.
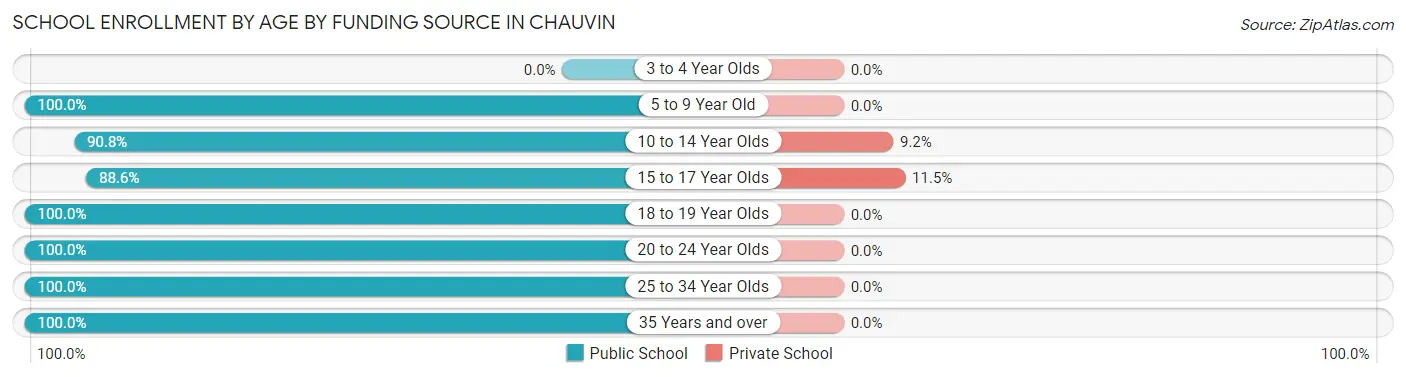
| Age Bracket | Public School | Private School |
| 3 to 4 Year Olds | 0 (0.0%) | 0 (0.0%) |
| 5 to 9 Year Old | 113 (100.0%) | 0 (0.0%) |
| 10 to 14 Year Olds | 227 (90.8%) | 23 (9.2%) |
| 15 to 17 Year Olds | 147 (88.5%) | 19 (11.5%) |
| 18 to 19 Year Olds | 82 (100.0%) | 0 (0.0%) |
| 20 to 24 Year Olds | 5 (100.0%) | 0 (0.0%) |
| 25 to 34 Year Olds | 19 (100.0%) | 0 (0.0%) |
| 35 Years and over | 61 (100.0%) | 0 (0.0%) |
| Total | 654 (94.0%) | 42 (6.0%) |
Educational Attainment by Field of Study in Chauvin
Physical & health sciences (14 | 50.0%), and education (14 | 50.0%) are the most common fields of study among 28 individuals in Chauvin who have obtained a bachelor's degree or higher.
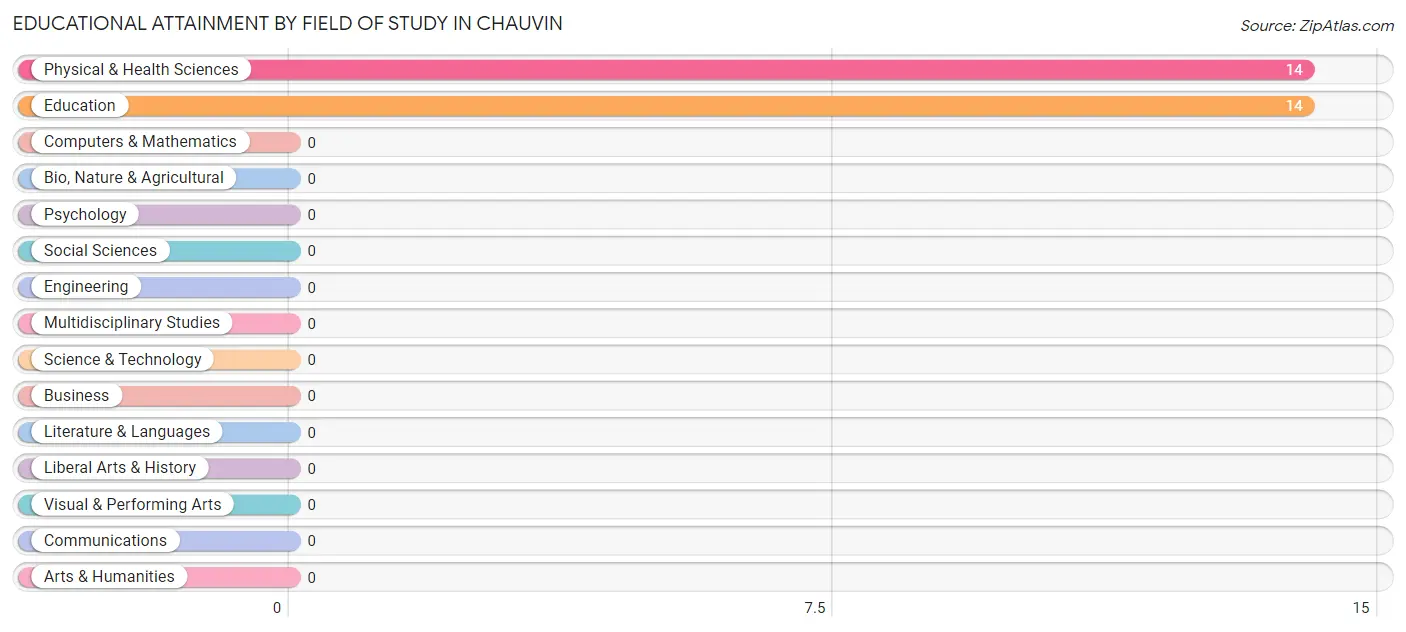
| Field of Study | # Graduates | % Graduates |
| Computers & Mathematics | 0 | 0.0% |
| Bio, Nature & Agricultural | 0 | 0.0% |
| Physical & Health Sciences | 14 | 50.0% |
| Psychology | 0 | 0.0% |
| Social Sciences | 0 | 0.0% |
| Engineering | 0 | 0.0% |
| Multidisciplinary Studies | 0 | 0.0% |
| Science & Technology | 0 | 0.0% |
| Business | 0 | 0.0% |
| Education | 14 | 50.0% |
| Literature & Languages | 0 | 0.0% |
| Liberal Arts & History | 0 | 0.0% |
| Visual & Performing Arts | 0 | 0.0% |
| Communications | 0 | 0.0% |
| Arts & Humanities | 0 | 0.0% |
| Total | 28 | 100.0% |
Transportation & Commute in Chauvin
Vehicle Availability by Sex in Chauvin
The most prevalent vehicle ownership categories in Chauvin are males with 5 or more vehicles (244, accounting for 41.7%) and females with 5 or more vehicles (115, making up 66.3%).
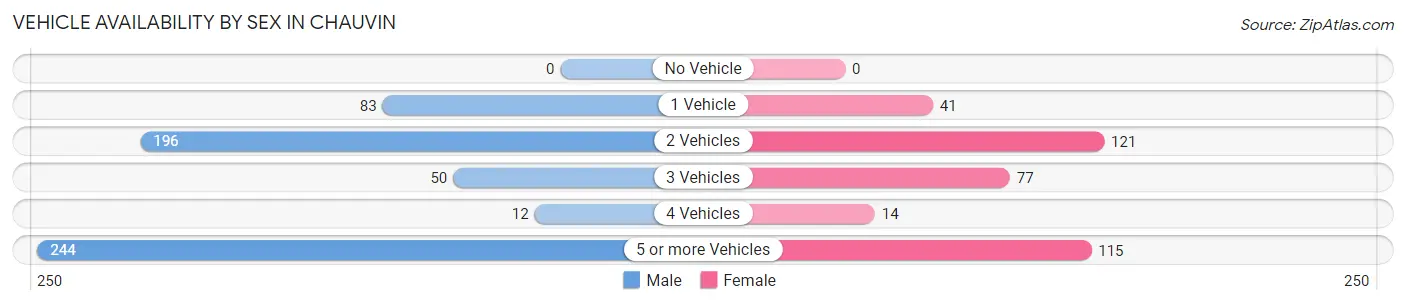
| Vehicles Available | Male | Female |
| No Vehicle | 0 (0.0%) | 0 (0.0%) |
| 1 Vehicle | 83 (14.2%) | 41 (11.1%) |
| 2 Vehicles | 196 (33.5%) | 121 (32.9%) |
| 3 Vehicles | 50 (8.6%) | 77 (20.9%) |
| 4 Vehicles | 12 (2.1%) | 14 (3.8%) |
| 5 or more Vehicles | 244 (41.7%) | 115 (31.2%) |
| Total | 585 (100.0%) | 368 (100.0%) |
Commute Time in Chauvin
The most frequently occuring commute durations in Chauvin are 30 to 34 minutes (357 commuters, 38.4%), 20 to 24 minutes (128 commuters, 13.8%), and 5 to 9 minutes (108 commuters, 11.6%).
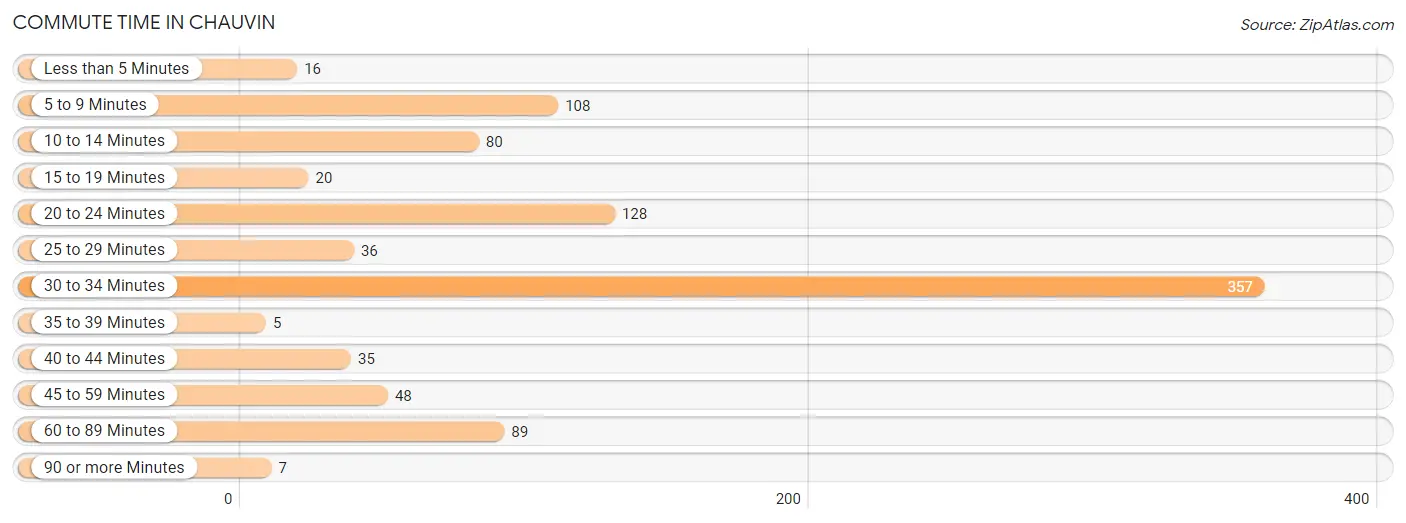
| Commute Time | # Commuters | % Commuters |
| Less than 5 Minutes | 16 | 1.7% |
| 5 to 9 Minutes | 108 | 11.6% |
| 10 to 14 Minutes | 80 | 8.6% |
| 15 to 19 Minutes | 20 | 2.1% |
| 20 to 24 Minutes | 128 | 13.8% |
| 25 to 29 Minutes | 36 | 3.9% |
| 30 to 34 Minutes | 357 | 38.4% |
| 35 to 39 Minutes | 5 | 0.5% |
| 40 to 44 Minutes | 35 | 3.8% |
| 45 to 59 Minutes | 48 | 5.2% |
| 60 to 89 Minutes | 89 | 9.6% |
| 90 or more Minutes | 7 | 0.7% |
Commute Time by Sex in Chauvin
The most common commute times in Chauvin are 30 to 34 minutes (225 commuters, 39.6%) for males and 30 to 34 minutes (132 commuters, 36.6%) for females.
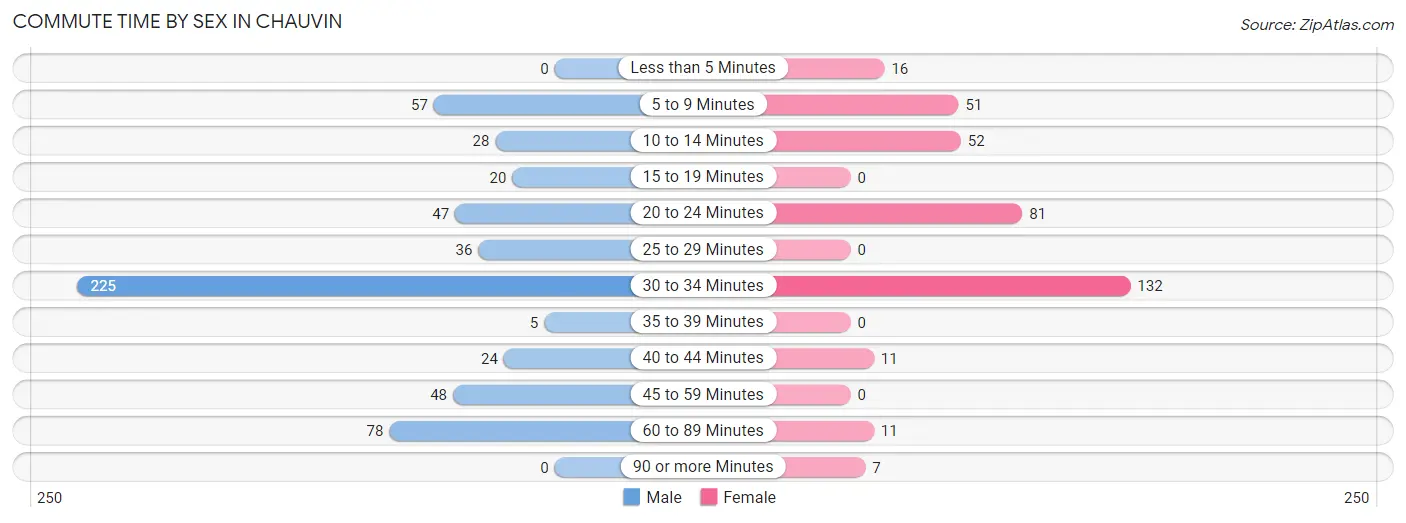
| Commute Time | Male | Female |
| Less than 5 Minutes | 0 (0.0%) | 16 (4.4%) |
| 5 to 9 Minutes | 57 (10.0%) | 51 (14.1%) |
| 10 to 14 Minutes | 28 (4.9%) | 52 (14.4%) |
| 15 to 19 Minutes | 20 (3.5%) | 0 (0.0%) |
| 20 to 24 Minutes | 47 (8.3%) | 81 (22.4%) |
| 25 to 29 Minutes | 36 (6.3%) | 0 (0.0%) |
| 30 to 34 Minutes | 225 (39.6%) | 132 (36.6%) |
| 35 to 39 Minutes | 5 (0.9%) | 0 (0.0%) |
| 40 to 44 Minutes | 24 (4.2%) | 11 (3.0%) |
| 45 to 59 Minutes | 48 (8.5%) | 0 (0.0%) |
| 60 to 89 Minutes | 78 (13.7%) | 11 (3.0%) |
| 90 or more Minutes | 0 (0.0%) | 7 (1.9%) |
Time of Departure to Work by Sex in Chauvin
The most frequent times of departure to work in Chauvin are 12:00 AM to 4:59 AM (163, 28.7%) for males and 7:30 AM to 7:59 AM (107, 29.6%) for females.
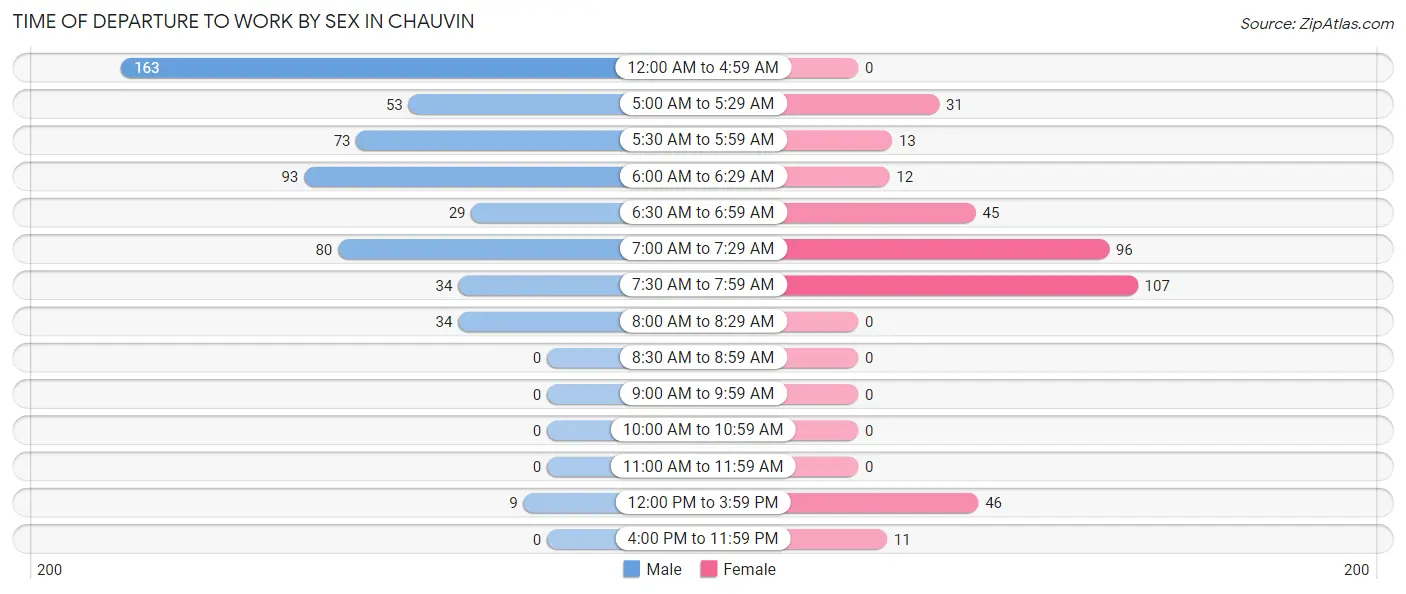
| Time of Departure | Male | Female |
| 12:00 AM to 4:59 AM | 163 (28.7%) | 0 (0.0%) |
| 5:00 AM to 5:29 AM | 53 (9.3%) | 31 (8.6%) |
| 5:30 AM to 5:59 AM | 73 (12.9%) | 13 (3.6%) |
| 6:00 AM to 6:29 AM | 93 (16.4%) | 12 (3.3%) |
| 6:30 AM to 6:59 AM | 29 (5.1%) | 45 (12.5%) |
| 7:00 AM to 7:29 AM | 80 (14.1%) | 96 (26.6%) |
| 7:30 AM to 7:59 AM | 34 (6.0%) | 107 (29.6%) |
| 8:00 AM to 8:29 AM | 34 (6.0%) | 0 (0.0%) |
| 8:30 AM to 8:59 AM | 0 (0.0%) | 0 (0.0%) |
| 9:00 AM to 9:59 AM | 0 (0.0%) | 0 (0.0%) |
| 10:00 AM to 10:59 AM | 0 (0.0%) | 0 (0.0%) |
| 11:00 AM to 11:59 AM | 0 (0.0%) | 0 (0.0%) |
| 12:00 PM to 3:59 PM | 9 (1.6%) | 46 (12.7%) |
| 4:00 PM to 11:59 PM | 0 (0.0%) | 11 (3.0%) |
| Total | 568 (100.0%) | 361 (100.0%) |
Housing Occupancy in Chauvin
Occupancy by Ownership in Chauvin
Of the total 848 dwellings in Chauvin, owner-occupied units account for 614 (72.4%), while renter-occupied units make up 234 (27.6%).
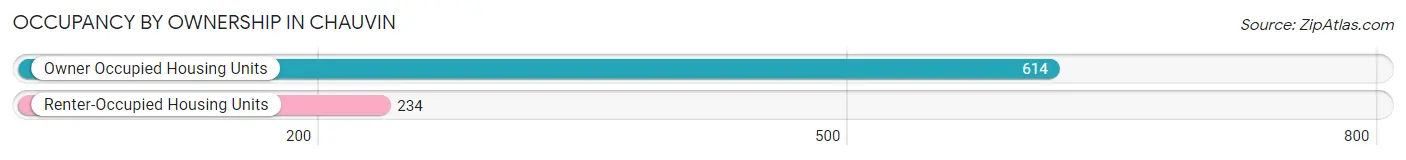
| Occupancy | # Housing Units | % Housing Units |
| Owner Occupied Housing Units | 614 | 72.4% |
| Renter-Occupied Housing Units | 234 | 27.6% |
| Total Occupied Housing Units | 848 | 100.0% |
Occupancy by Household Size in Chauvin
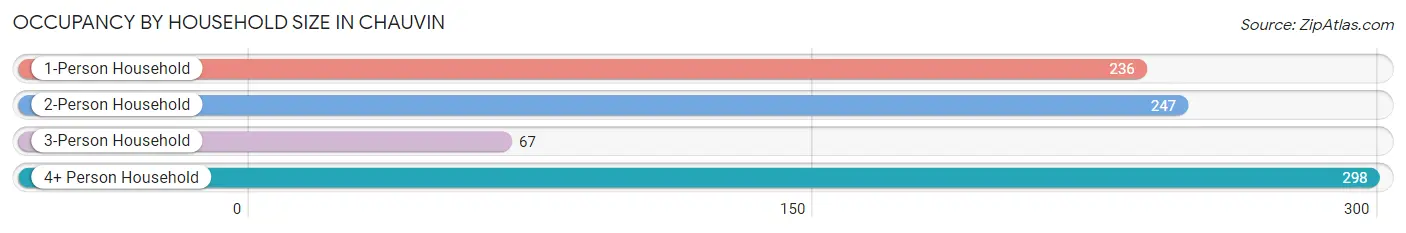
| Household Size | # Housing Units | % Housing Units |
| 1-Person Household | 236 | 27.8% |
| 2-Person Household | 247 | 29.1% |
| 3-Person Household | 67 | 7.9% |
| 4+ Person Household | 298 | 35.1% |
| Total Housing Units | 848 | 100.0% |
Occupancy by Ownership by Household Size in Chauvin
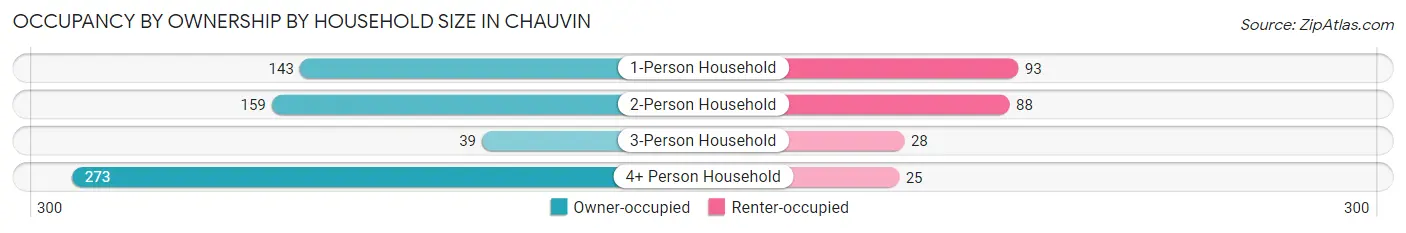
| Household Size | Owner-occupied | Renter-occupied |
| 1-Person Household | 143 (60.6%) | 93 (39.4%) |
| 2-Person Household | 159 (64.4%) | 88 (35.6%) |
| 3-Person Household | 39 (58.2%) | 28 (41.8%) |
| 4+ Person Household | 273 (91.6%) | 25 (8.4%) |
| Total Housing Units | 614 (72.4%) | 234 (27.6%) |
Occupancy by Educational Attainment in Chauvin
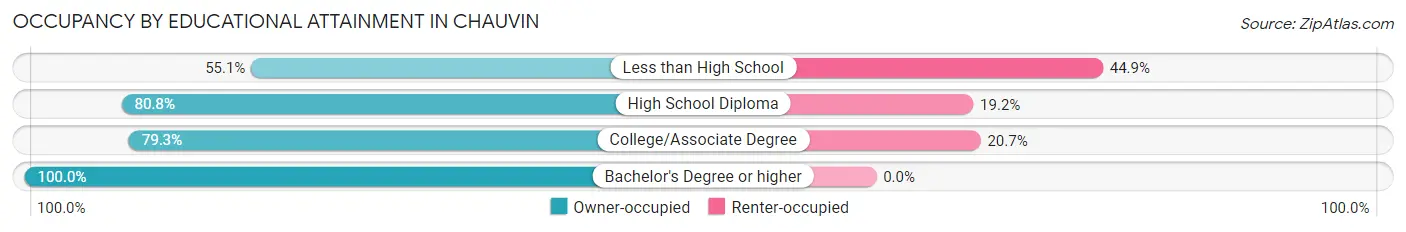
| Household Size | Owner-occupied | Renter-occupied |
| Less than High School | 152 (55.1%) | 124 (44.9%) |
| High School Diploma | 231 (80.8%) | 55 (19.2%) |
| College/Associate Degree | 211 (79.3%) | 55 (20.7%) |
| Bachelor's Degree or higher | 20 (100.0%) | 0 (0.0%) |
Occupancy by Age of Householder in Chauvin
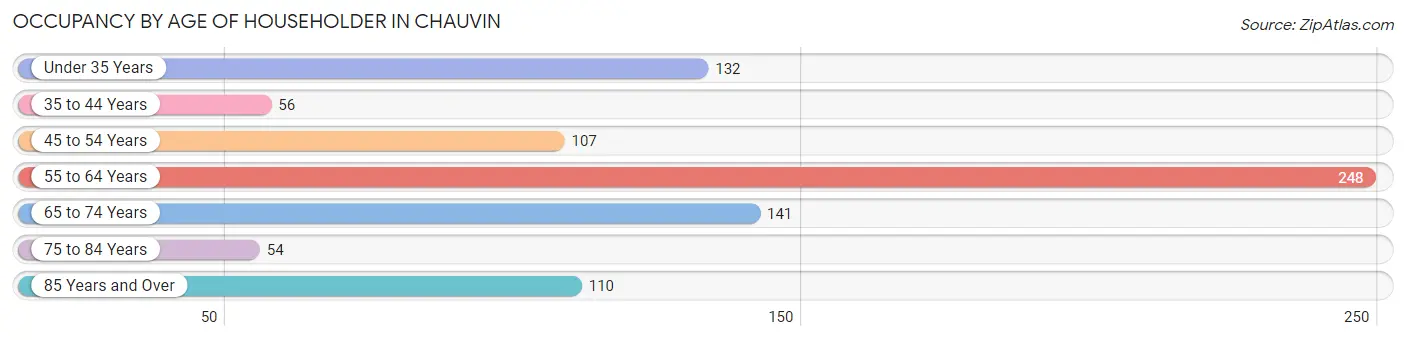
| Age Bracket | # Households | % Households |
| Under 35 Years | 132 | 15.6% |
| 35 to 44 Years | 56 | 6.6% |
| 45 to 54 Years | 107 | 12.6% |
| 55 to 64 Years | 248 | 29.2% |
| 65 to 74 Years | 141 | 16.6% |
| 75 to 84 Years | 54 | 6.4% |
| 85 Years and Over | 110 | 13.0% |
| Total | 848 | 100.0% |
Housing Finances in Chauvin
Median Income by Occupancy in Chauvin
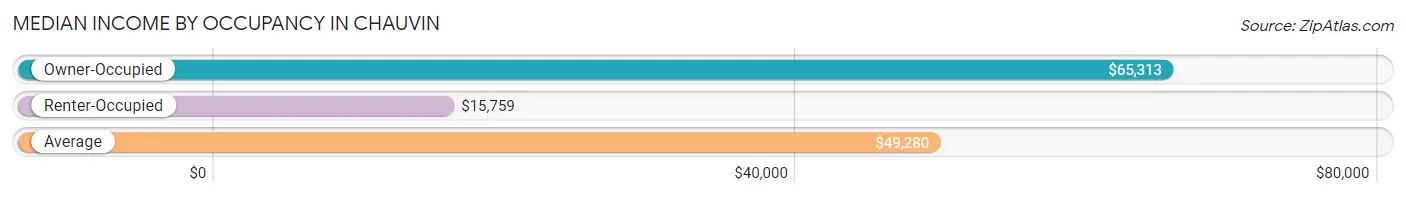
| Occupancy Type | # Households | Median Income |
| Owner-Occupied | 614 (72.4%) | $65,313 |
| Renter-Occupied | 234 (27.6%) | $15,759 |
| Average | 848 (100.0%) | $49,280 |
Occupancy by Householder Income Bracket in Chauvin
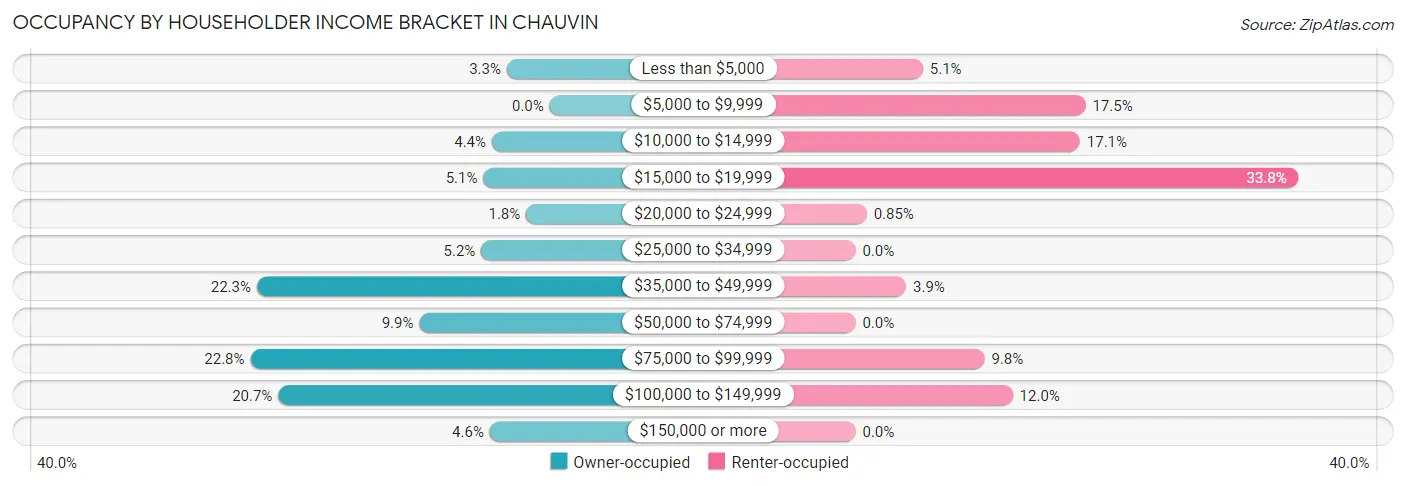
| Income Bracket | Owner-occupied | Renter-occupied |
| Less than $5,000 | 20 (3.3%) | 12 (5.1%) |
| $5,000 to $9,999 | 0 (0.0%) | 41 (17.5%) |
| $10,000 to $14,999 | 27 (4.4%) | 40 (17.1%) |
| $15,000 to $19,999 | 31 (5.1%) | 79 (33.8%) |
| $20,000 to $24,999 | 11 (1.8%) | 2 (0.9%) |
| $25,000 to $34,999 | 32 (5.2%) | 0 (0.0%) |
| $35,000 to $49,999 | 137 (22.3%) | 9 (3.8%) |
| $50,000 to $74,999 | 61 (9.9%) | 0 (0.0%) |
| $75,000 to $99,999 | 140 (22.8%) | 23 (9.8%) |
| $100,000 to $149,999 | 127 (20.7%) | 28 (12.0%) |
| $150,000 or more | 28 (4.6%) | 0 (0.0%) |
| Total | 614 (100.0%) | 234 (100.0%) |
Monthly Housing Cost Tiers in Chauvin
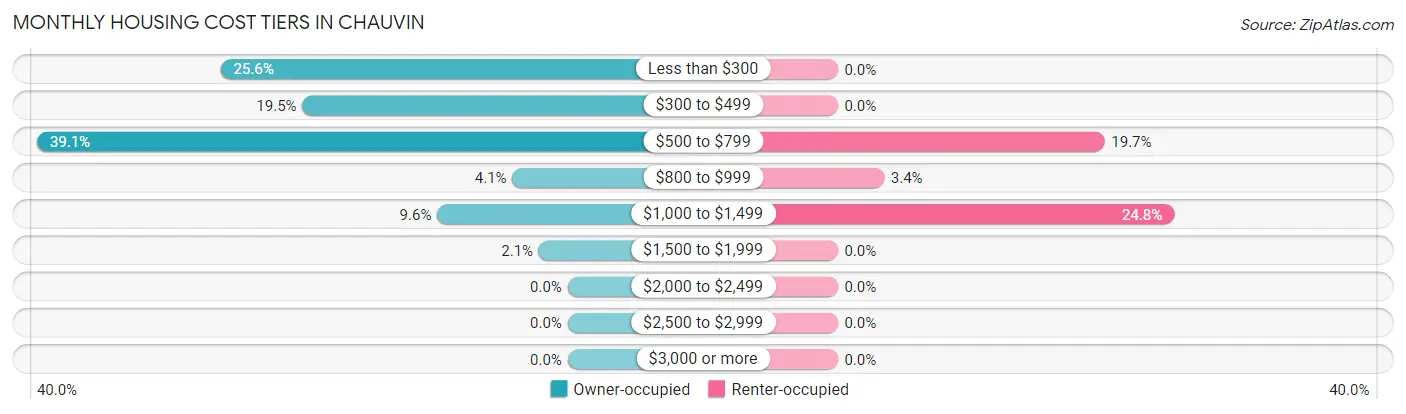
| Monthly Cost | Owner-occupied | Renter-occupied |
| Less than $300 | 157 (25.6%) | 0 (0.0%) |
| $300 to $499 | 120 (19.5%) | 0 (0.0%) |
| $500 to $799 | 240 (39.1%) | 46 (19.7%) |
| $800 to $999 | 25 (4.1%) | 8 (3.4%) |
| $1,000 to $1,499 | 59 (9.6%) | 58 (24.8%) |
| $1,500 to $1,999 | 13 (2.1%) | 0 (0.0%) |
| $2,000 to $2,499 | 0 (0.0%) | 0 (0.0%) |
| $2,500 to $2,999 | 0 (0.0%) | 0 (0.0%) |
| $3,000 or more | 0 (0.0%) | 0 (0.0%) |
| Total | 614 (100.0%) | 234 (100.0%) |
Physical Housing Characteristics in Chauvin
Housing Structures in Chauvin
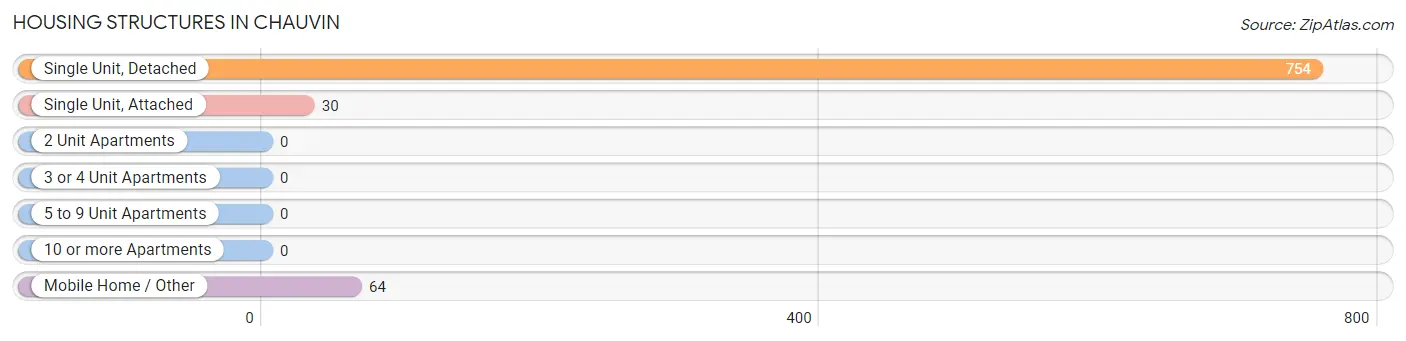
| Structure Type | # Housing Units | % Housing Units |
| Single Unit, Detached | 754 | 88.9% |
| Single Unit, Attached | 30 | 3.5% |
| 2 Unit Apartments | 0 | 0.0% |
| 3 or 4 Unit Apartments | 0 | 0.0% |
| 5 to 9 Unit Apartments | 0 | 0.0% |
| 10 or more Apartments | 0 | 0.0% |
| Mobile Home / Other | 64 | 7.5% |
| Total | 848 | 100.0% |
Housing Structures by Occupancy in Chauvin
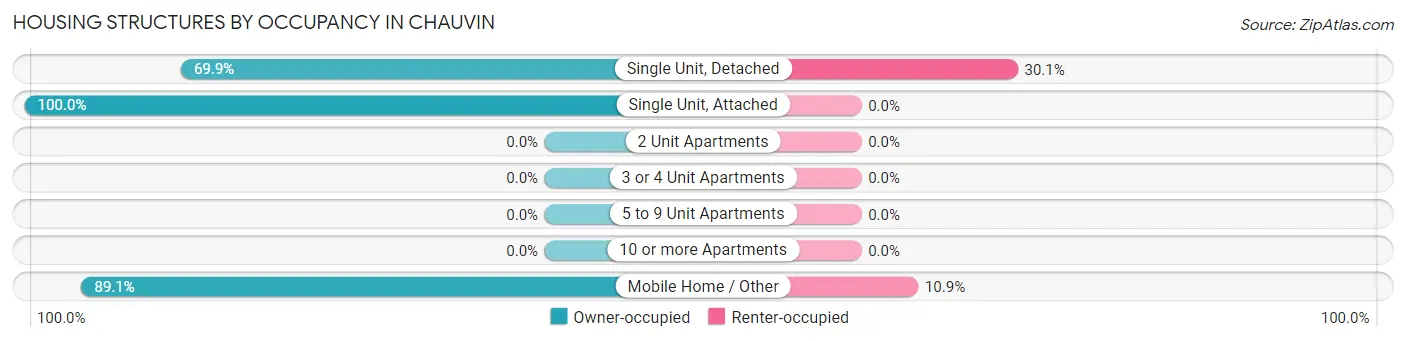
| Structure Type | Owner-occupied | Renter-occupied |
| Single Unit, Detached | 527 (69.9%) | 227 (30.1%) |
| Single Unit, Attached | 30 (100.0%) | 0 (0.0%) |
| 2 Unit Apartments | 0 (0.0%) | 0 (0.0%) |
| 3 or 4 Unit Apartments | 0 (0.0%) | 0 (0.0%) |
| 5 to 9 Unit Apartments | 0 (0.0%) | 0 (0.0%) |
| 10 or more Apartments | 0 (0.0%) | 0 (0.0%) |
| Mobile Home / Other | 57 (89.1%) | 7 (10.9%) |
| Total | 614 (72.4%) | 234 (27.6%) |
Housing Structures by Number of Rooms in Chauvin
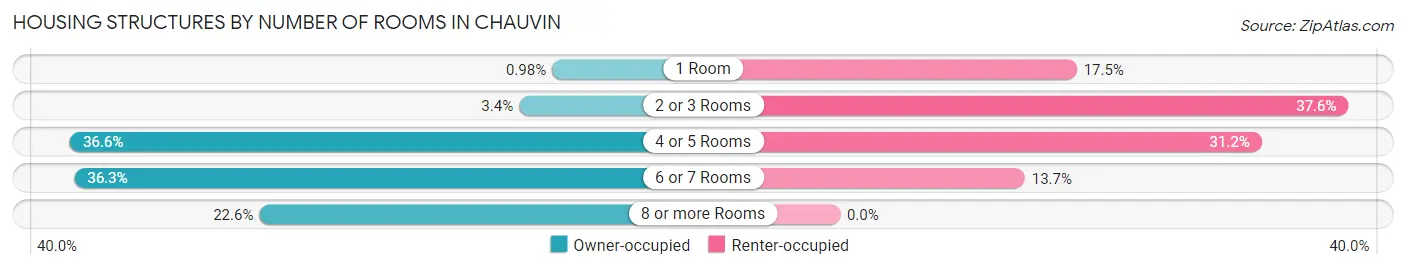
| Number of Rooms | Owner-occupied | Renter-occupied |
| 1 Room | 6 (1.0%) | 41 (17.5%) |
| 2 or 3 Rooms | 21 (3.4%) | 88 (37.6%) |
| 4 or 5 Rooms | 225 (36.6%) | 73 (31.2%) |
| 6 or 7 Rooms | 223 (36.3%) | 32 (13.7%) |
| 8 or more Rooms | 139 (22.6%) | 0 (0.0%) |
| Total | 614 (100.0%) | 234 (100.0%) |
Housing Structure by Heating Type in Chauvin
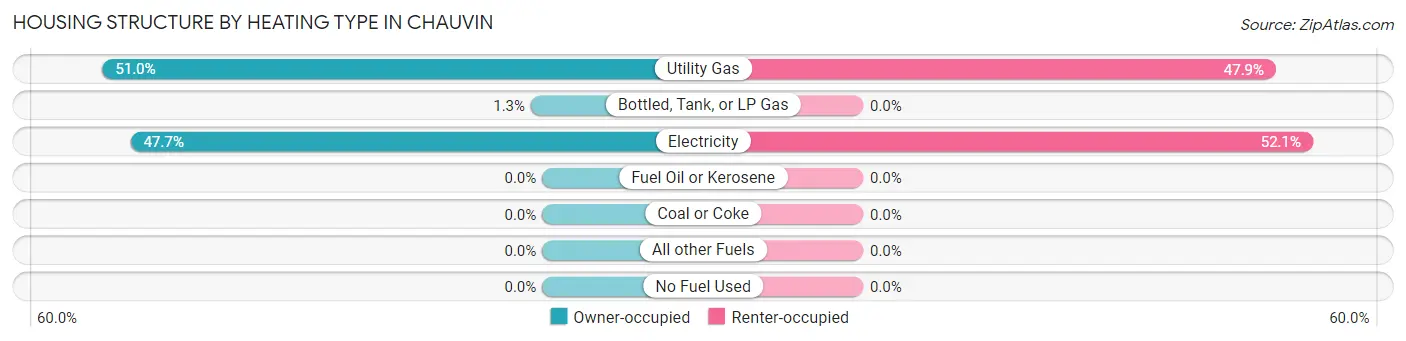
| Heating Type | Owner-occupied | Renter-occupied |
| Utility Gas | 313 (51.0%) | 112 (47.9%) |
| Bottled, Tank, or LP Gas | 8 (1.3%) | 0 (0.0%) |
| Electricity | 293 (47.7%) | 122 (52.1%) |
| Fuel Oil or Kerosene | 0 (0.0%) | 0 (0.0%) |
| Coal or Coke | 0 (0.0%) | 0 (0.0%) |
| All other Fuels | 0 (0.0%) | 0 (0.0%) |
| No Fuel Used | 0 (0.0%) | 0 (0.0%) |
| Total | 614 (100.0%) | 234 (100.0%) |
Household Vehicle Usage in Chauvin
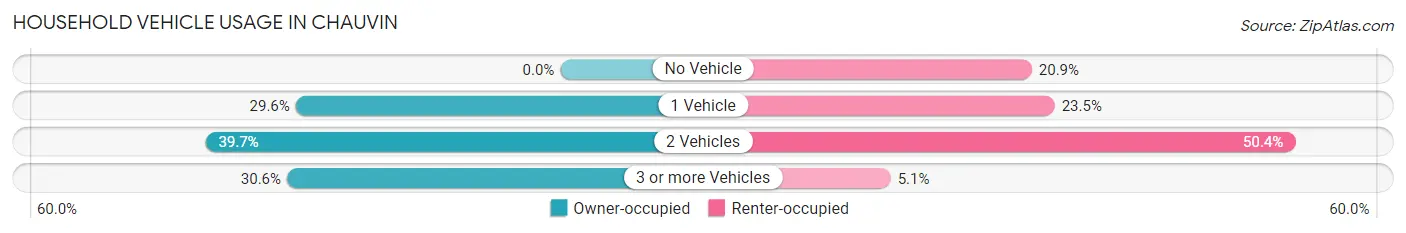
| Vehicles per Household | Owner-occupied | Renter-occupied |
| No Vehicle | 0 (0.0%) | 49 (20.9%) |
| 1 Vehicle | 182 (29.6%) | 55 (23.5%) |
| 2 Vehicles | 244 (39.7%) | 118 (50.4%) |
| 3 or more Vehicles | 188 (30.6%) | 12 (5.1%) |
| Total | 614 (100.0%) | 234 (100.0%) |
Real Estate & Mortgages in Chauvin
Real Estate and Mortgage Overview in Chauvin
| Characteristic | Without Mortgage | With Mortgage |
| Housing Units | 379 | 235 |
| Median Property Value | $86,000 | $87,500 |
| Median Household Income | $67,344 | $0 |
| Monthly Housing Costs | $331 | $0 |
| Real Estate Taxes | $550 | $158 |
Property Value by Mortgage Status in Chauvin
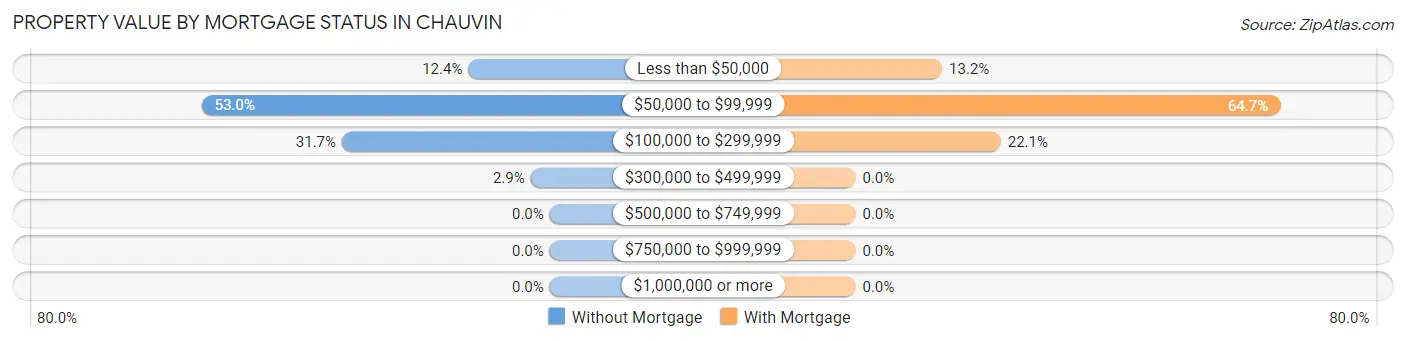
| Property Value | Without Mortgage | With Mortgage |
| Less than $50,000 | 47 (12.4%) | 31 (13.2%) |
| $50,000 to $99,999 | 201 (53.0%) | 152 (64.7%) |
| $100,000 to $299,999 | 120 (31.7%) | 52 (22.1%) |
| $300,000 to $499,999 | 11 (2.9%) | 0 (0.0%) |
| $500,000 to $749,999 | 0 (0.0%) | 0 (0.0%) |
| $750,000 to $999,999 | 0 (0.0%) | 0 (0.0%) |
| $1,000,000 or more | 0 (0.0%) | 0 (0.0%) |
| Total | 379 (100.0%) | 235 (100.0%) |
Household Income by Mortgage Status in Chauvin
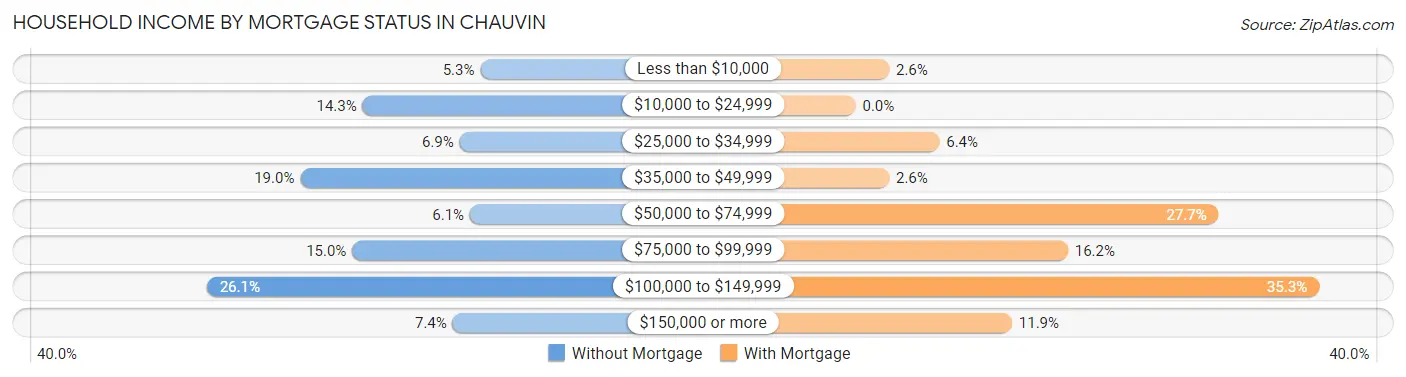
| Household Income | Without Mortgage | With Mortgage |
| Less than $10,000 | 20 (5.3%) | 6 (2.5%) |
| $10,000 to $24,999 | 54 (14.2%) | 0 (0.0%) |
| $25,000 to $34,999 | 26 (6.9%) | 15 (6.4%) |
| $35,000 to $49,999 | 72 (19.0%) | 6 (2.5%) |
| $50,000 to $74,999 | 23 (6.1%) | 65 (27.7%) |
| $75,000 to $99,999 | 57 (15.0%) | 38 (16.2%) |
| $100,000 to $149,999 | 99 (26.1%) | 83 (35.3%) |
| $150,000 or more | 28 (7.4%) | 28 (11.9%) |
| Total | 379 (100.0%) | 235 (100.0%) |
Property Value to Household Income Ratio in Chauvin
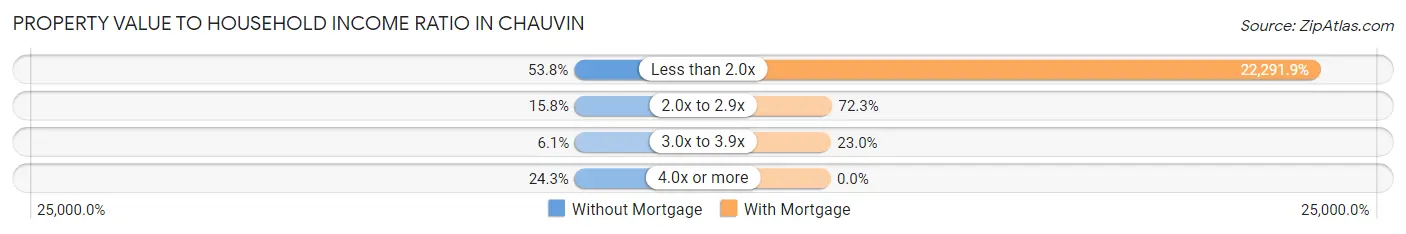
| Value-to-Income Ratio | Without Mortgage | With Mortgage |
| Less than 2.0x | 204 (53.8%) | 52,386 (22,291.9%) |
| 2.0x to 2.9x | 60 (15.8%) | 170 (72.3%) |
| 3.0x to 3.9x | 23 (6.1%) | 54 (23.0%) |
| 4.0x or more | 92 (24.3%) | 0 (0.0%) |
| Total | 379 (100.0%) | 235 (100.0%) |
Real Estate Taxes by Mortgage Status in Chauvin
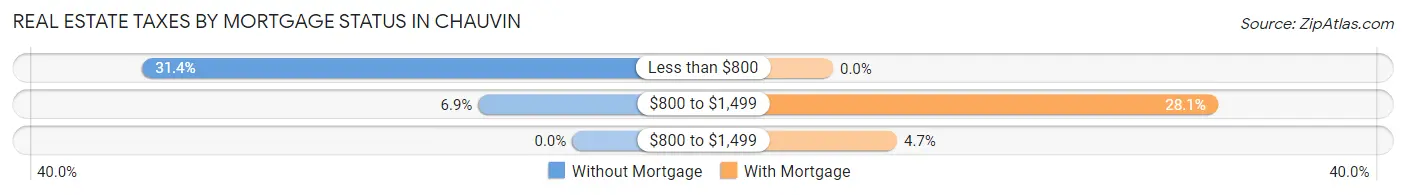
| Property Taxes | Without Mortgage | With Mortgage |
| Less than $800 | 119 (31.4%) | 0 (0.0%) |
| $800 to $1,499 | 26 (6.9%) | 66 (28.1%) |
| $800 to $1,499 | 0 (0.0%) | 11 (4.7%) |
| Total | 379 (100.0%) | 235 (100.0%) |
Health & Disability in Chauvin
Health Insurance Coverage by Age in Chauvin
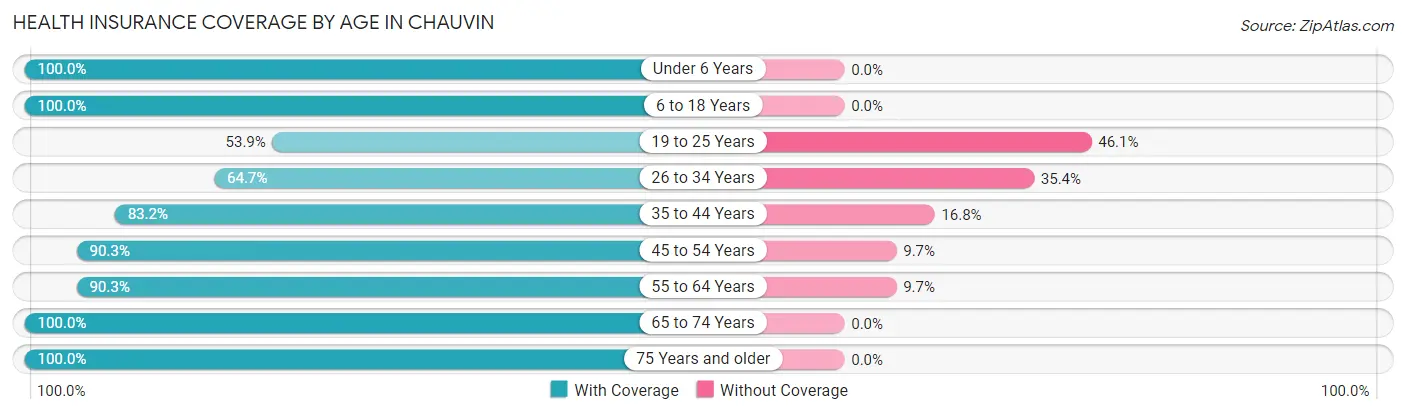
| Age Bracket | With Coverage | Without Coverage |
| Under 6 Years | 17 (100.0%) | 0 (0.0%) |
| 6 to 18 Years | 594 (100.0%) | 0 (0.0%) |
| 19 to 25 Years | 260 (53.9%) | 222 (46.1%) |
| 26 to 34 Years | 139 (64.6%) | 76 (35.3%) |
| 35 to 44 Years | 99 (83.2%) | 20 (16.8%) |
| 45 to 54 Years | 205 (90.3%) | 22 (9.7%) |
| 55 to 64 Years | 429 (90.3%) | 46 (9.7%) |
| 65 to 74 Years | 164 (100.0%) | 0 (0.0%) |
| 75 Years and older | 218 (100.0%) | 0 (0.0%) |
| Total | 2,125 (84.6%) | 386 (15.4%) |
Health Insurance Coverage by Citizenship Status in Chauvin
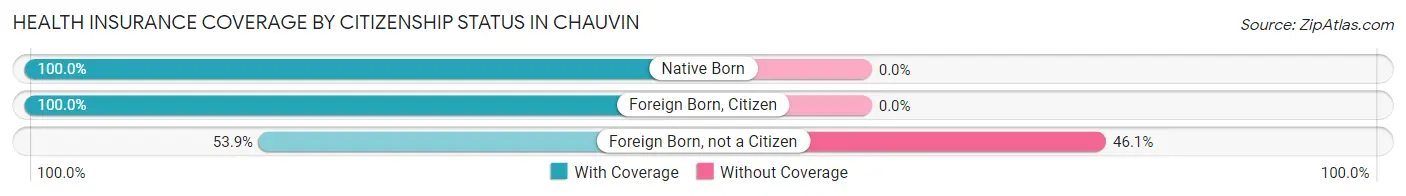
| Citizenship Status | With Coverage | Without Coverage |
| Native Born | 17 (100.0%) | 0 (0.0%) |
| Foreign Born, Citizen | 594 (100.0%) | 0 (0.0%) |
| Foreign Born, not a Citizen | 260 (53.9%) | 222 (46.1%) |
Health Insurance Coverage by Household Income in Chauvin
| Household Income | With Coverage | Without Coverage |
| Under $25,000 | 288 (93.2%) | 21 (6.8%) |
| $25,000 to $49,999 | 345 (92.2%) | 29 (7.7%) |
| $50,000 to $74,999 | 140 (48.6%) | 148 (51.4%) |
| $75,000 to $99,999 | 559 (93.0%) | 42 (7.0%) |
| $100,000 and over | 793 (84.5%) | 146 (15.5%) |
Public vs Private Health Insurance Coverage by Age in Chauvin
| Age Bracket | Public Insurance | Private Insurance |
| Under 6 | 9 (52.9%) | 8 (47.1%) |
| 6 to 18 Years | 373 (62.8%) | 246 (41.4%) |
| 19 to 25 Years | 150 (31.1%) | 151 (31.3%) |
| 25 to 34 Years | 44 (20.5%) | 95 (44.2%) |
| 35 to 44 Years | 29 (24.4%) | 73 (61.3%) |
| 45 to 54 Years | 125 (55.1%) | 95 (41.8%) |
| 55 to 64 Years | 221 (46.5%) | 262 (55.2%) |
| 65 to 74 Years | 161 (98.2%) | 68 (41.5%) |
| 75 Years and over | 218 (100.0%) | 106 (48.6%) |
| Total | 1,330 (53.0%) | 1,104 (44.0%) |
Disability Status by Sex by Age in Chauvin
| Age Bracket | Male | Female |
| Under 5 Years | 0 (0.0%) | 0 (0.0%) |
| 5 to 17 Years | 51 (13.5%) | 0 (0.0%) |
| 18 to 34 Years | 39 (8.9%) | 62 (20.7%) |
| 35 to 64 Years | 137 (32.5%) | 60 (15.0%) |
| 65 to 74 Years | 50 (71.4%) | 44 (46.8%) |
| 75 Years and over | 40 (57.1%) | 33 (22.3%) |
Disability Class by Sex by Age in Chauvin
Disability Class: Hearing Difficulty
| Age Bracket | Male | Female |
| Under 5 Years | 0 (0.0%) | 0 (0.0%) |
| 5 to 17 Years | 0 (0.0%) | 0 (0.0%) |
| 18 to 34 Years | 0 (0.0%) | 0 (0.0%) |
| 35 to 64 Years | 56 (13.3%) | 22 (5.5%) |
| 65 to 74 Years | 9 (12.9%) | 11 (11.7%) |
| 75 Years and over | 0 (0.0%) | 30 (20.3%) |
Disability Class: Vision Difficulty
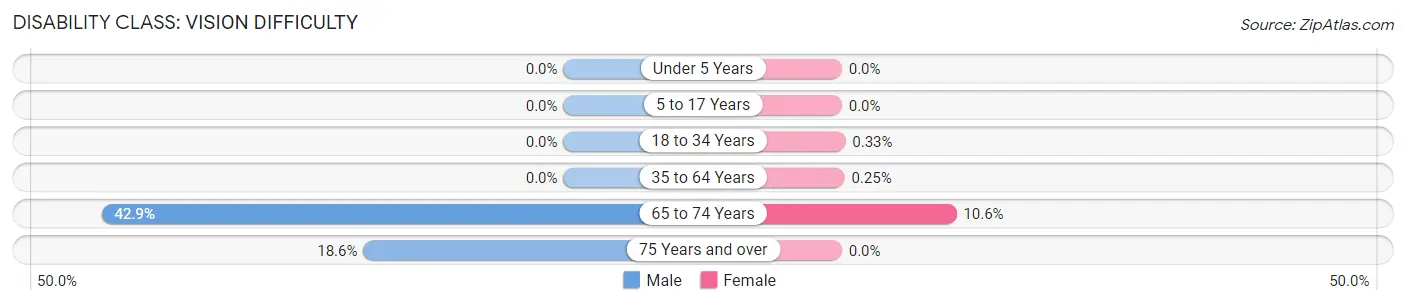
| Age Bracket | Male | Female |
| Under 5 Years | 0 (0.0%) | 0 (0.0%) |
| 5 to 17 Years | 0 (0.0%) | 0 (0.0%) |
| 18 to 34 Years | 0 (0.0%) | 1 (0.3%) |
| 35 to 64 Years | 0 (0.0%) | 1 (0.3%) |
| 65 to 74 Years | 30 (42.9%) | 10 (10.6%) |
| 75 Years and over | 13 (18.6%) | 0 (0.0%) |
Disability Class: Cognitive Difficulty
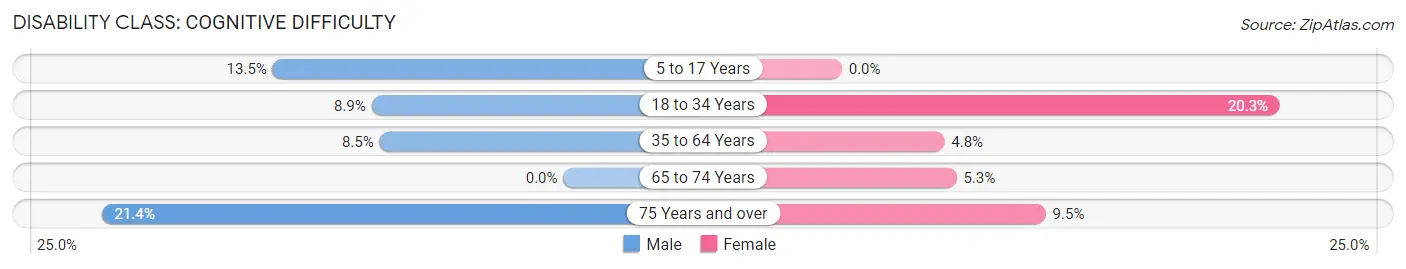
| Age Bracket | Male | Female |
| 5 to 17 Years | 51 (13.5%) | 0 (0.0%) |
| 18 to 34 Years | 39 (8.9%) | 61 (20.3%) |
| 35 to 64 Years | 36 (8.5%) | 19 (4.8%) |
| 65 to 74 Years | 0 (0.0%) | 5 (5.3%) |
| 75 Years and over | 15 (21.4%) | 14 (9.5%) |
Disability Class: Ambulatory Difficulty
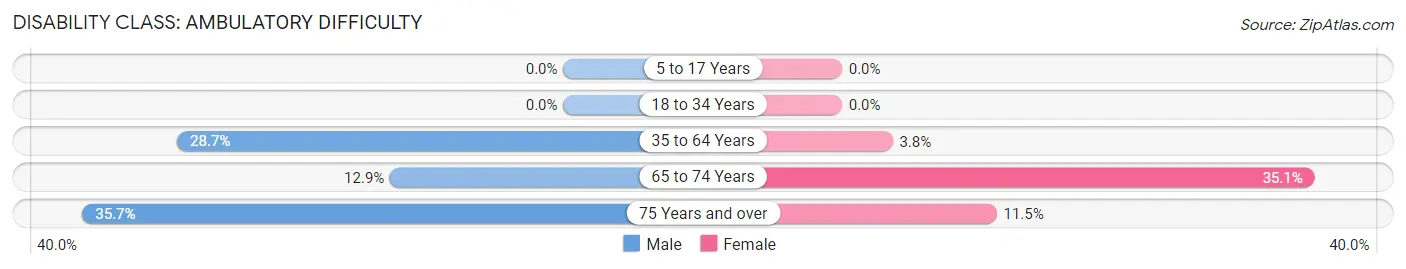
| Age Bracket | Male | Female |
| 5 to 17 Years | 0 (0.0%) | 0 (0.0%) |
| 18 to 34 Years | 0 (0.0%) | 0 (0.0%) |
| 35 to 64 Years | 121 (28.7%) | 15 (3.8%) |
| 65 to 74 Years | 9 (12.9%) | 33 (35.1%) |
| 75 Years and over | 25 (35.7%) | 17 (11.5%) |
Disability Class: Self-Care Difficulty
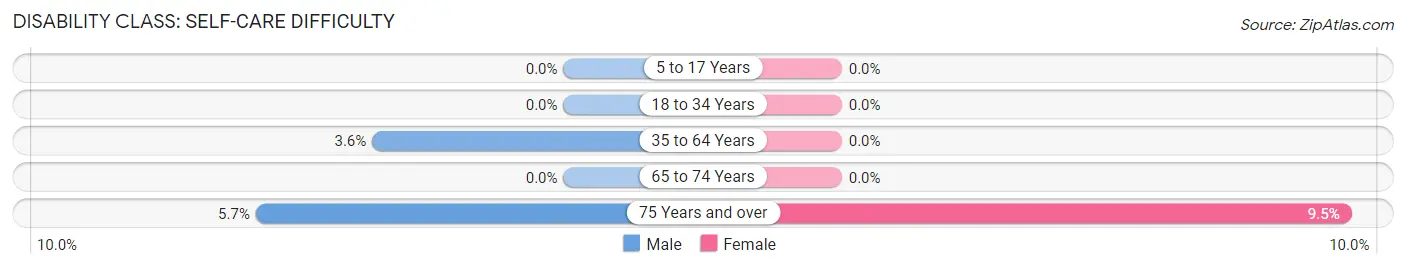
| Age Bracket | Male | Female |
| 5 to 17 Years | 0 (0.0%) | 0 (0.0%) |
| 18 to 34 Years | 0 (0.0%) | 0 (0.0%) |
| 35 to 64 Years | 15 (3.5%) | 0 (0.0%) |
| 65 to 74 Years | 0 (0.0%) | 0 (0.0%) |
| 75 Years and over | 4 (5.7%) | 14 (9.5%) |
Technology Access in Chauvin
Computing Device Access in Chauvin
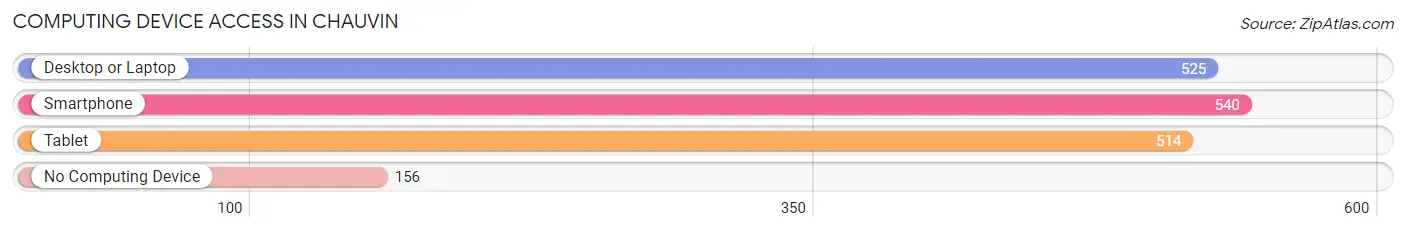
| Device Type | # Households | % Households |
| Desktop or Laptop | 525 | 61.9% |
| Smartphone | 540 | 63.7% |
| Tablet | 514 | 60.6% |
| No Computing Device | 156 | 18.4% |
| Total | 848 | 100.0% |
Internet Access in Chauvin
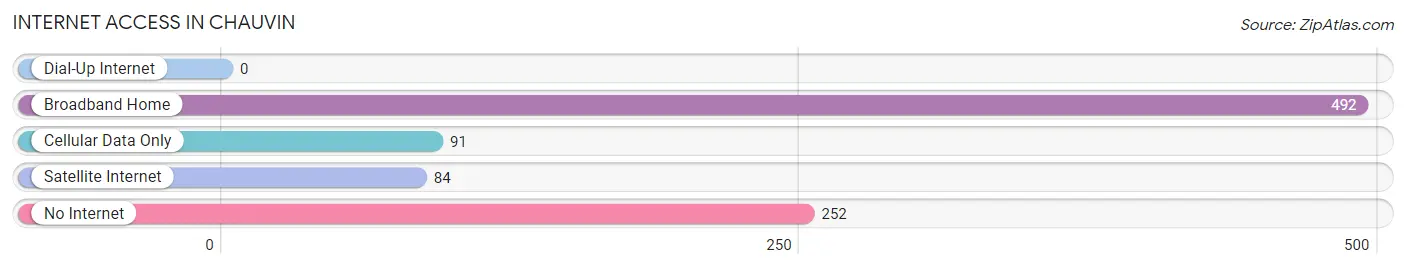
| Internet Type | # Households | % Households |
| Dial-Up Internet | 0 | 0.0% |
| Broadband Home | 492 | 58.0% |
| Cellular Data Only | 91 | 10.7% |
| Satellite Internet | 84 | 9.9% |
| No Internet | 252 | 29.7% |
| Total | 848 | 100.0% |
Chauvin Summary
Chauvin is a small unincorporated community located in Terrebonne Parish, Louisiana. It is situated on the banks of Bayou Little Caillou, approximately 15 miles south of Houma. The population of Chauvin was 2,945 at the 2010 census.
History
Chauvin was founded in the early 1800s by French settlers who were attracted to the area by its abundant natural resources. The name “Chauvin” is derived from the French word “chauvinisme”, which means “excessive patriotism”. The town was originally known as “Chauvin’s Landing”, and was a popular port for steamboats and other vessels.
In the late 1800s, Chauvin became a center for the lumber industry. The town was home to several sawmills and lumberyards, and the lumber industry was the primary source of employment for the town’s residents.
In the early 1900s, Chauvin was a popular destination for tourists. The town was home to several resorts, including the Grand Hotel, which was built in the late 1800s. The hotel was destroyed by a hurricane in 1915, but was rebuilt and reopened in 1916.
Geography
Chauvin is located in Terrebonne Parish, Louisiana, approximately 15 miles south of Houma. The town is situated on the banks of Bayou Little Caillou, which is a tributary of the Gulf of Mexico. The terrain of the area is mostly flat, with some low hills and marshlands.
Economy
The economy of Chauvin is largely based on the oil and gas industry. The town is home to several oil and gas companies, including Chevron, Shell, and ExxonMobil. The town is also home to several seafood processing plants, which process shrimp, oysters, and other seafood.
The town is also home to several retail stores, including a Walmart Supercenter, a Lowe’s Home Improvement store, and several restaurants.
Demographics
As of the 2010 census, the population of Chauvin was 2,945. The racial makeup of the town was 79.3% White, 17.2% African American, 0.7% Native American, 0.3% Asian, 0.1% Pacific Islander, and 2.4% from other races. The median household income was $37,917, and the median family income was $45,917.
Conclusion
Chauvin is a small unincorporated community located in Terrebonne Parish, Louisiana. It is situated on the banks of Bayou Little Caillou, approximately 15 miles south of Houma. The town was founded in the early 1800s by French settlers, and was originally known as “Chauvin’s Landing”. The economy of Chauvin is largely based on the oil and gas industry, and the town is also home to several seafood processing plants and retail stores. As of the 2010 census, the population of Chauvin was 2,945.
Common Questions
What is Per Capita Income in Chauvin?
Per Capita income in Chauvin is $19,665.
What is the Median Family Income in Chauvin?
Median Family Income in Chauvin is $75,379.
What is the Median Household income in Chauvin?
Median Household Income in Chauvin is $49,280.
What is Inequality or Gini Index in Chauvin?
Inequality or Gini Index in Chauvin is 0.42.
What is the Total Population of Chauvin?
Total Population of Chauvin is 2,511.
What is the Total Male Population of Chauvin?
Total Male Population of Chauvin is 1,388.
What is the Total Female Population of Chauvin?
Total Female Population of Chauvin is 1,123.
What is the Ratio of Males per 100 Females in Chauvin?
There are 123.60 Males per 100 Females in Chauvin.
What is the Ratio of Females per 100 Males in Chauvin?
There are 80.91 Females per 100 Males in Chauvin.
What is the Median Population Age in Chauvin?
Median Population Age in Chauvin is 33.4 Years.
What is the Average Family Size in Chauvin
Average Family Size in Chauvin is 3.5 People.
What is the Average Household Size in Chauvin
Average Household Size in Chauvin is 3.0 People.
How Large is the Labor Force in Chauvin?
There are 1,070 People in the Labor Forcein in Chauvin.
What is the Percentage of People in the Labor Force in Chauvin?
50.5% of People are in the Labor Force in Chauvin.
What is the Unemployment Rate in Chauvin?
Unemployment Rate in Chauvin is 10.5%.