Fort Polk North, LA Map & Demographics
Fort Polk North Map
Fort Polk North Overview
$28,116
PER CAPITA INCOME
$41,167
AVG FAMILY INCOME
$39,771
AVG HOUSEHOLD INCOME
19.2%
WAGE / INCOME GAP [ % ]
80.8¢/ $1
WAGE / INCOME GAP [ $ ]
0.41
INEQUALITY / GINI INDEX
2,075
TOTAL POPULATION
1,050
MALE POPULATION
1,025
FEMALE POPULATION
102.44
MALES / 100 FEMALES
97.62
FEMALES / 100 MALES
23.7
MEDIAN AGE
2.5
AVG FAMILY SIZE
2.0
AVG HOUSEHOLD SIZE
1,346
LABOR FORCE [ PEOPLE ]
78.6%
PERCENT IN LABOR FORCE
12.0%
UNEMPLOYMENT RATE
Income in Fort Polk North
Income Overview in Fort Polk North
Per Capita Income in Fort Polk North is $28,116, while median incomes of families and households are $41,167 and $39,771 respectively.
| Characteristic | Number | Measure |
| Per Capita Income | 2,075 | $28,116 |
| Median Family Income | 700 | $41,167 |
| Mean Family Income | 700 | $48,826 |
| Median Household Income | 1,030 | $39,771 |
| Mean Household Income | 1,030 | $55,476 |
| Income Deficit | 700 | $0 |
| Wage / Income Gap (%) | 2,075 | 19.24% |
| Wage / Income Gap ($) | 2,075 | 80.76¢ per $1 |
| Gini / Inequality Index | 2,075 | 0.41 |
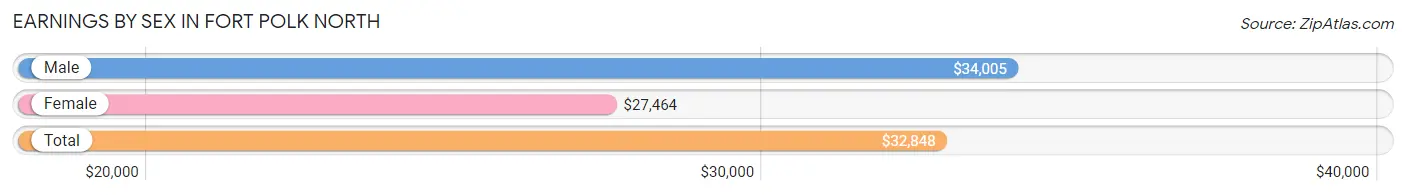
Earnings by Sex in Fort Polk North
Average Earnings in Fort Polk North are $32,848, $34,005 for men and $27,464 for women, a difference of 19.2%.
| Sex | Number | Average Earnings |
| Male | 904 (62.3%) | $34,005 |
| Female | 547 (37.7%) | $27,464 |
| Total | 1,451 (100.0%) | $32,848 |
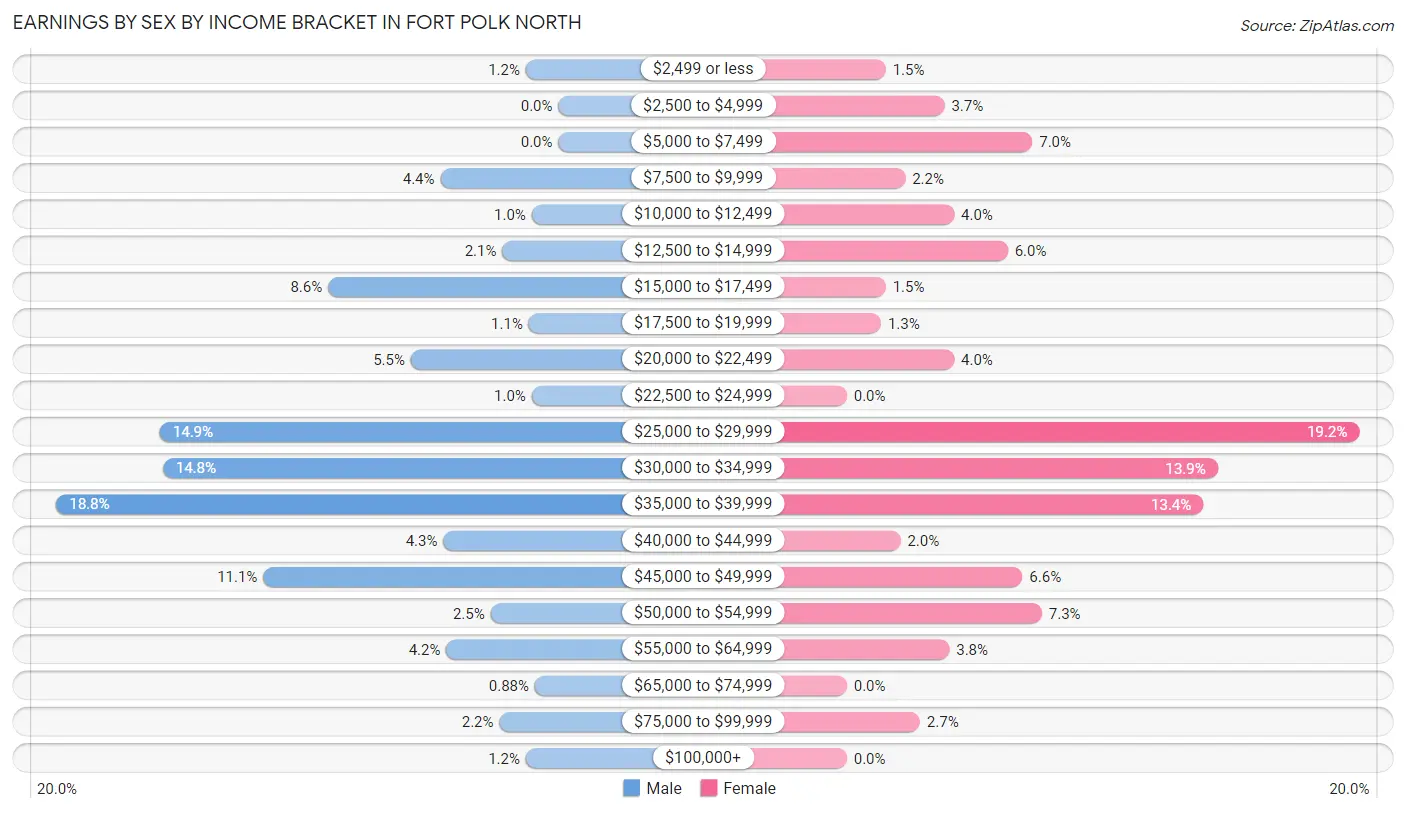
Earnings by Sex by Income Bracket in Fort Polk North
The most common earnings brackets in Fort Polk North are $35,000 to $39,999 for men (170 | 18.8%) and $25,000 to $29,999 for women (105 | 19.2%).
| Income | Male | Female |
| $2,499 or less | 11 (1.2%) | 8 (1.5%) |
| $2,500 to $4,999 | 0 (0.0%) | 20 (3.7%) |
| $5,000 to $7,499 | 0 (0.0%) | 38 (7.0%) |
| $7,500 to $9,999 | 40 (4.4%) | 12 (2.2%) |
| $10,000 to $12,499 | 9 (1.0%) | 22 (4.0%) |
| $12,500 to $14,999 | 19 (2.1%) | 33 (6.0%) |
| $15,000 to $17,499 | 78 (8.6%) | 8 (1.5%) |
| $17,500 to $19,999 | 10 (1.1%) | 7 (1.3%) |
| $20,000 to $22,499 | 50 (5.5%) | 22 (4.0%) |
| $22,500 to $24,999 | 9 (1.0%) | 0 (0.0%) |
| $25,000 to $29,999 | 135 (14.9%) | 105 (19.2%) |
| $30,000 to $34,999 | 134 (14.8%) | 76 (13.9%) |
| $35,000 to $39,999 | 170 (18.8%) | 73 (13.4%) |
| $40,000 to $44,999 | 39 (4.3%) | 11 (2.0%) |
| $45,000 to $49,999 | 100 (11.1%) | 36 (6.6%) |
| $50,000 to $54,999 | 23 (2.5%) | 40 (7.3%) |
| $55,000 to $64,999 | 38 (4.2%) | 21 (3.8%) |
| $65,000 to $74,999 | 8 (0.9%) | 0 (0.0%) |
| $75,000 to $99,999 | 20 (2.2%) | 15 (2.7%) |
| $100,000+ | 11 (1.2%) | 0 (0.0%) |
| Total | 904 (100.0%) | 547 (100.0%) |
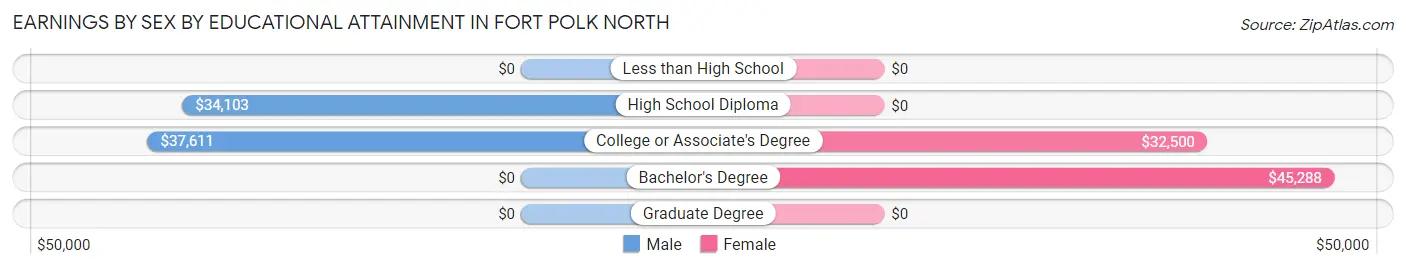
Earnings by Sex by Educational Attainment in Fort Polk North
Average earnings in Fort Polk North are $36,577 for men and $38,097 for women, a difference of 4.0%. Men with an educational attainment of college or associate's degree enjoy the highest average annual earnings of $37,611, while those with high school diploma education earn the least with $34,103. Women with an educational attainment of bachelor's degree earn the most with the average annual earnings of $45,288, while those with college or associate's degree education have the smallest earnings of $32,500.
| Educational Attainment | Male Income | Female Income |
| Less than High School | - | - |
| High School Diploma | $34,103 | $0 |
| College or Associate's Degree | $37,611 | $32,500 |
| Bachelor's Degree | - | - |
| Graduate Degree | - | - |
| Total | $36,577 | $38,097 |
Family Income in Fort Polk North
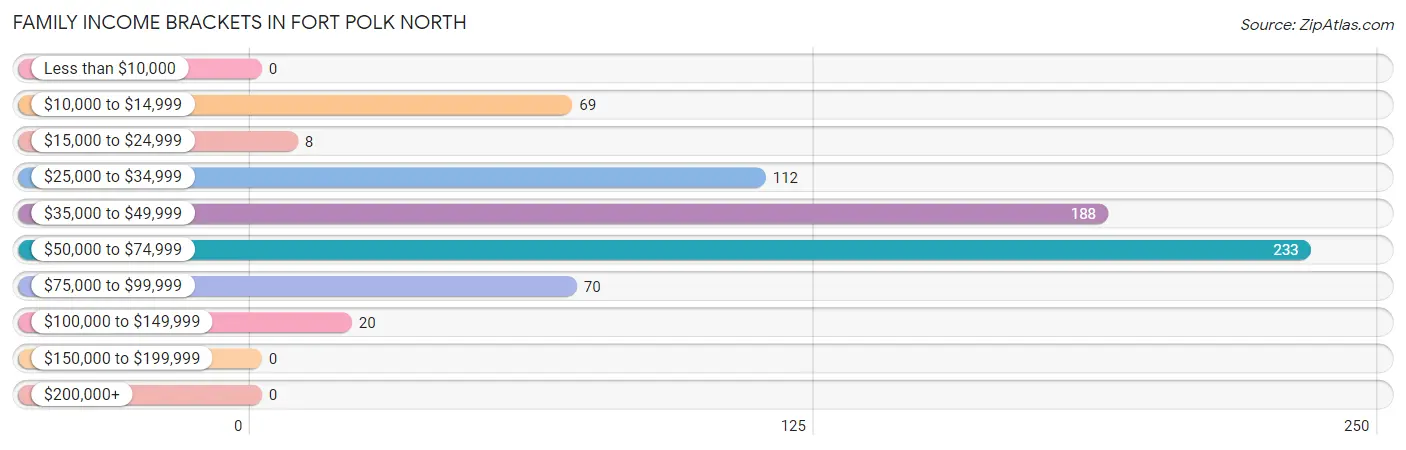
Family Income Brackets in Fort Polk North
According to the Fort Polk North family income data, there are 233 families falling into the $50,000 to $74,999 income range, which is the most common income bracket and makes up 33.3% of all families.
| Income Bracket | # Families | % Families |
| Less than $10,000 | 0 | 0.0% |
| $10,000 to $14,999 | 69 | 9.9% |
| $15,000 to $24,999 | 8 | 1.1% |
| $25,000 to $34,999 | 112 | 16.0% |
| $35,000 to $49,999 | 188 | 26.9% |
| $50,000 to $74,999 | 233 | 33.3% |
| $75,000 to $99,999 | 70 | 10.0% |
| $100,000 to $149,999 | 20 | 2.9% |
| $150,000 to $199,999 | 0 | 0.0% |
| $200,000+ | 0 | 0.0% |
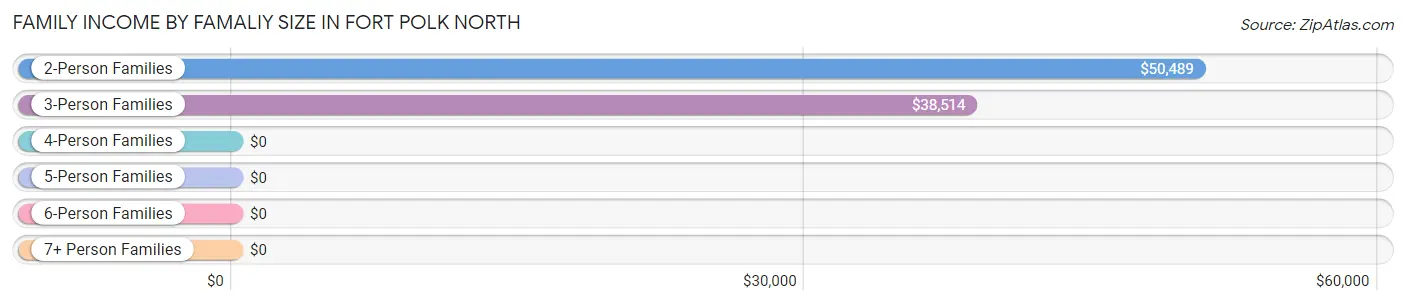
Family Income by Famaliy Size in Fort Polk North
2-person families (429 | 61.3%) account for the highest median family income in Fort Polk North with $50,489 per family, while 2-person families (429 | 61.3%) have the highest median income of $25,244 per family member.
| Income Bracket | # Families | Median Income |
| 2-Person Families | 429 (61.3%) | $50,489 |
| 3-Person Families | 252 (36.0%) | $38,514 |
| 4-Person Families | 19 (2.7%) | $0 |
| 5-Person Families | 0 (0.0%) | $0 |
| 6-Person Families | 0 (0.0%) | $0 |
| 7+ Person Families | 0 (0.0%) | $0 |
| Total | 700 (100.0%) | $41,167 |
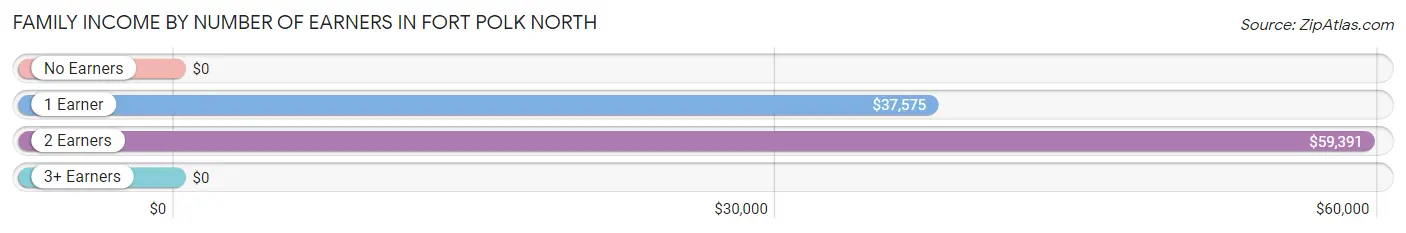
Family Income by Number of Earners in Fort Polk North
| Number of Earners | # Families | Median Income |
| No Earners | 0 (0.0%) | $0 |
| 1 Earner | 307 (43.9%) | $37,575 |
| 2 Earners | 393 (56.1%) | $59,391 |
| 3+ Earners | 0 (0.0%) | $0 |
| Total | 700 (100.0%) | $41,167 |
Household Income in Fort Polk North
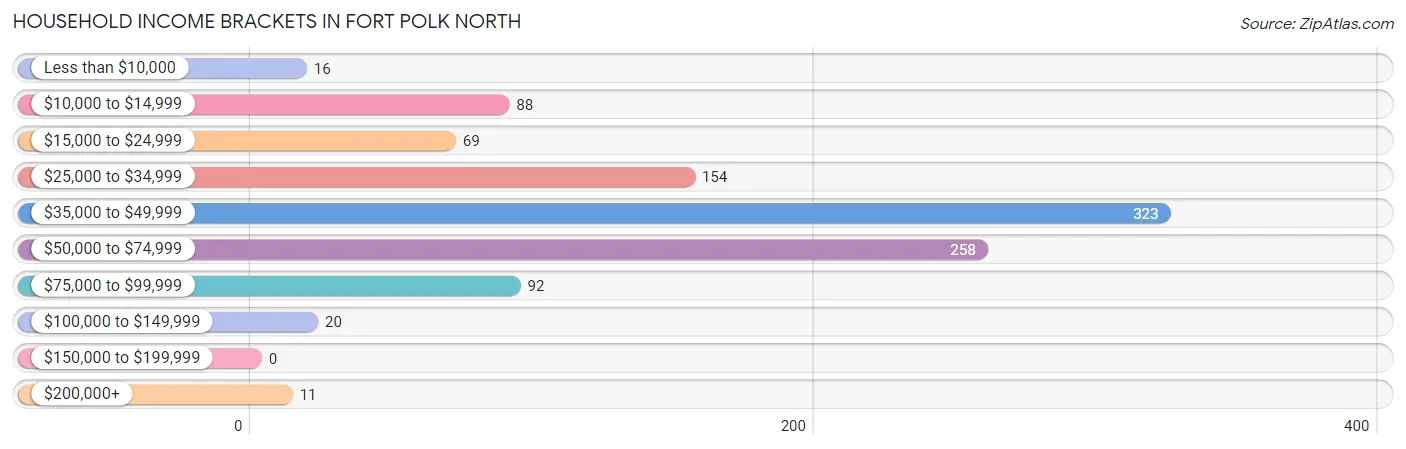
Household Income Brackets in Fort Polk North
With 323 households falling in the category, the $35,000 to $49,999 income range is the most frequent in Fort Polk North, accounting for 31.4% of all households.
| Income Bracket | # Households | % Households |
| Less than $10,000 | 16 | 1.6% |
| $10,000 to $14,999 | 88 | 8.5% |
| $15,000 to $24,999 | 69 | 6.7% |
| $25,000 to $34,999 | 154 | 15.0% |
| $35,000 to $49,999 | 323 | 31.4% |
| $50,000 to $74,999 | 258 | 25.0% |
| $75,000 to $99,999 | 92 | 8.9% |
| $100,000 to $149,999 | 20 | 1.9% |
| $150,000 to $199,999 | 0 | 0.0% |
| $200,000+ | 11 | 1.1% |
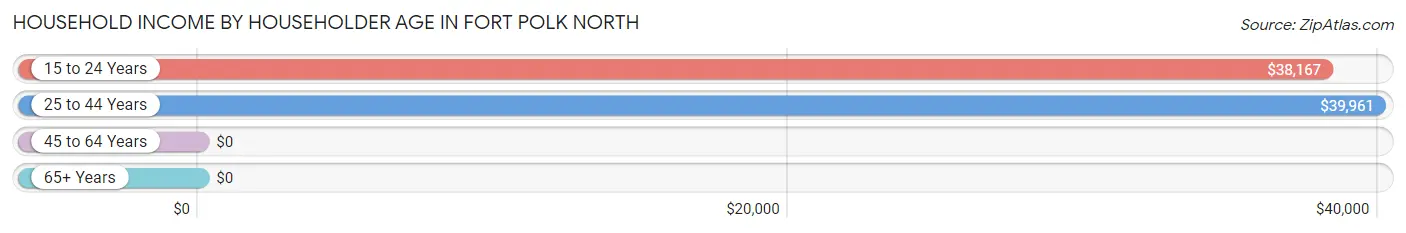
Household Income by Householder Age in Fort Polk North
The median household income in Fort Polk North is $39,771, with the highest median household income of $39,961 found in the 25 to 44 years age bracket for the primary householder. A total of 516 households (50.1%) fall into this category. Meanwhile, the 45 to 64 years age bracket for the primary householder has the lowest median household income of $0, with 16 households (1.5%) in this group.
| Income Bracket | # Households | Median Income |
| 15 to 24 Years | 498 (48.3%) | $38,167 |
| 25 to 44 Years | 516 (50.1%) | $39,961 |
| 45 to 64 Years | 16 (1.5%) | $0 |
| 65+ Years | 0 (0.0%) | $0 |
| Total | 1,030 (100.0%) | $39,771 |
Poverty in Fort Polk North
Income Below Poverty by Sex and Age in Fort Polk North
With 9.2% poverty level for males and 12.0% for females among the residents of Fort Polk North, 45 to 54 year old males and 45 to 54 year old females are the most vulnerable to poverty, with 8 males (50.0%) and 16 females (57.1%) in their respective age groups living below the poverty level.
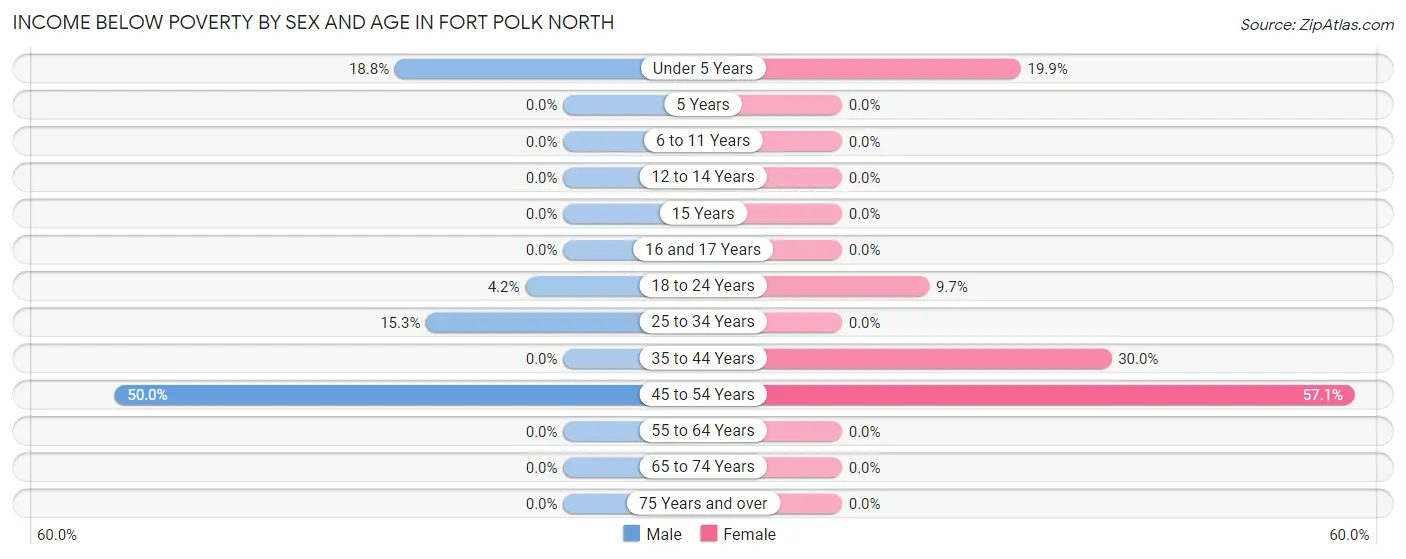
| Age Bracket | Male | Female |
| Under 5 Years | 18 (18.8%) | 42 (19.9%) |
| 5 Years | 0 (0.0%) | 0 (0.0%) |
| 6 to 11 Years | 0 (0.0%) | 0 (0.0%) |
| 12 to 14 Years | 0 (0.0%) | 0 (0.0%) |
| 15 Years | 0 (0.0%) | 0 (0.0%) |
| 16 and 17 Years | 0 (0.0%) | 0 (0.0%) |
| 18 to 24 Years | 19 (4.2%) | 44 (9.7%) |
| 25 to 34 Years | 51 (15.3%) | 0 (0.0%) |
| 35 to 44 Years | 0 (0.0%) | 21 (30.0%) |
| 45 to 54 Years | 8 (50.0%) | 16 (57.1%) |
| 55 to 64 Years | 0 (0.0%) | 0 (0.0%) |
| 65 to 74 Years | 0 (0.0%) | 0 (0.0%) |
| 75 Years and over | 0 (0.0%) | 0 (0.0%) |
| Total | 96 (9.2%) | 123 (12.0%) |
Income Above Poverty by Sex and Age in Fort Polk North
According to the poverty statistics in Fort Polk North, males aged 6 to 11 years and females aged 5 years are the age groups that are most secure financially, with 100.0% of males and 100.0% of females in these age groups living above the poverty line.
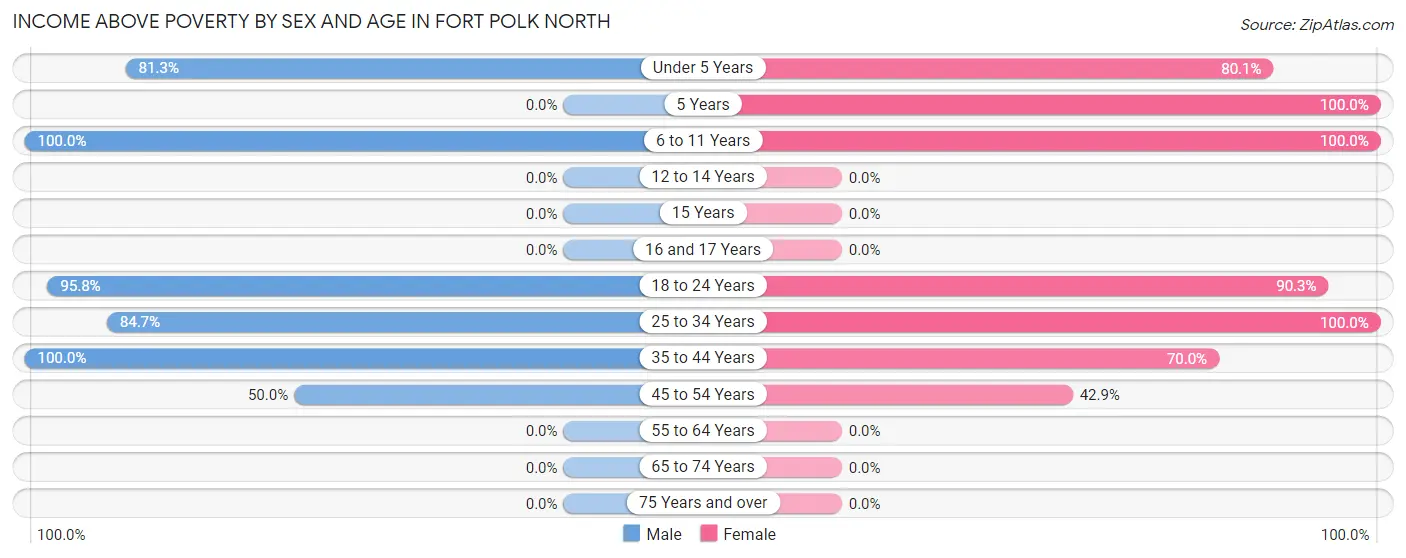
| Age Bracket | Male | Female |
| Under 5 Years | 78 (81.2%) | 169 (80.1%) |
| 5 Years | 0 (0.0%) | 5 (100.0%) |
| 6 to 11 Years | 32 (100.0%) | 19 (100.0%) |
| 12 to 14 Years | 0 (0.0%) | 0 (0.0%) |
| 15 Years | 0 (0.0%) | 0 (0.0%) |
| 16 and 17 Years | 0 (0.0%) | 0 (0.0%) |
| 18 to 24 Years | 429 (95.8%) | 409 (90.3%) |
| 25 to 34 Years | 283 (84.7%) | 239 (100.0%) |
| 35 to 44 Years | 113 (100.0%) | 49 (70.0%) |
| 45 to 54 Years | 8 (50.0%) | 12 (42.9%) |
| 55 to 64 Years | 0 (0.0%) | 0 (0.0%) |
| 65 to 74 Years | 0 (0.0%) | 0 (0.0%) |
| 75 Years and over | 0 (0.0%) | 0 (0.0%) |
| Total | 943 (90.8%) | 902 (88.0%) |
Income Below Poverty Among Married-Couple Families in Fort Polk North
The poverty statistics for married-couple families in Fort Polk North show that 7.4% or 45 of the total 610 families live below the poverty line. Families with 1 or 2 children have the highest poverty rate of 16.2%, comprising of 40 families. On the other hand, families with no children have the lowest poverty rate of 1.4%, which includes 5 families.
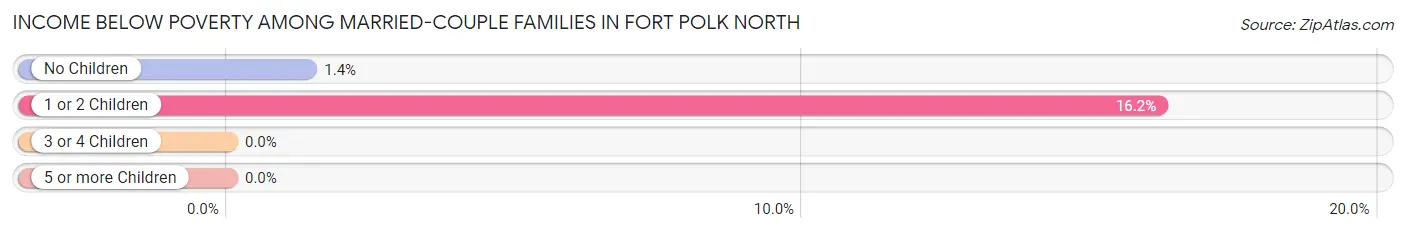
| Children | Above Poverty | Below Poverty |
| No Children | 358 (98.6%) | 5 (1.4%) |
| 1 or 2 Children | 207 (83.8%) | 40 (16.2%) |
| 3 or 4 Children | 0 (0.0%) | 0 (0.0%) |
| 5 or more Children | 0 (0.0%) | 0 (0.0%) |
| Total | 565 (92.6%) | 45 (7.4%) |
Income Below Poverty Among Single-Parent Households in Fort Polk North
According to the poverty data in Fort Polk North, 100.0% or 8 single-father households and 29.3% or 24 single-mother households are living below the poverty line. Among single-father households, those with no children have the highest poverty rate, with 8 households (100.0%) experiencing poverty. Likewise, among single-mother households, those with 1 or 2 children have the highest poverty rate, with 24 households (29.3%) falling below the poverty line.
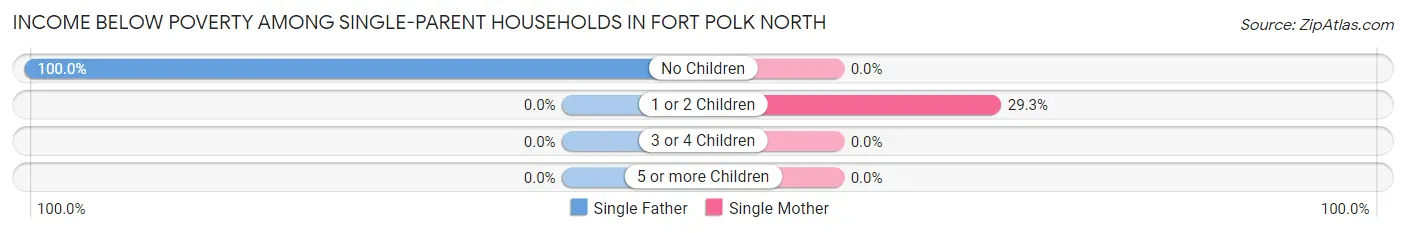
| Children | Single Father | Single Mother |
| No Children | 8 (100.0%) | 0 (0.0%) |
| 1 or 2 Children | 0 (0.0%) | 24 (29.3%) |
| 3 or 4 Children | 0 (0.0%) | 0 (0.0%) |
| 5 or more Children | 0 (0.0%) | 0 (0.0%) |
| Total | 8 (100.0%) | 24 (29.3%) |
Income Below Poverty Among Married-Couple vs Single-Parent Households in Fort Polk North
The poverty data for Fort Polk North shows that 45 of the married-couple family households (7.4%) and 32 of the single-parent households (35.6%) are living below the poverty level. Within the married-couple family households, those with 1 or 2 children have the highest poverty rate, with 40 households (16.2%) falling below the poverty line. Among the single-parent households, those with no children have the highest poverty rate, with 8 household (100.0%) living below poverty.
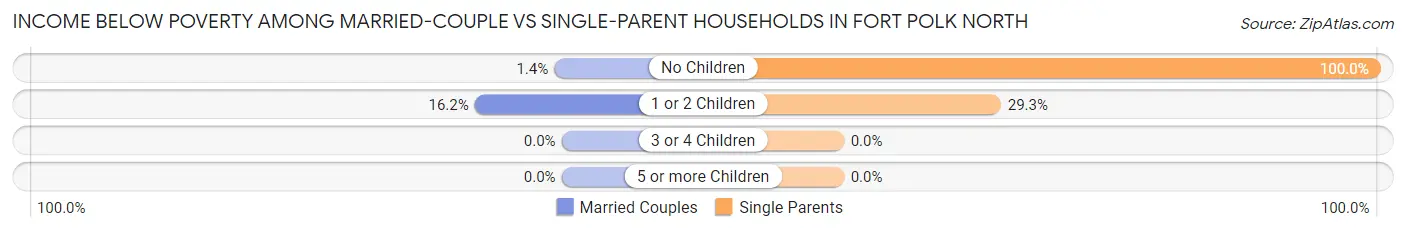
| Children | Married-Couple Families | Single-Parent Households |
| No Children | 5 (1.4%) | 8 (100.0%) |
| 1 or 2 Children | 40 (16.2%) | 24 (29.3%) |
| 3 or 4 Children | 0 (0.0%) | 0 (0.0%) |
| 5 or more Children | 0 (0.0%) | 0 (0.0%) |
| Total | 45 (7.4%) | 32 (35.6%) |
Race in Fort Polk North
The most populous races in Fort Polk North are White / Caucasian (1,380 | 66.5%), Hispanic or Latino (558 | 26.9%), and Black / African American (414 | 20.0%).
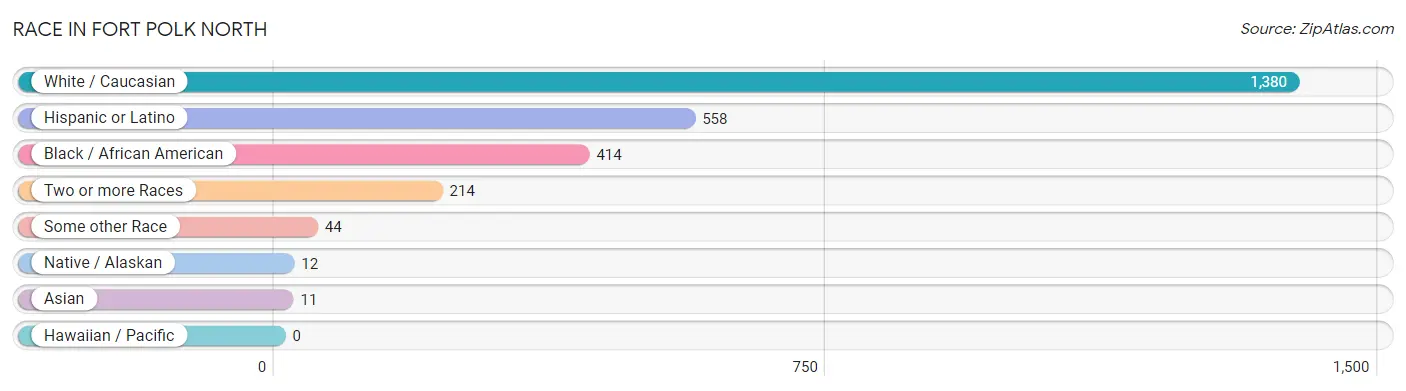
| Race | # Population | % Population |
| Asian | 11 | 0.5% |
| Black / African American | 414 | 20.0% |
| Hawaiian / Pacific | 0 | 0.0% |
| Hispanic or Latino | 558 | 26.9% |
| Native / Alaskan | 12 | 0.6% |
| White / Caucasian | 1,380 | 66.5% |
| Two or more Races | 214 | 10.3% |
| Some other Race | 44 | 2.1% |
| Total | 2,075 | 100.0% |
Ancestry in Fort Polk North
The most populous ancestries reported in Fort Polk North are Mexican (277 | 13.4%), German (215 | 10.4%), Italian (174 | 8.4%), American (136 | 6.6%), and Puerto Rican (135 | 6.5%), together accounting for 45.2% of all Fort Polk North residents.
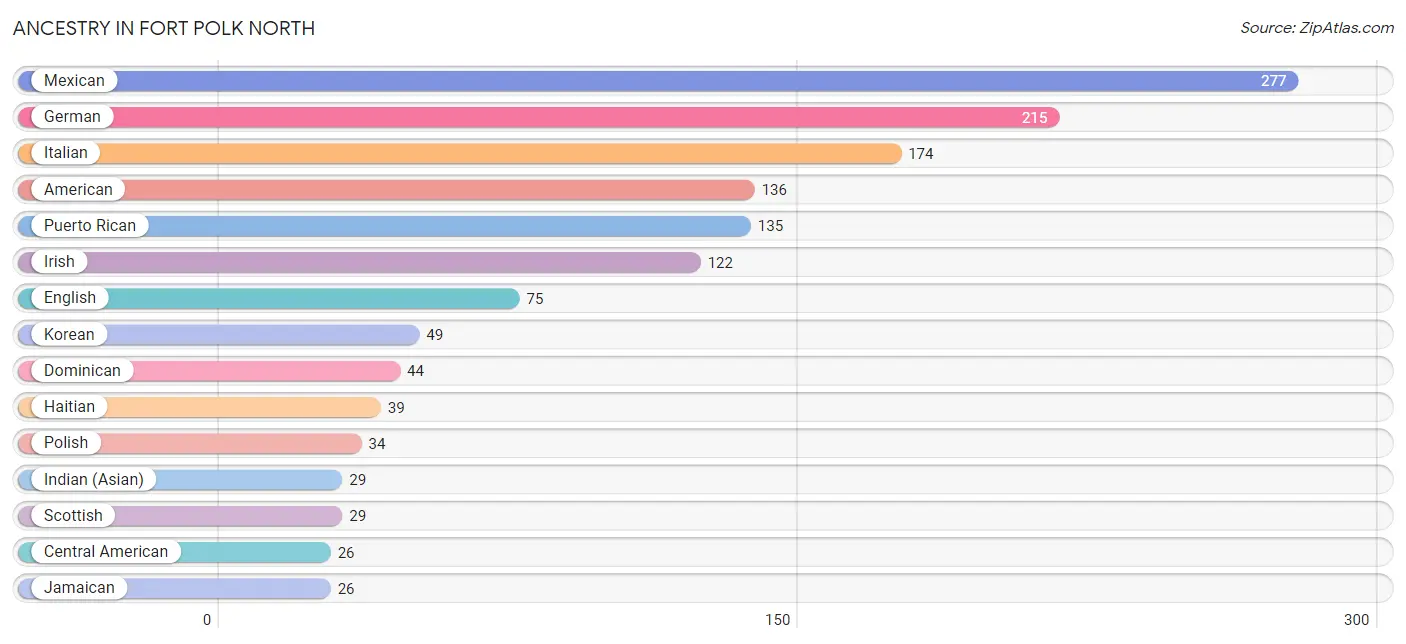
| Ancestry | # Population | % Population |
| American | 136 | 6.6% |
| Austrian | 10 | 0.5% |
| Burmese | 8 | 0.4% |
| Canadian | 16 | 0.8% |
| Central American | 26 | 1.3% |
| Cherokee | 12 | 0.6% |
| Choctaw | 12 | 0.6% |
| Colombian | 11 | 0.5% |
| Czech | 12 | 0.6% |
| Dominican | 44 | 2.1% |
| Dutch | 10 | 0.5% |
| English | 75 | 3.6% |
| European | 15 | 0.7% |
| French | 21 | 1.0% |
| German | 215 | 10.4% |
| Greek | 8 | 0.4% |
| Haitian | 39 | 1.9% |
| Indian (Asian) | 29 | 1.4% |
| Irish | 122 | 5.9% |
| Italian | 174 | 8.4% |
| Jamaican | 26 | 1.3% |
| Korean | 49 | 2.4% |
| Mexican | 277 | 13.4% |
| Native Hawaiian | 9 | 0.4% |
| Nigerian | 9 | 0.4% |
| Norwegian | 10 | 0.5% |
| Panamanian | 26 | 1.3% |
| Polish | 34 | 1.6% |
| Puerto Rican | 135 | 6.5% |
| Scandinavian | 11 | 0.5% |
| Scotch-Irish | 6 | 0.3% |
| Scottish | 29 | 1.4% |
| South American | 11 | 0.5% |
| Spaniard | 13 | 0.6% |
| Subsaharan African | 9 | 0.4% |
| Thai | 8 | 0.4% | View All 36 Rows |
Immigrants in Fort Polk North
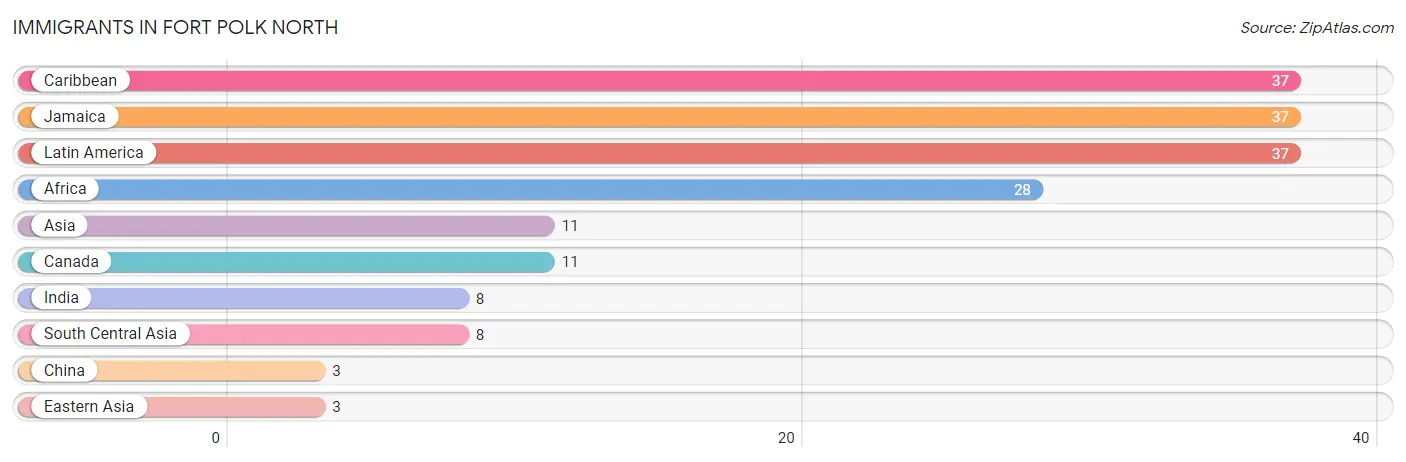
The most numerous immigrant groups reported in Fort Polk North came from Caribbean (37 | 1.8%), Jamaica (37 | 1.8%), Latin America (37 | 1.8%), Africa (28 | 1.3%), and Asia (11 | 0.5%), together accounting for 7.2% of all Fort Polk North residents.
| Immigration Origin | # Population | % Population |
| Africa | 28 | 1.3% |
| Asia | 11 | 0.5% |
| Canada | 11 | 0.5% |
| Caribbean | 37 | 1.8% |
| China | 3 | 0.1% |
| Eastern Asia | 3 | 0.1% |
| India | 8 | 0.4% |
| Jamaica | 37 | 1.8% |
| Latin America | 37 | 1.8% |
| South Central Asia | 8 | 0.4% | View All 10 Rows |
Sex and Age in Fort Polk North
Sex and Age in Fort Polk North
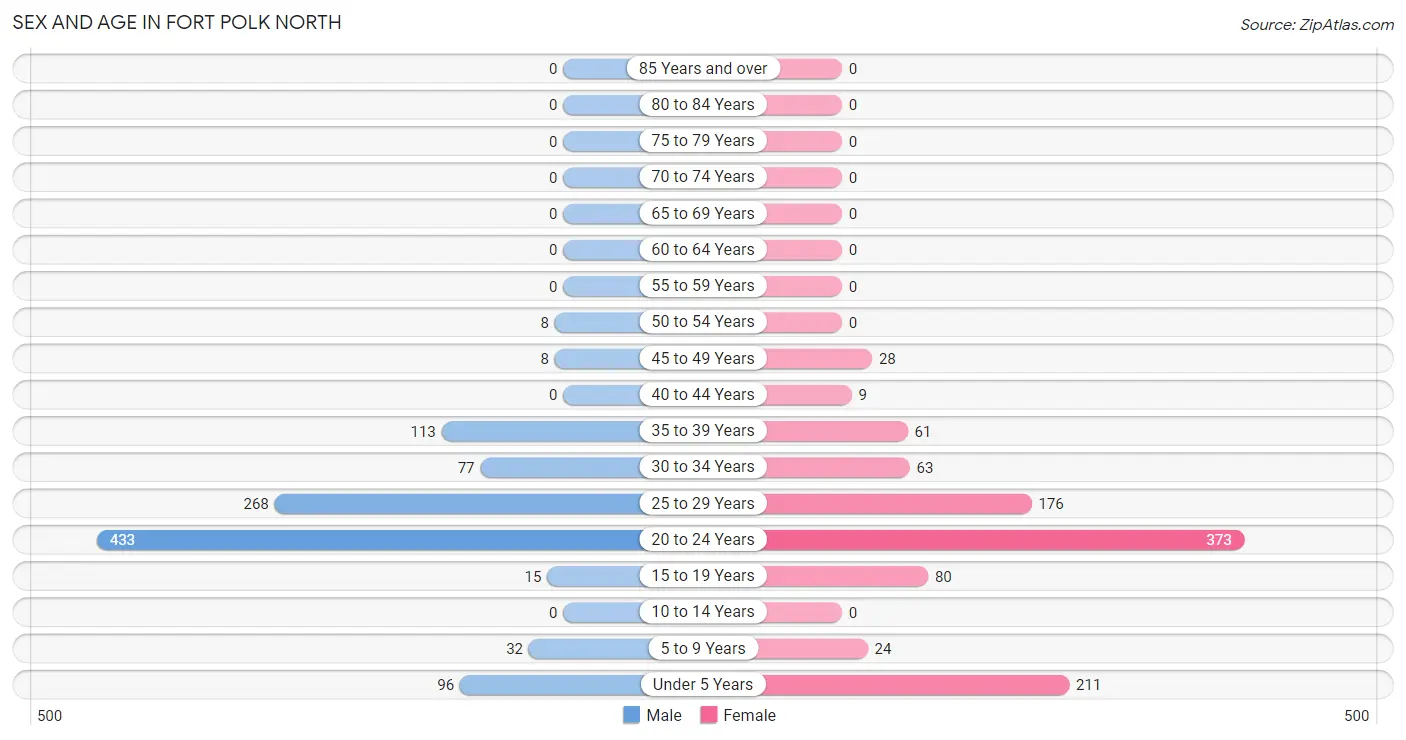
The most populous age groups in Fort Polk North are 20 to 24 Years (433 | 41.2%) for men and 20 to 24 Years (373 | 36.4%) for women.
| Age Bracket | Male | Female |
| Under 5 Years | 96 (9.1%) | 211 (20.6%) |
| 5 to 9 Years | 32 (3.0%) | 24 (2.3%) |
| 10 to 14 Years | 0 (0.0%) | 0 (0.0%) |
| 15 to 19 Years | 15 (1.4%) | 80 (7.8%) |
| 20 to 24 Years | 433 (41.2%) | 373 (36.4%) |
| 25 to 29 Years | 268 (25.5%) | 176 (17.2%) |
| 30 to 34 Years | 77 (7.3%) | 63 (6.1%) |
| 35 to 39 Years | 113 (10.8%) | 61 (5.9%) |
| 40 to 44 Years | 0 (0.0%) | 9 (0.9%) |
| 45 to 49 Years | 8 (0.8%) | 28 (2.7%) |
| 50 to 54 Years | 8 (0.8%) | 0 (0.0%) |
| 55 to 59 Years | 0 (0.0%) | 0 (0.0%) |
| 60 to 64 Years | 0 (0.0%) | 0 (0.0%) |
| 65 to 69 Years | 0 (0.0%) | 0 (0.0%) |
| 70 to 74 Years | 0 (0.0%) | 0 (0.0%) |
| 75 to 79 Years | 0 (0.0%) | 0 (0.0%) |
| 80 to 84 Years | 0 (0.0%) | 0 (0.0%) |
| 85 Years and over | 0 (0.0%) | 0 (0.0%) |
| Total | 1,050 (100.0%) | 1,025 (100.0%) |
Families and Households in Fort Polk North
Median Family Size in Fort Polk North
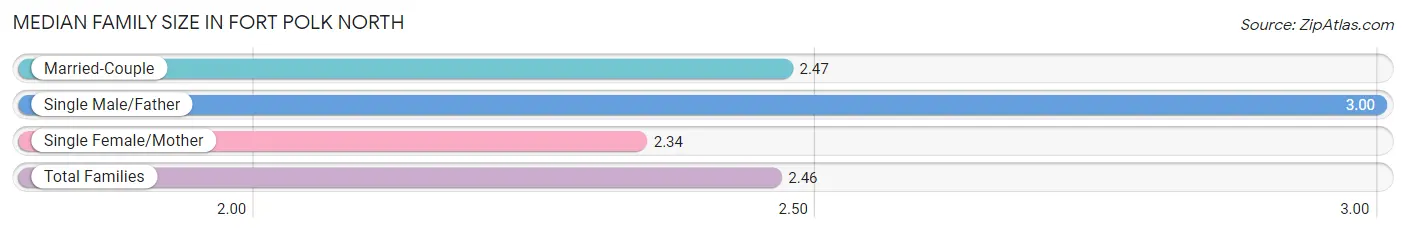
The median family size in Fort Polk North is 2.46 persons per family, with single male/father families (8 | 1.1%) accounting for the largest median family size of 3 persons per family. On the other hand, single female/mother families (82 | 11.7%) represent the smallest median family size with 2.34 persons per family.
| Family Type | # Families | Family Size |
| Married-Couple | 610 (87.1%) | 2.47 |
| Single Male/Father | 8 (1.1%) | 3.00 |
| Single Female/Mother | 82 (11.7%) | 2.34 |
| Total Families | 700 (100.0%) | 2.46 |
Median Household Size in Fort Polk North
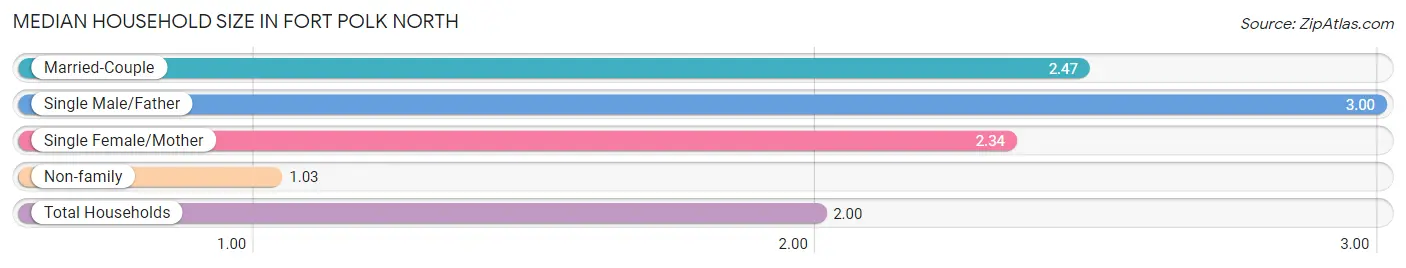
The median household size in Fort Polk North is 2.00 persons per household, with single male/father households (8 | 0.8%) accounting for the largest median household size of 3 persons per household. non-family households (330 | 32.0%) represent the smallest median household size with 1.03 persons per household.
| Household Type | # Households | Household Size |
| Married-Couple | 610 (59.2%) | 2.47 |
| Single Male/Father | 8 (0.8%) | 3.00 |
| Single Female/Mother | 82 (8.0%) | 2.34 |
| Non-family | 330 (32.0%) | 1.03 |
| Total Households | 1,030 (100.0%) | 2.00 |
Household Size by Marriage Status in Fort Polk North
Out of a total of 1,030 households in Fort Polk North, 700 (68.0%) are family households, while 330 (32.0%) are nonfamily households. The most numerous type of family households are 2-person households, comprising 429, and the most common type of nonfamily households are 1-person households, comprising 317.
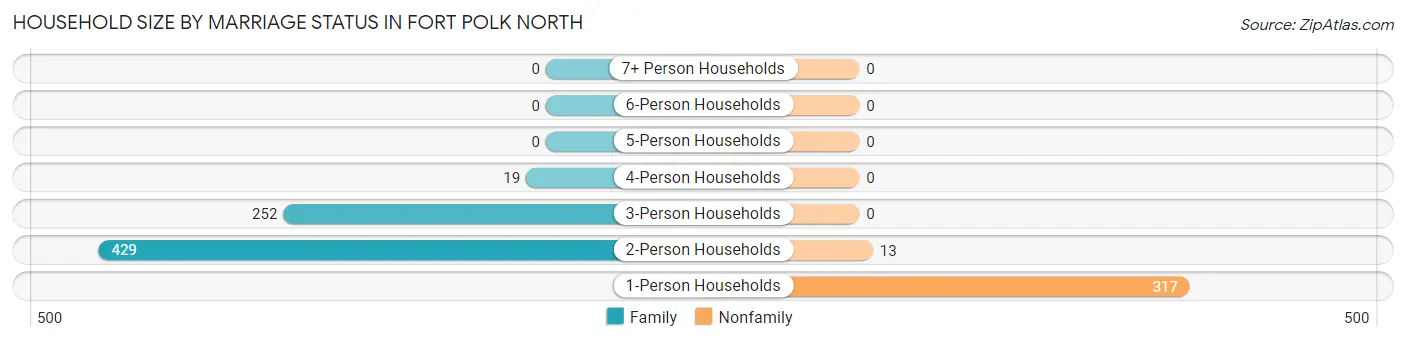
| Household Size | Family Households | Nonfamily Households |
| 1-Person Households | - | 317 (30.8%) |
| 2-Person Households | 429 (41.6%) | 13 (1.3%) |
| 3-Person Households | 252 (24.5%) | 0 (0.0%) |
| 4-Person Households | 19 (1.8%) | 0 (0.0%) |
| 5-Person Households | 0 (0.0%) | 0 (0.0%) |
| 6-Person Households | 0 (0.0%) | 0 (0.0%) |
| 7+ Person Households | 0 (0.0%) | 0 (0.0%) |
| Total | 700 (68.0%) | 330 (32.0%) |
Female Fertility in Fort Polk North
Fertility by Age in Fort Polk North
Average fertility rate in Fort Polk North is 266.0 births per 1,000 women. Women in the age bracket of 20 to 34 years have the highest fertility rate with 324.0 births per 1,000 women. Women in the age bracket of 20 to 34 years acount for 94.3% of all women with births.
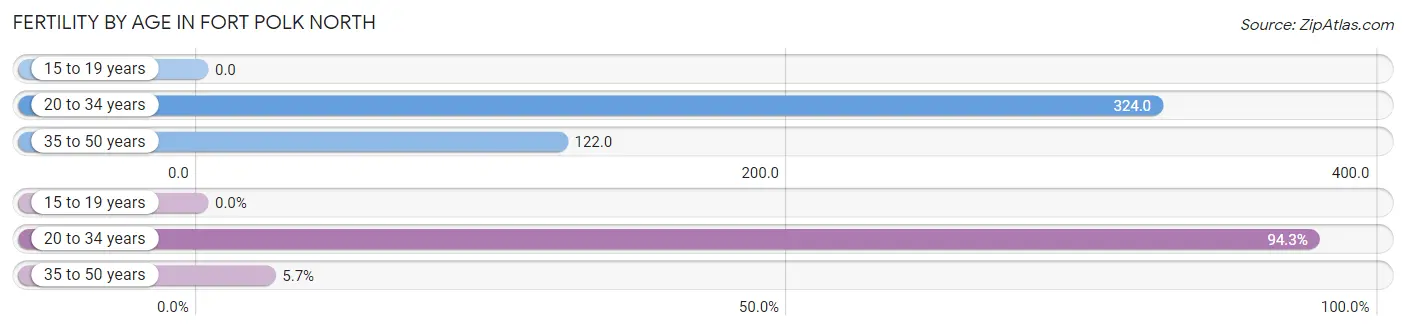
| Age Bracket | Women with Births | Births / 1,000 Women |
| 15 to 19 years | 0 (0.0%) | 0.0 |
| 20 to 34 years | 198 (94.3%) | 324.0 |
| 35 to 50 years | 12 (5.7%) | 122.0 |
| Total | 210 (100.0%) | 266.0 |
Fertility by Age by Marriage Status in Fort Polk North
71.0% of women with births (210) in Fort Polk North are married. The highest percentage of unmarried women with births falls into 20 to 34 years age bracket with 30.8% of them unmarried at the time of birth, while the lowest percentage of unmarried women with births belong to 35 to 50 years age bracket with 0.0% of them unmarried.
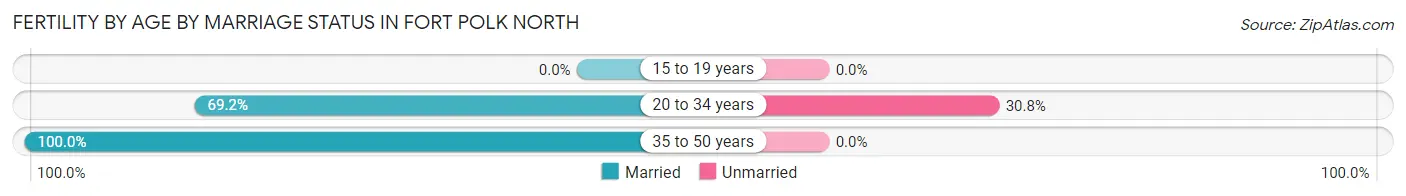
| Age Bracket | Married | Unmarried |
| 15 to 19 years | 0 (0.0%) | 0 (0.0%) |
| 20 to 34 years | 137 (69.2%) | 61 (30.8%) |
| 35 to 50 years | 12 (100.0%) | 0 (0.0%) |
| Total | 149 (71.0%) | 61 (29.0%) |
Fertility by Education in Fort Polk North
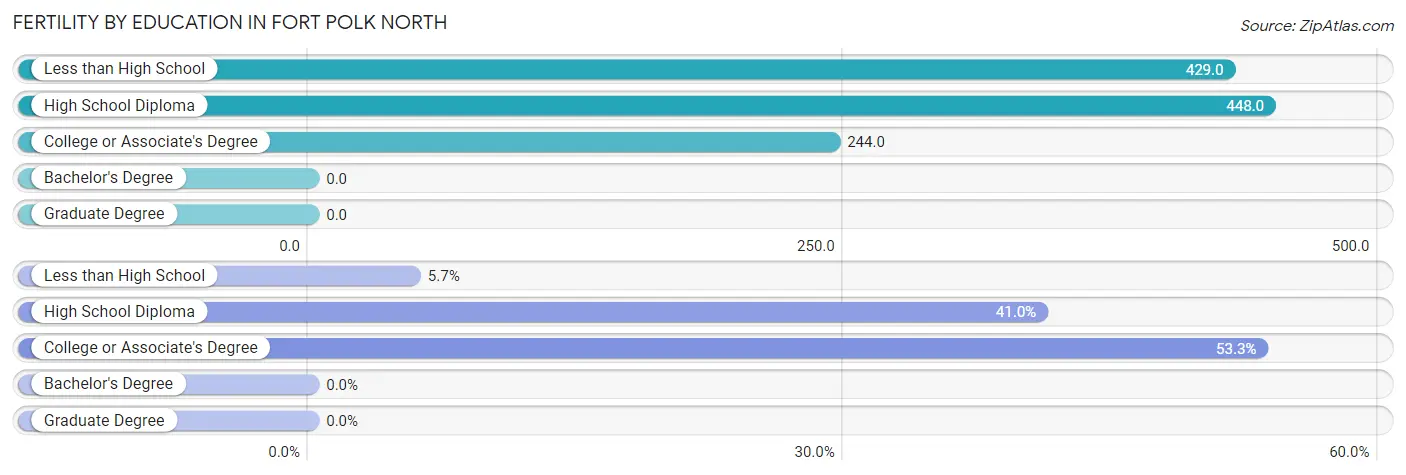
| Educational Attainment | Women with Births | Births / 1,000 Women |
| Less than High School | 12 (5.7%) | 429.0 |
| High School Diploma | 86 (40.9%) | 448.0 |
| College or Associate's Degree | 112 (53.3%) | 244.0 |
| Bachelor's Degree | 0 (0.0%) | 0.0 |
| Graduate Degree | 0 (0.0%) | 0.0 |
| Total | 210 (100.0%) | 266.0 |
Fertility by Education by Marriage Status in Fort Polk North
29.0% of women with births in Fort Polk North are unmarried. Women with the educational attainment of less than high school are most likely to be married with 100.0% of them married at childbirth, while women with the educational attainment of college or associate's degree are least likely to be married with 33.0% of them unmarried at childbirth.
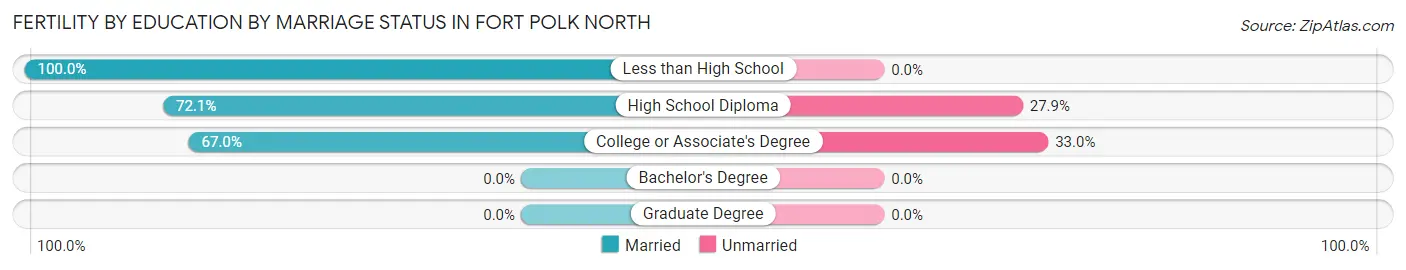
| Educational Attainment | Married | Unmarried |
| Less than High School | 12 (100.0%) | 0 (0.0%) |
| High School Diploma | 62 (72.1%) | 24 (27.9%) |
| College or Associate's Degree | 75 (67.0%) | 37 (33.0%) |
| Bachelor's Degree | 0 (0.0%) | 0 (0.0%) |
| Graduate Degree | 0 (0.0%) | 0 (0.0%) |
| Total | 149 (71.0%) | 61 (29.0%) |
Employment Characteristics in Fort Polk North
Employment by Class of Employer in Fort Polk North
Among the 1,232 employed individuals in Fort Polk North, federal government employees (931 | 75.6%), private company employees (223 | 18.1%), and not-for-profit organizations (73 | 5.9%) make up the most common classes of employment.
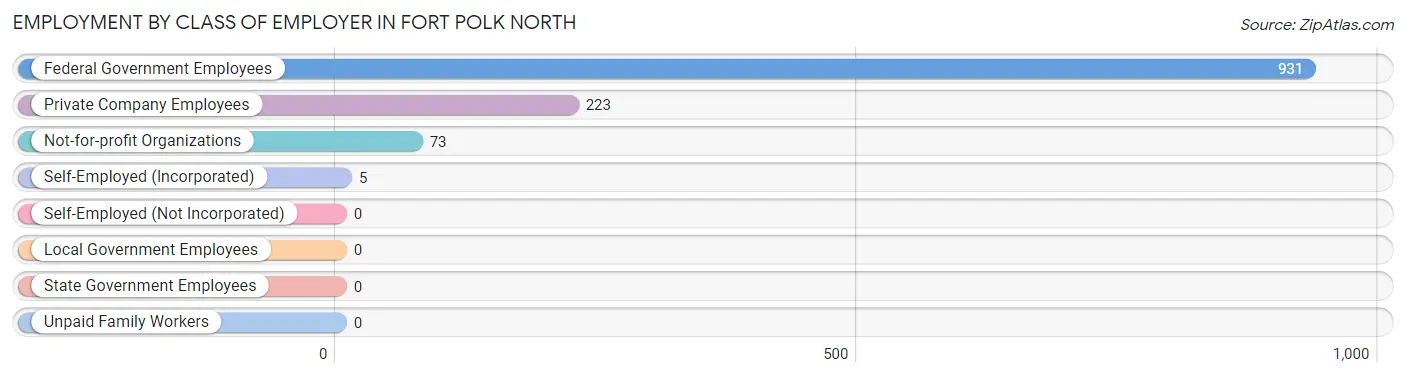
| Employer Class | # Employees | % Employees |
| Private Company Employees | 223 | 18.1% |
| Self-Employed (Incorporated) | 5 | 0.4% |
| Self-Employed (Not Incorporated) | 0 | 0.0% |
| Not-for-profit Organizations | 73 | 5.9% |
| Local Government Employees | 0 | 0.0% |
| State Government Employees | 0 | 0.0% |
| Federal Government Employees | 931 | 75.6% |
| Unpaid Family Workers | 0 | 0.0% |
| Total | 1,232 | 100.0% |
Employment Status by Age in Fort Polk North
According to the labor force statistics for Fort Polk North, out of the total population over 16 years of age (1,712), 78.6% or 1,346 individuals are in the labor force, with 12.0% or 162 of them unemployed. The age group with the highest labor force participation rate is 30 to 34 years, with 94.3% or 132 individuals in the labor force. Within the labor force, the 25 to 29 years age range has the highest percentage of unemployed individuals, with 54.6% or 185 of them being unemployed.
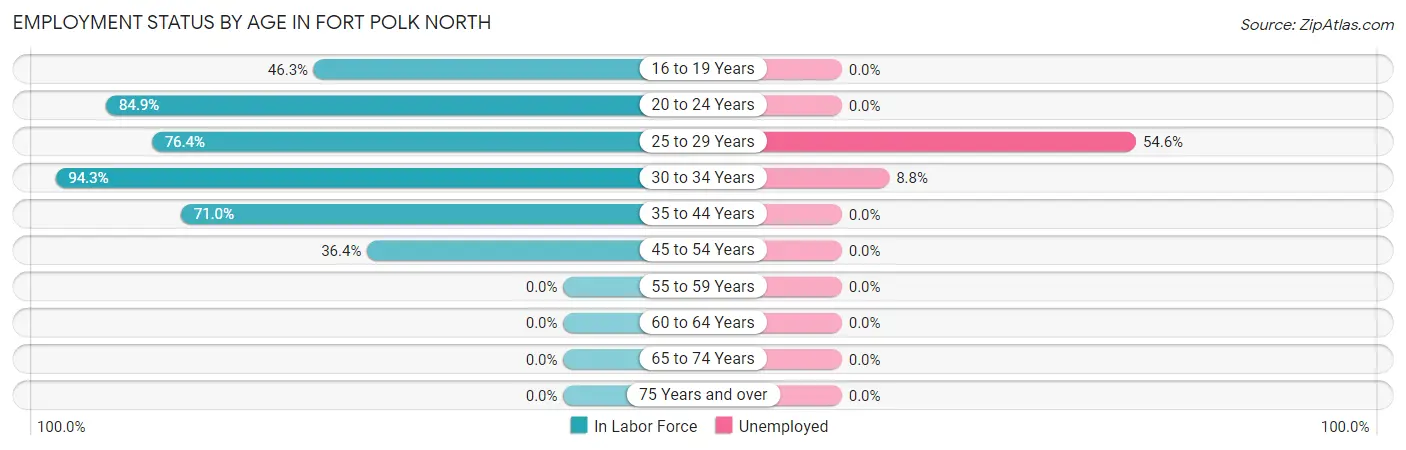
| Age Bracket | In Labor Force | Unemployed |
| 16 to 19 Years | 44 (46.3%) | 0 (0.0%) |
| 20 to 24 Years | 684 (84.9%) | 0 (0.0%) |
| 25 to 29 Years | 339 (76.4%) | 185 (54.6%) |
| 30 to 34 Years | 132 (94.3%) | 12 (8.8%) |
| 35 to 44 Years | 130 (71.0%) | 0 (0.0%) |
| 45 to 54 Years | 16 (36.4%) | 0 (0.0%) |
| 55 to 59 Years | 0 (0.0%) | 0 (0.0%) |
| 60 to 64 Years | 0 (0.0%) | 0 (0.0%) |
| 65 to 74 Years | 0 (0.0%) | 0 (0.0%) |
| 75 Years and over | 0 (0.0%) | 0 (0.0%) |
| Total | 1,346 (78.6%) | 162 (12.0%) |
Employment Status by Educational Attainment in Fort Polk North
According to labor force statistics for Fort Polk North, 76.1% of individuals (617) out of the total population between 25 and 64 years of age (811) are in the labor force, with 28.0% or 173 of them being unemployed. The group with the highest labor force participation rate are those with the educational attainment of college / associate degree, with 85.9% or 443 individuals in the labor force. Within the labor force, individuals with college / associate degree education have the highest percentage of unemployment, with 35.6% or 158 of them being unemployed.
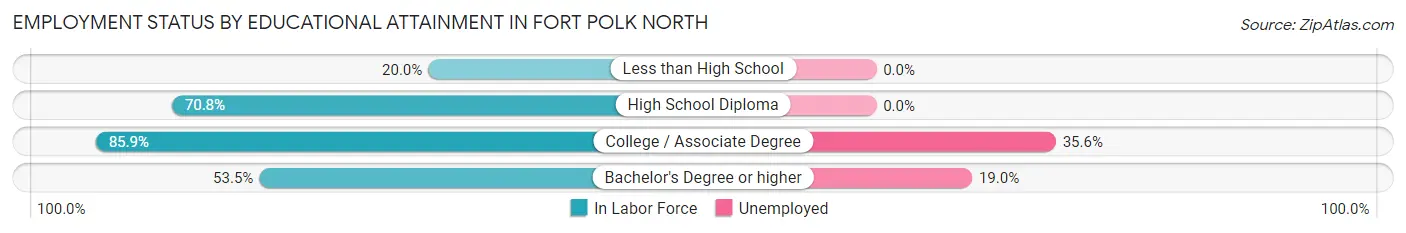
| Educational Attainment | In Labor Force | Unemployed |
| Less than High School | 7 (20.0%) | 0 (0.0%) |
| High School Diploma | 114 (70.8%) | 0 (0.0%) |
| College / Associate Degree | 443 (85.9%) | 184 (35.6%) |
| Bachelor's Degree or higher | 53 (53.5%) | 19 (19.0%) |
| Total | 617 (76.1%) | 227 (28.0%) |
Employment Occupations by Sex in Fort Polk North
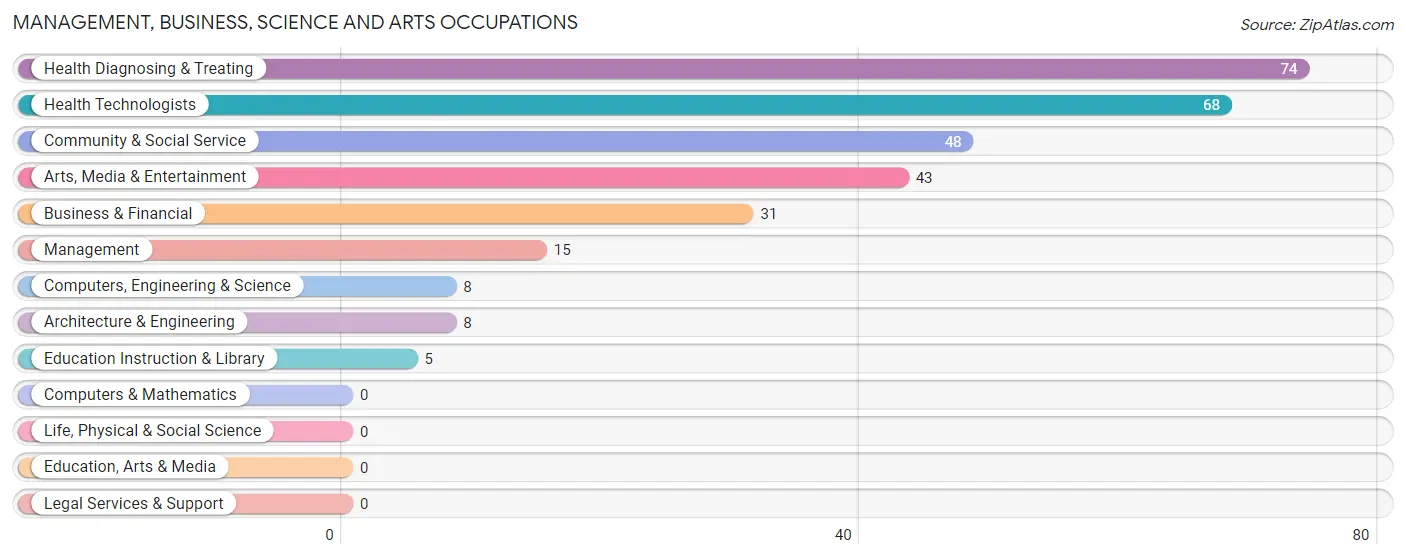
Management, Business, Science and Arts Occupations
The most common Management, Business, Science and Arts occupations in Fort Polk North are Health Diagnosing & Treating (74 | 16.6%), Health Technologists (68 | 15.2%), Community & Social Service (48 | 10.8%), Arts, Media & Entertainment (43 | 9.6%), and Business & Financial (31 | 7.0%).
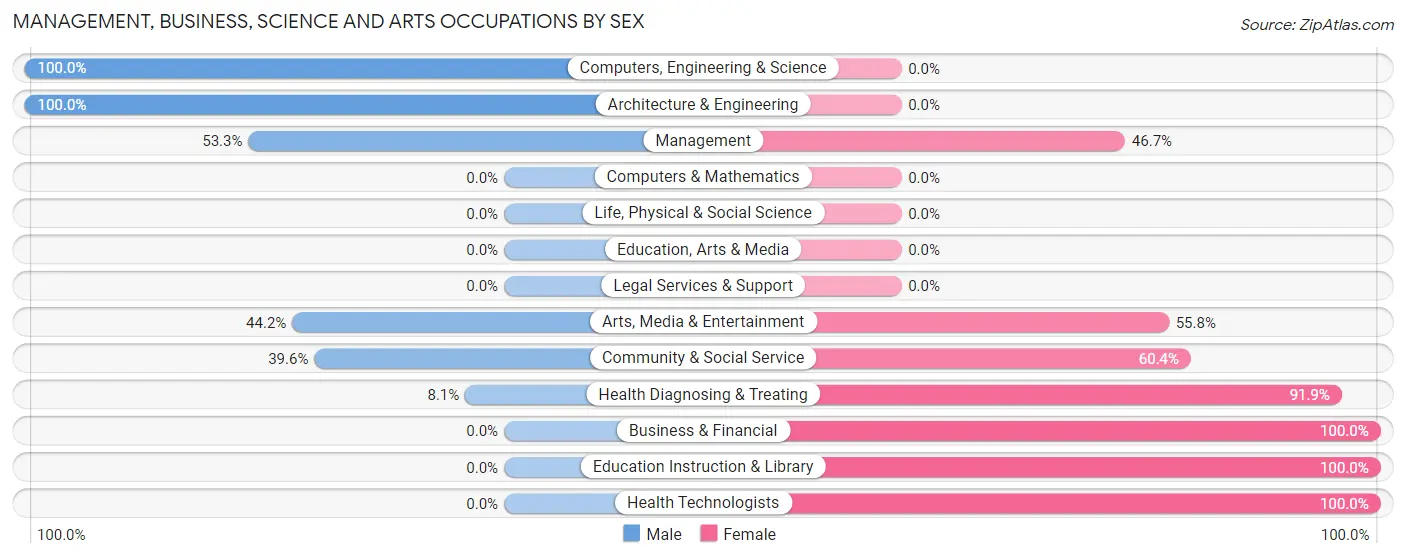
Management, Business, Science and Arts Occupations by Sex
Within the Management, Business, Science and Arts occupations in Fort Polk North, the most male-oriented occupations are Computers, Engineering & Science (100.0%), Architecture & Engineering (100.0%), and Management (53.3%), while the most female-oriented occupations are Business & Financial (100.0%), Education Instruction & Library (100.0%), and Health Technologists (100.0%).
| Occupation | Male | Female |
| Management | 8 (53.3%) | 7 (46.7%) |
| Business & Financial | 0 (0.0%) | 31 (100.0%) |
| Computers, Engineering & Science | 8 (100.0%) | 0 (0.0%) |
| Computers & Mathematics | 0 (0.0%) | 0 (0.0%) |
| Architecture & Engineering | 8 (100.0%) | 0 (0.0%) |
| Life, Physical & Social Science | 0 (0.0%) | 0 (0.0%) |
| Community & Social Service | 19 (39.6%) | 29 (60.4%) |
| Education, Arts & Media | 0 (0.0%) | 0 (0.0%) |
| Legal Services & Support | 0 (0.0%) | 0 (0.0%) |
| Education Instruction & Library | 0 (0.0%) | 5 (100.0%) |
| Arts, Media & Entertainment | 19 (44.2%) | 24 (55.8%) |
| Health Diagnosing & Treating | 6 (8.1%) | 68 (91.9%) |
| Health Technologists | 0 (0.0%) | 68 (100.0%) |
| Total (Category) | 41 (23.3%) | 135 (76.7%) |
| Total (Overall) | 178 (39.9%) | 268 (60.1%) |
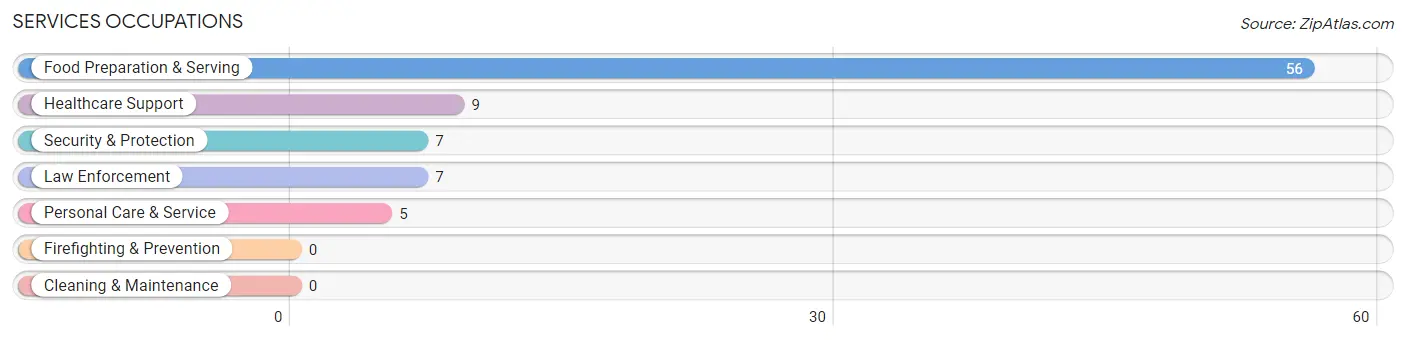
Services Occupations
The most common Services occupations in Fort Polk North are Food Preparation & Serving (56 | 12.6%), Healthcare Support (9 | 2.0%), Security & Protection (7 | 1.6%), Law Enforcement (7 | 1.6%), and Personal Care & Service (5 | 1.1%).
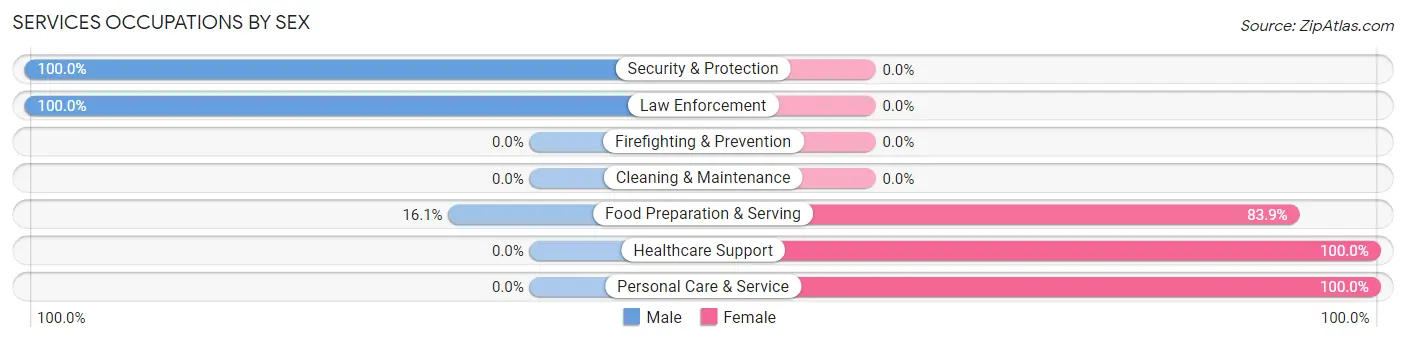
Services Occupations by Sex
Within the Services occupations in Fort Polk North, the most male-oriented occupations are Security & Protection (100.0%), Law Enforcement (100.0%), and Food Preparation & Serving (16.1%), while the most female-oriented occupations are Healthcare Support (100.0%), Personal Care & Service (100.0%), and Food Preparation & Serving (83.9%).
| Occupation | Male | Female |
| Healthcare Support | 0 (0.0%) | 9 (100.0%) |
| Security & Protection | 7 (100.0%) | 0 (0.0%) |
| Firefighting & Prevention | 0 (0.0%) | 0 (0.0%) |
| Law Enforcement | 7 (100.0%) | 0 (0.0%) |
| Food Preparation & Serving | 9 (16.1%) | 47 (83.9%) |
| Cleaning & Maintenance | 0 (0.0%) | 0 (0.0%) |
| Personal Care & Service | 0 (0.0%) | 5 (100.0%) |
| Total (Category) | 16 (20.8%) | 61 (79.2%) |
| Total (Overall) | 178 (39.9%) | 268 (60.1%) |
Sales and Office Occupations
The most common Sales and Office occupations in Fort Polk North are Office & Administration (64 | 14.3%), and Sales & Related (42 | 9.4%).
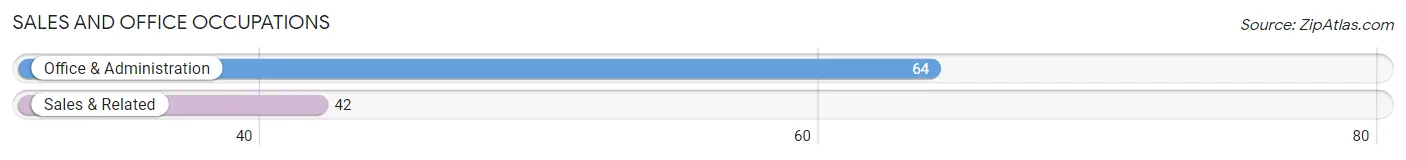
Sales and Office Occupations by Sex
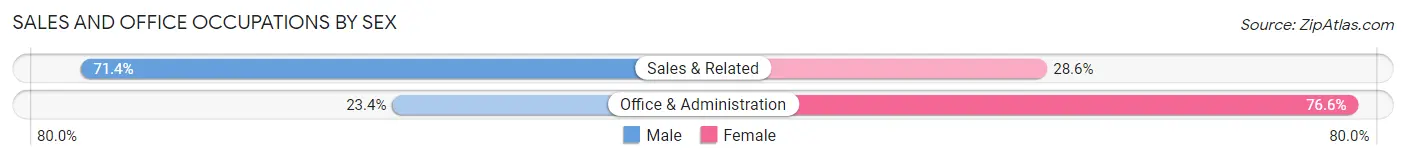
| Occupation | Male | Female |
| Sales & Related | 30 (71.4%) | 12 (28.6%) |
| Office & Administration | 15 (23.4%) | 49 (76.6%) |
| Total (Category) | 45 (42.4%) | 61 (57.6%) |
| Total (Overall) | 178 (39.9%) | 268 (60.1%) |
Natural Resources, Construction and Maintenance Occupations
The most common Natural Resources, Construction and Maintenance occupations in Fort Polk North are Installation, Maintenance & Repair (57 | 12.8%), and Construction & Extraction (19 | 4.3%).
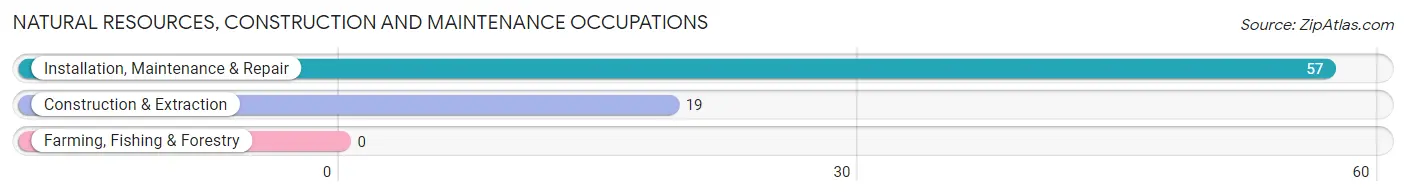
Natural Resources, Construction and Maintenance Occupations by Sex
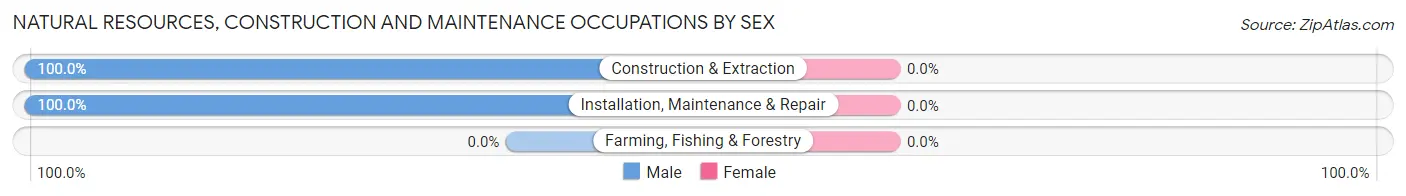
| Occupation | Male | Female |
| Farming, Fishing & Forestry | 0 (0.0%) | 0 (0.0%) |
| Construction & Extraction | 19 (100.0%) | 0 (0.0%) |
| Installation, Maintenance & Repair | 57 (100.0%) | 0 (0.0%) |
| Total (Category) | 76 (100.0%) | 0 (0.0%) |
| Total (Overall) | 178 (39.9%) | 268 (60.1%) |
Production, Transportation and Moving Occupations
The most common Production, Transportation and Moving occupations in Fort Polk North are , and Production (11 | 2.5%).
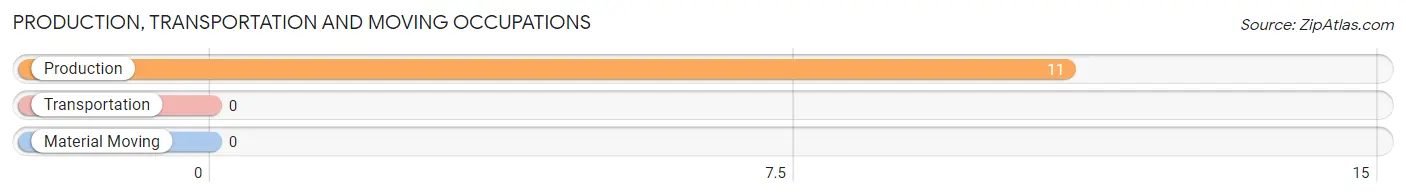
Production, Transportation and Moving Occupations by Sex
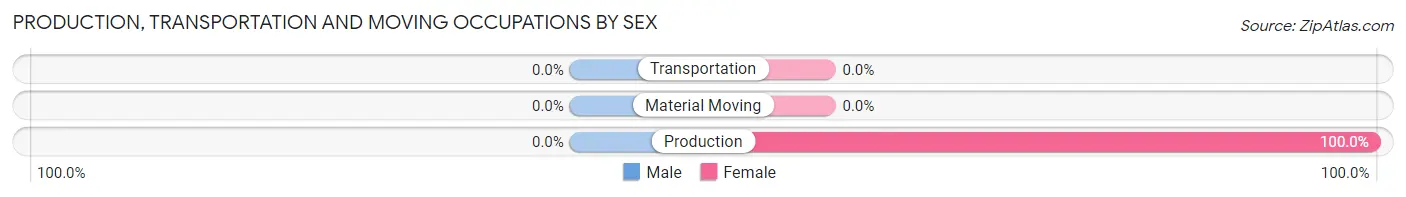
| Occupation | Male | Female |
| Production | 0 (0.0%) | 11 (100.0%) |
| Transportation | 0 (0.0%) | 0 (0.0%) |
| Material Moving | 0 (0.0%) | 0 (0.0%) |
| Total (Category) | 0 (0.0%) | 11 (100.0%) |
| Total (Overall) | 178 (39.9%) | 268 (60.1%) |
Employment Industries by Sex in Fort Polk North
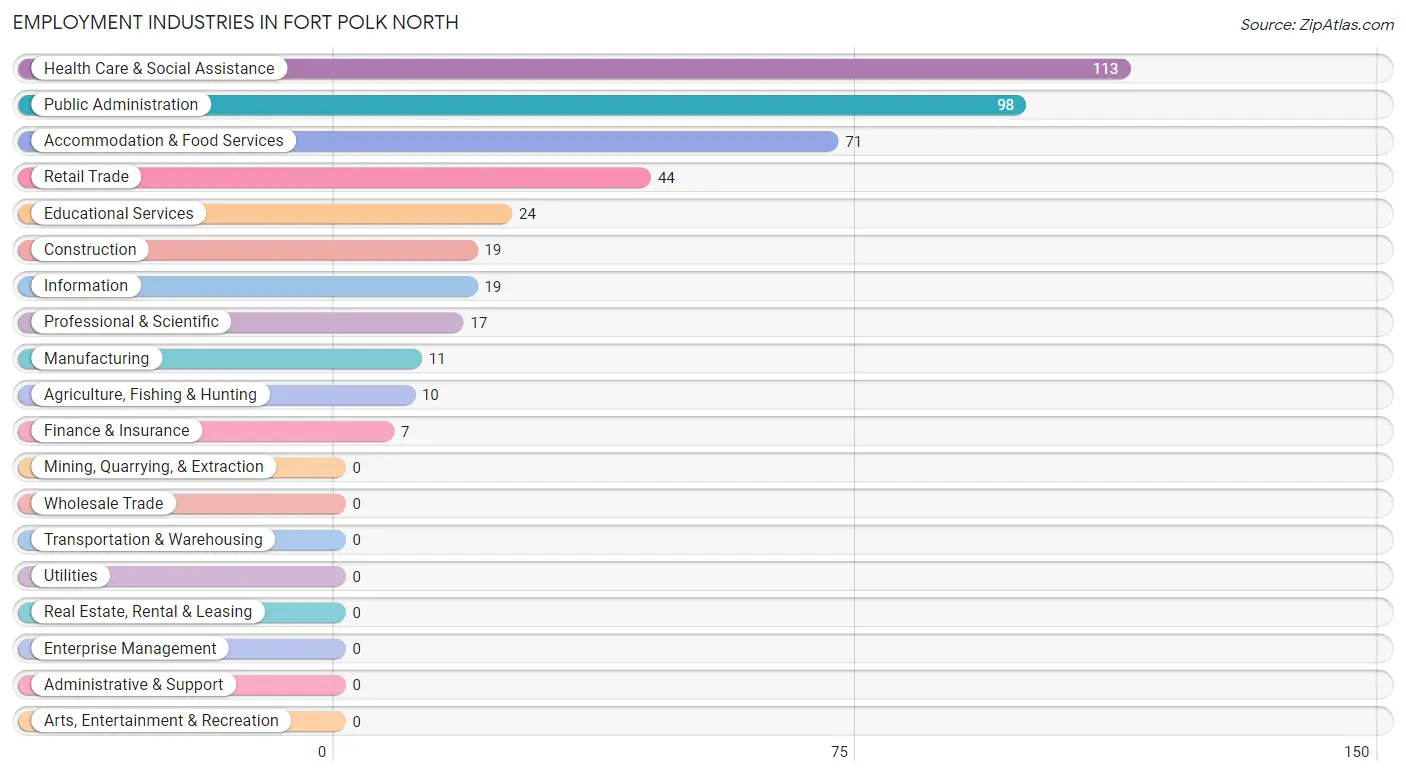
Employment Industries in Fort Polk North
The major employment industries in Fort Polk North include Health Care & Social Assistance (113 | 25.3%), Public Administration (98 | 22.0%), Accommodation & Food Services (71 | 15.9%), Retail Trade (44 | 9.9%), and Educational Services (24 | 5.4%).
Employment Industries by Sex in Fort Polk North
The Fort Polk North industries that see more men than women are Agriculture, Fishing & Hunting (100.0%), Construction (100.0%), and Information (100.0%), whereas the industries that tend to have a higher number of women are Manufacturing (100.0%), Finance & Insurance (100.0%), and Health Care & Social Assistance (100.0%).
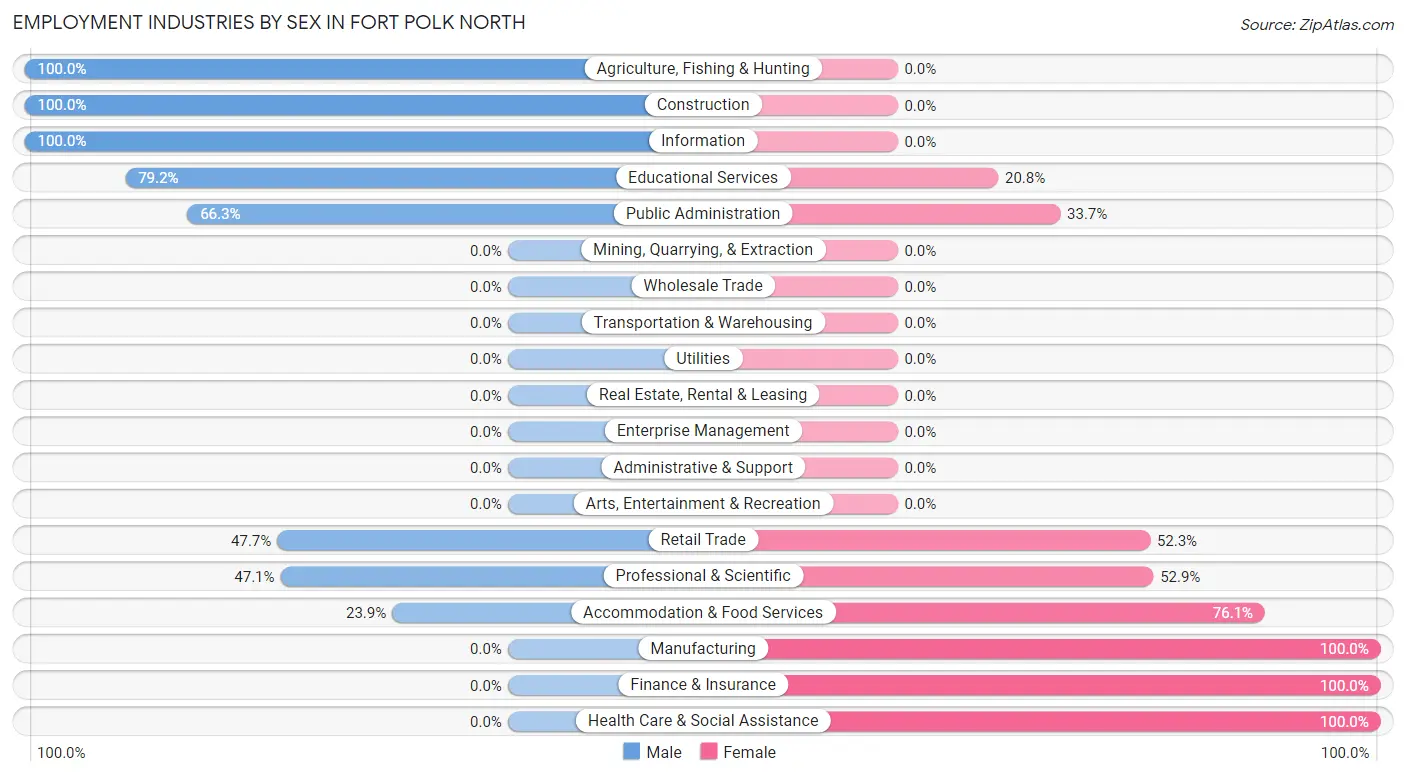
| Industry | Male | Female |
| Agriculture, Fishing & Hunting | 10 (100.0%) | 0 (0.0%) |
| Mining, Quarrying, & Extraction | 0 (0.0%) | 0 (0.0%) |
| Construction | 19 (100.0%) | 0 (0.0%) |
| Manufacturing | 0 (0.0%) | 11 (100.0%) |
| Wholesale Trade | 0 (0.0%) | 0 (0.0%) |
| Retail Trade | 21 (47.7%) | 23 (52.3%) |
| Transportation & Warehousing | 0 (0.0%) | 0 (0.0%) |
| Utilities | 0 (0.0%) | 0 (0.0%) |
| Information | 19 (100.0%) | 0 (0.0%) |
| Finance & Insurance | 0 (0.0%) | 7 (100.0%) |
| Real Estate, Rental & Leasing | 0 (0.0%) | 0 (0.0%) |
| Professional & Scientific | 8 (47.1%) | 9 (52.9%) |
| Enterprise Management | 0 (0.0%) | 0 (0.0%) |
| Administrative & Support | 0 (0.0%) | 0 (0.0%) |
| Educational Services | 19 (79.2%) | 5 (20.8%) |
| Health Care & Social Assistance | 0 (0.0%) | 113 (100.0%) |
| Arts, Entertainment & Recreation | 0 (0.0%) | 0 (0.0%) |
| Accommodation & Food Services | 17 (23.9%) | 54 (76.1%) |
| Public Administration | 65 (66.3%) | 33 (33.7%) |
| Total | 178 (39.9%) | 268 (60.1%) |
Education in Fort Polk North
School Enrollment in Fort Polk North
The most common levels of schooling among the 384 students in Fort Polk North are college / undergraduate (312 | 81.2%), kindergarten (37 | 9.6%), and elementary school (19 | 5.0%).
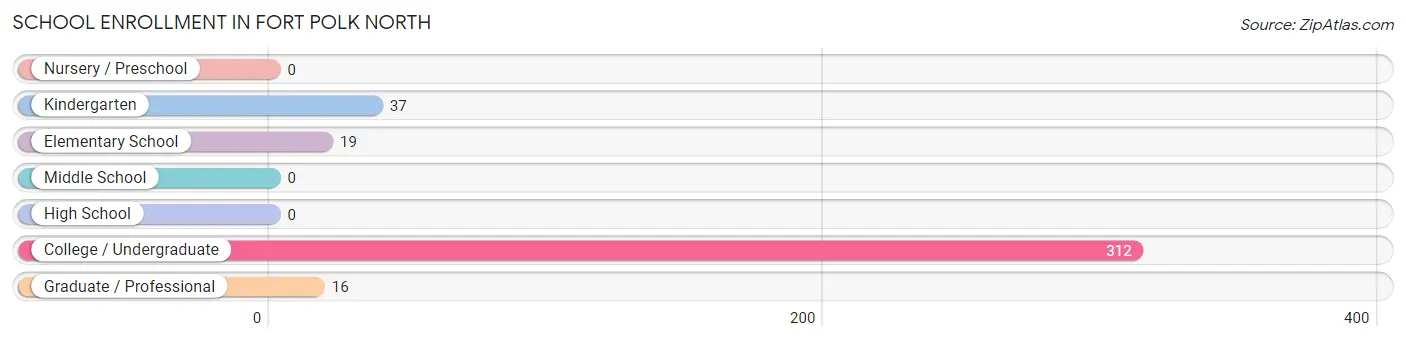
| School Level | # Students | % Students |
| Nursery / Preschool | 0 | 0.0% |
| Kindergarten | 37 | 9.6% |
| Elementary School | 19 | 5.0% |
| Middle School | 0 | 0.0% |
| High School | 0 | 0.0% |
| College / Undergraduate | 312 | 81.2% |
| Graduate / Professional | 16 | 4.2% |
| Total | 384 | 100.0% |
School Enrollment by Age by Funding Source in Fort Polk North
Out of a total of 384 students who are enrolled in schools in Fort Polk North, 74 (19.3%) attend a private institution, while the remaining 310 (80.7%) are enrolled in public schools. The age group of 5 to 9 year old has the highest likelihood of being enrolled in private schools, with 19 (33.9% in the age bracket) enrolled. Conversely, the age group of 18 to 19 year olds has the lowest likelihood of being enrolled in a private school, with 30 (100.0% in the age bracket) attending a public institution.
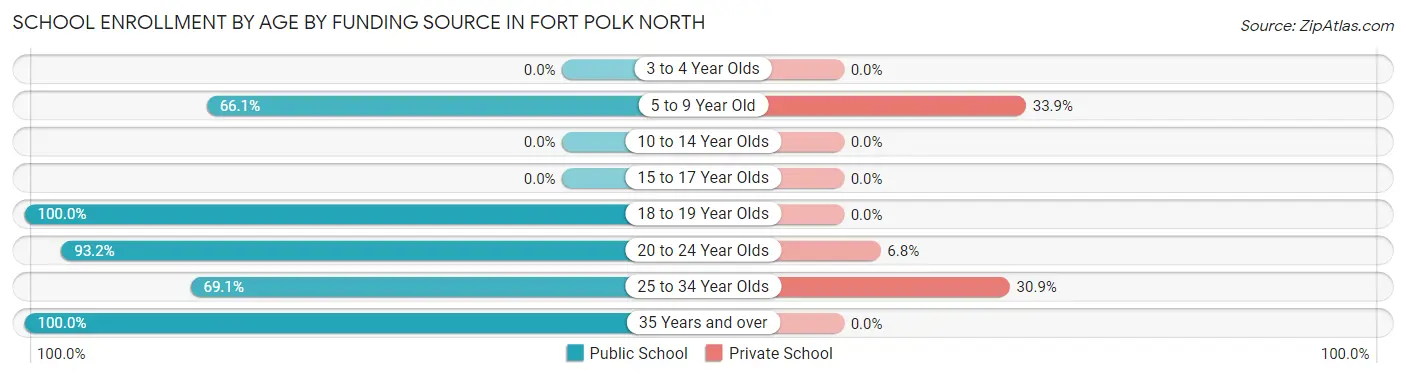
| Age Bracket | Public School | Private School |
| 3 to 4 Year Olds | 0 (0.0%) | 0 (0.0%) |
| 5 to 9 Year Old | 37 (66.1%) | 19 (33.9%) |
| 10 to 14 Year Olds | 0 (0.0%) | 0 (0.0%) |
| 15 to 17 Year Olds | 0 (0.0%) | 0 (0.0%) |
| 18 to 19 Year Olds | 30 (100.0%) | 0 (0.0%) |
| 20 to 24 Year Olds | 109 (93.2%) | 8 (6.8%) |
| 25 to 34 Year Olds | 105 (69.1%) | 47 (30.9%) |
| 35 Years and over | 29 (100.0%) | 0 (0.0%) |
| Total | 310 (80.7%) | 74 (19.3%) |
Educational Attainment by Field of Study in Fort Polk North
Psychology (43 | 42.2%), science & technology (23 | 22.6%), visual & performing arts (16 | 15.7%), business (15 | 14.7%), and arts & humanities (5 | 4.9%) are the most common fields of study among 102 individuals in Fort Polk North who have obtained a bachelor's degree or higher.
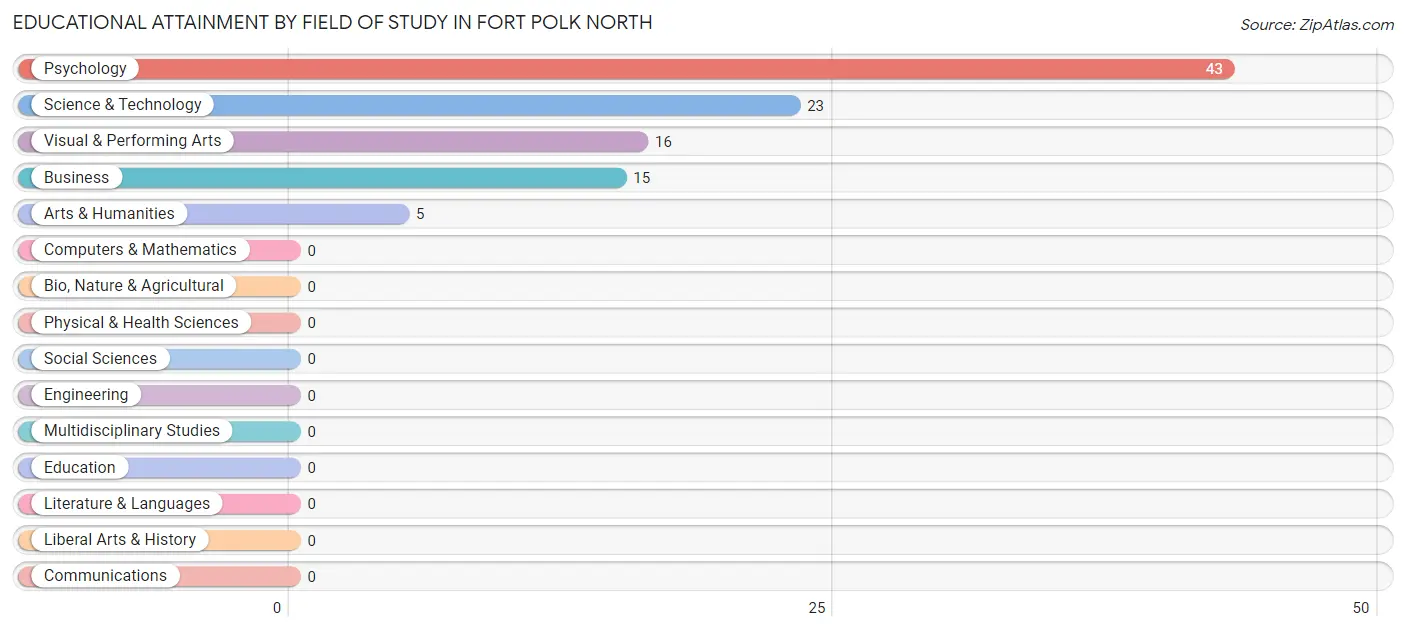
| Field of Study | # Graduates | % Graduates |
| Computers & Mathematics | 0 | 0.0% |
| Bio, Nature & Agricultural | 0 | 0.0% |
| Physical & Health Sciences | 0 | 0.0% |
| Psychology | 43 | 42.2% |
| Social Sciences | 0 | 0.0% |
| Engineering | 0 | 0.0% |
| Multidisciplinary Studies | 0 | 0.0% |
| Science & Technology | 23 | 22.6% |
| Business | 15 | 14.7% |
| Education | 0 | 0.0% |
| Literature & Languages | 0 | 0.0% |
| Liberal Arts & History | 0 | 0.0% |
| Visual & Performing Arts | 16 | 15.7% |
| Communications | 0 | 0.0% |
| Arts & Humanities | 5 | 4.9% |
| Total | 102 | 100.0% |
Transportation & Commute in Fort Polk North
Vehicle Availability by Sex in Fort Polk North
The most prevalent vehicle ownership categories in Fort Polk North are males with 1 vehicle (472, accounting for 53.9%) and females with 1 vehicle (154, making up 132.6%).
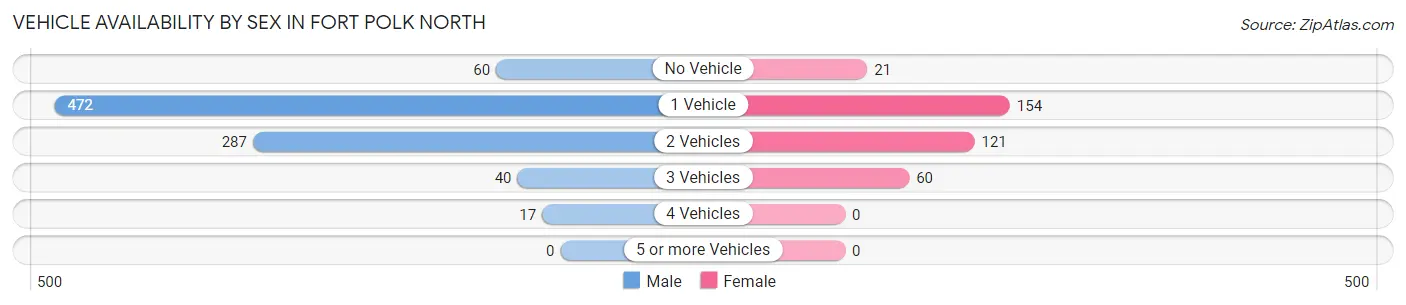
| Vehicles Available | Male | Female |
| No Vehicle | 60 (6.9%) | 21 (5.9%) |
| 1 Vehicle | 472 (53.9%) | 154 (43.3%) |
| 2 Vehicles | 287 (32.8%) | 121 (34.0%) |
| 3 Vehicles | 40 (4.6%) | 60 (16.9%) |
| 4 Vehicles | 17 (1.9%) | 0 (0.0%) |
| 5 or more Vehicles | 0 (0.0%) | 0 (0.0%) |
| Total | 876 (100.0%) | 356 (100.0%) |
Commute Time in Fort Polk North
The most frequently occuring commute durations in Fort Polk North are 10 to 14 minutes (504 commuters, 41.4%), 15 to 19 minutes (454 commuters, 37.3%), and 5 to 9 minutes (80 commuters, 6.6%).
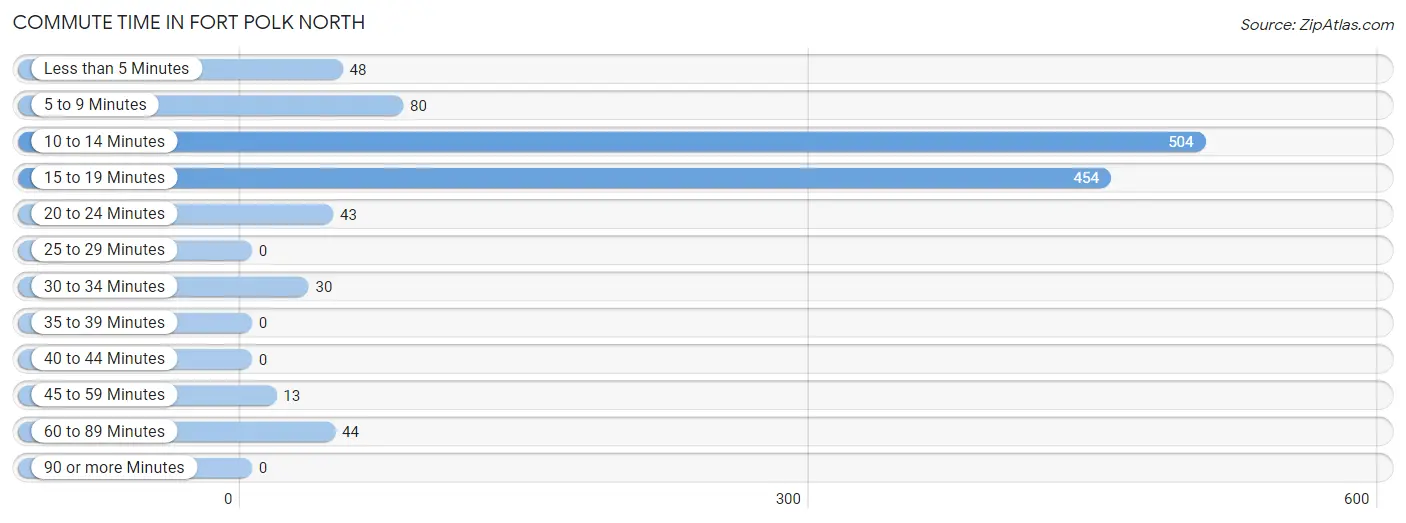
| Commute Time | # Commuters | % Commuters |
| Less than 5 Minutes | 48 | 4.0% |
| 5 to 9 Minutes | 80 | 6.6% |
| 10 to 14 Minutes | 504 | 41.4% |
| 15 to 19 Minutes | 454 | 37.3% |
| 20 to 24 Minutes | 43 | 3.5% |
| 25 to 29 Minutes | 0 | 0.0% |
| 30 to 34 Minutes | 30 | 2.5% |
| 35 to 39 Minutes | 0 | 0.0% |
| 40 to 44 Minutes | 0 | 0.0% |
| 45 to 59 Minutes | 13 | 1.1% |
| 60 to 89 Minutes | 44 | 3.6% |
| 90 or more Minutes | 0 | 0.0% |
Commute Time by Sex in Fort Polk North
The most common commute times in Fort Polk North are 10 to 14 minutes (445 commuters, 50.8%) for males and 15 to 19 minutes (158 commuters, 46.5%) for females.
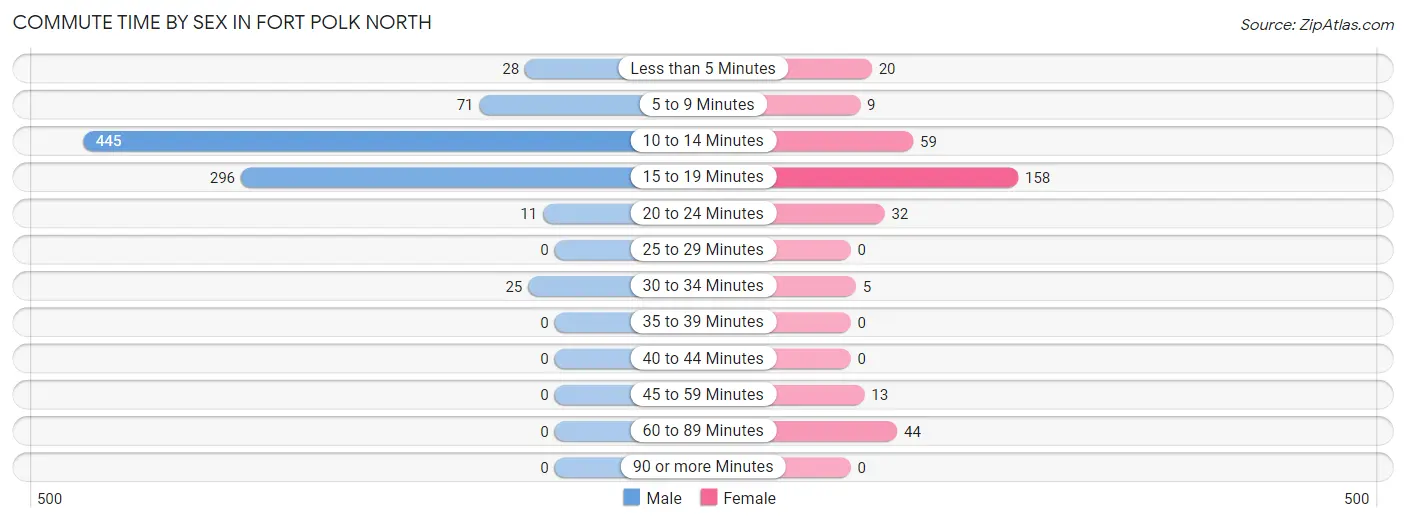
| Commute Time | Male | Female |
| Less than 5 Minutes | 28 (3.2%) | 20 (5.9%) |
| 5 to 9 Minutes | 71 (8.1%) | 9 (2.6%) |
| 10 to 14 Minutes | 445 (50.8%) | 59 (17.3%) |
| 15 to 19 Minutes | 296 (33.8%) | 158 (46.5%) |
| 20 to 24 Minutes | 11 (1.3%) | 32 (9.4%) |
| 25 to 29 Minutes | 0 (0.0%) | 0 (0.0%) |
| 30 to 34 Minutes | 25 (2.9%) | 5 (1.5%) |
| 35 to 39 Minutes | 0 (0.0%) | 0 (0.0%) |
| 40 to 44 Minutes | 0 (0.0%) | 0 (0.0%) |
| 45 to 59 Minutes | 0 (0.0%) | 13 (3.8%) |
| 60 to 89 Minutes | 0 (0.0%) | 44 (12.9%) |
| 90 or more Minutes | 0 (0.0%) | 0 (0.0%) |
Time of Departure to Work by Sex in Fort Polk North
The most frequent times of departure to work in Fort Polk North are 5:30 AM to 5:59 AM (367, 41.9%) for males and 6:00 AM to 6:29 AM (62, 18.2%) for females.
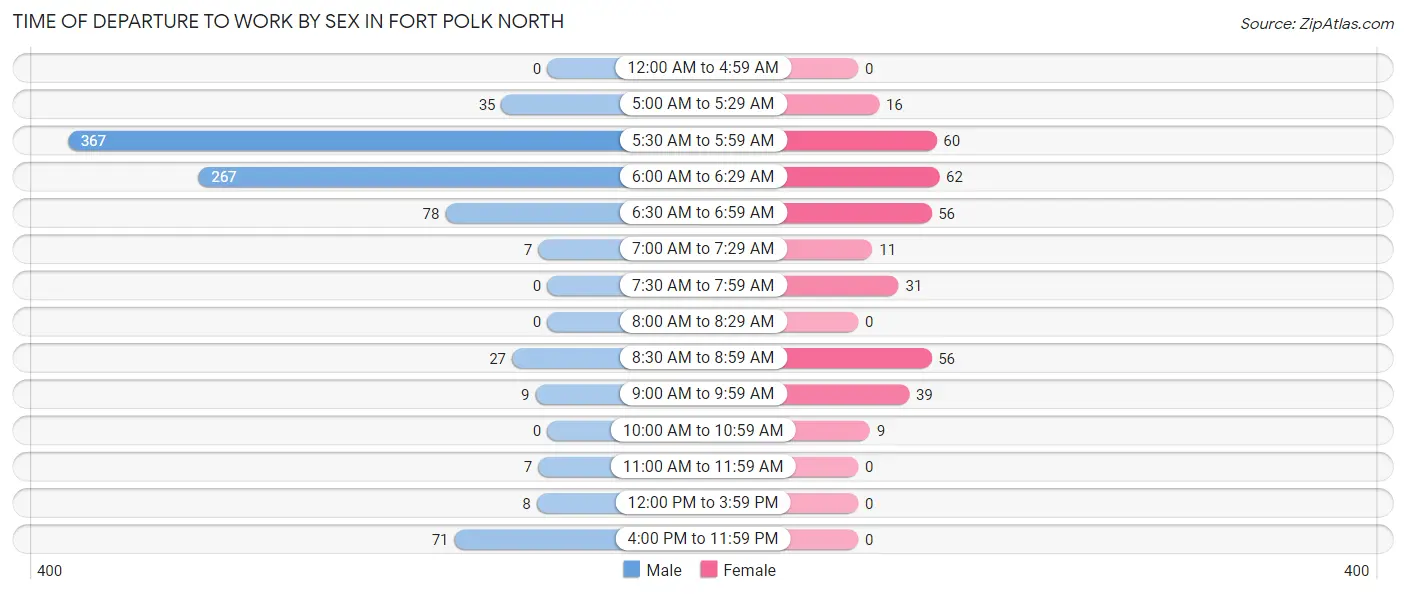
| Time of Departure | Male | Female |
| 12:00 AM to 4:59 AM | 0 (0.0%) | 0 (0.0%) |
| 5:00 AM to 5:29 AM | 35 (4.0%) | 16 (4.7%) |
| 5:30 AM to 5:59 AM | 367 (41.9%) | 60 (17.6%) |
| 6:00 AM to 6:29 AM | 267 (30.5%) | 62 (18.2%) |
| 6:30 AM to 6:59 AM | 78 (8.9%) | 56 (16.5%) |
| 7:00 AM to 7:29 AM | 7 (0.8%) | 11 (3.2%) |
| 7:30 AM to 7:59 AM | 0 (0.0%) | 31 (9.1%) |
| 8:00 AM to 8:29 AM | 0 (0.0%) | 0 (0.0%) |
| 8:30 AM to 8:59 AM | 27 (3.1%) | 56 (16.5%) |
| 9:00 AM to 9:59 AM | 9 (1.0%) | 39 (11.5%) |
| 10:00 AM to 10:59 AM | 0 (0.0%) | 9 (2.6%) |
| 11:00 AM to 11:59 AM | 7 (0.8%) | 0 (0.0%) |
| 12:00 PM to 3:59 PM | 8 (0.9%) | 0 (0.0%) |
| 4:00 PM to 11:59 PM | 71 (8.1%) | 0 (0.0%) |
| Total | 876 (100.0%) | 340 (100.0%) |
Housing Occupancy in Fort Polk North
Occupancy by Ownership in Fort Polk North
Of the total 1,030 dwellings in Fort Polk North, owner-occupied units account for 0 (0.0%), while renter-occupied units make up 1,030 (100.0%).
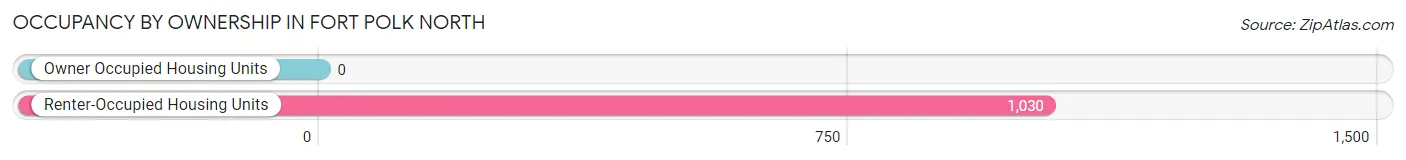
| Occupancy | # Housing Units | % Housing Units |
| Owner Occupied Housing Units | 0 | 0.0% |
| Renter-Occupied Housing Units | 1,030 | 100.0% |
| Total Occupied Housing Units | 1,030 | 100.0% |
Occupancy by Household Size in Fort Polk North
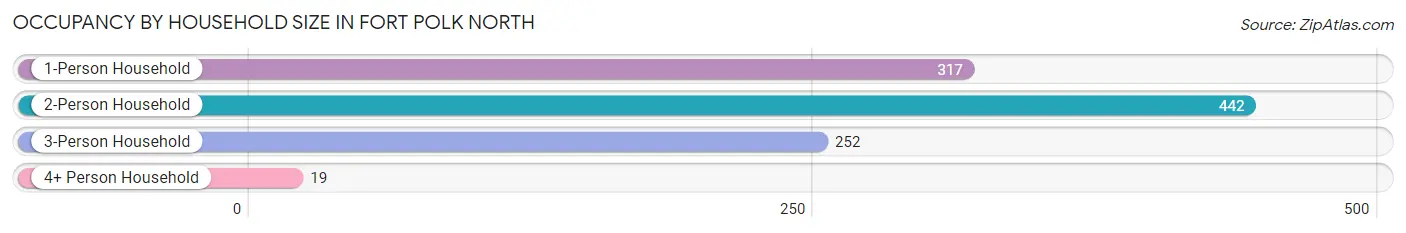
| Household Size | # Housing Units | % Housing Units |
| 1-Person Household | 317 | 30.8% |
| 2-Person Household | 442 | 42.9% |
| 3-Person Household | 252 | 24.5% |
| 4+ Person Household | 19 | 1.8% |
| Total Housing Units | 1,030 | 100.0% |
Occupancy by Ownership by Household Size in Fort Polk North
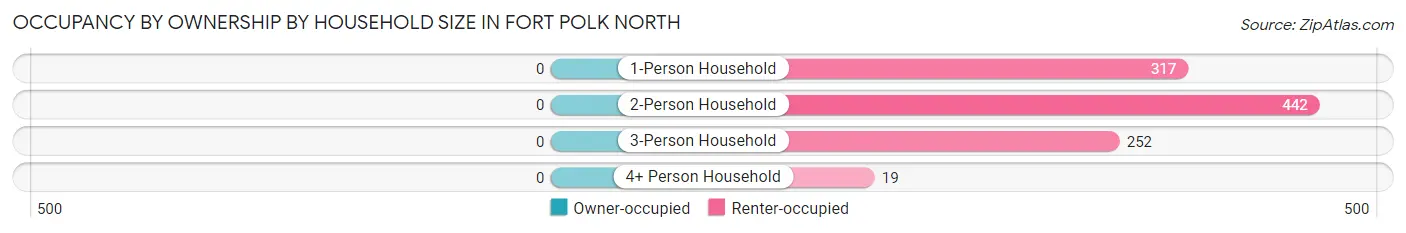
| Household Size | Owner-occupied | Renter-occupied |
| 1-Person Household | 0 (0.0%) | 317 (100.0%) |
| 2-Person Household | 0 (0.0%) | 442 (100.0%) |
| 3-Person Household | 0 (0.0%) | 252 (100.0%) |
| 4+ Person Household | 0 (0.0%) | 19 (100.0%) |
| Total Housing Units | 0 (0.0%) | 1,030 (100.0%) |
Occupancy by Educational Attainment in Fort Polk North
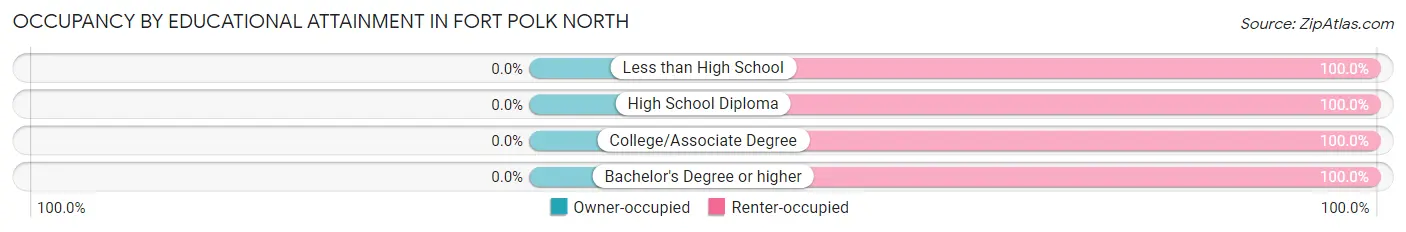
| Household Size | Owner-occupied | Renter-occupied |
| Less than High School | 0 (0.0%) | 23 (100.0%) |
| High School Diploma | 0 (0.0%) | 340 (100.0%) |
| College/Associate Degree | 0 (0.0%) | 550 (100.0%) |
| Bachelor's Degree or higher | 0 (0.0%) | 117 (100.0%) |
Occupancy by Age of Householder in Fort Polk North
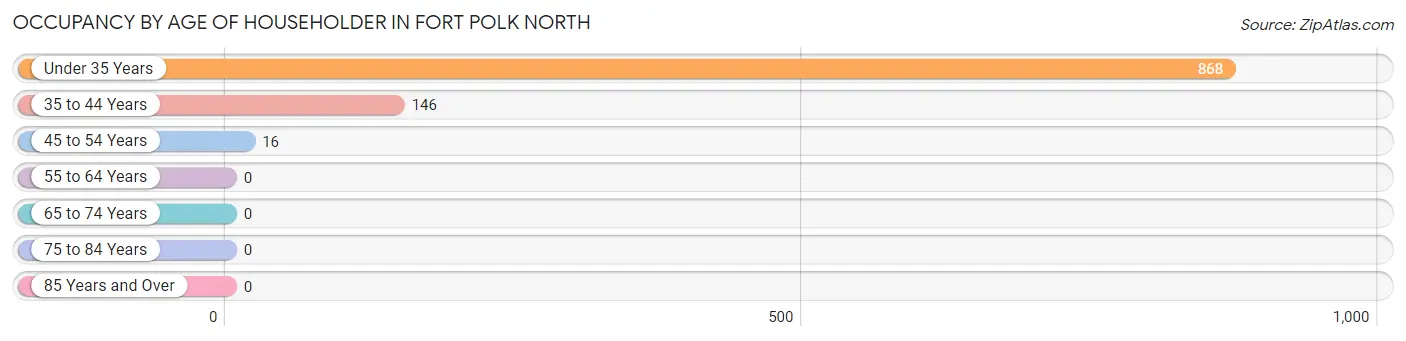
| Age Bracket | # Households | % Households |
| Under 35 Years | 868 | 84.3% |
| 35 to 44 Years | 146 | 14.2% |
| 45 to 54 Years | 16 | 1.5% |
| 55 to 64 Years | 0 | 0.0% |
| 65 to 74 Years | 0 | 0.0% |
| 75 to 84 Years | 0 | 0.0% |
| 85 Years and Over | 0 | 0.0% |
| Total | 1,030 | 100.0% |
Housing Finances in Fort Polk North
Median Income by Occupancy in Fort Polk North
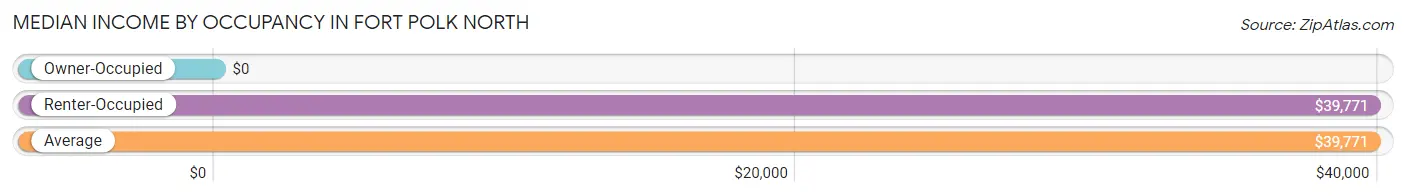
| Occupancy Type | # Households | Median Income |
| Owner-Occupied | 0 (0.0%) | $0 |
| Renter-Occupied | 1,030 (100.0%) | $39,771 |
| Average | 1,030 (100.0%) | $39,771 |
Occupancy by Householder Income Bracket in Fort Polk North
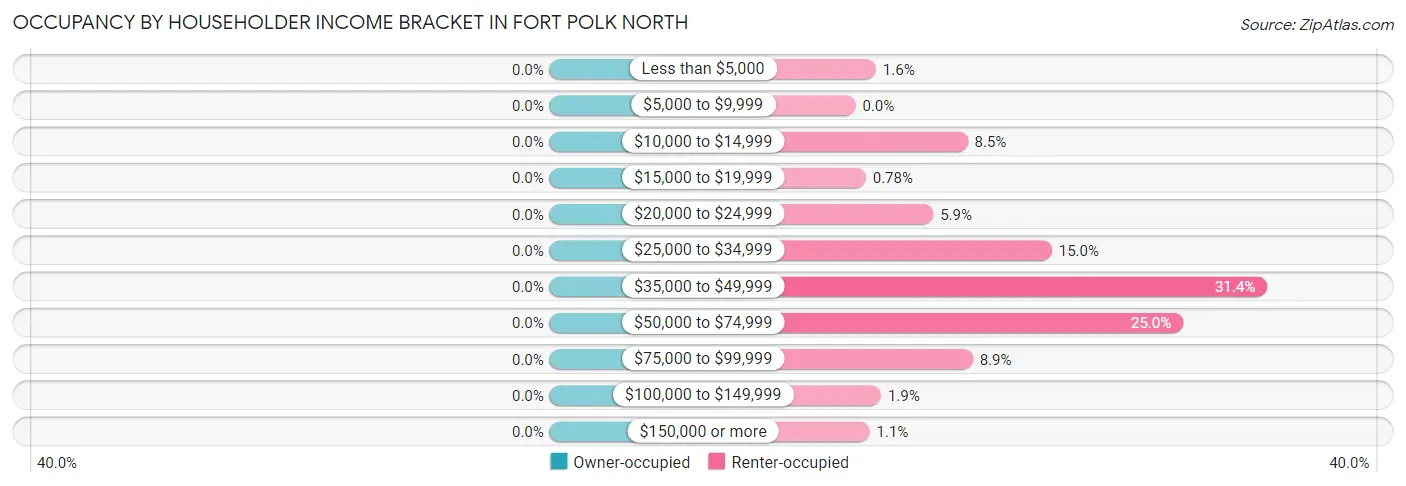
| Income Bracket | Owner-occupied | Renter-occupied |
| Less than $5,000 | 0 (0.0%) | 16 (1.5%) |
| $5,000 to $9,999 | 0 (0.0%) | 0 (0.0%) |
| $10,000 to $14,999 | 0 (0.0%) | 88 (8.5%) |
| $15,000 to $19,999 | 0 (0.0%) | 8 (0.8%) |
| $20,000 to $24,999 | 0 (0.0%) | 61 (5.9%) |
| $25,000 to $34,999 | 0 (0.0%) | 154 (14.9%) |
| $35,000 to $49,999 | 0 (0.0%) | 323 (31.4%) |
| $50,000 to $74,999 | 0 (0.0%) | 257 (24.9%) |
| $75,000 to $99,999 | 0 (0.0%) | 92 (8.9%) |
| $100,000 to $149,999 | 0 (0.0%) | 20 (1.9%) |
| $150,000 or more | 0 (0.0%) | 11 (1.1%) |
| Total | 0 (0.0%) | 1,030 (100.0%) |
Monthly Housing Cost Tiers in Fort Polk North
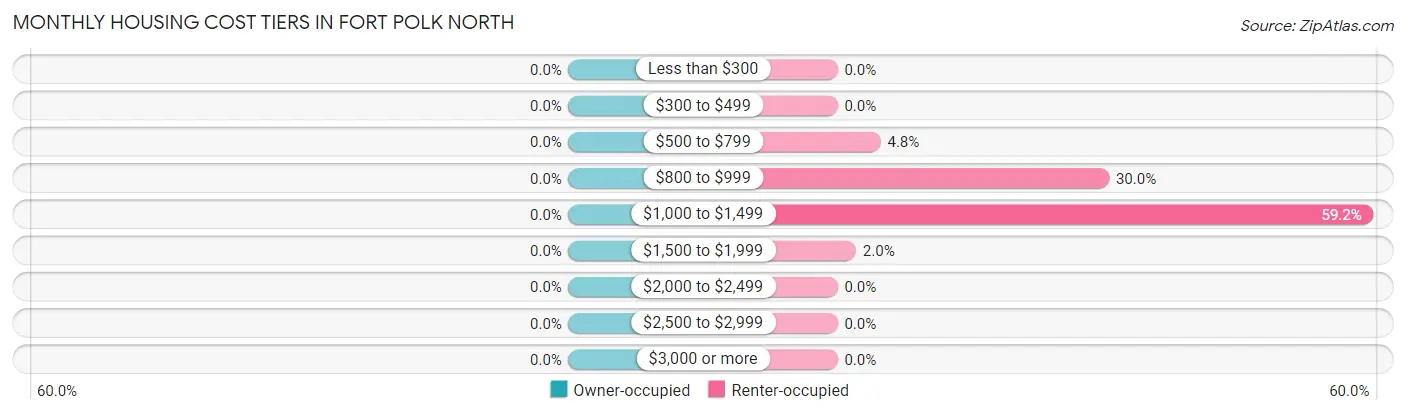
| Monthly Cost | Owner-occupied | Renter-occupied |
| Less than $300 | 0 (0.0%) | 0 (0.0%) |
| $300 to $499 | 0 (0.0%) | 0 (0.0%) |
| $500 to $799 | 0 (0.0%) | 49 (4.8%) |
| $800 to $999 | 0 (0.0%) | 309 (30.0%) |
| $1,000 to $1,499 | 0 (0.0%) | 610 (59.2%) |
| $1,500 to $1,999 | 0 (0.0%) | 21 (2.0%) |
| $2,000 to $2,499 | 0 (0.0%) | 0 (0.0%) |
| $2,500 to $2,999 | 0 (0.0%) | 0 (0.0%) |
| $3,000 or more | 0 (0.0%) | 0 (0.0%) |
| Total | 0 (0.0%) | 1,030 (100.0%) |
Physical Housing Characteristics in Fort Polk North
Housing Structures in Fort Polk North
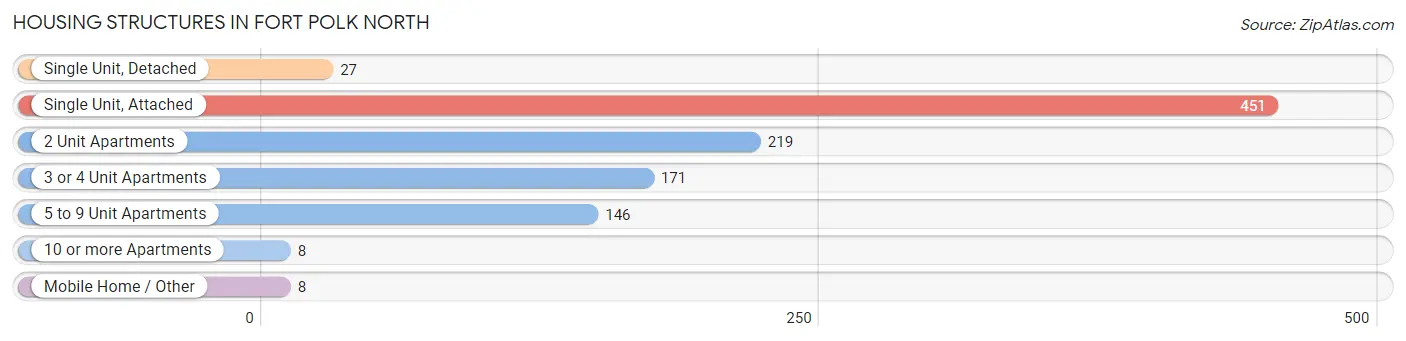
| Structure Type | # Housing Units | % Housing Units |
| Single Unit, Detached | 27 | 2.6% |
| Single Unit, Attached | 451 | 43.8% |
| 2 Unit Apartments | 219 | 21.3% |
| 3 or 4 Unit Apartments | 171 | 16.6% |
| 5 to 9 Unit Apartments | 146 | 14.2% |
| 10 or more Apartments | 8 | 0.8% |
| Mobile Home / Other | 8 | 0.8% |
| Total | 1,030 | 100.0% |
Housing Structures by Occupancy in Fort Polk North
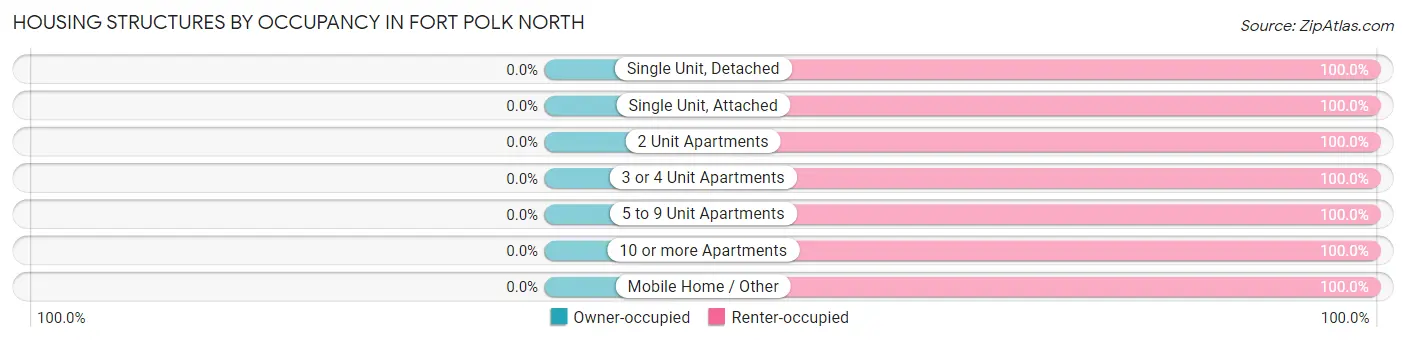
| Structure Type | Owner-occupied | Renter-occupied |
| Single Unit, Detached | 0 (0.0%) | 27 (100.0%) |
| Single Unit, Attached | 0 (0.0%) | 451 (100.0%) |
| 2 Unit Apartments | 0 (0.0%) | 219 (100.0%) |
| 3 or 4 Unit Apartments | 0 (0.0%) | 171 (100.0%) |
| 5 to 9 Unit Apartments | 0 (0.0%) | 146 (100.0%) |
| 10 or more Apartments | 0 (0.0%) | 8 (100.0%) |
| Mobile Home / Other | 0 (0.0%) | 8 (100.0%) |
| Total | 0 (0.0%) | 1,030 (100.0%) |
Housing Structures by Number of Rooms in Fort Polk North
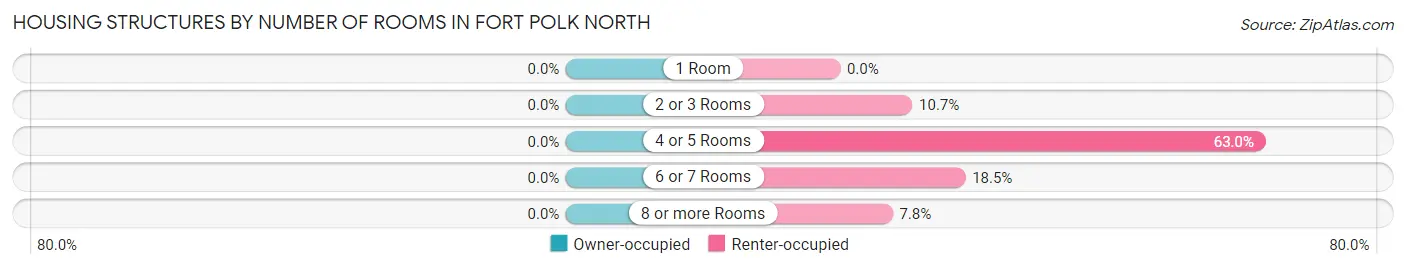
| Number of Rooms | Owner-occupied | Renter-occupied |
| 1 Room | 0 (0.0%) | 0 (0.0%) |
| 2 or 3 Rooms | 0 (0.0%) | 110 (10.7%) |
| 4 or 5 Rooms | 0 (0.0%) | 649 (63.0%) |
| 6 or 7 Rooms | 0 (0.0%) | 191 (18.5%) |
| 8 or more Rooms | 0 (0.0%) | 80 (7.8%) |
| Total | 0 (0.0%) | 1,030 (100.0%) |
Housing Structure by Heating Type in Fort Polk North
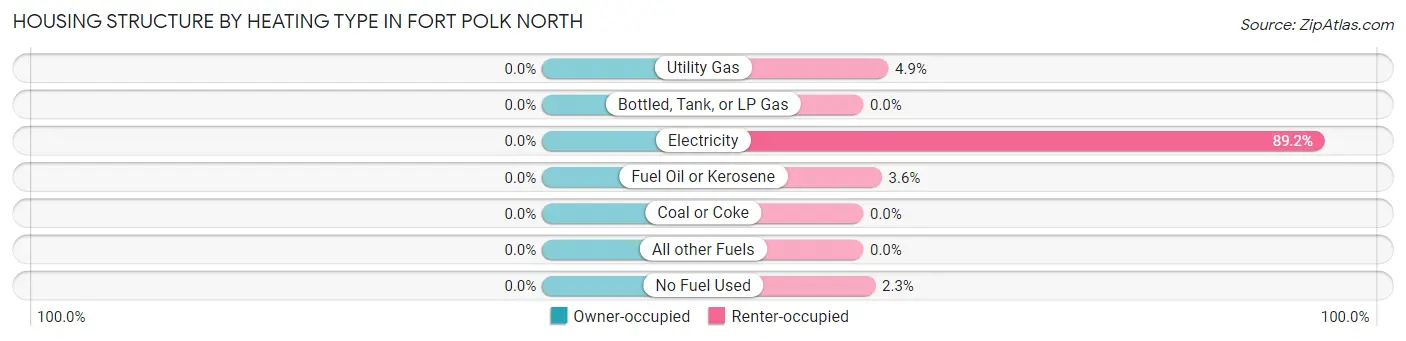
| Heating Type | Owner-occupied | Renter-occupied |
| Utility Gas | 0 (0.0%) | 50 (4.9%) |
| Bottled, Tank, or LP Gas | 0 (0.0%) | 0 (0.0%) |
| Electricity | 0 (0.0%) | 919 (89.2%) |
| Fuel Oil or Kerosene | 0 (0.0%) | 37 (3.6%) |
| Coal or Coke | 0 (0.0%) | 0 (0.0%) |
| All other Fuels | 0 (0.0%) | 0 (0.0%) |
| No Fuel Used | 0 (0.0%) | 24 (2.3%) |
| Total | 0 (0.0%) | 1,030 (100.0%) |
Household Vehicle Usage in Fort Polk North
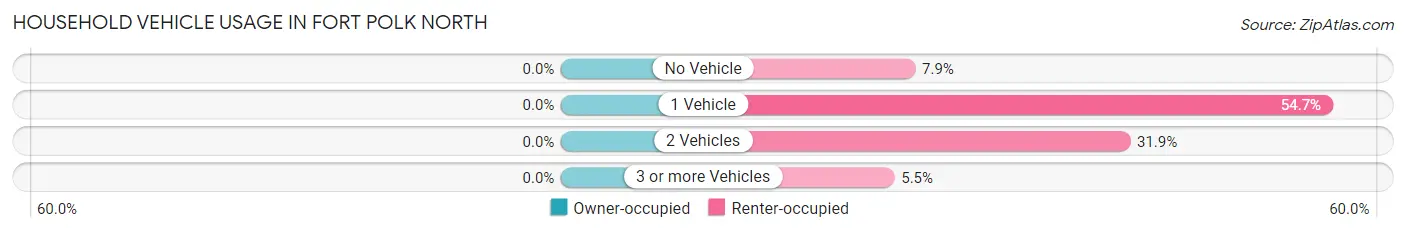
| Vehicles per Household | Owner-occupied | Renter-occupied |
| No Vehicle | 0 (0.0%) | 81 (7.9%) |
| 1 Vehicle | 0 (0.0%) | 563 (54.7%) |
| 2 Vehicles | 0 (0.0%) | 329 (31.9%) |
| 3 or more Vehicles | 0 (0.0%) | 57 (5.5%) |
| Total | 0 (0.0%) | 1,030 (100.0%) |
Real Estate & Mortgages in Fort Polk North
Real Estate and Mortgage Overview in Fort Polk North
| Characteristic | Without Mortgage | With Mortgage |
| Housing Units | 0 | 0 |
| Median Property Value | - | - |
| Median Household Income | - | - |
| Monthly Housing Costs | - | - |
| Real Estate Taxes | - | - |
Property Value by Mortgage Status in Fort Polk North
| Property Value | Without Mortgage | With Mortgage |
| Less than $50,000 | 0 (0.0%) | 0 (0.0%) |
| $50,000 to $99,999 | 0 (0.0%) | 0 (0.0%) |
| $100,000 to $299,999 | 0 (0.0%) | 0 (0.0%) |
| $300,000 to $499,999 | 0 (0.0%) | 0 (0.0%) |
| $500,000 to $749,999 | 0 (0.0%) | 0 (0.0%) |
| $750,000 to $999,999 | 0 (0.0%) | 0 (0.0%) |
| $1,000,000 or more | 0 (0.0%) | 0 (0.0%) |
| Total | 0 (0.0%) | 0 (0.0%) |
Household Income by Mortgage Status in Fort Polk North
| Household Income | Without Mortgage | With Mortgage |
| Less than $10,000 | 0 (0.0%) | 0 (0.0%) |
| $10,000 to $24,999 | 0 (0.0%) | 0 (0.0%) |
| $25,000 to $34,999 | 0 (0.0%) | 0 (0.0%) |
| $35,000 to $49,999 | 0 (0.0%) | 0 (0.0%) |
| $50,000 to $74,999 | 0 (0.0%) | 0 (0.0%) |
| $75,000 to $99,999 | 0 (0.0%) | 0 (0.0%) |
| $100,000 to $149,999 | 0 (0.0%) | 0 (0.0%) |
| $150,000 or more | 0 (0.0%) | 0 (0.0%) |
| Total | 0 (0.0%) | 0 (0.0%) |
Property Value to Household Income Ratio in Fort Polk North
| Value-to-Income Ratio | Without Mortgage | With Mortgage |
| Less than 2.0x | 0 (0.0%) | 0 (0.0%) |
| 2.0x to 2.9x | 0 (0.0%) | 0 (0.0%) |
| 3.0x to 3.9x | 0 (0.0%) | 0 (0.0%) |
| 4.0x or more | 0 (0.0%) | 0 (0.0%) |
| Total | 0 (0.0%) | 0 (0.0%) |
Real Estate Taxes by Mortgage Status in Fort Polk North
| Property Taxes | Without Mortgage | With Mortgage |
| Less than $800 | 0 (0.0%) | 0 (0.0%) |
| $800 to $1,499 | 0 (0.0%) | 0 (0.0%) |
| $800 to $1,499 | 0 (0.0%) | 0 (0.0%) |
| Total | 0 (0.0%) | 0 (0.0%) |
Health & Disability in Fort Polk North
Health Insurance Coverage by Age in Fort Polk North
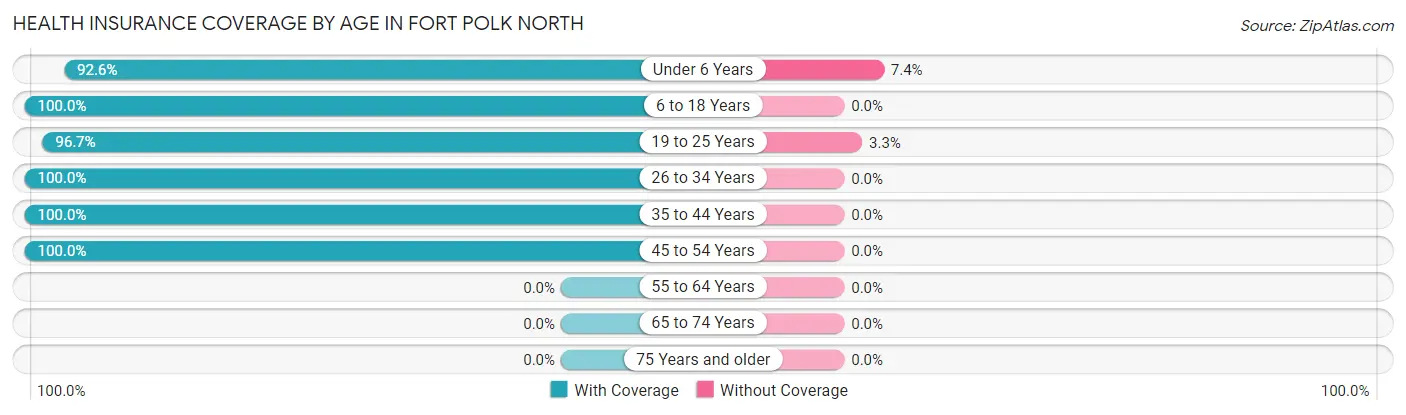
| Age Bracket | With Coverage | Without Coverage |
| Under 6 Years | 289 (92.6%) | 23 (7.4%) |
| 6 to 18 Years | 64 (100.0%) | 0 (0.0%) |
| 19 to 25 Years | 554 (96.7%) | 19 (3.3%) |
| 26 to 34 Years | 166 (100.0%) | 0 (0.0%) |
| 35 to 44 Years | 67 (100.0%) | 0 (0.0%) |
| 45 to 54 Years | 44 (100.0%) | 0 (0.0%) |
| 55 to 64 Years | 0 (0.0%) | 0 (0.0%) |
| 65 to 74 Years | 0 (0.0%) | 0 (0.0%) |
| 75 Years and older | 0 (0.0%) | 0 (0.0%) |
| Total | 1,184 (96.6%) | 42 (3.4%) |
Health Insurance Coverage by Citizenship Status in Fort Polk North
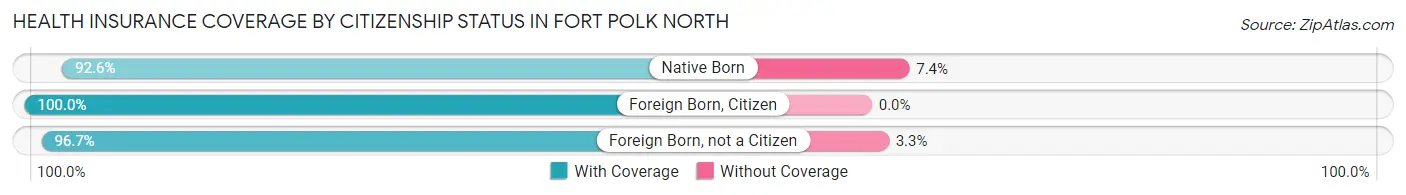
| Citizenship Status | With Coverage | Without Coverage |
| Native Born | 289 (92.6%) | 23 (7.4%) |
| Foreign Born, Citizen | 64 (100.0%) | 0 (0.0%) |
| Foreign Born, not a Citizen | 554 (96.7%) | 19 (3.3%) |
Health Insurance Coverage by Household Income in Fort Polk North
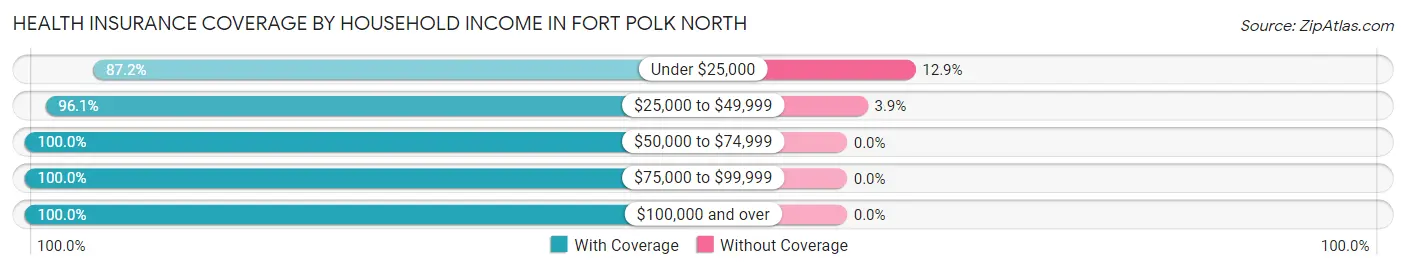
| Household Income | With Coverage | Without Coverage |
| Under $25,000 | 156 (87.2%) | 23 (12.9%) |
| $25,000 to $49,999 | 471 (96.1%) | 19 (3.9%) |
| $50,000 to $74,999 | 344 (100.0%) | 0 (0.0%) |
| $75,000 to $99,999 | 149 (100.0%) | 0 (0.0%) |
| $100,000 and over | 64 (100.0%) | 0 (0.0%) |
Public vs Private Health Insurance Coverage by Age in Fort Polk North
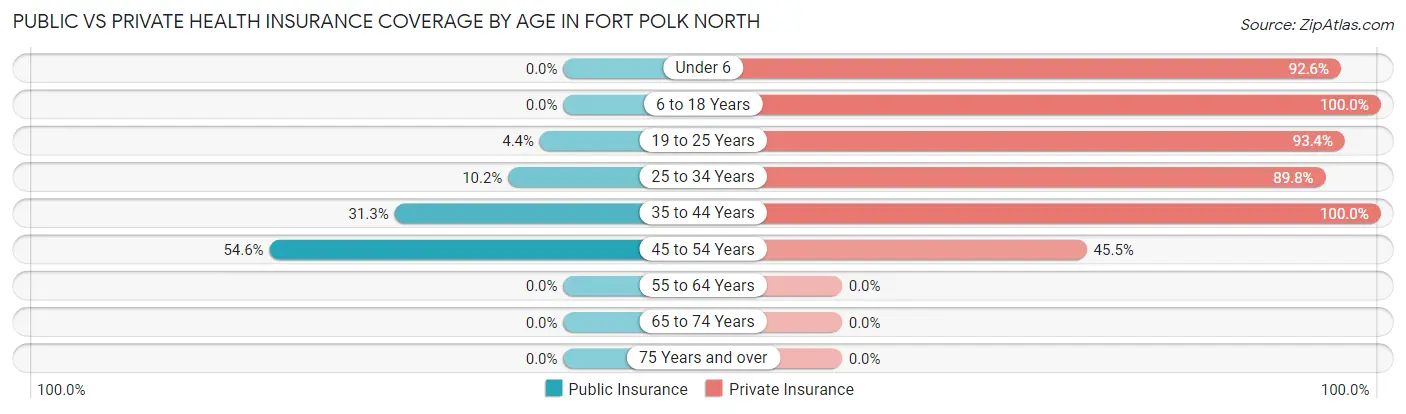
| Age Bracket | Public Insurance | Private Insurance |
| Under 6 | 0 (0.0%) | 289 (92.6%) |
| 6 to 18 Years | 0 (0.0%) | 64 (100.0%) |
| 19 to 25 Years | 25 (4.4%) | 535 (93.4%) |
| 25 to 34 Years | 17 (10.2%) | 149 (89.8%) |
| 35 to 44 Years | 21 (31.3%) | 67 (100.0%) |
| 45 to 54 Years | 24 (54.5%) | 20 (45.5%) |
| 55 to 64 Years | 0 (0.0%) | 0 (0.0%) |
| 65 to 74 Years | 0 (0.0%) | 0 (0.0%) |
| 75 Years and over | 0 (0.0%) | 0 (0.0%) |
| Total | 87 (7.1%) | 1,124 (91.7%) |
Disability Status by Sex by Age in Fort Polk North
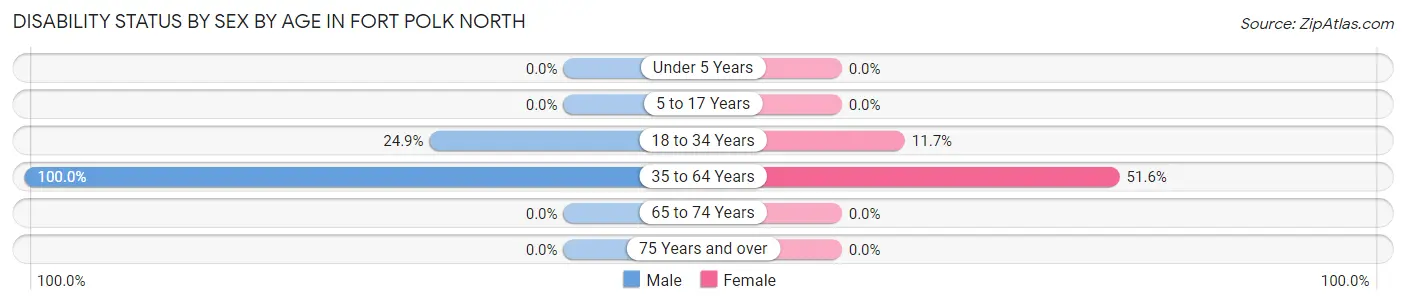
| Age Bracket | Male | Female |
| Under 5 Years | 0 (0.0%) | 0 (0.0%) |
| 5 to 17 Years | 0 (0.0%) | 0 (0.0%) |
| 18 to 34 Years | 49 (24.9%) | 65 (11.7%) |
| 35 to 64 Years | 16 (100.0%) | 49 (51.6%) |
| 65 to 74 Years | 0 (0.0%) | 0 (0.0%) |
| 75 Years and over | 0 (0.0%) | 0 (0.0%) |
Disability Class by Sex by Age in Fort Polk North
Disability Class: Hearing Difficulty
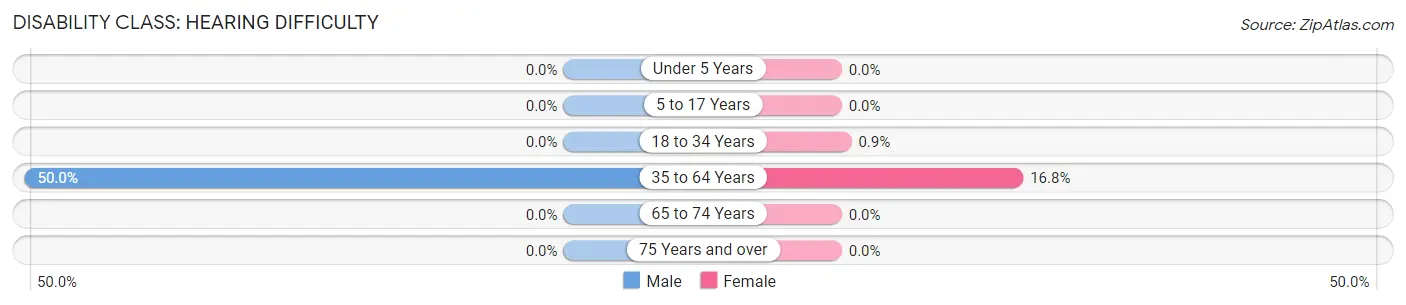
| Age Bracket | Male | Female |
| Under 5 Years | 0 (0.0%) | 0 (0.0%) |
| 5 to 17 Years | 0 (0.0%) | 0 (0.0%) |
| 18 to 34 Years | 0 (0.0%) | 5 (0.9%) |
| 35 to 64 Years | 8 (50.0%) | 16 (16.8%) |
| 65 to 74 Years | 0 (0.0%) | 0 (0.0%) |
| 75 Years and over | 0 (0.0%) | 0 (0.0%) |
Disability Class: Vision Difficulty
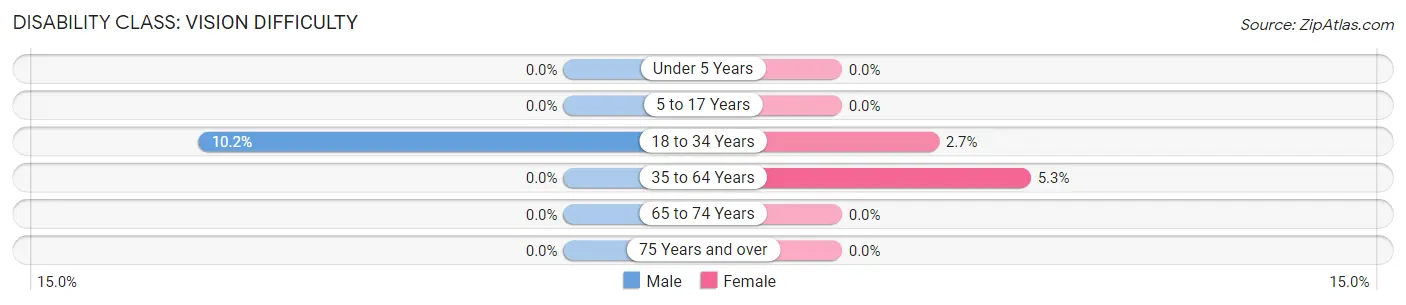
| Age Bracket | Male | Female |
| Under 5 Years | 0 (0.0%) | 0 (0.0%) |
| 5 to 17 Years | 0 (0.0%) | 0 (0.0%) |
| 18 to 34 Years | 20 (10.2%) | 15 (2.7%) |
| 35 to 64 Years | 0 (0.0%) | 5 (5.3%) |
| 65 to 74 Years | 0 (0.0%) | 0 (0.0%) |
| 75 Years and over | 0 (0.0%) | 0 (0.0%) |
Disability Class: Cognitive Difficulty
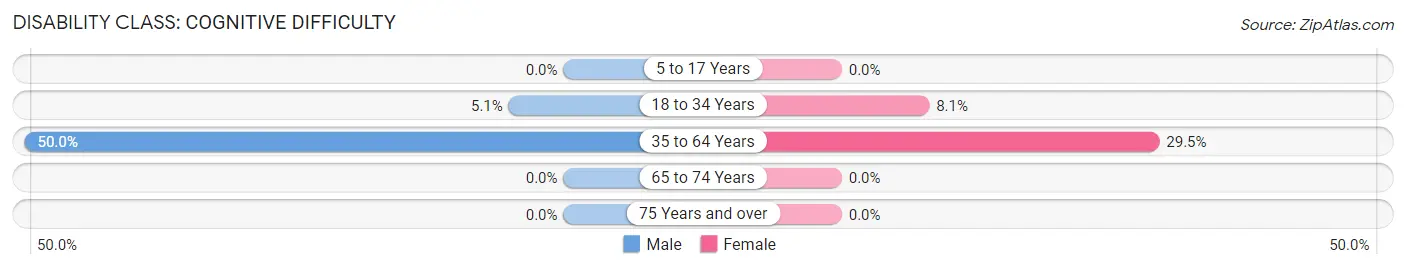
| Age Bracket | Male | Female |
| 5 to 17 Years | 0 (0.0%) | 0 (0.0%) |
| 18 to 34 Years | 10 (5.1%) | 45 (8.1%) |
| 35 to 64 Years | 8 (50.0%) | 28 (29.5%) |
| 65 to 74 Years | 0 (0.0%) | 0 (0.0%) |
| 75 Years and over | 0 (0.0%) | 0 (0.0%) |
Disability Class: Ambulatory Difficulty
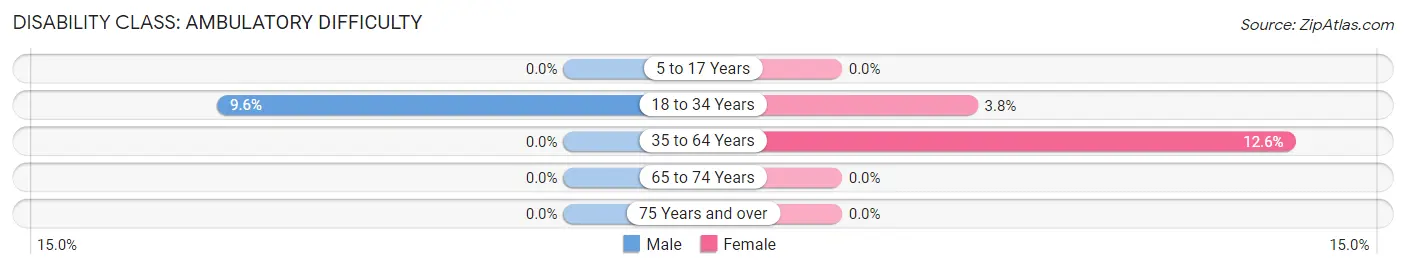
| Age Bracket | Male | Female |
| 5 to 17 Years | 0 (0.0%) | 0 (0.0%) |
| 18 to 34 Years | 19 (9.6%) | 21 (3.8%) |
| 35 to 64 Years | 0 (0.0%) | 12 (12.6%) |
| 65 to 74 Years | 0 (0.0%) | 0 (0.0%) |
| 75 Years and over | 0 (0.0%) | 0 (0.0%) |
Disability Class: Self-Care Difficulty
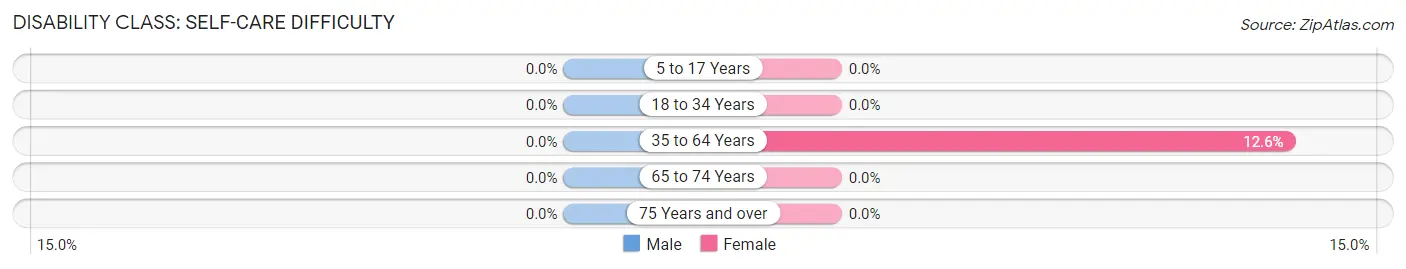
| Age Bracket | Male | Female |
| 5 to 17 Years | 0 (0.0%) | 0 (0.0%) |
| 18 to 34 Years | 0 (0.0%) | 0 (0.0%) |
| 35 to 64 Years | 0 (0.0%) | 12 (12.6%) |
| 65 to 74 Years | 0 (0.0%) | 0 (0.0%) |
| 75 Years and over | 0 (0.0%) | 0 (0.0%) |
Technology Access in Fort Polk North
Computing Device Access in Fort Polk North
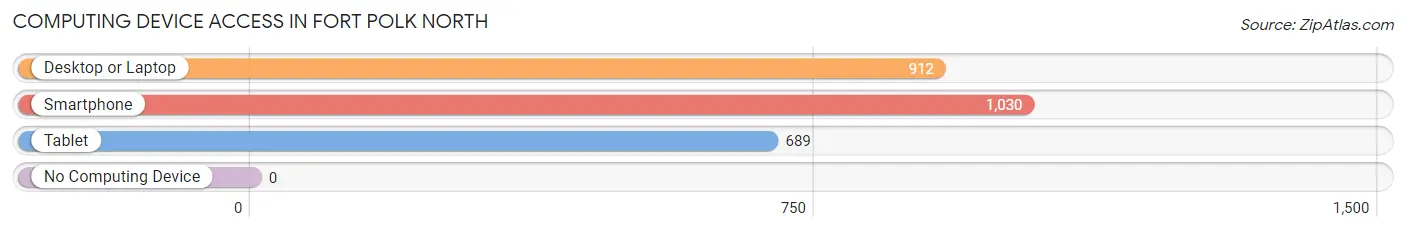
| Device Type | # Households | % Households |
| Desktop or Laptop | 912 | 88.5% |
| Smartphone | 1,030 | 100.0% |
| Tablet | 689 | 66.9% |
| No Computing Device | 0 | 0.0% |
| Total | 1,030 | 100.0% |
Internet Access in Fort Polk North
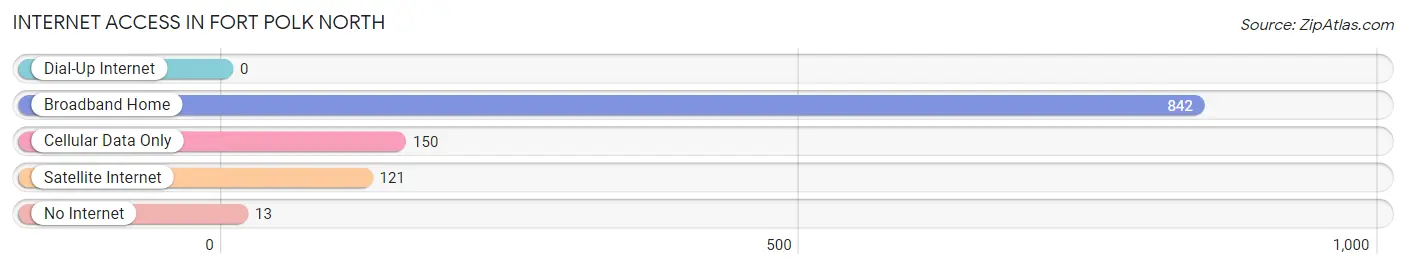
| Internet Type | # Households | % Households |
| Dial-Up Internet | 0 | 0.0% |
| Broadband Home | 842 | 81.8% |
| Cellular Data Only | 150 | 14.6% |
| Satellite Internet | 121 | 11.7% |
| No Internet | 13 | 1.3% |
| Total | 1,030 | 100.0% |
Fort Polk North Summary
Introduction
Fort Polk North, Louisiana is a small town located in the central part of the state. It is situated in the heart of the Kisatchie National Forest and is home to the Joint Readiness Training Center (JRTC) and Fort Polk, the largest military installation in the state. The town has a population of approximately 4,000 people and is known for its rural charm and friendly atmosphere.
History
Fort Polk North, Louisiana was originally established in 1941 as a military training center for the United States Army. The town was named after General Leonidas Polk, a Confederate general who was killed in the Battle of Pine Mountain during the Civil War. The town was initially used as a training center for the Army Air Corps and later for the Army Ground Forces. During World War II, the town was home to the largest Army Air Corps training center in the United States.
In the 1950s, the town was used as a training center for the Army Reserve and National Guard. In the 1960s, the town was used as a training center for the Army's Special Forces. In the 1970s, the town was used as a training center for the Army's Airborne and Ranger units. In the 1980s, the town was used as a training center for the Army's Air Assault units.
In the 1990s, the town was used as a training center for the Army's Light Infantry units. In the 2000s, the town was used as a training center for the Army's Air Assault and Ranger units.
Geography
Fort Polk North, Louisiana is located in the central part of the state, in the heart of the Kisatchie National Forest. The town is situated on the banks of the Red River and is surrounded by rolling hills and lush forests. The town is located approximately 30 miles south of Shreveport, Louisiana and approximately 50 miles north of Alexandria, Louisiana.
The town is located at an elevation of approximately 200 feet above sea level and has a humid subtropical climate. The average temperature in the summer is around 90 degrees Fahrenheit and the average temperature in the winter is around 50 degrees Fahrenheit.
Economy
Fort Polk North, Louisiana is primarily a military town and is home to the Joint Readiness Training Center (JRTC) and Fort Polk, the largest military installation in the state. The town is also home to several small businesses, including restaurants, retail stores, and service providers.
The town is also home to several large employers, including the United States Army, the United States Air Force, and the United States Navy. The town is also home to several educational institutions, including the University of Louisiana at Monroe, Louisiana State University, and Louisiana Tech University.
Demographics
As of the 2010 census, the population of Fort Polk North, Louisiana was 4,000 people. The racial makeup of the town was 79.2% White, 15.2% African American, 0.3% Native American, 0.7% Asian, 0.1% Pacific Islander, and 4.5% from other races. The median household income in the town was $37,500 and the median family income was $45,000.
Conclusion
Fort Polk North, Louisiana is a small town located in the central part of the state. It is situated in the heart of the Kisatchie National Forest and is home to the Joint Readiness Training Center (JRTC) and Fort Polk, the largest military installation in the state. The town has a population of approximately 4,000 people and is known for its rural charm and friendly atmosphere. The town is primarily a military town and is home to several large employers, including the United States Army, the United States Air Force, and the United States Navy. The town is also home to several small businesses, including restaurants, retail stores, and service providers. The town has a humid subtropical climate and the median household income in the town was $37,500 and the median family income was $45,000.
Common Questions
What is Per Capita Income in Fort Polk North?
Per Capita income in Fort Polk North is $28,116.
What is the Median Family Income in Fort Polk North?
Median Family Income in Fort Polk North is $41,167.
What is the Median Household income in Fort Polk North?
Median Household Income in Fort Polk North is $39,771.
What is Income or Wage Gap in Fort Polk North?
Income or Wage Gap in Fort Polk North is 19.2%.
Women in Fort Polk North earn 80.8 cents for every dollar earned by a man.
What is Inequality or Gini Index in Fort Polk North?
Inequality or Gini Index in Fort Polk North is 0.41.
What is the Total Population of Fort Polk North?
Total Population of Fort Polk North is 2,075.
What is the Total Male Population of Fort Polk North?
Total Male Population of Fort Polk North is 1,050.
What is the Total Female Population of Fort Polk North?
Total Female Population of Fort Polk North is 1,025.
What is the Ratio of Males per 100 Females in Fort Polk North?
There are 102.44 Males per 100 Females in Fort Polk North.
What is the Ratio of Females per 100 Males in Fort Polk North?
There are 97.62 Females per 100 Males in Fort Polk North.
What is the Median Population Age in Fort Polk North?
Median Population Age in Fort Polk North is 23.7 Years.
What is the Average Family Size in Fort Polk North
Average Family Size in Fort Polk North is 2.5 People.
What is the Average Household Size in Fort Polk North
Average Household Size in Fort Polk North is 2.0 People.
How Large is the Labor Force in Fort Polk North?
There are 1,346 People in the Labor Forcein in Fort Polk North.
What is the Percentage of People in the Labor Force in Fort Polk North?
78.6% of People are in the Labor Force in Fort Polk North.
What is the Unemployment Rate in Fort Polk North?
Unemployment Rate in Fort Polk North is 12.0%.