Zip Codes with the Highest Percentage of Population Employed in Food Preparation & Serving in Sulphur, LA
RELATED REPORTS & OPTIONS
Food Preparation & Serving
Sulphur
Compare Zip Codes
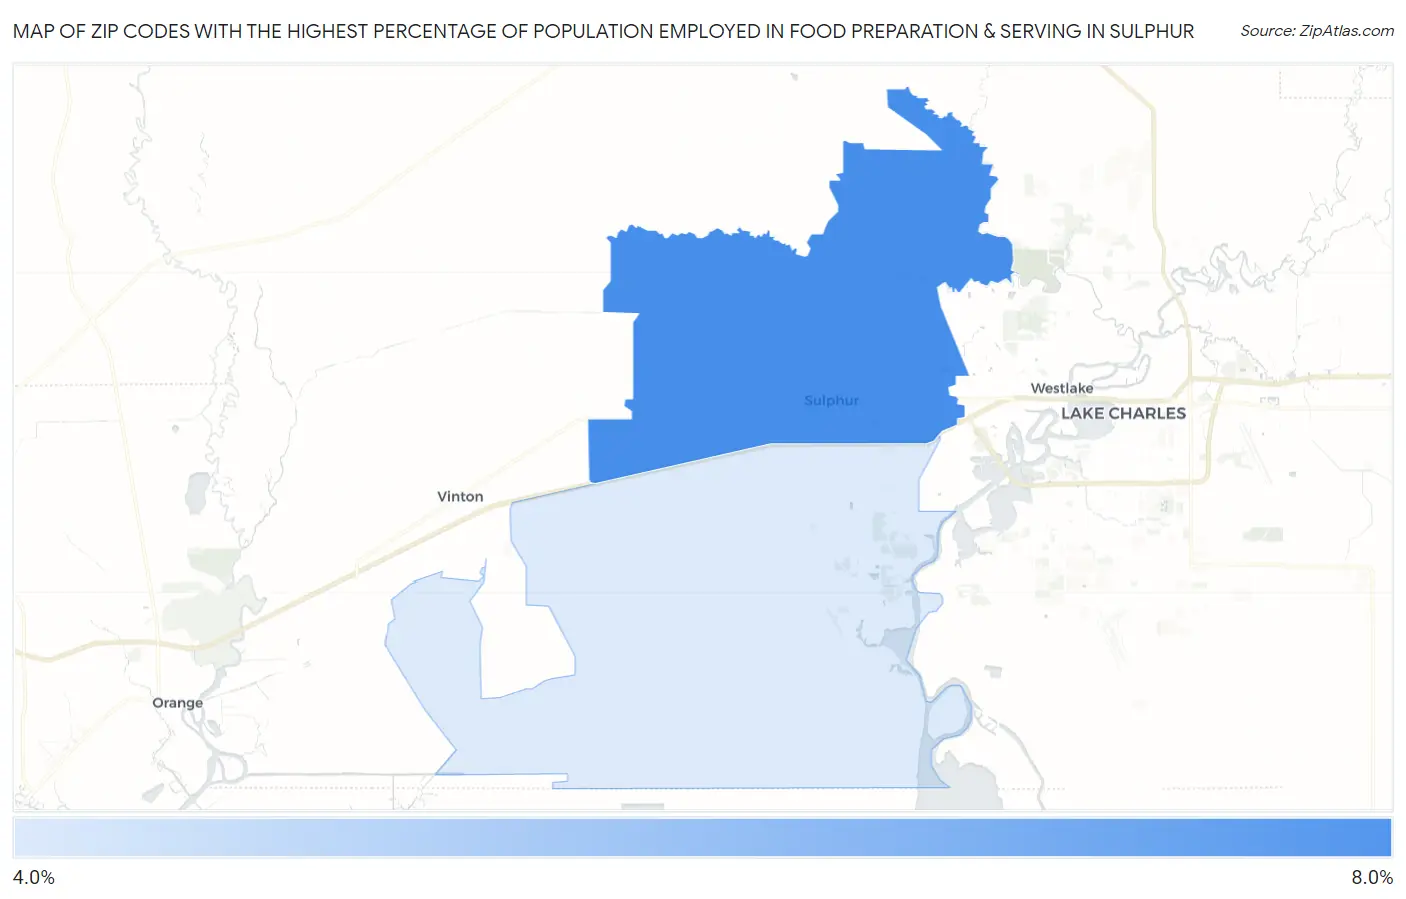
Map of Zip Codes with the Highest Percentage of Population Employed in Food Preparation & Serving in Sulphur
4.1%
6.5%
Zip Codes with the Highest Percentage of Population Employed in Food Preparation & Serving in Sulphur, LA
| Zip Code | % Employed | vs State | vs National | |
| 1. | 70663 | 6.5% | 6.0%(+0.457)#150 | 5.3%(+1.21)#7,885 |
| 2. | 70665 | 4.1% | 6.0%(-1.92)#273 | 5.3%(-1.17)#16,627 |
1
Common Questions
What are the Top Zip Codes with the Highest Percentage of Population Employed in Food Preparation & Serving in Sulphur, LA?
Top Zip Codes with the Highest Percentage of Population Employed in Food Preparation & Serving in Sulphur, LA are:
What zip code has the Highest Percentage of Population Employed in Food Preparation & Serving in Sulphur, LA?
70663 has the Highest Percentage of Population Employed in Food Preparation & Serving in Sulphur, LA with 6.5%.
What is the Percentage of Population Employed in Food Preparation & Serving in Sulphur, LA?
Percentage of Population Employed in Food Preparation & Serving in Sulphur is 6.5%.
What is the Percentage of Population Employed in Food Preparation & Serving in Louisiana?
Percentage of Population Employed in Food Preparation & Serving in Louisiana is 6.0%.
What is the Percentage of Population Employed in Food Preparation & Serving in the United States?
Percentage of Population Employed in Food Preparation & Serving in the United States is 5.3%.