Wallace Ridge, LA Map & Demographics
Wallace Ridge Map
Wallace Ridge Overview
$35,563
PER CAPITA INCOME
$115,489
AVG FAMILY INCOME
$77,250
AVG HOUSEHOLD INCOME
0.43
INEQUALITY / GINI INDEX
747
TOTAL POPULATION
327
MALE POPULATION
420
FEMALE POPULATION
77.86
MALES / 100 FEMALES
128.44
FEMALES / 100 MALES
40.2
MEDIAN AGE
2.9
AVG FAMILY SIZE
2.5
AVG HOUSEHOLD SIZE
377
LABOR FORCE [ PEOPLE ]
63.0%
PERCENT IN LABOR FORCE
Income in Wallace Ridge
Income Overview in Wallace Ridge
Per Capita Income in Wallace Ridge is $35,563, while median incomes of families and households are $115,489 and $77,250 respectively.
| Characteristic | Number | Measure |
| Per Capita Income | 747 | $35,563 |
| Median Family Income | 225 | $115,489 |
| Mean Family Income | 225 | $101,746 |
| Median Household Income | 301 | $77,250 |
| Mean Household Income | 301 | $86,644 |
| Income Deficit | 225 | $0 |
| Wage / Income Gap (%) | 747 | 0.00% |
| Wage / Income Gap ($) | 747 | 100.00¢ per $1 |
| Gini / Inequality Index | 747 | 0.43 |
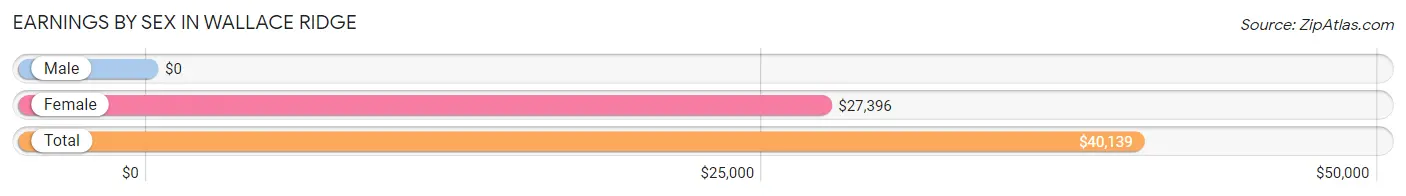
Earnings by Sex in Wallace Ridge
| Sex | Number | Average Earnings |
| Male | 196 (50.4%) | $0 |
| Female | 193 (49.6%) | $27,396 |
| Total | 389 (100.0%) | $40,139 |
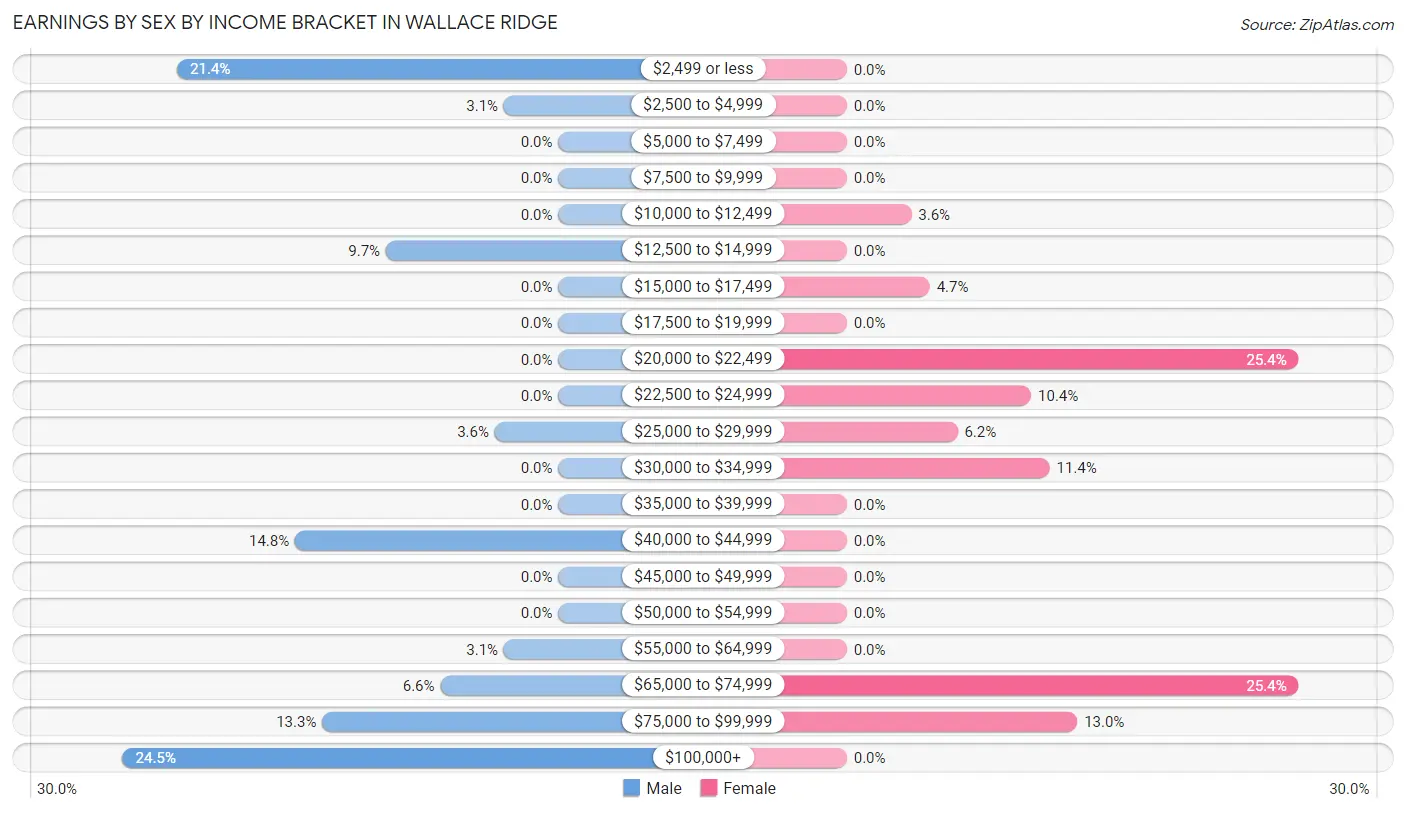
Earnings by Sex by Income Bracket in Wallace Ridge
The most common earnings brackets in Wallace Ridge are $100,000+ for men (48 | 24.5%) and $20,000 to $22,499 for women (49 | 25.4%).
| Income | Male | Female |
| $2,499 or less | 42 (21.4%) | 0 (0.0%) |
| $2,500 to $4,999 | 6 (3.1%) | 0 (0.0%) |
| $5,000 to $7,499 | 0 (0.0%) | 0 (0.0%) |
| $7,500 to $9,999 | 0 (0.0%) | 0 (0.0%) |
| $10,000 to $12,499 | 0 (0.0%) | 7 (3.6%) |
| $12,500 to $14,999 | 19 (9.7%) | 0 (0.0%) |
| $15,000 to $17,499 | 0 (0.0%) | 9 (4.7%) |
| $17,500 to $19,999 | 0 (0.0%) | 0 (0.0%) |
| $20,000 to $22,499 | 0 (0.0%) | 49 (25.4%) |
| $22,500 to $24,999 | 0 (0.0%) | 20 (10.4%) |
| $25,000 to $29,999 | 7 (3.6%) | 12 (6.2%) |
| $30,000 to $34,999 | 0 (0.0%) | 22 (11.4%) |
| $35,000 to $39,999 | 0 (0.0%) | 0 (0.0%) |
| $40,000 to $44,999 | 29 (14.8%) | 0 (0.0%) |
| $45,000 to $49,999 | 0 (0.0%) | 0 (0.0%) |
| $50,000 to $54,999 | 0 (0.0%) | 0 (0.0%) |
| $55,000 to $64,999 | 6 (3.1%) | 0 (0.0%) |
| $65,000 to $74,999 | 13 (6.6%) | 49 (25.4%) |
| $75,000 to $99,999 | 26 (13.3%) | 25 (13.0%) |
| $100,000+ | 48 (24.5%) | 0 (0.0%) |
| Total | 196 (100.0%) | 193 (100.0%) |
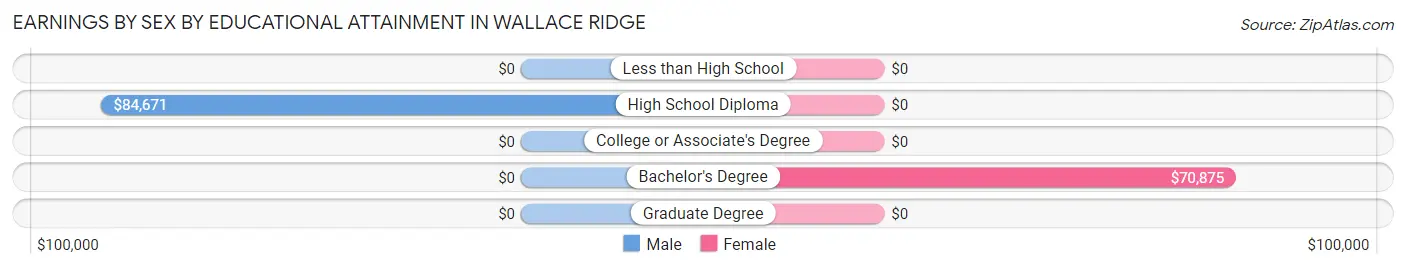
Earnings by Sex by Educational Attainment in Wallace Ridge
| Educational Attainment | Male Income | Female Income |
| Less than High School | - | - |
| High School Diploma | $84,671 | $0 |
| College or Associate's Degree | - | - |
| Bachelor's Degree | - | - |
| Graduate Degree | - | - |
| Total | $73,846 | $0 |
Family Income in Wallace Ridge
Family Income Brackets in Wallace Ridge
According to the Wallace Ridge family income data, there are 79 families falling into the $100,000 to $149,999 income range, which is the most common income bracket and makes up 35.1% of all families.
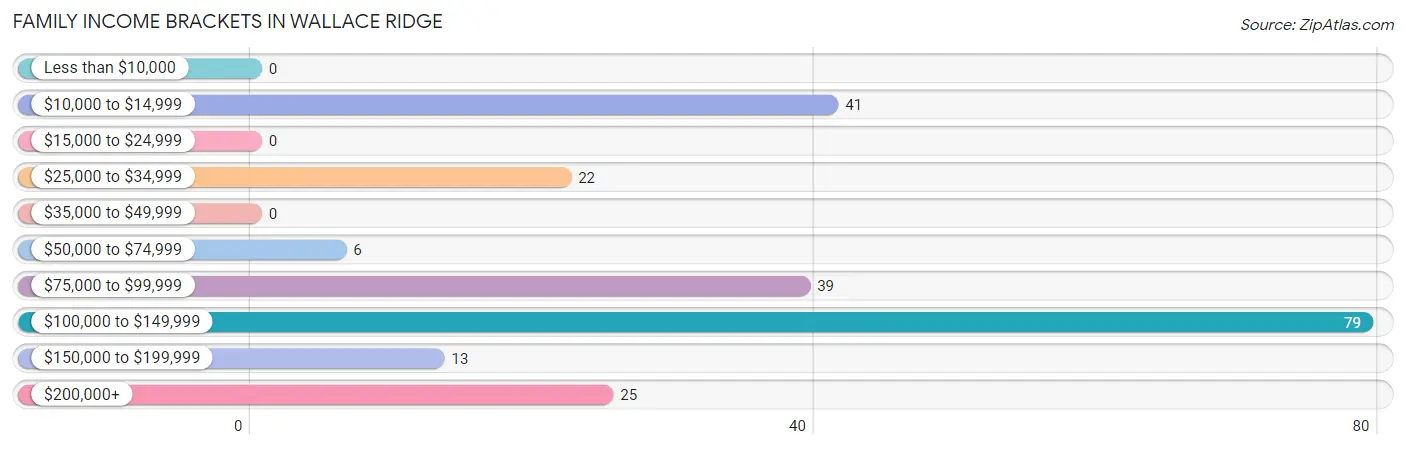
| Income Bracket | # Families | % Families |
| Less than $10,000 | 0 | 0.0% |
| $10,000 to $14,999 | 41 | 18.2% |
| $15,000 to $24,999 | 0 | 0.0% |
| $25,000 to $34,999 | 22 | 9.8% |
| $35,000 to $49,999 | 0 | 0.0% |
| $50,000 to $74,999 | 6 | 2.7% |
| $75,000 to $99,999 | 39 | 17.3% |
| $100,000 to $149,999 | 79 | 35.1% |
| $150,000 to $199,999 | 13 | 5.8% |
| $200,000+ | 25 | 11.1% |
Family Income by Famaliy Size in Wallace Ridge
2-person families (68 | 30.2%) account for the highest median family income in Wallace Ridge with $117,391 per family, while 2-person families (68 | 30.2%) have the highest median income of $58,696 per family member.
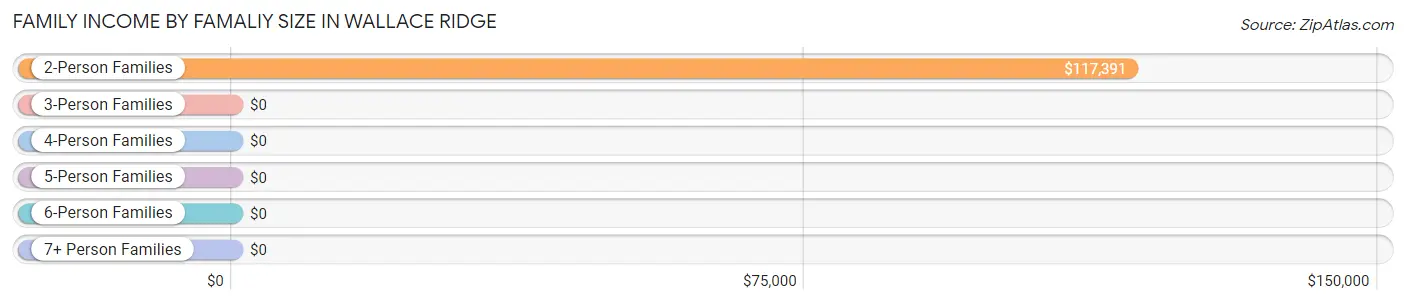
| Income Bracket | # Families | Median Income |
| 2-Person Families | 68 (30.2%) | $117,391 |
| 3-Person Families | 81 (36.0%) | $0 |
| 4-Person Families | 54 (24.0%) | $0 |
| 5-Person Families | 22 (9.8%) | $0 |
| 6-Person Families | 0 (0.0%) | $0 |
| 7+ Person Families | 0 (0.0%) | $0 |
| Total | 225 (100.0%) | $115,489 |
Family Income by Number of Earners in Wallace Ridge
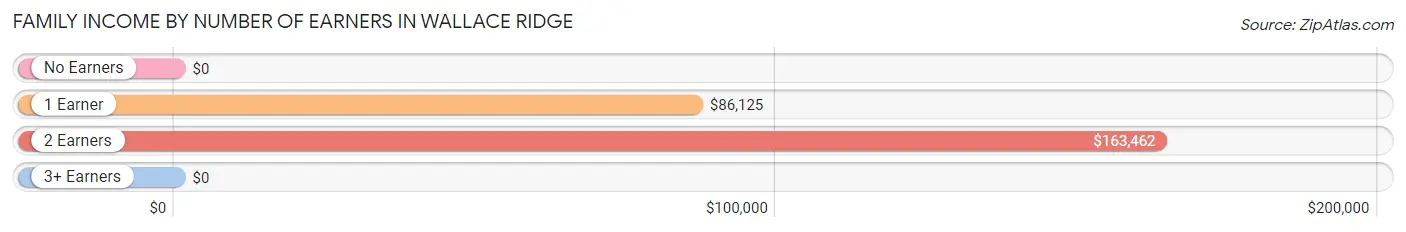
| Number of Earners | # Families | Median Income |
| No Earners | 47 (20.9%) | $0 |
| 1 Earner | 70 (31.1%) | $86,125 |
| 2 Earners | 66 (29.3%) | $163,462 |
| 3+ Earners | 42 (18.7%) | $0 |
| Total | 225 (100.0%) | $115,489 |
Household Income in Wallace Ridge
Household Income Brackets in Wallace Ridge
With 79 households falling in the category, the $100,000 to $149,999 income range is the most frequent in Wallace Ridge, accounting for 26.3% of all households.
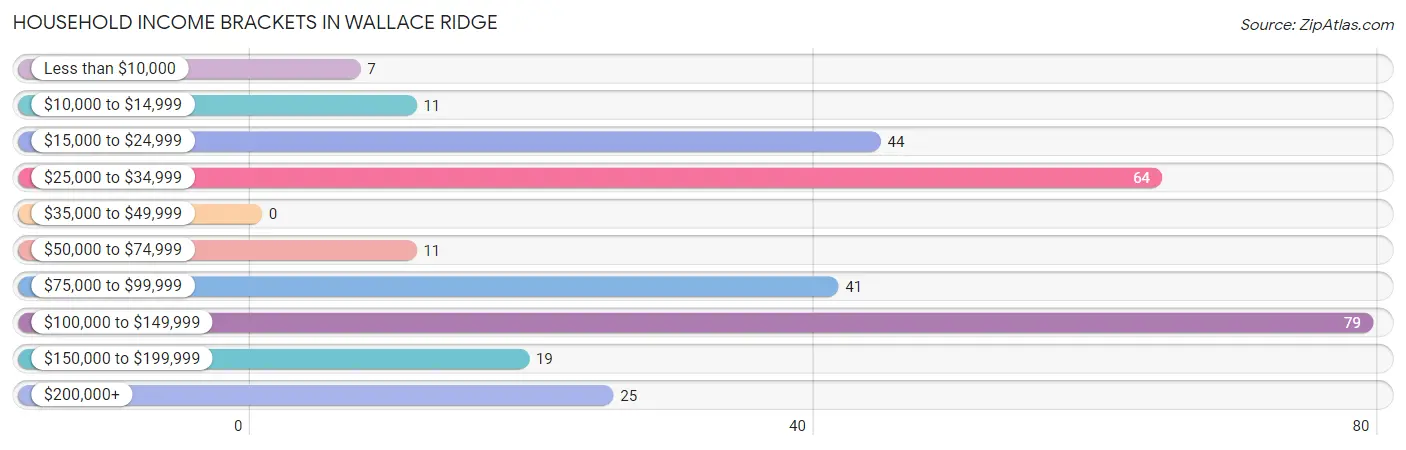
| Income Bracket | # Households | % Households |
| Less than $10,000 | 7 | 2.3% |
| $10,000 to $14,999 | 11 | 3.7% |
| $15,000 to $24,999 | 44 | 14.6% |
| $25,000 to $34,999 | 64 | 21.3% |
| $35,000 to $49,999 | 0 | 0.0% |
| $50,000 to $74,999 | 11 | 3.7% |
| $75,000 to $99,999 | 41 | 13.6% |
| $100,000 to $149,999 | 79 | 26.2% |
| $150,000 to $199,999 | 19 | 6.3% |
| $200,000+ | 25 | 8.3% |
Household Income by Householder Age in Wallace Ridge
The median household income in Wallace Ridge is $77,250, with the highest median household income of $116,196 found in the 45 to 64 years age bracket for the primary householder. A total of 122 households (40.5%) fall into this category.
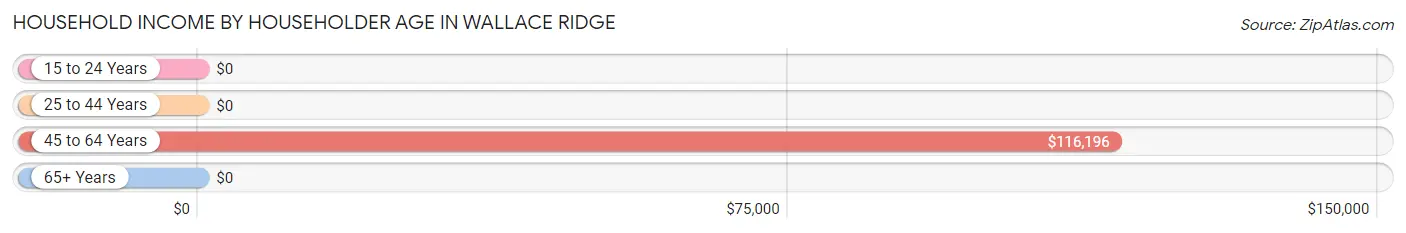
| Income Bracket | # Households | Median Income |
| 15 to 24 Years | 0 (0.0%) | $0 |
| 25 to 44 Years | 86 (28.6%) | $0 |
| 45 to 64 Years | 122 (40.5%) | $116,196 |
| 65+ Years | 93 (30.9%) | $0 |
| Total | 301 (100.0%) | $77,250 |
Poverty in Wallace Ridge
Income Below Poverty by Sex and Age in Wallace Ridge
With 15.3% poverty level for males and 20.9% for females among the residents of Wallace Ridge, 35 to 44 year old males and 16 and 17 year old females are the most vulnerable to poverty, with 25 males (100.0%) and 6 females (100.0%) in their respective age groups living below the poverty level.
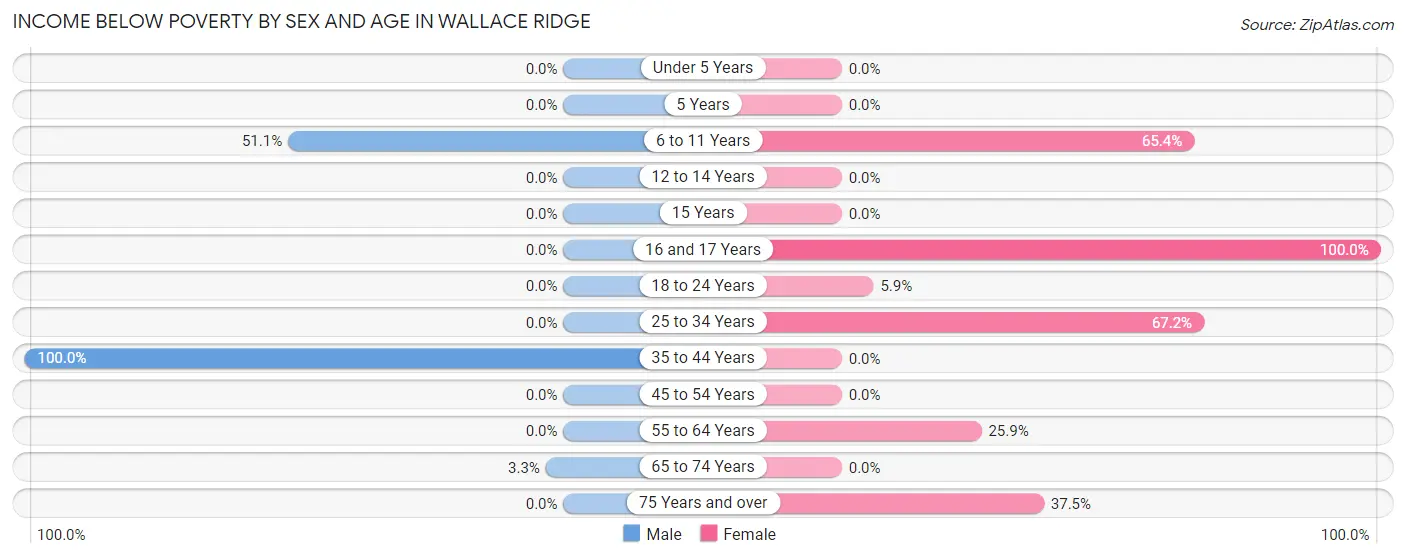
| Age Bracket | Male | Female |
| Under 5 Years | 0 (0.0%) | 0 (0.0%) |
| 5 Years | 0 (0.0%) | 0 (0.0%) |
| 6 to 11 Years | 23 (51.1%) | 17 (65.4%) |
| 12 to 14 Years | 0 (0.0%) | 0 (0.0%) |
| 15 Years | 0 (0.0%) | 0 (0.0%) |
| 16 and 17 Years | 0 (0.0%) | 6 (100.0%) |
| 18 to 24 Years | 0 (0.0%) | 4 (5.9%) |
| 25 to 34 Years | 0 (0.0%) | 41 (67.2%) |
| 35 to 44 Years | 25 (100.0%) | 0 (0.0%) |
| 45 to 54 Years | 0 (0.0%) | 0 (0.0%) |
| 55 to 64 Years | 0 (0.0%) | 14 (25.9%) |
| 65 to 74 Years | 2 (3.3%) | 0 (0.0%) |
| 75 Years and over | 0 (0.0%) | 6 (37.5%) |
| Total | 50 (15.3%) | 88 (20.9%) |
Income Above Poverty by Sex and Age in Wallace Ridge
According to the poverty statistics in Wallace Ridge, males aged 12 to 14 years and females aged under 5 years are the age groups that are most secure financially, with 100.0% of males and 100.0% of females in these age groups living above the poverty line.
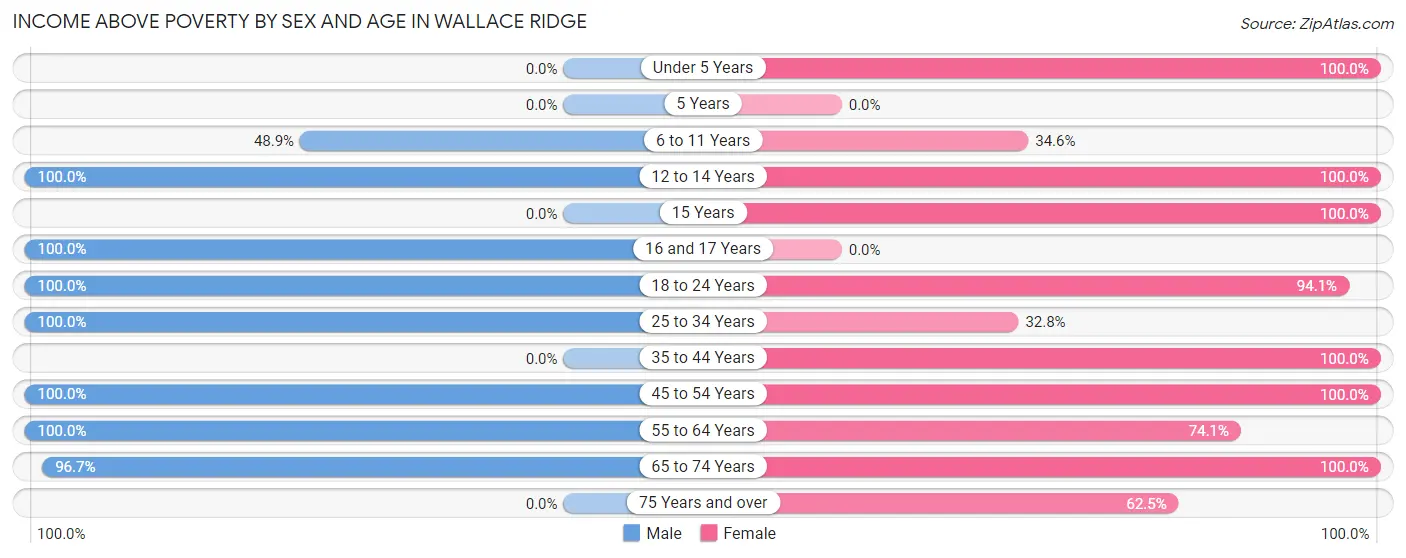
| Age Bracket | Male | Female |
| Under 5 Years | 0 (0.0%) | 18 (100.0%) |
| 5 Years | 0 (0.0%) | 0 (0.0%) |
| 6 to 11 Years | 22 (48.9%) | 9 (34.6%) |
| 12 to 14 Years | 22 (100.0%) | 12 (100.0%) |
| 15 Years | 0 (0.0%) | 26 (100.0%) |
| 16 and 17 Years | 36 (100.0%) | 0 (0.0%) |
| 18 to 24 Years | 15 (100.0%) | 64 (94.1%) |
| 25 to 34 Years | 9 (100.0%) | 20 (32.8%) |
| 35 to 44 Years | 0 (0.0%) | 25 (100.0%) |
| 45 to 54 Years | 81 (100.0%) | 61 (100.0%) |
| 55 to 64 Years | 33 (100.0%) | 40 (74.1%) |
| 65 to 74 Years | 59 (96.7%) | 47 (100.0%) |
| 75 Years and over | 0 (0.0%) | 10 (62.5%) |
| Total | 277 (84.7%) | 332 (79.0%) |
Income Below Poverty Among Married-Couple Families in Wallace Ridge
The poverty statistics for married-couple families in Wallace Ridge show that 1.3% or 2 of the total 151 families live below the poverty line. Families with 1 or 2 children have the highest poverty rate of 3.6%, comprising of 2 families. On the other hand, families with no children have the lowest poverty rate of 0.0%, which includes 0 families.
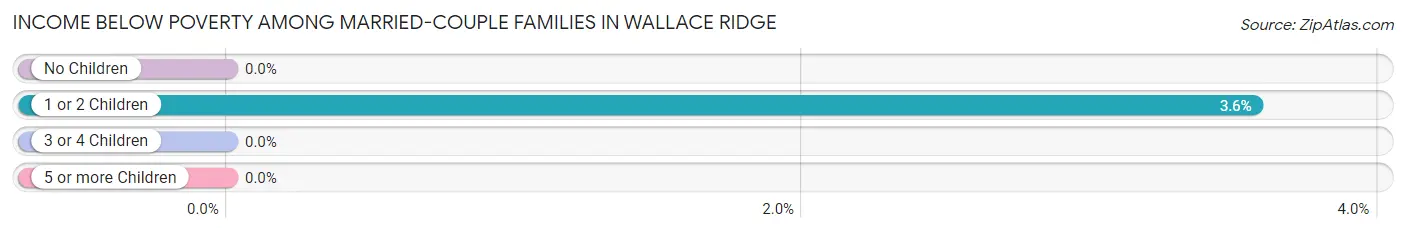
| Children | Above Poverty | Below Poverty |
| No Children | 75 (100.0%) | 0 (0.0%) |
| 1 or 2 Children | 54 (96.4%) | 2 (3.6%) |
| 3 or 4 Children | 20 (100.0%) | 0 (0.0%) |
| 5 or more Children | 0 (0.0%) | 0 (0.0%) |
| Total | 149 (98.7%) | 2 (1.3%) |
Income Below Poverty Among Single-Parent Households in Wallace Ridge
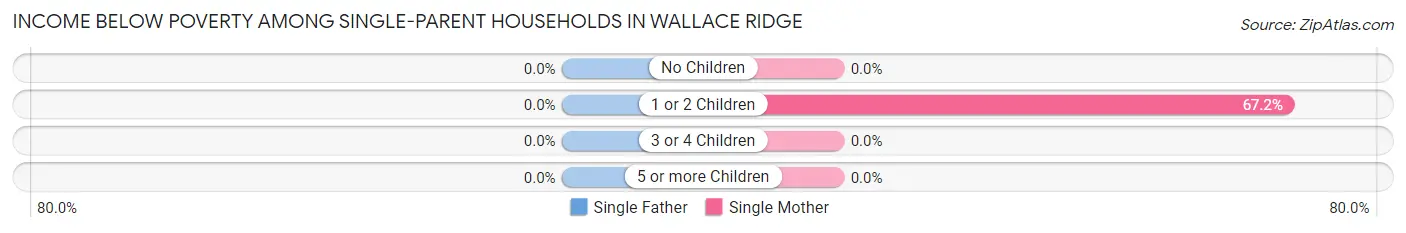
| Children | Single Father | Single Mother |
| No Children | 0 (0.0%) | 0 (0.0%) |
| 1 or 2 Children | 0 (0.0%) | 41 (67.2%) |
| 3 or 4 Children | 0 (0.0%) | 0 (0.0%) |
| 5 or more Children | 0 (0.0%) | 0 (0.0%) |
| Total | 0 (0.0%) | 41 (67.2%) |
Income Below Poverty Among Married-Couple vs Single-Parent Households in Wallace Ridge
The poverty data for Wallace Ridge shows that 2 of the married-couple family households (1.3%) and 41 of the single-parent households (55.4%) are living below the poverty level. Within the married-couple family households, those with 1 or 2 children have the highest poverty rate, with 2 households (3.6%) falling below the poverty line. Among the single-parent households, those with 1 or 2 children have the highest poverty rate, with 41 household (55.4%) living below poverty.
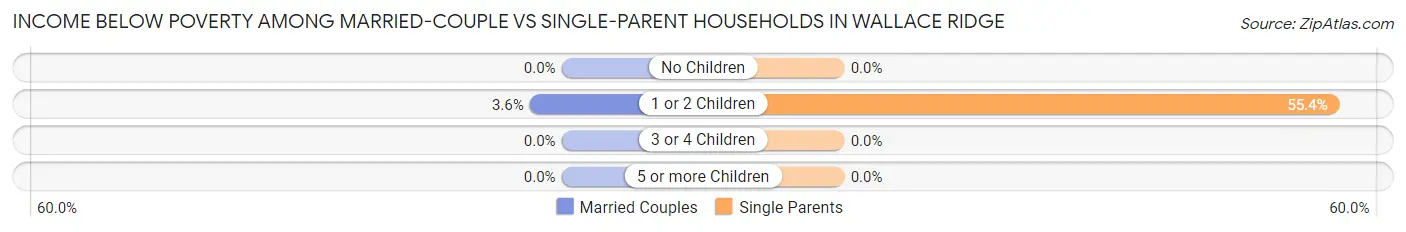
| Children | Married-Couple Families | Single-Parent Households |
| No Children | 0 (0.0%) | 0 (0.0%) |
| 1 or 2 Children | 2 (3.6%) | 41 (55.4%) |
| 3 or 4 Children | 0 (0.0%) | 0 (0.0%) |
| 5 or more Children | 0 (0.0%) | 0 (0.0%) |
| Total | 2 (1.3%) | 41 (55.4%) |
Race in Wallace Ridge
The most populous races in Wallace Ridge are White / Caucasian (432 | 57.8%), and Black / African American (315 | 42.2%).
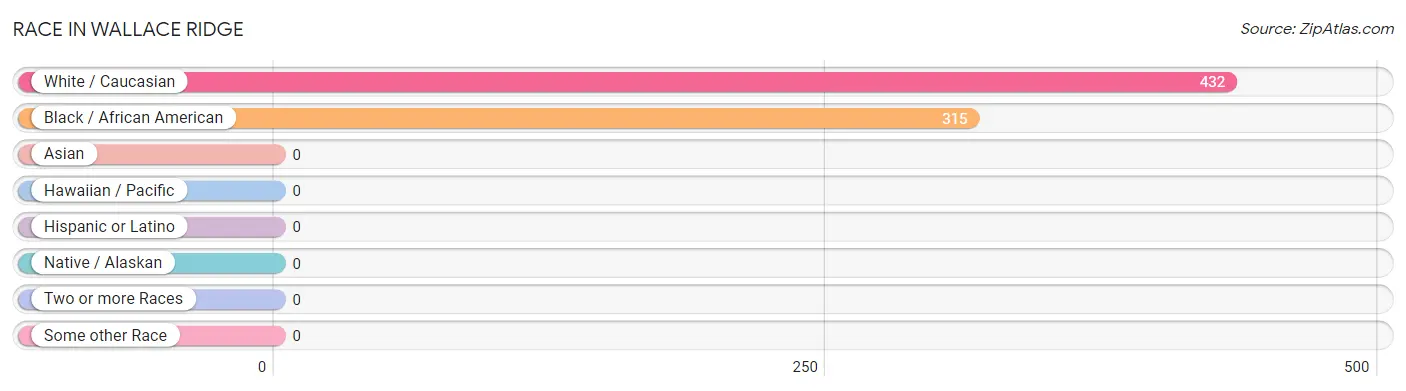
| Race | # Population | % Population |
| Asian | 0 | 0.0% |
| Black / African American | 315 | 42.2% |
| Hawaiian / Pacific | 0 | 0.0% |
| Hispanic or Latino | 0 | 0.0% |
| Native / Alaskan | 0 | 0.0% |
| White / Caucasian | 432 | 57.8% |
| Two or more Races | 0 | 0.0% |
| Some other Race | 0 | 0.0% |
| Total | 747 | 100.0% |
Ancestry in Wallace Ridge
The most populous ancestries reported in Wallace Ridge are American (134 | 17.9%), English (96 | 12.9%), Irish (33 | 4.4%), French (28 | 3.7%), and Welsh (13 | 1.7%), together accounting for 40.7% of all Wallace Ridge residents.
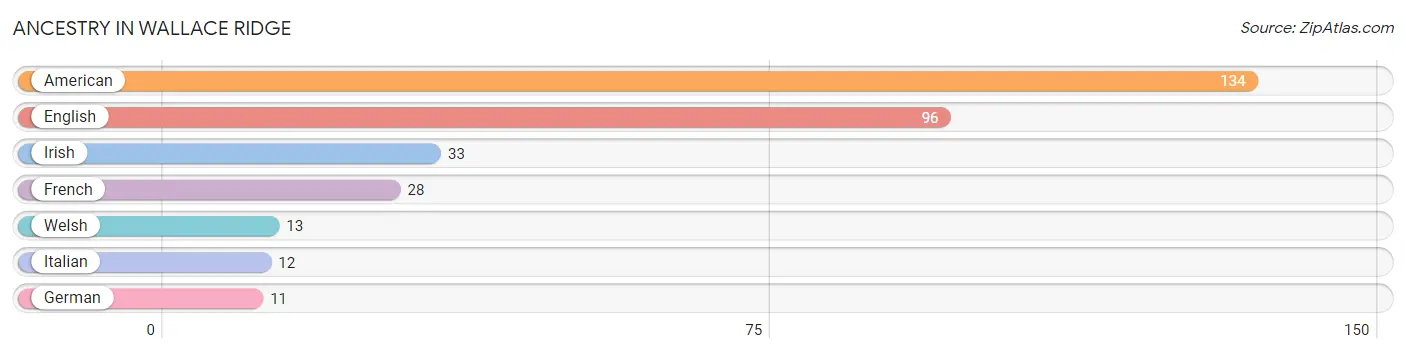
| Ancestry | # Population | % Population |
| American | 134 | 17.9% |
| English | 96 | 12.9% |
| French | 28 | 3.7% |
| German | 11 | 1.5% |
| Irish | 33 | 4.4% |
| Italian | 12 | 1.6% |
| Welsh | 13 | 1.7% | View All 7 Rows |
Immigrants in Wallace Ridge

| Immigration Origin | # Population | % Population | View All 0 Rows |
Sex and Age in Wallace Ridge
Sex and Age in Wallace Ridge
The most populous age groups in Wallace Ridge are 45 to 49 Years (55 | 16.8%) for men and 20 to 24 Years (64 | 15.2%) for women.
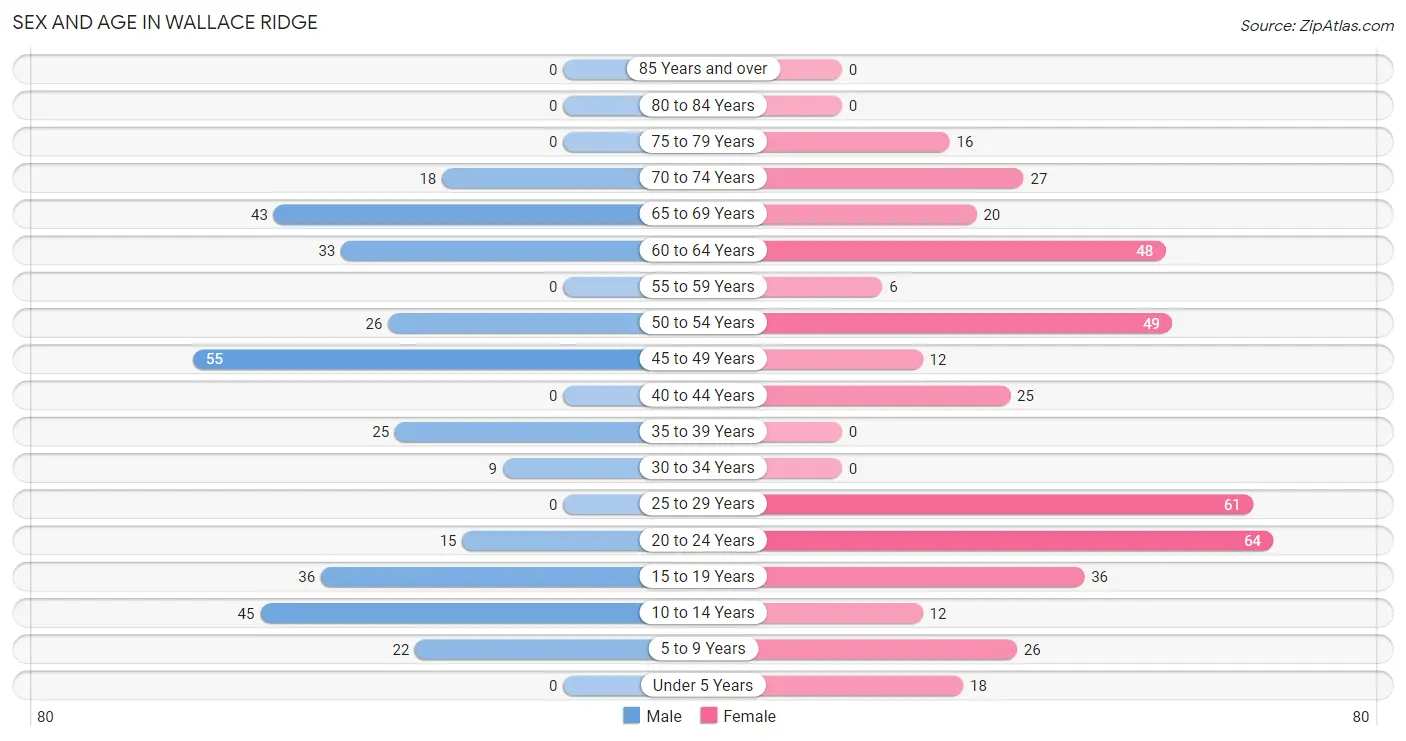
| Age Bracket | Male | Female |
| Under 5 Years | 0 (0.0%) | 18 (4.3%) |
| 5 to 9 Years | 22 (6.7%) | 26 (6.2%) |
| 10 to 14 Years | 45 (13.8%) | 12 (2.9%) |
| 15 to 19 Years | 36 (11.0%) | 36 (8.6%) |
| 20 to 24 Years | 15 (4.6%) | 64 (15.2%) |
| 25 to 29 Years | 0 (0.0%) | 61 (14.5%) |
| 30 to 34 Years | 9 (2.8%) | 0 (0.0%) |
| 35 to 39 Years | 25 (7.6%) | 0 (0.0%) |
| 40 to 44 Years | 0 (0.0%) | 25 (5.9%) |
| 45 to 49 Years | 55 (16.8%) | 12 (2.9%) |
| 50 to 54 Years | 26 (8.0%) | 49 (11.7%) |
| 55 to 59 Years | 0 (0.0%) | 6 (1.4%) |
| 60 to 64 Years | 33 (10.1%) | 48 (11.4%) |
| 65 to 69 Years | 43 (13.2%) | 20 (4.8%) |
| 70 to 74 Years | 18 (5.5%) | 27 (6.4%) |
| 75 to 79 Years | 0 (0.0%) | 16 (3.8%) |
| 80 to 84 Years | 0 (0.0%) | 0 (0.0%) |
| 85 Years and over | 0 (0.0%) | 0 (0.0%) |
| Total | 327 (100.0%) | 420 (100.0%) |
Families and Households in Wallace Ridge
Median Family Size in Wallace Ridge
The median family size in Wallace Ridge is 2.89 persons per family, with single male/father families (13 | 5.8%) accounting for the largest median family size of 3.77 persons per family. On the other hand, single female/mother families (61 | 27.1%) represent the smallest median family size with 2.10 persons per family.
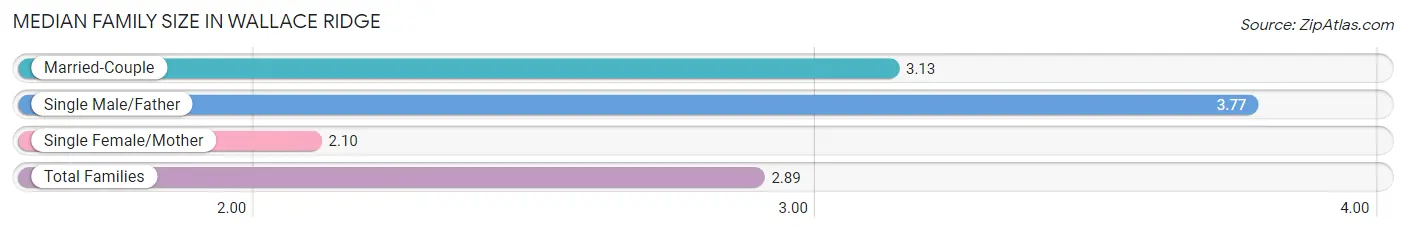
| Family Type | # Families | Family Size |
| Married-Couple | 151 (67.1%) | 3.13 |
| Single Male/Father | 13 (5.8%) | 3.77 |
| Single Female/Mother | 61 (27.1%) | 2.10 |
| Total Families | 225 (100.0%) | 2.89 |
Median Household Size in Wallace Ridge
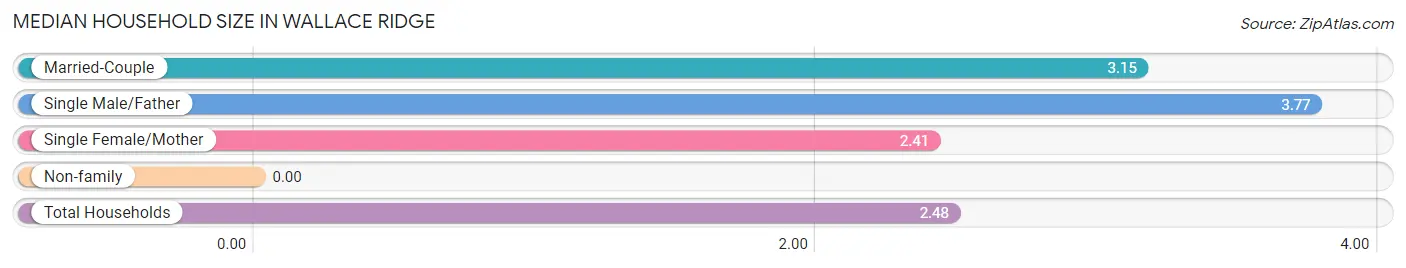
| Household Type | # Households | Household Size |
| Married-Couple | 151 (50.2%) | 3.15 |
| Single Male/Father | 13 (4.3%) | 3.77 |
| Single Female/Mother | 61 (20.3%) | 2.41 |
| Non-family | 76 (25.3%) | - |
| Total Households | 301 (100.0%) | 2.48 |
Household Size by Marriage Status in Wallace Ridge
Out of a total of 301 households in Wallace Ridge, 225 (74.8%) are family households, while 76 (25.3%) are nonfamily households. The most numerous type of family households are 4-person households, comprising 95, and the most common type of nonfamily households are 1-person households, comprising 76.
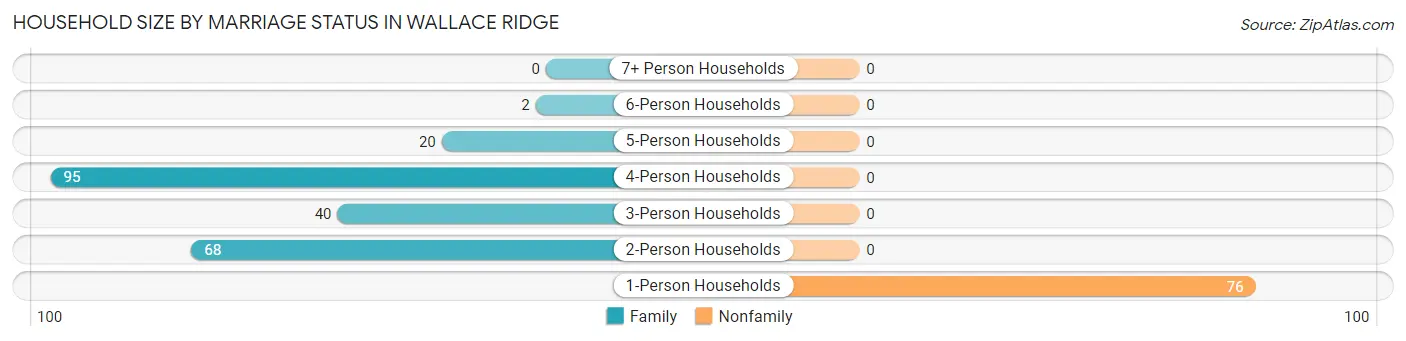
| Household Size | Family Households | Nonfamily Households |
| 1-Person Households | - | 76 (25.3%) |
| 2-Person Households | 68 (22.6%) | 0 (0.0%) |
| 3-Person Households | 40 (13.3%) | 0 (0.0%) |
| 4-Person Households | 95 (31.6%) | 0 (0.0%) |
| 5-Person Households | 20 (6.6%) | 0 (0.0%) |
| 6-Person Households | 2 (0.7%) | 0 (0.0%) |
| 7+ Person Households | 0 (0.0%) | 0 (0.0%) |
| Total | 225 (74.8%) | 76 (25.3%) |
Female Fertility in Wallace Ridge
Fertility by Age in Wallace Ridge
| Age Bracket | Women with Births | Births / 1,000 Women |
| 15 to 19 years | 0 (0.0%) | 0.0 |
| 20 to 34 years | 0 (0.0%) | 0.0 |
| 35 to 50 years | 0 (0.0%) | 0.0 |
| Total | 0 (0.0%) | 0.0 |
Fertility by Age by Marriage Status in Wallace Ridge
| Age Bracket | Married | Unmarried |
| 15 to 19 years | 0 (0.0%) | 0 (0.0%) |
| 20 to 34 years | 0 (0.0%) | 0 (0.0%) |
| 35 to 50 years | 0 (0.0%) | 0 (0.0%) |
| Total | 0 (0.0%) | 0 (0.0%) |
Fertility by Education in Wallace Ridge
| Educational Attainment | Women with Births | Births / 1,000 Women |
| Less than High School | 0 (0.0%) | 0.0 |
| High School Diploma | 0 (0.0%) | 0.0 |
| College or Associate's Degree | 0 (0.0%) | 0.0 |
| Bachelor's Degree | 0 (0.0%) | 0.0 |
| Graduate Degree | 0 (0.0%) | 0.0 |
| Total | 0 (0.0%) | 0.0 |
Fertility by Education by Marriage Status in Wallace Ridge
| Educational Attainment | Married | Unmarried |
| Less than High School | 0 (0.0%) | 0 (0.0%) |
| High School Diploma | 0 (0.0%) | 0 (0.0%) |
| College or Associate's Degree | 0 (0.0%) | 0 (0.0%) |
| Bachelor's Degree | 0 (0.0%) | 0 (0.0%) |
| Graduate Degree | 0 (0.0%) | 0 (0.0%) |
| Total | 0 (0.0%) | 0 (0.0%) |
Employment Characteristics in Wallace Ridge
Employment by Class of Employer in Wallace Ridge
Among the 377 employed individuals in Wallace Ridge, private company employees (238 | 63.1%), local government employees (76 | 20.2%), and self-employed (not incorporated) (30 | 8.0%) make up the most common classes of employment.
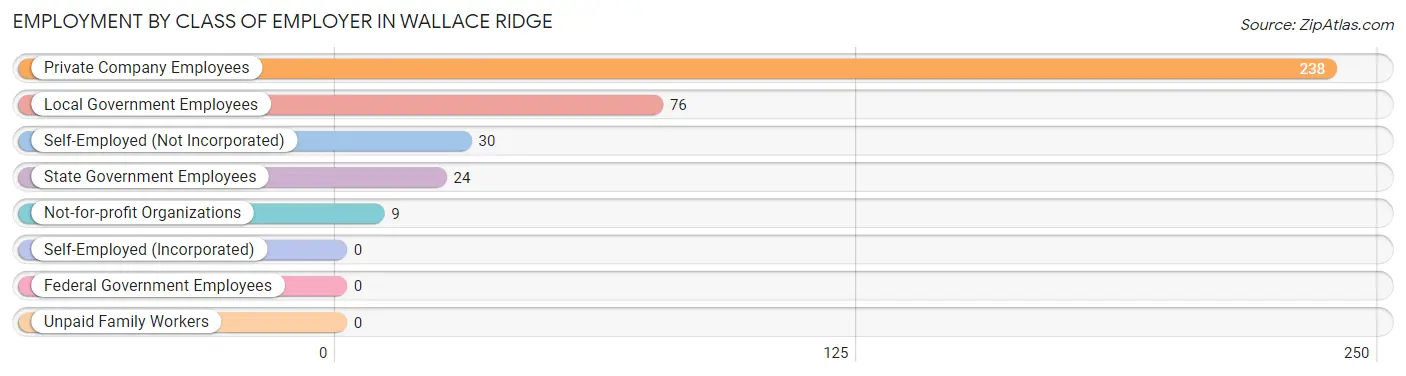
| Employer Class | # Employees | % Employees |
| Private Company Employees | 238 | 63.1% |
| Self-Employed (Incorporated) | 0 | 0.0% |
| Self-Employed (Not Incorporated) | 30 | 8.0% |
| Not-for-profit Organizations | 9 | 2.4% |
| Local Government Employees | 76 | 20.2% |
| State Government Employees | 24 | 6.4% |
| Federal Government Employees | 0 | 0.0% |
| Unpaid Family Workers | 0 | 0.0% |
| Total | 377 | 100.0% |
Employment Status by Age in Wallace Ridge
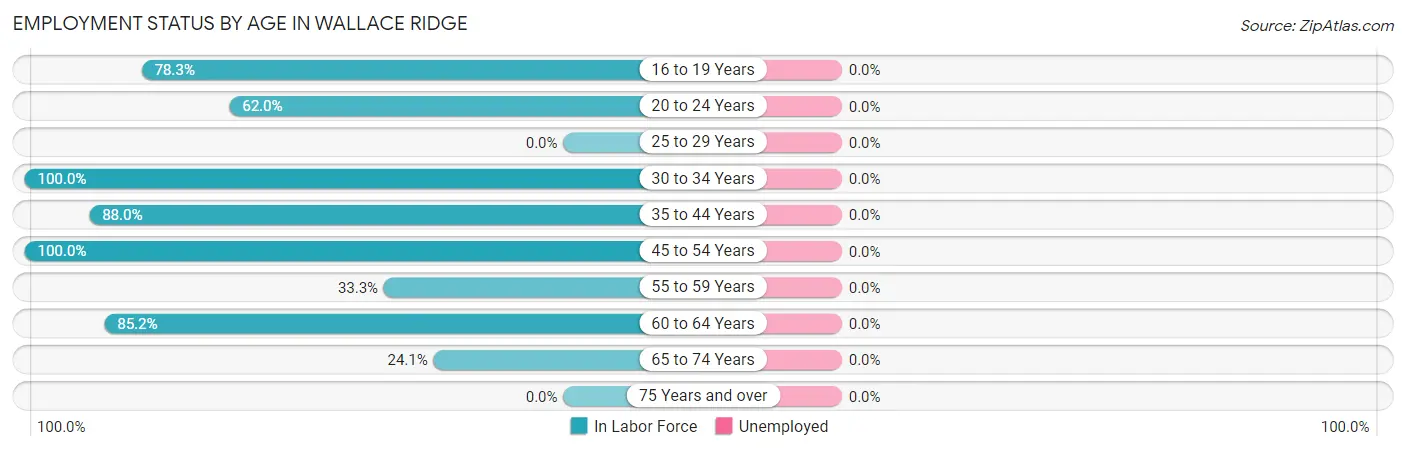
| Age Bracket | In Labor Force | Unemployed |
| 16 to 19 Years | 36 (78.3%) | 0 (0.0%) |
| 20 to 24 Years | 49 (62.0%) | 0 (0.0%) |
| 25 to 29 Years | 0 (0.0%) | 0 (0.0%) |
| 30 to 34 Years | 9 (100.0%) | 0 (0.0%) |
| 35 to 44 Years | 44 (88.0%) | 0 (0.0%) |
| 45 to 54 Years | 142 (100.0%) | 0 (0.0%) |
| 55 to 59 Years | 2 (33.3%) | 0 (0.0%) |
| 60 to 64 Years | 69 (85.2%) | 0 (0.0%) |
| 65 to 74 Years | 26 (24.1%) | 0 (0.0%) |
| 75 Years and over | 0 (0.0%) | 0 (0.0%) |
| Total | 377 (63.0%) | 0 (0.0%) |
Employment Status by Educational Attainment in Wallace Ridge
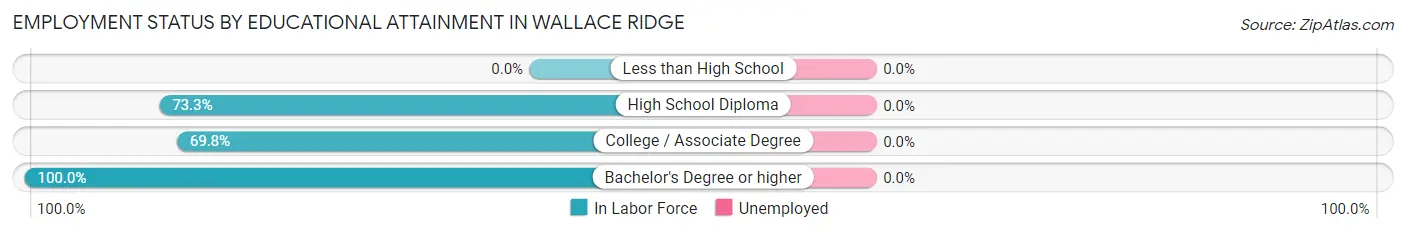
| Educational Attainment | In Labor Force | Unemployed |
| Less than High School | 0 (0.0%) | 0 (0.0%) |
| High School Diploma | 137 (73.3%) | 0 (0.0%) |
| College / Associate Degree | 60 (69.8%) | 0 (0.0%) |
| Bachelor's Degree or higher | 69 (100.0%) | 0 (0.0%) |
| Total | 266 (76.2%) | 0 (0.0%) |
Employment Occupations by Sex in Wallace Ridge
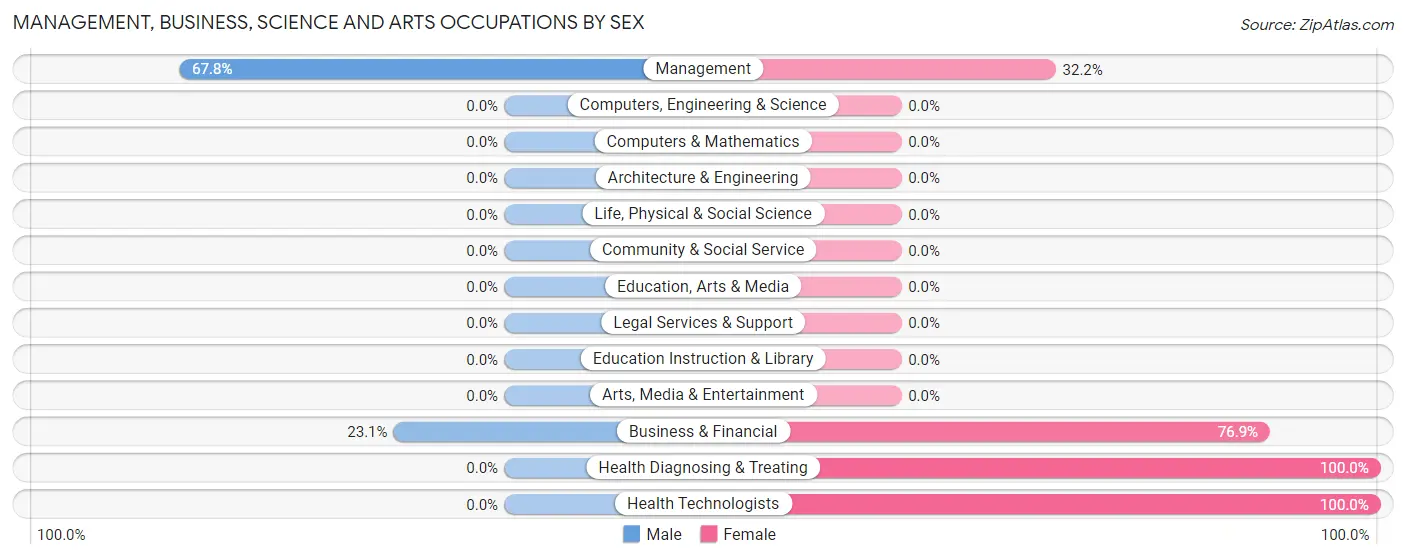
Management, Business, Science and Arts Occupations
The most common Management, Business, Science and Arts occupations in Wallace Ridge are Management (90 | 23.9%), Health Diagnosing & Treating (47 | 12.5%), Health Technologists (47 | 12.5%), and Business & Financial (26 | 6.9%).
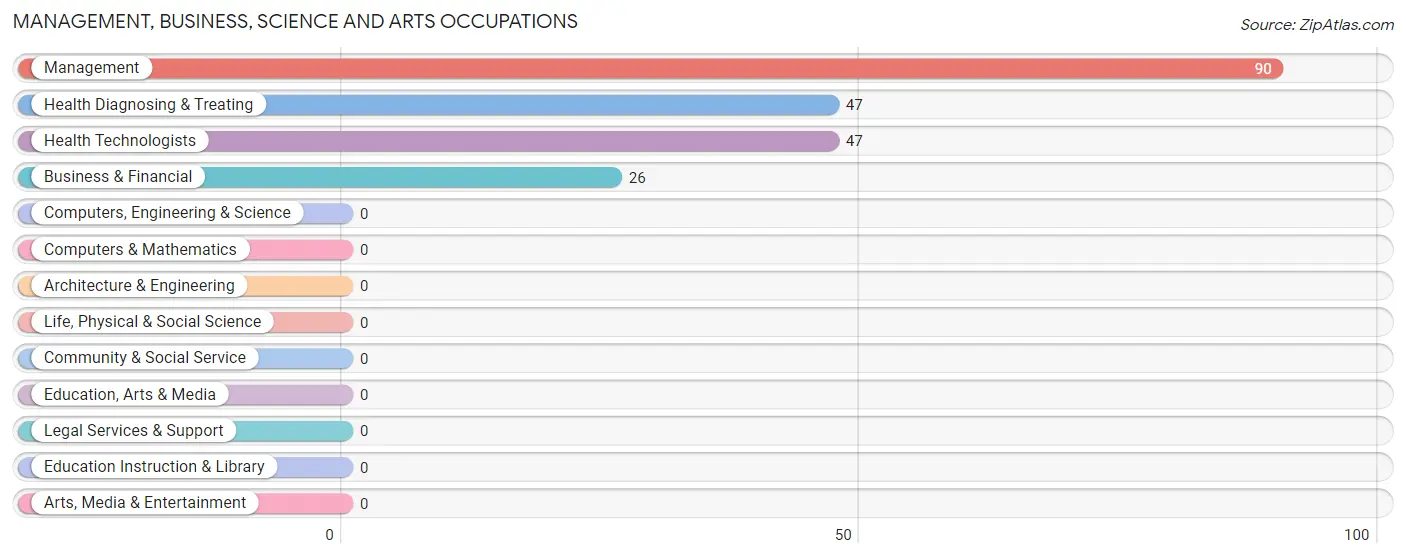
Management, Business, Science and Arts Occupations by Sex
Within the Management, Business, Science and Arts occupations in Wallace Ridge, the most male-oriented occupations are Management (67.8%), and Business & Financial (23.1%), while the most female-oriented occupations are Health Diagnosing & Treating (100.0%), Health Technologists (100.0%), and Business & Financial (76.9%).
| Occupation | Male | Female |
| Management | 61 (67.8%) | 29 (32.2%) |
| Business & Financial | 6 (23.1%) | 20 (76.9%) |
| Computers, Engineering & Science | 0 (0.0%) | 0 (0.0%) |
| Computers & Mathematics | 0 (0.0%) | 0 (0.0%) |
| Architecture & Engineering | 0 (0.0%) | 0 (0.0%) |
| Life, Physical & Social Science | 0 (0.0%) | 0 (0.0%) |
| Community & Social Service | 0 (0.0%) | 0 (0.0%) |
| Education, Arts & Media | 0 (0.0%) | 0 (0.0%) |
| Legal Services & Support | 0 (0.0%) | 0 (0.0%) |
| Education Instruction & Library | 0 (0.0%) | 0 (0.0%) |
| Arts, Media & Entertainment | 0 (0.0%) | 0 (0.0%) |
| Health Diagnosing & Treating | 0 (0.0%) | 47 (100.0%) |
| Health Technologists | 0 (0.0%) | 47 (100.0%) |
| Total (Category) | 67 (41.1%) | 96 (58.9%) |
| Total (Overall) | 184 (48.8%) | 193 (51.2%) |
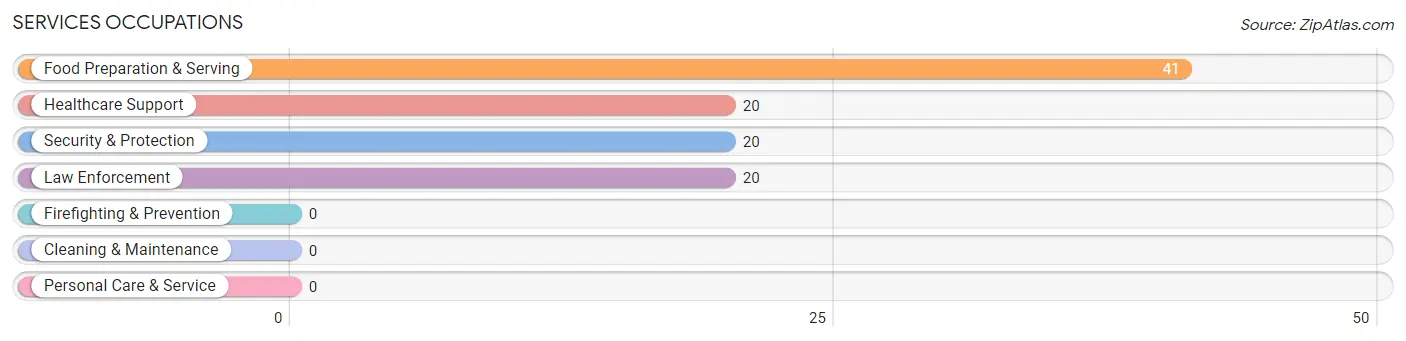
Services Occupations
The most common Services occupations in Wallace Ridge are Food Preparation & Serving (41 | 10.9%), Healthcare Support (20 | 5.3%), Security & Protection (20 | 5.3%), and Law Enforcement (20 | 5.3%).
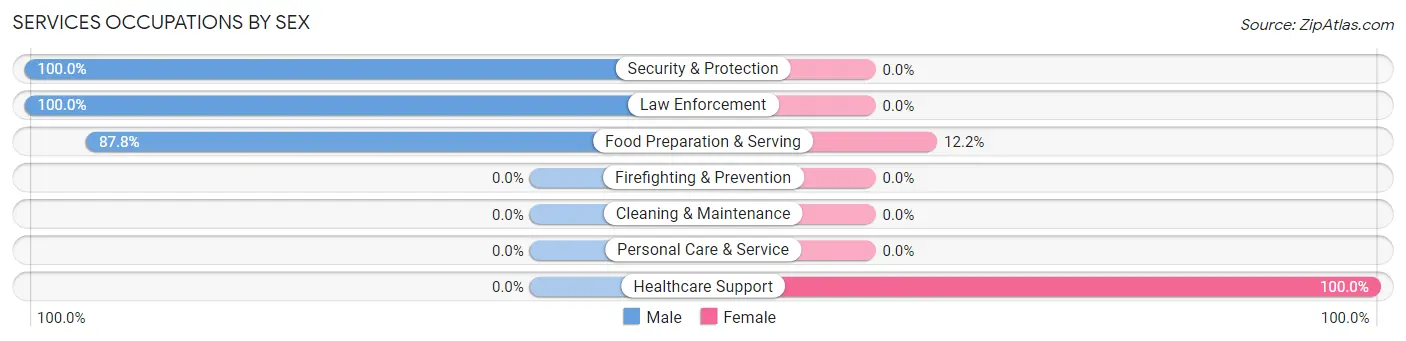
Services Occupations by Sex
Within the Services occupations in Wallace Ridge, the most male-oriented occupations are Security & Protection (100.0%), Law Enforcement (100.0%), and Food Preparation & Serving (87.8%), while the most female-oriented occupations are Healthcare Support (100.0%), and Food Preparation & Serving (12.2%).
| Occupation | Male | Female |
| Healthcare Support | 0 (0.0%) | 20 (100.0%) |
| Security & Protection | 20 (100.0%) | 0 (0.0%) |
| Firefighting & Prevention | 0 (0.0%) | 0 (0.0%) |
| Law Enforcement | 20 (100.0%) | 0 (0.0%) |
| Food Preparation & Serving | 36 (87.8%) | 5 (12.2%) |
| Cleaning & Maintenance | 0 (0.0%) | 0 (0.0%) |
| Personal Care & Service | 0 (0.0%) | 0 (0.0%) |
| Total (Category) | 56 (69.1%) | 25 (30.9%) |
| Total (Overall) | 184 (48.8%) | 193 (51.2%) |
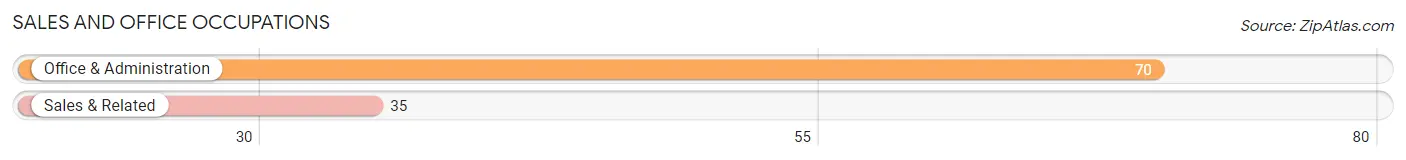
Sales and Office Occupations
The most common Sales and Office occupations in Wallace Ridge are Office & Administration (70 | 18.6%), and Sales & Related (35 | 9.3%).
Sales and Office Occupations by Sex

| Occupation | Male | Female |
| Sales & Related | 35 (100.0%) | 0 (0.0%) |
| Office & Administration | 0 (0.0%) | 70 (100.0%) |
| Total (Category) | 35 (33.3%) | 70 (66.7%) |
| Total (Overall) | 184 (48.8%) | 193 (51.2%) |
Natural Resources, Construction and Maintenance Occupations
The most common Natural Resources, Construction and Maintenance occupations in Wallace Ridge are Construction & Extraction (20 | 5.3%), and Installation, Maintenance & Repair (4 | 1.1%).
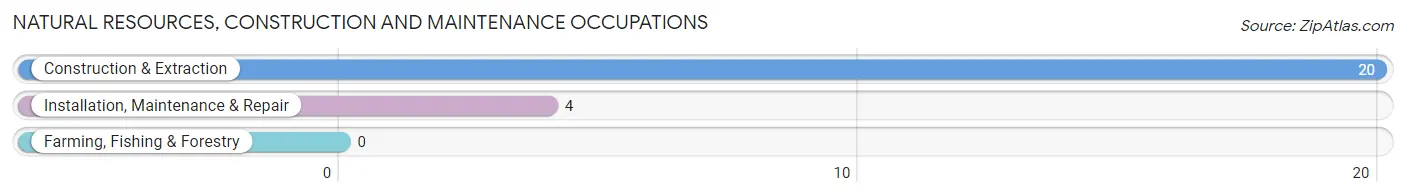
Natural Resources, Construction and Maintenance Occupations by Sex

| Occupation | Male | Female |
| Farming, Fishing & Forestry | 0 (0.0%) | 0 (0.0%) |
| Construction & Extraction | 20 (100.0%) | 0 (0.0%) |
| Installation, Maintenance & Repair | 4 (100.0%) | 0 (0.0%) |
| Total (Category) | 24 (100.0%) | 0 (0.0%) |
| Total (Overall) | 184 (48.8%) | 193 (51.2%) |
Production, Transportation and Moving Occupations
The most common Production, Transportation and Moving occupations in Wallace Ridge are Production (2 | 0.5%), and Material Moving (2 | 0.5%).
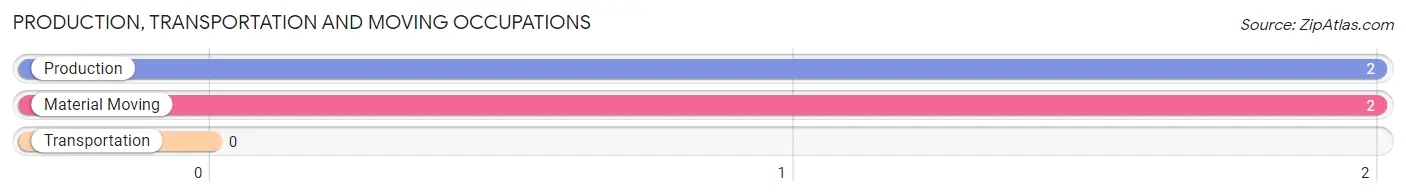
Production, Transportation and Moving Occupations by Sex
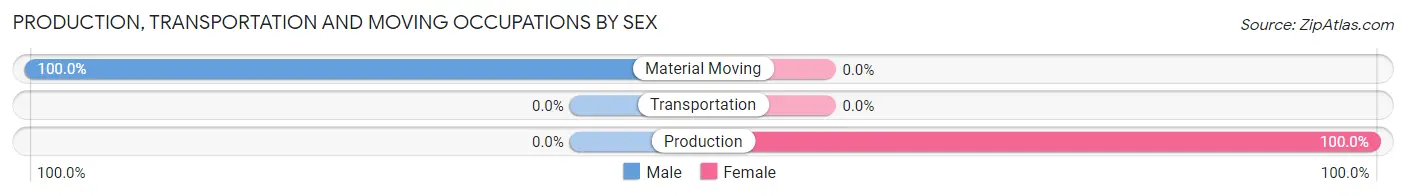
| Occupation | Male | Female |
| Production | 0 (0.0%) | 2 (100.0%) |
| Transportation | 0 (0.0%) | 0 (0.0%) |
| Material Moving | 2 (100.0%) | 0 (0.0%) |
| Total (Category) | 2 (50.0%) | 2 (50.0%) |
| Total (Overall) | 184 (48.8%) | 193 (51.2%) |
Employment Industries by Sex in Wallace Ridge
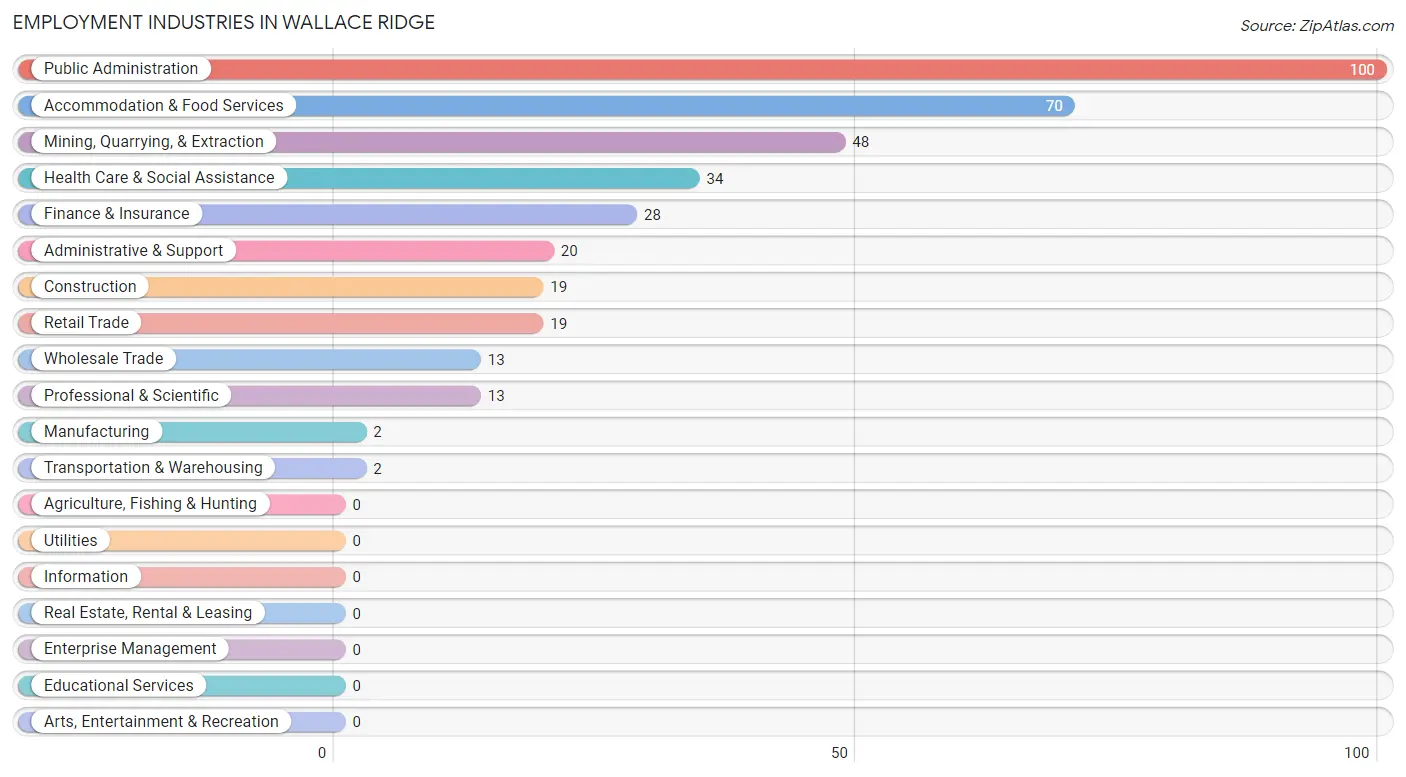
Employment Industries in Wallace Ridge
The major employment industries in Wallace Ridge include Public Administration (100 | 26.5%), Accommodation & Food Services (70 | 18.6%), Mining, Quarrying, & Extraction (48 | 12.7%), Health Care & Social Assistance (34 | 9.0%), and Finance & Insurance (28 | 7.4%).
Employment Industries by Sex in Wallace Ridge
The Wallace Ridge industries that see more men than women are Mining, Quarrying, & Extraction (100.0%), Construction (100.0%), and Wholesale Trade (100.0%), whereas the industries that tend to have a higher number of women are Manufacturing (100.0%), Administrative & Support (100.0%), and Health Care & Social Assistance (100.0%).
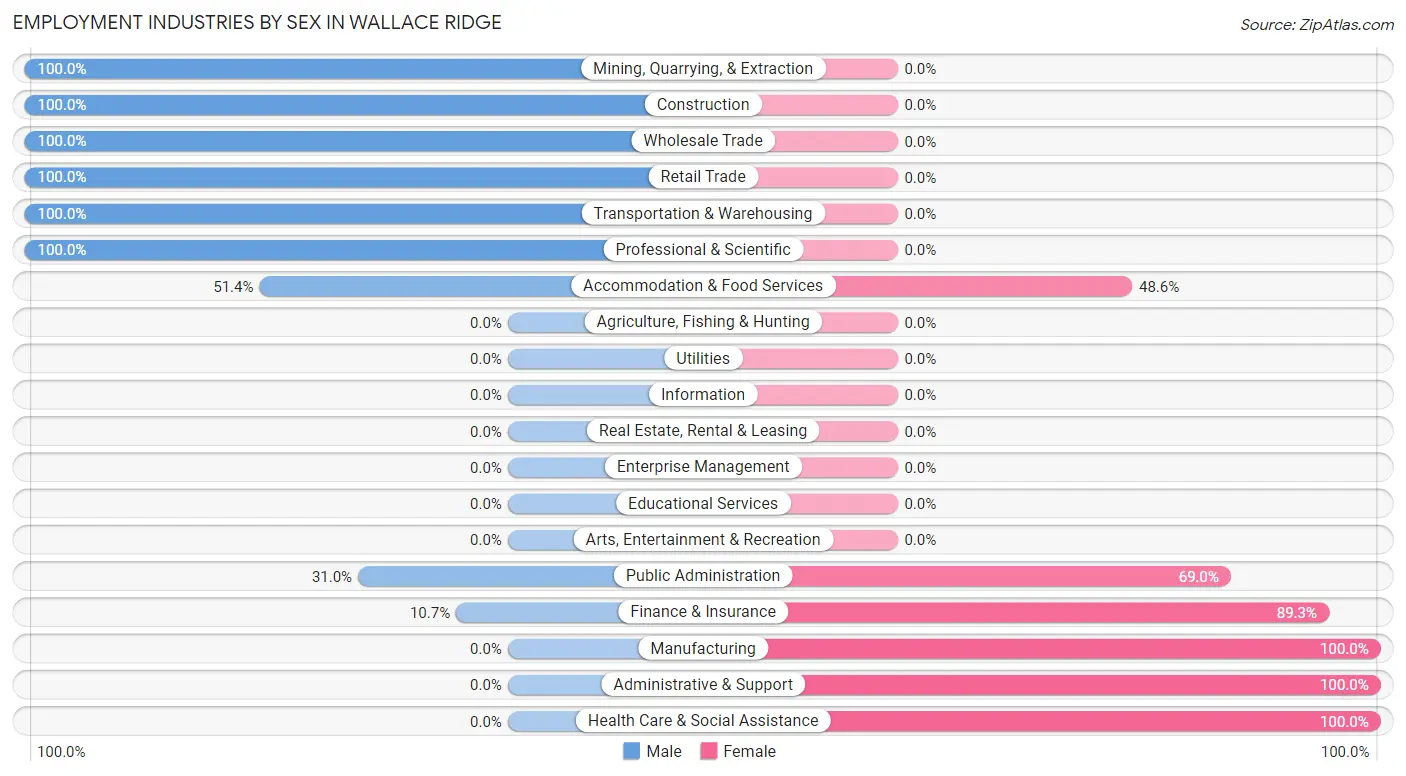
| Industry | Male | Female |
| Agriculture, Fishing & Hunting | 0 (0.0%) | 0 (0.0%) |
| Mining, Quarrying, & Extraction | 48 (100.0%) | 0 (0.0%) |
| Construction | 19 (100.0%) | 0 (0.0%) |
| Manufacturing | 0 (0.0%) | 2 (100.0%) |
| Wholesale Trade | 13 (100.0%) | 0 (0.0%) |
| Retail Trade | 19 (100.0%) | 0 (0.0%) |
| Transportation & Warehousing | 2 (100.0%) | 0 (0.0%) |
| Utilities | 0 (0.0%) | 0 (0.0%) |
| Information | 0 (0.0%) | 0 (0.0%) |
| Finance & Insurance | 3 (10.7%) | 25 (89.3%) |
| Real Estate, Rental & Leasing | 0 (0.0%) | 0 (0.0%) |
| Professional & Scientific | 13 (100.0%) | 0 (0.0%) |
| Enterprise Management | 0 (0.0%) | 0 (0.0%) |
| Administrative & Support | 0 (0.0%) | 20 (100.0%) |
| Educational Services | 0 (0.0%) | 0 (0.0%) |
| Health Care & Social Assistance | 0 (0.0%) | 34 (100.0%) |
| Arts, Entertainment & Recreation | 0 (0.0%) | 0 (0.0%) |
| Accommodation & Food Services | 36 (51.4%) | 34 (48.6%) |
| Public Administration | 31 (31.0%) | 69 (69.0%) |
| Total | 184 (48.8%) | 193 (51.2%) |
Education in Wallace Ridge
School Enrollment in Wallace Ridge
The most common levels of schooling among the 195 students in Wallace Ridge are high school (68 | 34.9%), elementary school (48 | 24.6%), and middle school (35 | 17.9%).
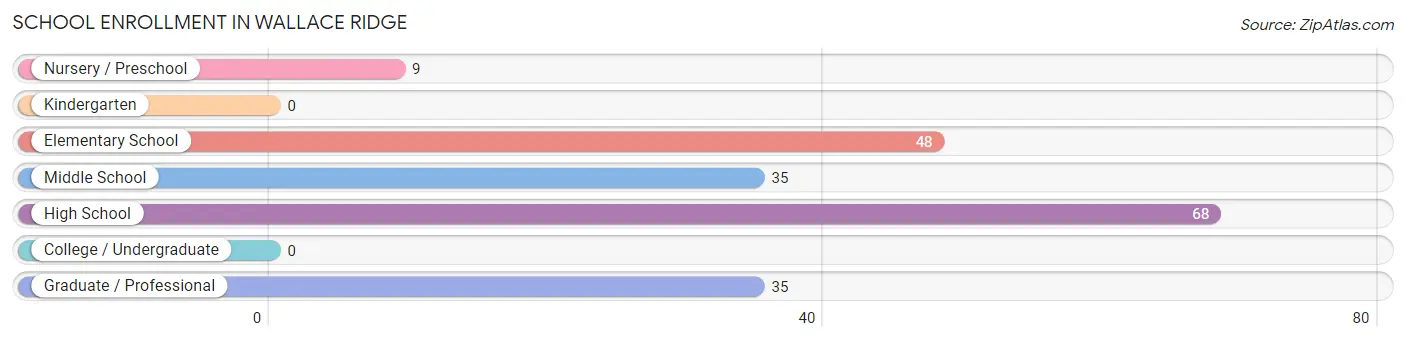
| School Level | # Students | % Students |
| Nursery / Preschool | 9 | 4.6% |
| Kindergarten | 0 | 0.0% |
| Elementary School | 48 | 24.6% |
| Middle School | 35 | 17.9% |
| High School | 68 | 34.9% |
| College / Undergraduate | 0 | 0.0% |
| Graduate / Professional | 35 | 17.9% |
| Total | 195 | 100.0% |
School Enrollment by Age by Funding Source in Wallace Ridge
Out of a total of 195 students who are enrolled in schools in Wallace Ridge, 35 (17.9%) attend a private institution, while the remaining 160 (82.1%) are enrolled in public schools. The age group of 20 to 24 year olds has the highest likelihood of being enrolled in private schools, with 15 (100.0% in the age bracket) enrolled. Conversely, the age group of 3 to 4 year olds has the lowest likelihood of being enrolled in a private school, with 9 (100.0% in the age bracket) attending a public institution.
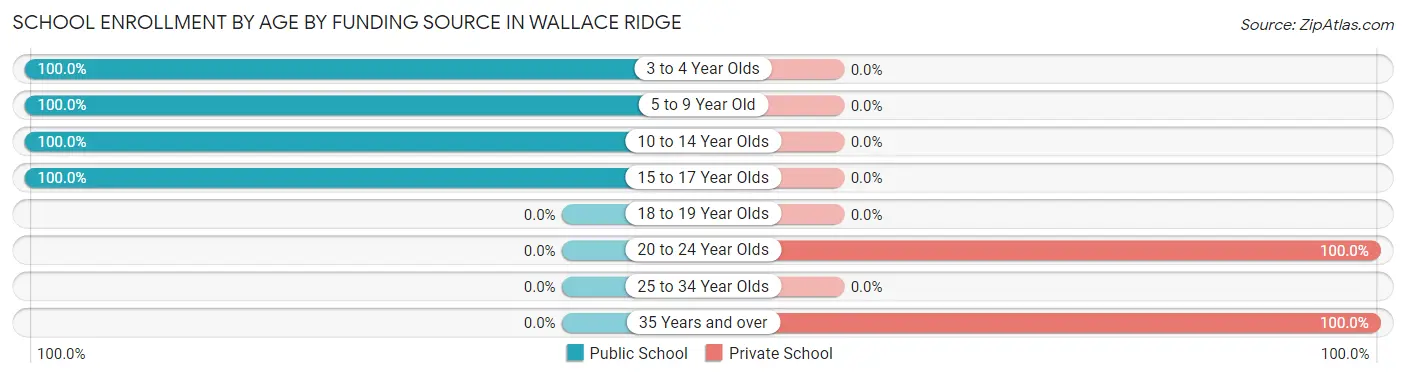
| Age Bracket | Public School | Private School |
| 3 to 4 Year Olds | 9 (100.0%) | 0 (0.0%) |
| 5 to 9 Year Old | 48 (100.0%) | 0 (0.0%) |
| 10 to 14 Year Olds | 35 (100.0%) | 0 (0.0%) |
| 15 to 17 Year Olds | 68 (100.0%) | 0 (0.0%) |
| 18 to 19 Year Olds | 0 (0.0%) | 0 (0.0%) |
| 20 to 24 Year Olds | 0 (0.0%) | 15 (100.0%) |
| 25 to 34 Year Olds | 0 (0.0%) | 0 (0.0%) |
| 35 Years and over | 0 (0.0%) | 20 (100.0%) |
| Total | 160 (82.1%) | 35 (17.9%) |
Educational Attainment by Field of Study in Wallace Ridge
Science & technology (47 | 49.5%), social sciences (20 | 21.0%), business (13 | 13.7%), arts & humanities (9 | 9.5%), and physical & health sciences (6 | 6.3%) are the most common fields of study among 95 individuals in Wallace Ridge who have obtained a bachelor's degree or higher.
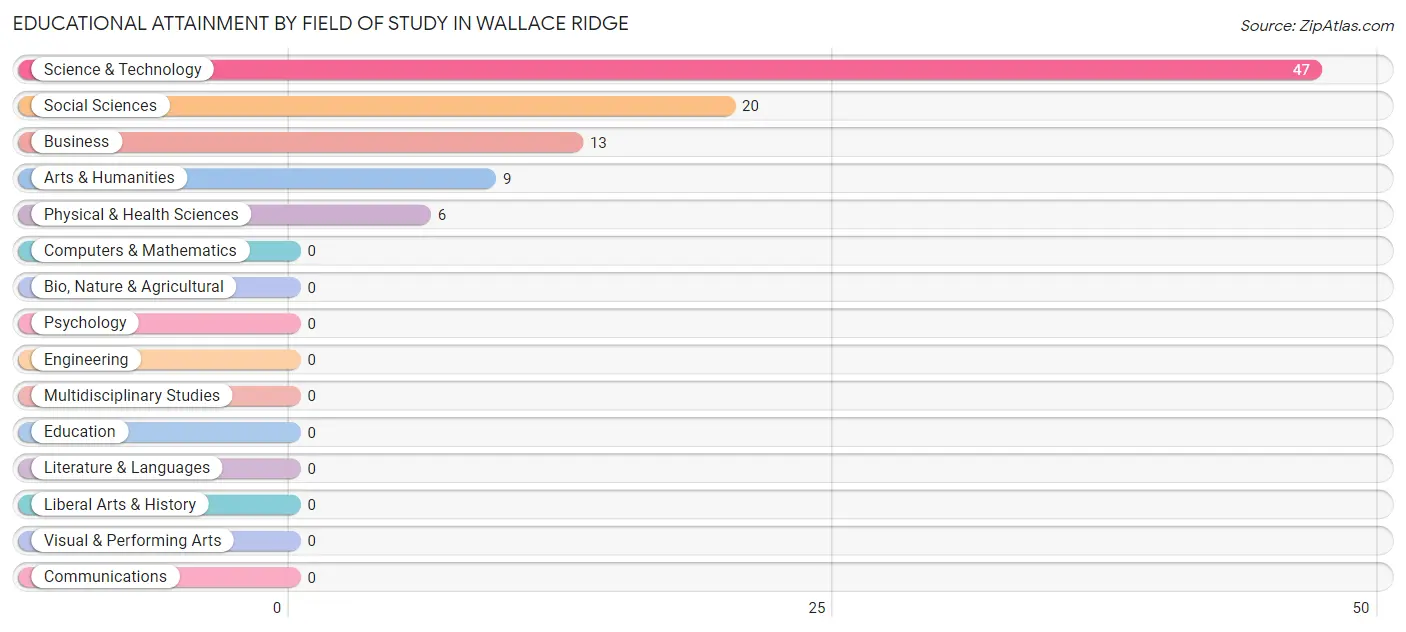
| Field of Study | # Graduates | % Graduates |
| Computers & Mathematics | 0 | 0.0% |
| Bio, Nature & Agricultural | 0 | 0.0% |
| Physical & Health Sciences | 6 | 6.3% |
| Psychology | 0 | 0.0% |
| Social Sciences | 20 | 21.0% |
| Engineering | 0 | 0.0% |
| Multidisciplinary Studies | 0 | 0.0% |
| Science & Technology | 47 | 49.5% |
| Business | 13 | 13.7% |
| Education | 0 | 0.0% |
| Literature & Languages | 0 | 0.0% |
| Liberal Arts & History | 0 | 0.0% |
| Visual & Performing Arts | 0 | 0.0% |
| Communications | 0 | 0.0% |
| Arts & Humanities | 9 | 9.5% |
| Total | 95 | 100.0% |
Transportation & Commute in Wallace Ridge
Vehicle Availability by Sex in Wallace Ridge
The most prevalent vehicle ownership categories in Wallace Ridge are males with 3 vehicles (123, accounting for 66.8%) and females with 3 vehicles (88, making up 63.7%).
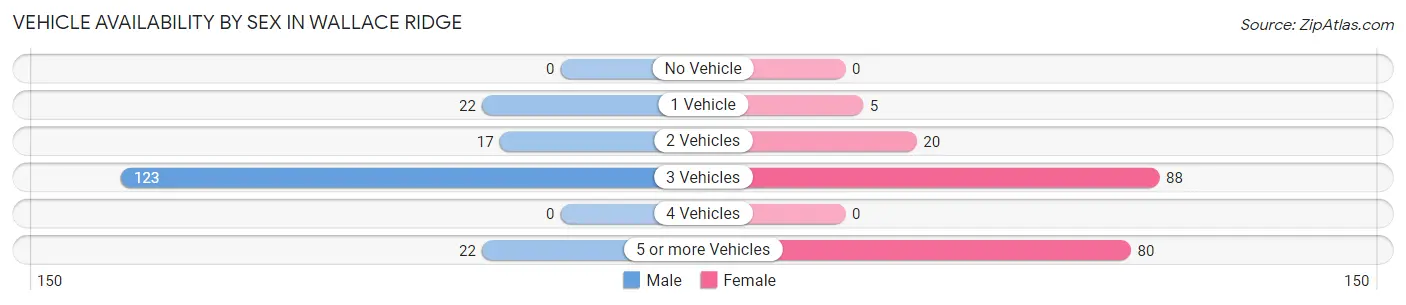
| Vehicles Available | Male | Female |
| No Vehicle | 0 (0.0%) | 0 (0.0%) |
| 1 Vehicle | 22 (12.0%) | 5 (2.6%) |
| 2 Vehicles | 17 (9.2%) | 20 (10.4%) |
| 3 Vehicles | 123 (66.8%) | 88 (45.6%) |
| 4 Vehicles | 0 (0.0%) | 0 (0.0%) |
| 5 or more Vehicles | 22 (12.0%) | 80 (41.4%) |
| Total | 184 (100.0%) | 193 (100.0%) |
Commute Time in Wallace Ridge
The most frequently occuring commute durations in Wallace Ridge are 30 to 34 minutes (139 commuters, 36.9%), 10 to 14 minutes (83 commuters, 22.0%), and 5 to 9 minutes (49 commuters, 13.0%).
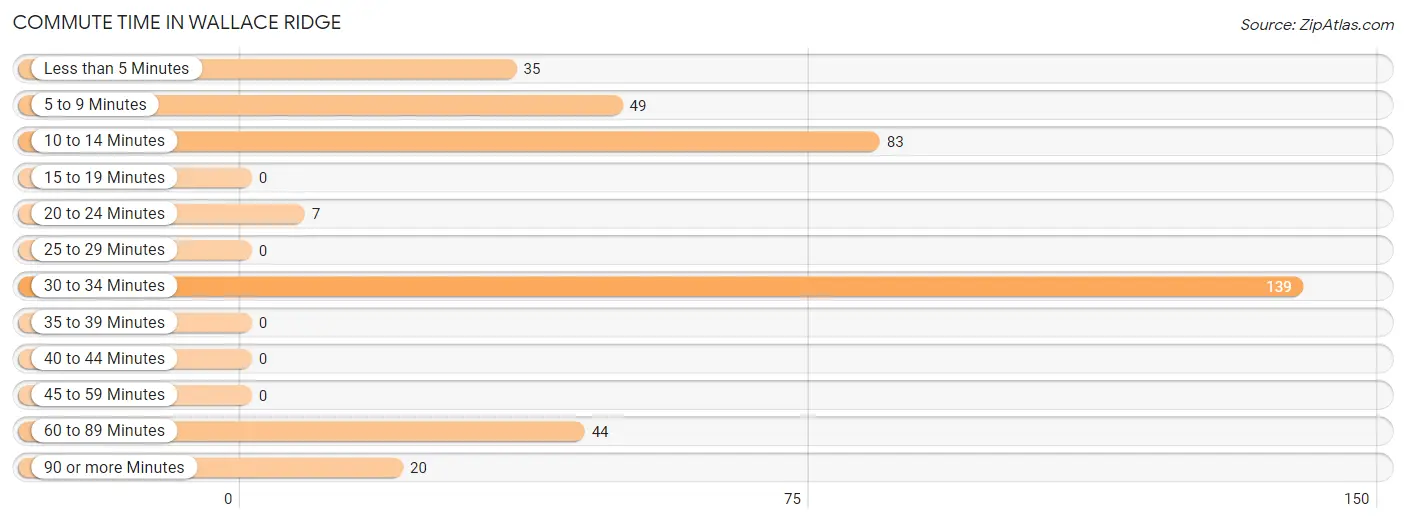
| Commute Time | # Commuters | % Commuters |
| Less than 5 Minutes | 35 | 9.3% |
| 5 to 9 Minutes | 49 | 13.0% |
| 10 to 14 Minutes | 83 | 22.0% |
| 15 to 19 Minutes | 0 | 0.0% |
| 20 to 24 Minutes | 7 | 1.9% |
| 25 to 29 Minutes | 0 | 0.0% |
| 30 to 34 Minutes | 139 | 36.9% |
| 35 to 39 Minutes | 0 | 0.0% |
| 40 to 44 Minutes | 0 | 0.0% |
| 45 to 59 Minutes | 0 | 0.0% |
| 60 to 89 Minutes | 44 | 11.7% |
| 90 or more Minutes | 20 | 5.3% |
Commute Time by Sex in Wallace Ridge
The most common commute times in Wallace Ridge are 30 to 34 minutes (60 commuters, 32.6%) for males and 30 to 34 minutes (79 commuters, 40.9%) for females.
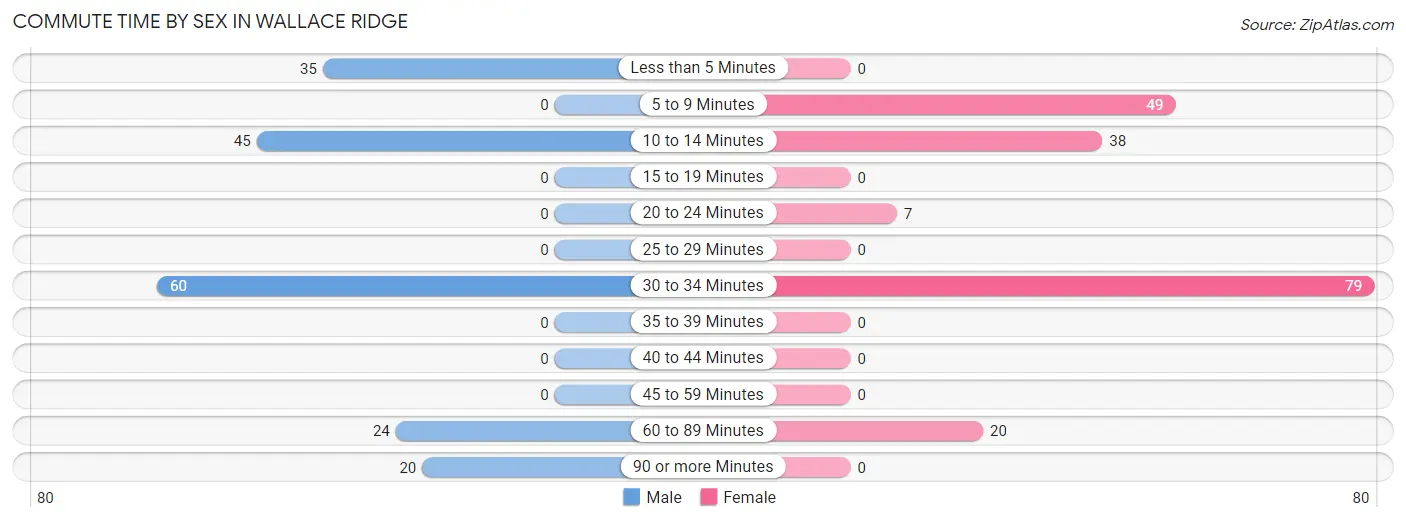
| Commute Time | Male | Female |
| Less than 5 Minutes | 35 (19.0%) | 0 (0.0%) |
| 5 to 9 Minutes | 0 (0.0%) | 49 (25.4%) |
| 10 to 14 Minutes | 45 (24.5%) | 38 (19.7%) |
| 15 to 19 Minutes | 0 (0.0%) | 0 (0.0%) |
| 20 to 24 Minutes | 0 (0.0%) | 7 (3.6%) |
| 25 to 29 Minutes | 0 (0.0%) | 0 (0.0%) |
| 30 to 34 Minutes | 60 (32.6%) | 79 (40.9%) |
| 35 to 39 Minutes | 0 (0.0%) | 0 (0.0%) |
| 40 to 44 Minutes | 0 (0.0%) | 0 (0.0%) |
| 45 to 59 Minutes | 0 (0.0%) | 0 (0.0%) |
| 60 to 89 Minutes | 24 (13.0%) | 20 (10.4%) |
| 90 or more Minutes | 20 (10.9%) | 0 (0.0%) |
Time of Departure to Work by Sex in Wallace Ridge
The most frequent times of departure to work in Wallace Ridge are 5:30 AM to 5:59 AM (42, 22.8%) for males and 7:00 AM to 7:29 AM (68, 35.2%) for females.
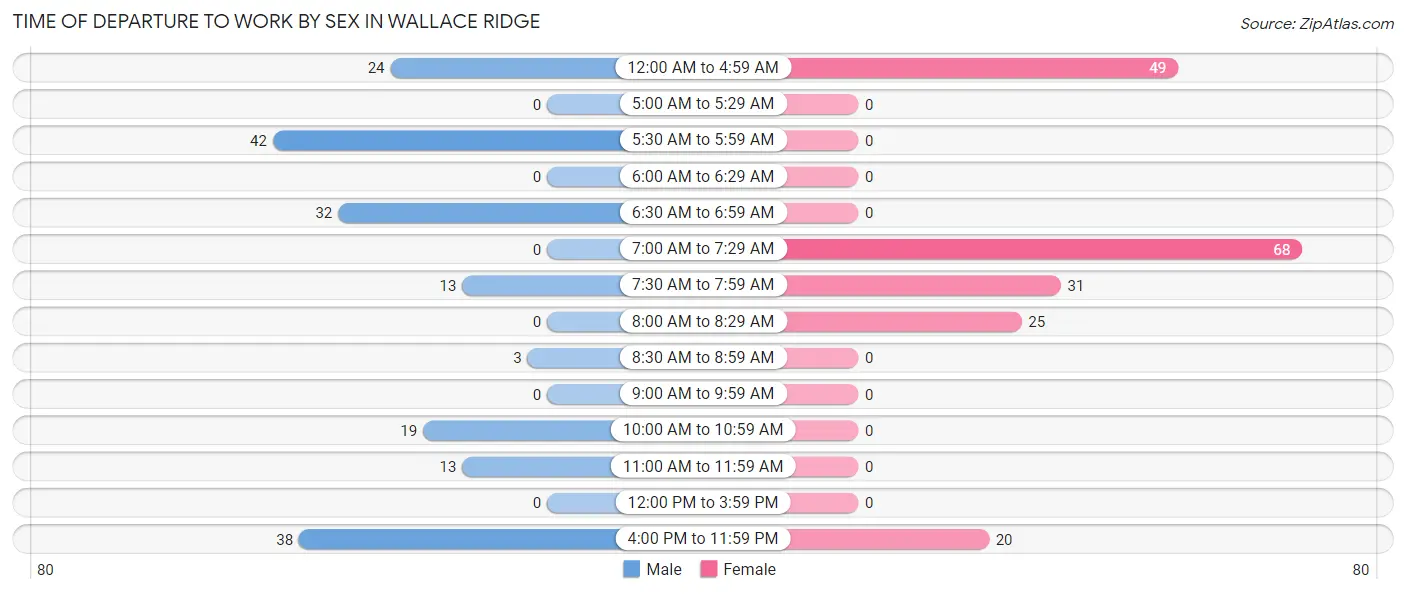
| Time of Departure | Male | Female |
| 12:00 AM to 4:59 AM | 24 (13.0%) | 49 (25.4%) |
| 5:00 AM to 5:29 AM | 0 (0.0%) | 0 (0.0%) |
| 5:30 AM to 5:59 AM | 42 (22.8%) | 0 (0.0%) |
| 6:00 AM to 6:29 AM | 0 (0.0%) | 0 (0.0%) |
| 6:30 AM to 6:59 AM | 32 (17.4%) | 0 (0.0%) |
| 7:00 AM to 7:29 AM | 0 (0.0%) | 68 (35.2%) |
| 7:30 AM to 7:59 AM | 13 (7.1%) | 31 (16.1%) |
| 8:00 AM to 8:29 AM | 0 (0.0%) | 25 (13.0%) |
| 8:30 AM to 8:59 AM | 3 (1.6%) | 0 (0.0%) |
| 9:00 AM to 9:59 AM | 0 (0.0%) | 0 (0.0%) |
| 10:00 AM to 10:59 AM | 19 (10.3%) | 0 (0.0%) |
| 11:00 AM to 11:59 AM | 13 (7.1%) | 0 (0.0%) |
| 12:00 PM to 3:59 PM | 0 (0.0%) | 0 (0.0%) |
| 4:00 PM to 11:59 PM | 38 (20.6%) | 20 (10.4%) |
| Total | 184 (100.0%) | 193 (100.0%) |
Housing Occupancy in Wallace Ridge
Occupancy by Ownership in Wallace Ridge
Of the total 301 dwellings in Wallace Ridge, owner-occupied units account for 224 (74.4%), while renter-occupied units make up 77 (25.6%).
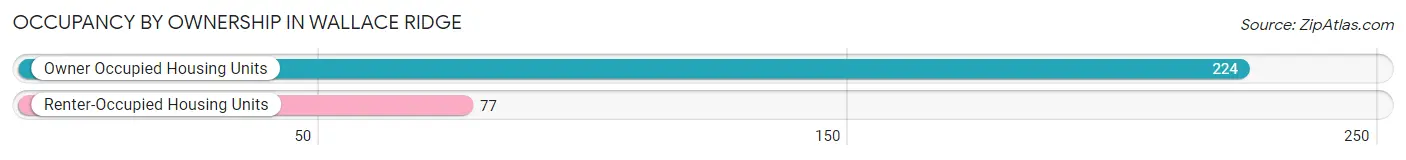
| Occupancy | # Housing Units | % Housing Units |
| Owner Occupied Housing Units | 224 | 74.4% |
| Renter-Occupied Housing Units | 77 | 25.6% |
| Total Occupied Housing Units | 301 | 100.0% |
Occupancy by Household Size in Wallace Ridge
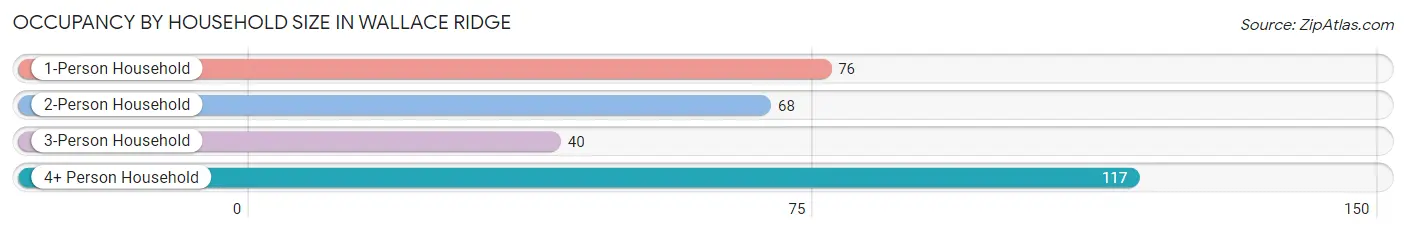
| Household Size | # Housing Units | % Housing Units |
| 1-Person Household | 76 | 25.3% |
| 2-Person Household | 68 | 22.6% |
| 3-Person Household | 40 | 13.3% |
| 4+ Person Household | 117 | 38.9% |
| Total Housing Units | 301 | 100.0% |
Occupancy by Ownership by Household Size in Wallace Ridge
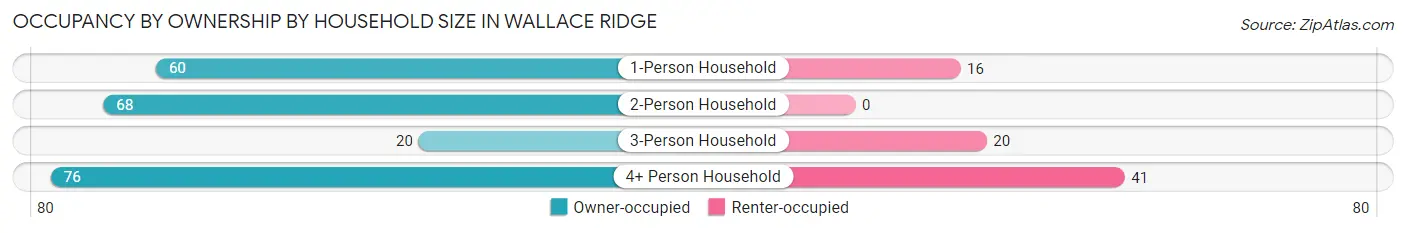
| Household Size | Owner-occupied | Renter-occupied |
| 1-Person Household | 60 (78.9%) | 16 (21.0%) |
| 2-Person Household | 68 (100.0%) | 0 (0.0%) |
| 3-Person Household | 20 (50.0%) | 20 (50.0%) |
| 4+ Person Household | 76 (65.0%) | 41 (35.0%) |
| Total Housing Units | 224 (74.4%) | 77 (25.6%) |
Occupancy by Educational Attainment in Wallace Ridge
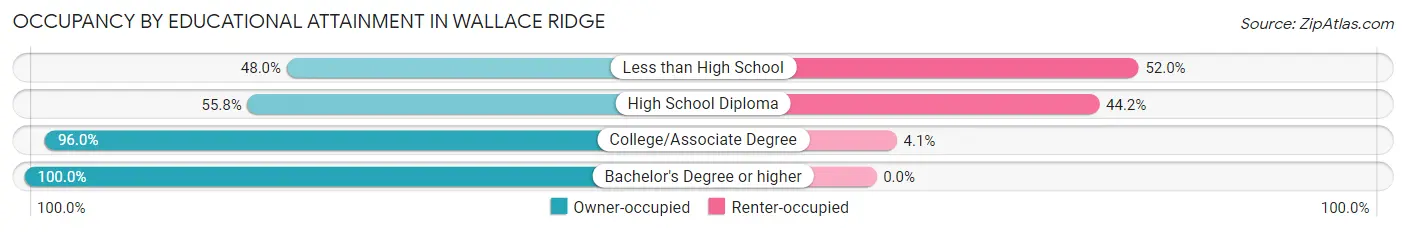
| Household Size | Owner-occupied | Renter-occupied |
| Less than High School | 12 (48.0%) | 13 (52.0%) |
| High School Diploma | 77 (55.8%) | 61 (44.2%) |
| College/Associate Degree | 71 (96.0%) | 3 (4.1%) |
| Bachelor's Degree or higher | 64 (100.0%) | 0 (0.0%) |
Occupancy by Age of Householder in Wallace Ridge
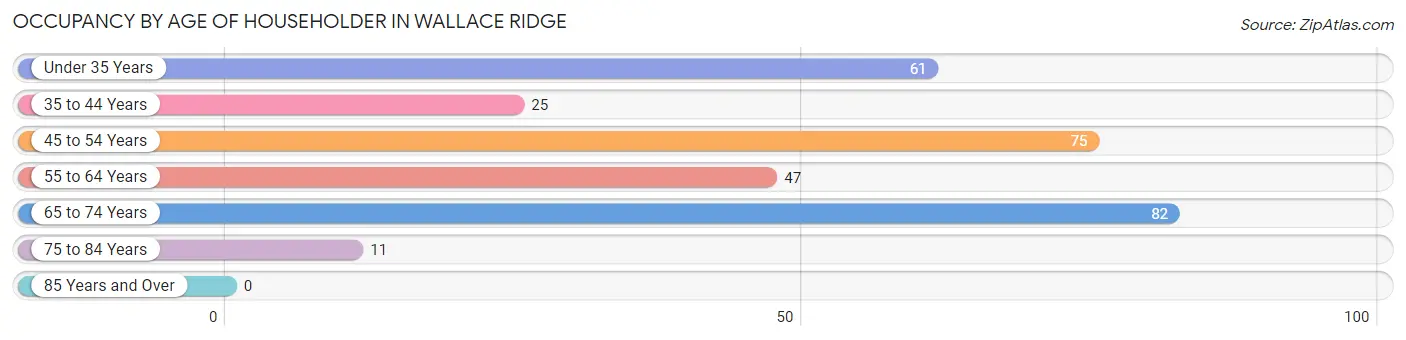
| Age Bracket | # Households | % Households |
| Under 35 Years | 61 | 20.3% |
| 35 to 44 Years | 25 | 8.3% |
| 45 to 54 Years | 75 | 24.9% |
| 55 to 64 Years | 47 | 15.6% |
| 65 to 74 Years | 82 | 27.2% |
| 75 to 84 Years | 11 | 3.6% |
| 85 Years and Over | 0 | 0.0% |
| Total | 301 | 100.0% |
Housing Finances in Wallace Ridge
Median Income by Occupancy in Wallace Ridge
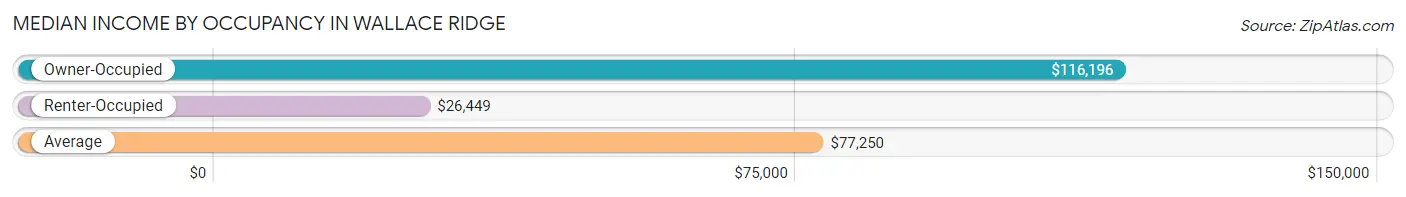
| Occupancy Type | # Households | Median Income |
| Owner-Occupied | 224 (74.4%) | $116,196 |
| Renter-Occupied | 77 (25.6%) | $26,449 |
| Average | 301 (100.0%) | $77,250 |
Occupancy by Householder Income Bracket in Wallace Ridge

| Income Bracket | Owner-occupied | Renter-occupied |
| Less than $5,000 | 7 (3.1%) | 0 (0.0%) |
| $5,000 to $9,999 | 0 (0.0%) | 0 (0.0%) |
| $10,000 to $14,999 | 5 (2.2%) | 6 (7.8%) |
| $15,000 to $19,999 | 37 (16.5%) | 0 (0.0%) |
| $20,000 to $24,999 | 0 (0.0%) | 7 (9.1%) |
| $25,000 to $34,999 | 0 (0.0%) | 64 (83.1%) |
| $35,000 to $49,999 | 0 (0.0%) | 0 (0.0%) |
| $50,000 to $74,999 | 11 (4.9%) | 0 (0.0%) |
| $75,000 to $99,999 | 41 (18.3%) | 0 (0.0%) |
| $100,000 to $149,999 | 79 (35.3%) | 0 (0.0%) |
| $150,000 or more | 44 (19.6%) | 0 (0.0%) |
| Total | 224 (100.0%) | 77 (100.0%) |
Monthly Housing Cost Tiers in Wallace Ridge
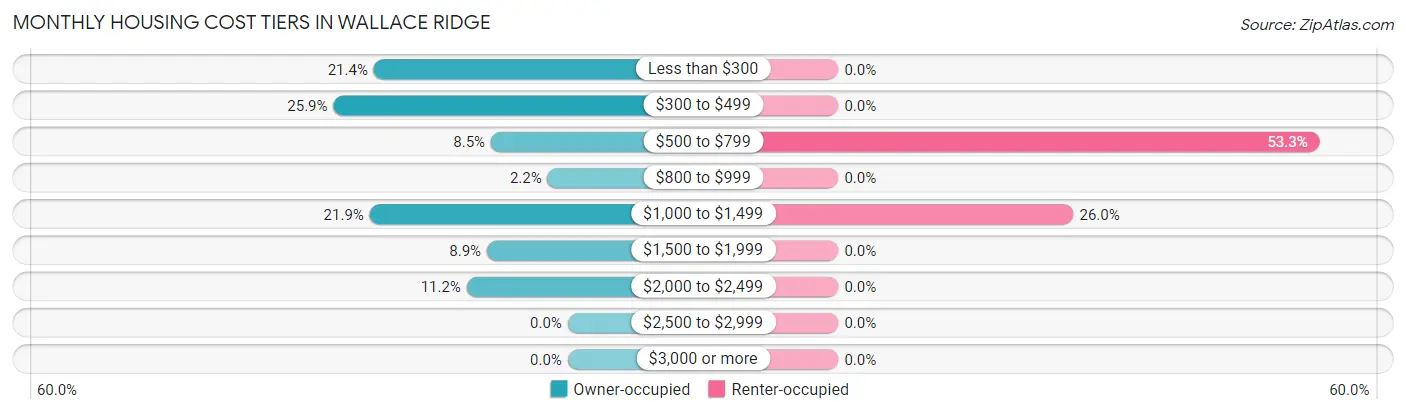
| Monthly Cost | Owner-occupied | Renter-occupied |
| Less than $300 | 48 (21.4%) | 0 (0.0%) |
| $300 to $499 | 58 (25.9%) | 0 (0.0%) |
| $500 to $799 | 19 (8.5%) | 41 (53.2%) |
| $800 to $999 | 5 (2.2%) | 0 (0.0%) |
| $1,000 to $1,499 | 49 (21.9%) | 20 (26.0%) |
| $1,500 to $1,999 | 20 (8.9%) | 0 (0.0%) |
| $2,000 to $2,499 | 25 (11.2%) | 0 (0.0%) |
| $2,500 to $2,999 | 0 (0.0%) | 0 (0.0%) |
| $3,000 or more | 0 (0.0%) | 0 (0.0%) |
| Total | 224 (100.0%) | 77 (100.0%) |
Physical Housing Characteristics in Wallace Ridge
Housing Structures in Wallace Ridge
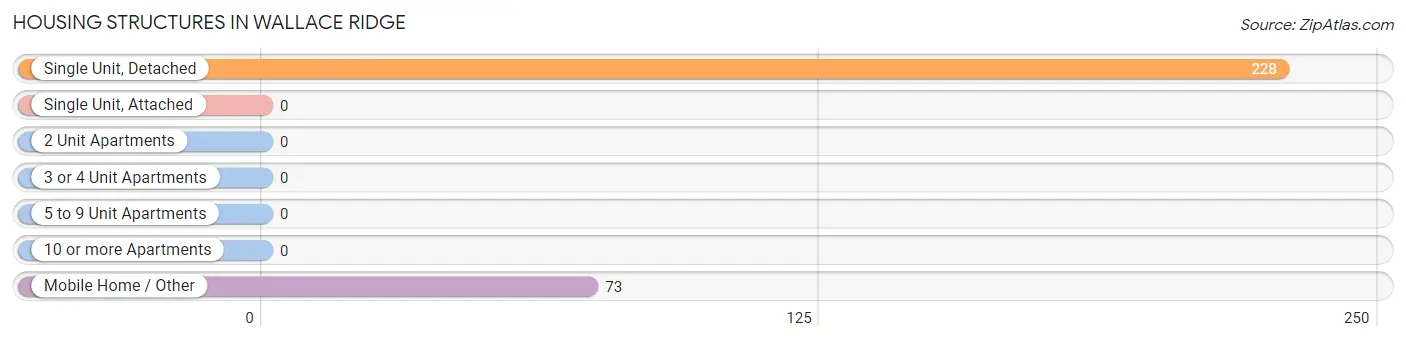
| Structure Type | # Housing Units | % Housing Units |
| Single Unit, Detached | 228 | 75.7% |
| Single Unit, Attached | 0 | 0.0% |
| 2 Unit Apartments | 0 | 0.0% |
| 3 or 4 Unit Apartments | 0 | 0.0% |
| 5 to 9 Unit Apartments | 0 | 0.0% |
| 10 or more Apartments | 0 | 0.0% |
| Mobile Home / Other | 73 | 24.2% |
| Total | 301 | 100.0% |
Housing Structures by Occupancy in Wallace Ridge
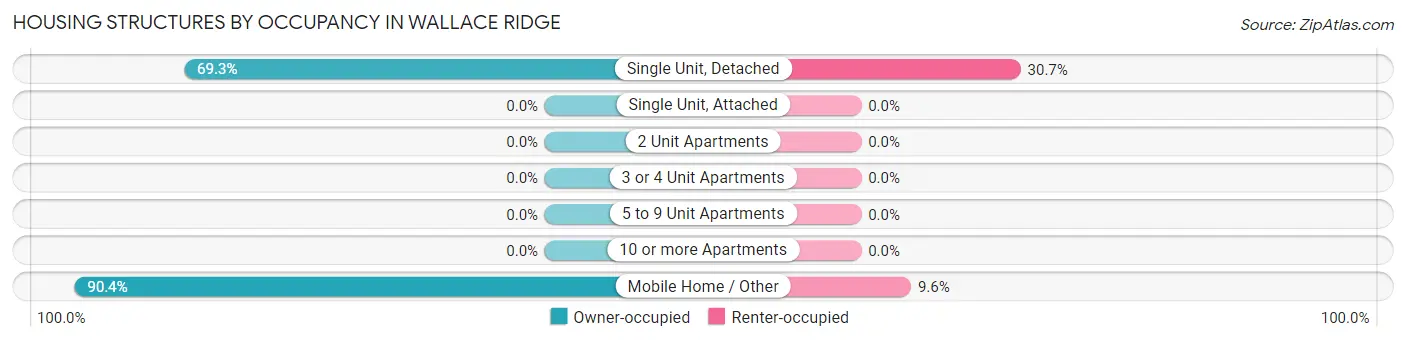
| Structure Type | Owner-occupied | Renter-occupied |
| Single Unit, Detached | 158 (69.3%) | 70 (30.7%) |
| Single Unit, Attached | 0 (0.0%) | 0 (0.0%) |
| 2 Unit Apartments | 0 (0.0%) | 0 (0.0%) |
| 3 or 4 Unit Apartments | 0 (0.0%) | 0 (0.0%) |
| 5 to 9 Unit Apartments | 0 (0.0%) | 0 (0.0%) |
| 10 or more Apartments | 0 (0.0%) | 0 (0.0%) |
| Mobile Home / Other | 66 (90.4%) | 7 (9.6%) |
| Total | 224 (74.4%) | 77 (25.6%) |
Housing Structures by Number of Rooms in Wallace Ridge
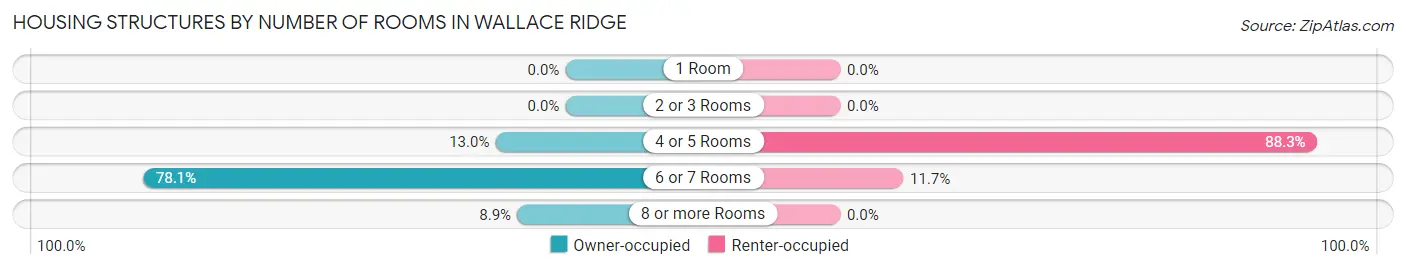
| Number of Rooms | Owner-occupied | Renter-occupied |
| 1 Room | 0 (0.0%) | 0 (0.0%) |
| 2 or 3 Rooms | 0 (0.0%) | 0 (0.0%) |
| 4 or 5 Rooms | 29 (13.0%) | 68 (88.3%) |
| 6 or 7 Rooms | 175 (78.1%) | 9 (11.7%) |
| 8 or more Rooms | 20 (8.9%) | 0 (0.0%) |
| Total | 224 (100.0%) | 77 (100.0%) |
Housing Structure by Heating Type in Wallace Ridge
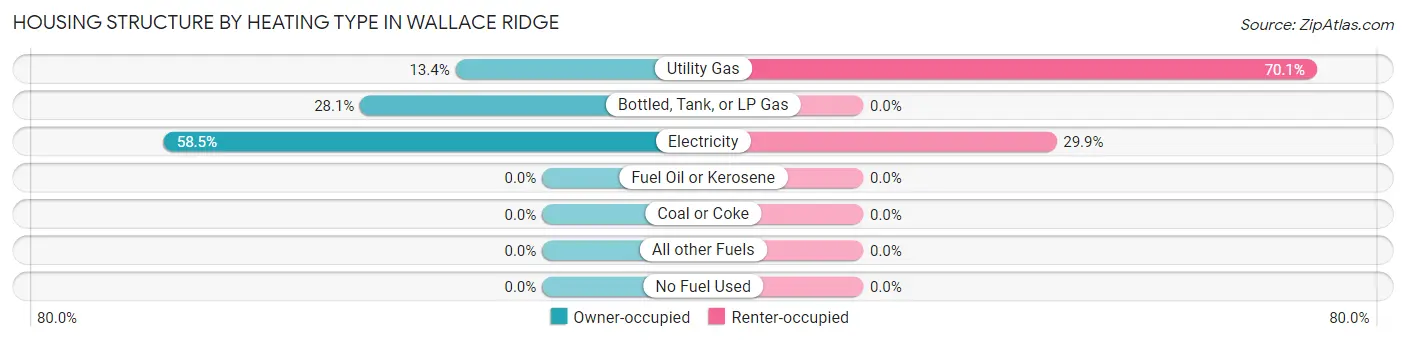
| Heating Type | Owner-occupied | Renter-occupied |
| Utility Gas | 30 (13.4%) | 54 (70.1%) |
| Bottled, Tank, or LP Gas | 63 (28.1%) | 0 (0.0%) |
| Electricity | 131 (58.5%) | 23 (29.9%) |
| Fuel Oil or Kerosene | 0 (0.0%) | 0 (0.0%) |
| Coal or Coke | 0 (0.0%) | 0 (0.0%) |
| All other Fuels | 0 (0.0%) | 0 (0.0%) |
| No Fuel Used | 0 (0.0%) | 0 (0.0%) |
| Total | 224 (100.0%) | 77 (100.0%) |
Household Vehicle Usage in Wallace Ridge
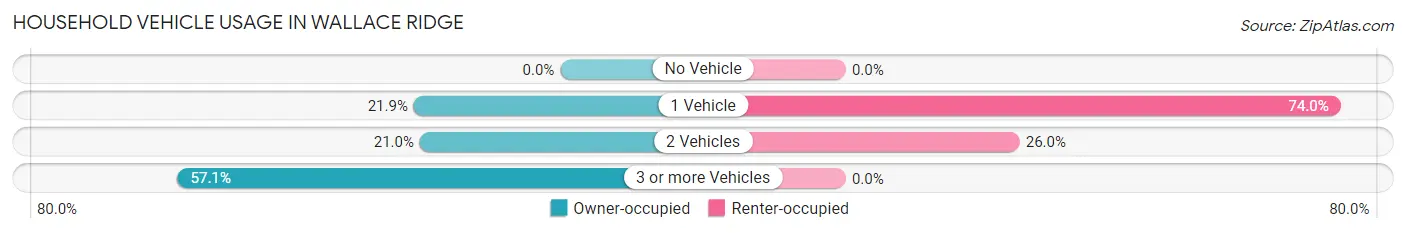
| Vehicles per Household | Owner-occupied | Renter-occupied |
| No Vehicle | 0 (0.0%) | 0 (0.0%) |
| 1 Vehicle | 49 (21.9%) | 57 (74.0%) |
| 2 Vehicles | 47 (21.0%) | 20 (26.0%) |
| 3 or more Vehicles | 128 (57.1%) | 0 (0.0%) |
| Total | 224 (100.0%) | 77 (100.0%) |
Real Estate & Mortgages in Wallace Ridge
Real Estate and Mortgage Overview in Wallace Ridge
| Characteristic | Without Mortgage | With Mortgage |
| Housing Units | 125 | 99 |
| Median Property Value | $140,900 | $158,400 |
| Median Household Income | $84,792 | $38 |
| Monthly Housing Costs | $336 | $0 |
| Real Estate Taxes | $495 | $53 |
Property Value by Mortgage Status in Wallace Ridge
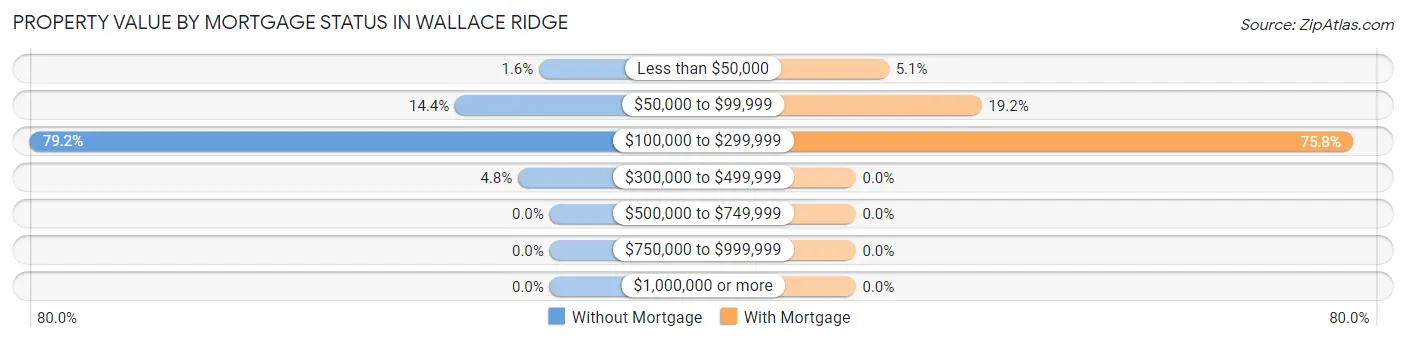
| Property Value | Without Mortgage | With Mortgage |
| Less than $50,000 | 2 (1.6%) | 5 (5.1%) |
| $50,000 to $99,999 | 18 (14.4%) | 19 (19.2%) |
| $100,000 to $299,999 | 99 (79.2%) | 75 (75.8%) |
| $300,000 to $499,999 | 6 (4.8%) | 0 (0.0%) |
| $500,000 to $749,999 | 0 (0.0%) | 0 (0.0%) |
| $750,000 to $999,999 | 0 (0.0%) | 0 (0.0%) |
| $1,000,000 or more | 0 (0.0%) | 0 (0.0%) |
| Total | 125 (100.0%) | 99 (100.0%) |
Household Income by Mortgage Status in Wallace Ridge
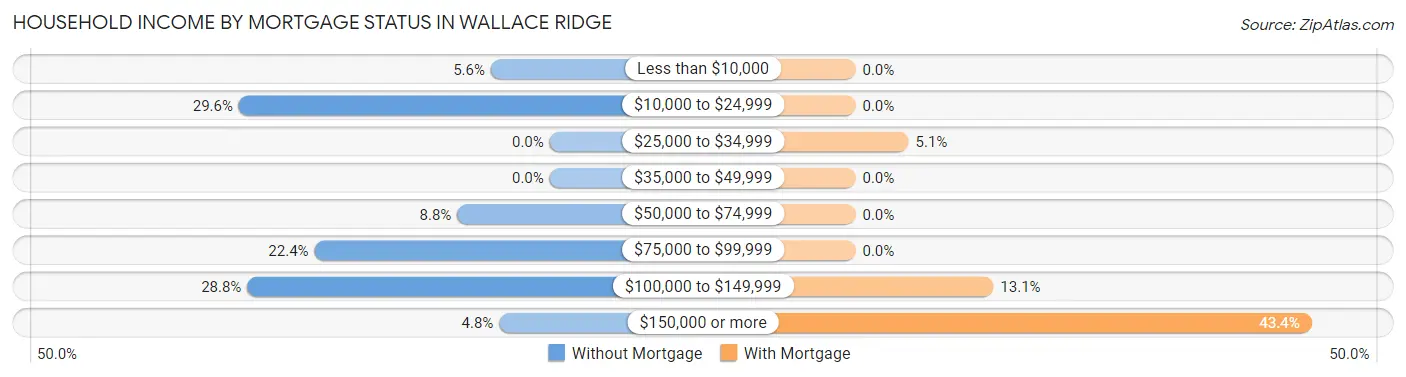
| Household Income | Without Mortgage | With Mortgage |
| Less than $10,000 | 7 (5.6%) | 0 (0.0%) |
| $10,000 to $24,999 | 37 (29.6%) | 0 (0.0%) |
| $25,000 to $34,999 | 0 (0.0%) | 5 (5.1%) |
| $35,000 to $49,999 | 0 (0.0%) | 0 (0.0%) |
| $50,000 to $74,999 | 11 (8.8%) | 0 (0.0%) |
| $75,000 to $99,999 | 28 (22.4%) | 0 (0.0%) |
| $100,000 to $149,999 | 36 (28.8%) | 13 (13.1%) |
| $150,000 or more | 6 (4.8%) | 43 (43.4%) |
| Total | 125 (100.0%) | 99 (100.0%) |
Property Value to Household Income Ratio in Wallace Ridge
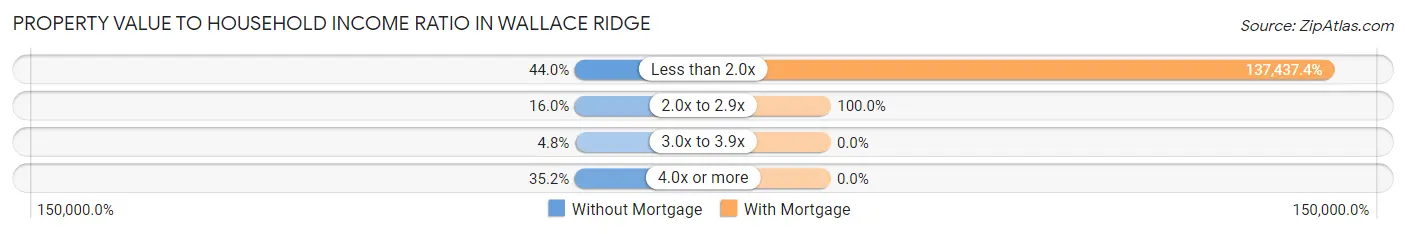
| Value-to-Income Ratio | Without Mortgage | With Mortgage |
| Less than 2.0x | 55 (44.0%) | 136,063 (137,437.4%) |
| 2.0x to 2.9x | 20 (16.0%) | 99 (100.0%) |
| 3.0x to 3.9x | 6 (4.8%) | 0 (0.0%) |
| 4.0x or more | 44 (35.2%) | 0 (0.0%) |
| Total | 125 (100.0%) | 99 (100.0%) |
Real Estate Taxes by Mortgage Status in Wallace Ridge
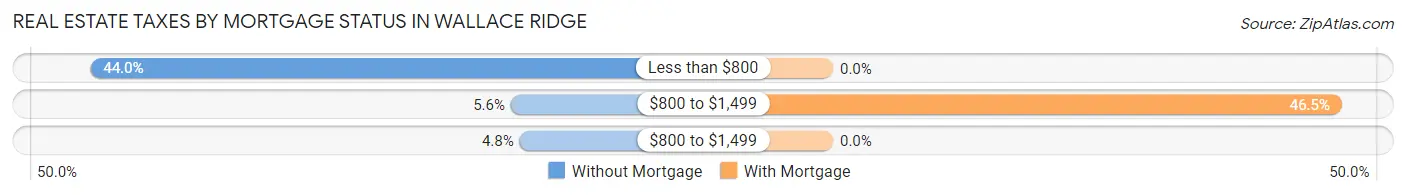
| Property Taxes | Without Mortgage | With Mortgage |
| Less than $800 | 55 (44.0%) | 0 (0.0%) |
| $800 to $1,499 | 7 (5.6%) | 46 (46.5%) |
| $800 to $1,499 | 6 (4.8%) | 0 (0.0%) |
| Total | 125 (100.0%) | 99 (100.0%) |
Health & Disability in Wallace Ridge
Health Insurance Coverage by Age in Wallace Ridge
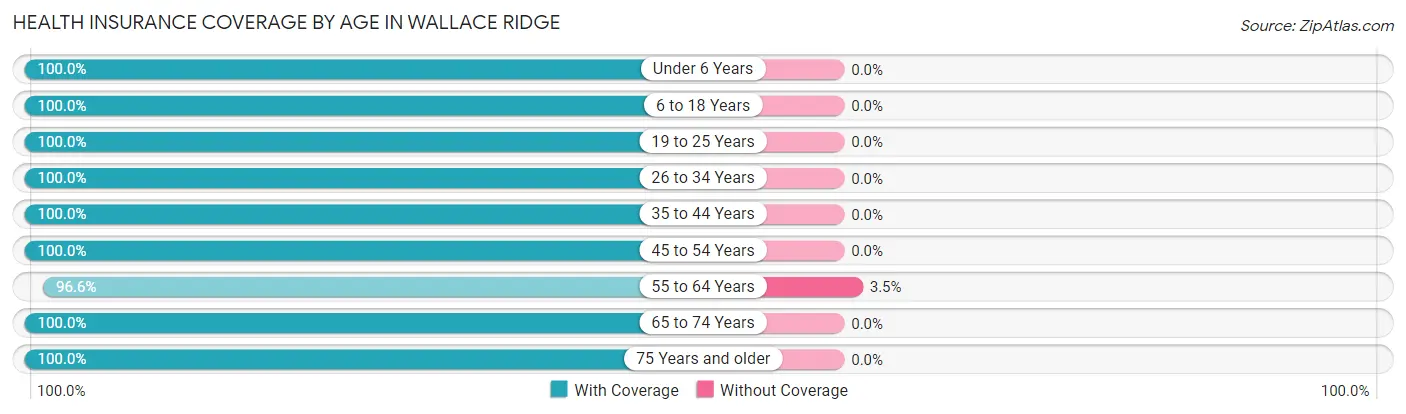
| Age Bracket | With Coverage | Without Coverage |
| Under 6 Years | 18 (100.0%) | 0 (0.0%) |
| 6 to 18 Years | 177 (100.0%) | 0 (0.0%) |
| 19 to 25 Years | 79 (100.0%) | 0 (0.0%) |
| 26 to 34 Years | 70 (100.0%) | 0 (0.0%) |
| 35 to 44 Years | 50 (100.0%) | 0 (0.0%) |
| 45 to 54 Years | 142 (100.0%) | 0 (0.0%) |
| 55 to 64 Years | 84 (96.6%) | 3 (3.5%) |
| 65 to 74 Years | 108 (100.0%) | 0 (0.0%) |
| 75 Years and older | 16 (100.0%) | 0 (0.0%) |
| Total | 744 (99.6%) | 3 (0.4%) |
Health Insurance Coverage by Citizenship Status in Wallace Ridge
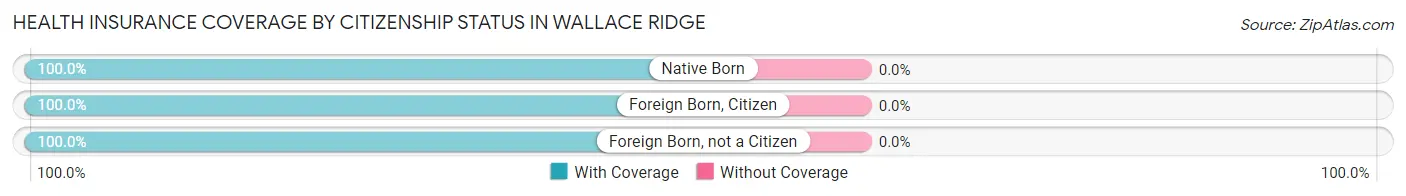
| Citizenship Status | With Coverage | Without Coverage |
| Native Born | 18 (100.0%) | 0 (0.0%) |
| Foreign Born, Citizen | 177 (100.0%) | 0 (0.0%) |
| Foreign Born, not a Citizen | 79 (100.0%) | 0 (0.0%) |
Health Insurance Coverage by Household Income in Wallace Ridge
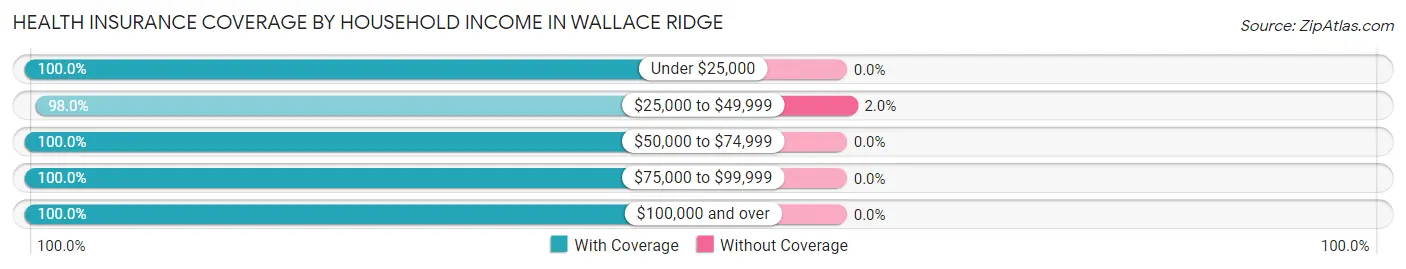
| Household Income | With Coverage | Without Coverage |
| Under $25,000 | 62 (100.0%) | 0 (0.0%) |
| $25,000 to $49,999 | 147 (98.0%) | 3 (2.0%) |
| $50,000 to $74,999 | 16 (100.0%) | 0 (0.0%) |
| $75,000 to $99,999 | 136 (100.0%) | 0 (0.0%) |
| $100,000 and over | 383 (100.0%) | 0 (0.0%) |
Public vs Private Health Insurance Coverage by Age in Wallace Ridge
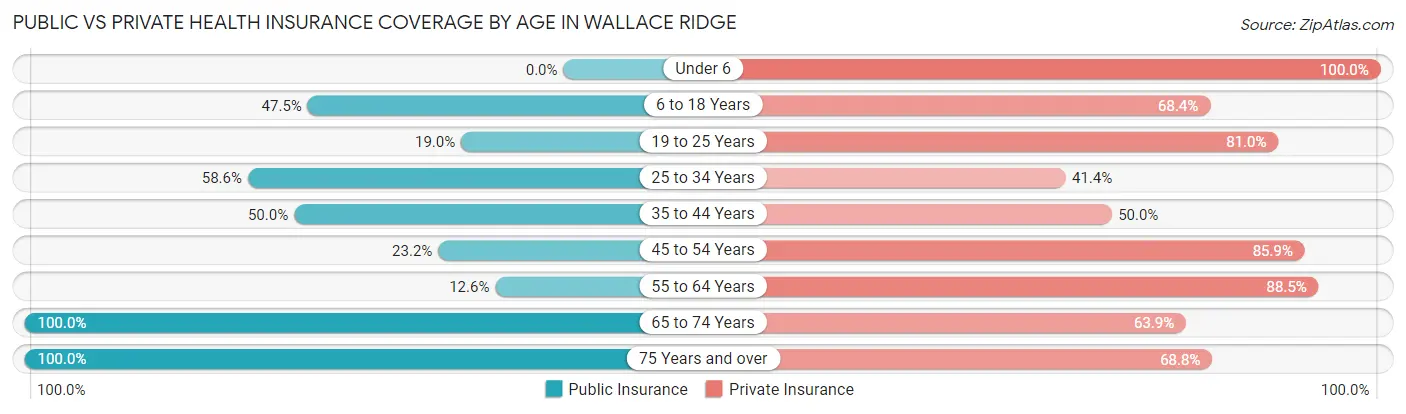
| Age Bracket | Public Insurance | Private Insurance |
| Under 6 | 0 (0.0%) | 18 (100.0%) |
| 6 to 18 Years | 84 (47.5%) | 121 (68.4%) |
| 19 to 25 Years | 15 (19.0%) | 64 (81.0%) |
| 25 to 34 Years | 41 (58.6%) | 29 (41.4%) |
| 35 to 44 Years | 25 (50.0%) | 25 (50.0%) |
| 45 to 54 Years | 33 (23.2%) | 122 (85.9%) |
| 55 to 64 Years | 11 (12.6%) | 77 (88.5%) |
| 65 to 74 Years | 108 (100.0%) | 69 (63.9%) |
| 75 Years and over | 16 (100.0%) | 11 (68.8%) |
| Total | 333 (44.6%) | 536 (71.8%) |
Disability Status by Sex by Age in Wallace Ridge
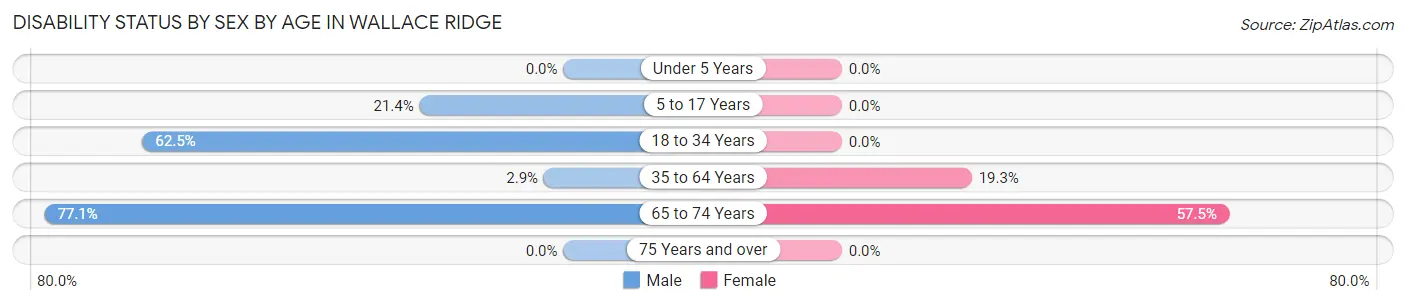
| Age Bracket | Male | Female |
| Under 5 Years | 0 (0.0%) | 0 (0.0%) |
| 5 to 17 Years | 22 (21.4%) | 0 (0.0%) |
| 18 to 34 Years | 15 (62.5%) | 0 (0.0%) |
| 35 to 64 Years | 4 (2.9%) | 27 (19.3%) |
| 65 to 74 Years | 47 (77.0%) | 27 (57.5%) |
| 75 Years and over | 0 (0.0%) | 0 (0.0%) |
Disability Class by Sex by Age in Wallace Ridge
Disability Class: Hearing Difficulty
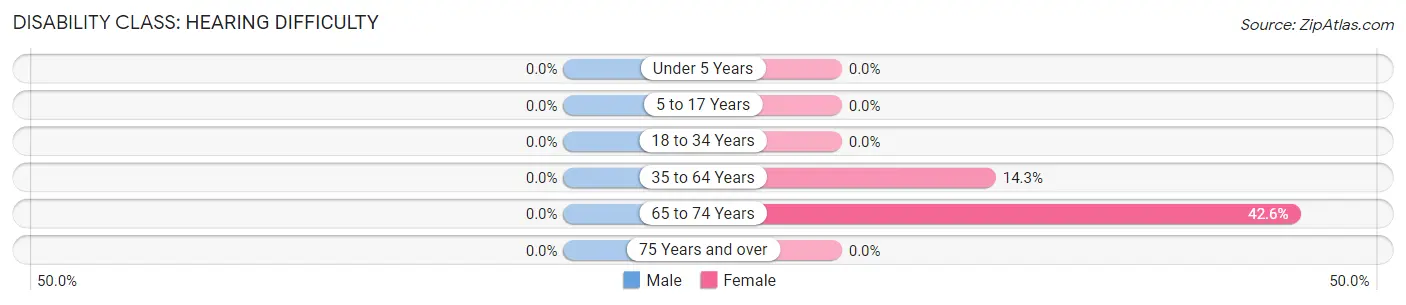
| Age Bracket | Male | Female |
| Under 5 Years | 0 (0.0%) | 0 (0.0%) |
| 5 to 17 Years | 0 (0.0%) | 0 (0.0%) |
| 18 to 34 Years | 0 (0.0%) | 0 (0.0%) |
| 35 to 64 Years | 0 (0.0%) | 20 (14.3%) |
| 65 to 74 Years | 0 (0.0%) | 20 (42.5%) |
| 75 Years and over | 0 (0.0%) | 0 (0.0%) |
Disability Class: Vision Difficulty
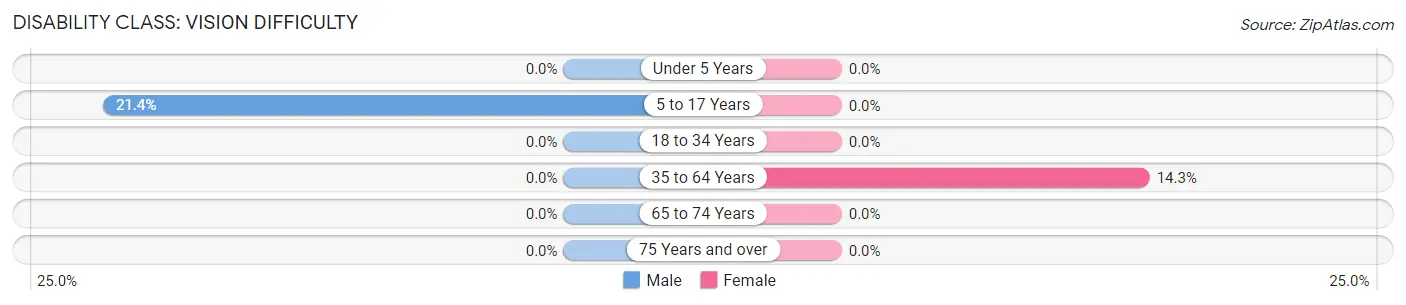
| Age Bracket | Male | Female |
| Under 5 Years | 0 (0.0%) | 0 (0.0%) |
| 5 to 17 Years | 22 (21.4%) | 0 (0.0%) |
| 18 to 34 Years | 0 (0.0%) | 0 (0.0%) |
| 35 to 64 Years | 0 (0.0%) | 20 (14.3%) |
| 65 to 74 Years | 0 (0.0%) | 0 (0.0%) |
| 75 Years and over | 0 (0.0%) | 0 (0.0%) |
Disability Class: Cognitive Difficulty
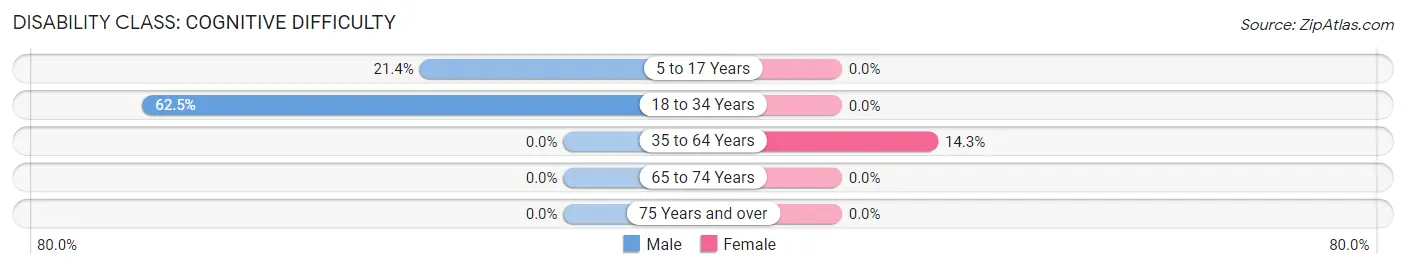
| Age Bracket | Male | Female |
| 5 to 17 Years | 22 (21.4%) | 0 (0.0%) |
| 18 to 34 Years | 15 (62.5%) | 0 (0.0%) |
| 35 to 64 Years | 0 (0.0%) | 20 (14.3%) |
| 65 to 74 Years | 0 (0.0%) | 0 (0.0%) |
| 75 Years and over | 0 (0.0%) | 0 (0.0%) |
Disability Class: Ambulatory Difficulty
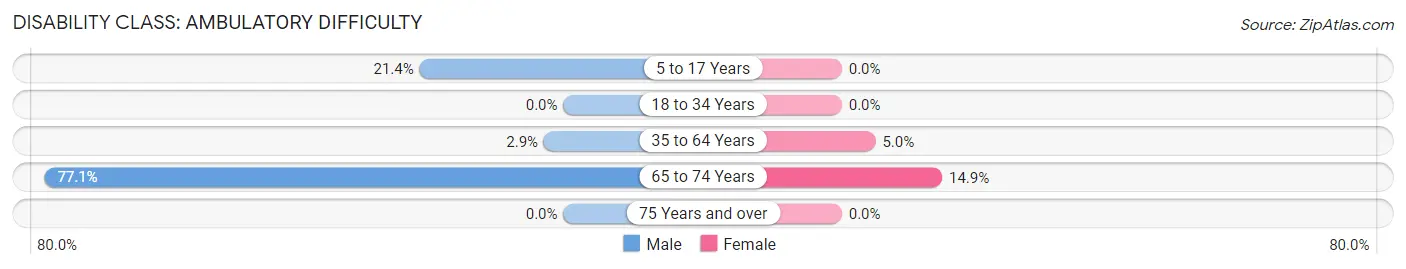
| Age Bracket | Male | Female |
| 5 to 17 Years | 22 (21.4%) | 0 (0.0%) |
| 18 to 34 Years | 0 (0.0%) | 0 (0.0%) |
| 35 to 64 Years | 4 (2.9%) | 7 (5.0%) |
| 65 to 74 Years | 47 (77.0%) | 7 (14.9%) |
| 75 Years and over | 0 (0.0%) | 0 (0.0%) |
Disability Class: Self-Care Difficulty
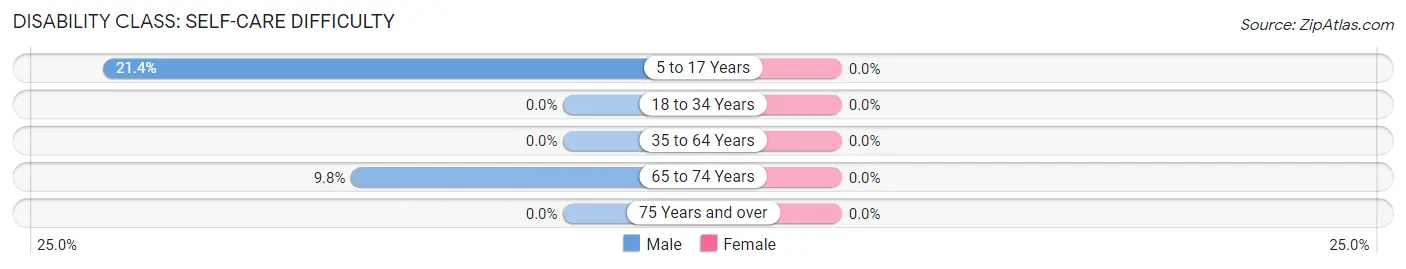
| Age Bracket | Male | Female |
| 5 to 17 Years | 22 (21.4%) | 0 (0.0%) |
| 18 to 34 Years | 0 (0.0%) | 0 (0.0%) |
| 35 to 64 Years | 0 (0.0%) | 0 (0.0%) |
| 65 to 74 Years | 6 (9.8%) | 0 (0.0%) |
| 75 Years and over | 0 (0.0%) | 0 (0.0%) |
Technology Access in Wallace Ridge
Computing Device Access in Wallace Ridge
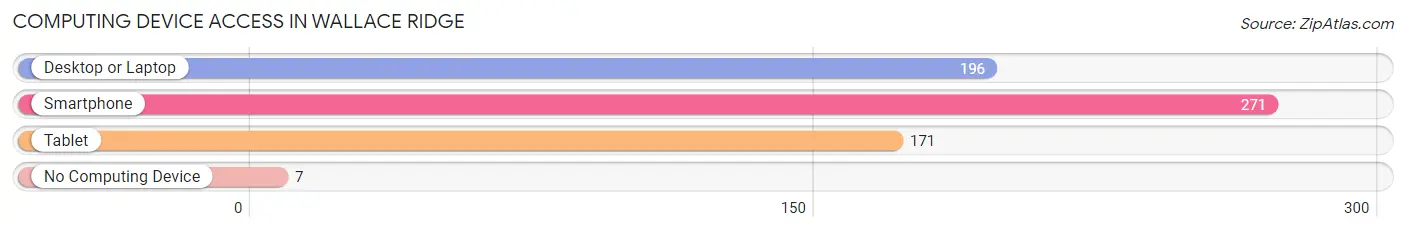
| Device Type | # Households | % Households |
| Desktop or Laptop | 196 | 65.1% |
| Smartphone | 271 | 90.0% |
| Tablet | 171 | 56.8% |
| No Computing Device | 7 | 2.3% |
| Total | 301 | 100.0% |
Internet Access in Wallace Ridge
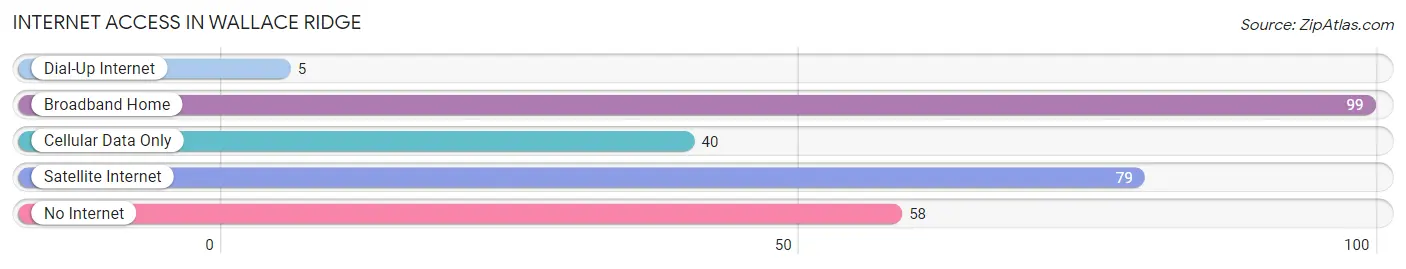
| Internet Type | # Households | % Households |
| Dial-Up Internet | 5 | 1.7% |
| Broadband Home | 99 | 32.9% |
| Cellular Data Only | 40 | 13.3% |
| Satellite Internet | 79 | 26.3% |
| No Internet | 58 | 19.3% |
| Total | 301 | 100.0% |
Wallace Ridge Summary
Wallace Ridge is a small unincorporated community located in the state of Louisiana, United States. It is situated in the northern part of the state, in the parish of Rapides. The community is located on the banks of the Red River, and is bordered by the towns of Pineville and Ball.
History
Wallace Ridge was first settled in the early 1800s by a group of settlers from the nearby town of Pineville. The settlers were looking for a place to settle and farm, and the fertile land of Wallace Ridge provided them with the perfect opportunity. The settlers named the area after a local landowner, Wallace, who had given them permission to settle on his land.
The community grew slowly over the years, and by the early 1900s, it had become a thriving agricultural community. The main crops grown in the area were cotton, corn, and soybeans. The community also had a small sawmill, which provided lumber for the local farmers.
In the late 1940s, the community began to experience a decline in population as many of the younger residents moved away in search of better opportunities. This trend continued until the late 1970s, when the population began to slowly increase again.
Geography
Wallace Ridge is located in the northern part of the state of Louisiana, in the parish of Rapides. It is situated on the banks of the Red River, and is bordered by the towns of Pineville and Ball. The community is located in a rural area, and is surrounded by farmland and forests.
The climate in Wallace Ridge is humid subtropical, with hot summers and mild winters. The average annual temperature is around 70 degrees Fahrenheit, and the average annual precipitation is around 50 inches.
Economy
The economy of Wallace Ridge is largely based on agriculture. The main crops grown in the area are cotton, corn, and soybeans. The community also has a small sawmill, which provides lumber for the local farmers.
In addition to agriculture, the community also has a few small businesses, including a gas station, a convenience store, and a few restaurants.
Demographics
As of the 2010 census, the population of Wallace Ridge was 1,845. The racial makeup of the community was 97.3% White, 0.7% African American, 0.3% Native American, 0.2% Asian, and 1.5% from other races.
The median household income in Wallace Ridge was $37,917, and the median family income was $45,938. The per capita income was $18,945. About 11.3% of the population was below the poverty line.
Common Questions
What is Per Capita Income in Wallace Ridge?
Per Capita income in Wallace Ridge is $35,563.
What is the Median Family Income in Wallace Ridge?
Median Family Income in Wallace Ridge is $115,489.
What is the Median Household income in Wallace Ridge?
Median Household Income in Wallace Ridge is $77,250.
What is Inequality or Gini Index in Wallace Ridge?
Inequality or Gini Index in Wallace Ridge is 0.43.
What is the Total Population of Wallace Ridge?
Total Population of Wallace Ridge is 747.
What is the Total Male Population of Wallace Ridge?
Total Male Population of Wallace Ridge is 327.
What is the Total Female Population of Wallace Ridge?
Total Female Population of Wallace Ridge is 420.
What is the Ratio of Males per 100 Females in Wallace Ridge?
There are 77.86 Males per 100 Females in Wallace Ridge.
What is the Ratio of Females per 100 Males in Wallace Ridge?
There are 128.44 Females per 100 Males in Wallace Ridge.
What is the Median Population Age in Wallace Ridge?
Median Population Age in Wallace Ridge is 40.2 Years.
What is the Average Family Size in Wallace Ridge
Average Family Size in Wallace Ridge is 2.9 People.
What is the Average Household Size in Wallace Ridge
Average Household Size in Wallace Ridge is 2.5 People.
How Large is the Labor Force in Wallace Ridge?
There are 377 People in the Labor Forcein in Wallace Ridge.
What is the Percentage of People in the Labor Force in Wallace Ridge?
63.0% of People are in the Labor Force in Wallace Ridge.