Gardere, LA Map & Demographics
Gardere Map
Gardere Overview
$25,024
PER CAPITA INCOME
$66,659
AVG FAMILY INCOME
$54,412
AVG HOUSEHOLD INCOME
52.2%
WAGE / INCOME GAP [ % ]
47.8¢/ $1
WAGE / INCOME GAP [ $ ]
0.46
INEQUALITY / GINI INDEX
11,565
TOTAL POPULATION
5,469
MALE POPULATION
6,096
FEMALE POPULATION
89.71
MALES / 100 FEMALES
111.46
FEMALES / 100 MALES
23.9
MEDIAN AGE
3.5
AVG FAMILY SIZE
2.8
AVG HOUSEHOLD SIZE
6,768
LABOR FORCE [ PEOPLE ]
78.9%
PERCENT IN LABOR FORCE
6.2%
UNEMPLOYMENT RATE
Income in Gardere
Income Overview in Gardere
Per Capita Income in Gardere is $25,024, while median incomes of families and households are $66,659 and $54,412 respectively.
| Characteristic | Number | Measure |
| Per Capita Income | 11,565 | $25,024 |
| Median Family Income | 2,307 | $66,659 |
| Mean Family Income | 2,307 | $76,519 |
| Median Household Income | 4,062 | $54,412 |
| Mean Household Income | 4,062 | $68,199 |
| Income Deficit | 2,307 | $0 |
| Wage / Income Gap (%) | 11,565 | 52.21% |
| Wage / Income Gap ($) | 11,565 | 47.79¢ per $1 |
| Gini / Inequality Index | 11,565 | 0.46 |
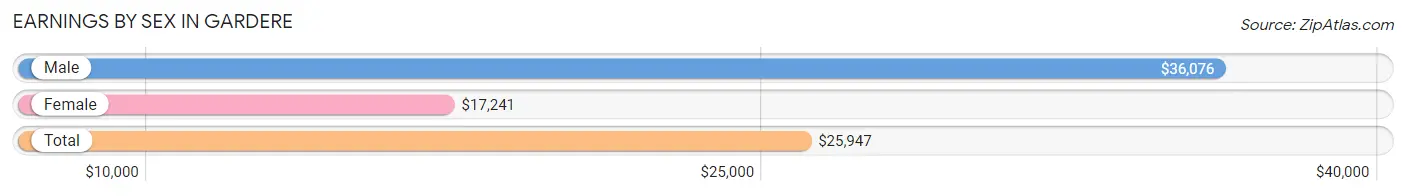
Earnings by Sex in Gardere
Average Earnings in Gardere are $25,947, $36,076 for men and $17,241 for women, a difference of 52.2%.
| Sex | Number | Average Earnings |
| Male | 2,845 (41.7%) | $36,076 |
| Female | 3,974 (58.3%) | $17,241 |
| Total | 6,819 (100.0%) | $25,947 |
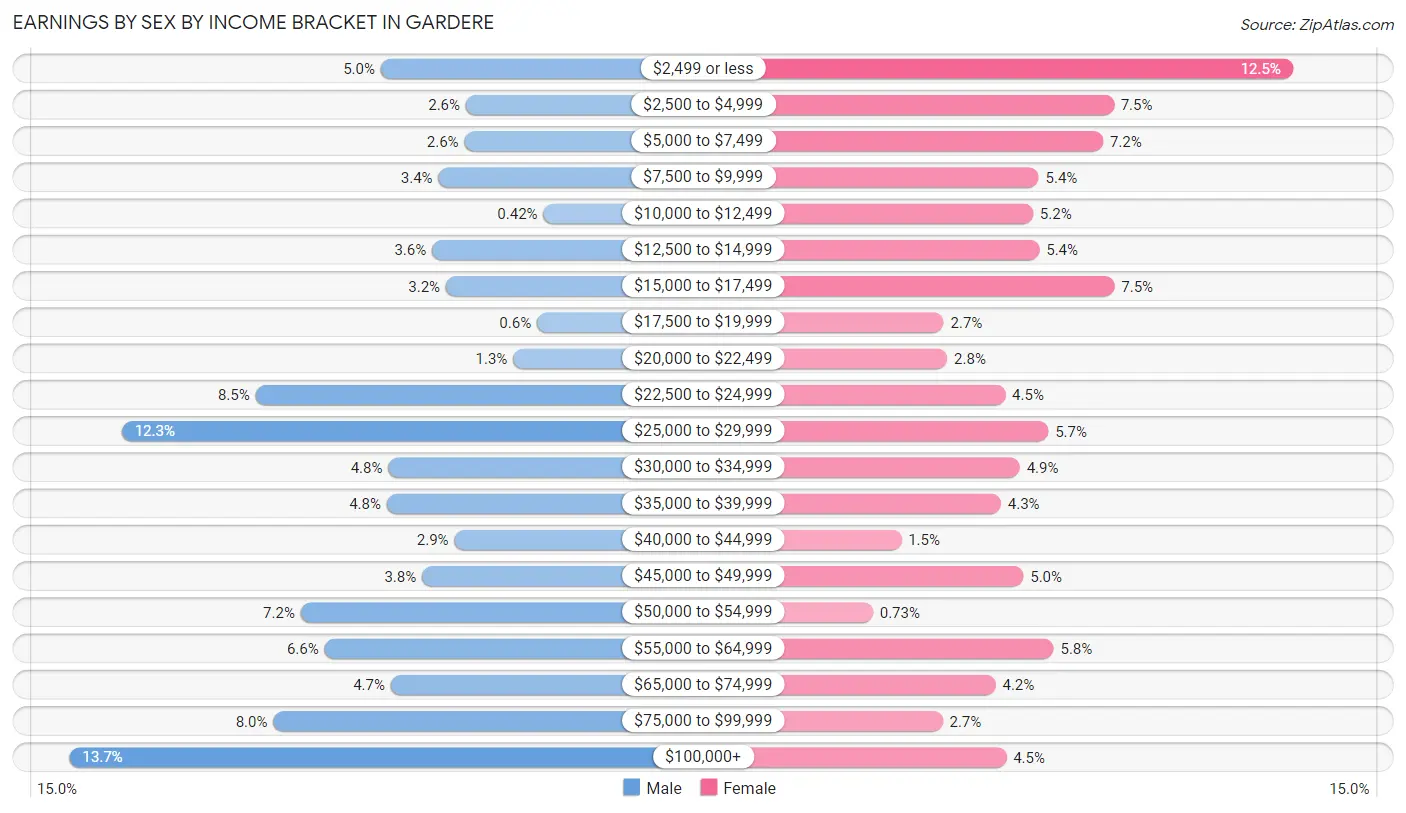
Earnings by Sex by Income Bracket in Gardere
The most common earnings brackets in Gardere are $100,000+ for men (391 | 13.7%) and $2,499 or less for women (498 | 12.5%).
| Income | Male | Female |
| $2,499 or less | 142 (5.0%) | 498 (12.5%) |
| $2,500 to $4,999 | 74 (2.6%) | 298 (7.5%) |
| $5,000 to $7,499 | 75 (2.6%) | 286 (7.2%) |
| $7,500 to $9,999 | 96 (3.4%) | 214 (5.4%) |
| $10,000 to $12,499 | 12 (0.4%) | 208 (5.2%) |
| $12,500 to $14,999 | 101 (3.5%) | 215 (5.4%) |
| $15,000 to $17,499 | 90 (3.2%) | 299 (7.5%) |
| $17,500 to $19,999 | 17 (0.6%) | 108 (2.7%) |
| $20,000 to $22,499 | 36 (1.3%) | 112 (2.8%) |
| $22,500 to $24,999 | 242 (8.5%) | 177 (4.4%) |
| $25,000 to $29,999 | 349 (12.3%) | 225 (5.7%) |
| $30,000 to $34,999 | 136 (4.8%) | 193 (4.9%) |
| $35,000 to $39,999 | 137 (4.8%) | 172 (4.3%) |
| $40,000 to $44,999 | 83 (2.9%) | 61 (1.5%) |
| $45,000 to $49,999 | 109 (3.8%) | 197 (5.0%) |
| $50,000 to $54,999 | 206 (7.2%) | 29 (0.7%) |
| $55,000 to $64,999 | 187 (6.6%) | 231 (5.8%) |
| $65,000 to $74,999 | 134 (4.7%) | 166 (4.2%) |
| $75,000 to $99,999 | 228 (8.0%) | 107 (2.7%) |
| $100,000+ | 391 (13.7%) | 178 (4.5%) |
| Total | 2,845 (100.0%) | 3,974 (100.0%) |
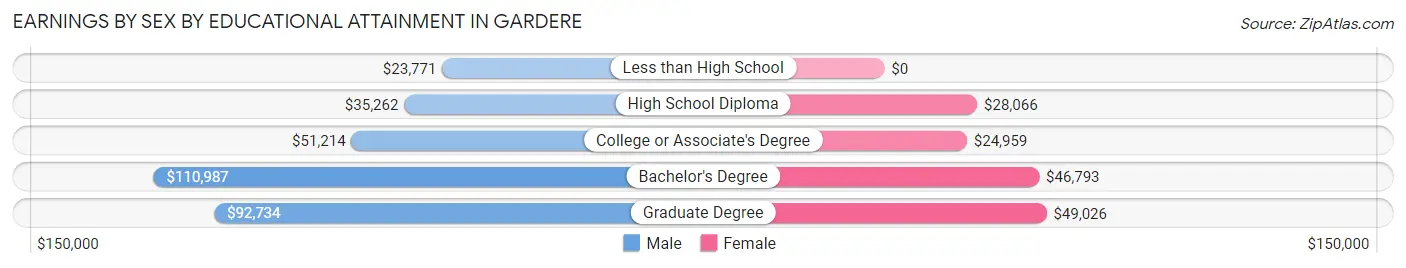
Earnings by Sex by Educational Attainment in Gardere
Average earnings in Gardere are $52,404 for men and $33,219 for women, a difference of 36.6%. Men with an educational attainment of bachelor's degree enjoy the highest average annual earnings of $110,987, while those with less than high school education earn the least with $23,771. Women with an educational attainment of graduate degree earn the most with the average annual earnings of $49,026, while those with college or associate's degree education have the smallest earnings of $24,959.
| Educational Attainment | Male Income | Female Income |
| Less than High School | $23,771 | $0 |
| High School Diploma | $35,262 | $28,066 |
| College or Associate's Degree | $51,214 | $24,959 |
| Bachelor's Degree | $110,987 | $46,793 |
| Graduate Degree | $92,734 | $49,026 |
| Total | $52,404 | $33,219 |
Family Income in Gardere
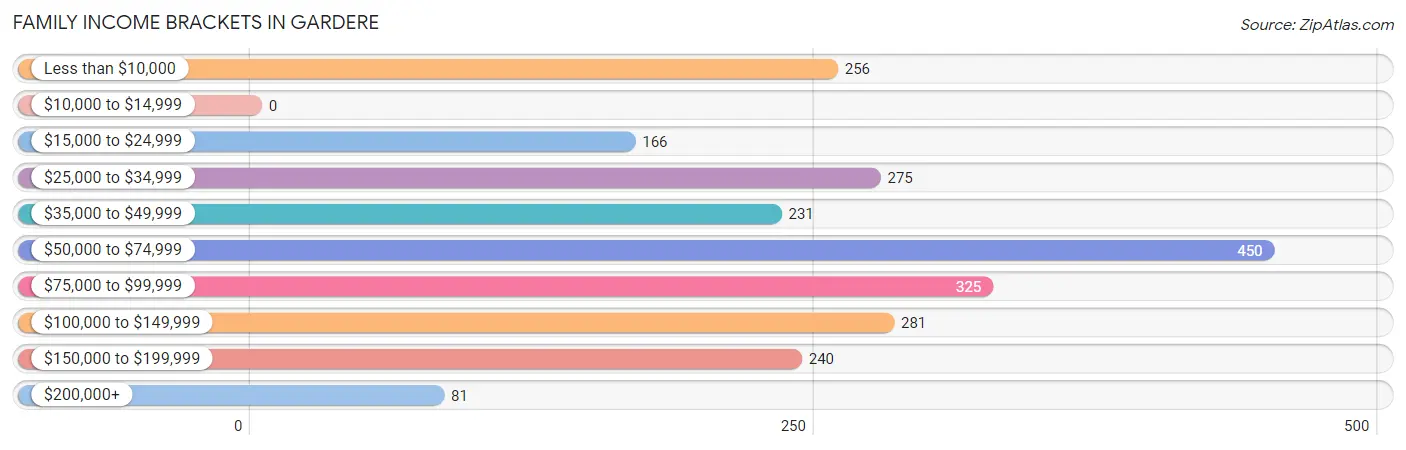
Family Income Brackets in Gardere
According to the Gardere family income data, there are 450 families falling into the $50,000 to $74,999 income range, which is the most common income bracket and makes up 19.5% of all families.
| Income Bracket | # Families | % Families |
| Less than $10,000 | 256 | 11.1% |
| $10,000 to $14,999 | 0 | 0.0% |
| $15,000 to $24,999 | 166 | 7.2% |
| $25,000 to $34,999 | 275 | 11.9% |
| $35,000 to $49,999 | 231 | 10.0% |
| $50,000 to $74,999 | 450 | 19.5% |
| $75,000 to $99,999 | 325 | 14.1% |
| $100,000 to $149,999 | 281 | 12.2% |
| $150,000 to $199,999 | 240 | 10.4% |
| $200,000+ | 81 | 3.5% |
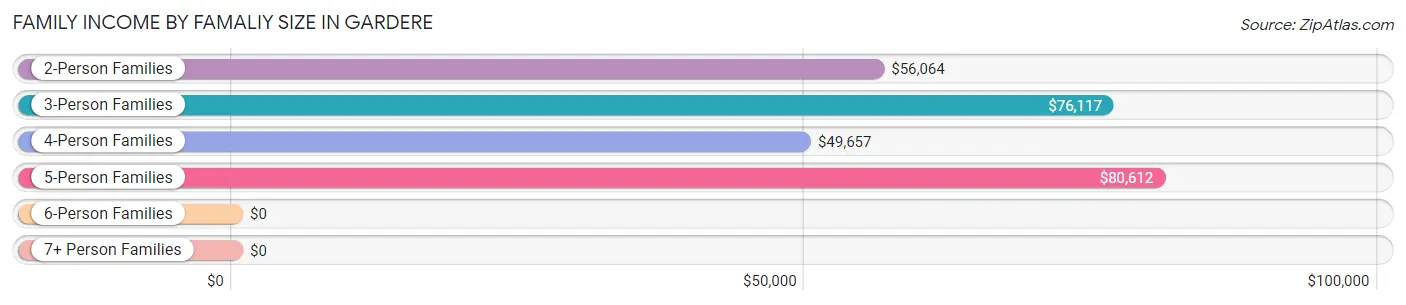
Family Income by Famaliy Size in Gardere
5-person families (74 | 3.2%) account for the highest median family income in Gardere with $80,612 per family, while 2-person families (1,104 | 47.8%) have the highest median income of $28,032 per family member.
| Income Bracket | # Families | Median Income |
| 2-Person Families | 1,104 (47.8%) | $56,064 |
| 3-Person Families | 420 (18.2%) | $76,117 |
| 4-Person Families | 670 (29.0%) | $49,657 |
| 5-Person Families | 74 (3.2%) | $80,612 |
| 6-Person Families | 18 (0.8%) | $0 |
| 7+ Person Families | 21 (0.9%) | $0 |
| Total | 2,307 (100.0%) | $66,659 |
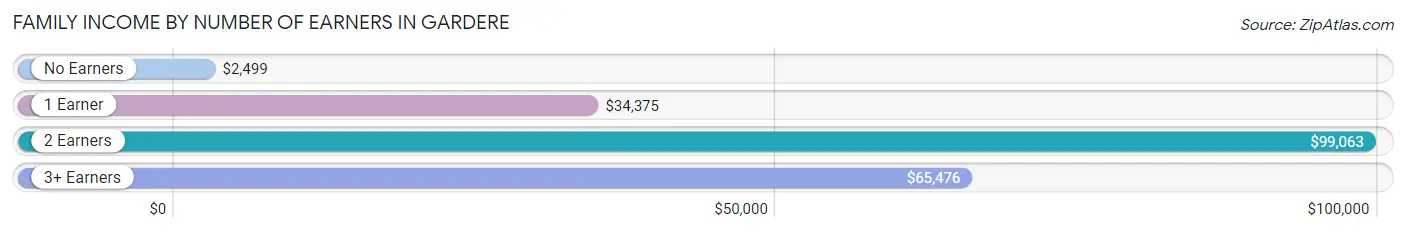
Family Income by Number of Earners in Gardere
The median family income in Gardere is $66,659, with families comprising 2 earners (1,044) having the highest median family income of $99,063, while families with no earners (167) have the lowest median family income of $2,499, accounting for 45.3% and 7.2% of families, respectively.
| Number of Earners | # Families | Median Income |
| No Earners | 167 (7.2%) | $2,499 |
| 1 Earner | 888 (38.5%) | $34,375 |
| 2 Earners | 1,044 (45.3%) | $99,063 |
| 3+ Earners | 208 (9.0%) | $65,476 |
| Total | 2,307 (100.0%) | $66,659 |
Household Income in Gardere
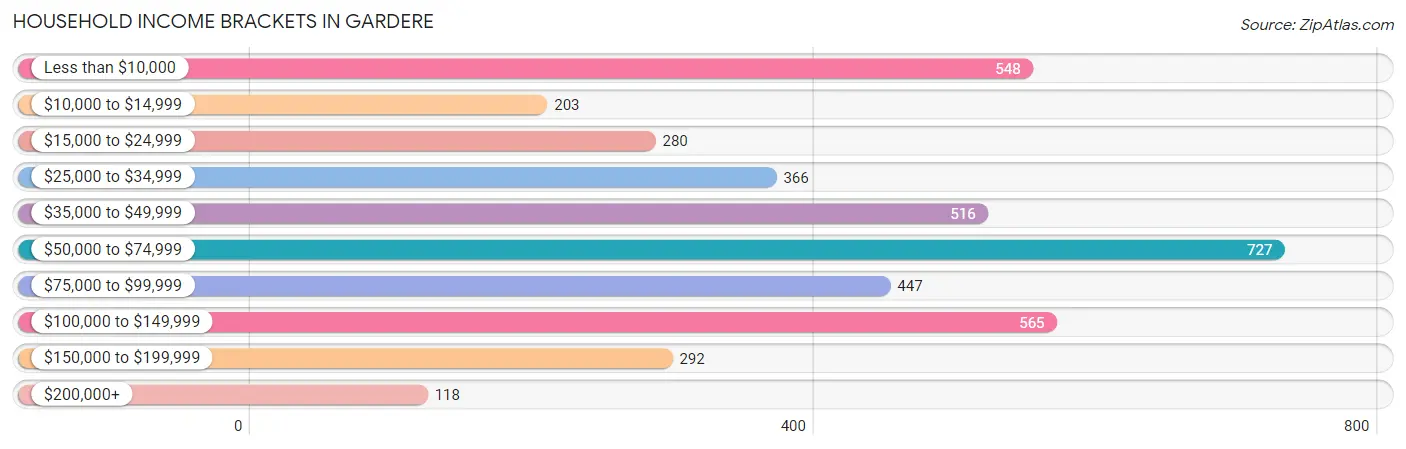
Household Income Brackets in Gardere
With 727 households falling in the category, the $50,000 to $74,999 income range is the most frequent in Gardere, accounting for 17.9% of all households. In contrast, only 118 households (2.9%) fall into the $200,000+ income bracket, making it the least populous group.
| Income Bracket | # Households | % Households |
| Less than $10,000 | 548 | 13.5% |
| $10,000 to $14,999 | 203 | 5.0% |
| $15,000 to $24,999 | 280 | 6.9% |
| $25,000 to $34,999 | 366 | 9.0% |
| $35,000 to $49,999 | 516 | 12.7% |
| $50,000 to $74,999 | 727 | 17.9% |
| $75,000 to $99,999 | 447 | 11.0% |
| $100,000 to $149,999 | 565 | 13.9% |
| $150,000 to $199,999 | 292 | 7.2% |
| $200,000+ | 118 | 2.9% |
Household Income by Householder Age in Gardere
The median household income in Gardere is $54,412, with the highest median household income of $73,970 found in the 25 to 44 years age bracket for the primary householder. A total of 2,091 households (51.5%) fall into this category. Meanwhile, the 65+ years age bracket for the primary householder has the lowest median household income of $0, with 495 households (12.2%) in this group.
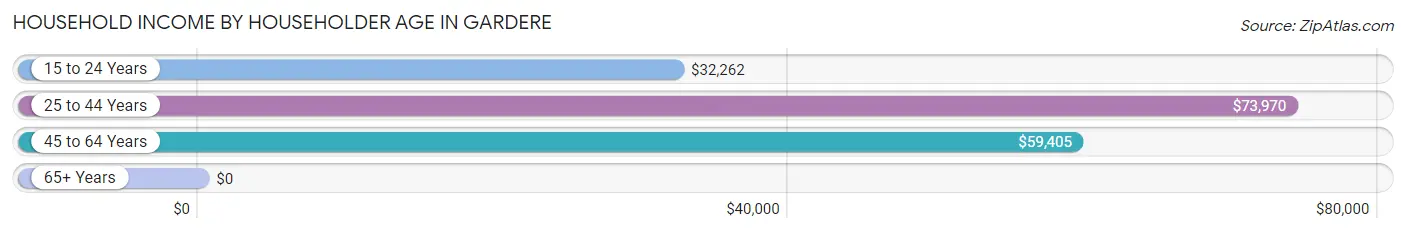
| Income Bracket | # Households | Median Income |
| 15 to 24 Years | 680 (16.7%) | $32,262 |
| 25 to 44 Years | 2,091 (51.5%) | $73,970 |
| 45 to 64 Years | 796 (19.6%) | $59,405 |
| 65+ Years | 495 (12.2%) | $0 |
| Total | 4,062 (100.0%) | $54,412 |
Poverty in Gardere
Income Below Poverty by Sex and Age in Gardere
With 23.8% poverty level for males and 32.2% for females among the residents of Gardere, 5 year old males and 16 and 17 year old females are the most vulnerable to poverty, with 35 males (59.3%) and 54 females (91.5%) in their respective age groups living below the poverty level.
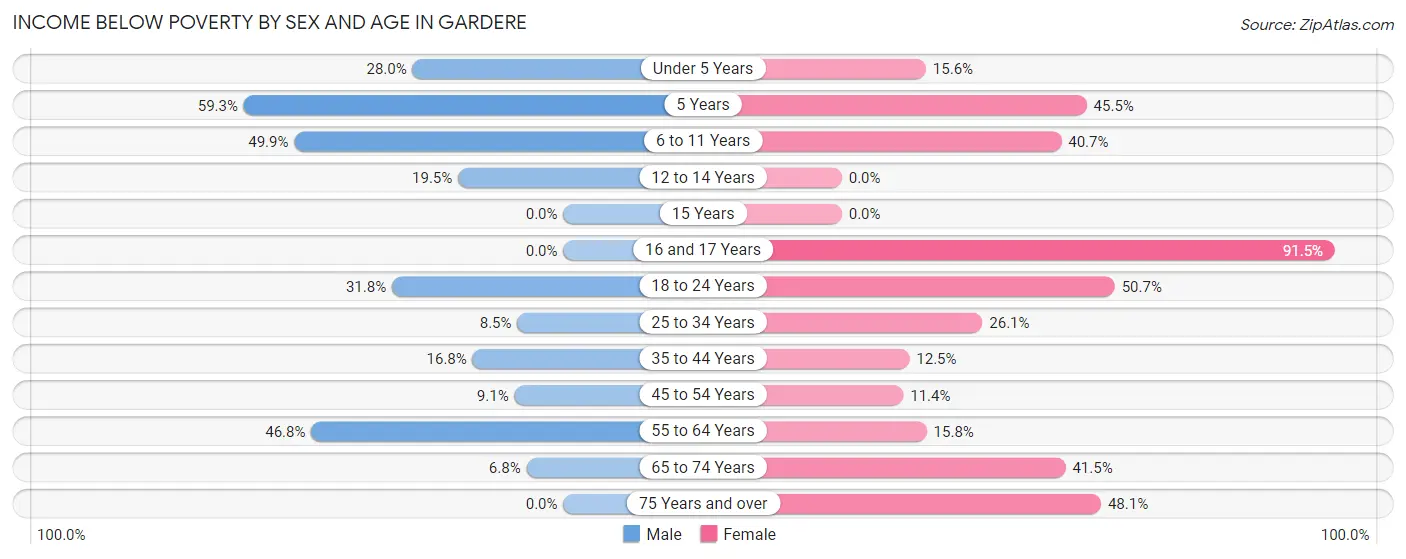
| Age Bracket | Male | Female |
| Under 5 Years | 180 (28.0%) | 64 (15.6%) |
| 5 Years | 35 (59.3%) | 20 (45.5%) |
| 6 to 11 Years | 399 (49.9%) | 198 (40.7%) |
| 12 to 14 Years | 50 (19.5%) | 0 (0.0%) |
| 15 Years | 0 (0.0%) | 0 (0.0%) |
| 16 and 17 Years | 0 (0.0%) | 54 (91.5%) |
| 18 to 24 Years | 272 (31.8%) | 965 (50.7%) |
| 25 to 34 Years | 109 (8.5%) | 300 (26.1%) |
| 35 to 44 Years | 81 (16.8%) | 78 (12.5%) |
| 45 to 54 Years | 34 (9.1%) | 38 (11.4%) |
| 55 to 64 Years | 124 (46.8%) | 72 (15.8%) |
| 65 to 74 Years | 18 (6.8%) | 120 (41.5%) |
| 75 Years and over | 0 (0.0%) | 51 (48.1%) |
| Total | 1,302 (23.8%) | 1,960 (32.2%) |
Income Above Poverty by Sex and Age in Gardere
According to the poverty statistics in Gardere, males aged 15 years and females aged 12 to 14 years are the age groups that are most secure financially, with 100.0% of males and 100.0% of females in these age groups living above the poverty line.
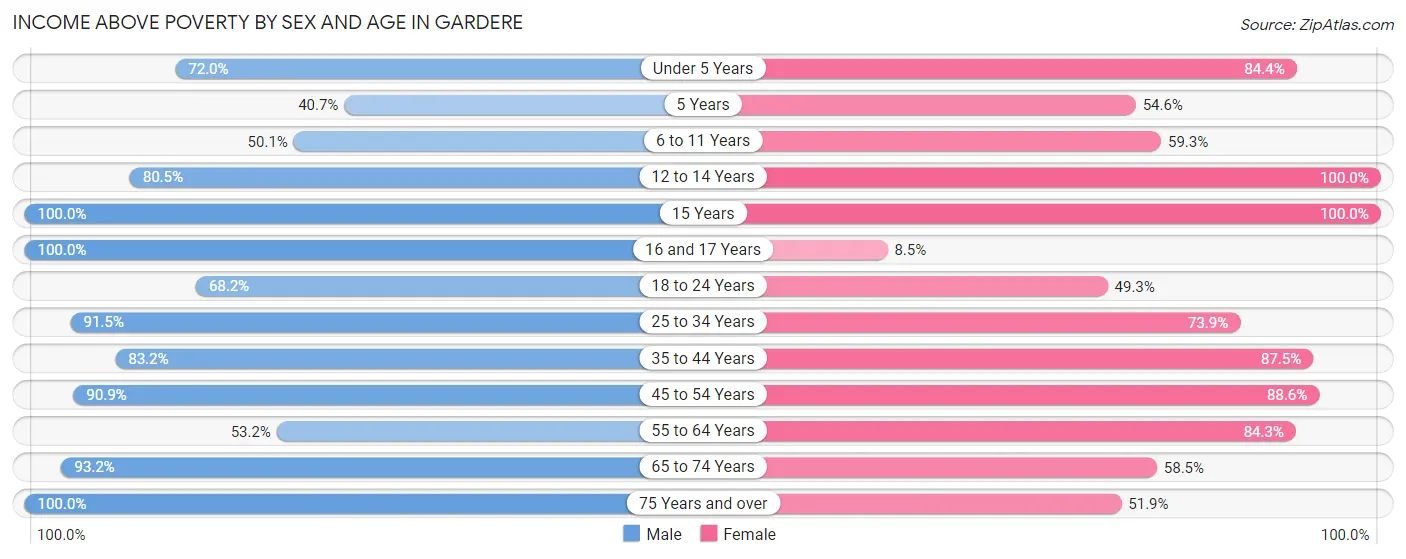
| Age Bracket | Male | Female |
| Under 5 Years | 463 (72.0%) | 346 (84.4%) |
| 5 Years | 24 (40.7%) | 24 (54.5%) |
| 6 to 11 Years | 400 (50.1%) | 288 (59.3%) |
| 12 to 14 Years | 206 (80.5%) | 180 (100.0%) |
| 15 Years | 55 (100.0%) | 55 (100.0%) |
| 16 and 17 Years | 134 (100.0%) | 5 (8.5%) |
| 18 to 24 Years | 583 (68.2%) | 940 (49.3%) |
| 25 to 34 Years | 1,167 (91.5%) | 850 (73.9%) |
| 35 to 44 Years | 400 (83.2%) | 544 (87.5%) |
| 45 to 54 Years | 341 (90.9%) | 295 (88.6%) |
| 55 to 64 Years | 141 (53.2%) | 385 (84.3%) |
| 65 to 74 Years | 245 (93.2%) | 169 (58.5%) |
| 75 Years and over | 8 (100.0%) | 55 (51.9%) |
| Total | 4,167 (76.2%) | 4,136 (67.8%) |
Income Below Poverty Among Married-Couple Families in Gardere
The poverty statistics for married-couple families in Gardere show that 6.2% or 61 of the total 984 families live below the poverty line. Families with no children have the highest poverty rate of 11.7%, comprising of 52 families. On the other hand, families with 3 or 4 children have the lowest poverty rate of 0.0%, which includes 0 families.
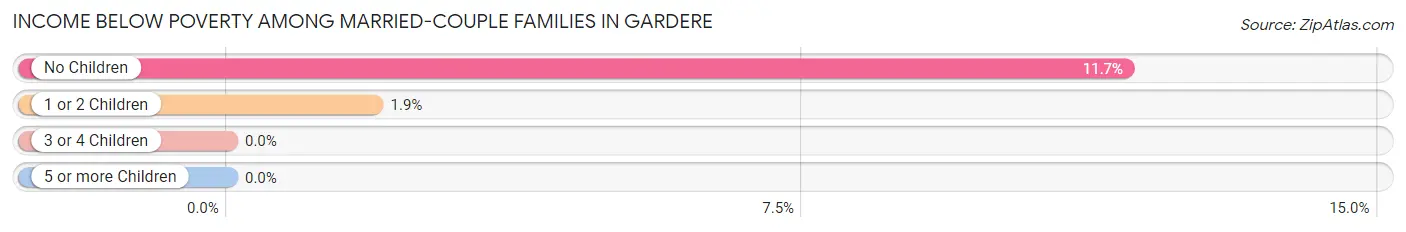
| Children | Above Poverty | Below Poverty |
| No Children | 392 (88.3%) | 52 (11.7%) |
| 1 or 2 Children | 464 (98.1%) | 9 (1.9%) |
| 3 or 4 Children | 67 (100.0%) | 0 (0.0%) |
| 5 or more Children | 0 (0.0%) | 0 (0.0%) |
| Total | 923 (93.8%) | 61 (6.2%) |
Income Below Poverty Among Single-Parent Households in Gardere
According to the poverty data in Gardere, 20.0% or 61 single-father households and 33.6% or 342 single-mother households are living below the poverty line. Among single-father households, those with 3 or 4 children have the highest poverty rate, with 60 households (100.0%) experiencing poverty. Likewise, among single-mother households, those with 3 or 4 children have the highest poverty rate, with 148 households (87.6%) falling below the poverty line.
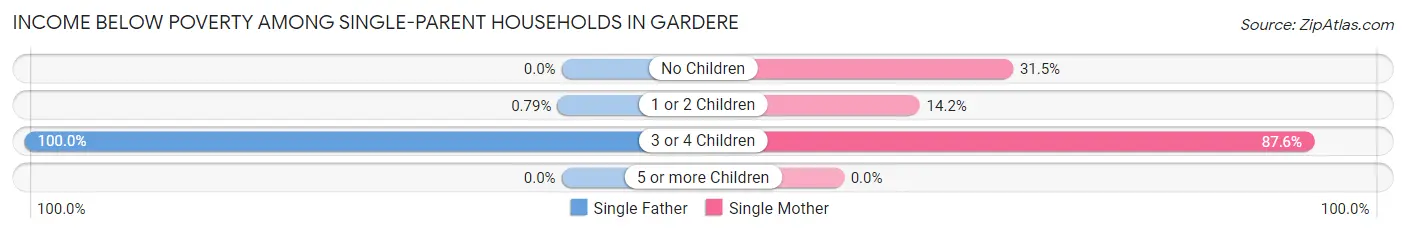
| Children | Single Father | Single Mother |
| No Children | 0 (0.0%) | 134 (31.5%) |
| 1 or 2 Children | 1 (0.8%) | 60 (14.1%) |
| 3 or 4 Children | 60 (100.0%) | 148 (87.6%) |
| 5 or more Children | 0 (0.0%) | 0 (0.0%) |
| Total | 61 (20.0%) | 342 (33.6%) |
Income Below Poverty Among Married-Couple vs Single-Parent Households in Gardere
The poverty data for Gardere shows that 61 of the married-couple family households (6.2%) and 403 of the single-parent households (30.5%) are living below the poverty level. Within the married-couple family households, those with no children have the highest poverty rate, with 52 households (11.7%) falling below the poverty line. Among the single-parent households, those with 3 or 4 children have the highest poverty rate, with 208 household (90.8%) living below poverty.
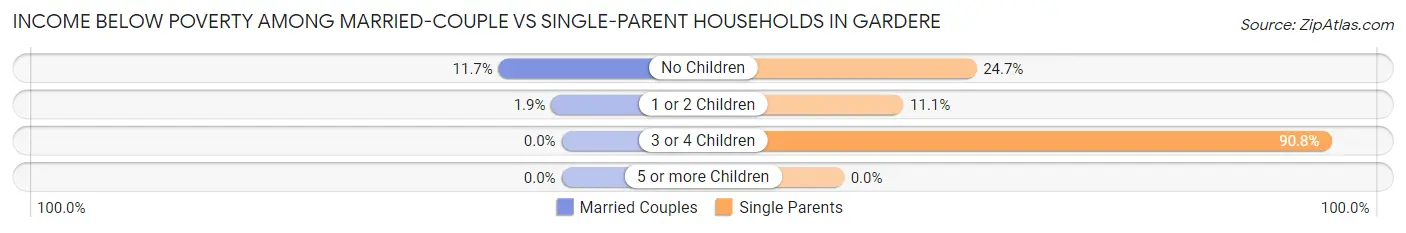
| Children | Married-Couple Families | Single-Parent Households |
| No Children | 52 (11.7%) | 134 (24.7%) |
| 1 or 2 Children | 9 (1.9%) | 61 (11.1%) |
| 3 or 4 Children | 0 (0.0%) | 208 (90.8%) |
| 5 or more Children | 0 (0.0%) | 0 (0.0%) |
| Total | 61 (6.2%) | 403 (30.5%) |
Race in Gardere
The most populous races in Gardere are Black / African American (5,713 | 49.4%), White / Caucasian (3,335 | 28.8%), and Hispanic or Latino (2,146 | 18.6%).
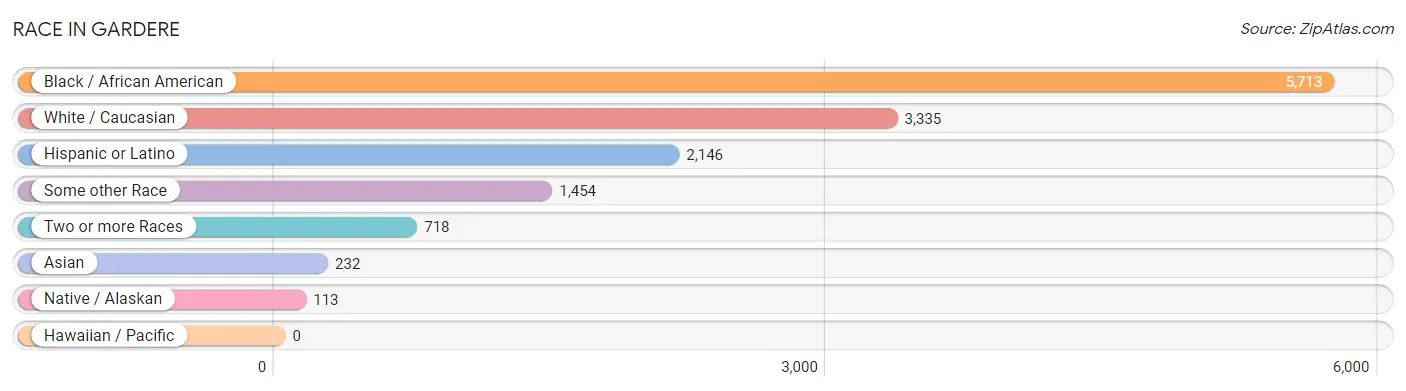
| Race | # Population | % Population |
| Asian | 232 | 2.0% |
| Black / African American | 5,713 | 49.4% |
| Hawaiian / Pacific | 0 | 0.0% |
| Hispanic or Latino | 2,146 | 18.6% |
| Native / Alaskan | 113 | 1.0% |
| White / Caucasian | 3,335 | 28.8% |
| Two or more Races | 718 | 6.2% |
| Some other Race | 1,454 | 12.6% |
| Total | 11,565 | 100.0% |
Ancestry in Gardere
The most populous ancestries reported in Gardere are Central American (1,455 | 12.6%), Honduran (1,118 | 9.7%), Italian (599 | 5.2%), French (499 | 4.3%), and American (462 | 4.0%), together accounting for 35.7% of all Gardere residents.
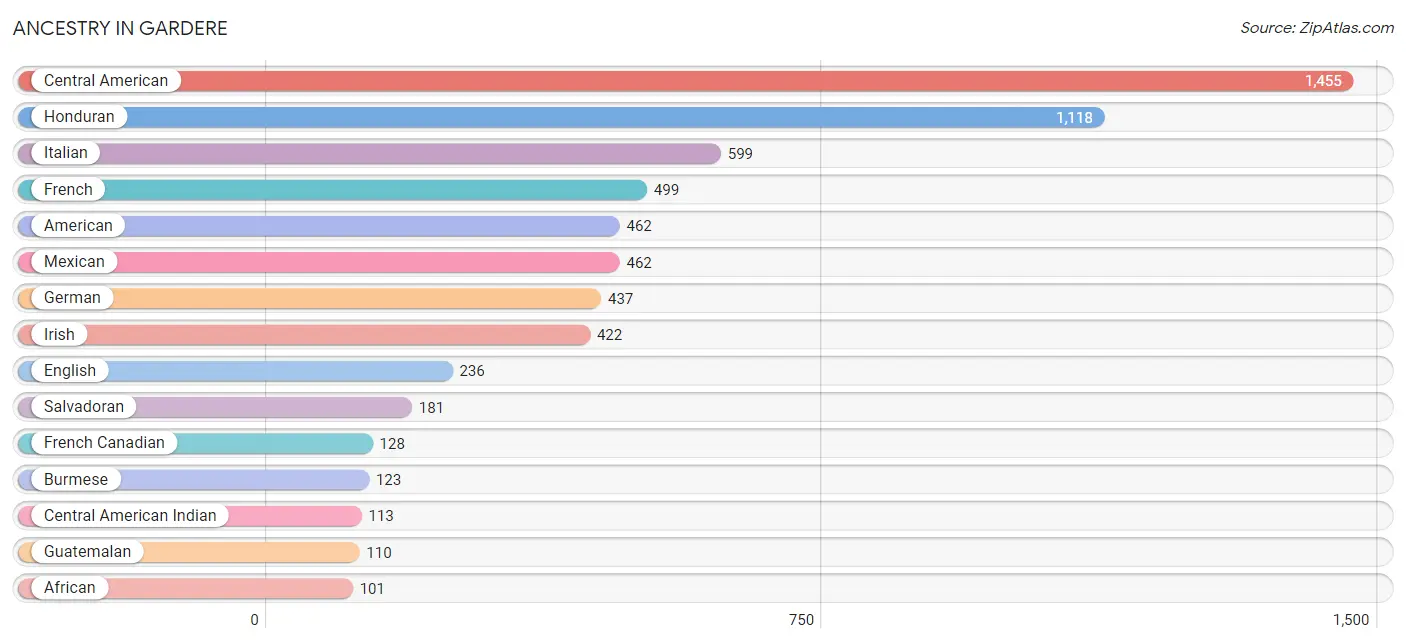
| Ancestry | # Population | % Population |
| African | 101 | 0.9% |
| American | 462 | 4.0% |
| Australian | 14 | 0.1% |
| British | 25 | 0.2% |
| Burmese | 123 | 1.1% |
| Central American | 1,455 | 12.6% |
| Central American Indian | 113 | 1.0% |
| Cuban | 39 | 0.3% |
| Danish | 9 | 0.1% |
| Dominican | 76 | 0.7% |
| English | 236 | 2.0% |
| European | 58 | 0.5% |
| Filipino | 41 | 0.4% |
| Finnish | 74 | 0.6% |
| French | 499 | 4.3% |
| French Canadian | 128 | 1.1% |
| German | 437 | 3.8% |
| Greek | 25 | 0.2% |
| Guatemalan | 110 | 0.9% |
| Honduran | 1,118 | 9.7% |
| Indian (Asian) | 101 | 0.9% |
| Irish | 422 | 3.6% |
| Italian | 599 | 5.2% |
| Mexican | 462 | 4.0% |
| Nicaraguan | 46 | 0.4% |
| Northern European | 34 | 0.3% |
| Polish | 33 | 0.3% |
| Portuguese | 33 | 0.3% |
| Puerto Rican | 5 | 0.0% |
| Russian | 13 | 0.1% |
| Salvadoran | 181 | 1.6% |
| Scandinavian | 8 | 0.1% |
| Scotch-Irish | 17 | 0.2% |
| Scottish | 43 | 0.4% |
| Slovak | 17 | 0.2% |
| Spaniard | 51 | 0.4% |
| Spanish | 19 | 0.2% |
| Sri Lankan | 42 | 0.4% |
| Subsaharan African | 101 | 0.9% |
| Swiss | 23 | 0.2% |
| Thai | 8 | 0.1% |
| Welsh | 26 | 0.2% | View All 42 Rows |
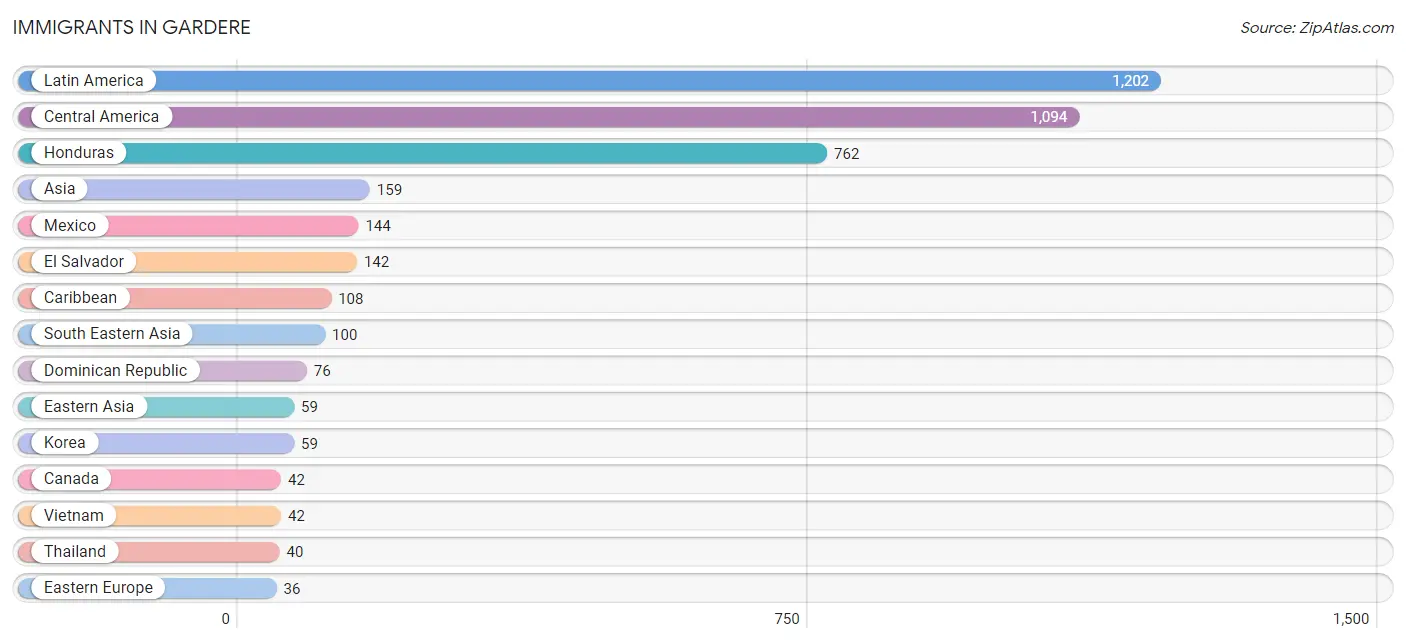
Immigrants in Gardere
The most numerous immigrant groups reported in Gardere came from Latin America (1,202 | 10.4%), Central America (1,094 | 9.5%), Honduras (762 | 6.6%), Asia (159 | 1.4%), and Mexico (144 | 1.3%), together accounting for 29.1% of all Gardere residents.
| Immigration Origin | # Population | % Population |
| Asia | 159 | 1.4% |
| Australia | 14 | 0.1% |
| Canada | 42 | 0.4% |
| Caribbean | 108 | 0.9% |
| Central America | 1,094 | 9.5% |
| Costa Rica | 17 | 0.2% |
| Cuba | 24 | 0.2% |
| Dominican Republic | 76 | 0.7% |
| Eastern Asia | 59 | 0.5% |
| Eastern Europe | 36 | 0.3% |
| El Salvador | 142 | 1.2% |
| Europe | 36 | 0.3% |
| Honduras | 762 | 6.6% |
| Korea | 59 | 0.5% |
| Laos | 18 | 0.2% |
| Latin America | 1,202 | 10.4% |
| Mexico | 144 | 1.3% |
| Nicaragua | 29 | 0.3% |
| Oceania | 14 | 0.1% |
| Romania | 36 | 0.3% |
| South Eastern Asia | 100 | 0.9% |
| Thailand | 40 | 0.4% |
| Trinidad and Tobago | 8 | 0.1% |
| Vietnam | 42 | 0.4% | View All 24 Rows |
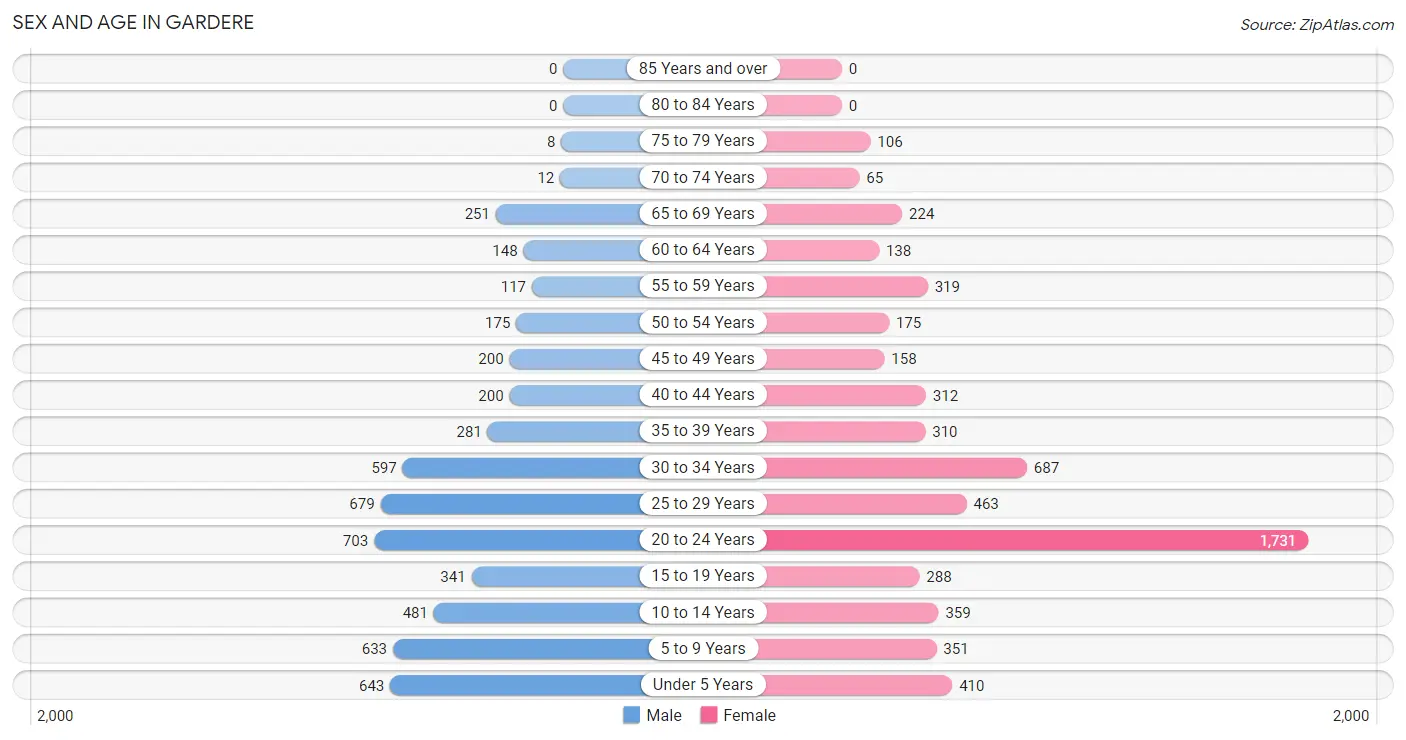
Sex and Age in Gardere
Sex and Age in Gardere
The most populous age groups in Gardere are 20 to 24 Years (703 | 12.9%) for men and 20 to 24 Years (1,731 | 28.4%) for women.
| Age Bracket | Male | Female |
| Under 5 Years | 643 (11.8%) | 410 (6.7%) |
| 5 to 9 Years | 633 (11.6%) | 351 (5.8%) |
| 10 to 14 Years | 481 (8.8%) | 359 (5.9%) |
| 15 to 19 Years | 341 (6.2%) | 288 (4.7%) |
| 20 to 24 Years | 703 (12.9%) | 1,731 (28.4%) |
| 25 to 29 Years | 679 (12.4%) | 463 (7.6%) |
| 30 to 34 Years | 597 (10.9%) | 687 (11.3%) |
| 35 to 39 Years | 281 (5.1%) | 310 (5.1%) |
| 40 to 44 Years | 200 (3.7%) | 312 (5.1%) |
| 45 to 49 Years | 200 (3.7%) | 158 (2.6%) |
| 50 to 54 Years | 175 (3.2%) | 175 (2.9%) |
| 55 to 59 Years | 117 (2.1%) | 319 (5.2%) |
| 60 to 64 Years | 148 (2.7%) | 138 (2.3%) |
| 65 to 69 Years | 251 (4.6%) | 224 (3.7%) |
| 70 to 74 Years | 12 (0.2%) | 65 (1.1%) |
| 75 to 79 Years | 8 (0.2%) | 106 (1.7%) |
| 80 to 84 Years | 0 (0.0%) | 0 (0.0%) |
| 85 Years and over | 0 (0.0%) | 0 (0.0%) |
| Total | 5,469 (100.0%) | 6,096 (100.0%) |
Families and Households in Gardere
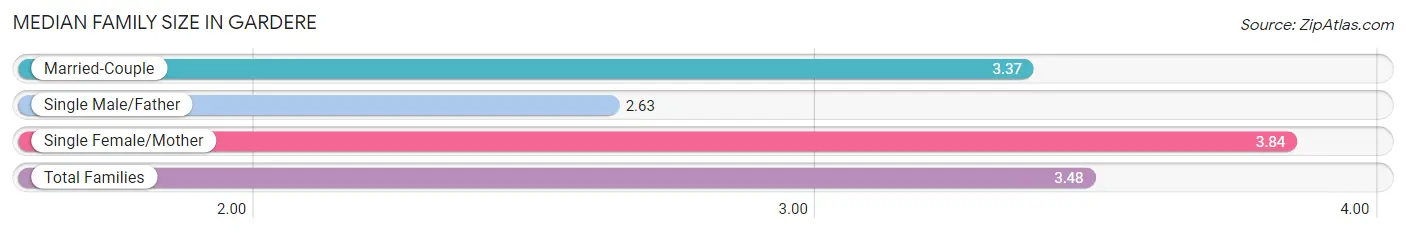
Median Family Size in Gardere
The median family size in Gardere is 3.48 persons per family, with single female/mother families (1,018 | 44.1%) accounting for the largest median family size of 3.84 persons per family. On the other hand, single male/father families (305 | 13.2%) represent the smallest median family size with 2.63 persons per family.
| Family Type | # Families | Family Size |
| Married-Couple | 984 (42.6%) | 3.37 |
| Single Male/Father | 305 (13.2%) | 2.63 |
| Single Female/Mother | 1,018 (44.1%) | 3.84 |
| Total Families | 2,307 (100.0%) | 3.48 |
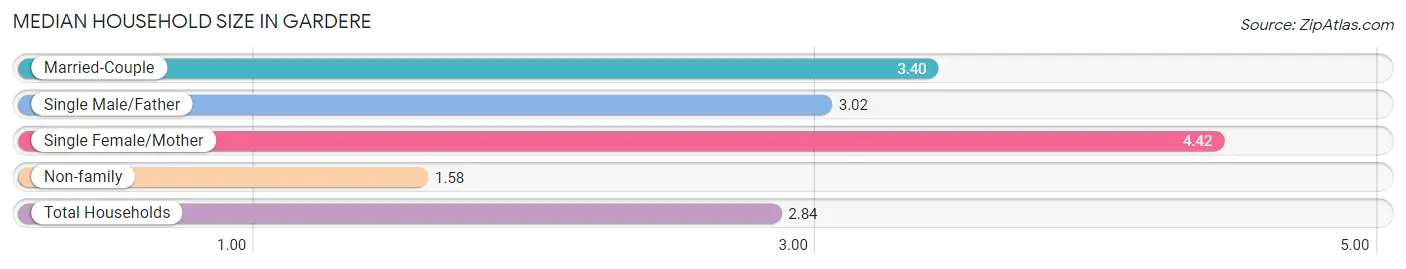
Median Household Size in Gardere
The median household size in Gardere is 2.84 persons per household, with single female/mother households (1,018 | 25.1%) accounting for the largest median household size of 4.42 persons per household. non-family households (1,755 | 43.2%) represent the smallest median household size with 1.58 persons per household.
| Household Type | # Households | Household Size |
| Married-Couple | 984 (24.2%) | 3.40 |
| Single Male/Father | 305 (7.5%) | 3.02 |
| Single Female/Mother | 1,018 (25.1%) | 4.42 |
| Non-family | 1,755 (43.2%) | 1.58 |
| Total Households | 4,062 (100.0%) | 2.84 |
Household Size by Marriage Status in Gardere
Out of a total of 4,062 households in Gardere, 2,307 (56.8%) are family households, while 1,755 (43.2%) are nonfamily households. The most numerous type of family households are 2-person households, comprising 841, and the most common type of nonfamily households are 1-person households, comprising 1,178.
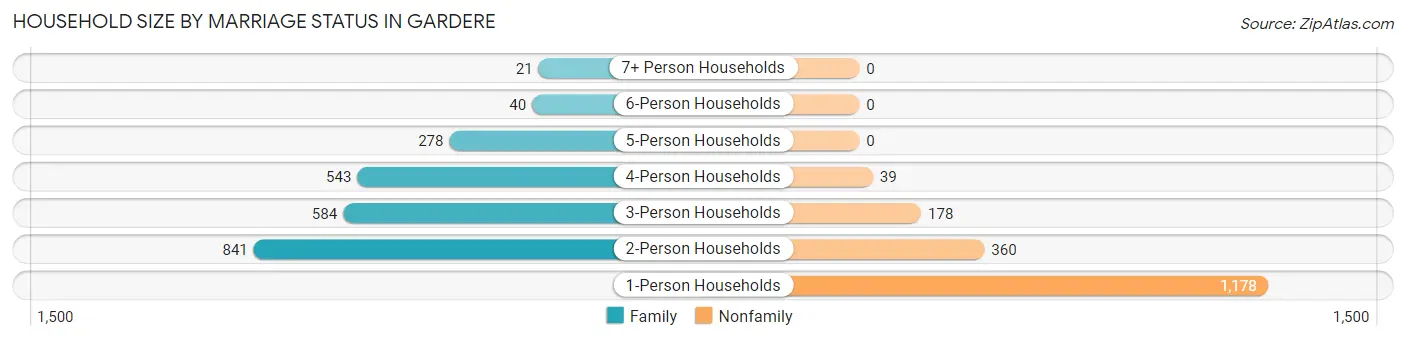
| Household Size | Family Households | Nonfamily Households |
| 1-Person Households | - | 1,178 (29.0%) |
| 2-Person Households | 841 (20.7%) | 360 (8.9%) |
| 3-Person Households | 584 (14.4%) | 178 (4.4%) |
| 4-Person Households | 543 (13.4%) | 39 (1.0%) |
| 5-Person Households | 278 (6.8%) | 0 (0.0%) |
| 6-Person Households | 40 (1.0%) | 0 (0.0%) |
| 7+ Person Households | 21 (0.5%) | 0 (0.0%) |
| Total | 2,307 (56.8%) | 1,755 (43.2%) |
Female Fertility in Gardere
Fertility by Age in Gardere
Average fertility rate in Gardere is 78.0 births per 1,000 women. Women in the age bracket of 20 to 34 years have the highest fertility rate with 84.0 births per 1,000 women. Women in the age bracket of 20 to 34 years acount for 78.9% of all women with births.
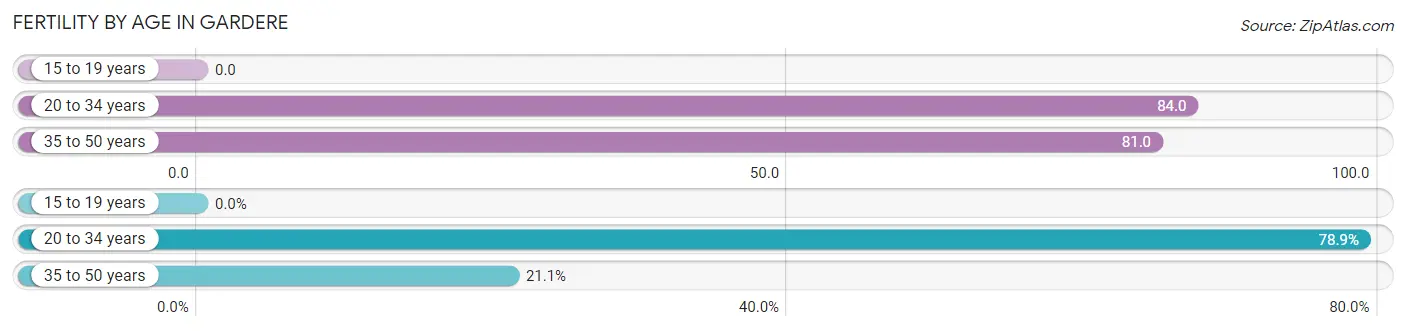
| Age Bracket | Women with Births | Births / 1,000 Women |
| 15 to 19 years | 0 (0.0%) | 0.0 |
| 20 to 34 years | 243 (78.9%) | 84.0 |
| 35 to 50 years | 65 (21.1%) | 81.0 |
| Total | 308 (100.0%) | 78.0 |
Fertility by Age by Marriage Status in Gardere
34.7% of women with births (308) in Gardere are married. The highest percentage of unmarried women with births falls into 20 to 34 years age bracket with 82.7% of them unmarried at the time of birth, while the lowest percentage of unmarried women with births belong to 35 to 50 years age bracket with 0.0% of them unmarried.
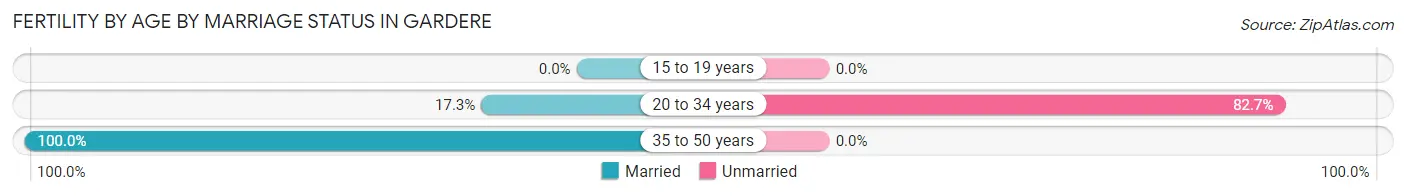
| Age Bracket | Married | Unmarried |
| 15 to 19 years | 0 (0.0%) | 0 (0.0%) |
| 20 to 34 years | 42 (17.3%) | 201 (82.7%) |
| 35 to 50 years | 65 (100.0%) | 0 (0.0%) |
| Total | 107 (34.7%) | 201 (65.3%) |
Fertility by Education in Gardere
Average fertility rate in Gardere is 78.0 births per 1,000 women. Women with the education attainment of less than high school have the highest fertility rate of 132.0 births per 1,000 women, while women with the education attainment of college or associate's degree have the lowest fertility at 20.0 births per 1,000 women. Women with the education attainment of high school diploma represent 45.8% of all women with births.
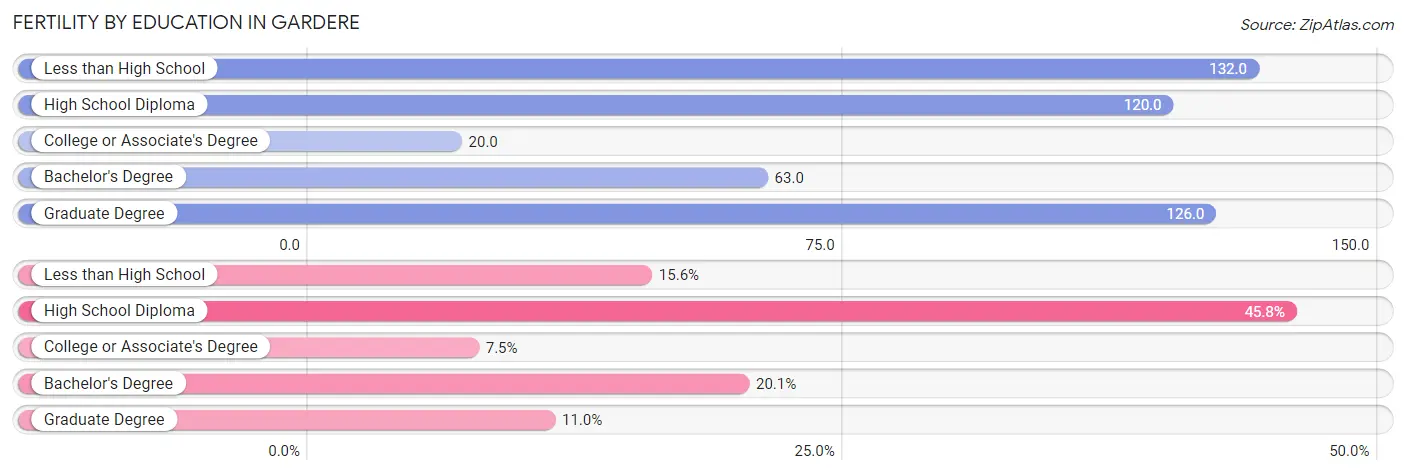
| Educational Attainment | Women with Births | Births / 1,000 Women |
| Less than High School | 48 (15.6%) | 132.0 |
| High School Diploma | 141 (45.8%) | 120.0 |
| College or Associate's Degree | 23 (7.5%) | 20.0 |
| Bachelor's Degree | 62 (20.1%) | 63.0 |
| Graduate Degree | 34 (11.0%) | 126.0 |
| Total | 308 (100.0%) | 78.0 |
Fertility by Education by Marriage Status in Gardere
65.3% of women with births in Gardere are unmarried. Women with the educational attainment of college or associate's degree are most likely to be married with 100.0% of them married at childbirth, while women with the educational attainment of high school diploma are least likely to be married with 100.0% of them unmarried at childbirth.
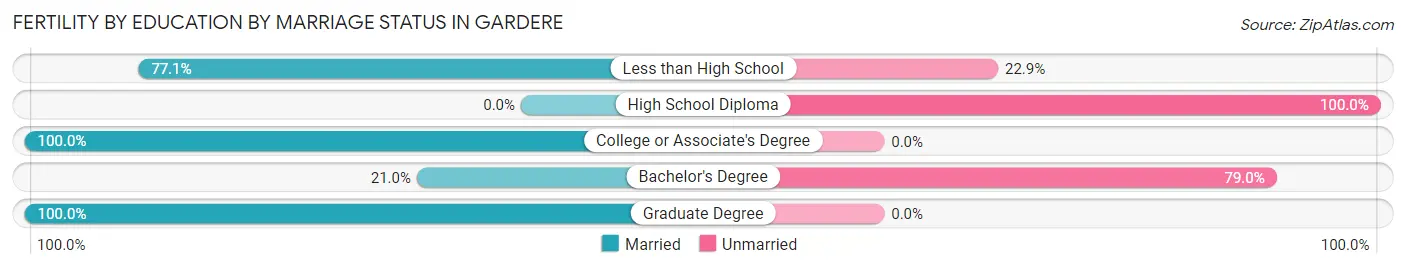
| Educational Attainment | Married | Unmarried |
| Less than High School | 37 (77.1%) | 11 (22.9%) |
| High School Diploma | 0 (0.0%) | 141 (100.0%) |
| College or Associate's Degree | 23 (100.0%) | 0 (0.0%) |
| Bachelor's Degree | 13 (21.0%) | 49 (79.0%) |
| Graduate Degree | 34 (100.0%) | 0 (0.0%) |
| Total | 107 (34.7%) | 201 (65.3%) |
Employment Characteristics in Gardere
Employment by Class of Employer in Gardere
Among the 6,099 employed individuals in Gardere, private company employees (4,479 | 73.4%), self-employed (not incorporated) (481 | 7.9%), and state government employees (470 | 7.7%) make up the most common classes of employment.
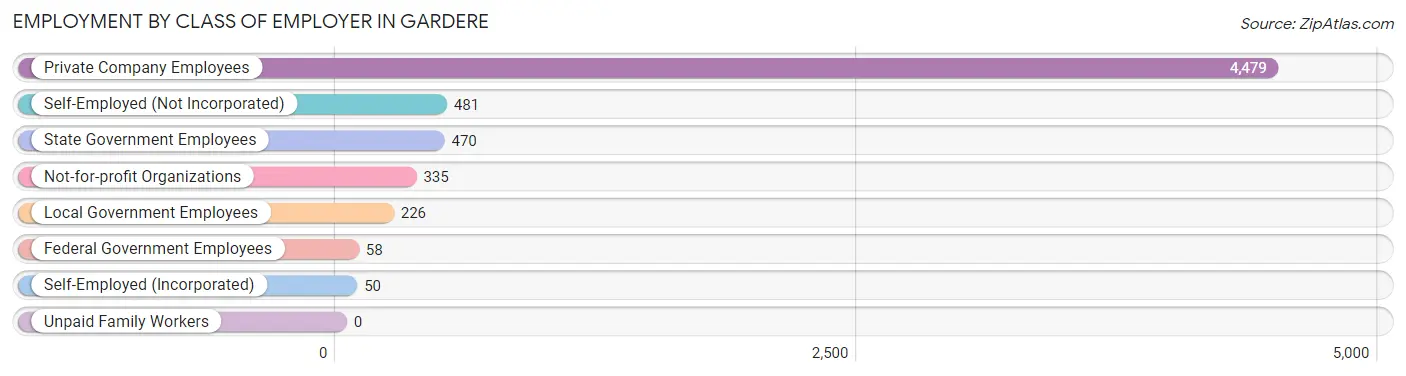
| Employer Class | # Employees | % Employees |
| Private Company Employees | 4,479 | 73.4% |
| Self-Employed (Incorporated) | 50 | 0.8% |
| Self-Employed (Not Incorporated) | 481 | 7.9% |
| Not-for-profit Organizations | 335 | 5.5% |
| Local Government Employees | 226 | 3.7% |
| State Government Employees | 470 | 7.7% |
| Federal Government Employees | 58 | 0.9% |
| Unpaid Family Workers | 0 | 0.0% |
| Total | 6,099 | 100.0% |
Employment Status by Age in Gardere
According to the labor force statistics for Gardere, out of the total population over 16 years of age (8,578), 78.9% or 6,768 individuals are in the labor force, with 6.2% or 420 of them unemployed. The age group with the highest labor force participation rate is 30 to 34 years, with 94.4% or 1,212 individuals in the labor force. Within the labor force, the 16 to 19 years age range has the highest percentage of unemployed individuals, with 57.2% or 171 of them being unemployed.
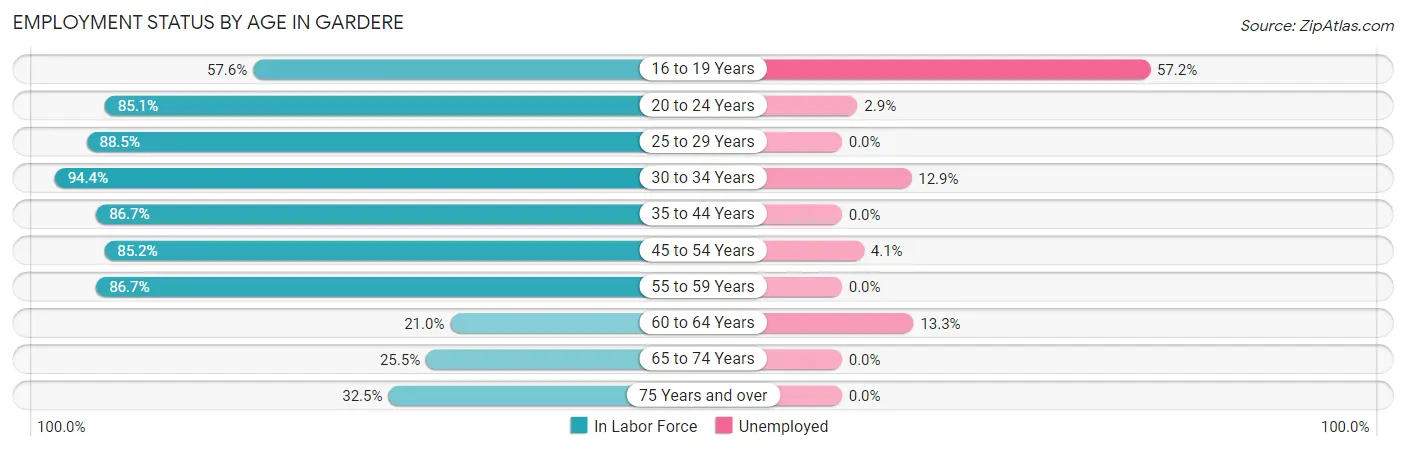
| Age Bracket | In Labor Force | Unemployed |
| 16 to 19 Years | 299 (57.6%) | 171 (57.2%) |
| 20 to 24 Years | 2,071 (85.1%) | 60 (2.9%) |
| 25 to 29 Years | 1,011 (88.5%) | 0 (0.0%) |
| 30 to 34 Years | 1,212 (94.4%) | 156 (12.9%) |
| 35 to 44 Years | 956 (86.7%) | 0 (0.0%) |
| 45 to 54 Years | 603 (85.2%) | 25 (4.1%) |
| 55 to 59 Years | 378 (86.7%) | 0 (0.0%) |
| 60 to 64 Years | 60 (21.0%) | 8 (13.3%) |
| 65 to 74 Years | 141 (25.5%) | 0 (0.0%) |
| 75 Years and over | 37 (32.5%) | 0 (0.0%) |
| Total | 6,768 (78.9%) | 420 (6.2%) |
Employment Status by Educational Attainment in Gardere
According to labor force statistics for Gardere, 85.1% of individuals (4,220) out of the total population between 25 and 64 years of age (4,959) are in the labor force, with 4.5% or 190 of them being unemployed. The group with the highest labor force participation rate are those with the educational attainment of bachelor's degree or higher, with 92.1% or 1,554 individuals in the labor force. Within the labor force, individuals with less than high school education have the highest percentage of unemployment, with 16.0% or 55 of them being unemployed.
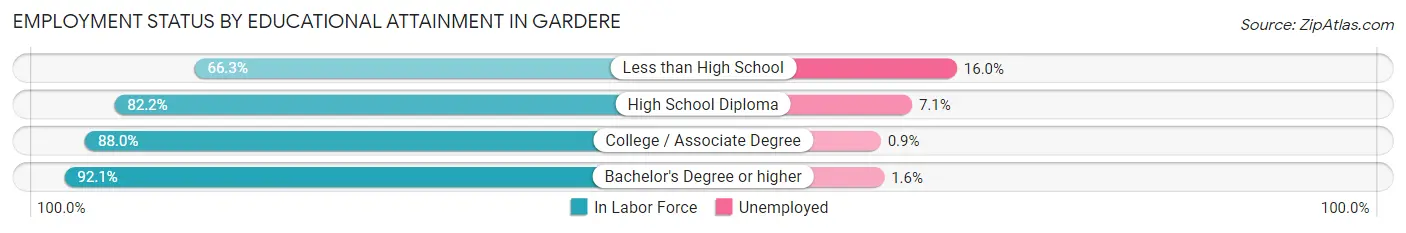
| Educational Attainment | In Labor Force | Unemployed |
| Less than High School | 343 (66.3%) | 83 (16.0%) |
| High School Diploma | 1,421 (82.2%) | 123 (7.1%) |
| College / Associate Degree | 903 (88.0%) | 9 (0.9%) |
| Bachelor's Degree or higher | 1,554 (92.1%) | 27 (1.6%) |
| Total | 4,220 (85.1%) | 223 (4.5%) |
Employment Occupations by Sex in Gardere
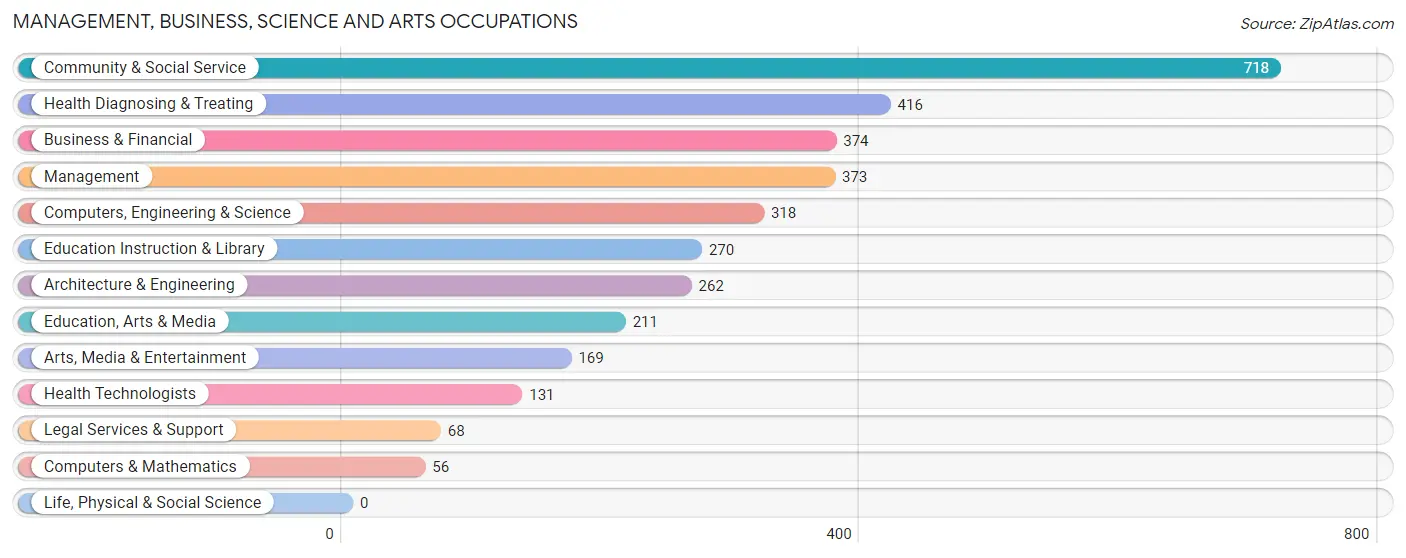
Management, Business, Science and Arts Occupations
The most common Management, Business, Science and Arts occupations in Gardere are Community & Social Service (718 | 11.3%), Health Diagnosing & Treating (416 | 6.6%), Business & Financial (374 | 5.9%), Management (373 | 5.9%), and Computers, Engineering & Science (318 | 5.0%).
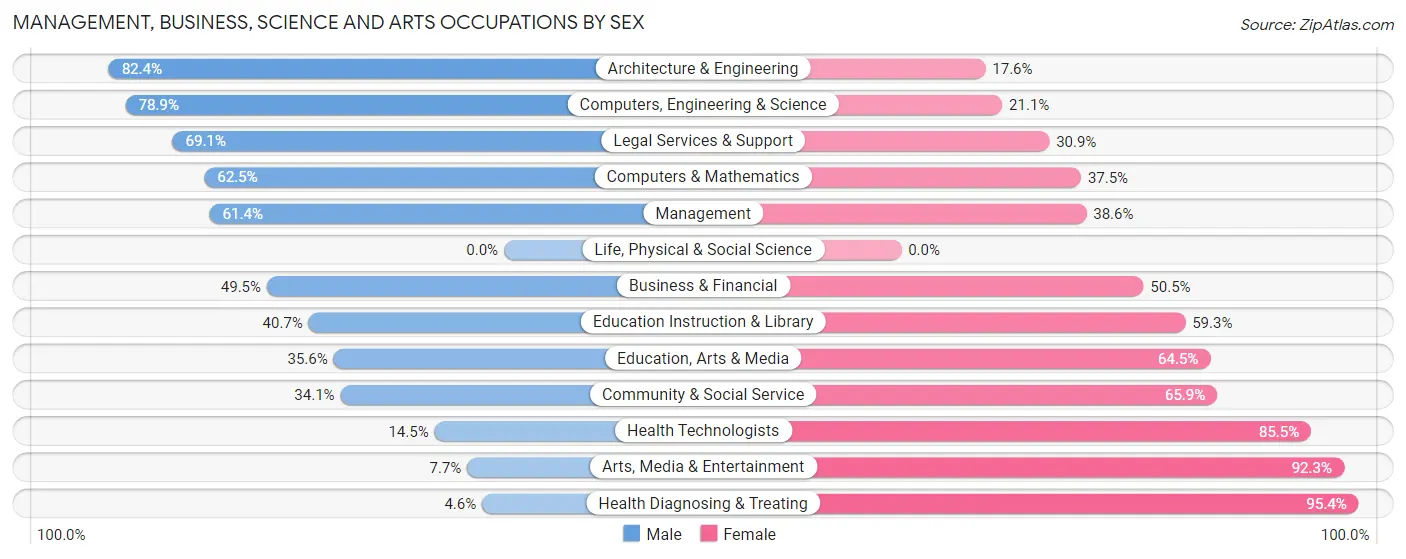
Management, Business, Science and Arts Occupations by Sex
Within the Management, Business, Science and Arts occupations in Gardere, the most male-oriented occupations are Architecture & Engineering (82.4%), Computers, Engineering & Science (78.9%), and Legal Services & Support (69.1%), while the most female-oriented occupations are Health Diagnosing & Treating (95.4%), Arts, Media & Entertainment (92.3%), and Health Technologists (85.5%).
| Occupation | Male | Female |
| Management | 229 (61.4%) | 144 (38.6%) |
| Business & Financial | 185 (49.5%) | 189 (50.5%) |
| Computers, Engineering & Science | 251 (78.9%) | 67 (21.1%) |
| Computers & Mathematics | 35 (62.5%) | 21 (37.5%) |
| Architecture & Engineering | 216 (82.4%) | 46 (17.6%) |
| Life, Physical & Social Science | 0 (0.0%) | 0 (0.0%) |
| Community & Social Service | 245 (34.1%) | 473 (65.9%) |
| Education, Arts & Media | 75 (35.5%) | 136 (64.4%) |
| Legal Services & Support | 47 (69.1%) | 21 (30.9%) |
| Education Instruction & Library | 110 (40.7%) | 160 (59.3%) |
| Arts, Media & Entertainment | 13 (7.7%) | 156 (92.3%) |
| Health Diagnosing & Treating | 19 (4.6%) | 397 (95.4%) |
| Health Technologists | 19 (14.5%) | 112 (85.5%) |
| Total (Category) | 929 (42.2%) | 1,270 (57.8%) |
| Total (Overall) | 2,685 (42.3%) | 3,663 (57.7%) |
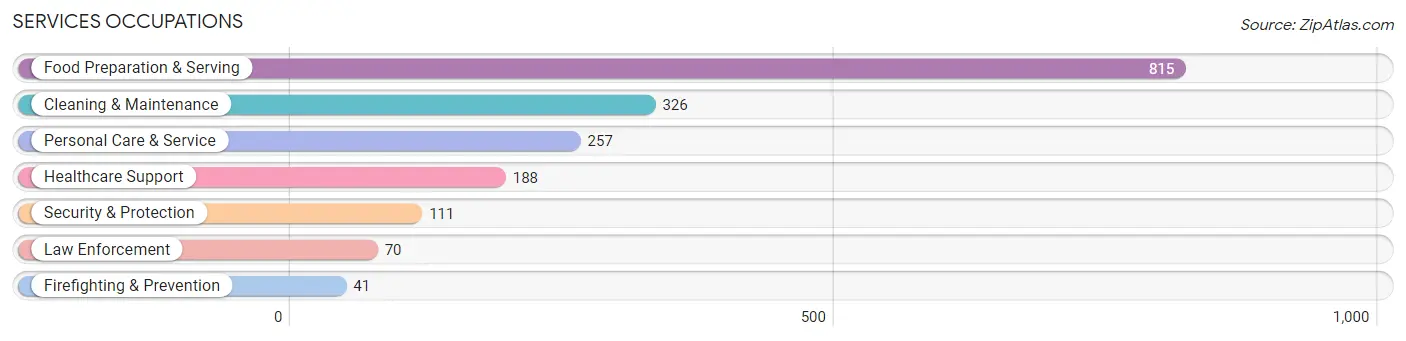
Services Occupations
The most common Services occupations in Gardere are Food Preparation & Serving (815 | 12.8%), Cleaning & Maintenance (326 | 5.1%), Personal Care & Service (257 | 4.1%), Healthcare Support (188 | 3.0%), and Security & Protection (111 | 1.8%).
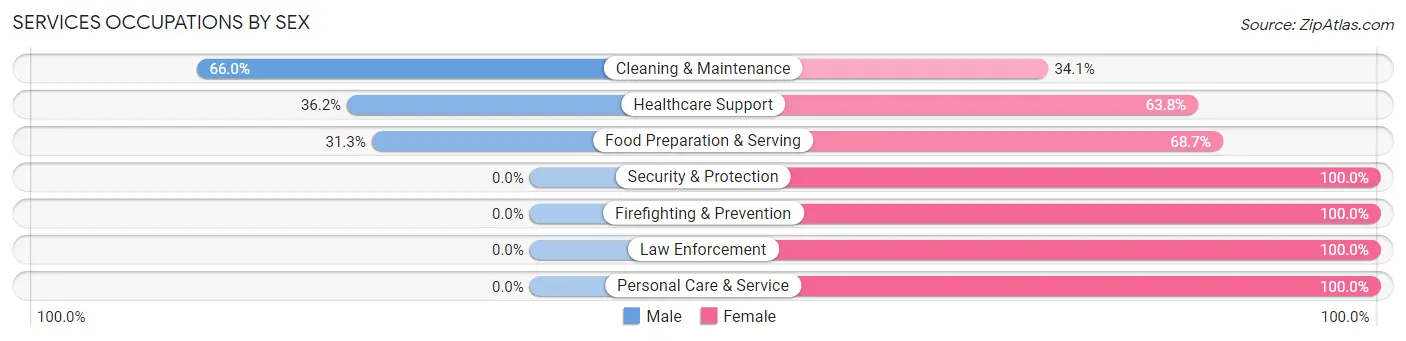
Services Occupations by Sex
Within the Services occupations in Gardere, the most male-oriented occupations are Cleaning & Maintenance (65.9%), Healthcare Support (36.2%), and Food Preparation & Serving (31.3%), while the most female-oriented occupations are Security & Protection (100.0%), Firefighting & Prevention (100.0%), and Law Enforcement (100.0%).
| Occupation | Male | Female |
| Healthcare Support | 68 (36.2%) | 120 (63.8%) |
| Security & Protection | 0 (0.0%) | 111 (100.0%) |
| Firefighting & Prevention | 0 (0.0%) | 41 (100.0%) |
| Law Enforcement | 0 (0.0%) | 70 (100.0%) |
| Food Preparation & Serving | 255 (31.3%) | 560 (68.7%) |
| Cleaning & Maintenance | 215 (65.9%) | 111 (34.1%) |
| Personal Care & Service | 0 (0.0%) | 257 (100.0%) |
| Total (Category) | 538 (31.7%) | 1,159 (68.3%) |
| Total (Overall) | 2,685 (42.3%) | 3,663 (57.7%) |
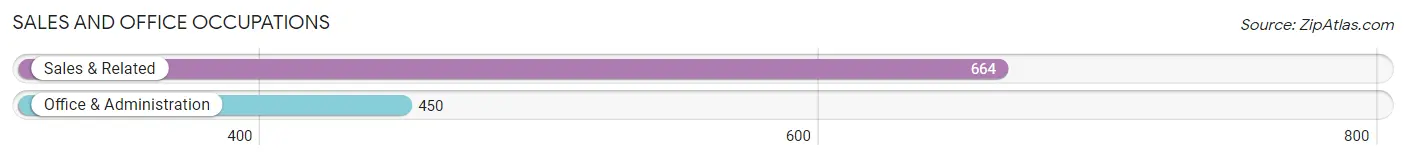
Sales and Office Occupations
The most common Sales and Office occupations in Gardere are Sales & Related (664 | 10.5%), and Office & Administration (450 | 7.1%).
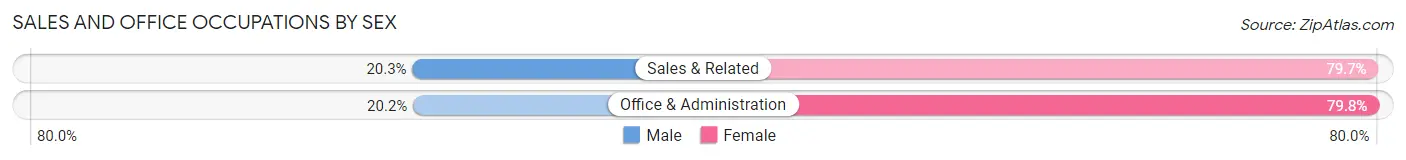
Sales and Office Occupations by Sex
| Occupation | Male | Female |
| Sales & Related | 135 (20.3%) | 529 (79.7%) |
| Office & Administration | 91 (20.2%) | 359 (79.8%) |
| Total (Category) | 226 (20.3%) | 888 (79.7%) |
| Total (Overall) | 2,685 (42.3%) | 3,663 (57.7%) |
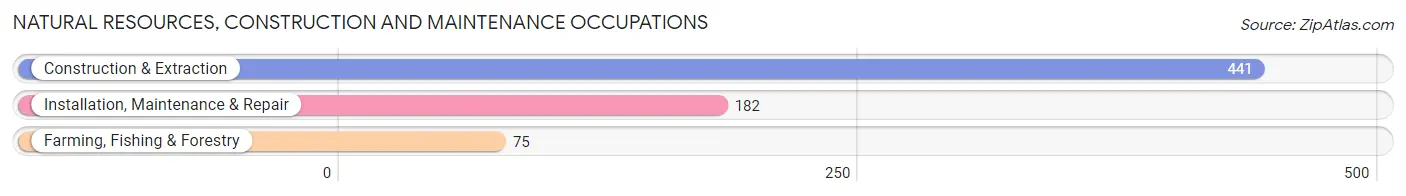
Natural Resources, Construction and Maintenance Occupations
The most common Natural Resources, Construction and Maintenance occupations in Gardere are Construction & Extraction (441 | 7.0%), Installation, Maintenance & Repair (182 | 2.9%), and Farming, Fishing & Forestry (75 | 1.2%).
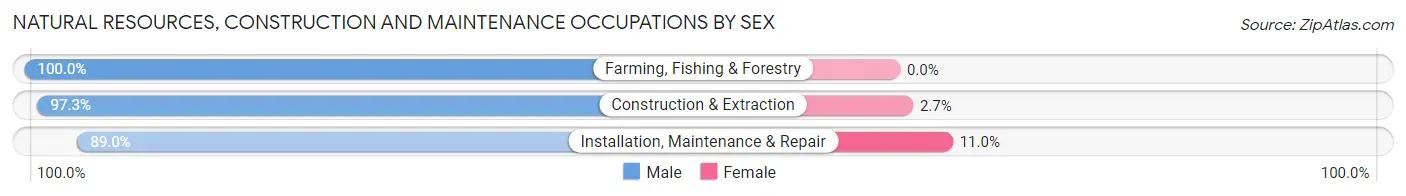
Natural Resources, Construction and Maintenance Occupations by Sex
| Occupation | Male | Female |
| Farming, Fishing & Forestry | 75 (100.0%) | 0 (0.0%) |
| Construction & Extraction | 429 (97.3%) | 12 (2.7%) |
| Installation, Maintenance & Repair | 162 (89.0%) | 20 (11.0%) |
| Total (Category) | 666 (95.4%) | 32 (4.6%) |
| Total (Overall) | 2,685 (42.3%) | 3,663 (57.7%) |
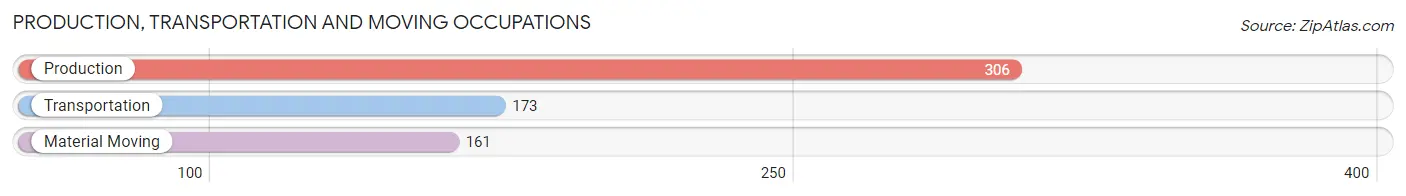
Production, Transportation and Moving Occupations
The most common Production, Transportation and Moving occupations in Gardere are Production (306 | 4.8%), Transportation (173 | 2.7%), and Material Moving (161 | 2.5%).
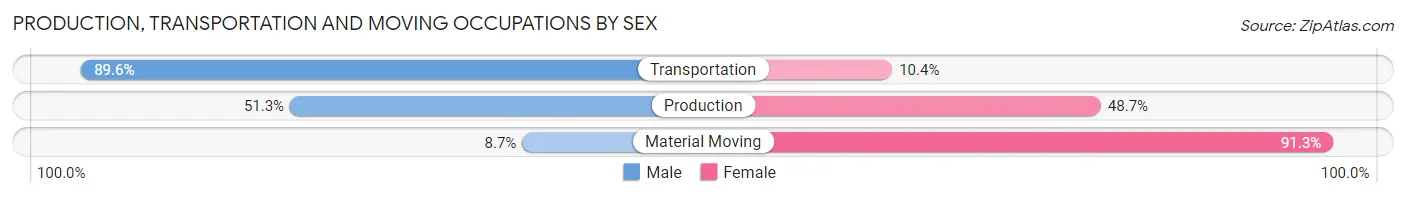
Production, Transportation and Moving Occupations by Sex
| Occupation | Male | Female |
| Production | 157 (51.3%) | 149 (48.7%) |
| Transportation | 155 (89.6%) | 18 (10.4%) |
| Material Moving | 14 (8.7%) | 147 (91.3%) |
| Total (Category) | 326 (50.9%) | 314 (49.1%) |
| Total (Overall) | 2,685 (42.3%) | 3,663 (57.7%) |
Employment Industries by Sex in Gardere
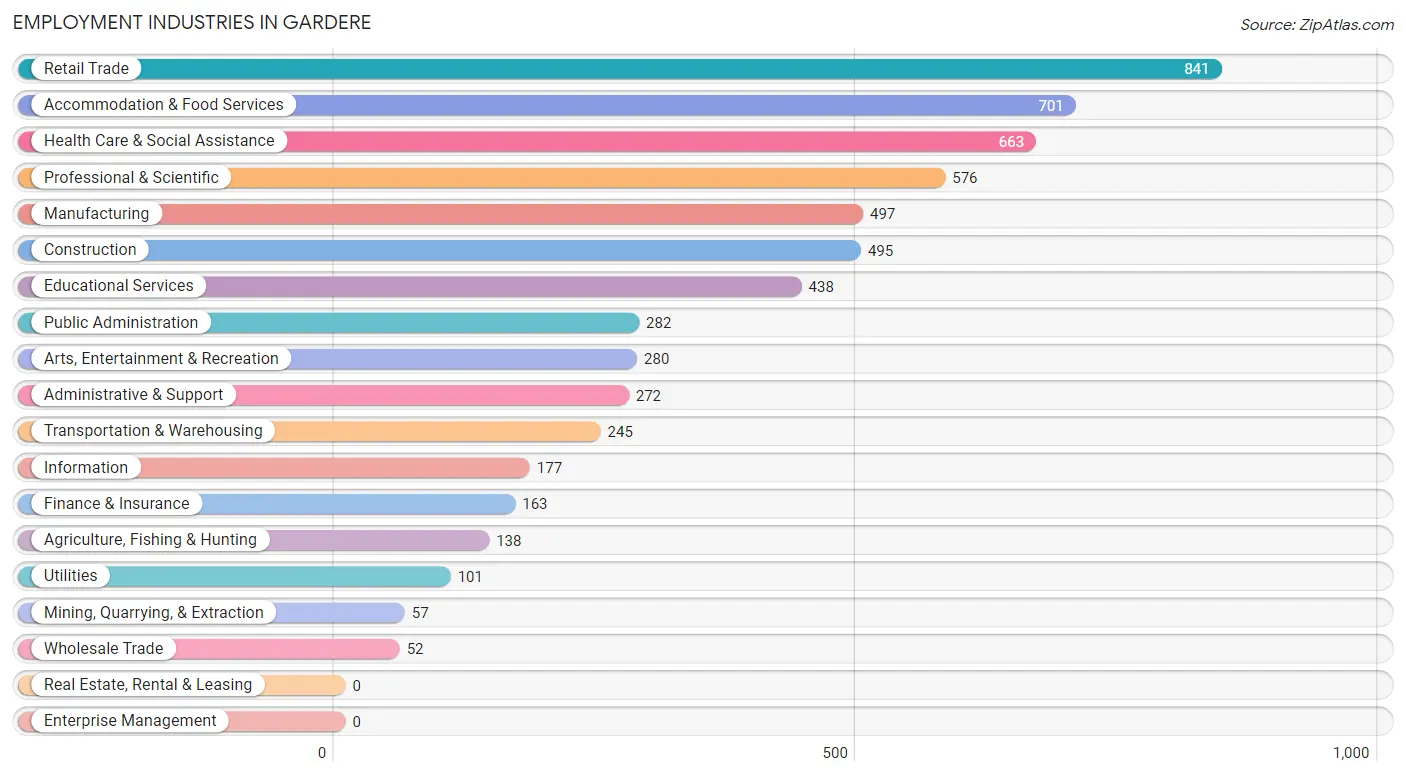
Employment Industries in Gardere
The major employment industries in Gardere include Retail Trade (841 | 13.3%), Accommodation & Food Services (701 | 11.0%), Health Care & Social Assistance (663 | 10.4%), Professional & Scientific (576 | 9.1%), and Manufacturing (497 | 7.8%).
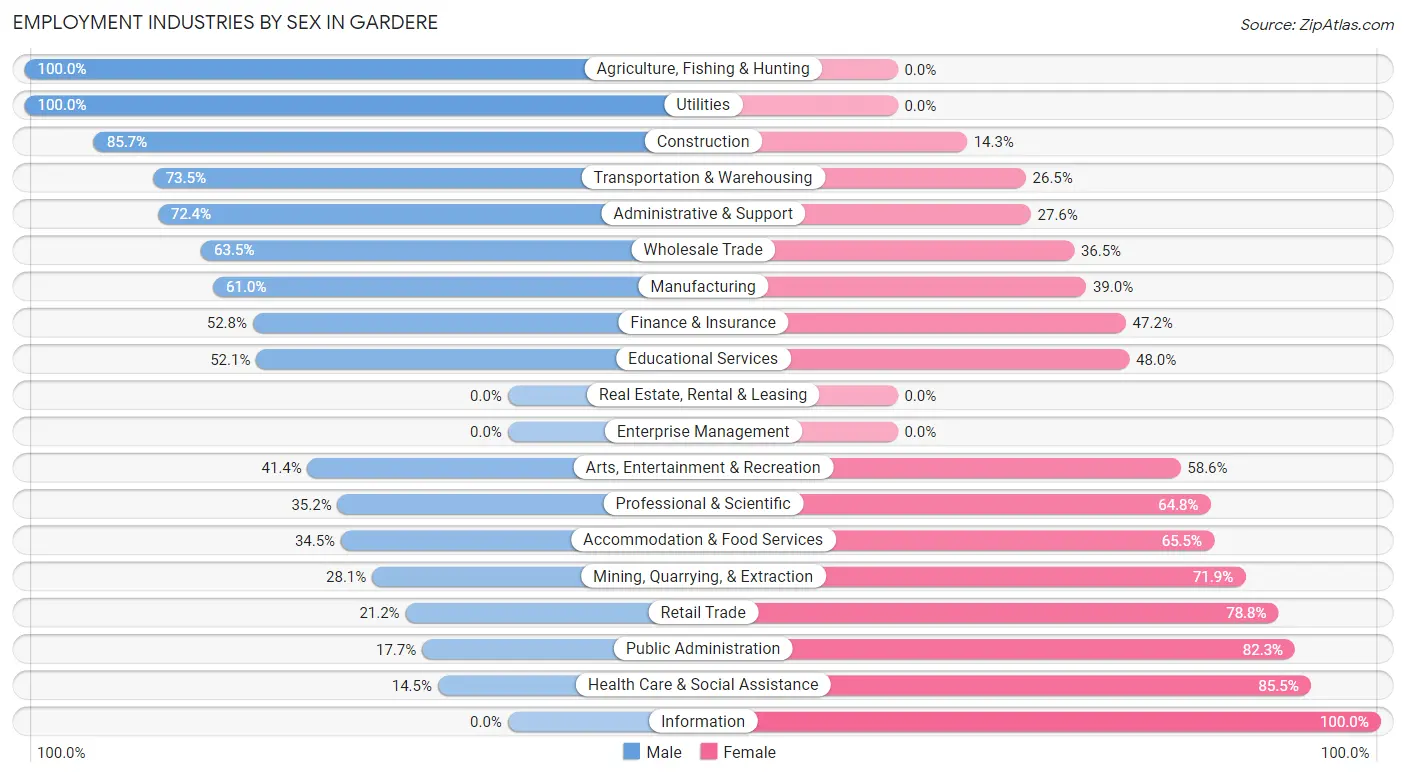
Employment Industries by Sex in Gardere
The Gardere industries that see more men than women are Agriculture, Fishing & Hunting (100.0%), Utilities (100.0%), and Construction (85.7%), whereas the industries that tend to have a higher number of women are Information (100.0%), Health Care & Social Assistance (85.5%), and Public Administration (82.3%).
| Industry | Male | Female |
| Agriculture, Fishing & Hunting | 138 (100.0%) | 0 (0.0%) |
| Mining, Quarrying, & Extraction | 16 (28.1%) | 41 (71.9%) |
| Construction | 424 (85.7%) | 71 (14.3%) |
| Manufacturing | 303 (61.0%) | 194 (39.0%) |
| Wholesale Trade | 33 (63.5%) | 19 (36.5%) |
| Retail Trade | 178 (21.2%) | 663 (78.8%) |
| Transportation & Warehousing | 180 (73.5%) | 65 (26.5%) |
| Utilities | 101 (100.0%) | 0 (0.0%) |
| Information | 0 (0.0%) | 177 (100.0%) |
| Finance & Insurance | 86 (52.8%) | 77 (47.2%) |
| Real Estate, Rental & Leasing | 0 (0.0%) | 0 (0.0%) |
| Professional & Scientific | 203 (35.2%) | 373 (64.8%) |
| Enterprise Management | 0 (0.0%) | 0 (0.0%) |
| Administrative & Support | 197 (72.4%) | 75 (27.6%) |
| Educational Services | 228 (52.0%) | 210 (47.9%) |
| Health Care & Social Assistance | 96 (14.5%) | 567 (85.5%) |
| Arts, Entertainment & Recreation | 116 (41.4%) | 164 (58.6%) |
| Accommodation & Food Services | 242 (34.5%) | 459 (65.5%) |
| Public Administration | 50 (17.7%) | 232 (82.3%) |
| Total | 2,685 (42.3%) | 3,663 (57.7%) |
Education in Gardere
School Enrollment in Gardere
The most common levels of schooling among the 3,970 students in Gardere are college / undergraduate (1,470 | 37.0%), elementary school (854 | 21.5%), and middle school (686 | 17.3%).
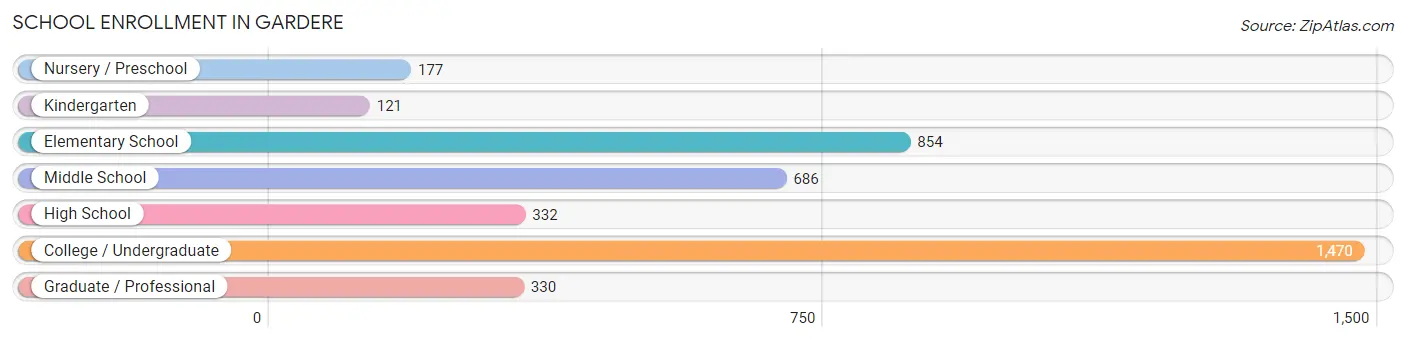
| School Level | # Students | % Students |
| Nursery / Preschool | 177 | 4.5% |
| Kindergarten | 121 | 3.0% |
| Elementary School | 854 | 21.5% |
| Middle School | 686 | 17.3% |
| High School | 332 | 8.4% |
| College / Undergraduate | 1,470 | 37.0% |
| Graduate / Professional | 330 | 8.3% |
| Total | 3,970 | 100.0% |
School Enrollment by Age by Funding Source in Gardere
Out of a total of 3,970 students who are enrolled in schools in Gardere, 421 (10.6%) attend a private institution, while the remaining 3,549 (89.4%) are enrolled in public schools. The age group of 3 to 4 year olds has the highest likelihood of being enrolled in private schools, with 84 (63.6% in the age bracket) enrolled. Conversely, the age group of 5 to 9 year old has the lowest likelihood of being enrolled in a private school, with 815 (96.3% in the age bracket) attending a public institution.
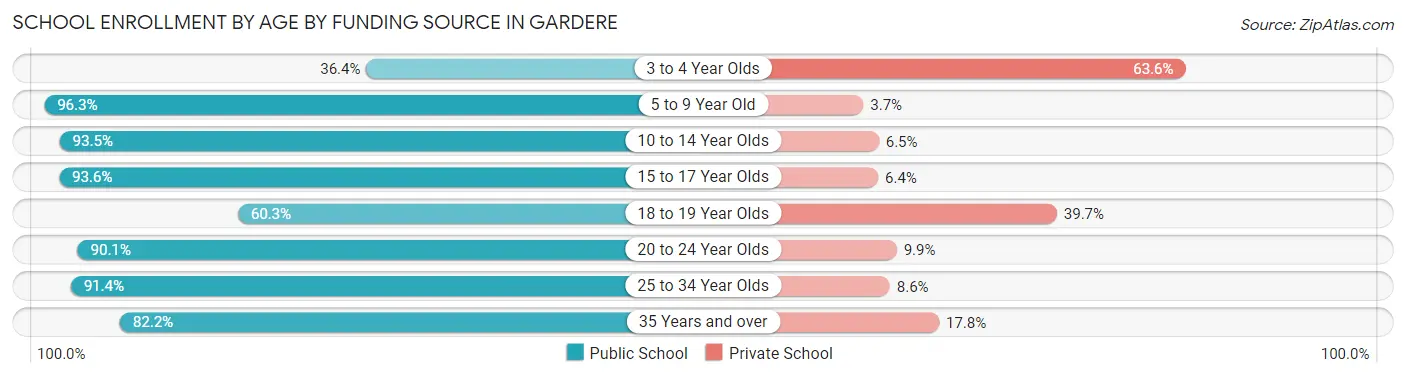
| Age Bracket | Public School | Private School |
| 3 to 4 Year Olds | 48 (36.4%) | 84 (63.6%) |
| 5 to 9 Year Old | 815 (96.3%) | 31 (3.7%) |
| 10 to 14 Year Olds | 715 (93.5%) | 50 (6.5%) |
| 15 to 17 Year Olds | 248 (93.6%) | 17 (6.4%) |
| 18 to 19 Year Olds | 82 (60.3%) | 54 (39.7%) |
| 20 to 24 Year Olds | 1,350 (90.1%) | 148 (9.9%) |
| 25 to 34 Year Olds | 202 (91.4%) | 19 (8.6%) |
| 35 Years and over | 88 (82.2%) | 19 (17.8%) |
| Total | 3,549 (89.4%) | 421 (10.6%) |
Educational Attainment by Field of Study in Gardere
Business (383 | 20.2%), engineering (357 | 18.8%), science & technology (220 | 11.6%), social sciences (190 | 10.0%), and arts & humanities (188 | 9.9%) are the most common fields of study among 1,899 individuals in Gardere who have obtained a bachelor's degree or higher.
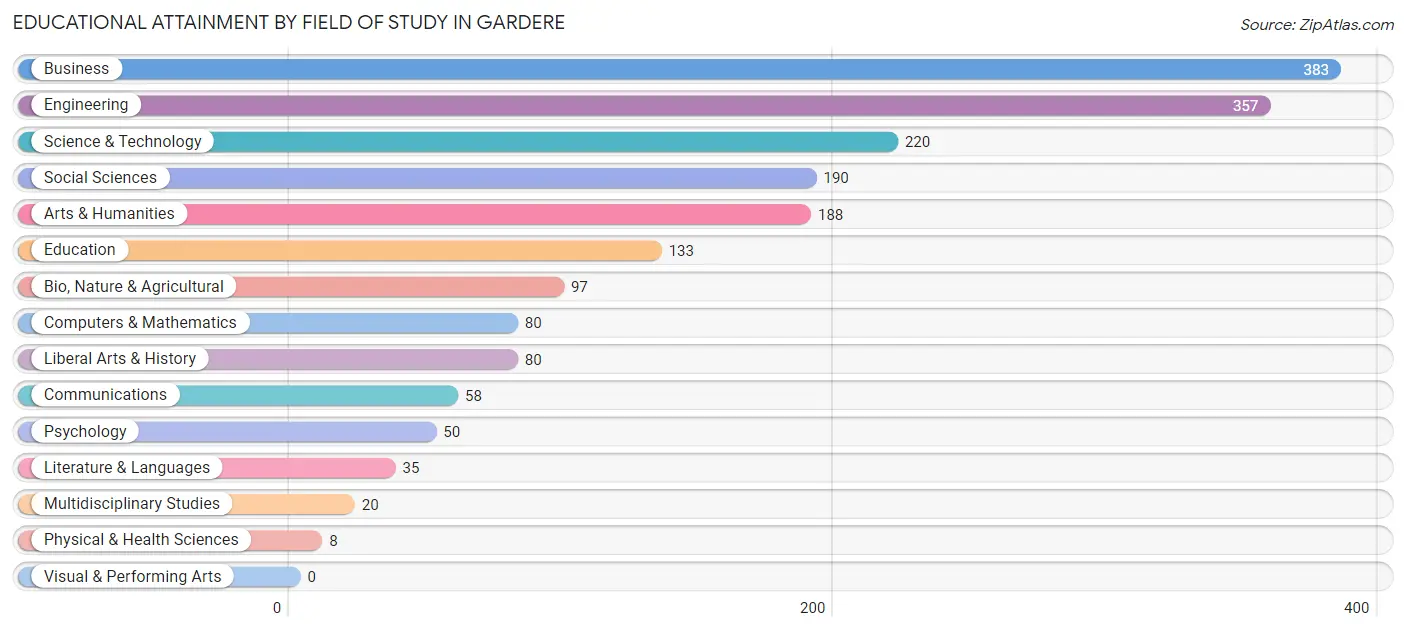
| Field of Study | # Graduates | % Graduates |
| Computers & Mathematics | 80 | 4.2% |
| Bio, Nature & Agricultural | 97 | 5.1% |
| Physical & Health Sciences | 8 | 0.4% |
| Psychology | 50 | 2.6% |
| Social Sciences | 190 | 10.0% |
| Engineering | 357 | 18.8% |
| Multidisciplinary Studies | 20 | 1.1% |
| Science & Technology | 220 | 11.6% |
| Business | 383 | 20.2% |
| Education | 133 | 7.0% |
| Literature & Languages | 35 | 1.8% |
| Liberal Arts & History | 80 | 4.2% |
| Visual & Performing Arts | 0 | 0.0% |
| Communications | 58 | 3.0% |
| Arts & Humanities | 188 | 9.9% |
| Total | 1,899 | 100.0% |
Transportation & Commute in Gardere
Vehicle Availability by Sex in Gardere
The most prevalent vehicle ownership categories in Gardere are males with 2 vehicles (1,524, accounting for 56.9%) and females with 2 vehicles (1,047, making up 44.6%).
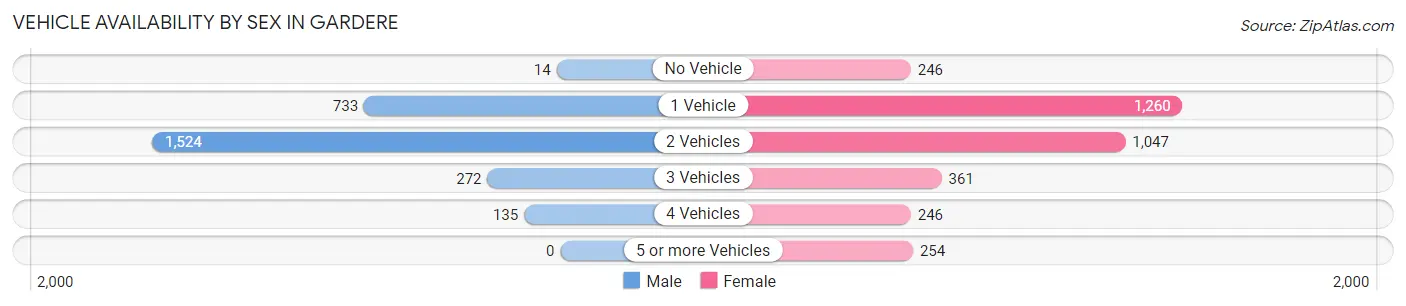
| Vehicles Available | Male | Female |
| No Vehicle | 14 (0.5%) | 246 (7.2%) |
| 1 Vehicle | 733 (27.4%) | 1,260 (36.9%) |
| 2 Vehicles | 1,524 (56.9%) | 1,047 (30.7%) |
| 3 Vehicles | 272 (10.2%) | 361 (10.6%) |
| 4 Vehicles | 135 (5.0%) | 246 (7.2%) |
| 5 or more Vehicles | 0 (0.0%) | 254 (7.4%) |
| Total | 2,678 (100.0%) | 3,414 (100.0%) |
Commute Time in Gardere
The most frequently occuring commute durations in Gardere are 20 to 24 minutes (1,772 commuters, 31.2%), 15 to 19 minutes (1,324 commuters, 23.4%), and 30 to 34 minutes (736 commuters, 13.0%).
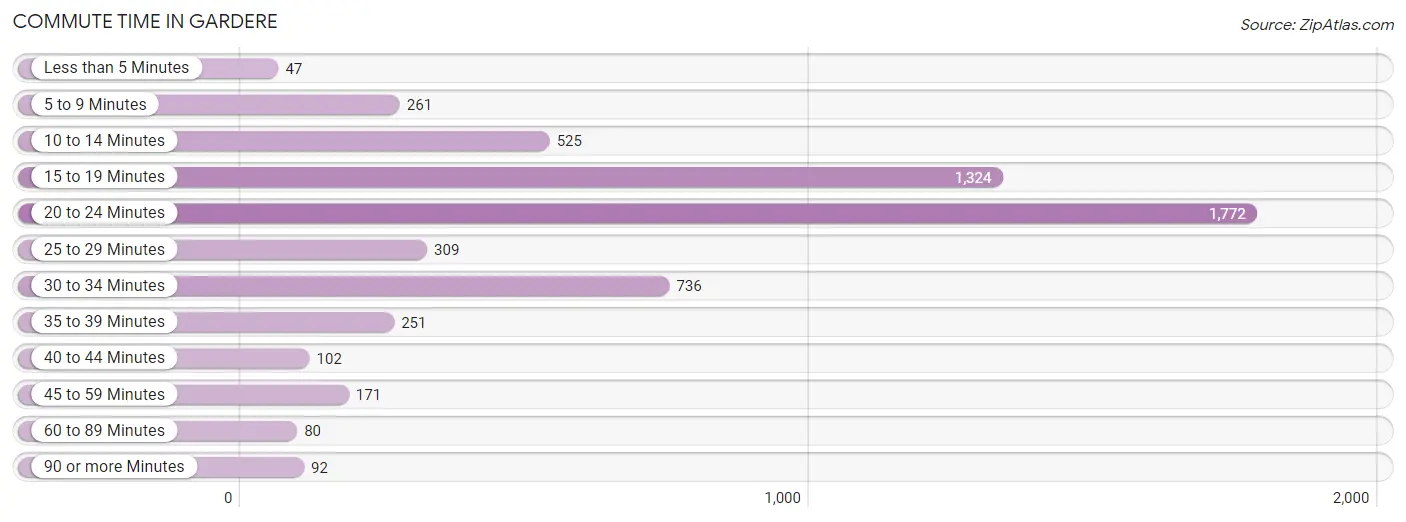
| Commute Time | # Commuters | % Commuters |
| Less than 5 Minutes | 47 | 0.8% |
| 5 to 9 Minutes | 261 | 4.6% |
| 10 to 14 Minutes | 525 | 9.3% |
| 15 to 19 Minutes | 1,324 | 23.4% |
| 20 to 24 Minutes | 1,772 | 31.2% |
| 25 to 29 Minutes | 309 | 5.4% |
| 30 to 34 Minutes | 736 | 13.0% |
| 35 to 39 Minutes | 251 | 4.4% |
| 40 to 44 Minutes | 102 | 1.8% |
| 45 to 59 Minutes | 171 | 3.0% |
| 60 to 89 Minutes | 80 | 1.4% |
| 90 or more Minutes | 92 | 1.6% |
Commute Time by Sex in Gardere
The most common commute times in Gardere are 20 to 24 minutes (708 commuters, 28.7%) for males and 20 to 24 minutes (1,064 commuters, 33.2%) for females.
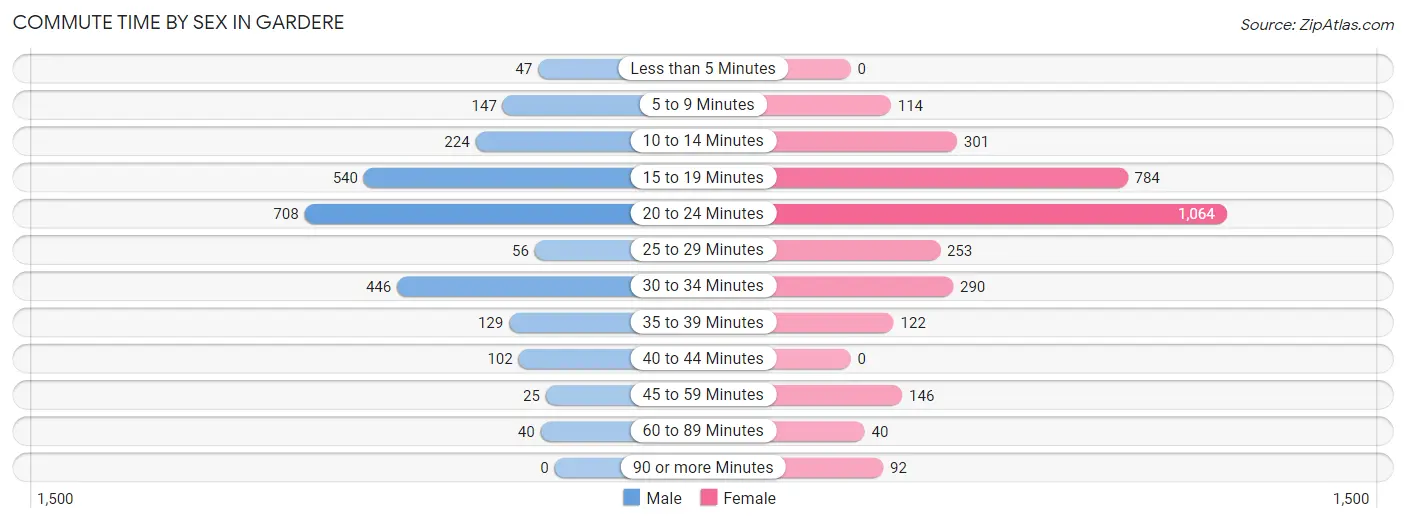
| Commute Time | Male | Female |
| Less than 5 Minutes | 47 (1.9%) | 0 (0.0%) |
| 5 to 9 Minutes | 147 (6.0%) | 114 (3.6%) |
| 10 to 14 Minutes | 224 (9.1%) | 301 (9.4%) |
| 15 to 19 Minutes | 540 (21.9%) | 784 (24.4%) |
| 20 to 24 Minutes | 708 (28.7%) | 1,064 (33.2%) |
| 25 to 29 Minutes | 56 (2.3%) | 253 (7.9%) |
| 30 to 34 Minutes | 446 (18.1%) | 290 (9.0%) |
| 35 to 39 Minutes | 129 (5.2%) | 122 (3.8%) |
| 40 to 44 Minutes | 102 (4.1%) | 0 (0.0%) |
| 45 to 59 Minutes | 25 (1.0%) | 146 (4.5%) |
| 60 to 89 Minutes | 40 (1.6%) | 40 (1.3%) |
| 90 or more Minutes | 0 (0.0%) | 92 (2.9%) |
Time of Departure to Work by Sex in Gardere
The most frequent times of departure to work in Gardere are 8:00 AM to 8:29 AM (338, 13.7%) for males and 7:30 AM to 7:59 AM (508, 15.9%) for females.
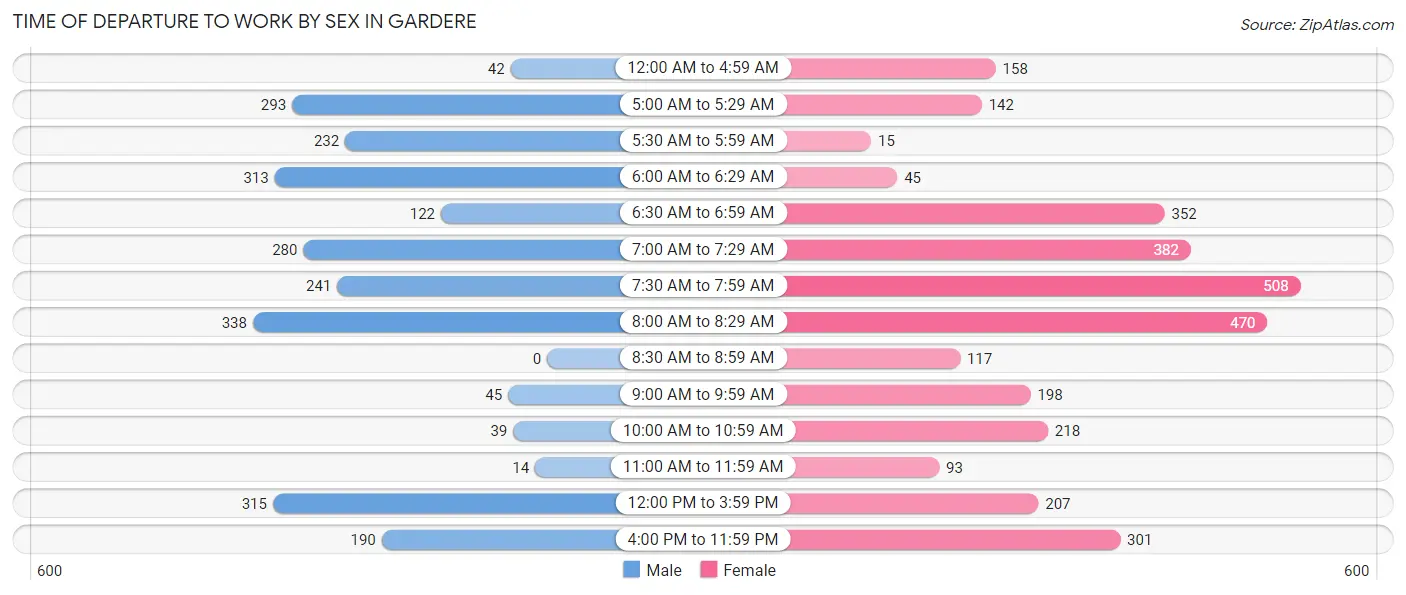
| Time of Departure | Male | Female |
| 12:00 AM to 4:59 AM | 42 (1.7%) | 158 (4.9%) |
| 5:00 AM to 5:29 AM | 293 (11.9%) | 142 (4.4%) |
| 5:30 AM to 5:59 AM | 232 (9.4%) | 15 (0.5%) |
| 6:00 AM to 6:29 AM | 313 (12.7%) | 45 (1.4%) |
| 6:30 AM to 6:59 AM | 122 (5.0%) | 352 (11.0%) |
| 7:00 AM to 7:29 AM | 280 (11.4%) | 382 (11.9%) |
| 7:30 AM to 7:59 AM | 241 (9.8%) | 508 (15.9%) |
| 8:00 AM to 8:29 AM | 338 (13.7%) | 470 (14.7%) |
| 8:30 AM to 8:59 AM | 0 (0.0%) | 117 (3.6%) |
| 9:00 AM to 9:59 AM | 45 (1.8%) | 198 (6.2%) |
| 10:00 AM to 10:59 AM | 39 (1.6%) | 218 (6.8%) |
| 11:00 AM to 11:59 AM | 14 (0.6%) | 93 (2.9%) |
| 12:00 PM to 3:59 PM | 315 (12.8%) | 207 (6.5%) |
| 4:00 PM to 11:59 PM | 190 (7.7%) | 301 (9.4%) |
| Total | 2,464 (100.0%) | 3,206 (100.0%) |
Housing Occupancy in Gardere
Occupancy by Ownership in Gardere
Of the total 4,062 dwellings in Gardere, owner-occupied units account for 1,694 (41.7%), while renter-occupied units make up 2,368 (58.3%).
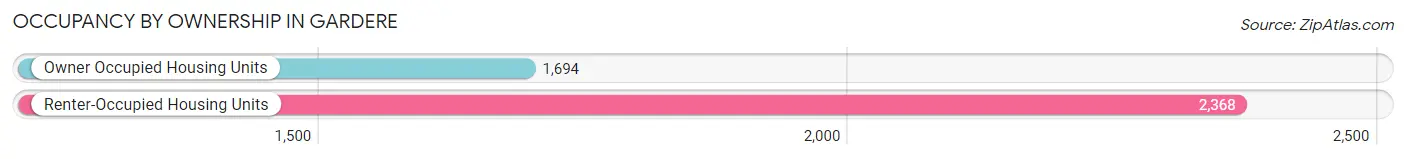
| Occupancy | # Housing Units | % Housing Units |
| Owner Occupied Housing Units | 1,694 | 41.7% |
| Renter-Occupied Housing Units | 2,368 | 58.3% |
| Total Occupied Housing Units | 4,062 | 100.0% |
Occupancy by Household Size in Gardere
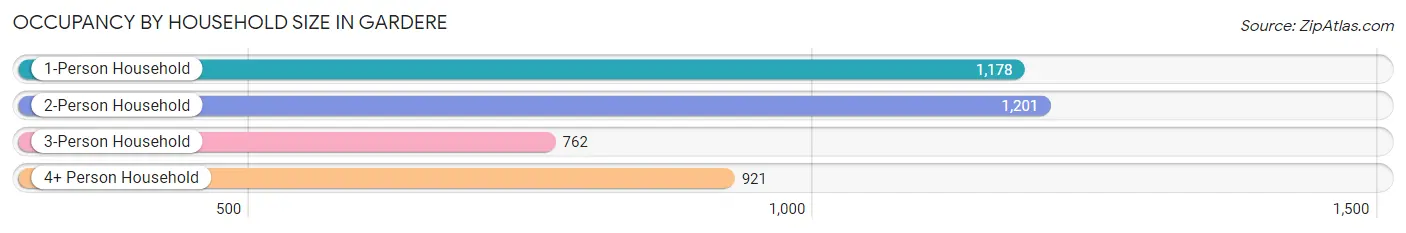
| Household Size | # Housing Units | % Housing Units |
| 1-Person Household | 1,178 | 29.0% |
| 2-Person Household | 1,201 | 29.6% |
| 3-Person Household | 762 | 18.8% |
| 4+ Person Household | 921 | 22.7% |
| Total Housing Units | 4,062 | 100.0% |
Occupancy by Ownership by Household Size in Gardere
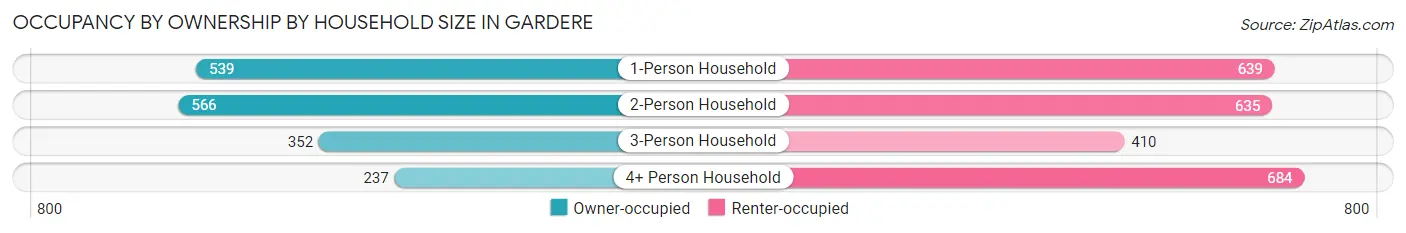
| Household Size | Owner-occupied | Renter-occupied |
| 1-Person Household | 539 (45.8%) | 639 (54.2%) |
| 2-Person Household | 566 (47.1%) | 635 (52.9%) |
| 3-Person Household | 352 (46.2%) | 410 (53.8%) |
| 4+ Person Household | 237 (25.7%) | 684 (74.3%) |
| Total Housing Units | 1,694 (41.7%) | 2,368 (58.3%) |
Occupancy by Educational Attainment in Gardere
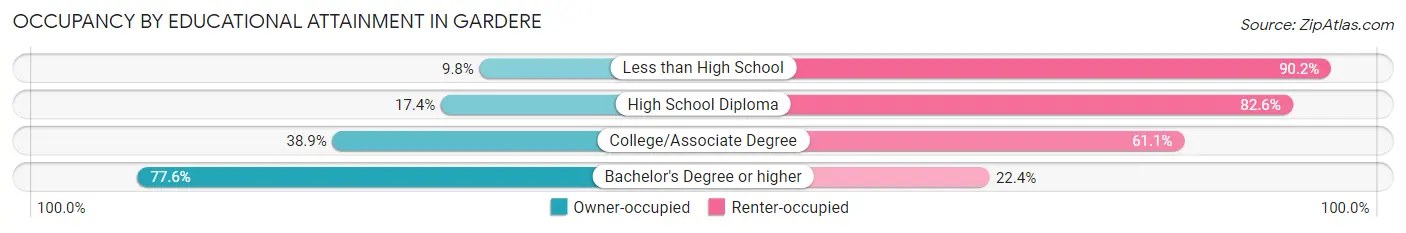
| Household Size | Owner-occupied | Renter-occupied |
| Less than High School | 37 (9.8%) | 341 (90.2%) |
| High School Diploma | 228 (17.4%) | 1,079 (82.6%) |
| College/Associate Degree | 419 (38.9%) | 657 (61.1%) |
| Bachelor's Degree or higher | 1,010 (77.6%) | 291 (22.4%) |
Occupancy by Age of Householder in Gardere
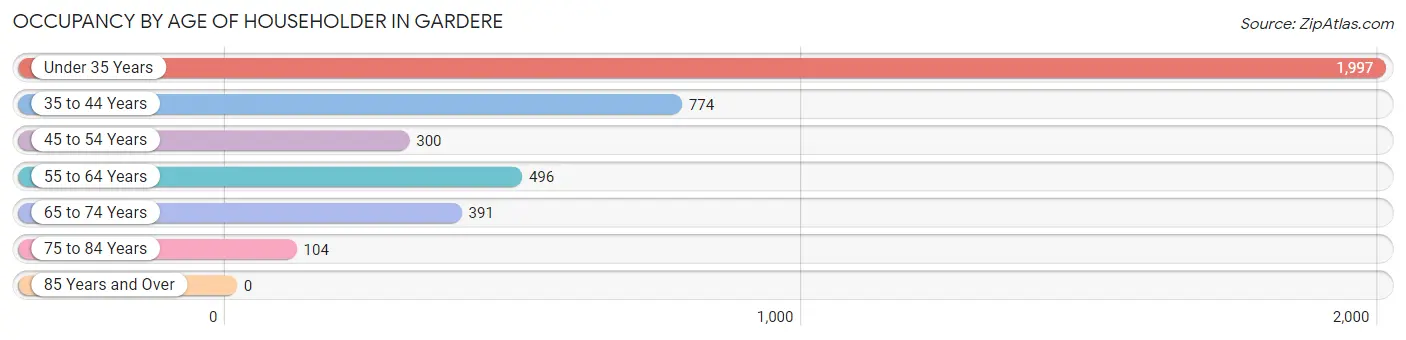
| Age Bracket | # Households | % Households |
| Under 35 Years | 1,997 | 49.2% |
| 35 to 44 Years | 774 | 19.1% |
| 45 to 54 Years | 300 | 7.4% |
| 55 to 64 Years | 496 | 12.2% |
| 65 to 74 Years | 391 | 9.6% |
| 75 to 84 Years | 104 | 2.6% |
| 85 Years and Over | 0 | 0.0% |
| Total | 4,062 | 100.0% |
Housing Finances in Gardere
Median Income by Occupancy in Gardere
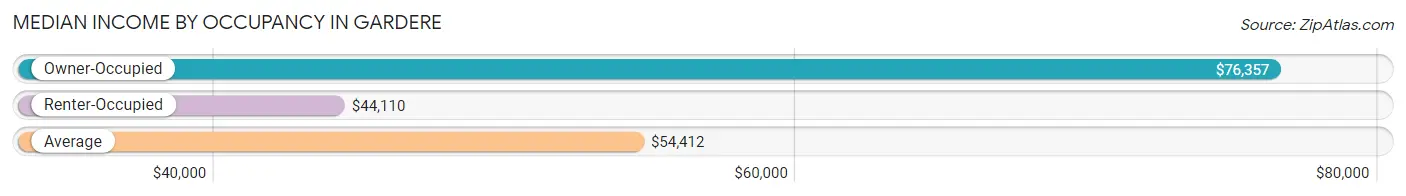
| Occupancy Type | # Households | Median Income |
| Owner-Occupied | 1,694 (41.7%) | $76,357 |
| Renter-Occupied | 2,368 (58.3%) | $44,110 |
| Average | 4,062 (100.0%) | $54,412 |
Occupancy by Householder Income Bracket in Gardere
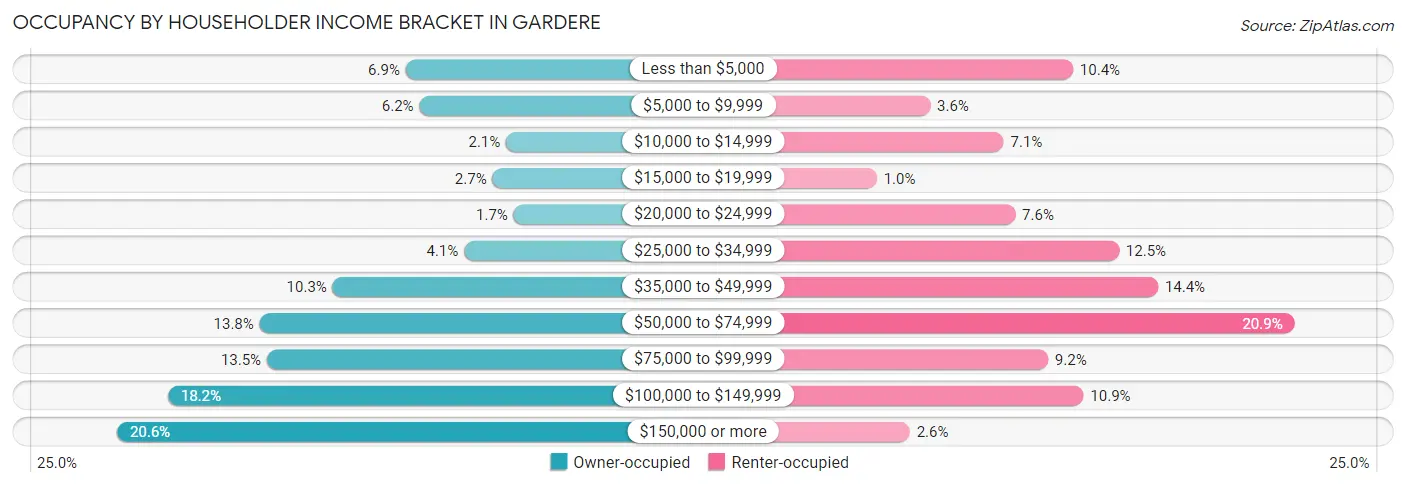
| Income Bracket | Owner-occupied | Renter-occupied |
| Less than $5,000 | 116 (6.9%) | 245 (10.3%) |
| $5,000 to $9,999 | 105 (6.2%) | 84 (3.5%) |
| $10,000 to $14,999 | 35 (2.1%) | 167 (7.0%) |
| $15,000 to $19,999 | 46 (2.7%) | 24 (1.0%) |
| $20,000 to $24,999 | 29 (1.7%) | 180 (7.6%) |
| $25,000 to $34,999 | 69 (4.1%) | 297 (12.5%) |
| $35,000 to $49,999 | 175 (10.3%) | 341 (14.4%) |
| $50,000 to $74,999 | 234 (13.8%) | 495 (20.9%) |
| $75,000 to $99,999 | 228 (13.5%) | 217 (9.2%) |
| $100,000 to $149,999 | 308 (18.2%) | 257 (10.8%) |
| $150,000 or more | 349 (20.6%) | 61 (2.6%) |
| Total | 1,694 (100.0%) | 2,368 (100.0%) |
Monthly Housing Cost Tiers in Gardere
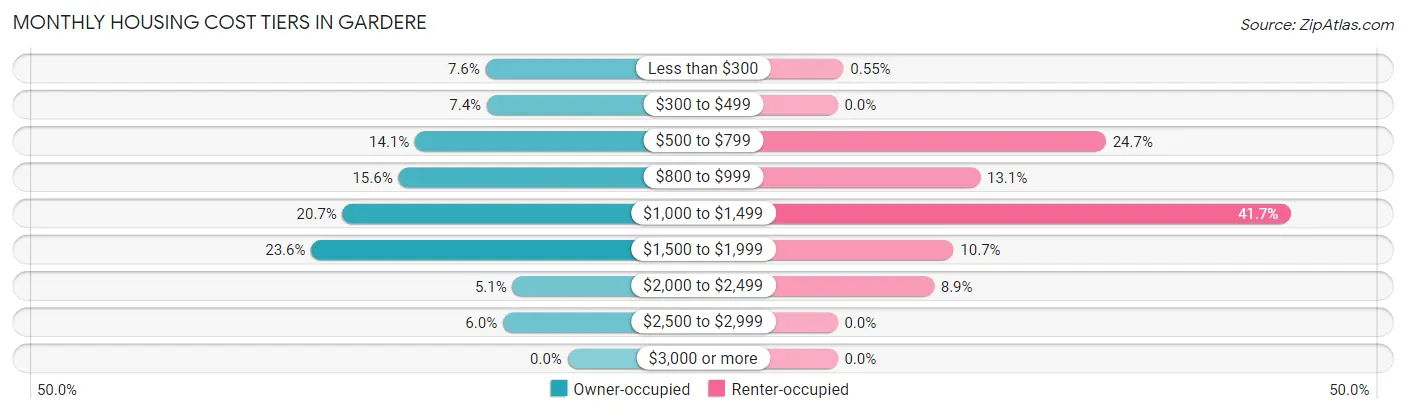
| Monthly Cost | Owner-occupied | Renter-occupied |
| Less than $300 | 128 (7.6%) | 13 (0.5%) |
| $300 to $499 | 126 (7.4%) | 0 (0.0%) |
| $500 to $799 | 238 (14.1%) | 585 (24.7%) |
| $800 to $999 | 264 (15.6%) | 311 (13.1%) |
| $1,000 to $1,499 | 351 (20.7%) | 987 (41.7%) |
| $1,500 to $1,999 | 400 (23.6%) | 253 (10.7%) |
| $2,000 to $2,499 | 86 (5.1%) | 210 (8.9%) |
| $2,500 to $2,999 | 101 (6.0%) | 0 (0.0%) |
| $3,000 or more | 0 (0.0%) | 0 (0.0%) |
| Total | 1,694 (100.0%) | 2,368 (100.0%) |
Physical Housing Characteristics in Gardere
Housing Structures in Gardere
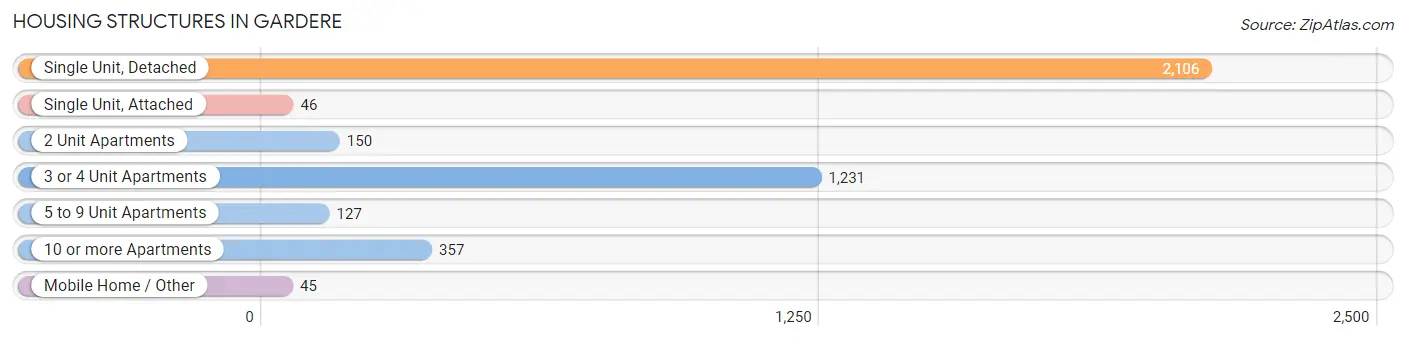
| Structure Type | # Housing Units | % Housing Units |
| Single Unit, Detached | 2,106 | 51.8% |
| Single Unit, Attached | 46 | 1.1% |
| 2 Unit Apartments | 150 | 3.7% |
| 3 or 4 Unit Apartments | 1,231 | 30.3% |
| 5 to 9 Unit Apartments | 127 | 3.1% |
| 10 or more Apartments | 357 | 8.8% |
| Mobile Home / Other | 45 | 1.1% |
| Total | 4,062 | 100.0% |
Housing Structures by Occupancy in Gardere
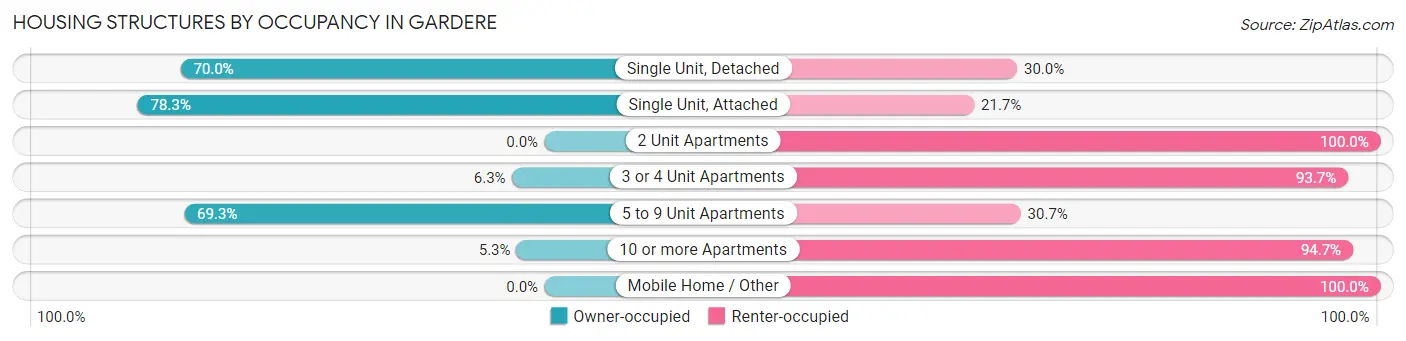
| Structure Type | Owner-occupied | Renter-occupied |
| Single Unit, Detached | 1,474 (70.0%) | 632 (30.0%) |
| Single Unit, Attached | 36 (78.3%) | 10 (21.7%) |
| 2 Unit Apartments | 0 (0.0%) | 150 (100.0%) |
| 3 or 4 Unit Apartments | 77 (6.3%) | 1,154 (93.7%) |
| 5 to 9 Unit Apartments | 88 (69.3%) | 39 (30.7%) |
| 10 or more Apartments | 19 (5.3%) | 338 (94.7%) |
| Mobile Home / Other | 0 (0.0%) | 45 (100.0%) |
| Total | 1,694 (41.7%) | 2,368 (58.3%) |
Housing Structures by Number of Rooms in Gardere
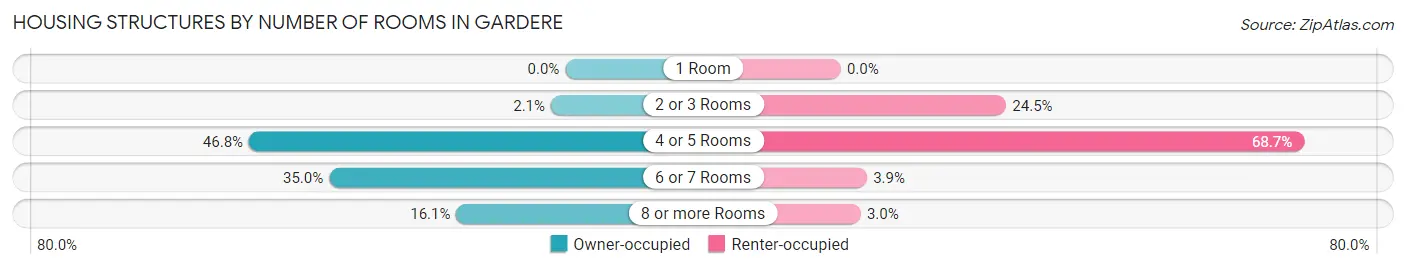
| Number of Rooms | Owner-occupied | Renter-occupied |
| 1 Room | 0 (0.0%) | 0 (0.0%) |
| 2 or 3 Rooms | 36 (2.1%) | 580 (24.5%) |
| 4 or 5 Rooms | 793 (46.8%) | 1,626 (68.7%) |
| 6 or 7 Rooms | 592 (34.9%) | 92 (3.9%) |
| 8 or more Rooms | 273 (16.1%) | 70 (3.0%) |
| Total | 1,694 (100.0%) | 2,368 (100.0%) |
Housing Structure by Heating Type in Gardere
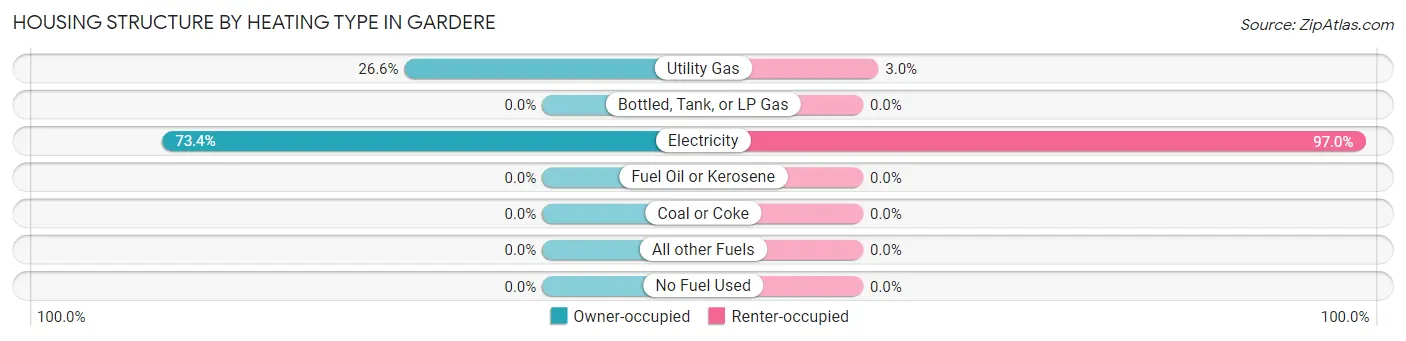
| Heating Type | Owner-occupied | Renter-occupied |
| Utility Gas | 451 (26.6%) | 70 (3.0%) |
| Bottled, Tank, or LP Gas | 0 (0.0%) | 0 (0.0%) |
| Electricity | 1,243 (73.4%) | 2,298 (97.0%) |
| Fuel Oil or Kerosene | 0 (0.0%) | 0 (0.0%) |
| Coal or Coke | 0 (0.0%) | 0 (0.0%) |
| All other Fuels | 0 (0.0%) | 0 (0.0%) |
| No Fuel Used | 0 (0.0%) | 0 (0.0%) |
| Total | 1,694 (100.0%) | 2,368 (100.0%) |
Household Vehicle Usage in Gardere
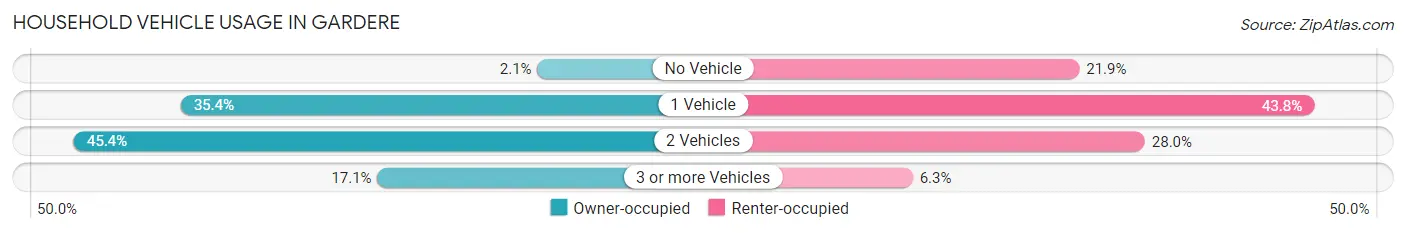
| Vehicles per Household | Owner-occupied | Renter-occupied |
| No Vehicle | 36 (2.1%) | 518 (21.9%) |
| 1 Vehicle | 600 (35.4%) | 1,037 (43.8%) |
| 2 Vehicles | 769 (45.4%) | 663 (28.0%) |
| 3 or more Vehicles | 289 (17.1%) | 150 (6.3%) |
| Total | 1,694 (100.0%) | 2,368 (100.0%) |
Real Estate & Mortgages in Gardere
Real Estate and Mortgage Overview in Gardere
| Characteristic | Without Mortgage | With Mortgage |
| Housing Units | 416 | 1,278 |
| Median Property Value | $236,700 | $233,400 |
| Median Household Income | $48,049 | $319 |
| Monthly Housing Costs | $480 | $0 |
| Real Estate Taxes | $2,235 | $123 |
Property Value by Mortgage Status in Gardere
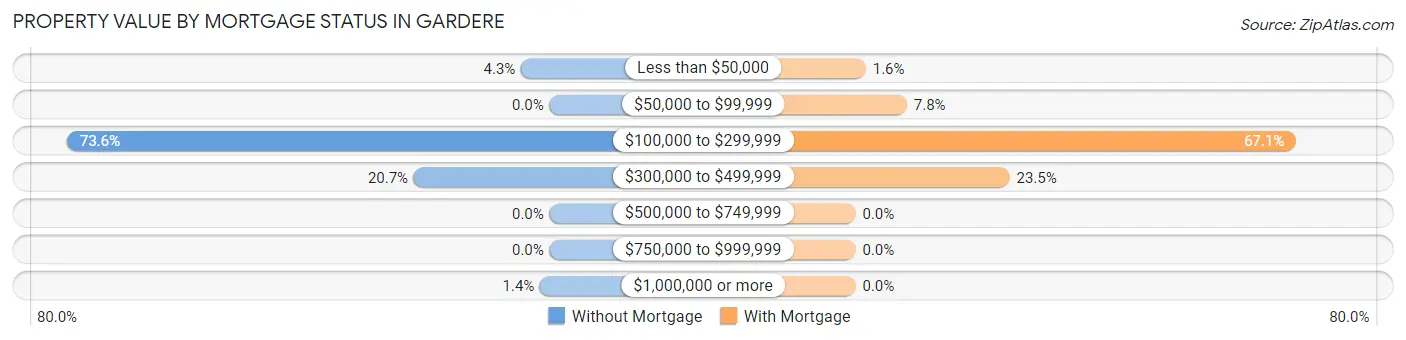
| Property Value | Without Mortgage | With Mortgage |
| Less than $50,000 | 18 (4.3%) | 20 (1.6%) |
| $50,000 to $99,999 | 0 (0.0%) | 100 (7.8%) |
| $100,000 to $299,999 | 306 (73.6%) | 858 (67.1%) |
| $300,000 to $499,999 | 86 (20.7%) | 300 (23.5%) |
| $500,000 to $749,999 | 0 (0.0%) | 0 (0.0%) |
| $750,000 to $999,999 | 0 (0.0%) | 0 (0.0%) |
| $1,000,000 or more | 6 (1.4%) | 0 (0.0%) |
| Total | 416 (100.0%) | 1,278 (100.0%) |
Household Income by Mortgage Status in Gardere
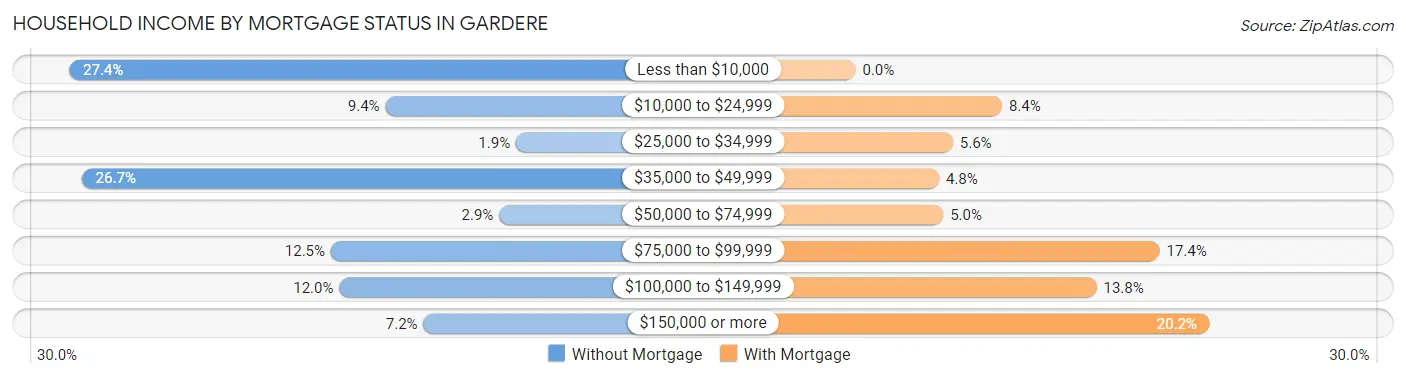
| Household Income | Without Mortgage | With Mortgage |
| Less than $10,000 | 114 (27.4%) | 0 (0.0%) |
| $10,000 to $24,999 | 39 (9.4%) | 107 (8.4%) |
| $25,000 to $34,999 | 8 (1.9%) | 71 (5.6%) |
| $35,000 to $49,999 | 111 (26.7%) | 61 (4.8%) |
| $50,000 to $74,999 | 12 (2.9%) | 64 (5.0%) |
| $75,000 to $99,999 | 52 (12.5%) | 222 (17.4%) |
| $100,000 to $149,999 | 50 (12.0%) | 176 (13.8%) |
| $150,000 or more | 30 (7.2%) | 258 (20.2%) |
| Total | 416 (100.0%) | 1,278 (100.0%) |
Property Value to Household Income Ratio in Gardere
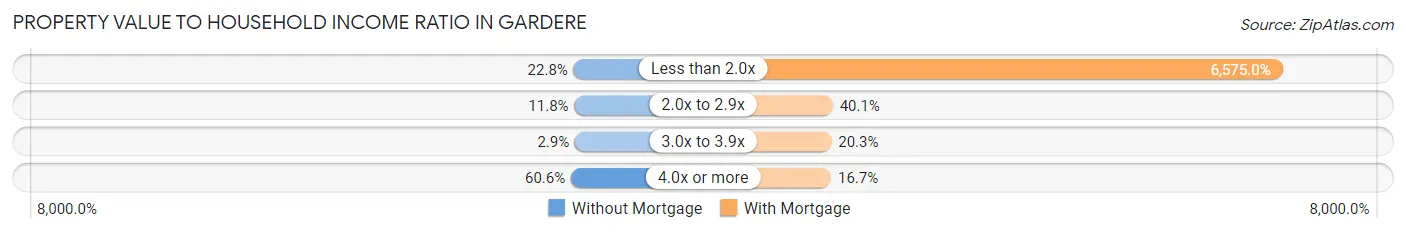
| Value-to-Income Ratio | Without Mortgage | With Mortgage |
| Less than 2.0x | 95 (22.8%) | 84,028 (6,575.0%) |
| 2.0x to 2.9x | 49 (11.8%) | 513 (40.1%) |
| 3.0x to 3.9x | 12 (2.9%) | 260 (20.3%) |
| 4.0x or more | 252 (60.6%) | 213 (16.7%) |
| Total | 416 (100.0%) | 1,278 (100.0%) |
Real Estate Taxes by Mortgage Status in Gardere
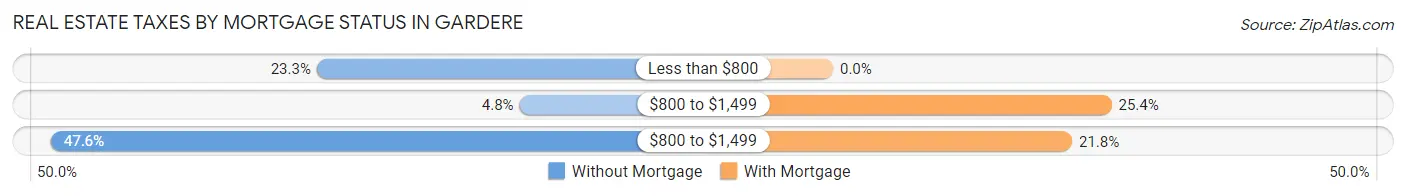
| Property Taxes | Without Mortgage | With Mortgage |
| Less than $800 | 97 (23.3%) | 0 (0.0%) |
| $800 to $1,499 | 20 (4.8%) | 325 (25.4%) |
| $800 to $1,499 | 198 (47.6%) | 279 (21.8%) |
| Total | 416 (100.0%) | 1,278 (100.0%) |
Health & Disability in Gardere
Health Insurance Coverage by Age in Gardere
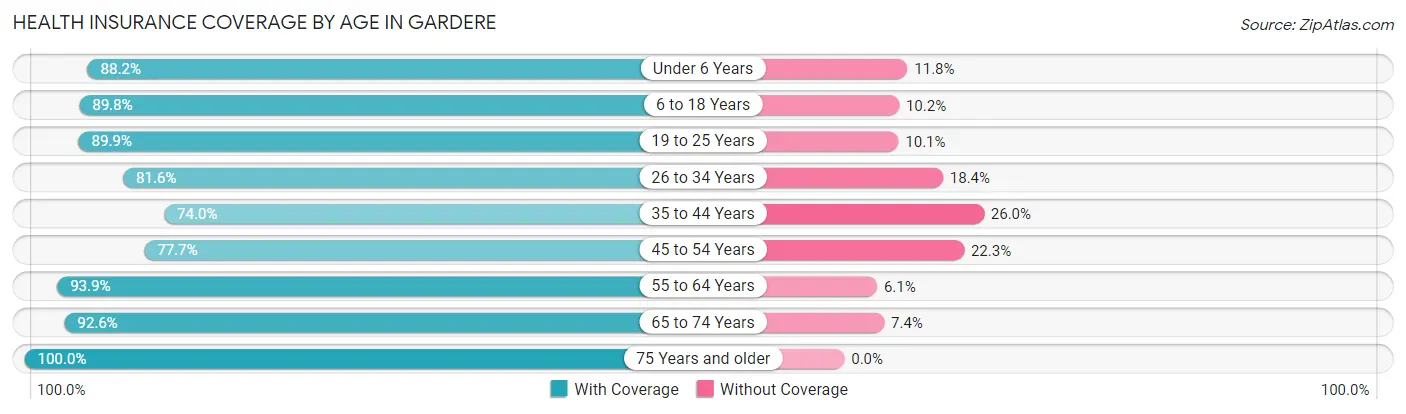
| Age Bracket | With Coverage | Without Coverage |
| Under 6 Years | 1,020 (88.2%) | 136 (11.8%) |
| 6 to 18 Years | 1,998 (89.8%) | 227 (10.2%) |
| 19 to 25 Years | 2,472 (89.9%) | 277 (10.1%) |
| 26 to 34 Years | 1,825 (81.6%) | 411 (18.4%) |
| 35 to 44 Years | 816 (74.0%) | 287 (26.0%) |
| 45 to 54 Years | 550 (77.7%) | 158 (22.3%) |
| 55 to 64 Years | 678 (93.9%) | 44 (6.1%) |
| 65 to 74 Years | 511 (92.6%) | 41 (7.4%) |
| 75 Years and older | 114 (100.0%) | 0 (0.0%) |
| Total | 9,984 (86.3%) | 1,581 (13.7%) |
Health Insurance Coverage by Citizenship Status in Gardere
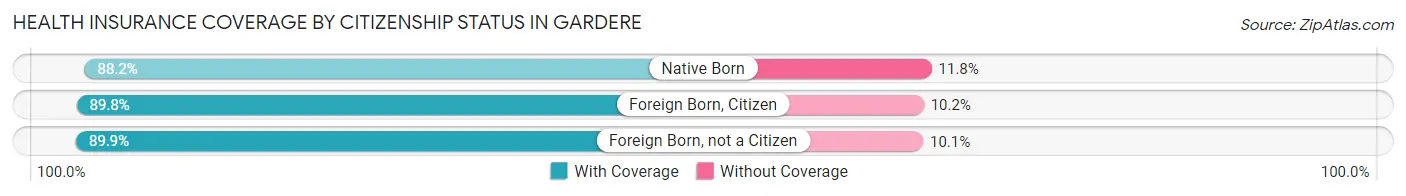
| Citizenship Status | With Coverage | Without Coverage |
| Native Born | 1,020 (88.2%) | 136 (11.8%) |
| Foreign Born, Citizen | 1,998 (89.8%) | 227 (10.2%) |
| Foreign Born, not a Citizen | 2,472 (89.9%) | 277 (10.1%) |
Health Insurance Coverage by Household Income in Gardere
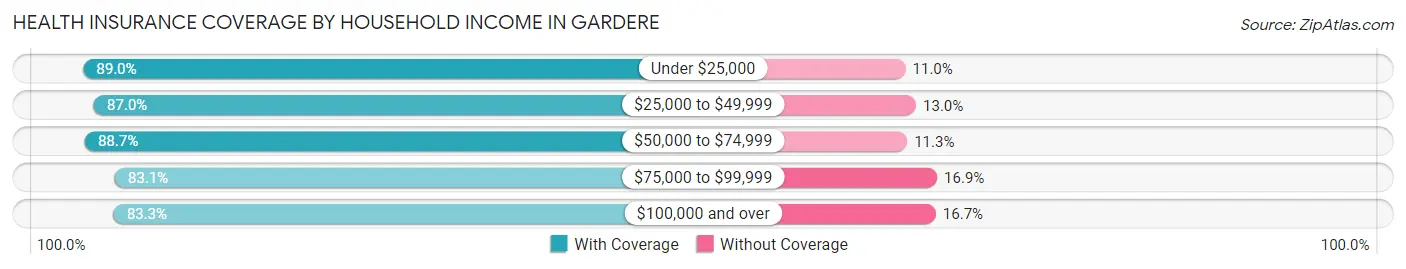
| Household Income | With Coverage | Without Coverage |
| Under $25,000 | 1,962 (89.0%) | 243 (11.0%) |
| $25,000 to $49,999 | 2,365 (87.0%) | 353 (13.0%) |
| $50,000 to $74,999 | 2,053 (88.7%) | 262 (11.3%) |
| $75,000 to $99,999 | 1,217 (83.1%) | 248 (16.9%) |
| $100,000 and over | 2,370 (83.3%) | 475 (16.7%) |
Public vs Private Health Insurance Coverage by Age in Gardere
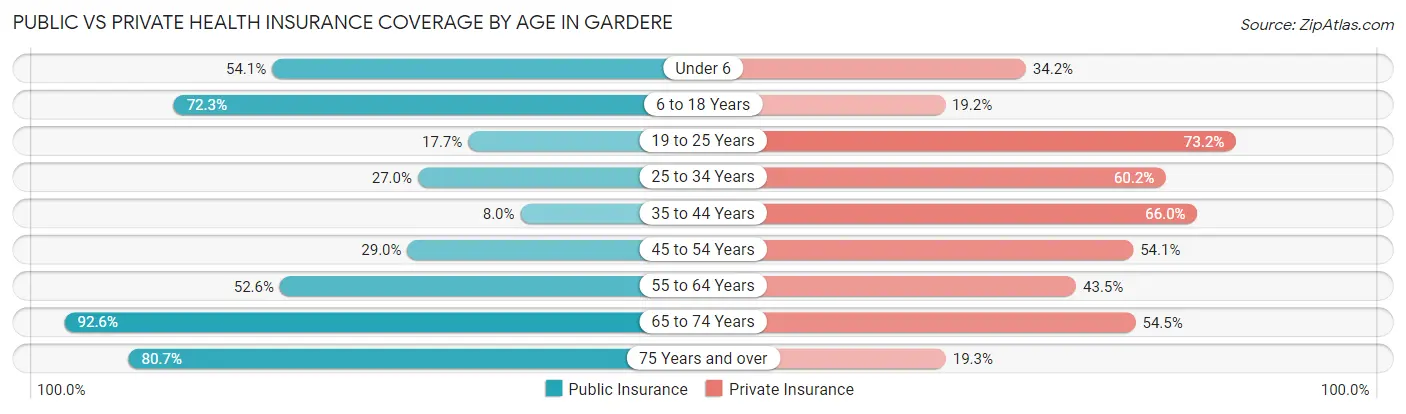
| Age Bracket | Public Insurance | Private Insurance |
| Under 6 | 625 (54.1%) | 395 (34.2%) |
| 6 to 18 Years | 1,609 (72.3%) | 426 (19.2%) |
| 19 to 25 Years | 486 (17.7%) | 2,012 (73.2%) |
| 25 to 34 Years | 604 (27.0%) | 1,346 (60.2%) |
| 35 to 44 Years | 88 (8.0%) | 728 (66.0%) |
| 45 to 54 Years | 205 (28.9%) | 383 (54.1%) |
| 55 to 64 Years | 380 (52.6%) | 314 (43.5%) |
| 65 to 74 Years | 511 (92.6%) | 301 (54.5%) |
| 75 Years and over | 92 (80.7%) | 22 (19.3%) |
| Total | 4,600 (39.8%) | 5,927 (51.2%) |
Disability Status by Sex by Age in Gardere
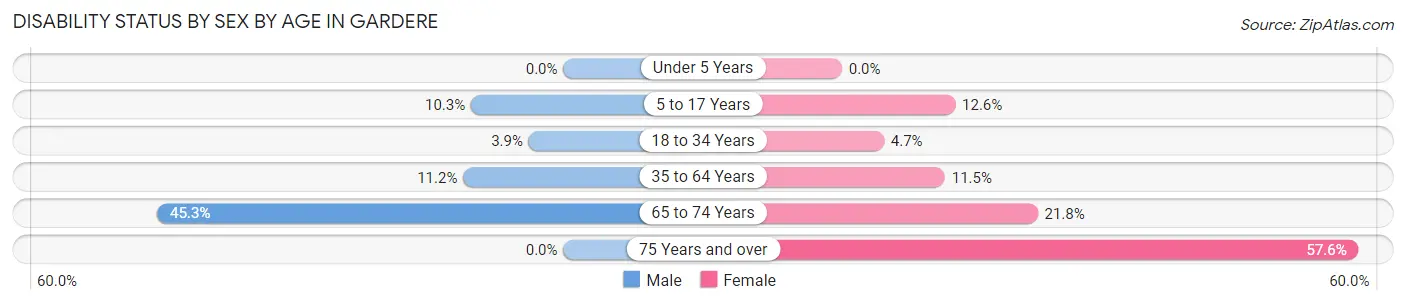
| Age Bracket | Male | Female |
| Under 5 Years | 0 (0.0%) | 0 (0.0%) |
| 5 to 17 Years | 134 (10.3%) | 104 (12.6%) |
| 18 to 34 Years | 82 (3.8%) | 143 (4.7%) |
| 35 to 64 Years | 125 (11.2%) | 162 (11.5%) |
| 65 to 74 Years | 119 (45.3%) | 63 (21.8%) |
| 75 Years and over | 0 (0.0%) | 61 (57.6%) |
Disability Class by Sex by Age in Gardere
Disability Class: Hearing Difficulty
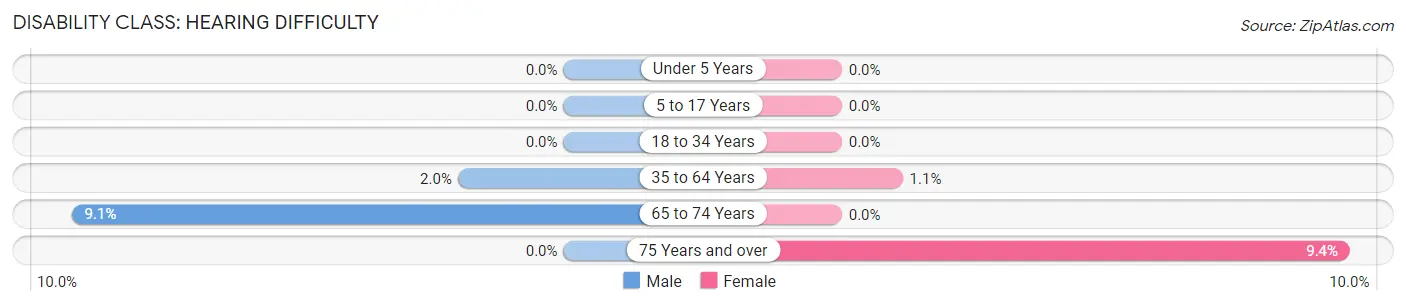
| Age Bracket | Male | Female |
| Under 5 Years | 0 (0.0%) | 0 (0.0%) |
| 5 to 17 Years | 0 (0.0%) | 0 (0.0%) |
| 18 to 34 Years | 0 (0.0%) | 0 (0.0%) |
| 35 to 64 Years | 22 (2.0%) | 16 (1.1%) |
| 65 to 74 Years | 24 (9.1%) | 0 (0.0%) |
| 75 Years and over | 0 (0.0%) | 10 (9.4%) |
Disability Class: Vision Difficulty
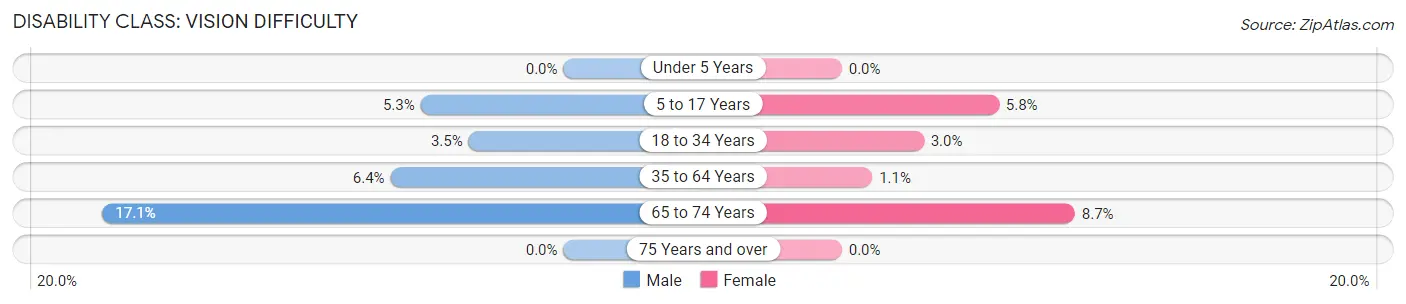
| Age Bracket | Male | Female |
| Under 5 Years | 0 (0.0%) | 0 (0.0%) |
| 5 to 17 Years | 69 (5.3%) | 48 (5.8%) |
| 18 to 34 Years | 75 (3.5%) | 93 (3.0%) |
| 35 to 64 Years | 72 (6.4%) | 16 (1.1%) |
| 65 to 74 Years | 45 (17.1%) | 25 (8.6%) |
| 75 Years and over | 0 (0.0%) | 0 (0.0%) |
Disability Class: Cognitive Difficulty
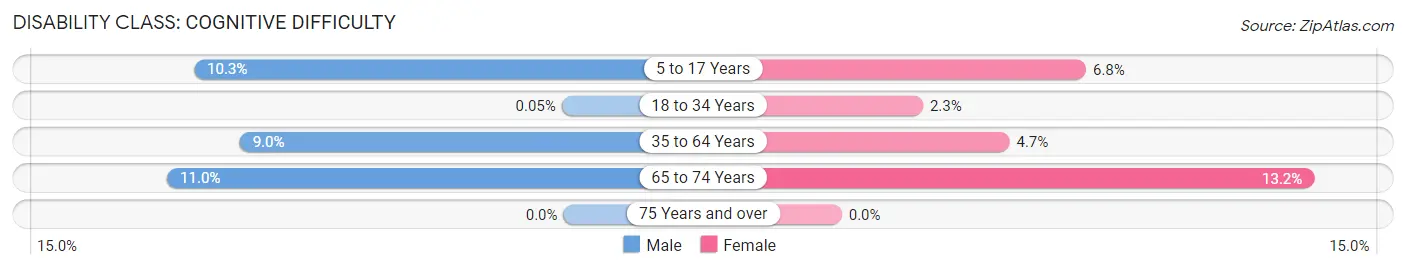
| Age Bracket | Male | Female |
| 5 to 17 Years | 134 (10.3%) | 56 (6.8%) |
| 18 to 34 Years | 1 (0.1%) | 69 (2.3%) |
| 35 to 64 Years | 101 (9.0%) | 66 (4.7%) |
| 65 to 74 Years | 29 (11.0%) | 38 (13.2%) |
| 75 Years and over | 0 (0.0%) | 0 (0.0%) |
Disability Class: Ambulatory Difficulty
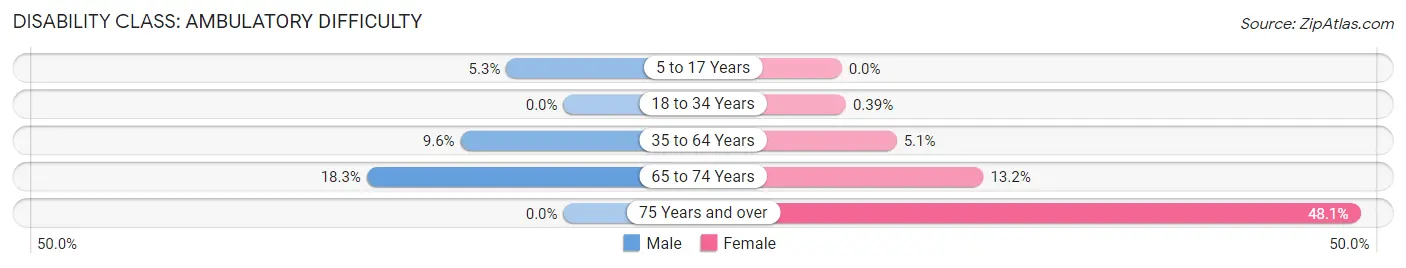
| Age Bracket | Male | Female |
| 5 to 17 Years | 69 (5.3%) | 0 (0.0%) |
| 18 to 34 Years | 0 (0.0%) | 12 (0.4%) |
| 35 to 64 Years | 107 (9.6%) | 72 (5.1%) |
| 65 to 74 Years | 48 (18.2%) | 38 (13.2%) |
| 75 Years and over | 0 (0.0%) | 51 (48.1%) |
Disability Class: Self-Care Difficulty
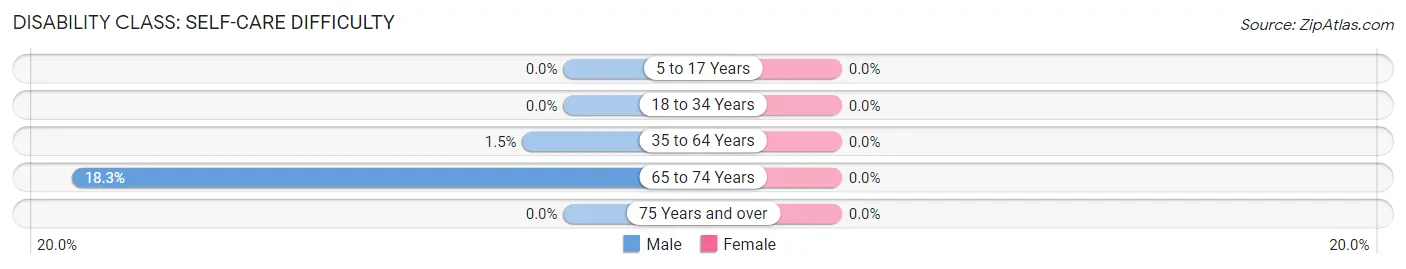
| Age Bracket | Male | Female |
| 5 to 17 Years | 0 (0.0%) | 0 (0.0%) |
| 18 to 34 Years | 0 (0.0%) | 0 (0.0%) |
| 35 to 64 Years | 17 (1.5%) | 0 (0.0%) |
| 65 to 74 Years | 48 (18.2%) | 0 (0.0%) |
| 75 Years and over | 0 (0.0%) | 0 (0.0%) |
Technology Access in Gardere
Computing Device Access in Gardere
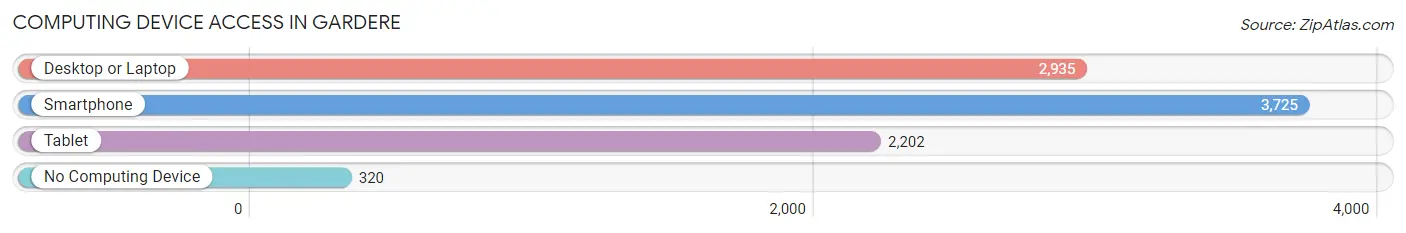
| Device Type | # Households | % Households |
| Desktop or Laptop | 2,935 | 72.3% |
| Smartphone | 3,725 | 91.7% |
| Tablet | 2,202 | 54.2% |
| No Computing Device | 320 | 7.9% |
| Total | 4,062 | 100.0% |
Internet Access in Gardere
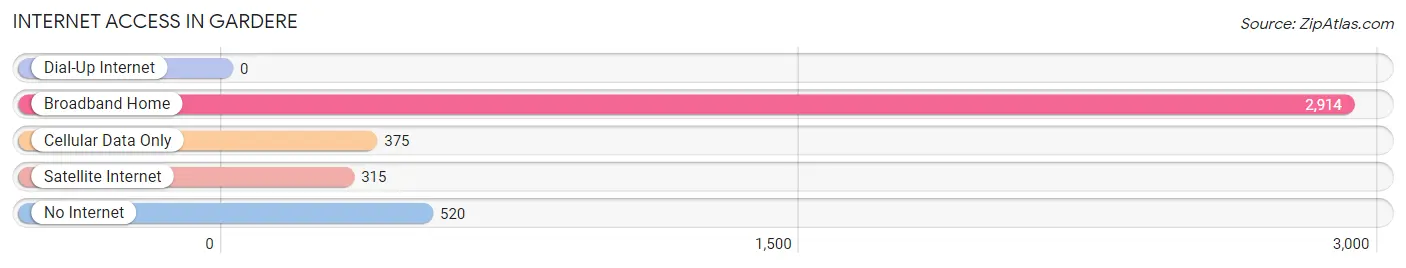
| Internet Type | # Households | % Households |
| Dial-Up Internet | 0 | 0.0% |
| Broadband Home | 2,914 | 71.7% |
| Cellular Data Only | 375 | 9.2% |
| Satellite Internet | 315 | 7.7% |
| No Internet | 520 | 12.8% |
| Total | 4,062 | 100.0% |
Gardere Summary
Gardere is a census-designated place (CDP) located in East Baton Rouge Parish, Louisiana. It is a suburb of Baton Rouge, the state capital, and is located approximately 8 miles southeast of downtown. The population of Gardere was 8,845 at the 2010 census.
History
Gardere was founded in 1820 by Jean Baptiste Gardere, a French-Canadian immigrant who had moved to the area from Canada. He purchased a large tract of land and built a home on it, which he named Gardere. The area was originally known as Gardereville, but the name was eventually shortened to Gardere.
Gardere was a small rural community until the 1950s, when it began to experience rapid growth due to its proximity to Baton Rouge. The population of Gardere increased from 1,000 in 1950 to 8,845 in 2010.
Geography
Gardere is located at 30°25'25" North, 91°7'45" West (30.423, -91.129). It is situated in East Baton Rouge Parish, approximately 8 miles southeast of downtown Baton Rouge.
Gardere has a total area of 4.2 square miles, all of which is land. The terrain is mostly flat, with some rolling hills. The climate is humid subtropical, with hot, humid summers and mild winters.
Economy
Gardere is primarily a residential community, with most of its residents commuting to nearby Baton Rouge for work. The largest employers in the area are the East Baton Rouge Parish School System, the Louisiana State University System, and the Baton Rouge General Medical Center.
Gardere also has a number of small businesses, including restaurants, retail stores, and professional services. The area is also home to several industrial parks, which provide employment for many of the residents.
Demographics
As of the 2010 census, the population of Gardere was 8,845. The racial makeup of the town was 68.3% White, 28.2% African American, 0.7% Native American, 0.7% Asian, 0.2% Pacific Islander, 0.7% from other races, and 1.4% from two or more races. Hispanic or Latino of any race were 2.2% of the population.
The median household income in Gardere was $50,945, and the median family income was $60,945. The per capita income was $25,945. About 11.2% of families and 13.2% of the population were below the poverty line, including 17.2% of those under age 18 and 8.2% of those age 65 or over.
Common Questions
What is Per Capita Income in Gardere?
Per Capita income in Gardere is $25,024.
What is the Median Family Income in Gardere?
Median Family Income in Gardere is $66,659.
What is the Median Household income in Gardere?
Median Household Income in Gardere is $54,412.
What is Income or Wage Gap in Gardere?
Income or Wage Gap in Gardere is 52.2%.
Women in Gardere earn 47.8 cents for every dollar earned by a man.
What is Inequality or Gini Index in Gardere?
Inequality or Gini Index in Gardere is 0.46.
What is the Total Population of Gardere?
Total Population of Gardere is 11,565.
What is the Total Male Population of Gardere?
Total Male Population of Gardere is 5,469.
What is the Total Female Population of Gardere?
Total Female Population of Gardere is 6,096.
What is the Ratio of Males per 100 Females in Gardere?
There are 89.71 Males per 100 Females in Gardere.
What is the Ratio of Females per 100 Males in Gardere?
There are 111.46 Females per 100 Males in Gardere.
What is the Median Population Age in Gardere?
Median Population Age in Gardere is 23.9 Years.
What is the Average Family Size in Gardere
Average Family Size in Gardere is 3.5 People.
What is the Average Household Size in Gardere
Average Household Size in Gardere is 2.8 People.
How Large is the Labor Force in Gardere?
There are 6,768 People in the Labor Forcein in Gardere.
What is the Percentage of People in the Labor Force in Gardere?
78.9% of People are in the Labor Force in Gardere.
What is the Unemployment Rate in Gardere?
Unemployment Rate in Gardere is 6.2%.