Sikes, LA Map & Demographics
Sikes Map
Sikes Overview
$9,223
PER CAPITA INCOME
$38,875
AVG FAMILY INCOME
$38,875
AVG HOUSEHOLD INCOME
56.6%
WAGE / INCOME GAP [ % ]
43.4¢/ $1
WAGE / INCOME GAP [ $ ]
0.29
INEQUALITY / GINI INDEX
268
TOTAL POPULATION
200
MALE POPULATION
68
FEMALE POPULATION
294.12
MALES / 100 FEMALES
34.00
FEMALES / 100 MALES
27.5
MEDIAN AGE
5.9
AVG FAMILY SIZE
5.0
AVG HOUSEHOLD SIZE
50
LABOR FORCE [ PEOPLE ]
20.5%
PERCENT IN LABOR FORCE
Sikes Zip Codes
Sikes Area Codes
Income in Sikes
Income Overview in Sikes
Per Capita Income in Sikes is $9,223, while median incomes of families and households are $38,875 and $38,875 respectively.
| Characteristic | Number | Measure |
| Per Capita Income | 268 | $9,223 |
| Median Family Income | 44 | $38,875 |
| Mean Family Income | 44 | $47,405 |
| Median Household Income | 54 | $38,875 |
| Mean Household Income | 54 | $46,087 |
| Income Deficit | 44 | $0 |
| Wage / Income Gap (%) | 268 | 56.57% |
| Wage / Income Gap ($) | 268 | 43.43¢ per $1 |
| Gini / Inequality Index | 268 | 0.29 |
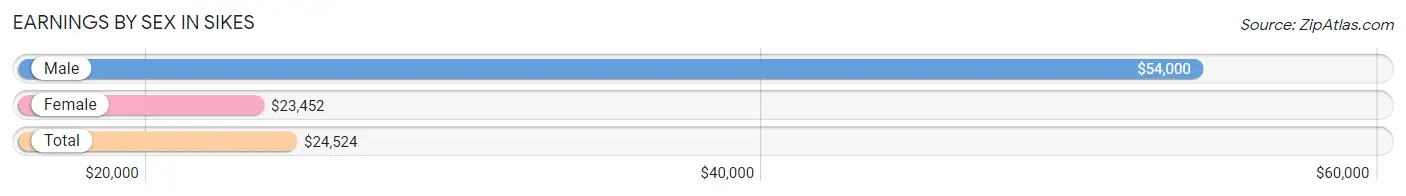
Earnings by Sex in Sikes
Average Earnings in Sikes are $24,524, $54,000 for men and $23,452 for women, a difference of 56.6%.
| Sex | Number | Average Earnings |
| Male | 22 (42.3%) | $54,000 |
| Female | 30 (57.7%) | $23,452 |
| Total | 52 (100.0%) | $24,524 |
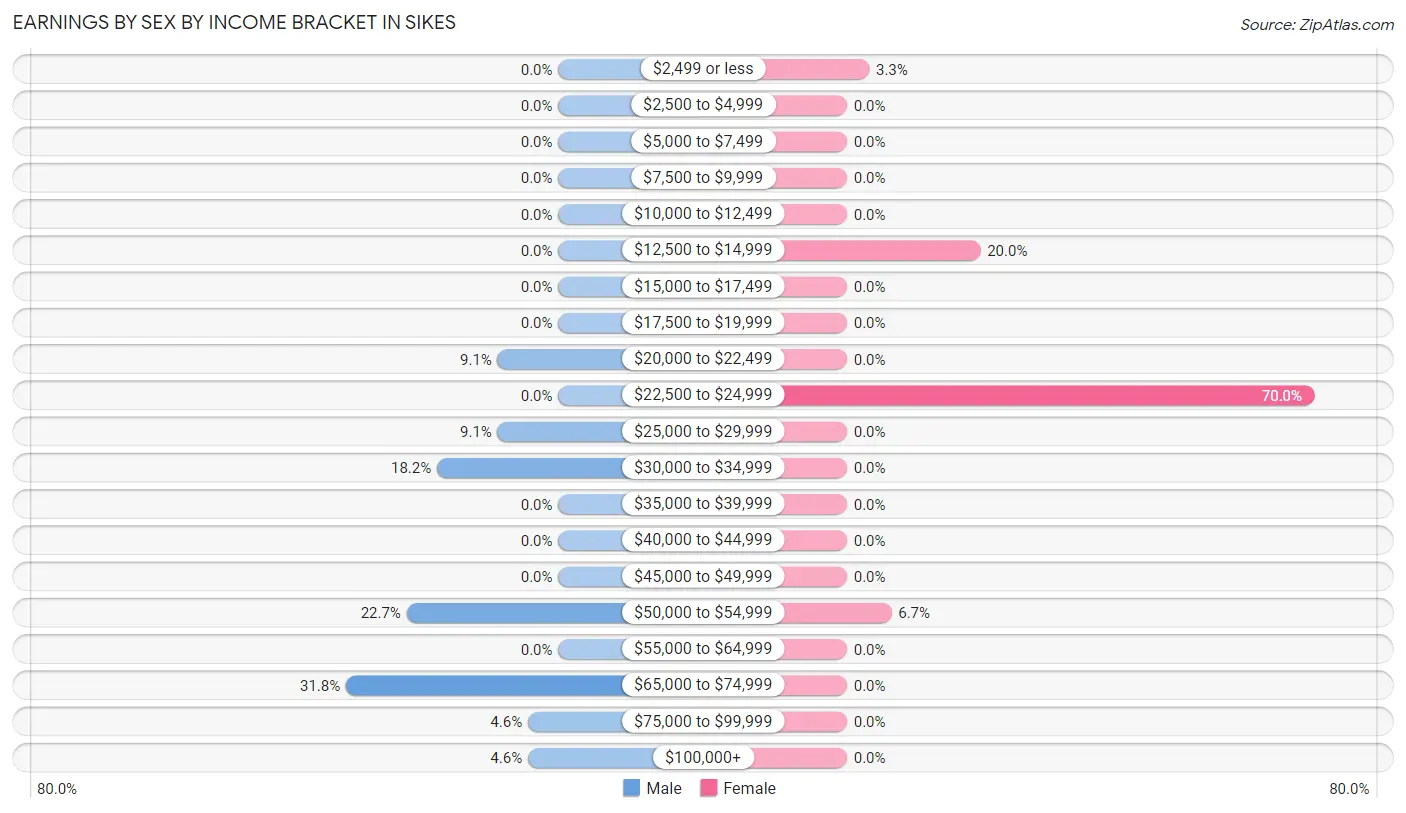
Earnings by Sex by Income Bracket in Sikes
The most common earnings brackets in Sikes are $65,000 to $74,999 for men (7 | 31.8%) and $22,500 to $24,999 for women (21 | 70.0%).
| Income | Male | Female |
| $2,499 or less | 0 (0.0%) | 1 (3.3%) |
| $2,500 to $4,999 | 0 (0.0%) | 0 (0.0%) |
| $5,000 to $7,499 | 0 (0.0%) | 0 (0.0%) |
| $7,500 to $9,999 | 0 (0.0%) | 0 (0.0%) |
| $10,000 to $12,499 | 0 (0.0%) | 0 (0.0%) |
| $12,500 to $14,999 | 0 (0.0%) | 6 (20.0%) |
| $15,000 to $17,499 | 0 (0.0%) | 0 (0.0%) |
| $17,500 to $19,999 | 0 (0.0%) | 0 (0.0%) |
| $20,000 to $22,499 | 2 (9.1%) | 0 (0.0%) |
| $22,500 to $24,999 | 0 (0.0%) | 21 (70.0%) |
| $25,000 to $29,999 | 2 (9.1%) | 0 (0.0%) |
| $30,000 to $34,999 | 4 (18.2%) | 0 (0.0%) |
| $35,000 to $39,999 | 0 (0.0%) | 0 (0.0%) |
| $40,000 to $44,999 | 0 (0.0%) | 0 (0.0%) |
| $45,000 to $49,999 | 0 (0.0%) | 0 (0.0%) |
| $50,000 to $54,999 | 5 (22.7%) | 2 (6.7%) |
| $55,000 to $64,999 | 0 (0.0%) | 0 (0.0%) |
| $65,000 to $74,999 | 7 (31.8%) | 0 (0.0%) |
| $75,000 to $99,999 | 1 (4.5%) | 0 (0.0%) |
| $100,000+ | 1 (4.5%) | 0 (0.0%) |
| Total | 22 (100.0%) | 30 (100.0%) |
Earnings by Sex by Educational Attainment in Sikes
| Educational Attainment | Male Income | Female Income |
| Less than High School | - | - |
| High School Diploma | - | - |
| College or Associate's Degree | - | - |
| Bachelor's Degree | - | - |
| Graduate Degree | - | - |
| Total | $54,750 | $23,333 |
Family Income in Sikes
Family Income Brackets in Sikes
According to the Sikes family income data, there are 21 families falling into the $35,000 to $49,999 income range, which is the most common income bracket and makes up 47.7% of all families.
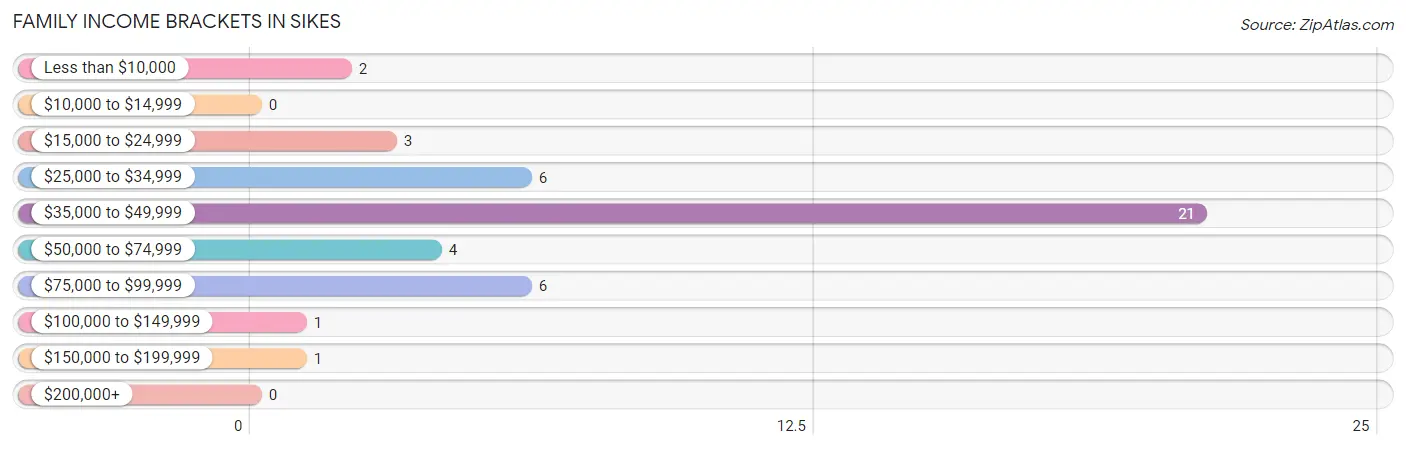
| Income Bracket | # Families | % Families |
| Less than $10,000 | 2 | 4.5% |
| $10,000 to $14,999 | 0 | 0.0% |
| $15,000 to $24,999 | 3 | 6.8% |
| $25,000 to $34,999 | 6 | 13.6% |
| $35,000 to $49,999 | 21 | 47.7% |
| $50,000 to $74,999 | 4 | 9.1% |
| $75,000 to $99,999 | 6 | 13.6% |
| $100,000 to $149,999 | 1 | 2.3% |
| $150,000 to $199,999 | 1 | 2.3% |
| $200,000+ | 0 | 0.0% |
Family Income by Famaliy Size in Sikes
2-person families (28 | 63.6%) account for the highest median family income in Sikes with $38,625 per family, while 2-person families (28 | 63.6%) have the highest median income of $19,312 per family member.
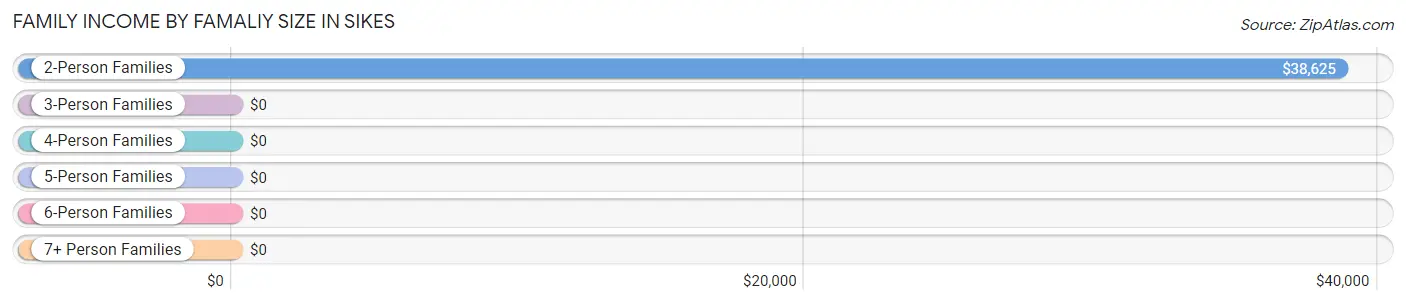
| Income Bracket | # Families | Median Income |
| 2-Person Families | 28 (63.6%) | $38,625 |
| 3-Person Families | 13 (29.5%) | $0 |
| 4-Person Families | 0 (0.0%) | $0 |
| 5-Person Families | 2 (4.5%) | $0 |
| 6-Person Families | 1 (2.3%) | $0 |
| 7+ Person Families | 0 (0.0%) | $0 |
| Total | 44 (100.0%) | $38,875 |
Family Income by Number of Earners in Sikes
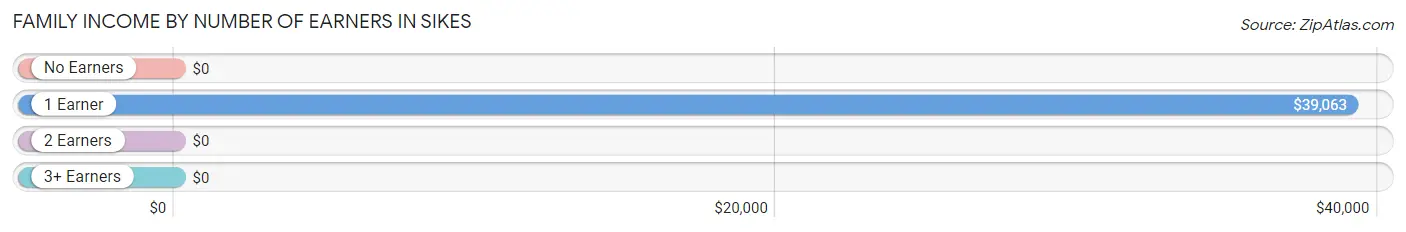
| Number of Earners | # Families | Median Income |
| No Earners | 5 (11.4%) | $0 |
| 1 Earner | 37 (84.1%) | $39,063 |
| 2 Earners | 2 (4.5%) | $0 |
| 3+ Earners | 0 (0.0%) | $0 |
| Total | 44 (100.0%) | $38,875 |
Household Income in Sikes
Household Income Brackets in Sikes
With 21 households falling in the category, the $35,000 to $49,999 income range is the most frequent in Sikes, accounting for 38.9% of all households.
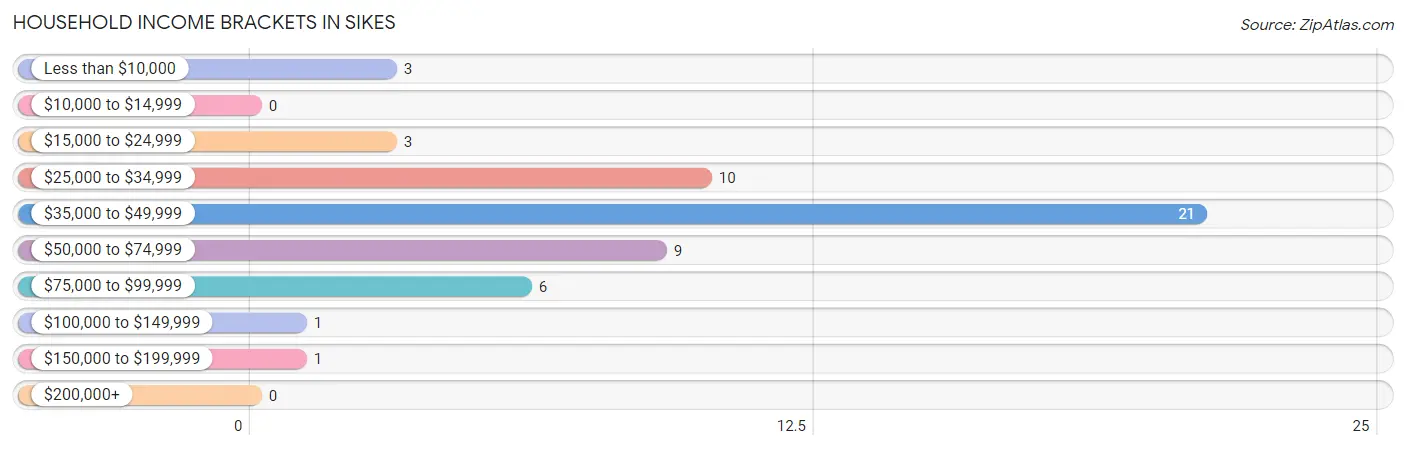
| Income Bracket | # Households | % Households |
| Less than $10,000 | 3 | 5.6% |
| $10,000 to $14,999 | 0 | 0.0% |
| $15,000 to $24,999 | 3 | 5.6% |
| $25,000 to $34,999 | 10 | 18.5% |
| $35,000 to $49,999 | 21 | 38.9% |
| $50,000 to $74,999 | 9 | 16.7% |
| $75,000 to $99,999 | 6 | 11.1% |
| $100,000 to $149,999 | 1 | 1.9% |
| $150,000 to $199,999 | 1 | 1.9% |
| $200,000+ | 0 | 0.0% |
Household Income by Householder Age in Sikes
The median household income in Sikes is $38,875, with the highest median household income of $39,063 found in the 45 to 64 years age bracket for the primary householder. A total of 29 households (53.7%) fall into this category. Meanwhile, the 15 to 24 years age bracket for the primary householder has the lowest median household income of $0, with 5 households (9.3%) in this group.
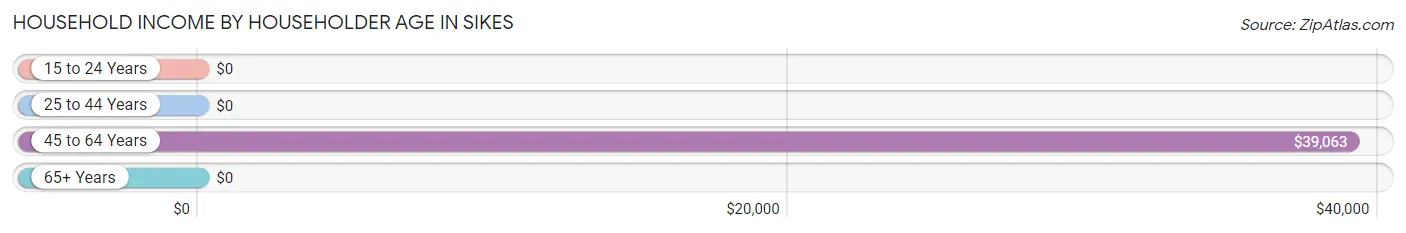
| Income Bracket | # Households | Median Income |
| 15 to 24 Years | 5 (9.3%) | $0 |
| 25 to 44 Years | 15 (27.8%) | $0 |
| 45 to 64 Years | 29 (53.7%) | $39,063 |
| 65+ Years | 5 (9.3%) | $0 |
| Total | 54 (100.0%) | $38,875 |
Poverty in Sikes
Income Below Poverty by Sex and Age in Sikes
With 1.0% poverty level for males and 8.8% for females among the residents of Sikes, 55 to 64 year old males and 75 year old and over females are the most vulnerable to poverty, with 2 males (22.2%) and 2 females (100.0%) in their respective age groups living below the poverty level.
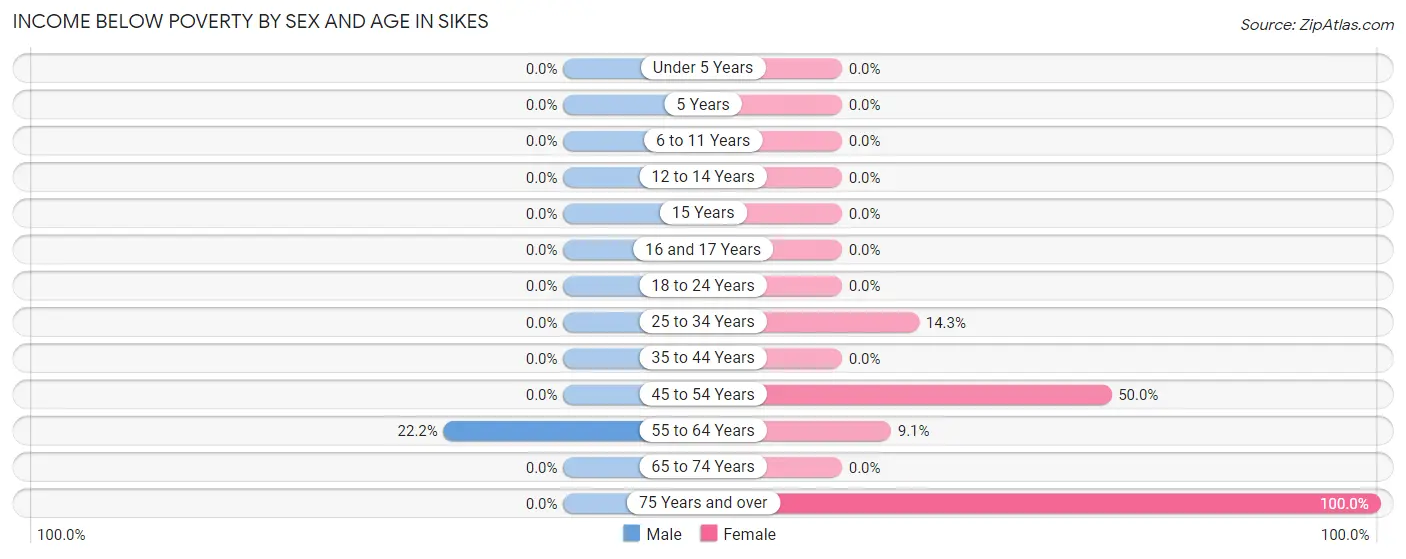
| Age Bracket | Male | Female |
| Under 5 Years | 0 (0.0%) | 0 (0.0%) |
| 5 Years | 0 (0.0%) | 0 (0.0%) |
| 6 to 11 Years | 0 (0.0%) | 0 (0.0%) |
| 12 to 14 Years | 0 (0.0%) | 0 (0.0%) |
| 15 Years | 0 (0.0%) | 0 (0.0%) |
| 16 and 17 Years | 0 (0.0%) | 0 (0.0%) |
| 18 to 24 Years | 0 (0.0%) | 0 (0.0%) |
| 25 to 34 Years | 0 (0.0%) | 1 (14.3%) |
| 35 to 44 Years | 0 (0.0%) | 0 (0.0%) |
| 45 to 54 Years | 0 (0.0%) | 1 (50.0%) |
| 55 to 64 Years | 2 (22.2%) | 2 (9.1%) |
| 65 to 74 Years | 0 (0.0%) | 0 (0.0%) |
| 75 Years and over | 0 (0.0%) | 2 (100.0%) |
| Total | 2 (1.0%) | 6 (8.8%) |
Income Above Poverty by Sex and Age in Sikes
According to the poverty statistics in Sikes, males aged under 5 years and females aged under 5 years are the age groups that are most secure financially, with 100.0% of males and 100.0% of females in these age groups living above the poverty line.
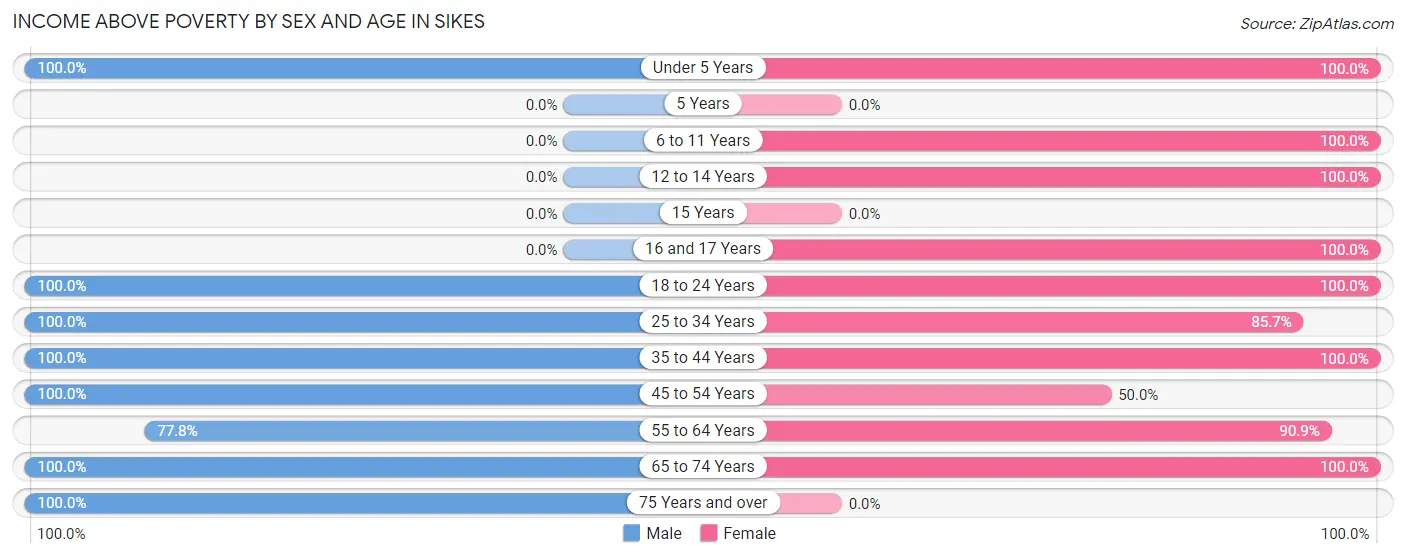
| Age Bracket | Male | Female |
| Under 5 Years | 8 (100.0%) | 13 (100.0%) |
| 5 Years | 0 (0.0%) | 0 (0.0%) |
| 6 to 11 Years | 0 (0.0%) | 2 (100.0%) |
| 12 to 14 Years | 0 (0.0%) | 1 (100.0%) |
| 15 Years | 0 (0.0%) | 0 (0.0%) |
| 16 and 17 Years | 0 (0.0%) | 5 (100.0%) |
| 18 to 24 Years | 7 (100.0%) | 2 (100.0%) |
| 25 to 34 Years | 165 (100.0%) | 6 (85.7%) |
| 35 to 44 Years | 7 (100.0%) | 10 (100.0%) |
| 45 to 54 Years | 1 (100.0%) | 1 (50.0%) |
| 55 to 64 Years | 7 (77.8%) | 20 (90.9%) |
| 65 to 74 Years | 2 (100.0%) | 2 (100.0%) |
| 75 Years and over | 1 (100.0%) | 0 (0.0%) |
| Total | 198 (99.0%) | 62 (91.2%) |
Income Below Poverty Among Married-Couple Families in Sikes
The poverty statistics for married-couple families in Sikes show that 13.3% or 2 of the total 15 families live below the poverty line. Families with no children have the highest poverty rate of 33.3%, comprising of 2 families. On the other hand, families with 1 or 2 children have the lowest poverty rate of 0.0%, which includes 0 families.
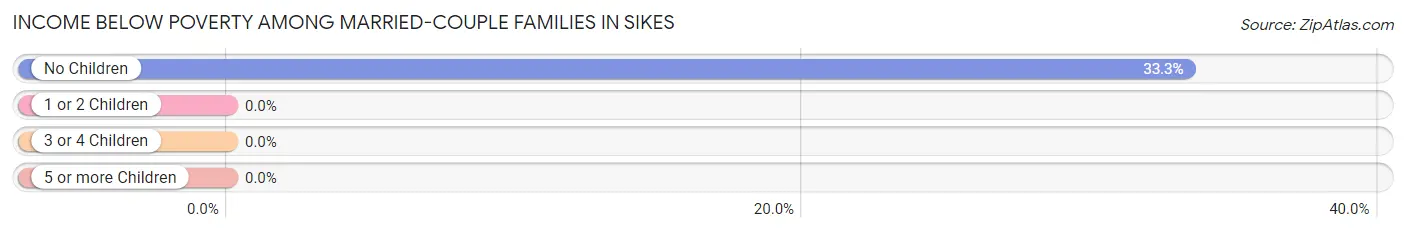
| Children | Above Poverty | Below Poverty |
| No Children | 4 (66.7%) | 2 (33.3%) |
| 1 or 2 Children | 6 (100.0%) | 0 (0.0%) |
| 3 or 4 Children | 3 (100.0%) | 0 (0.0%) |
| 5 or more Children | 0 (0.0%) | 0 (0.0%) |
| Total | 13 (86.7%) | 2 (13.3%) |
Income Below Poverty Among Single-Parent Households in Sikes
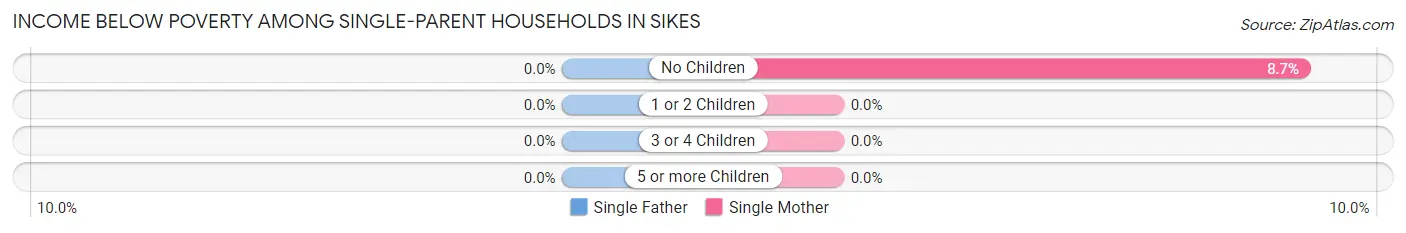
| Children | Single Father | Single Mother |
| No Children | 0 (0.0%) | 2 (8.7%) |
| 1 or 2 Children | 0 (0.0%) | 0 (0.0%) |
| 3 or 4 Children | 0 (0.0%) | 0 (0.0%) |
| 5 or more Children | 0 (0.0%) | 0 (0.0%) |
| Total | 0 (0.0%) | 2 (6.9%) |
Income Below Poverty Among Married-Couple vs Single-Parent Households in Sikes
The poverty data for Sikes shows that 2 of the married-couple family households (13.3%) and 2 of the single-parent households (6.9%) are living below the poverty level. Within the married-couple family households, those with no children have the highest poverty rate, with 2 households (33.3%) falling below the poverty line. Among the single-parent households, those with no children have the highest poverty rate, with 2 household (8.7%) living below poverty.
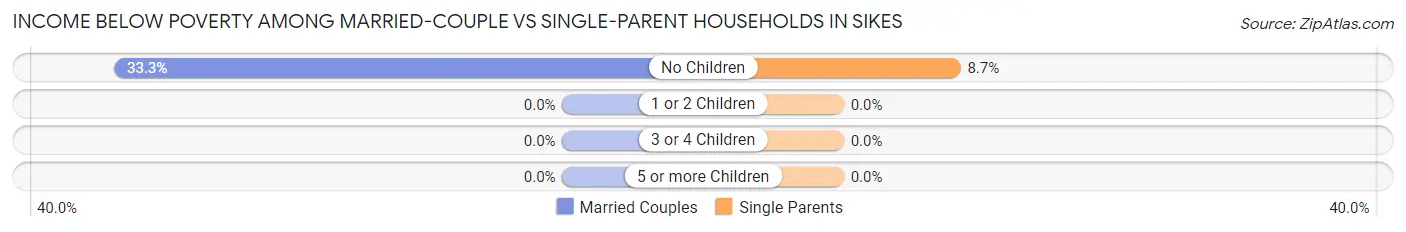
| Children | Married-Couple Families | Single-Parent Households |
| No Children | 2 (33.3%) | 2 (8.7%) |
| 1 or 2 Children | 0 (0.0%) | 0 (0.0%) |
| 3 or 4 Children | 0 (0.0%) | 0 (0.0%) |
| 5 or more Children | 0 (0.0%) | 0 (0.0%) |
| Total | 2 (13.3%) | 2 (6.9%) |
Race in Sikes
The most populous races in Sikes are White / Caucasian (266 | 99.3%), Hispanic or Latino (2 | 0.7%), and Native / Alaskan (2 | 0.7%).
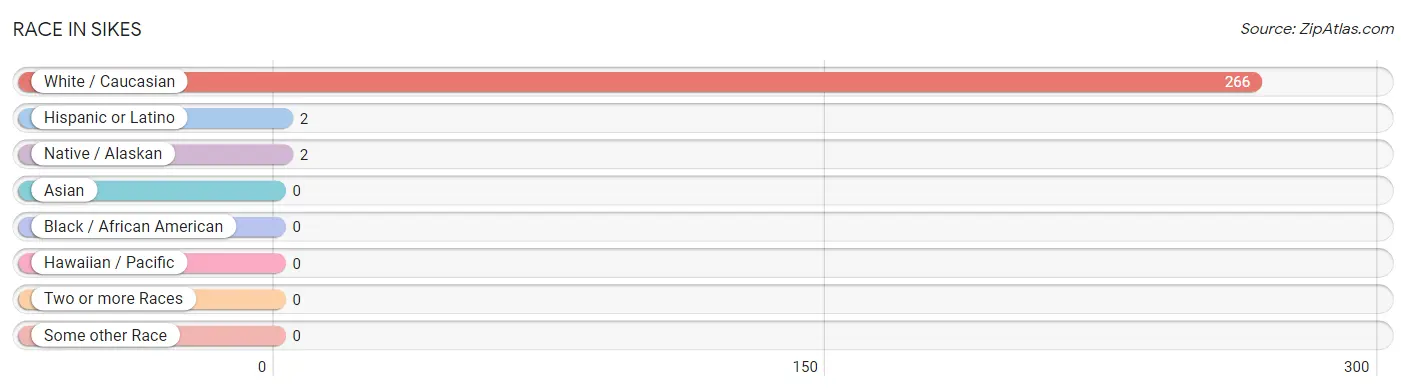
| Race | # Population | % Population |
| Asian | 0 | 0.0% |
| Black / African American | 0 | 0.0% |
| Hawaiian / Pacific | 0 | 0.0% |
| Hispanic or Latino | 2 | 0.7% |
| Native / Alaskan | 2 | 0.7% |
| White / Caucasian | 266 | 99.3% |
| Two or more Races | 0 | 0.0% |
| Some other Race | 0 | 0.0% |
| Total | 268 | 100.0% |
Ancestry in Sikes
The most populous ancestries reported in Sikes are American (26 | 9.7%), Italian (21 | 7.8%), French (19 | 7.1%), German (5 | 1.9%), and French American Indian (2 | 0.7%), together accounting for 27.3% of all Sikes residents.
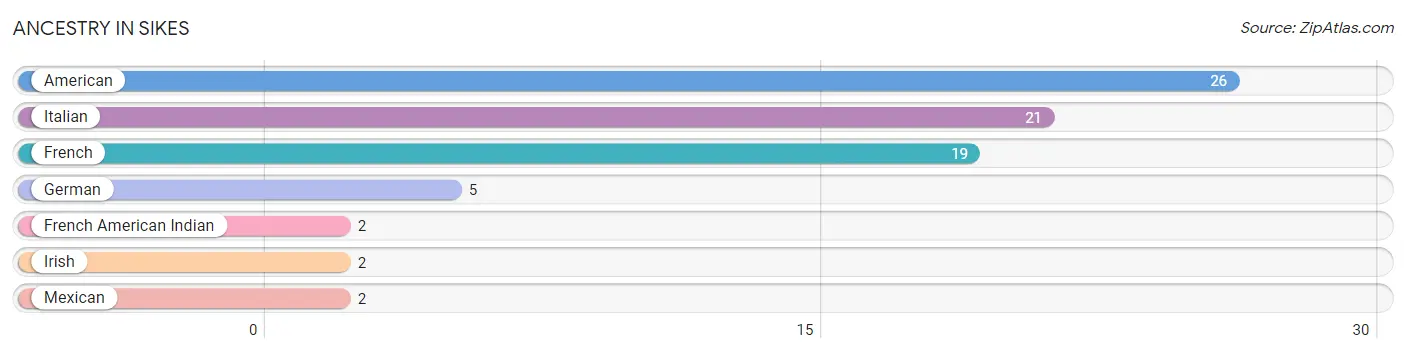
| Ancestry | # Population | % Population |
| American | 26 | 9.7% |
| French | 19 | 7.1% |
| French American Indian | 2 | 0.7% |
| German | 5 | 1.9% |
| Irish | 2 | 0.7% |
| Italian | 21 | 7.8% |
| Mexican | 2 | 0.7% | View All 7 Rows |
Immigrants in Sikes

| Immigration Origin | # Population | % Population | View All 0 Rows |
Sex and Age in Sikes
Sex and Age in Sikes
The most populous age groups in Sikes are 25 to 29 Years (164 | 82.0%) for men and 60 to 64 Years (22 | 32.4%) for women.
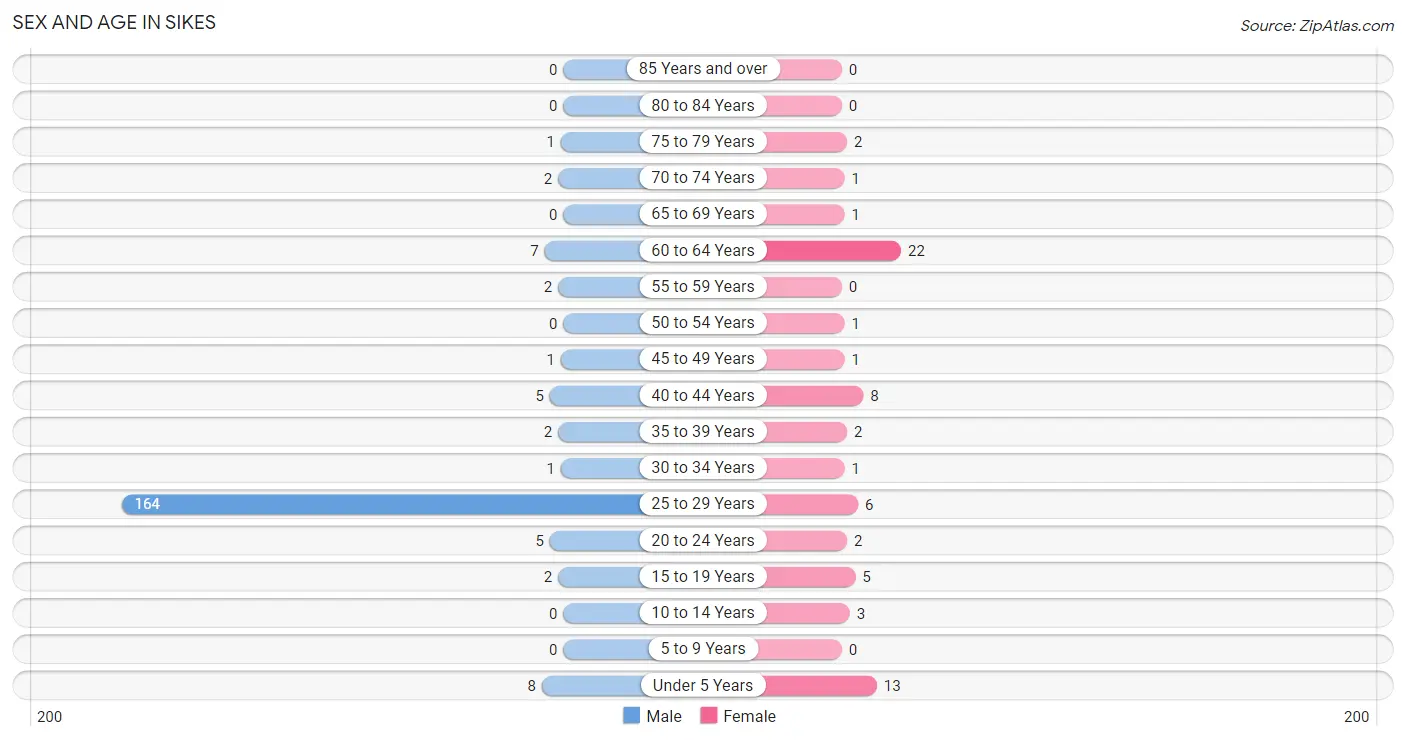
| Age Bracket | Male | Female |
| Under 5 Years | 8 (4.0%) | 13 (19.1%) |
| 5 to 9 Years | 0 (0.0%) | 0 (0.0%) |
| 10 to 14 Years | 0 (0.0%) | 3 (4.4%) |
| 15 to 19 Years | 2 (1.0%) | 5 (7.3%) |
| 20 to 24 Years | 5 (2.5%) | 2 (2.9%) |
| 25 to 29 Years | 164 (82.0%) | 6 (8.8%) |
| 30 to 34 Years | 1 (0.5%) | 1 (1.5%) |
| 35 to 39 Years | 2 (1.0%) | 2 (2.9%) |
| 40 to 44 Years | 5 (2.5%) | 8 (11.8%) |
| 45 to 49 Years | 1 (0.5%) | 1 (1.5%) |
| 50 to 54 Years | 0 (0.0%) | 1 (1.5%) |
| 55 to 59 Years | 2 (1.0%) | 0 (0.0%) |
| 60 to 64 Years | 7 (3.5%) | 22 (32.4%) |
| 65 to 69 Years | 0 (0.0%) | 1 (1.5%) |
| 70 to 74 Years | 2 (1.0%) | 1 (1.5%) |
| 75 to 79 Years | 1 (0.5%) | 2 (2.9%) |
| 80 to 84 Years | 0 (0.0%) | 0 (0.0%) |
| 85 Years and over | 0 (0.0%) | 0 (0.0%) |
| Total | 200 (100.0%) | 68 (100.0%) |
Families and Households in Sikes
Median Family Size in Sikes
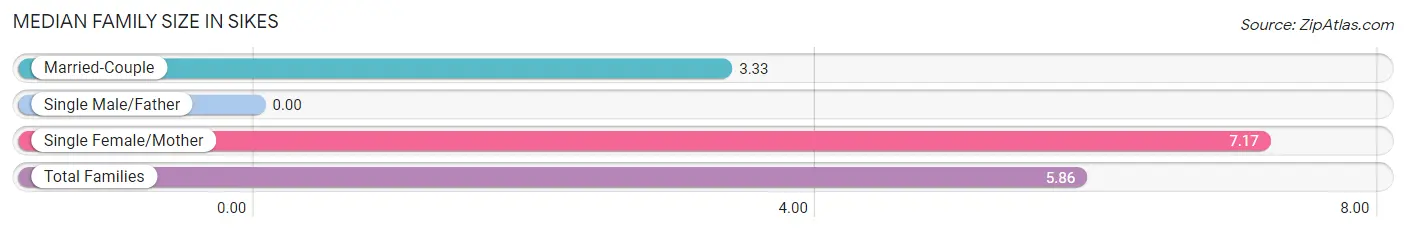
| Family Type | # Families | Family Size |
| Married-Couple | 15 (34.1%) | 3.33 |
| Single Male/Father | 0 (0.0%) | - |
| Single Female/Mother | 29 (65.9%) | 7.17 |
| Total Families | 44 (100.0%) | 5.86 |
Median Household Size in Sikes
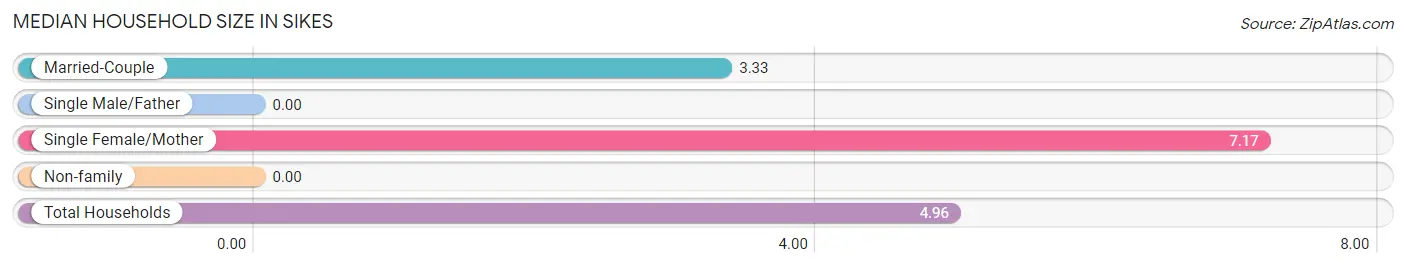
| Household Type | # Households | Household Size |
| Married-Couple | 15 (27.8%) | 3.33 |
| Single Male/Father | 0 (0.0%) | - |
| Single Female/Mother | 29 (53.7%) | 7.17 |
| Non-family | 10 (18.5%) | - |
| Total Households | 54 (100.0%) | 4.96 |
Household Size by Marriage Status in Sikes
Out of a total of 54 households in Sikes, 44 (81.5%) are family households, while 10 (18.5%) are nonfamily households. The most numerous type of family households are 2-person households, comprising 28, and the most common type of nonfamily households are 1-person households, comprising 10.
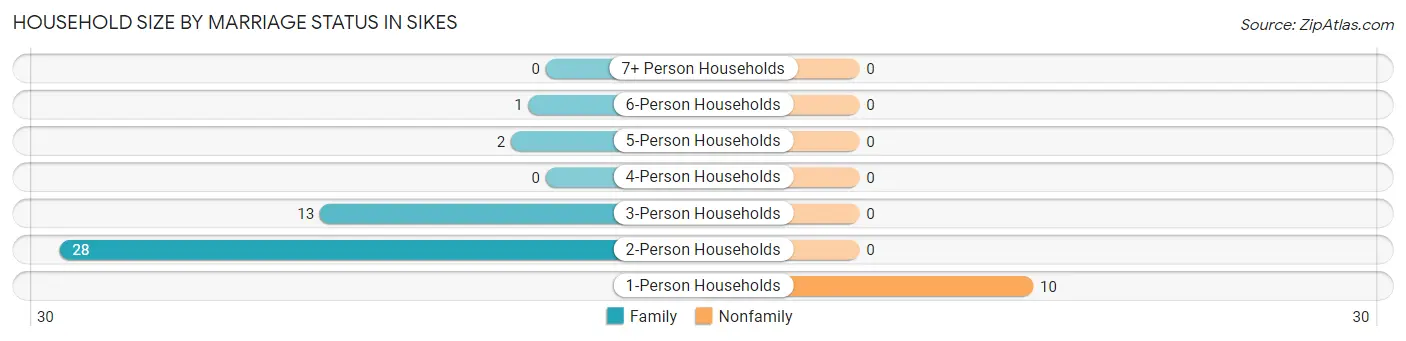
| Household Size | Family Households | Nonfamily Households |
| 1-Person Households | - | 10 (18.5%) |
| 2-Person Households | 28 (51.8%) | 0 (0.0%) |
| 3-Person Households | 13 (24.1%) | 0 (0.0%) |
| 4-Person Households | 0 (0.0%) | 0 (0.0%) |
| 5-Person Households | 2 (3.7%) | 0 (0.0%) |
| 6-Person Households | 1 (1.8%) | 0 (0.0%) |
| 7+ Person Households | 0 (0.0%) | 0 (0.0%) |
| Total | 44 (81.5%) | 10 (18.5%) |
Female Fertility in Sikes
Fertility by Age in Sikes
Average fertility rate in Sikes is 160.0 births per 1,000 women. Women in the age bracket of 20 to 34 years have the highest fertility rate with 222.0 births per 1,000 women. Women in the age bracket of 20 to 34 years acount for 50.0% of all women with births.
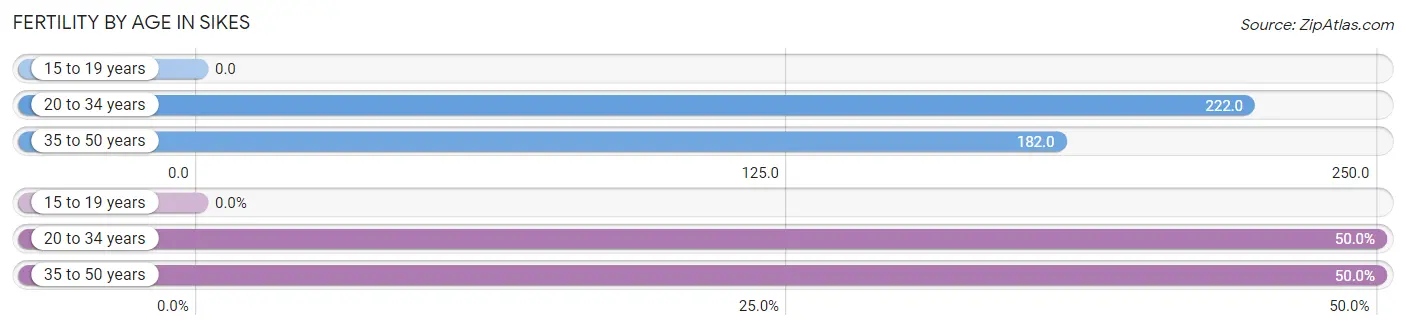
| Age Bracket | Women with Births | Births / 1,000 Women |
| 15 to 19 years | 0 (0.0%) | 0.0 |
| 20 to 34 years | 2 (50.0%) | 222.0 |
| 35 to 50 years | 2 (50.0%) | 182.0 |
| Total | 4 (100.0%) | 160.0 |
Fertility by Age by Marriage Status in Sikes
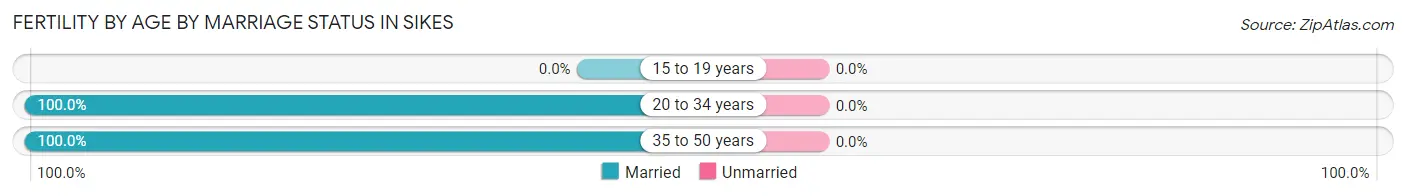
| Age Bracket | Married | Unmarried |
| 15 to 19 years | 0 (0.0%) | 0 (0.0%) |
| 20 to 34 years | 2 (100.0%) | 0 (0.0%) |
| 35 to 50 years | 2 (100.0%) | 0 (0.0%) |
| Total | 4 (100.0%) | 0 (0.0%) |
Fertility by Education in Sikes
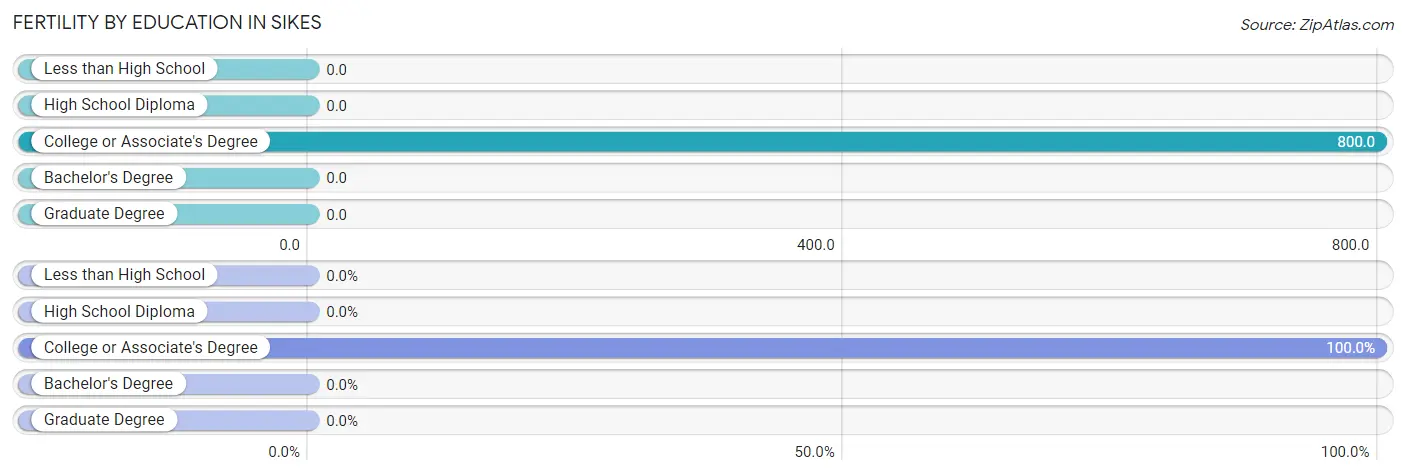
| Educational Attainment | Women with Births | Births / 1,000 Women |
| Less than High School | 0 (0.0%) | 0.0 |
| High School Diploma | 0 (0.0%) | 0.0 |
| College or Associate's Degree | 4 (100.0%) | 800.0 |
| Bachelor's Degree | 0 (0.0%) | 0.0 |
| Graduate Degree | 0 (0.0%) | 0.0 |
| Total | 4 (100.0%) | 160.0 |
Fertility by Education by Marriage Status in Sikes
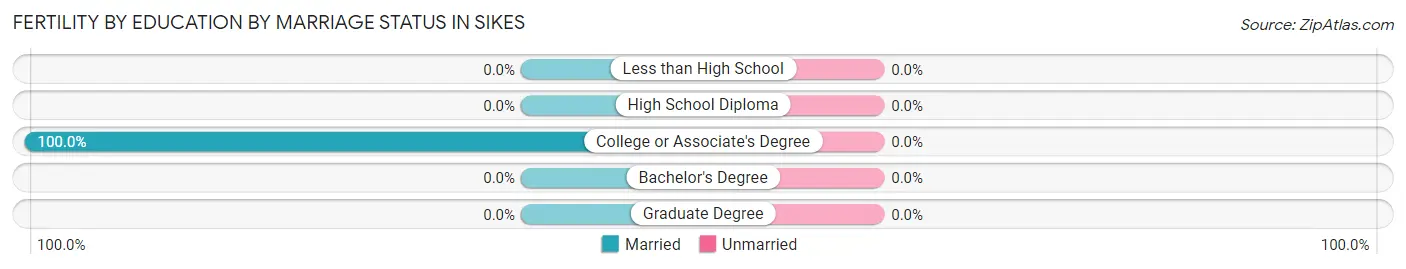
| Educational Attainment | Married | Unmarried |
| Less than High School | 0 (0.0%) | 0 (0.0%) |
| High School Diploma | 0 (0.0%) | 0 (0.0%) |
| College or Associate's Degree | 4 (100.0%) | 0 (0.0%) |
| Bachelor's Degree | 0 (0.0%) | 0 (0.0%) |
| Graduate Degree | 0 (0.0%) | 0 (0.0%) |
| Total | 4 (100.0%) | 0 (0.0%) |
Employment Characteristics in Sikes
Employment by Class of Employer in Sikes
Among the 48 employed individuals in Sikes, private company employees (27 | 56.2%), local government employees (20 | 41.7%), and not-for-profit organizations (1 | 2.1%) make up the most common classes of employment.
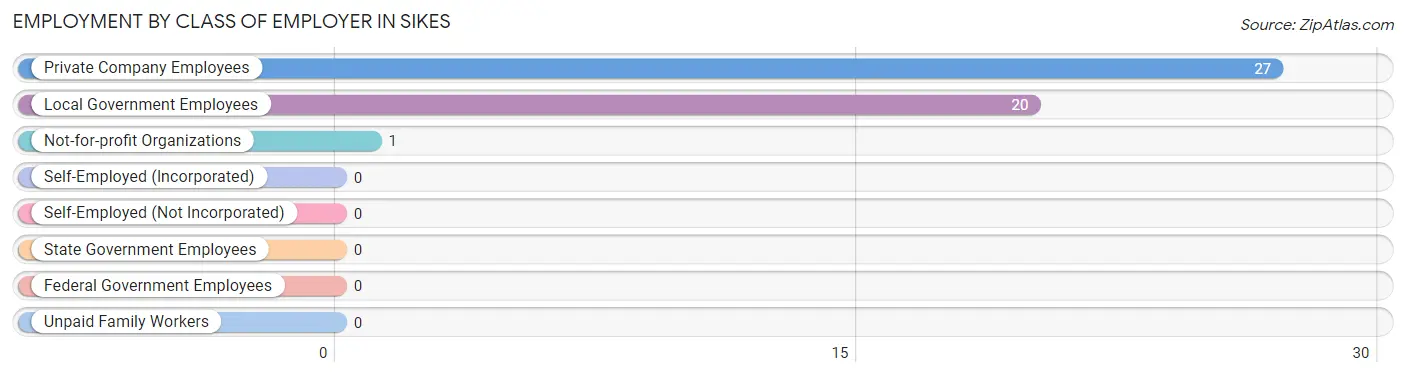
| Employer Class | # Employees | % Employees |
| Private Company Employees | 27 | 56.2% |
| Self-Employed (Incorporated) | 0 | 0.0% |
| Self-Employed (Not Incorporated) | 0 | 0.0% |
| Not-for-profit Organizations | 1 | 2.1% |
| Local Government Employees | 20 | 41.7% |
| State Government Employees | 0 | 0.0% |
| Federal Government Employees | 0 | 0.0% |
| Unpaid Family Workers | 0 | 0.0% |
| Total | 48 | 100.0% |
Employment Status by Age in Sikes
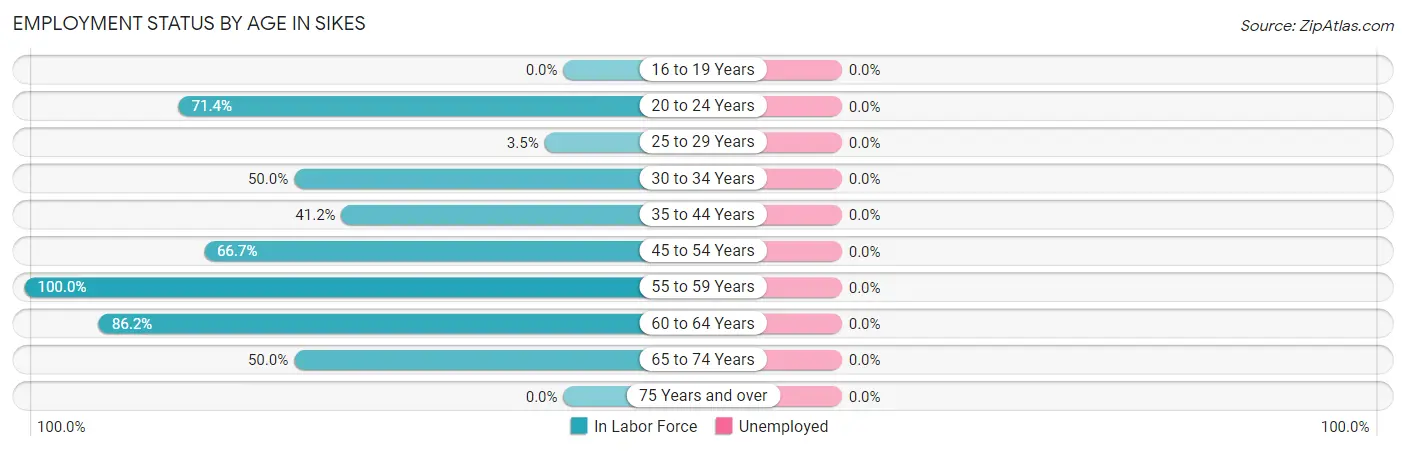
| Age Bracket | In Labor Force | Unemployed |
| 16 to 19 Years | 0 (0.0%) | 0 (0.0%) |
| 20 to 24 Years | 5 (71.4%) | 0 (0.0%) |
| 25 to 29 Years | 6 (3.5%) | 0 (0.0%) |
| 30 to 34 Years | 1 (50.0%) | 0 (0.0%) |
| 35 to 44 Years | 7 (41.2%) | 0 (0.0%) |
| 45 to 54 Years | 2 (66.7%) | 0 (0.0%) |
| 55 to 59 Years | 2 (100.0%) | 0 (0.0%) |
| 60 to 64 Years | 25 (86.2%) | 0 (0.0%) |
| 65 to 74 Years | 2 (50.0%) | 0 (0.0%) |
| 75 Years and over | 0 (0.0%) | 0 (0.0%) |
| Total | 50 (20.5%) | 0 (0.0%) |
Employment Status by Educational Attainment in Sikes
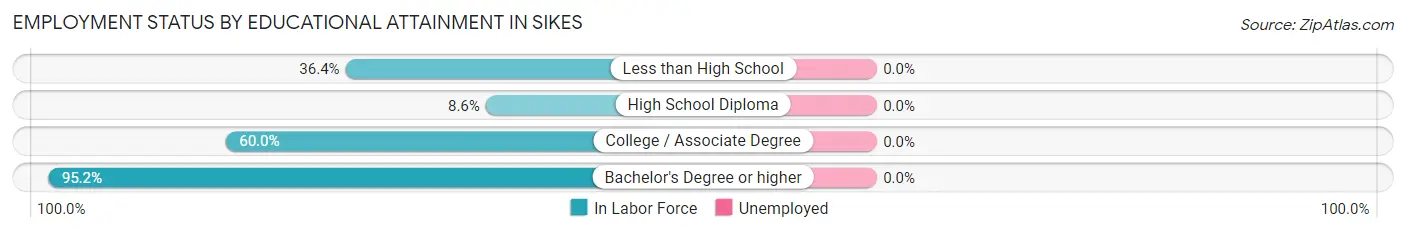
| Educational Attainment | In Labor Force | Unemployed |
| Less than High School | 4 (36.4%) | 0 (0.0%) |
| High School Diploma | 16 (8.6%) | 0 (0.0%) |
| College / Associate Degree | 3 (60.0%) | 0 (0.0%) |
| Bachelor's Degree or higher | 20 (95.2%) | 0 (0.0%) |
| Total | 43 (19.3%) | 0 (0.0%) |
Employment Occupations by Sex in Sikes
Management, Business, Science and Arts Occupations
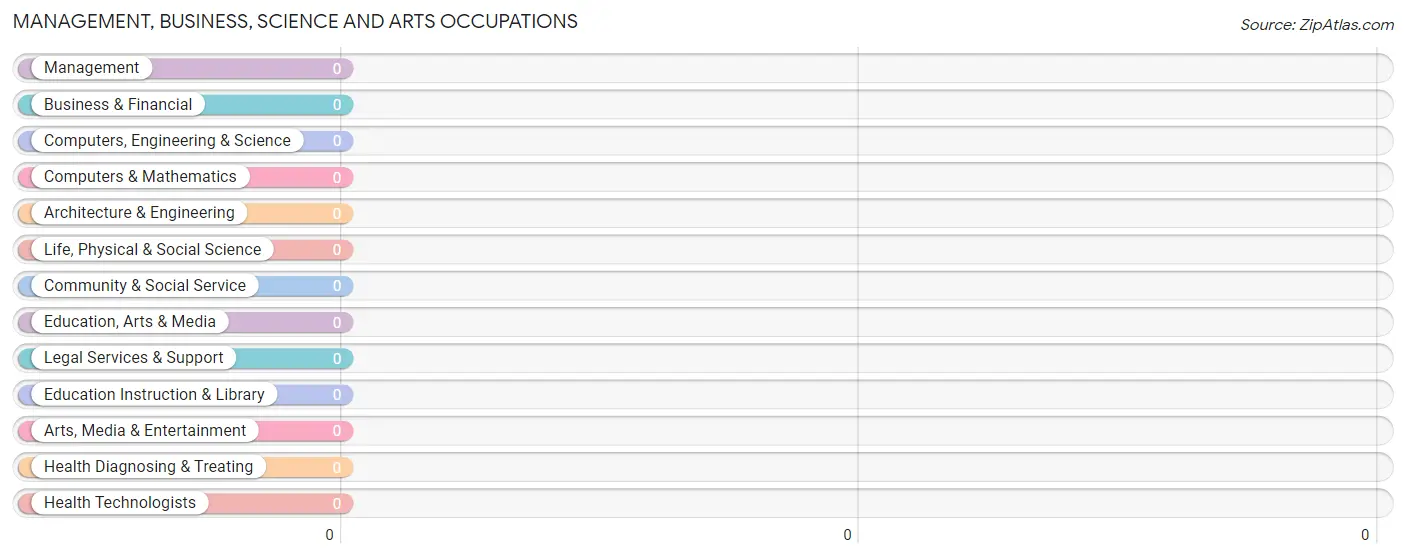
Management, Business, Science and Arts Occupations by Sex
| Occupation | Male | Female |
| Management | 0 (0.0%) | 0 (0.0%) |
| Business & Financial | 0 (0.0%) | 0 (0.0%) |
| Computers, Engineering & Science | 0 (0.0%) | 0 (0.0%) |
| Computers & Mathematics | 0 (0.0%) | 0 (0.0%) |
| Architecture & Engineering | 0 (0.0%) | 0 (0.0%) |
| Life, Physical & Social Science | 0 (0.0%) | 0 (0.0%) |
| Community & Social Service | 0 (0.0%) | 0 (0.0%) |
| Education, Arts & Media | 0 (0.0%) | 0 (0.0%) |
| Legal Services & Support | 0 (0.0%) | 0 (0.0%) |
| Education Instruction & Library | 0 (0.0%) | 0 (0.0%) |
| Arts, Media & Entertainment | 0 (0.0%) | 0 (0.0%) |
| Health Diagnosing & Treating | 0 (0.0%) | 0 (0.0%) |
| Health Technologists | 0 (0.0%) | 0 (0.0%) |
| Total (Category) | 0 (0.0%) | 0 (0.0%) |
| Total (Overall) | 22 (44.0%) | 28 (56.0%) |
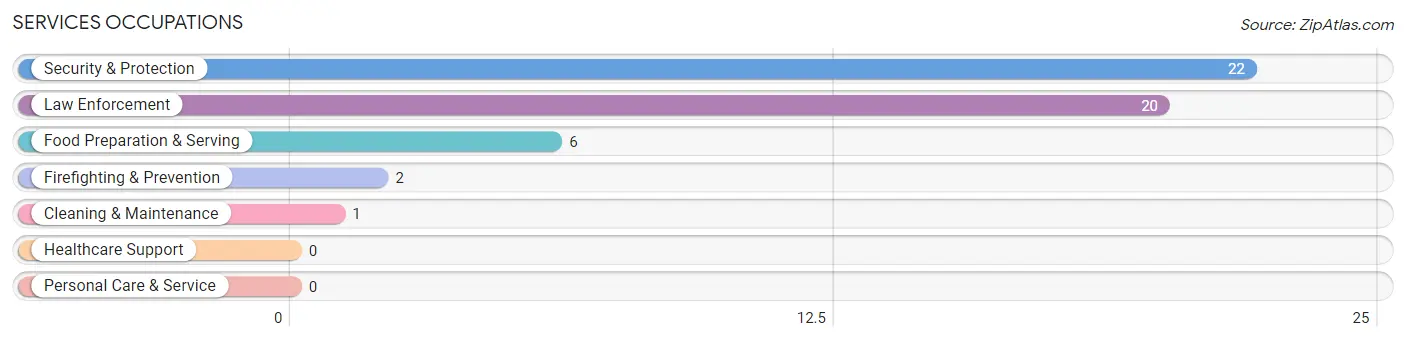
Services Occupations
The most common Services occupations in Sikes are Security & Protection (22 | 44.0%), Law Enforcement (20 | 40.0%), Food Preparation & Serving (6 | 12.0%), Firefighting & Prevention (2 | 4.0%), and Cleaning & Maintenance (1 | 2.0%).
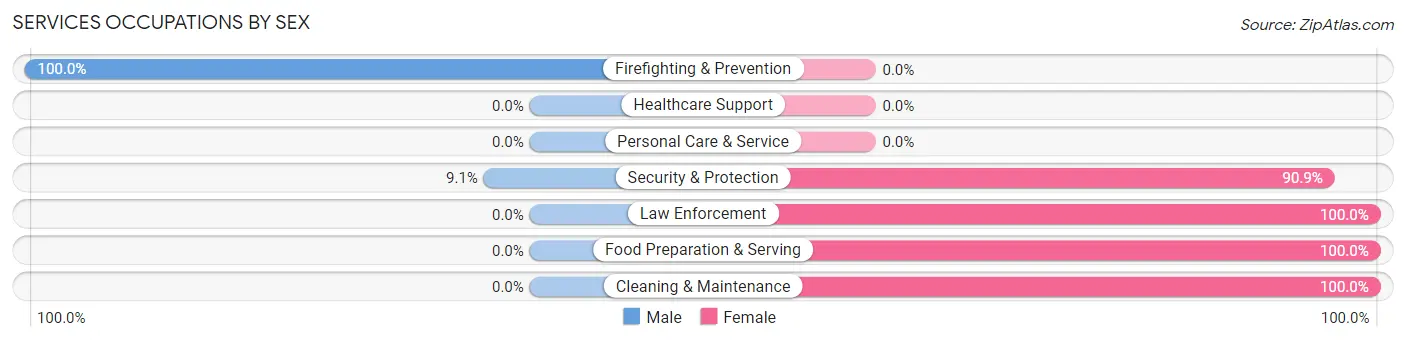
Services Occupations by Sex
Within the Services occupations in Sikes, the most male-oriented occupations are Firefighting & Prevention (100.0%), and Security & Protection (9.1%), while the most female-oriented occupations are Law Enforcement (100.0%), Food Preparation & Serving (100.0%), and Cleaning & Maintenance (100.0%).
| Occupation | Male | Female |
| Healthcare Support | 0 (0.0%) | 0 (0.0%) |
| Security & Protection | 2 (9.1%) | 20 (90.9%) |
| Firefighting & Prevention | 2 (100.0%) | 0 (0.0%) |
| Law Enforcement | 0 (0.0%) | 20 (100.0%) |
| Food Preparation & Serving | 0 (0.0%) | 6 (100.0%) |
| Cleaning & Maintenance | 0 (0.0%) | 1 (100.0%) |
| Personal Care & Service | 0 (0.0%) | 0 (0.0%) |
| Total (Category) | 2 (6.9%) | 27 (93.1%) |
| Total (Overall) | 22 (44.0%) | 28 (56.0%) |
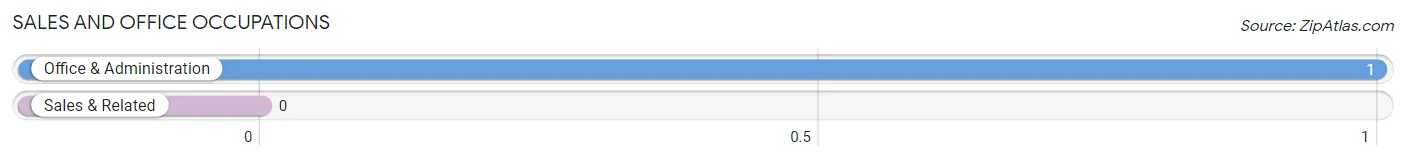
Sales and Office Occupations
The most common Sales and Office occupations in Sikes are , and Office & Administration (1 | 2.0%).
Sales and Office Occupations by Sex
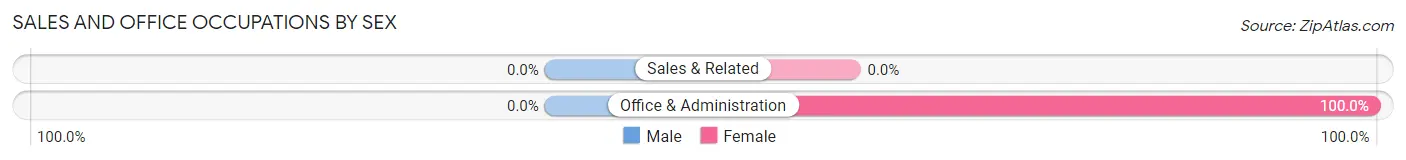
| Occupation | Male | Female |
| Sales & Related | 0 (0.0%) | 0 (0.0%) |
| Office & Administration | 0 (0.0%) | 1 (100.0%) |
| Total (Category) | 0 (0.0%) | 1 (100.0%) |
| Total (Overall) | 22 (44.0%) | 28 (56.0%) |
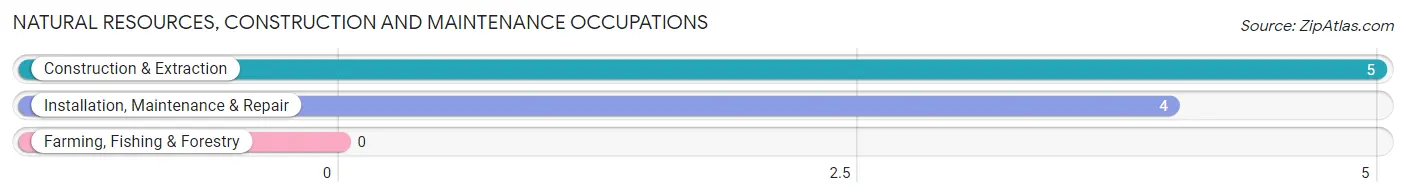
Natural Resources, Construction and Maintenance Occupations
The most common Natural Resources, Construction and Maintenance occupations in Sikes are Construction & Extraction (5 | 10.0%), and Installation, Maintenance & Repair (4 | 8.0%).
Natural Resources, Construction and Maintenance Occupations by Sex
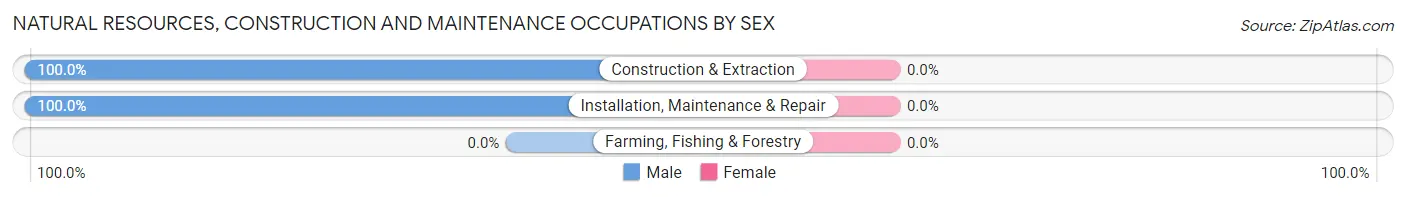
| Occupation | Male | Female |
| Farming, Fishing & Forestry | 0 (0.0%) | 0 (0.0%) |
| Construction & Extraction | 5 (100.0%) | 0 (0.0%) |
| Installation, Maintenance & Repair | 4 (100.0%) | 0 (0.0%) |
| Total (Category) | 9 (100.0%) | 0 (0.0%) |
| Total (Overall) | 22 (44.0%) | 28 (56.0%) |
Production, Transportation and Moving Occupations
The most common Production, Transportation and Moving occupations in Sikes are , and Production (11 | 22.0%).
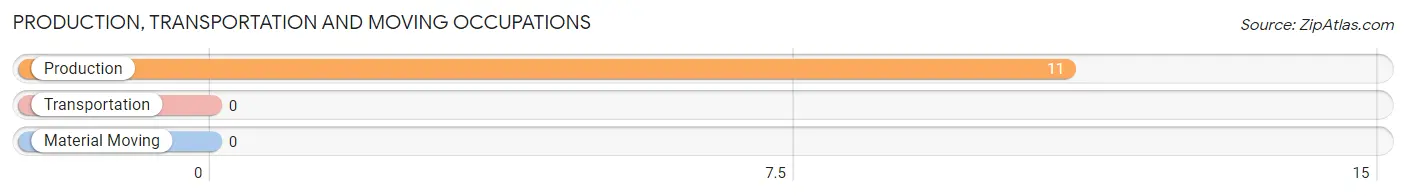
Production, Transportation and Moving Occupations by Sex
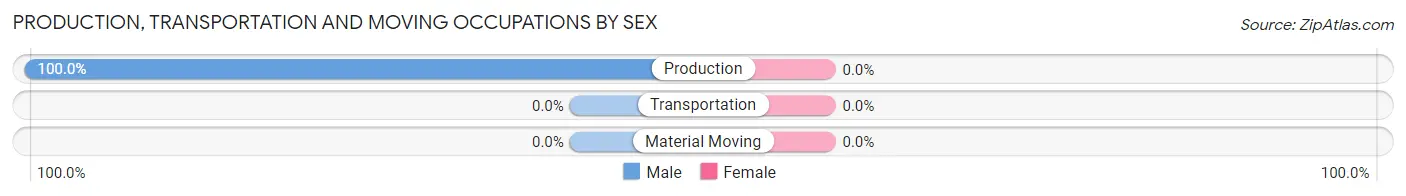
| Occupation | Male | Female |
| Production | 11 (100.0%) | 0 (0.0%) |
| Transportation | 0 (0.0%) | 0 (0.0%) |
| Material Moving | 0 (0.0%) | 0 (0.0%) |
| Total (Category) | 11 (100.0%) | 0 (0.0%) |
| Total (Overall) | 22 (44.0%) | 28 (56.0%) |
Employment Industries by Sex in Sikes
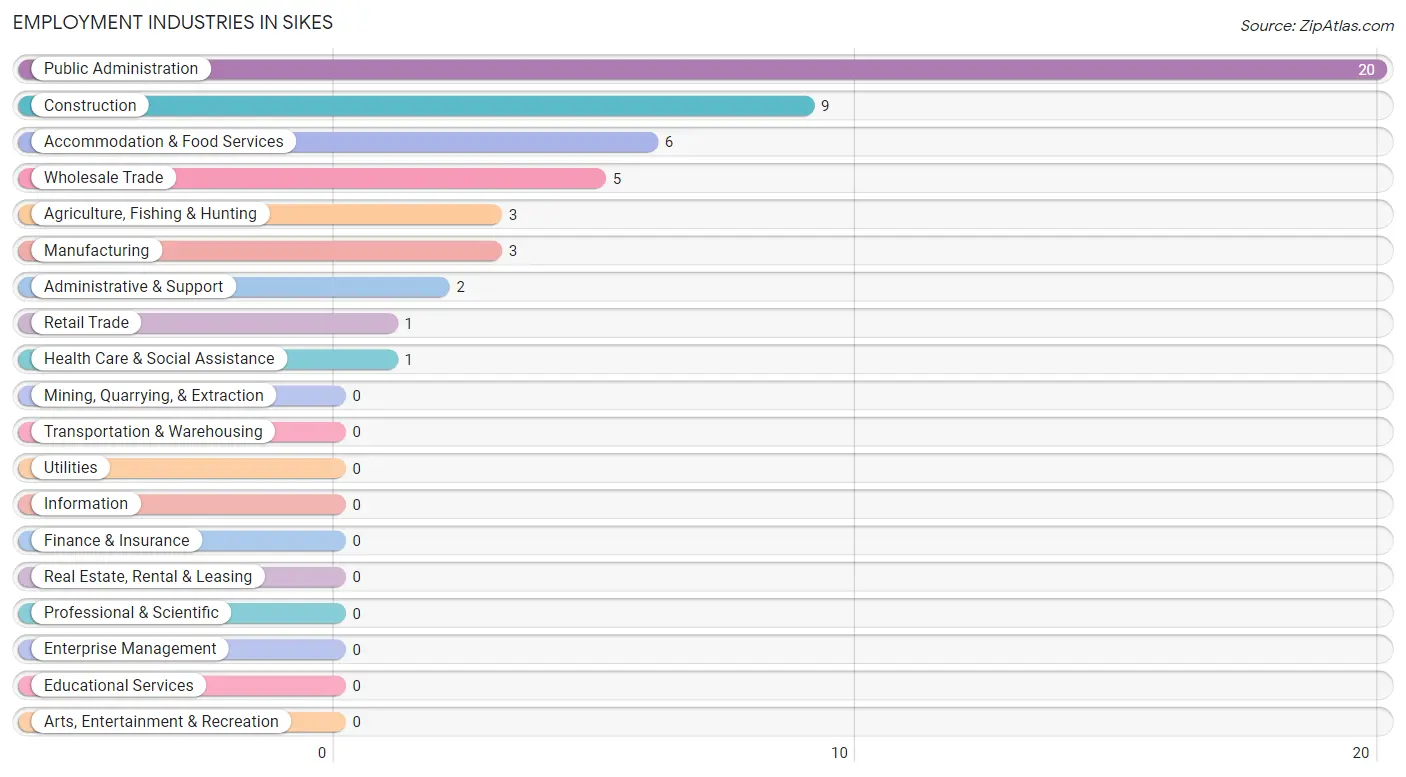
Employment Industries in Sikes
The major employment industries in Sikes include Public Administration (20 | 40.0%), Construction (9 | 18.0%), Accommodation & Food Services (6 | 12.0%), Wholesale Trade (5 | 10.0%), and Agriculture, Fishing & Hunting (3 | 6.0%).
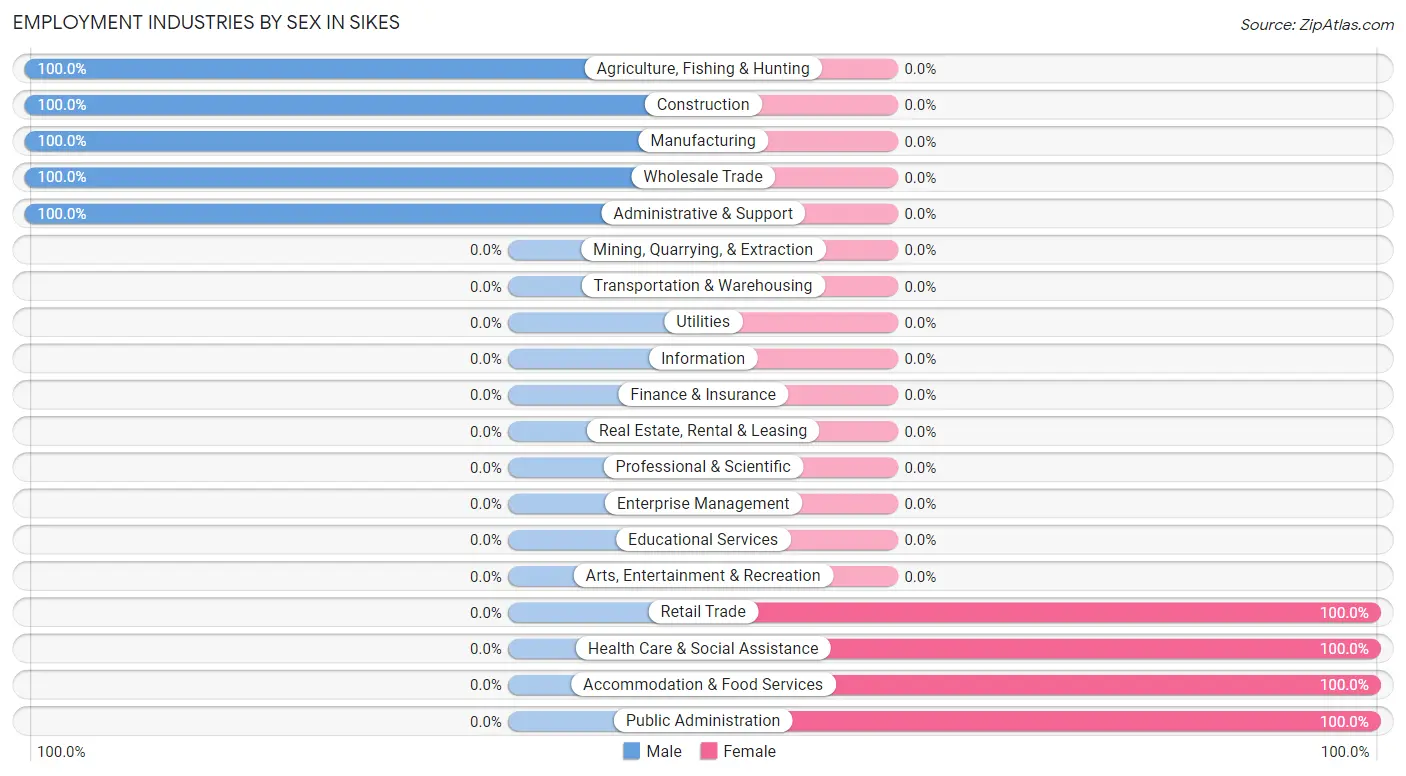
Employment Industries by Sex in Sikes
The Sikes industries that see more men than women are Agriculture, Fishing & Hunting (100.0%), Construction (100.0%), and Manufacturing (100.0%), whereas the industries that tend to have a higher number of women are Retail Trade (100.0%), Health Care & Social Assistance (100.0%), and Accommodation & Food Services (100.0%).
| Industry | Male | Female |
| Agriculture, Fishing & Hunting | 3 (100.0%) | 0 (0.0%) |
| Mining, Quarrying, & Extraction | 0 (0.0%) | 0 (0.0%) |
| Construction | 9 (100.0%) | 0 (0.0%) |
| Manufacturing | 3 (100.0%) | 0 (0.0%) |
| Wholesale Trade | 5 (100.0%) | 0 (0.0%) |
| Retail Trade | 0 (0.0%) | 1 (100.0%) |
| Transportation & Warehousing | 0 (0.0%) | 0 (0.0%) |
| Utilities | 0 (0.0%) | 0 (0.0%) |
| Information | 0 (0.0%) | 0 (0.0%) |
| Finance & Insurance | 0 (0.0%) | 0 (0.0%) |
| Real Estate, Rental & Leasing | 0 (0.0%) | 0 (0.0%) |
| Professional & Scientific | 0 (0.0%) | 0 (0.0%) |
| Enterprise Management | 0 (0.0%) | 0 (0.0%) |
| Administrative & Support | 2 (100.0%) | 0 (0.0%) |
| Educational Services | 0 (0.0%) | 0 (0.0%) |
| Health Care & Social Assistance | 0 (0.0%) | 1 (100.0%) |
| Arts, Entertainment & Recreation | 0 (0.0%) | 0 (0.0%) |
| Accommodation & Food Services | 0 (0.0%) | 6 (100.0%) |
| Public Administration | 0 (0.0%) | 20 (100.0%) |
| Total | 22 (44.0%) | 28 (56.0%) |
Education in Sikes
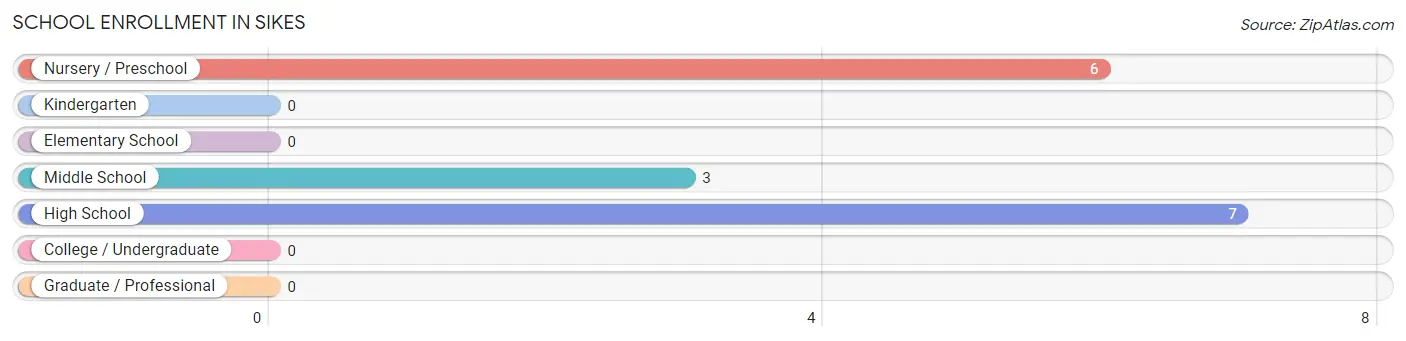
School Enrollment in Sikes
The most common levels of schooling among the 16 students in Sikes are high school (7 | 43.8%), nursery / preschool (6 | 37.5%), and middle school (3 | 18.8%).
| School Level | # Students | % Students |
| Nursery / Preschool | 6 | 37.5% |
| Kindergarten | 0 | 0.0% |
| Elementary School | 0 | 0.0% |
| Middle School | 3 | 18.8% |
| High School | 7 | 43.8% |
| College / Undergraduate | 0 | 0.0% |
| Graduate / Professional | 0 | 0.0% |
| Total | 16 | 100.0% |
School Enrollment by Age by Funding Source in Sikes
Out of a total of 16 students who are enrolled in schools in Sikes, 6 (37.5%) attend a private institution, while the remaining 10 (62.5%) are enrolled in public schools. The age group of 3 to 4 year olds has the highest likelihood of being enrolled in private schools, with 6 (100.0% in the age bracket) enrolled. Conversely, the age group of 10 to 14 year olds has the lowest likelihood of being enrolled in a private school, with 3 (100.0% in the age bracket) attending a public institution.
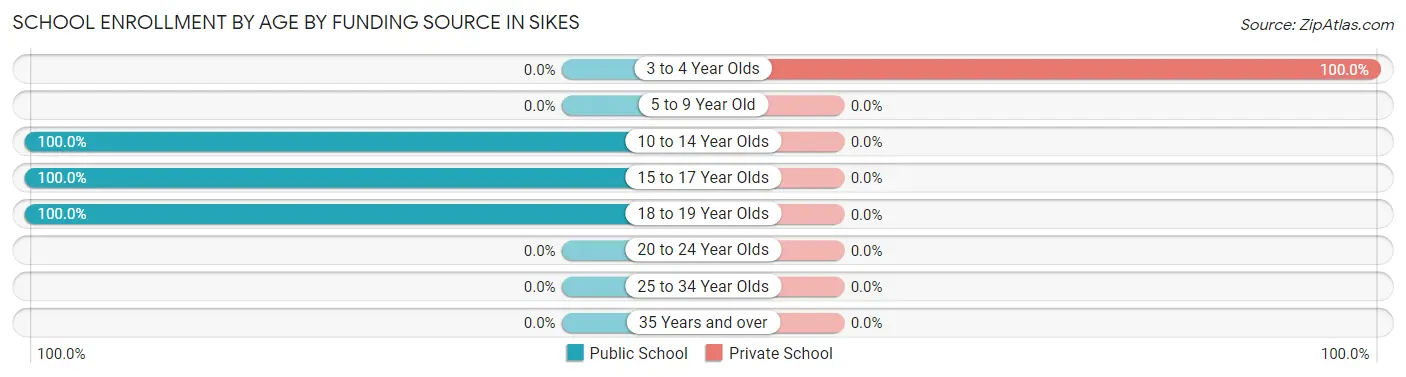
| Age Bracket | Public School | Private School |
| 3 to 4 Year Olds | 0 (0.0%) | 6 (100.0%) |
| 5 to 9 Year Old | 0 (0.0%) | 0 (0.0%) |
| 10 to 14 Year Olds | 3 (100.0%) | 0 (0.0%) |
| 15 to 17 Year Olds | 5 (100.0%) | 0 (0.0%) |
| 18 to 19 Year Olds | 2 (100.0%) | 0 (0.0%) |
| 20 to 24 Year Olds | 0 (0.0%) | 0 (0.0%) |
| 25 to 34 Year Olds | 0 (0.0%) | 0 (0.0%) |
| 35 Years and over | 0 (0.0%) | 0 (0.0%) |
| Total | 10 (62.5%) | 6 (37.5%) |
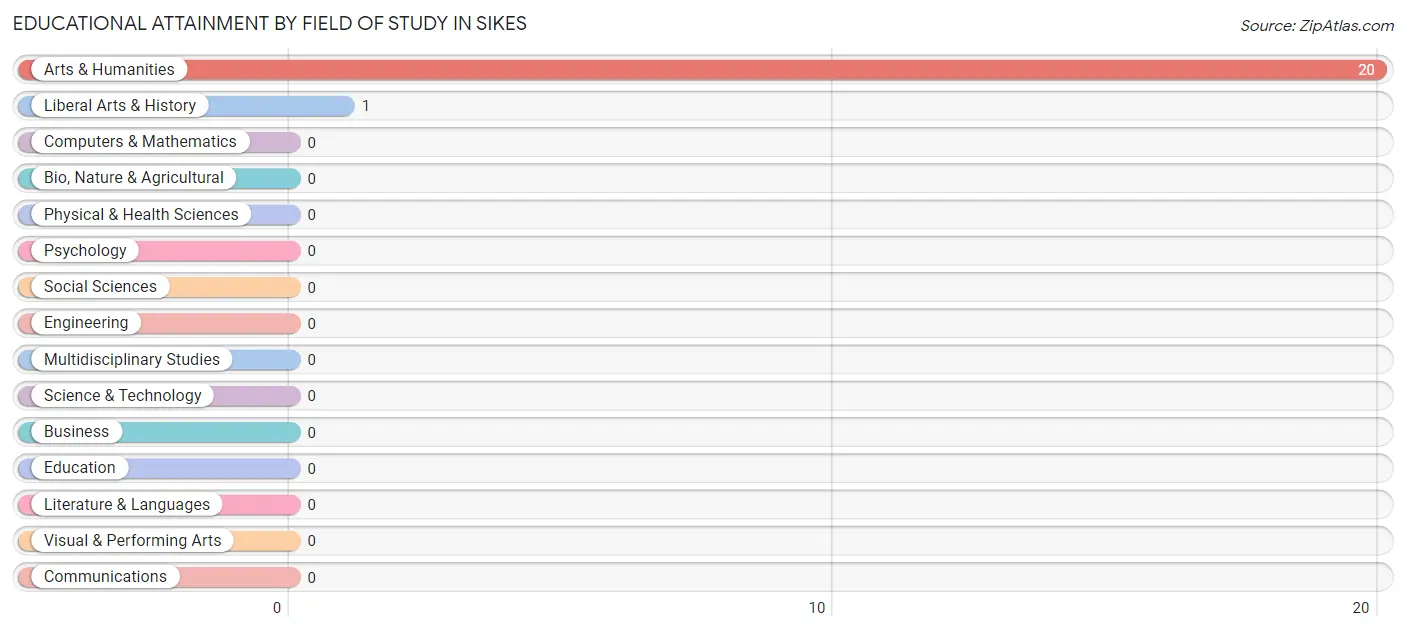
Educational Attainment by Field of Study in Sikes
Arts & humanities (20 | 95.2%), and liberal arts & history (1 | 4.8%) are the most common fields of study among 21 individuals in Sikes who have obtained a bachelor's degree or higher.
| Field of Study | # Graduates | % Graduates |
| Computers & Mathematics | 0 | 0.0% |
| Bio, Nature & Agricultural | 0 | 0.0% |
| Physical & Health Sciences | 0 | 0.0% |
| Psychology | 0 | 0.0% |
| Social Sciences | 0 | 0.0% |
| Engineering | 0 | 0.0% |
| Multidisciplinary Studies | 0 | 0.0% |
| Science & Technology | 0 | 0.0% |
| Business | 0 | 0.0% |
| Education | 0 | 0.0% |
| Literature & Languages | 0 | 0.0% |
| Liberal Arts & History | 1 | 4.8% |
| Visual & Performing Arts | 0 | 0.0% |
| Communications | 0 | 0.0% |
| Arts & Humanities | 20 | 95.2% |
| Total | 21 | 100.0% |
Transportation & Commute in Sikes
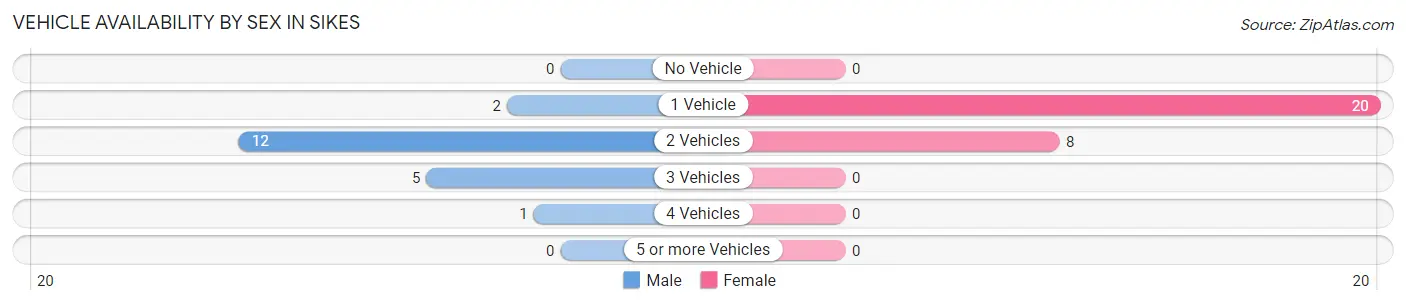
Vehicle Availability by Sex in Sikes
The most prevalent vehicle ownership categories in Sikes are males with 2 vehicles (12, accounting for 60.0%) and females with 2 vehicles (8, making up 42.9%).
| Vehicles Available | Male | Female |
| No Vehicle | 0 (0.0%) | 0 (0.0%) |
| 1 Vehicle | 2 (10.0%) | 20 (71.4%) |
| 2 Vehicles | 12 (60.0%) | 8 (28.6%) |
| 3 Vehicles | 5 (25.0%) | 0 (0.0%) |
| 4 Vehicles | 1 (5.0%) | 0 (0.0%) |
| 5 or more Vehicles | 0 (0.0%) | 0 (0.0%) |
| Total | 20 (100.0%) | 28 (100.0%) |
Commute Time in Sikes
The most frequently occuring commute durations in Sikes are 35 to 39 minutes (20 commuters, 41.7%), 30 to 34 minutes (9 commuters, 18.8%), and 25 to 29 minutes (8 commuters, 16.7%).
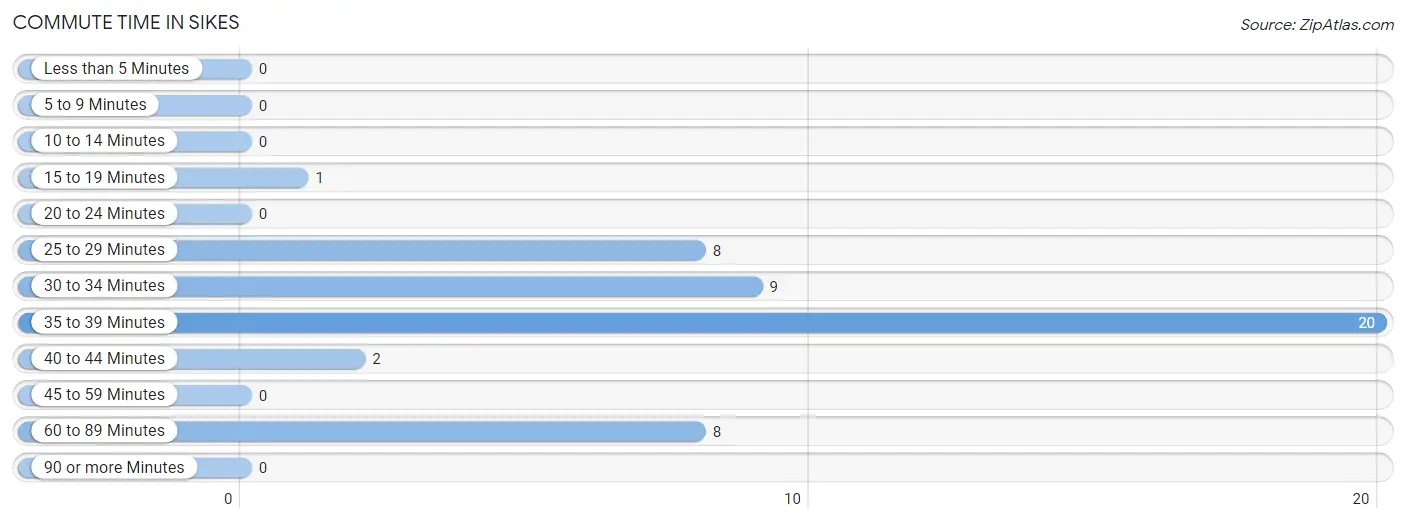
| Commute Time | # Commuters | % Commuters |
| Less than 5 Minutes | 0 | 0.0% |
| 5 to 9 Minutes | 0 | 0.0% |
| 10 to 14 Minutes | 0 | 0.0% |
| 15 to 19 Minutes | 1 | 2.1% |
| 20 to 24 Minutes | 0 | 0.0% |
| 25 to 29 Minutes | 8 | 16.7% |
| 30 to 34 Minutes | 9 | 18.8% |
| 35 to 39 Minutes | 20 | 41.7% |
| 40 to 44 Minutes | 2 | 4.2% |
| 45 to 59 Minutes | 0 | 0.0% |
| 60 to 89 Minutes | 8 | 16.7% |
| 90 or more Minutes | 0 | 0.0% |
Commute Time by Sex in Sikes
The most common commute times in Sikes are 30 to 34 minutes (9 commuters, 45.0%) for males and 35 to 39 minutes (20 commuters, 71.4%) for females.
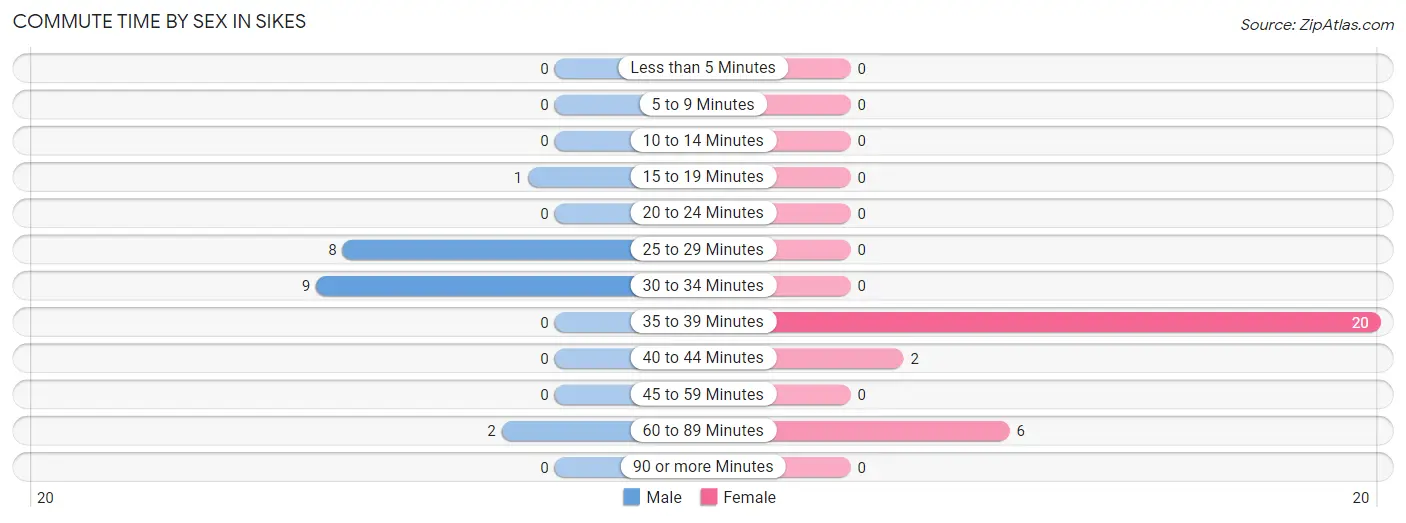
| Commute Time | Male | Female |
| Less than 5 Minutes | 0 (0.0%) | 0 (0.0%) |
| 5 to 9 Minutes | 0 (0.0%) | 0 (0.0%) |
| 10 to 14 Minutes | 0 (0.0%) | 0 (0.0%) |
| 15 to 19 Minutes | 1 (5.0%) | 0 (0.0%) |
| 20 to 24 Minutes | 0 (0.0%) | 0 (0.0%) |
| 25 to 29 Minutes | 8 (40.0%) | 0 (0.0%) |
| 30 to 34 Minutes | 9 (45.0%) | 0 (0.0%) |
| 35 to 39 Minutes | 0 (0.0%) | 20 (71.4%) |
| 40 to 44 Minutes | 0 (0.0%) | 2 (7.1%) |
| 45 to 59 Minutes | 0 (0.0%) | 0 (0.0%) |
| 60 to 89 Minutes | 2 (10.0%) | 6 (21.4%) |
| 90 or more Minutes | 0 (0.0%) | 0 (0.0%) |
Time of Departure to Work by Sex in Sikes
The most frequent times of departure to work in Sikes are 5:30 AM to 5:59 AM (9, 45.0%) for males and 5:00 AM to 5:29 AM (26, 92.9%) for females.
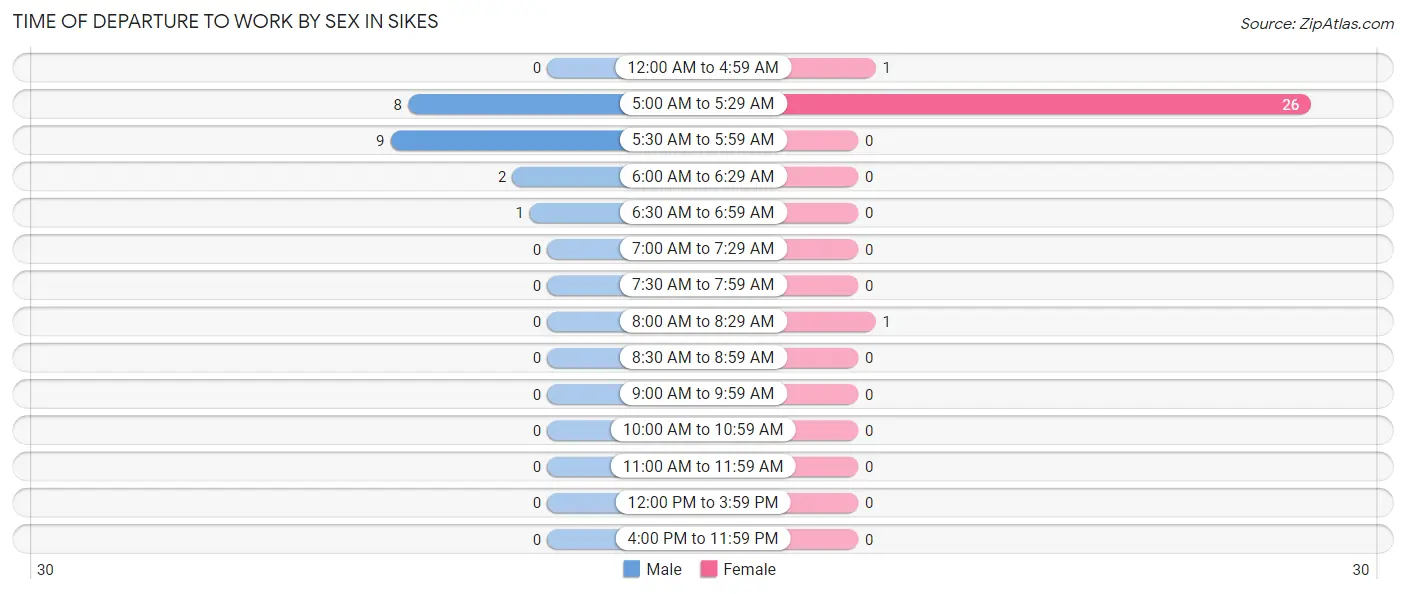
| Time of Departure | Male | Female |
| 12:00 AM to 4:59 AM | 0 (0.0%) | 1 (3.6%) |
| 5:00 AM to 5:29 AM | 8 (40.0%) | 26 (92.9%) |
| 5:30 AM to 5:59 AM | 9 (45.0%) | 0 (0.0%) |
| 6:00 AM to 6:29 AM | 2 (10.0%) | 0 (0.0%) |
| 6:30 AM to 6:59 AM | 1 (5.0%) | 0 (0.0%) |
| 7:00 AM to 7:29 AM | 0 (0.0%) | 0 (0.0%) |
| 7:30 AM to 7:59 AM | 0 (0.0%) | 0 (0.0%) |
| 8:00 AM to 8:29 AM | 0 (0.0%) | 1 (3.6%) |
| 8:30 AM to 8:59 AM | 0 (0.0%) | 0 (0.0%) |
| 9:00 AM to 9:59 AM | 0 (0.0%) | 0 (0.0%) |
| 10:00 AM to 10:59 AM | 0 (0.0%) | 0 (0.0%) |
| 11:00 AM to 11:59 AM | 0 (0.0%) | 0 (0.0%) |
| 12:00 PM to 3:59 PM | 0 (0.0%) | 0 (0.0%) |
| 4:00 PM to 11:59 PM | 0 (0.0%) | 0 (0.0%) |
| Total | 20 (100.0%) | 28 (100.0%) |
Housing Occupancy in Sikes
Occupancy by Ownership in Sikes
Of the total 54 dwellings in Sikes, owner-occupied units account for 48 (88.9%), while renter-occupied units make up 6 (11.1%).
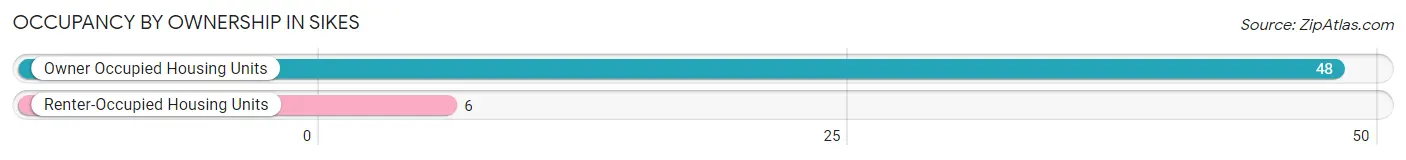
| Occupancy | # Housing Units | % Housing Units |
| Owner Occupied Housing Units | 48 | 88.9% |
| Renter-Occupied Housing Units | 6 | 11.1% |
| Total Occupied Housing Units | 54 | 100.0% |
Occupancy by Household Size in Sikes
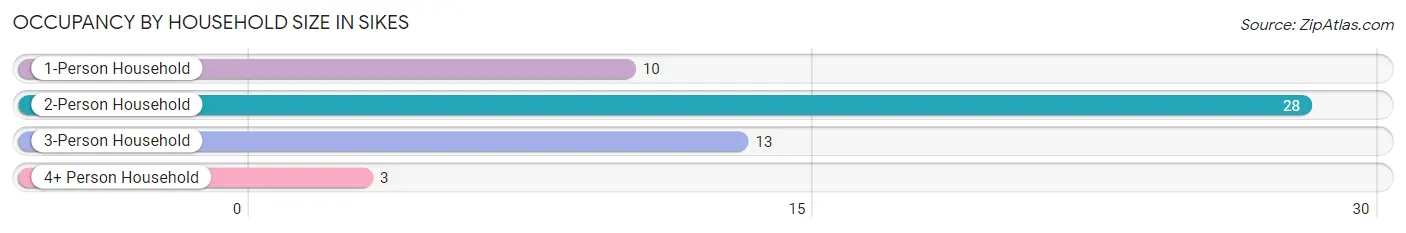
| Household Size | # Housing Units | % Housing Units |
| 1-Person Household | 10 | 18.5% |
| 2-Person Household | 28 | 51.8% |
| 3-Person Household | 13 | 24.1% |
| 4+ Person Household | 3 | 5.6% |
| Total Housing Units | 54 | 100.0% |
Occupancy by Ownership by Household Size in Sikes
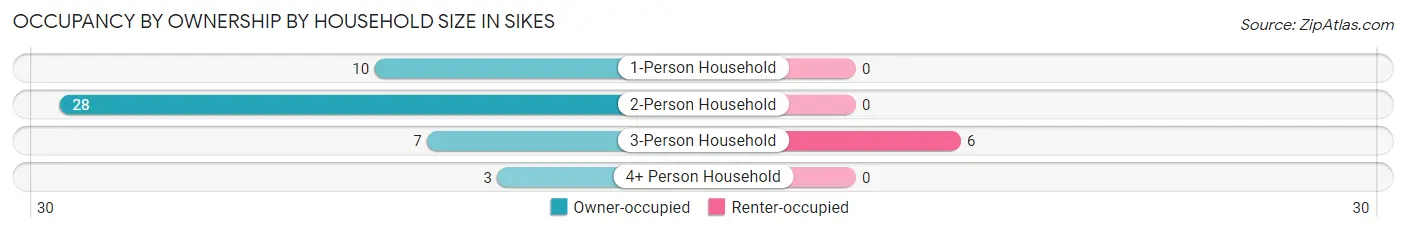
| Household Size | Owner-occupied | Renter-occupied |
| 1-Person Household | 10 (100.0%) | 0 (0.0%) |
| 2-Person Household | 28 (100.0%) | 0 (0.0%) |
| 3-Person Household | 7 (53.8%) | 6 (46.2%) |
| 4+ Person Household | 3 (100.0%) | 0 (0.0%) |
| Total Housing Units | 48 (88.9%) | 6 (11.1%) |
Occupancy by Educational Attainment in Sikes
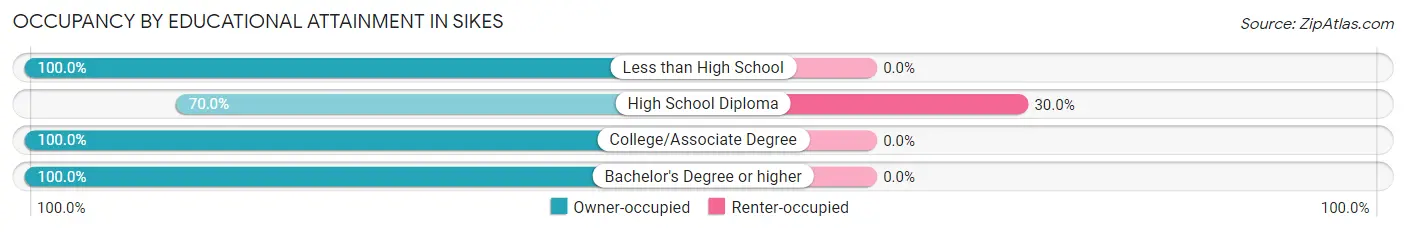
| Household Size | Owner-occupied | Renter-occupied |
| Less than High School | 9 (100.0%) | 0 (0.0%) |
| High School Diploma | 14 (70.0%) | 6 (30.0%) |
| College/Associate Degree | 5 (100.0%) | 0 (0.0%) |
| Bachelor's Degree or higher | 20 (100.0%) | 0 (0.0%) |
Occupancy by Age of Householder in Sikes
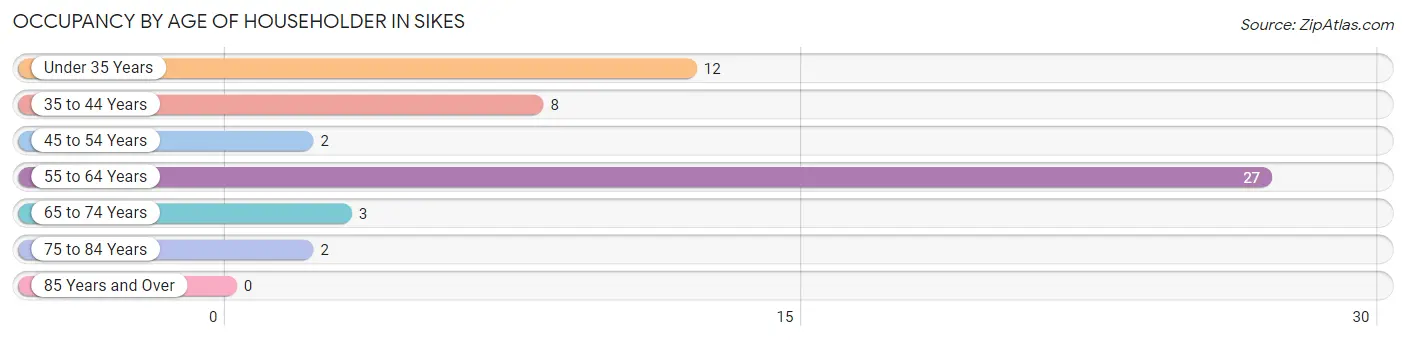
| Age Bracket | # Households | % Households |
| Under 35 Years | 12 | 22.2% |
| 35 to 44 Years | 8 | 14.8% |
| 45 to 54 Years | 2 | 3.7% |
| 55 to 64 Years | 27 | 50.0% |
| 65 to 74 Years | 3 | 5.6% |
| 75 to 84 Years | 2 | 3.7% |
| 85 Years and Over | 0 | 0.0% |
| Total | 54 | 100.0% |
Housing Finances in Sikes
Median Income by Occupancy in Sikes
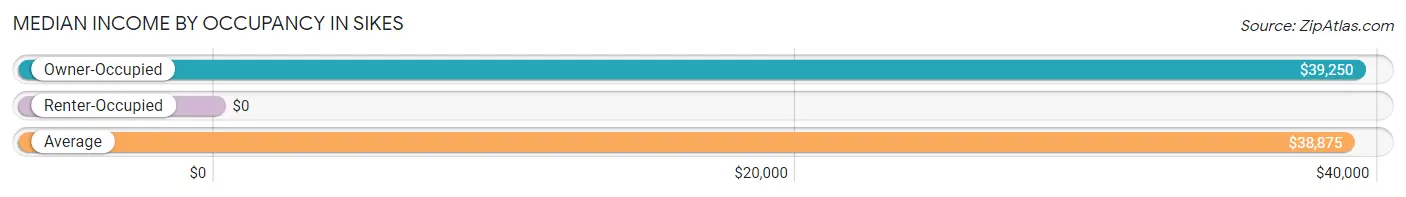
| Occupancy Type | # Households | Median Income |
| Owner-Occupied | 48 (88.9%) | $39,250 |
| Renter-Occupied | 6 (11.1%) | $0 |
| Average | 54 (100.0%) | $38,875 |
Occupancy by Householder Income Bracket in Sikes
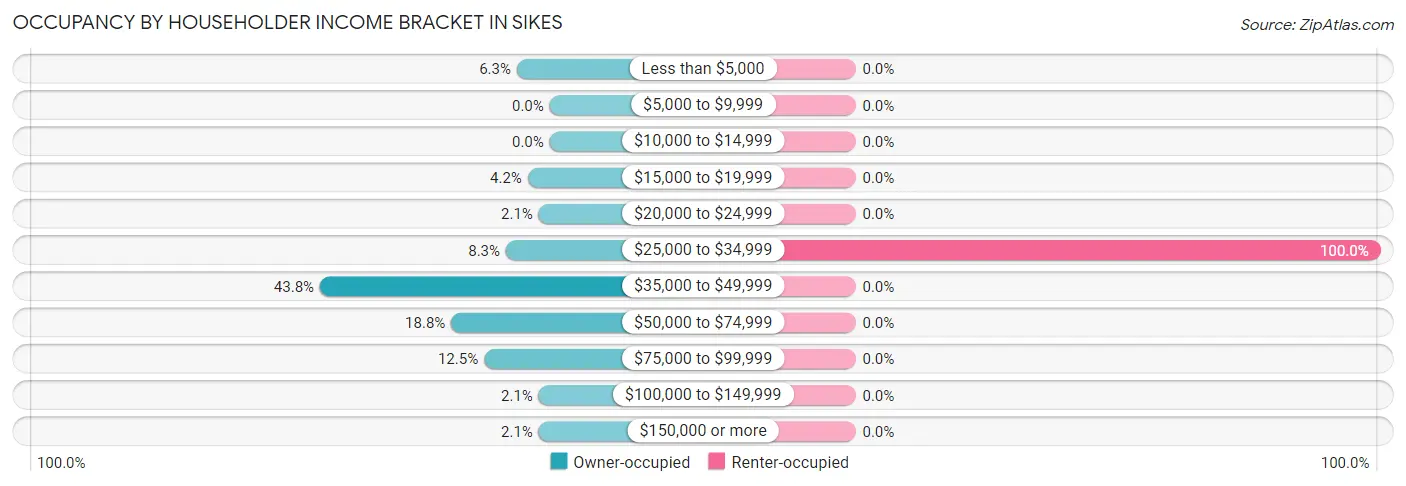
| Income Bracket | Owner-occupied | Renter-occupied |
| Less than $5,000 | 3 (6.2%) | 0 (0.0%) |
| $5,000 to $9,999 | 0 (0.0%) | 0 (0.0%) |
| $10,000 to $14,999 | 0 (0.0%) | 0 (0.0%) |
| $15,000 to $19,999 | 2 (4.2%) | 0 (0.0%) |
| $20,000 to $24,999 | 1 (2.1%) | 0 (0.0%) |
| $25,000 to $34,999 | 4 (8.3%) | 6 (100.0%) |
| $35,000 to $49,999 | 21 (43.8%) | 0 (0.0%) |
| $50,000 to $74,999 | 9 (18.8%) | 0 (0.0%) |
| $75,000 to $99,999 | 6 (12.5%) | 0 (0.0%) |
| $100,000 to $149,999 | 1 (2.1%) | 0 (0.0%) |
| $150,000 or more | 1 (2.1%) | 0 (0.0%) |
| Total | 48 (100.0%) | 6 (100.0%) |
Monthly Housing Cost Tiers in Sikes
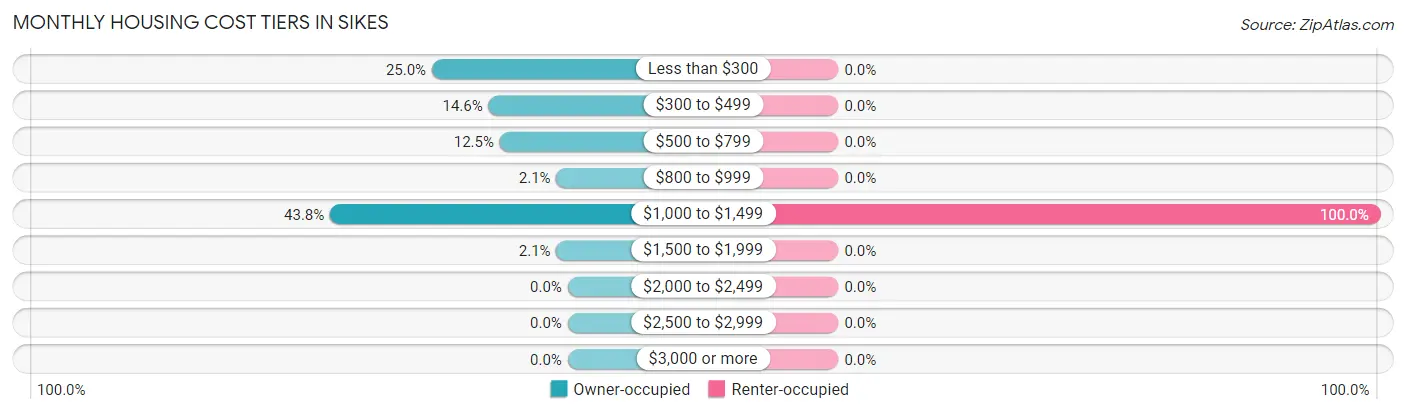
| Monthly Cost | Owner-occupied | Renter-occupied |
| Less than $300 | 12 (25.0%) | 0 (0.0%) |
| $300 to $499 | 7 (14.6%) | 0 (0.0%) |
| $500 to $799 | 6 (12.5%) | 0 (0.0%) |
| $800 to $999 | 1 (2.1%) | 0 (0.0%) |
| $1,000 to $1,499 | 21 (43.8%) | 6 (100.0%) |
| $1,500 to $1,999 | 1 (2.1%) | 0 (0.0%) |
| $2,000 to $2,499 | 0 (0.0%) | 0 (0.0%) |
| $2,500 to $2,999 | 0 (0.0%) | 0 (0.0%) |
| $3,000 or more | 0 (0.0%) | 0 (0.0%) |
| Total | 48 (100.0%) | 6 (100.0%) |
Physical Housing Characteristics in Sikes
Housing Structures in Sikes
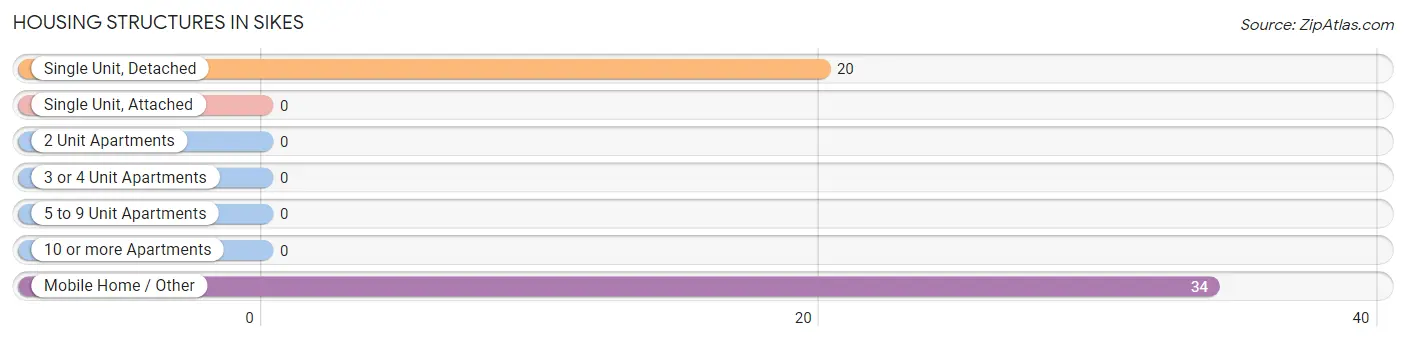
| Structure Type | # Housing Units | % Housing Units |
| Single Unit, Detached | 20 | 37.0% |
| Single Unit, Attached | 0 | 0.0% |
| 2 Unit Apartments | 0 | 0.0% |
| 3 or 4 Unit Apartments | 0 | 0.0% |
| 5 to 9 Unit Apartments | 0 | 0.0% |
| 10 or more Apartments | 0 | 0.0% |
| Mobile Home / Other | 34 | 63.0% |
| Total | 54 | 100.0% |
Housing Structures by Occupancy in Sikes
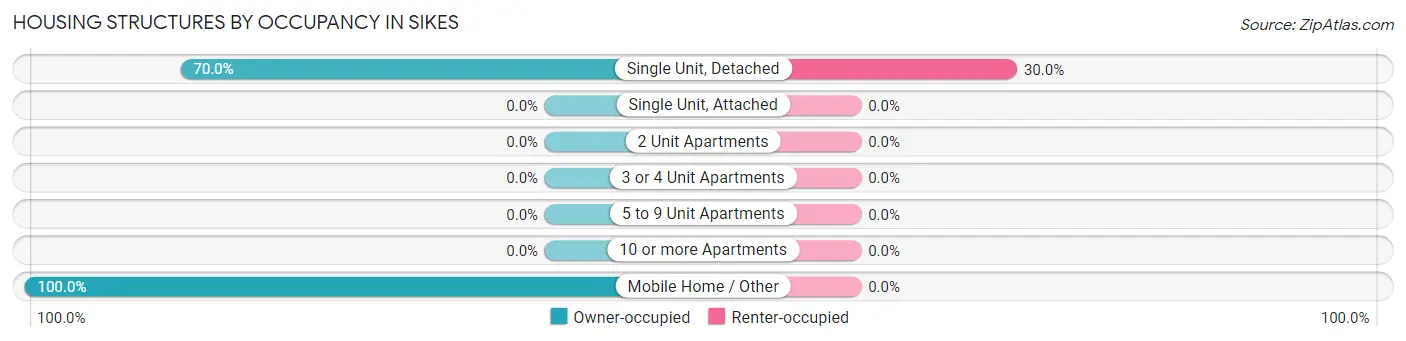
| Structure Type | Owner-occupied | Renter-occupied |
| Single Unit, Detached | 14 (70.0%) | 6 (30.0%) |
| Single Unit, Attached | 0 (0.0%) | 0 (0.0%) |
| 2 Unit Apartments | 0 (0.0%) | 0 (0.0%) |
| 3 or 4 Unit Apartments | 0 (0.0%) | 0 (0.0%) |
| 5 to 9 Unit Apartments | 0 (0.0%) | 0 (0.0%) |
| 10 or more Apartments | 0 (0.0%) | 0 (0.0%) |
| Mobile Home / Other | 34 (100.0%) | 0 (0.0%) |
| Total | 48 (88.9%) | 6 (11.1%) |
Housing Structures by Number of Rooms in Sikes
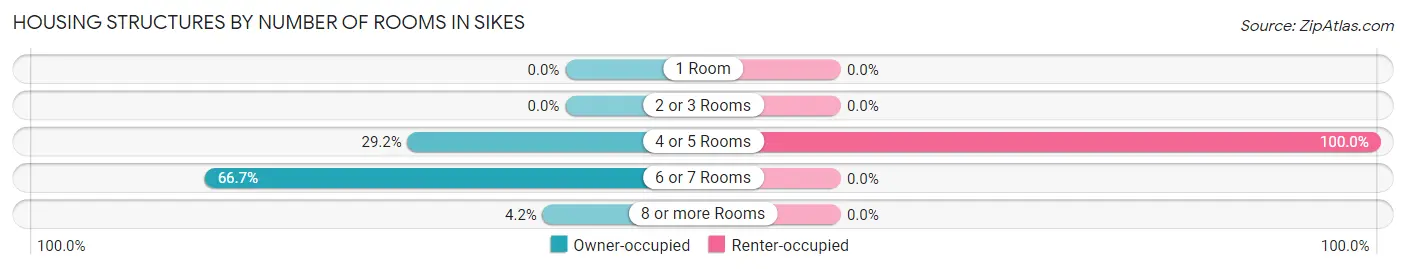
| Number of Rooms | Owner-occupied | Renter-occupied |
| 1 Room | 0 (0.0%) | 0 (0.0%) |
| 2 or 3 Rooms | 0 (0.0%) | 0 (0.0%) |
| 4 or 5 Rooms | 14 (29.2%) | 6 (100.0%) |
| 6 or 7 Rooms | 32 (66.7%) | 0 (0.0%) |
| 8 or more Rooms | 2 (4.2%) | 0 (0.0%) |
| Total | 48 (100.0%) | 6 (100.0%) |
Housing Structure by Heating Type in Sikes
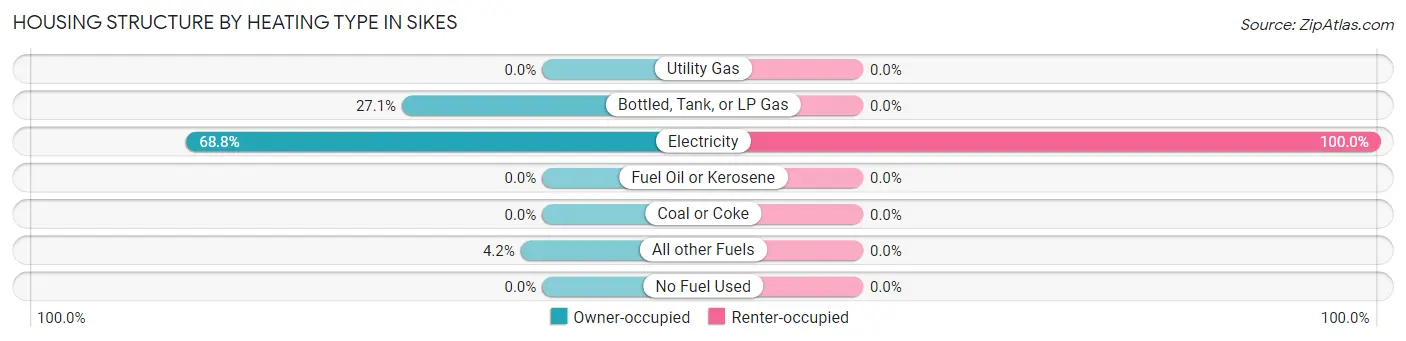
| Heating Type | Owner-occupied | Renter-occupied |
| Utility Gas | 0 (0.0%) | 0 (0.0%) |
| Bottled, Tank, or LP Gas | 13 (27.1%) | 0 (0.0%) |
| Electricity | 33 (68.8%) | 6 (100.0%) |
| Fuel Oil or Kerosene | 0 (0.0%) | 0 (0.0%) |
| Coal or Coke | 0 (0.0%) | 0 (0.0%) |
| All other Fuels | 2 (4.2%) | 0 (0.0%) |
| No Fuel Used | 0 (0.0%) | 0 (0.0%) |
| Total | 48 (100.0%) | 6 (100.0%) |
Household Vehicle Usage in Sikes
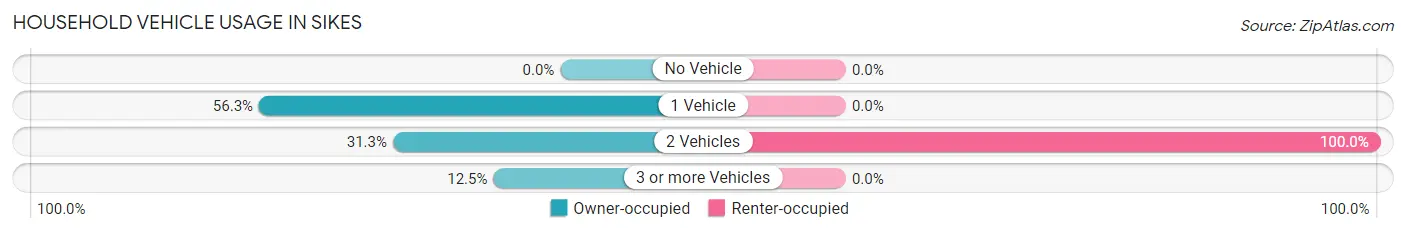
| Vehicles per Household | Owner-occupied | Renter-occupied |
| No Vehicle | 0 (0.0%) | 0 (0.0%) |
| 1 Vehicle | 27 (56.2%) | 0 (0.0%) |
| 2 Vehicles | 15 (31.2%) | 6 (100.0%) |
| 3 or more Vehicles | 6 (12.5%) | 0 (0.0%) |
| Total | 48 (100.0%) | 6 (100.0%) |
Real Estate & Mortgages in Sikes
Real Estate and Mortgage Overview in Sikes
| Characteristic | Without Mortgage | With Mortgage |
| Housing Units | 25 | 23 |
| Median Property Value | - | - |
| Median Household Income | $53,750 | $1 |
| Monthly Housing Costs | $363 | $0 |
| Real Estate Taxes | $199 | $20 |
Property Value by Mortgage Status in Sikes
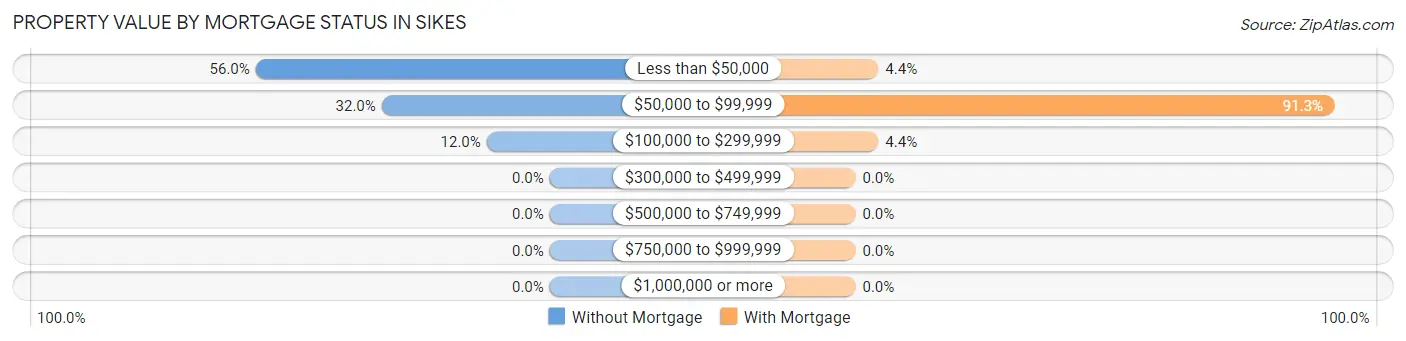
| Property Value | Without Mortgage | With Mortgage |
| Less than $50,000 | 14 (56.0%) | 1 (4.3%) |
| $50,000 to $99,999 | 8 (32.0%) | 21 (91.3%) |
| $100,000 to $299,999 | 3 (12.0%) | 1 (4.3%) |
| $300,000 to $499,999 | 0 (0.0%) | 0 (0.0%) |
| $500,000 to $749,999 | 0 (0.0%) | 0 (0.0%) |
| $750,000 to $999,999 | 0 (0.0%) | 0 (0.0%) |
| $1,000,000 or more | 0 (0.0%) | 0 (0.0%) |
| Total | 25 (100.0%) | 23 (100.0%) |
Household Income by Mortgage Status in Sikes
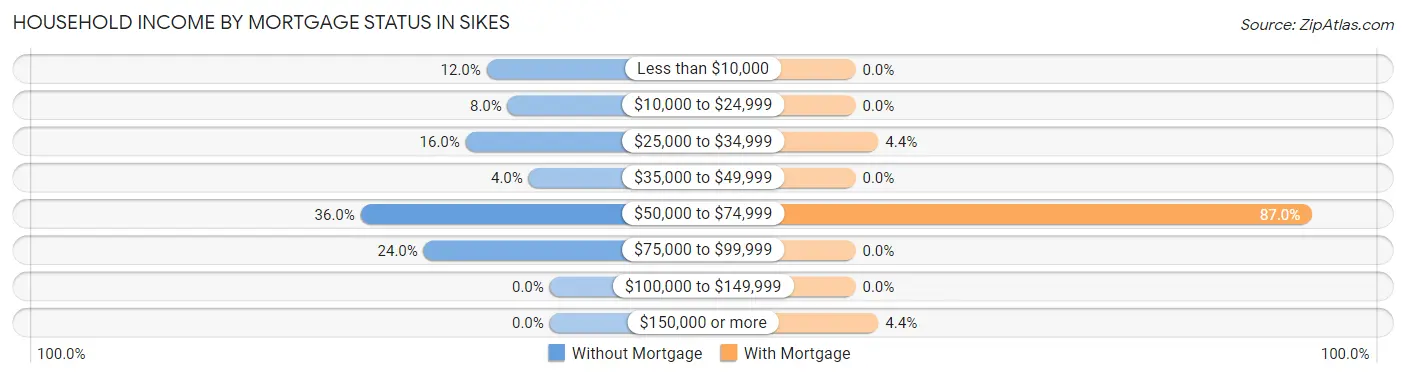
| Household Income | Without Mortgage | With Mortgage |
| Less than $10,000 | 3 (12.0%) | 0 (0.0%) |
| $10,000 to $24,999 | 2 (8.0%) | 0 (0.0%) |
| $25,000 to $34,999 | 4 (16.0%) | 1 (4.3%) |
| $35,000 to $49,999 | 1 (4.0%) | 0 (0.0%) |
| $50,000 to $74,999 | 9 (36.0%) | 20 (87.0%) |
| $75,000 to $99,999 | 6 (24.0%) | 0 (0.0%) |
| $100,000 to $149,999 | 0 (0.0%) | 0 (0.0%) |
| $150,000 or more | 0 (0.0%) | 1 (4.3%) |
| Total | 25 (100.0%) | 23 (100.0%) |
Property Value to Household Income Ratio in Sikes
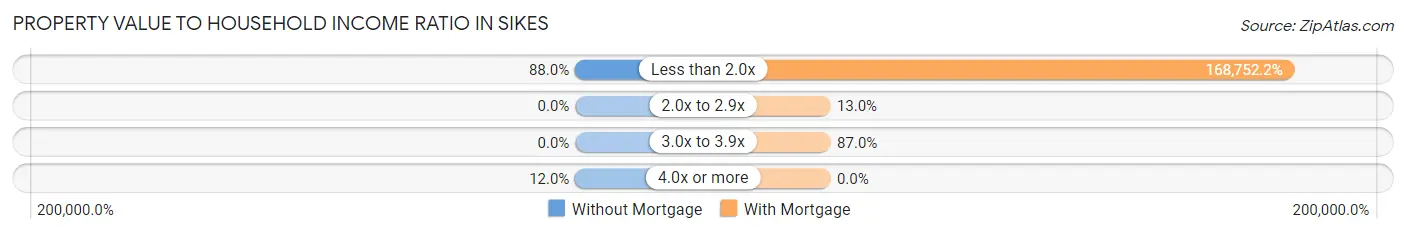
| Value-to-Income Ratio | Without Mortgage | With Mortgage |
| Less than 2.0x | 22 (88.0%) | 38,813 (168,752.2%) |
| 2.0x to 2.9x | 0 (0.0%) | 3 (13.0%) |
| 3.0x to 3.9x | 0 (0.0%) | 20 (87.0%) |
| 4.0x or more | 3 (12.0%) | 0 (0.0%) |
| Total | 25 (100.0%) | 23 (100.0%) |
Real Estate Taxes by Mortgage Status in Sikes
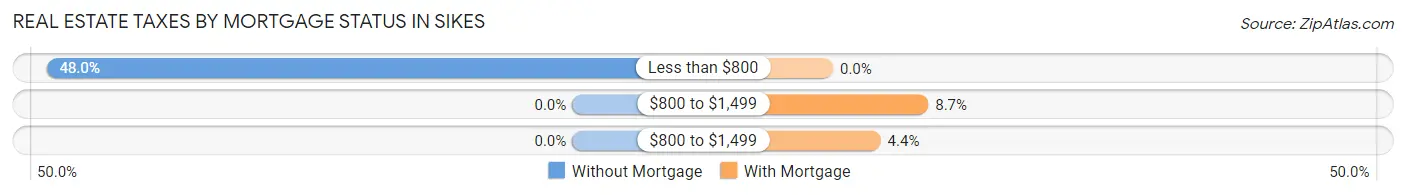
| Property Taxes | Without Mortgage | With Mortgage |
| Less than $800 | 12 (48.0%) | 0 (0.0%) |
| $800 to $1,499 | 0 (0.0%) | 2 (8.7%) |
| $800 to $1,499 | 0 (0.0%) | 1 (4.3%) |
| Total | 25 (100.0%) | 23 (100.0%) |
Health & Disability in Sikes
Health Insurance Coverage by Age in Sikes
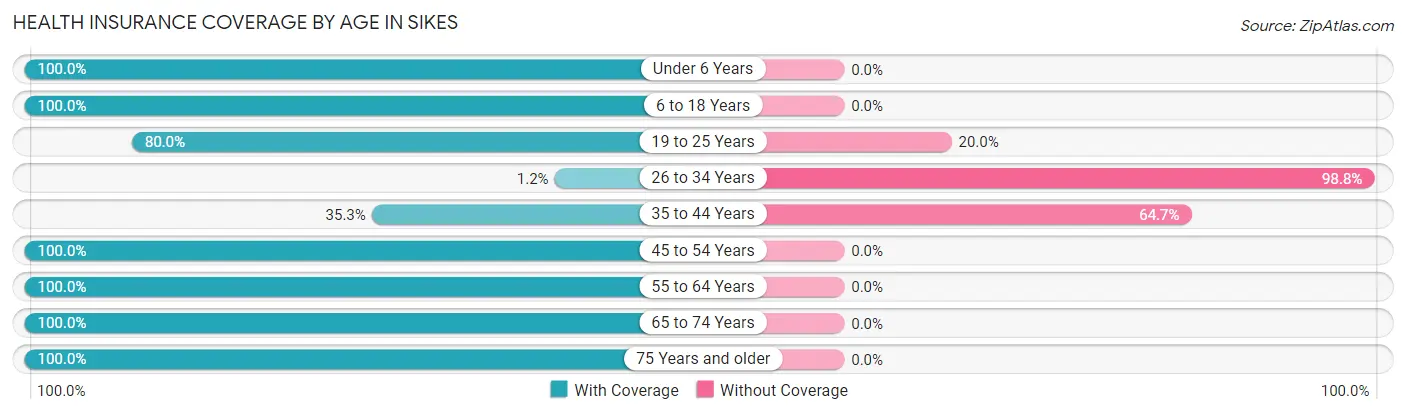
| Age Bracket | With Coverage | Without Coverage |
| Under 6 Years | 21 (100.0%) | 0 (0.0%) |
| 6 to 18 Years | 8 (100.0%) | 0 (0.0%) |
| 19 to 25 Years | 12 (80.0%) | 3 (20.0%) |
| 26 to 34 Years | 2 (1.2%) | 164 (98.8%) |
| 35 to 44 Years | 6 (35.3%) | 11 (64.7%) |
| 45 to 54 Years | 3 (100.0%) | 0 (0.0%) |
| 55 to 64 Years | 31 (100.0%) | 0 (0.0%) |
| 65 to 74 Years | 4 (100.0%) | 0 (0.0%) |
| 75 Years and older | 3 (100.0%) | 0 (0.0%) |
| Total | 90 (33.6%) | 178 (66.4%) |
Health Insurance Coverage by Citizenship Status in Sikes
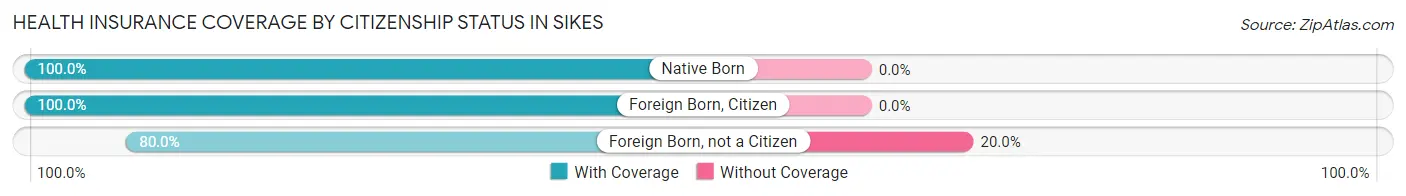
| Citizenship Status | With Coverage | Without Coverage |
| Native Born | 21 (100.0%) | 0 (0.0%) |
| Foreign Born, Citizen | 8 (100.0%) | 0 (0.0%) |
| Foreign Born, not a Citizen | 12 (80.0%) | 3 (20.0%) |
Health Insurance Coverage by Household Income in Sikes
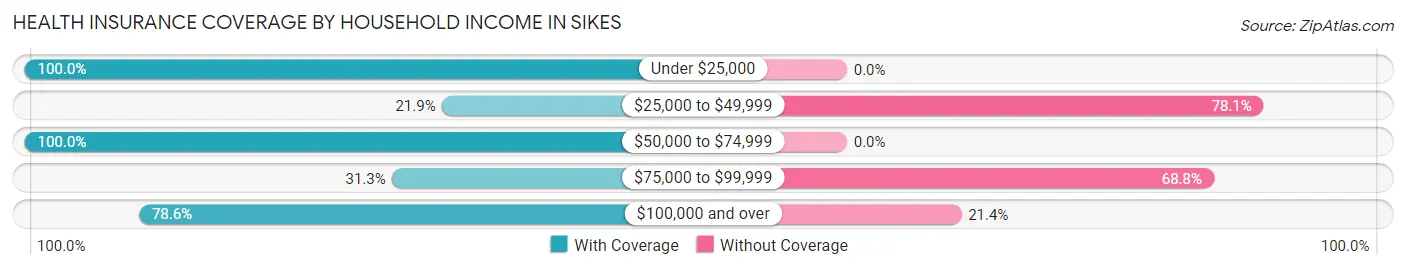
| Household Income | With Coverage | Without Coverage |
| Under $25,000 | 10 (100.0%) | 0 (0.0%) |
| $25,000 to $49,999 | 46 (21.9%) | 164 (78.1%) |
| $50,000 to $74,999 | 18 (100.0%) | 0 (0.0%) |
| $75,000 to $99,999 | 5 (31.2%) | 11 (68.8%) |
| $100,000 and over | 11 (78.6%) | 3 (21.4%) |
Public vs Private Health Insurance Coverage by Age in Sikes
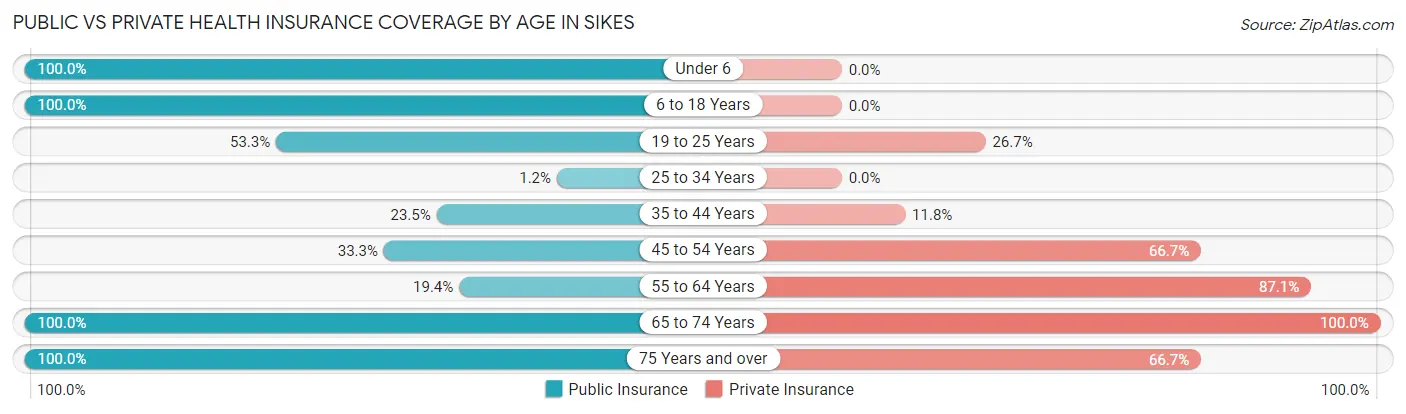
| Age Bracket | Public Insurance | Private Insurance |
| Under 6 | 21 (100.0%) | 0 (0.0%) |
| 6 to 18 Years | 8 (100.0%) | 0 (0.0%) |
| 19 to 25 Years | 8 (53.3%) | 4 (26.7%) |
| 25 to 34 Years | 2 (1.2%) | 0 (0.0%) |
| 35 to 44 Years | 4 (23.5%) | 2 (11.8%) |
| 45 to 54 Years | 1 (33.3%) | 2 (66.7%) |
| 55 to 64 Years | 6 (19.4%) | 27 (87.1%) |
| 65 to 74 Years | 4 (100.0%) | 4 (100.0%) |
| 75 Years and over | 3 (100.0%) | 2 (66.7%) |
| Total | 57 (21.3%) | 41 (15.3%) |
Disability Status by Sex by Age in Sikes
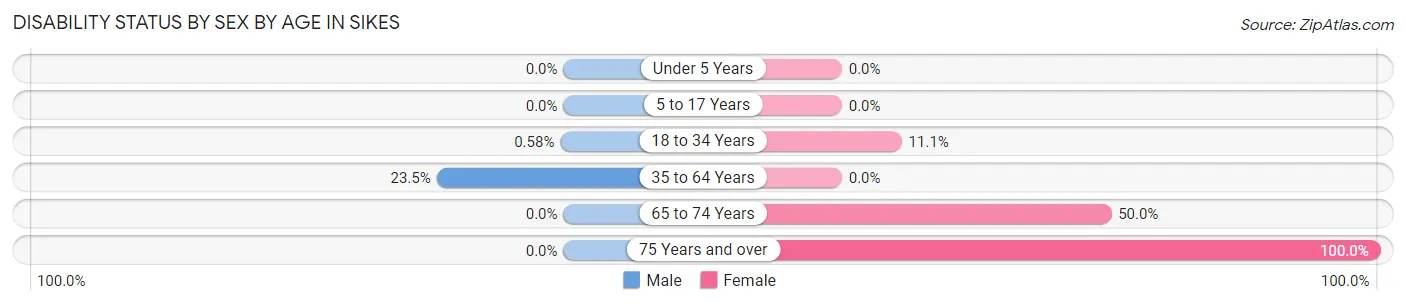
| Age Bracket | Male | Female |
| Under 5 Years | 0 (0.0%) | 0 (0.0%) |
| 5 to 17 Years | 0 (0.0%) | 0 (0.0%) |
| 18 to 34 Years | 1 (0.6%) | 1 (11.1%) |
| 35 to 64 Years | 4 (23.5%) | 0 (0.0%) |
| 65 to 74 Years | 0 (0.0%) | 1 (50.0%) |
| 75 Years and over | 0 (0.0%) | 2 (100.0%) |
Disability Class by Sex by Age in Sikes
Disability Class: Hearing Difficulty
| Age Bracket | Male | Female |
| Under 5 Years | 0 (0.0%) | 0 (0.0%) |
| 5 to 17 Years | 0 (0.0%) | 0 (0.0%) |
| 18 to 34 Years | 0 (0.0%) | 0 (0.0%) |
| 35 to 64 Years | 0 (0.0%) | 0 (0.0%) |
| 65 to 74 Years | 0 (0.0%) | 0 (0.0%) |
| 75 Years and over | 0 (0.0%) | 0 (0.0%) |
Disability Class: Vision Difficulty
| Age Bracket | Male | Female |
| Under 5 Years | 0 (0.0%) | 0 (0.0%) |
| 5 to 17 Years | 0 (0.0%) | 0 (0.0%) |
| 18 to 34 Years | 0 (0.0%) | 0 (0.0%) |
| 35 to 64 Years | 0 (0.0%) | 0 (0.0%) |
| 65 to 74 Years | 0 (0.0%) | 0 (0.0%) |
| 75 Years and over | 0 (0.0%) | 0 (0.0%) |
Disability Class: Cognitive Difficulty
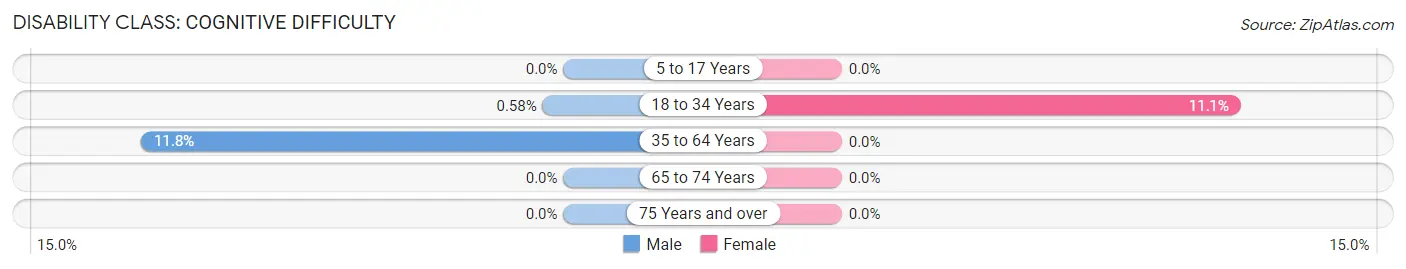
| Age Bracket | Male | Female |
| 5 to 17 Years | 0 (0.0%) | 0 (0.0%) |
| 18 to 34 Years | 1 (0.6%) | 1 (11.1%) |
| 35 to 64 Years | 2 (11.8%) | 0 (0.0%) |
| 65 to 74 Years | 0 (0.0%) | 0 (0.0%) |
| 75 Years and over | 0 (0.0%) | 0 (0.0%) |
Disability Class: Ambulatory Difficulty
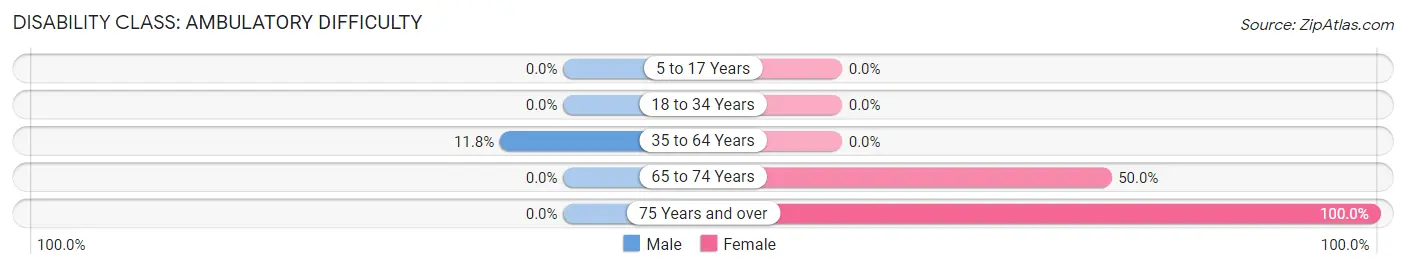
| Age Bracket | Male | Female |
| 5 to 17 Years | 0 (0.0%) | 0 (0.0%) |
| 18 to 34 Years | 0 (0.0%) | 0 (0.0%) |
| 35 to 64 Years | 2 (11.8%) | 0 (0.0%) |
| 65 to 74 Years | 0 (0.0%) | 1 (50.0%) |
| 75 Years and over | 0 (0.0%) | 2 (100.0%) |
Disability Class: Self-Care Difficulty
| Age Bracket | Male | Female |
| 5 to 17 Years | 0 (0.0%) | 0 (0.0%) |
| 18 to 34 Years | 0 (0.0%) | 0 (0.0%) |
| 35 to 64 Years | 0 (0.0%) | 0 (0.0%) |
| 65 to 74 Years | 0 (0.0%) | 0 (0.0%) |
| 75 Years and over | 0 (0.0%) | 0 (0.0%) |
Technology Access in Sikes
Computing Device Access in Sikes
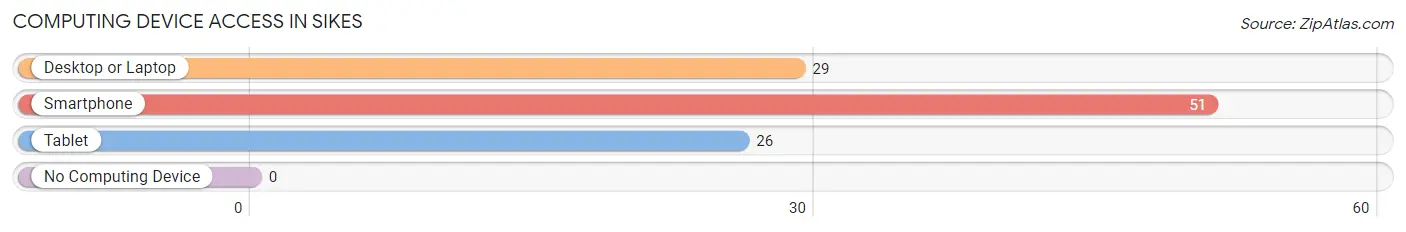
| Device Type | # Households | % Households |
| Desktop or Laptop | 29 | 53.7% |
| Smartphone | 51 | 94.4% |
| Tablet | 26 | 48.1% |
| No Computing Device | 0 | 0.0% |
| Total | 54 | 100.0% |
Internet Access in Sikes
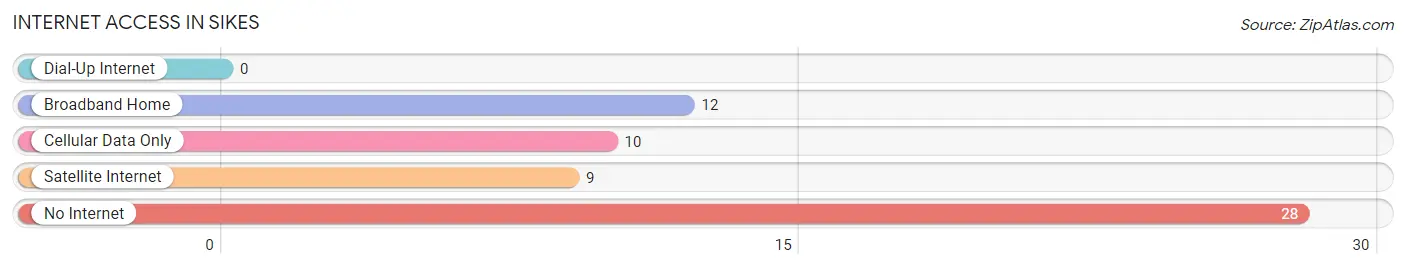
| Internet Type | # Households | % Households |
| Dial-Up Internet | 0 | 0.0% |
| Broadband Home | 12 | 22.2% |
| Cellular Data Only | 10 | 18.5% |
| Satellite Internet | 9 | 16.7% |
| No Internet | 28 | 51.8% |
| Total | 54 | 100.0% |
Sikes Summary
Sikes is a small town located in the northern part of Louisiana, in the United States. It is situated in the parish of Winn, and is part of the Ruston Metropolitan Statistical Area. The town has a population of just over 500 people, and is known for its rural charm and friendly atmosphere.
History
Sikes was founded in 1883 by a group of settlers from the nearby town of Winnfield. The town was named after the Sikes family, who were among the first settlers. The town was originally a farming community, and the main crops grown were cotton, corn, and sweet potatoes. In the early 1900s, the town began to grow and develop, and by the 1920s, it had become a thriving community.
In the 1950s, Sikes began to experience a decline in population, as many of the town’s residents moved away in search of better opportunities. However, in the late 1970s, the town began to experience a resurgence, as new businesses and industries began to move into the area. Today, Sikes is a small but vibrant community, with a variety of businesses and services.
Geography
Sikes is located in the northern part of Louisiana, in the parish of Winn. It is situated in the Ruston Metropolitan Statistical Area, and is approximately 30 miles from the city of Ruston. The town is situated on the banks of the Red River, and is surrounded by rolling hills and forests. The climate in Sikes is humid subtropical, with hot summers and mild winters.
Economy
The economy of Sikes is largely based on agriculture and forestry. The town is home to several farms, which produce a variety of crops, including cotton, corn, and sweet potatoes. The town also has a number of timber companies, which harvest and process timber for use in construction and other industries. In addition, Sikes is home to a number of small businesses, including restaurants, retail stores, and service providers.
Demographics
As of the 2010 census, the population of Sikes was 514 people. The racial makeup of the town was 94.3% White, 3.3% African American, 0.2% Native American, 0.4% Asian, and 1.8% from other races. The median household income in Sikes was $31,250, and the median age was 38.7 years. The town has a high rate of poverty, with 28.3% of the population living below the poverty line.
Sikes is a small but vibrant town, with a rich history and a friendly atmosphere. The town is home to a variety of businesses and services, and is a great place to live and work. With its rural charm and friendly atmosphere, Sikes is a great place to call home.
Common Questions
What is Per Capita Income in Sikes?
Per Capita income in Sikes is $9,223.
What is the Median Family Income in Sikes?
Median Family Income in Sikes is $38,875.
What is the Median Household income in Sikes?
Median Household Income in Sikes is $38,875.
What is Income or Wage Gap in Sikes?
Income or Wage Gap in Sikes is 56.6%.
Women in Sikes earn 43.4 cents for every dollar earned by a man.
What is Inequality or Gini Index in Sikes?
Inequality or Gini Index in Sikes is 0.29.
What is the Total Population of Sikes?
Total Population of Sikes is 268.
What is the Total Male Population of Sikes?
Total Male Population of Sikes is 200.
What is the Total Female Population of Sikes?
Total Female Population of Sikes is 68.
What is the Ratio of Males per 100 Females in Sikes?
There are 294.12 Males per 100 Females in Sikes.
What is the Ratio of Females per 100 Males in Sikes?
There are 34.00 Females per 100 Males in Sikes.
What is the Median Population Age in Sikes?
Median Population Age in Sikes is 27.5 Years.
What is the Average Family Size in Sikes
Average Family Size in Sikes is 5.9 People.
What is the Average Household Size in Sikes
Average Household Size in Sikes is 5.0 People.
How Large is the Labor Force in Sikes?
There are 50 People in the Labor Forcein in Sikes.
What is the Percentage of People in the Labor Force in Sikes?
20.5% of People are in the Labor Force in Sikes.