Dixie Inn, LA Map & Demographics
Dixie Inn Map
Dixie Inn Overview
$10,668
PER CAPITA INCOME
$14,519
AVG FAMILY INCOME
$22,083
AVG HOUSEHOLD INCOME
36.4%
WAGE / INCOME GAP [ % ]
63.6¢/ $1
WAGE / INCOME GAP [ $ ]
0.37
INEQUALITY / GINI INDEX
265
TOTAL POPULATION
130
MALE POPULATION
135
FEMALE POPULATION
96.30
MALES / 100 FEMALES
103.85
FEMALES / 100 MALES
28.1
MEDIAN AGE
2.9
AVG FAMILY SIZE
2.4
AVG HOUSEHOLD SIZE
96
LABOR FORCE [ PEOPLE ]
55.8%
PERCENT IN LABOR FORCE
9.4%
UNEMPLOYMENT RATE
Dixie Inn Area Codes
Income in Dixie Inn
Income Overview in Dixie Inn
Per Capita Income in Dixie Inn is $10,668, while median incomes of families and households are $14,519 and $22,083 respectively.
| Characteristic | Number | Measure |
| Per Capita Income | 265 | $10,668 |
| Median Family Income | 67 | $14,519 |
| Mean Family Income | 67 | $20,879 |
| Median Household Income | 111 | $22,083 |
| Mean Household Income | 111 | $25,601 |
| Income Deficit | 67 | $0 |
| Wage / Income Gap (%) | 265 | 36.36% |
| Wage / Income Gap ($) | 265 | 63.64¢ per $1 |
| Gini / Inequality Index | 265 | 0.37 |
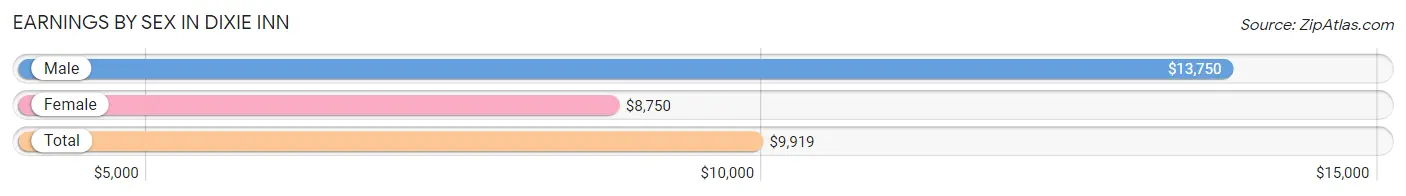
Earnings by Sex in Dixie Inn
Average Earnings in Dixie Inn are $9,919, $13,750 for men and $8,750 for women, a difference of 36.4%.
| Sex | Number | Average Earnings |
| Male | 38 (35.8%) | $13,750 |
| Female | 68 (64.1%) | $8,750 |
| Total | 106 (100.0%) | $9,919 |
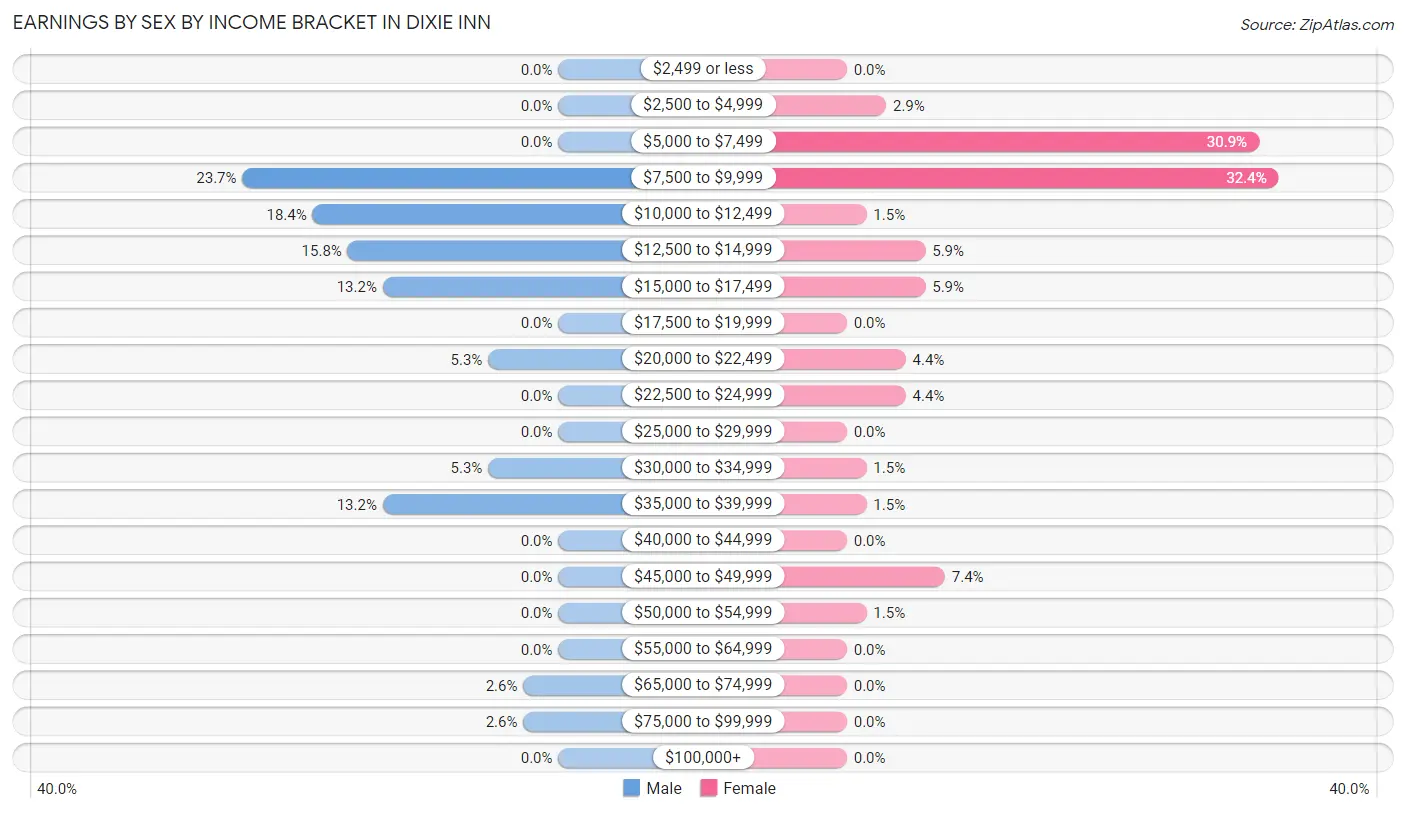
Earnings by Sex by Income Bracket in Dixie Inn
The most common earnings brackets in Dixie Inn are $7,500 to $9,999 for men (9 | 23.7%) and $7,500 to $9,999 for women (22 | 32.4%).
| Income | Male | Female |
| $2,499 or less | 0 (0.0%) | 0 (0.0%) |
| $2,500 to $4,999 | 0 (0.0%) | 2 (2.9%) |
| $5,000 to $7,499 | 0 (0.0%) | 21 (30.9%) |
| $7,500 to $9,999 | 9 (23.7%) | 22 (32.4%) |
| $10,000 to $12,499 | 7 (18.4%) | 1 (1.5%) |
| $12,500 to $14,999 | 6 (15.8%) | 4 (5.9%) |
| $15,000 to $17,499 | 5 (13.2%) | 4 (5.9%) |
| $17,500 to $19,999 | 0 (0.0%) | 0 (0.0%) |
| $20,000 to $22,499 | 2 (5.3%) | 3 (4.4%) |
| $22,500 to $24,999 | 0 (0.0%) | 3 (4.4%) |
| $25,000 to $29,999 | 0 (0.0%) | 0 (0.0%) |
| $30,000 to $34,999 | 2 (5.3%) | 1 (1.5%) |
| $35,000 to $39,999 | 5 (13.2%) | 1 (1.5%) |
| $40,000 to $44,999 | 0 (0.0%) | 0 (0.0%) |
| $45,000 to $49,999 | 0 (0.0%) | 5 (7.3%) |
| $50,000 to $54,999 | 0 (0.0%) | 1 (1.5%) |
| $55,000 to $64,999 | 0 (0.0%) | 0 (0.0%) |
| $65,000 to $74,999 | 1 (2.6%) | 0 (0.0%) |
| $75,000 to $99,999 | 1 (2.6%) | 0 (0.0%) |
| $100,000+ | 0 (0.0%) | 0 (0.0%) |
| Total | 38 (100.0%) | 68 (100.0%) |
Earnings by Sex by Educational Attainment in Dixie Inn
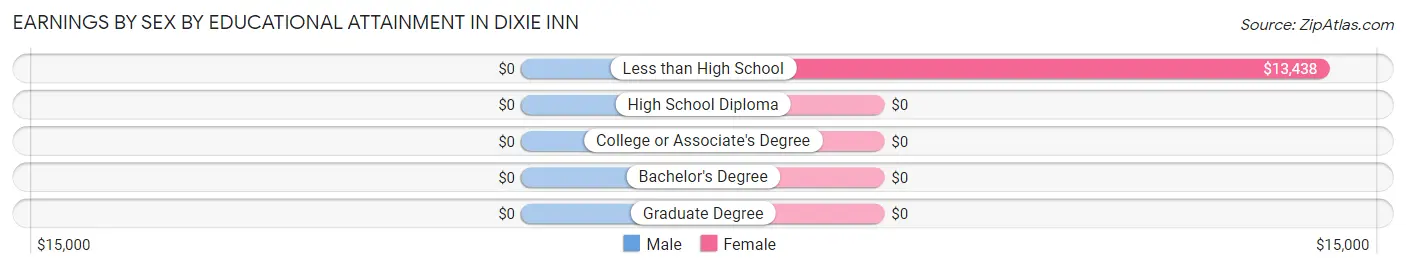
| Educational Attainment | Male Income | Female Income |
| Less than High School | - | - |
| High School Diploma | - | - |
| College or Associate's Degree | - | - |
| Bachelor's Degree | - | - |
| Graduate Degree | - | - |
| Total | $14,583 | $9,432 |
Family Income in Dixie Inn
Family Income Brackets in Dixie Inn
According to the Dixie Inn family income data, there are 19 families falling into the less than $10,000 income range, which is the most common income bracket and makes up 28.4% of all families.
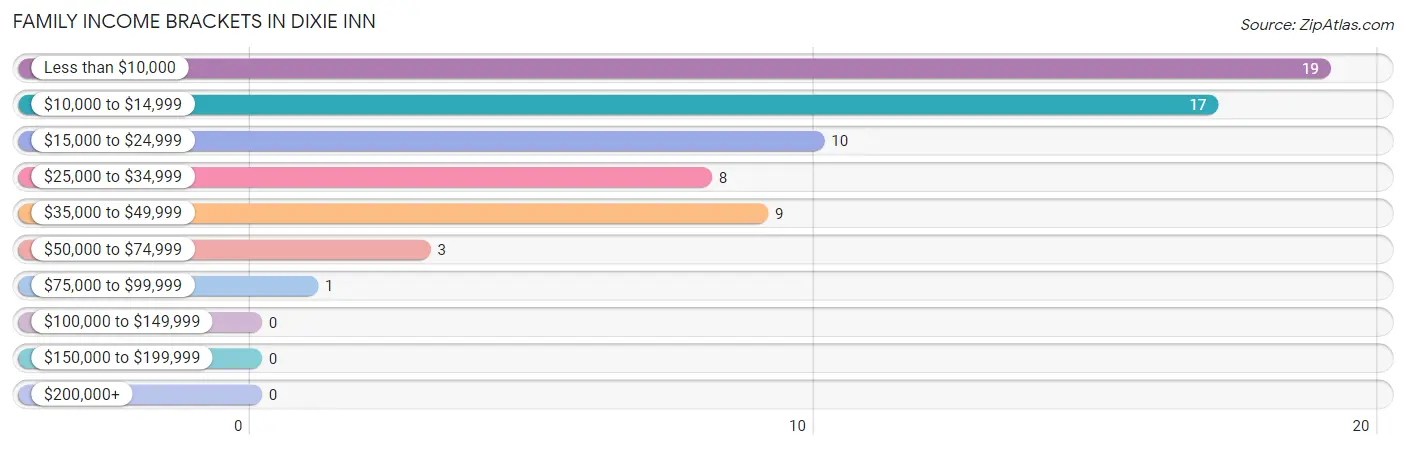
| Income Bracket | # Families | % Families |
| Less than $10,000 | 19 | 28.4% |
| $10,000 to $14,999 | 17 | 25.4% |
| $15,000 to $24,999 | 10 | 14.9% |
| $25,000 to $34,999 | 8 | 11.9% |
| $35,000 to $49,999 | 9 | 13.4% |
| $50,000 to $74,999 | 3 | 4.5% |
| $75,000 to $99,999 | 1 | 1.5% |
| $100,000 to $149,999 | 0 | 0.0% |
| $150,000 to $199,999 | 0 | 0.0% |
| $200,000+ | 0 | 0.0% |
Family Income by Famaliy Size in Dixie Inn
4-person families (17 | 25.4%) account for the highest median family income in Dixie Inn with $25,313 per family, while 2-person families (28 | 41.8%) have the highest median income of $6,634 per family member.
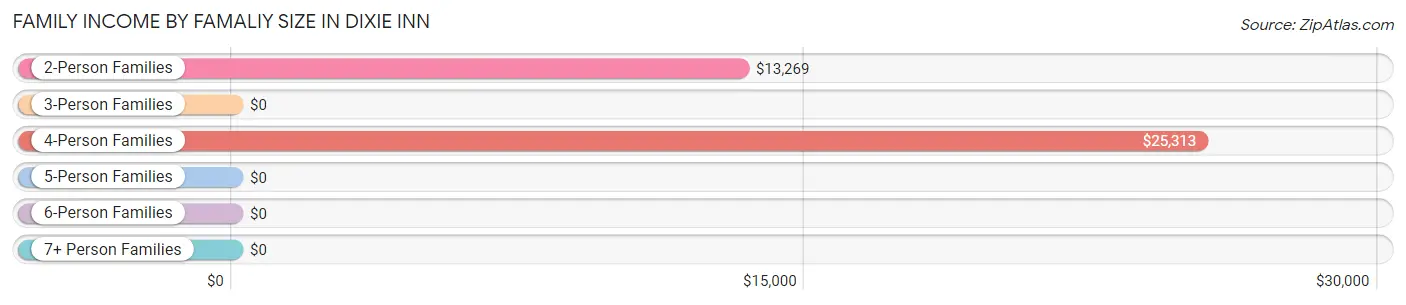
| Income Bracket | # Families | Median Income |
| 2-Person Families | 28 (41.8%) | $13,269 |
| 3-Person Families | 18 (26.9%) | $0 |
| 4-Person Families | 17 (25.4%) | $25,313 |
| 5-Person Families | 0 (0.0%) | $0 |
| 6-Person Families | 4 (6.0%) | $0 |
| 7+ Person Families | 0 (0.0%) | $0 |
| Total | 67 (100.0%) | $14,519 |
Family Income by Number of Earners in Dixie Inn
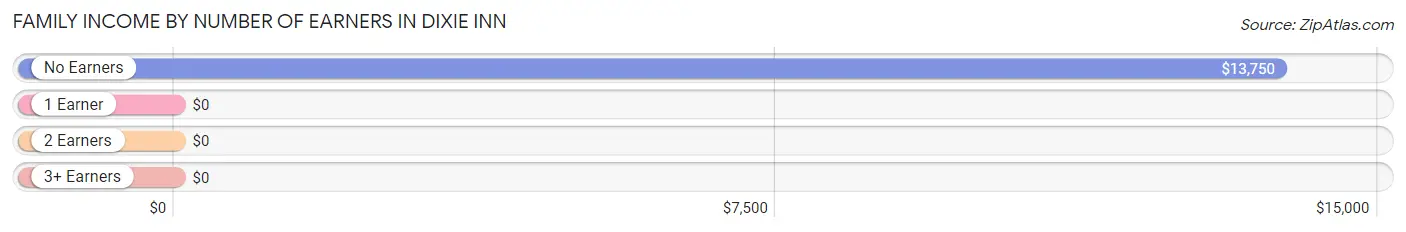
| Number of Earners | # Families | Median Income |
| No Earners | 21 (31.3%) | $13,750 |
| 1 Earner | 36 (53.7%) | $0 |
| 2 Earners | 10 (14.9%) | $0 |
| 3+ Earners | 0 (0.0%) | $0 |
| Total | 67 (100.0%) | $14,519 |
Household Income in Dixie Inn
Household Income Brackets in Dixie Inn
With 38 households falling in the category, the $15,000 to $24,999 income range is the most frequent in Dixie Inn, accounting for 34.2% of all households.
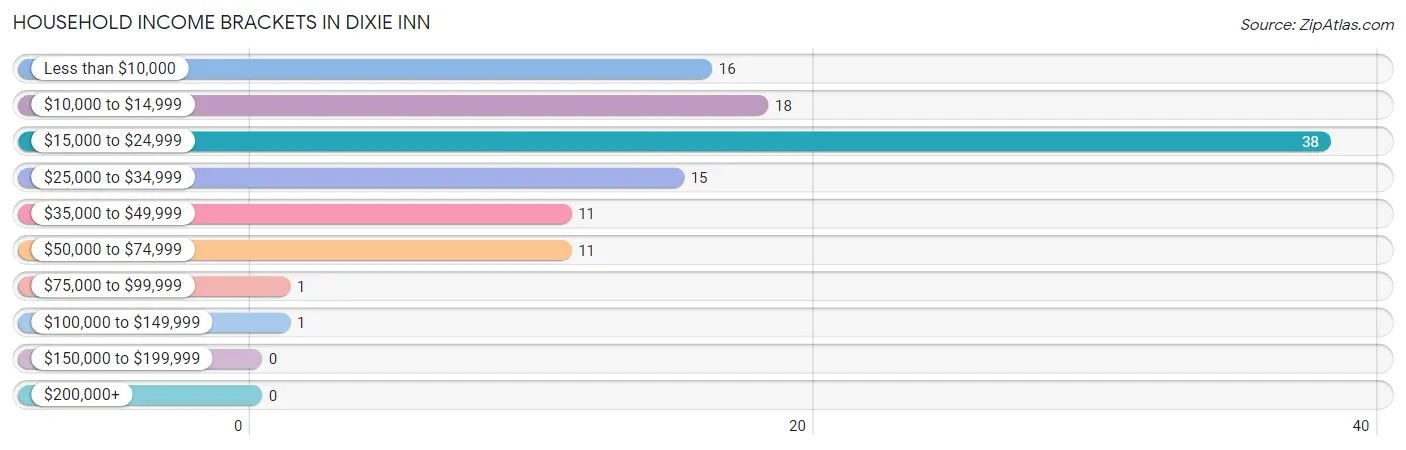
| Income Bracket | # Households | % Households |
| Less than $10,000 | 16 | 14.4% |
| $10,000 to $14,999 | 18 | 16.2% |
| $15,000 to $24,999 | 38 | 34.2% |
| $25,000 to $34,999 | 15 | 13.5% |
| $35,000 to $49,999 | 11 | 9.9% |
| $50,000 to $74,999 | 11 | 9.9% |
| $75,000 to $99,999 | 1 | 0.9% |
| $100,000 to $149,999 | 1 | 0.9% |
| $150,000 to $199,999 | 0 | 0.0% |
| $200,000+ | 0 | 0.0% |
Household Income by Householder Age in Dixie Inn
The median household income in Dixie Inn is $22,083, with the highest median household income of $33,500 found in the 65+ years age bracket for the primary householder. A total of 14 households (12.6%) fall into this category. Meanwhile, the 15 to 24 years age bracket for the primary householder has the lowest median household income of $0, with 14 households (12.6%) in this group.
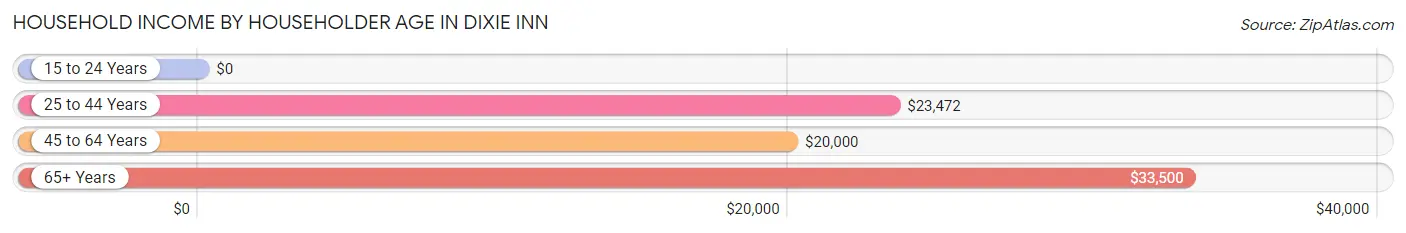
| Income Bracket | # Households | Median Income |
| 15 to 24 Years | 14 (12.6%) | $0 |
| 25 to 44 Years | 35 (31.5%) | $23,472 |
| 45 to 64 Years | 48 (43.2%) | $20,000 |
| 65+ Years | 14 (12.6%) | $33,500 |
| Total | 111 (100.0%) | $22,083 |
Poverty in Dixie Inn
Income Below Poverty by Sex and Age in Dixie Inn
With 62.3% poverty level for males and 66.9% for females among the residents of Dixie Inn, 12 to 14 year old males and under 5 year old females are the most vulnerable to poverty, with 3 males (100.0%) and 9 females (100.0%) in their respective age groups living below the poverty level.
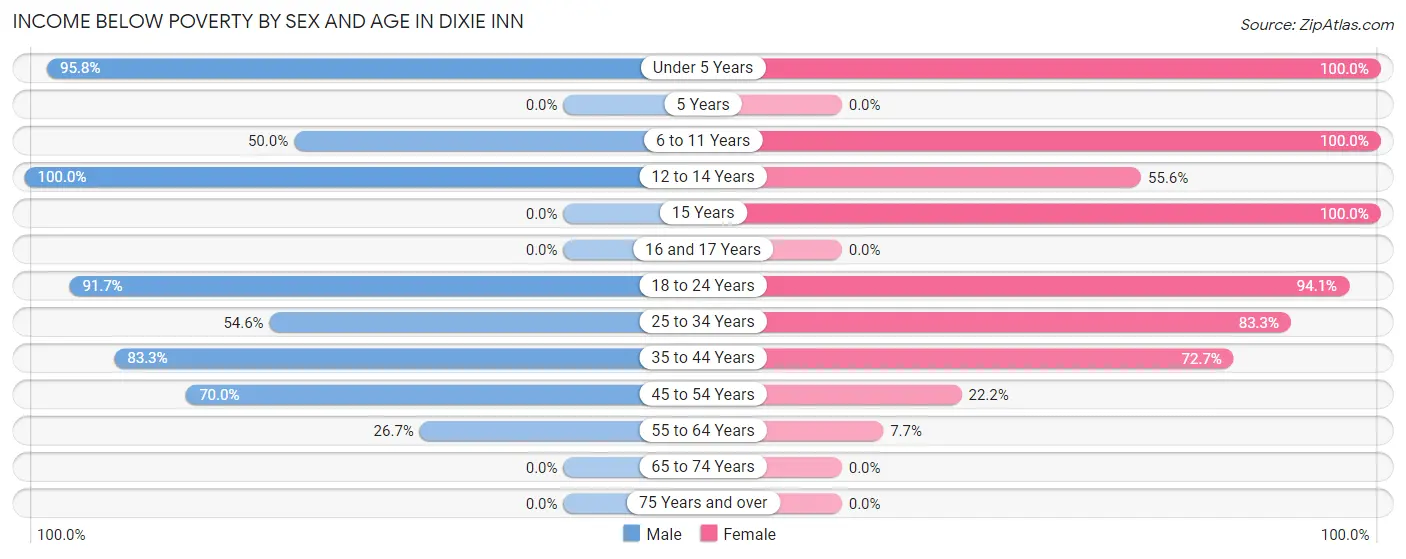
| Age Bracket | Male | Female |
| Under 5 Years | 23 (95.8%) | 9 (100.0%) |
| 5 Years | 0 (0.0%) | 0 (0.0%) |
| 6 to 11 Years | 10 (50.0%) | 21 (100.0%) |
| 12 to 14 Years | 3 (100.0%) | 5 (55.6%) |
| 15 Years | 0 (0.0%) | 2 (100.0%) |
| 16 and 17 Years | 0 (0.0%) | 0 (0.0%) |
| 18 to 24 Years | 11 (91.7%) | 16 (94.1%) |
| 25 to 34 Years | 6 (54.5%) | 25 (83.3%) |
| 35 to 44 Years | 10 (83.3%) | 8 (72.7%) |
| 45 to 54 Years | 14 (70.0%) | 2 (22.2%) |
| 55 to 64 Years | 4 (26.7%) | 1 (7.7%) |
| 65 to 74 Years | 0 (0.0%) | 0 (0.0%) |
| 75 Years and over | 0 (0.0%) | 0 (0.0%) |
| Total | 81 (62.3%) | 89 (66.9%) |
Income Above Poverty by Sex and Age in Dixie Inn
According to the poverty statistics in Dixie Inn, males aged 5 years and females aged 65 to 74 years are the age groups that are most secure financially, with 100.0% of males and 100.0% of females in these age groups living above the poverty line.
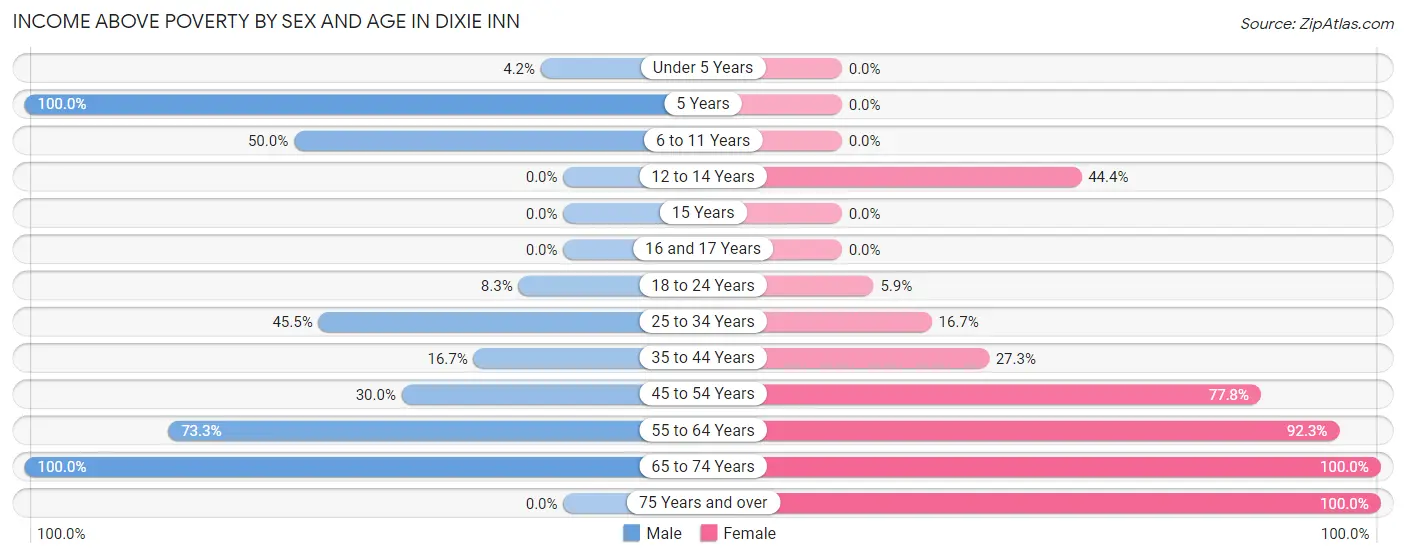
| Age Bracket | Male | Female |
| Under 5 Years | 1 (4.2%) | 0 (0.0%) |
| 5 Years | 3 (100.0%) | 0 (0.0%) |
| 6 to 11 Years | 10 (50.0%) | 0 (0.0%) |
| 12 to 14 Years | 0 (0.0%) | 4 (44.4%) |
| 15 Years | 0 (0.0%) | 0 (0.0%) |
| 16 and 17 Years | 0 (0.0%) | 0 (0.0%) |
| 18 to 24 Years | 1 (8.3%) | 1 (5.9%) |
| 25 to 34 Years | 5 (45.5%) | 5 (16.7%) |
| 35 to 44 Years | 2 (16.7%) | 3 (27.3%) |
| 45 to 54 Years | 6 (30.0%) | 7 (77.8%) |
| 55 to 64 Years | 11 (73.3%) | 12 (92.3%) |
| 65 to 74 Years | 10 (100.0%) | 8 (100.0%) |
| 75 Years and over | 0 (0.0%) | 4 (100.0%) |
| Total | 49 (37.7%) | 44 (33.1%) |
Income Below Poverty Among Married-Couple Families in Dixie Inn
The poverty statistics for married-couple families in Dixie Inn show that 30.0% or 6 of the total 20 families live below the poverty line. Families with 1 or 2 children have the highest poverty rate of 40.0%, comprising of 6 families. On the other hand, families with no children have the lowest poverty rate of 0.0%, which includes 0 families.
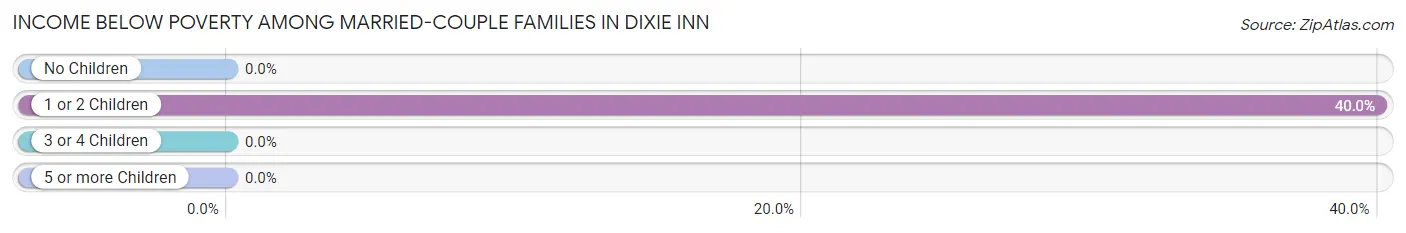
| Children | Above Poverty | Below Poverty |
| No Children | 5 (100.0%) | 0 (0.0%) |
| 1 or 2 Children | 9 (60.0%) | 6 (40.0%) |
| 3 or 4 Children | 0 (0.0%) | 0 (0.0%) |
| 5 or more Children | 0 (0.0%) | 0 (0.0%) |
| Total | 14 (70.0%) | 6 (30.0%) |
Income Below Poverty Among Single-Parent Households in Dixie Inn
According to the poverty data in Dixie Inn, 91.3% or 21 single-father households and 95.8% or 23 single-mother households are living below the poverty line. Among single-father households, those with 1 or 2 children have the highest poverty rate, with 8 households (100.0%) experiencing poverty. Likewise, among single-mother households, those with 3 or 4 children have the highest poverty rate, with 4 households (100.0%) falling below the poverty line.
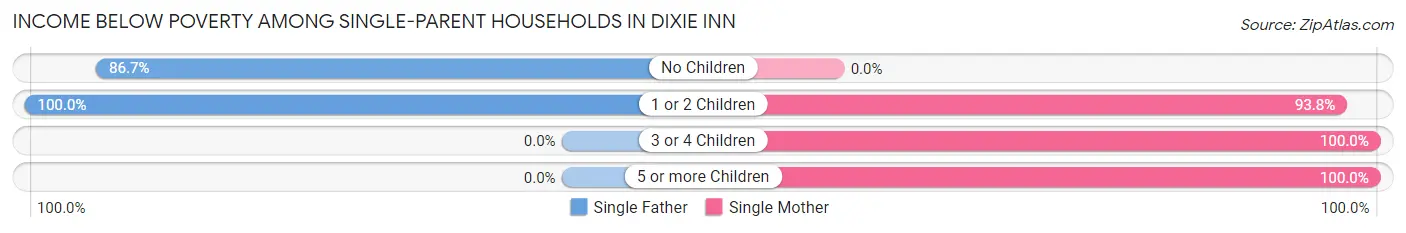
| Children | Single Father | Single Mother |
| No Children | 13 (86.7%) | 0 (0.0%) |
| 1 or 2 Children | 8 (100.0%) | 15 (93.8%) |
| 3 or 4 Children | 0 (0.0%) | 4 (100.0%) |
| 5 or more Children | 0 (0.0%) | 4 (100.0%) |
| Total | 21 (91.3%) | 23 (95.8%) |
Income Below Poverty Among Married-Couple vs Single-Parent Households in Dixie Inn
The poverty data for Dixie Inn shows that 6 of the married-couple family households (30.0%) and 44 of the single-parent households (93.6%) are living below the poverty level. Within the married-couple family households, those with 1 or 2 children have the highest poverty rate, with 6 households (40.0%) falling below the poverty line. Among the single-parent households, those with 3 or 4 children have the highest poverty rate, with 4 household (100.0%) living below poverty.
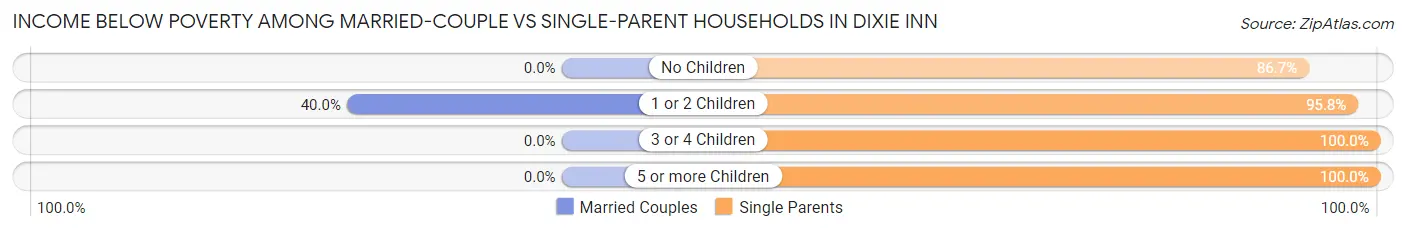
| Children | Married-Couple Families | Single-Parent Households |
| No Children | 0 (0.0%) | 13 (86.7%) |
| 1 or 2 Children | 6 (40.0%) | 23 (95.8%) |
| 3 or 4 Children | 0 (0.0%) | 4 (100.0%) |
| 5 or more Children | 0 (0.0%) | 4 (100.0%) |
| Total | 6 (30.0%) | 44 (93.6%) |
Race in Dixie Inn
The most populous races in Dixie Inn are Black / African American (121 | 45.7%), White / Caucasian (111 | 41.9%), and Two or more Races (33 | 12.4%).
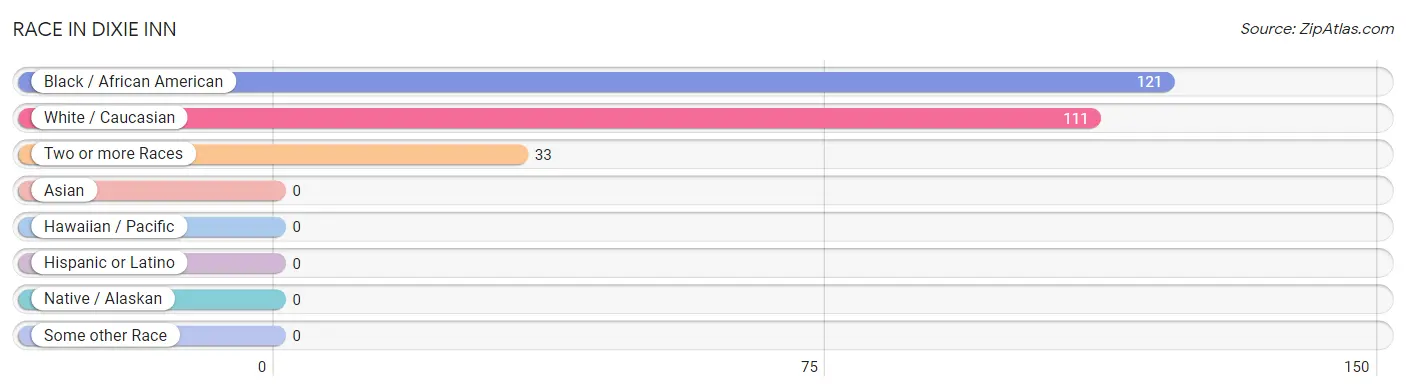
| Race | # Population | % Population |
| Asian | 0 | 0.0% |
| Black / African American | 121 | 45.7% |
| Hawaiian / Pacific | 0 | 0.0% |
| Hispanic or Latino | 0 | 0.0% |
| Native / Alaskan | 0 | 0.0% |
| White / Caucasian | 111 | 41.9% |
| Two or more Races | 33 | 12.4% |
| Some other Race | 0 | 0.0% |
| Total | 265 | 100.0% |
Ancestry in Dixie Inn
The most populous ancestries reported in Dixie Inn are American (105 | 39.6%), English (9 | 3.4%), Irish (8 | 3.0%), French American Indian (6 | 2.3%), and German (4 | 1.5%), together accounting for 49.8% of all Dixie Inn residents.
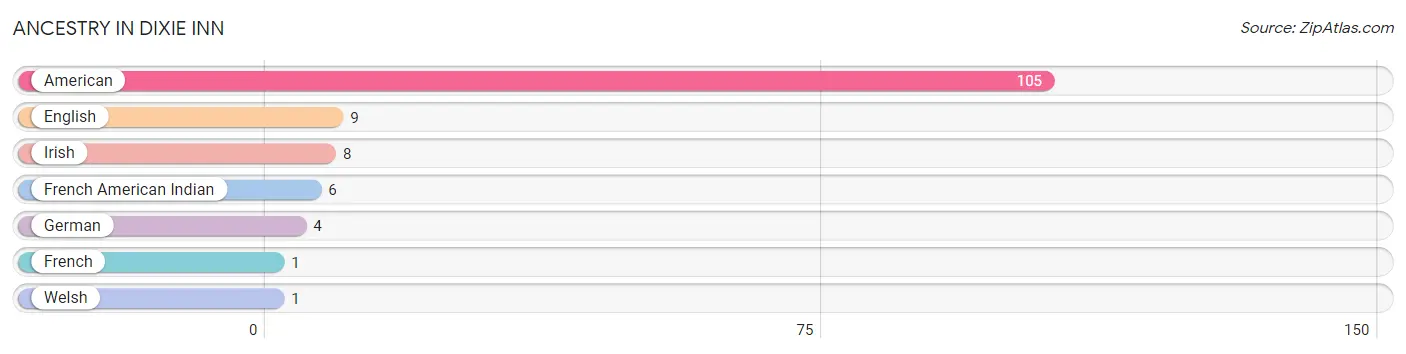
| Ancestry | # Population | % Population |
| American | 105 | 39.6% |
| English | 9 | 3.4% |
| French | 1 | 0.4% |
| French American Indian | 6 | 2.3% |
| German | 4 | 1.5% |
| Irish | 8 | 3.0% |
| Welsh | 1 | 0.4% | View All 7 Rows |
Immigrants in Dixie Inn

| Immigration Origin | # Population | % Population | View All 0 Rows |
Sex and Age in Dixie Inn
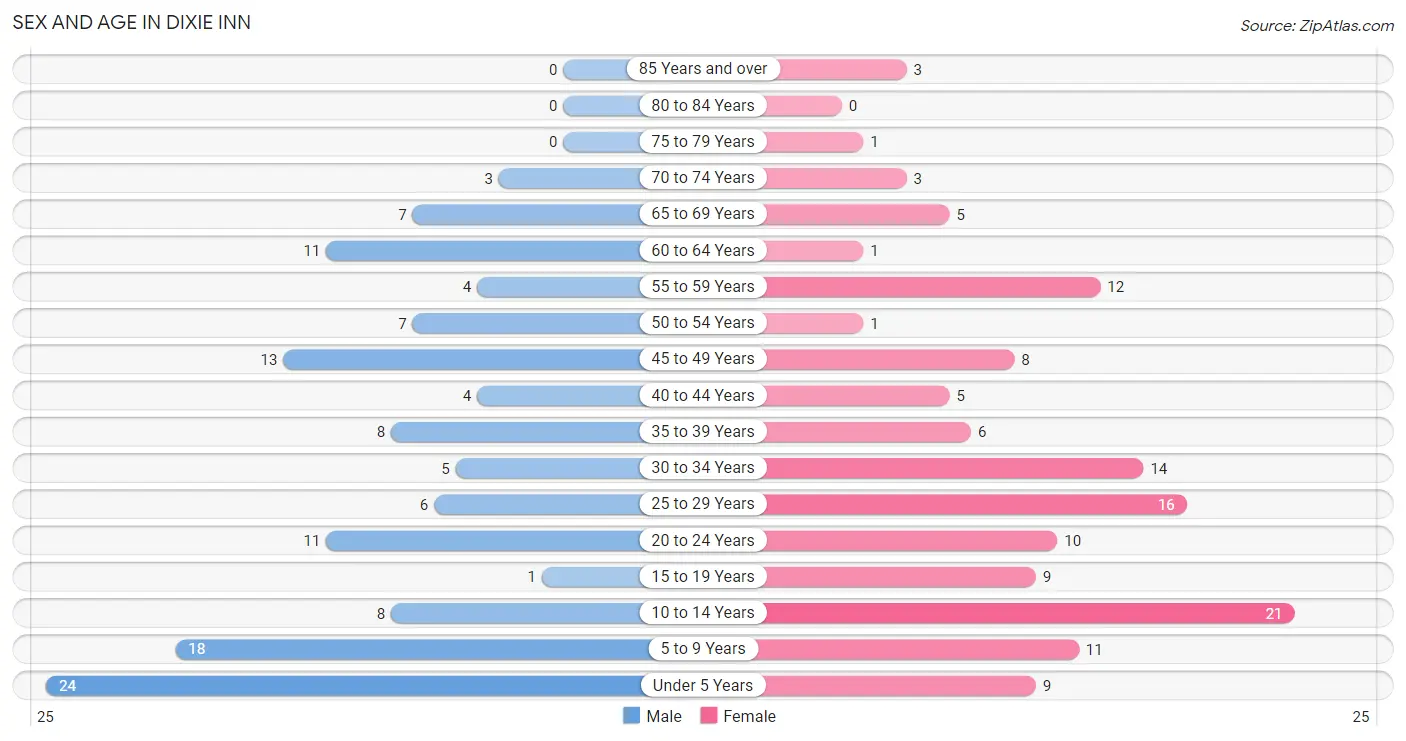
Sex and Age in Dixie Inn
The most populous age groups in Dixie Inn are Under 5 Years (24 | 18.5%) for men and 10 to 14 Years (21 | 15.6%) for women.
| Age Bracket | Male | Female |
| Under 5 Years | 24 (18.5%) | 9 (6.7%) |
| 5 to 9 Years | 18 (13.9%) | 11 (8.2%) |
| 10 to 14 Years | 8 (6.1%) | 21 (15.6%) |
| 15 to 19 Years | 1 (0.8%) | 9 (6.7%) |
| 20 to 24 Years | 11 (8.5%) | 10 (7.4%) |
| 25 to 29 Years | 6 (4.6%) | 16 (11.8%) |
| 30 to 34 Years | 5 (3.8%) | 14 (10.4%) |
| 35 to 39 Years | 8 (6.1%) | 6 (4.4%) |
| 40 to 44 Years | 4 (3.1%) | 5 (3.7%) |
| 45 to 49 Years | 13 (10.0%) | 8 (5.9%) |
| 50 to 54 Years | 7 (5.4%) | 1 (0.7%) |
| 55 to 59 Years | 4 (3.1%) | 12 (8.9%) |
| 60 to 64 Years | 11 (8.5%) | 1 (0.7%) |
| 65 to 69 Years | 7 (5.4%) | 5 (3.7%) |
| 70 to 74 Years | 3 (2.3%) | 3 (2.2%) |
| 75 to 79 Years | 0 (0.0%) | 1 (0.7%) |
| 80 to 84 Years | 0 (0.0%) | 0 (0.0%) |
| 85 Years and over | 0 (0.0%) | 3 (2.2%) |
| Total | 130 (100.0%) | 135 (100.0%) |
Families and Households in Dixie Inn
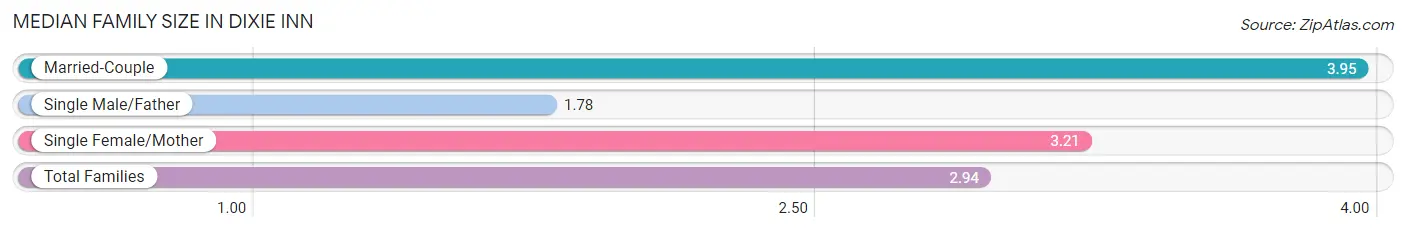
Median Family Size in Dixie Inn
The median family size in Dixie Inn is 2.94 persons per family, with married-couple families (20 | 29.8%) accounting for the largest median family size of 3.95 persons per family. On the other hand, single male/father families (23 | 34.3%) represent the smallest median family size with 1.78 persons per family.
| Family Type | # Families | Family Size |
| Married-Couple | 20 (29.8%) | 3.95 |
| Single Male/Father | 23 (34.3%) | 1.78 |
| Single Female/Mother | 24 (35.8%) | 3.21 |
| Total Families | 67 (100.0%) | 2.94 |
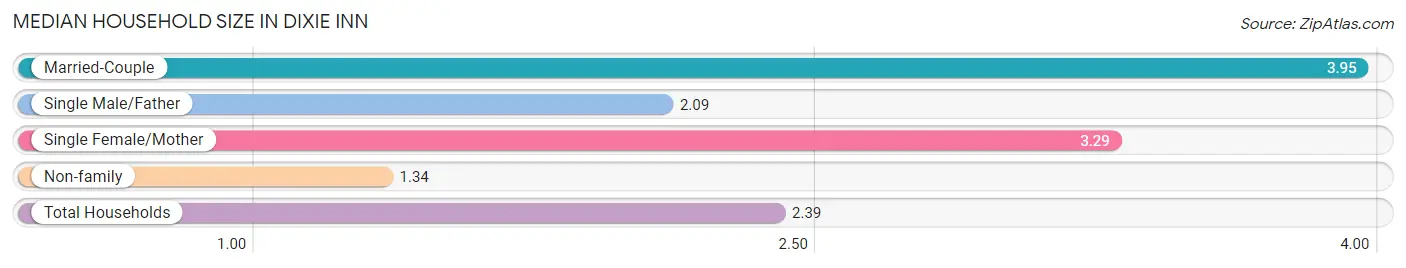
Median Household Size in Dixie Inn
The median household size in Dixie Inn is 2.39 persons per household, with married-couple households (20 | 18.0%) accounting for the largest median household size of 3.95 persons per household. non-family households (44 | 39.6%) represent the smallest median household size with 1.34 persons per household.
| Household Type | # Households | Household Size |
| Married-Couple | 20 (18.0%) | 3.95 |
| Single Male/Father | 23 (20.7%) | 2.09 |
| Single Female/Mother | 24 (21.6%) | 3.29 |
| Non-family | 44 (39.6%) | 1.34 |
| Total Households | 111 (100.0%) | 2.39 |
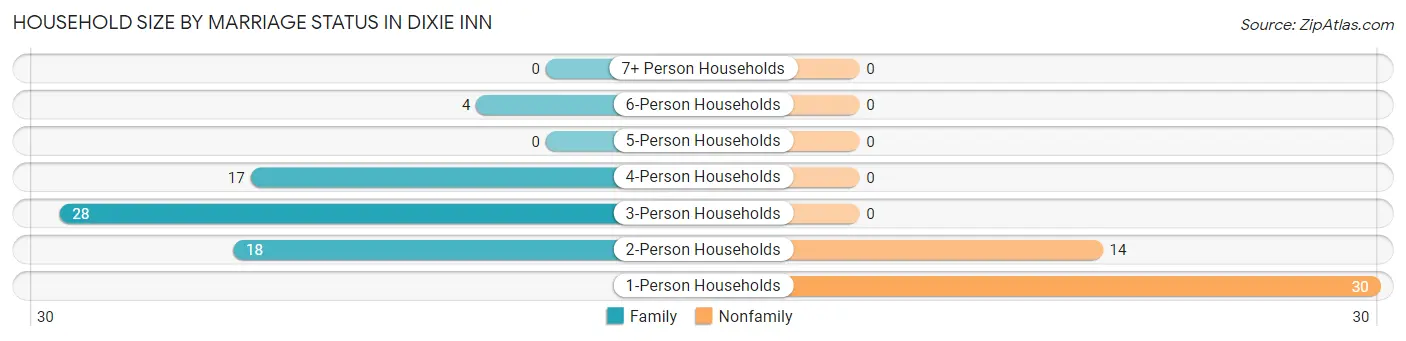
Household Size by Marriage Status in Dixie Inn
Out of a total of 111 households in Dixie Inn, 67 (60.4%) are family households, while 44 (39.6%) are nonfamily households. The most numerous type of family households are 3-person households, comprising 28, and the most common type of nonfamily households are 1-person households, comprising 30.
| Household Size | Family Households | Nonfamily Households |
| 1-Person Households | - | 30 (27.0%) |
| 2-Person Households | 18 (16.2%) | 14 (12.6%) |
| 3-Person Households | 28 (25.2%) | 0 (0.0%) |
| 4-Person Households | 17 (15.3%) | 0 (0.0%) |
| 5-Person Households | 0 (0.0%) | 0 (0.0%) |
| 6-Person Households | 4 (3.6%) | 0 (0.0%) |
| 7+ Person Households | 0 (0.0%) | 0 (0.0%) |
| Total | 67 (60.4%) | 44 (39.6%) |
Female Fertility in Dixie Inn
Fertility by Age in Dixie Inn
Average fertility rate in Dixie Inn is 74.0 births per 1,000 women. Women in the age bracket of 15 to 19 years have the highest fertility rate with 111.0 births per 1,000 women. Women in the age bracket of 20 to 34 years acount for 40.0% of all women with births.
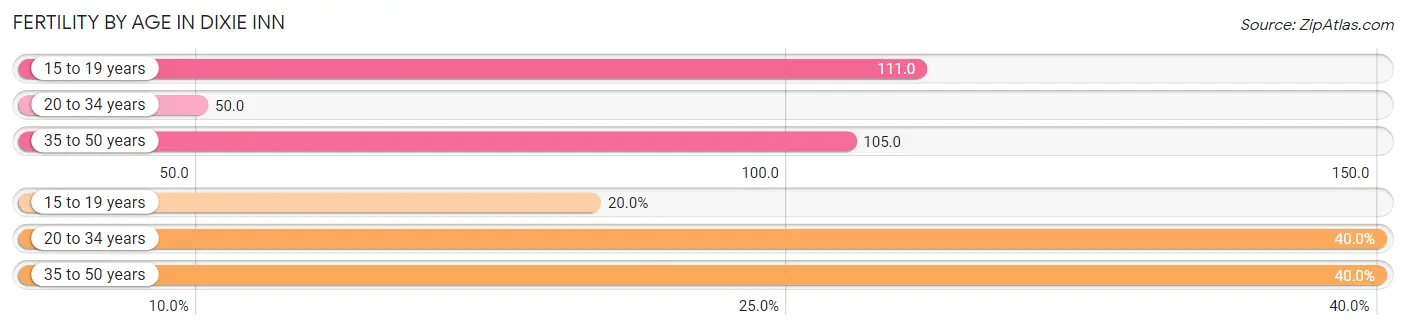
| Age Bracket | Women with Births | Births / 1,000 Women |
| 15 to 19 years | 1 (20.0%) | 111.0 |
| 20 to 34 years | 2 (40.0%) | 50.0 |
| 35 to 50 years | 2 (40.0%) | 105.0 |
| Total | 5 (100.0%) | 74.0 |
Fertility by Age by Marriage Status in Dixie Inn
20.0% of women with births (5) in Dixie Inn are married. The highest percentage of unmarried women with births falls into 20 to 34 years age bracket with 100.0% of them unmarried at the time of birth, while the lowest percentage of unmarried women with births belong to 15 to 19 years age bracket with 0.0% of them unmarried.
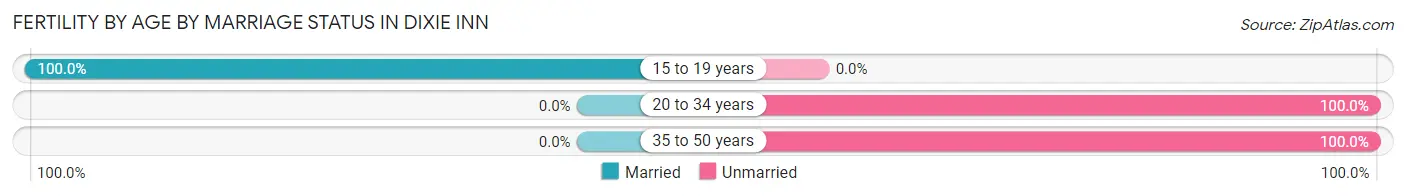
| Age Bracket | Married | Unmarried |
| 15 to 19 years | 1 (100.0%) | 0 (0.0%) |
| 20 to 34 years | 0 (0.0%) | 2 (100.0%) |
| 35 to 50 years | 0 (0.0%) | 2 (100.0%) |
| Total | 1 (20.0%) | 4 (80.0%) |
Fertility by Education in Dixie Inn
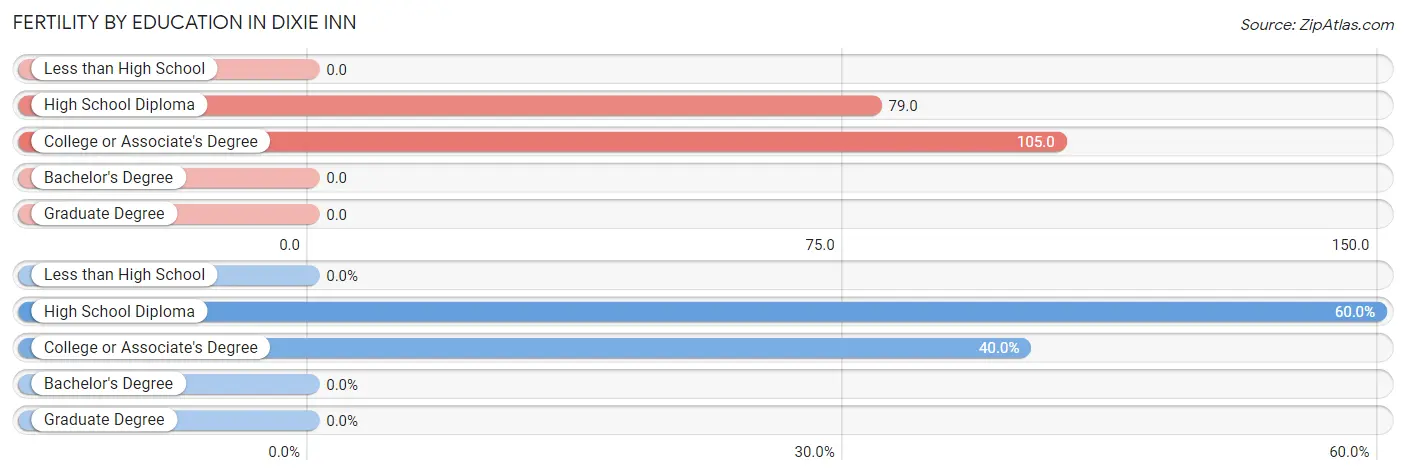
| Educational Attainment | Women with Births | Births / 1,000 Women |
| Less than High School | 0 (0.0%) | 0.0 |
| High School Diploma | 3 (60.0%) | 79.0 |
| College or Associate's Degree | 2 (40.0%) | 105.0 |
| Bachelor's Degree | 0 (0.0%) | 0.0 |
| Graduate Degree | 0 (0.0%) | 0.0 |
| Total | 5 (100.0%) | 74.0 |
Fertility by Education by Marriage Status in Dixie Inn
80.0% of women with births in Dixie Inn are unmarried. Women with the educational attainment of high school diploma are most likely to be married with 33.3% of them married at childbirth, while women with the educational attainment of college or associate's degree are least likely to be married with 100.0% of them unmarried at childbirth.
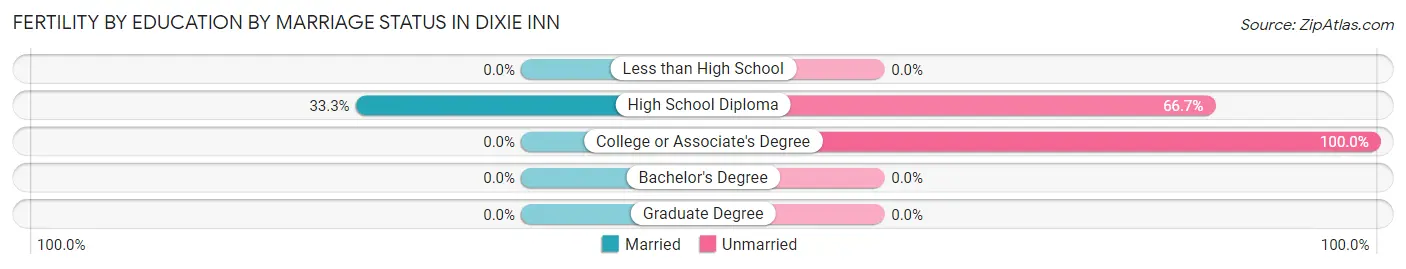
| Educational Attainment | Married | Unmarried |
| Less than High School | 0 (0.0%) | 0 (0.0%) |
| High School Diploma | 1 (33.3%) | 2 (66.7%) |
| College or Associate's Degree | 0 (0.0%) | 2 (100.0%) |
| Bachelor's Degree | 0 (0.0%) | 0 (0.0%) |
| Graduate Degree | 0 (0.0%) | 0 (0.0%) |
| Total | 1 (20.0%) | 4 (80.0%) |
Employment Characteristics in Dixie Inn
Employment by Class of Employer in Dixie Inn
Among the 87 employed individuals in Dixie Inn, private company employees (74 | 85.1%), local government employees (8 | 9.2%), and state government employees (4 | 4.6%) make up the most common classes of employment.
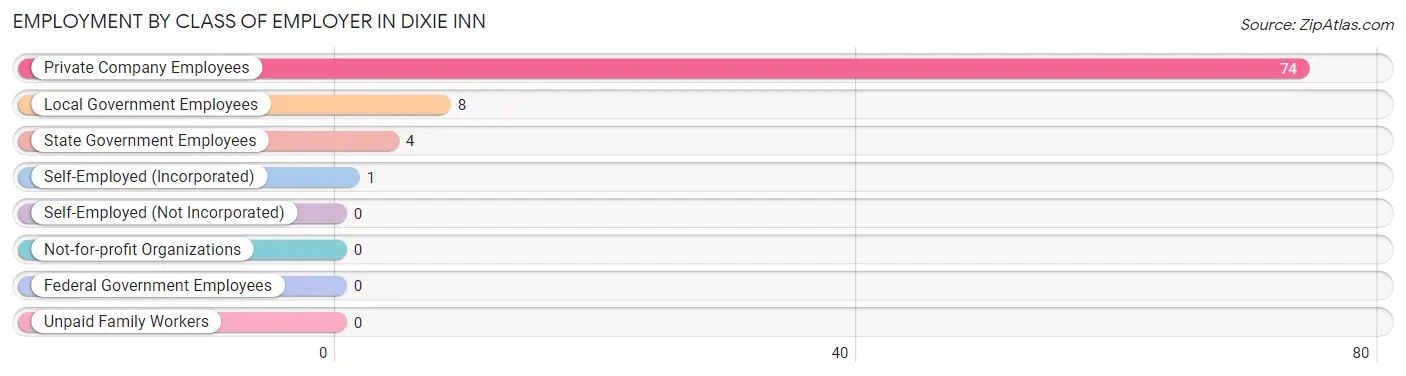
| Employer Class | # Employees | % Employees |
| Private Company Employees | 74 | 85.1% |
| Self-Employed (Incorporated) | 1 | 1.1% |
| Self-Employed (Not Incorporated) | 0 | 0.0% |
| Not-for-profit Organizations | 0 | 0.0% |
| Local Government Employees | 8 | 9.2% |
| State Government Employees | 4 | 4.6% |
| Federal Government Employees | 0 | 0.0% |
| Unpaid Family Workers | 0 | 0.0% |
| Total | 87 | 100.0% |
Employment Status by Age in Dixie Inn
According to the labor force statistics for Dixie Inn, out of the total population over 16 years of age (172), 55.8% or 96 individuals are in the labor force, with 9.4% or 9 of them unemployed. The age group with the highest labor force participation rate is 25 to 29 years, with 100.0% or 22 individuals in the labor force. Within the labor force, the 55 to 59 years age range has the highest percentage of unemployed individuals, with 71.4% or 5 of them being unemployed.
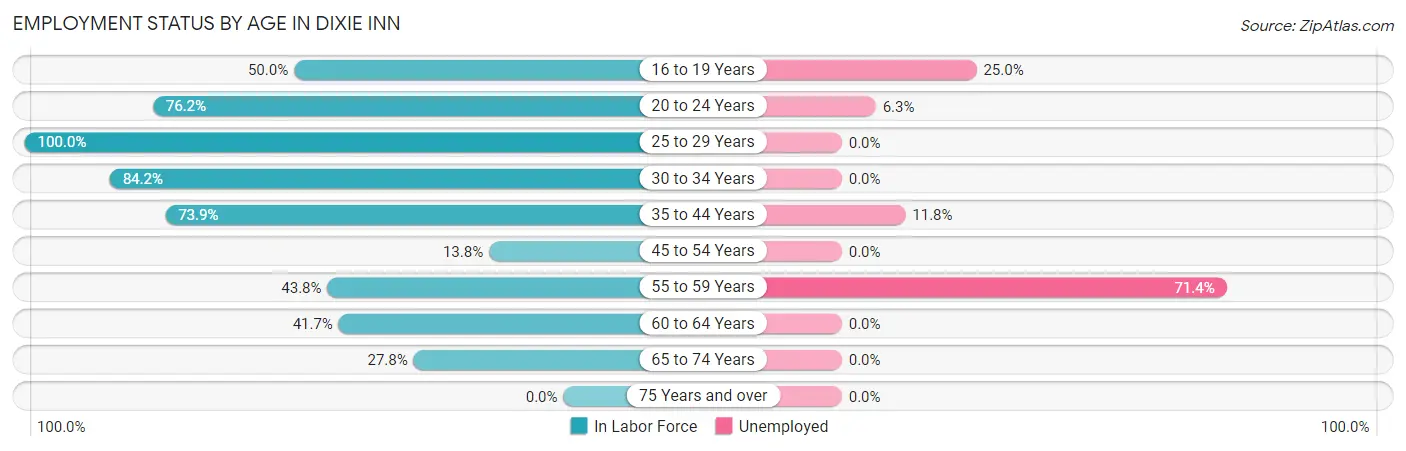
| Age Bracket | In Labor Force | Unemployed |
| 16 to 19 Years | 4 (50.0%) | 1 (25.0%) |
| 20 to 24 Years | 16 (76.2%) | 1 (6.3%) |
| 25 to 29 Years | 22 (100.0%) | 0 (0.0%) |
| 30 to 34 Years | 16 (84.2%) | 0 (0.0%) |
| 35 to 44 Years | 17 (73.9%) | 2 (11.8%) |
| 45 to 54 Years | 4 (13.8%) | 0 (0.0%) |
| 55 to 59 Years | 7 (43.8%) | 5 (71.4%) |
| 60 to 64 Years | 5 (41.7%) | 0 (0.0%) |
| 65 to 74 Years | 5 (27.8%) | 0 (0.0%) |
| 75 Years and over | 0 (0.0%) | 0 (0.0%) |
| Total | 96 (55.8%) | 9 (9.4%) |
Employment Status by Educational Attainment in Dixie Inn
According to labor force statistics for Dixie Inn, 58.7% of individuals (71) out of the total population between 25 and 64 years of age (121) are in the labor force, with 9.9% or 7 of them being unemployed. The group with the highest labor force participation rate are those with the educational attainment of bachelor's degree or higher, with 100.0% or 2 individuals in the labor force. Within the labor force, individuals with bachelor's degree or higher education have the highest percentage of unemployment, with 100.0% or 2 of them being unemployed.
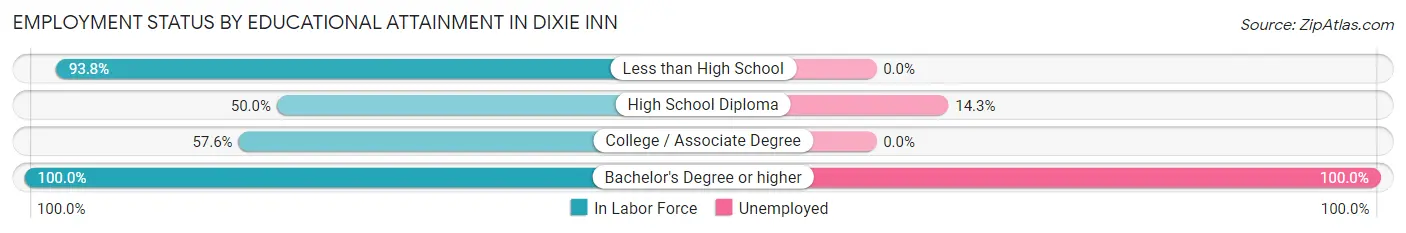
| Educational Attainment | In Labor Force | Unemployed |
| Less than High School | 15 (93.8%) | 0 (0.0%) |
| High School Diploma | 35 (50.0%) | 10 (14.3%) |
| College / Associate Degree | 19 (57.6%) | 0 (0.0%) |
| Bachelor's Degree or higher | 2 (100.0%) | 2 (100.0%) |
| Total | 71 (58.7%) | 12 (9.9%) |
Employment Occupations by Sex in Dixie Inn
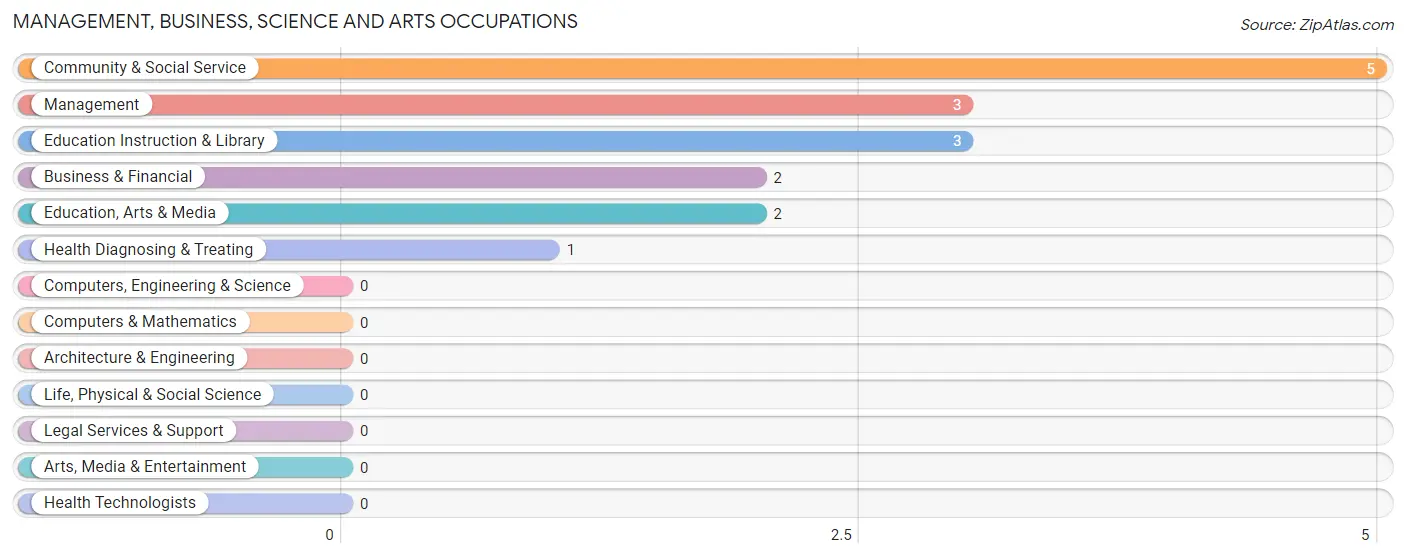
Management, Business, Science and Arts Occupations
The most common Management, Business, Science and Arts occupations in Dixie Inn are Community & Social Service (5 | 5.8%), Management (3 | 3.5%), Education Instruction & Library (3 | 3.5%), Business & Financial (2 | 2.3%), and Education, Arts & Media (2 | 2.3%).
Management, Business, Science and Arts Occupations by Sex
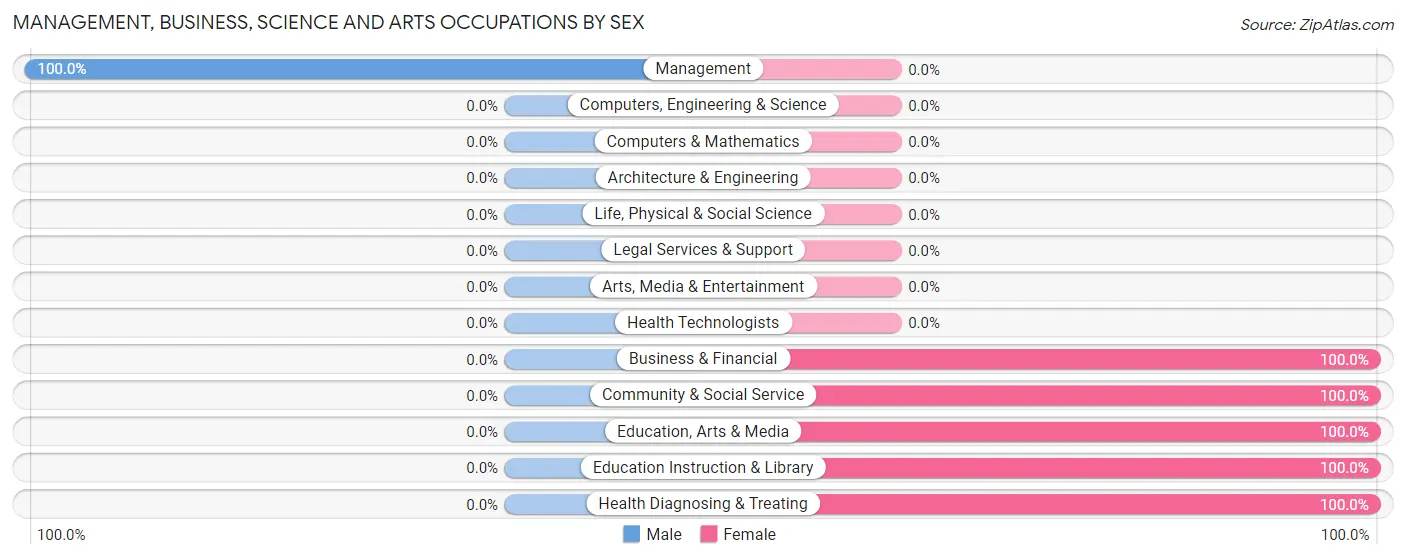
| Occupation | Male | Female |
| Management | 3 (100.0%) | 0 (0.0%) |
| Business & Financial | 0 (0.0%) | 2 (100.0%) |
| Computers, Engineering & Science | 0 (0.0%) | 0 (0.0%) |
| Computers & Mathematics | 0 (0.0%) | 0 (0.0%) |
| Architecture & Engineering | 0 (0.0%) | 0 (0.0%) |
| Life, Physical & Social Science | 0 (0.0%) | 0 (0.0%) |
| Community & Social Service | 0 (0.0%) | 5 (100.0%) |
| Education, Arts & Media | 0 (0.0%) | 2 (100.0%) |
| Legal Services & Support | 0 (0.0%) | 0 (0.0%) |
| Education Instruction & Library | 0 (0.0%) | 3 (100.0%) |
| Arts, Media & Entertainment | 0 (0.0%) | 0 (0.0%) |
| Health Diagnosing & Treating | 0 (0.0%) | 1 (100.0%) |
| Health Technologists | 0 (0.0%) | 0 (0.0%) |
| Total (Category) | 3 (27.3%) | 8 (72.7%) |
| Total (Overall) | 32 (36.8%) | 55 (63.2%) |
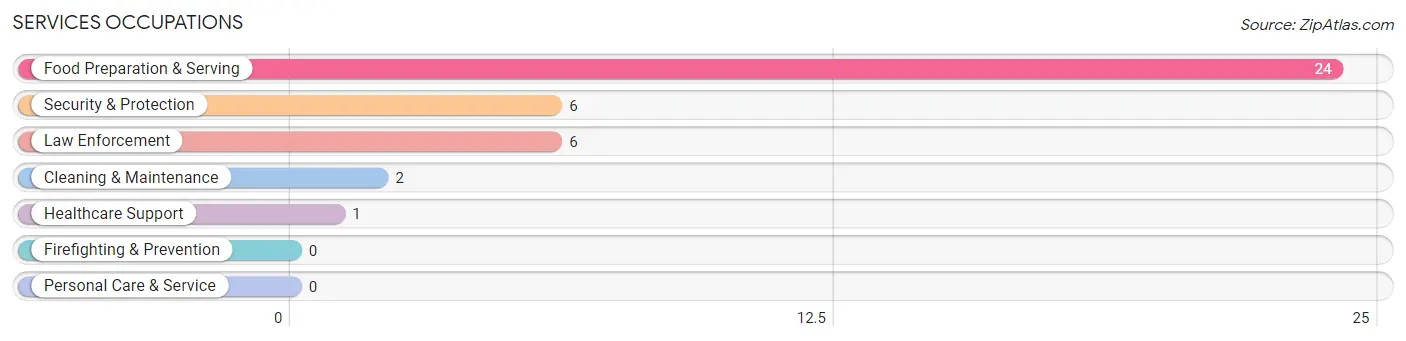
Services Occupations
The most common Services occupations in Dixie Inn are Food Preparation & Serving (24 | 27.6%), Security & Protection (6 | 6.9%), Law Enforcement (6 | 6.9%), Cleaning & Maintenance (2 | 2.3%), and Healthcare Support (1 | 1.1%).
Services Occupations by Sex
Within the Services occupations in Dixie Inn, the most male-oriented occupations are Security & Protection (100.0%), Law Enforcement (100.0%), and Cleaning & Maintenance (100.0%), while the most female-oriented occupations are Healthcare Support (100.0%), and Food Preparation & Serving (100.0%).
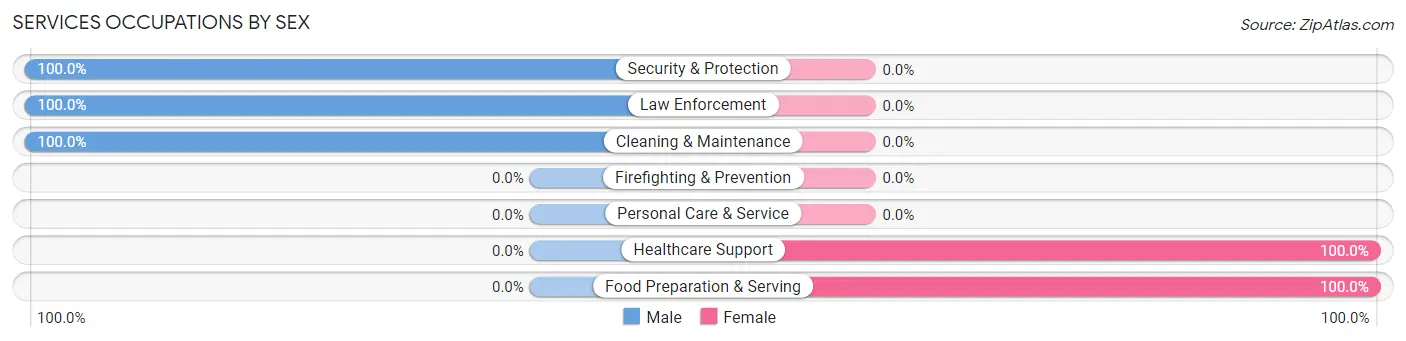
| Occupation | Male | Female |
| Healthcare Support | 0 (0.0%) | 1 (100.0%) |
| Security & Protection | 6 (100.0%) | 0 (0.0%) |
| Firefighting & Prevention | 0 (0.0%) | 0 (0.0%) |
| Law Enforcement | 6 (100.0%) | 0 (0.0%) |
| Food Preparation & Serving | 0 (0.0%) | 24 (100.0%) |
| Cleaning & Maintenance | 2 (100.0%) | 0 (0.0%) |
| Personal Care & Service | 0 (0.0%) | 0 (0.0%) |
| Total (Category) | 8 (24.2%) | 25 (75.8%) |
| Total (Overall) | 32 (36.8%) | 55 (63.2%) |
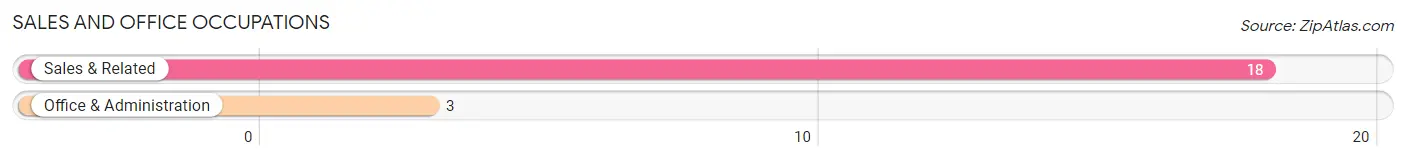
Sales and Office Occupations
The most common Sales and Office occupations in Dixie Inn are Sales & Related (18 | 20.7%), and Office & Administration (3 | 3.5%).
Sales and Office Occupations by Sex
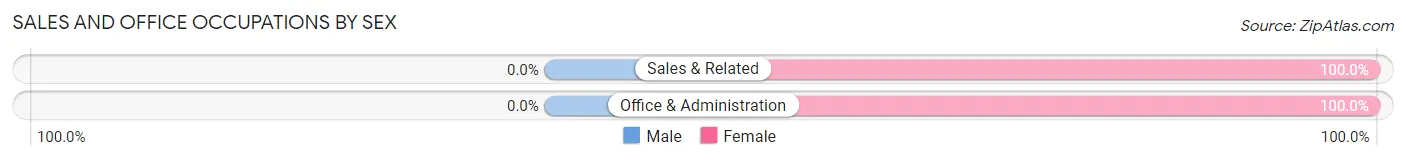
| Occupation | Male | Female |
| Sales & Related | 0 (0.0%) | 18 (100.0%) |
| Office & Administration | 0 (0.0%) | 3 (100.0%) |
| Total (Category) | 0 (0.0%) | 21 (100.0%) |
| Total (Overall) | 32 (36.8%) | 55 (63.2%) |
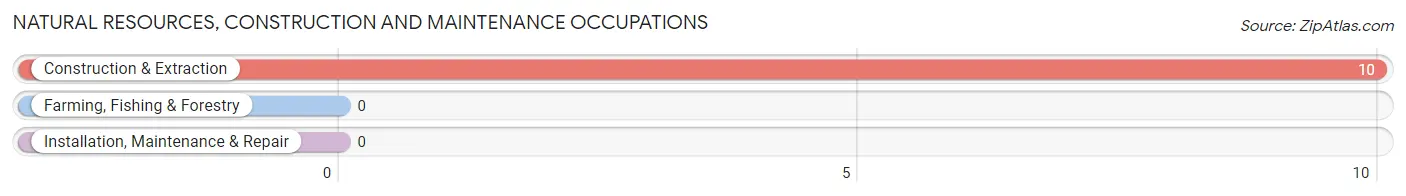
Natural Resources, Construction and Maintenance Occupations
The most common Natural Resources, Construction and Maintenance occupations in Dixie Inn are , and Construction & Extraction (10 | 11.5%).
Natural Resources, Construction and Maintenance Occupations by Sex
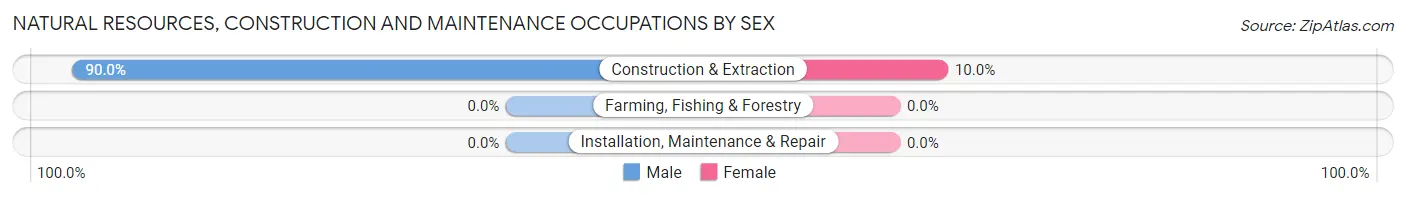
| Occupation | Male | Female |
| Farming, Fishing & Forestry | 0 (0.0%) | 0 (0.0%) |
| Construction & Extraction | 9 (90.0%) | 1 (10.0%) |
| Installation, Maintenance & Repair | 0 (0.0%) | 0 (0.0%) |
| Total (Category) | 9 (90.0%) | 1 (10.0%) |
| Total (Overall) | 32 (36.8%) | 55 (63.2%) |
Production, Transportation and Moving Occupations
The most common Production, Transportation and Moving occupations in Dixie Inn are Transportation (8 | 9.2%), and Production (4 | 4.6%).
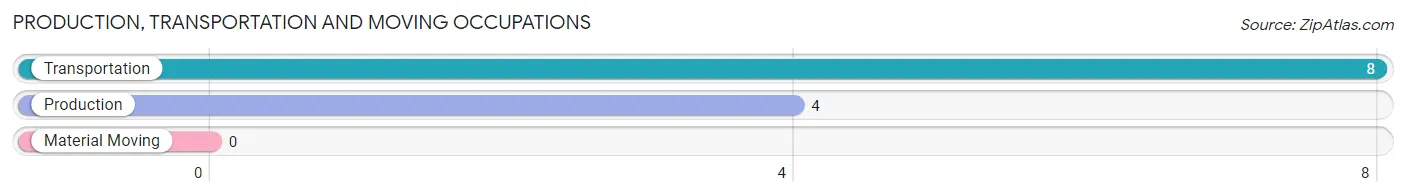
Production, Transportation and Moving Occupations by Sex
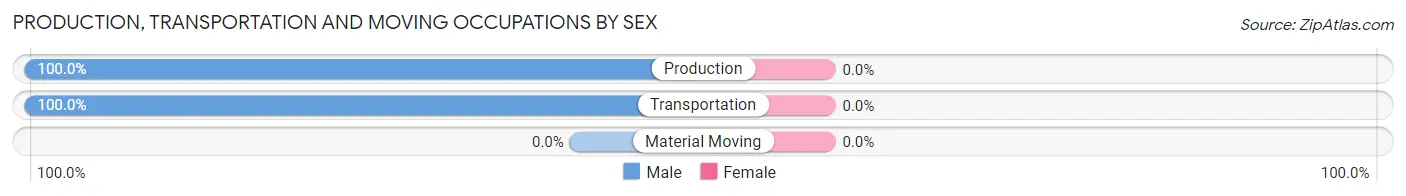
| Occupation | Male | Female |
| Production | 4 (100.0%) | 0 (0.0%) |
| Transportation | 8 (100.0%) | 0 (0.0%) |
| Material Moving | 0 (0.0%) | 0 (0.0%) |
| Total (Category) | 12 (100.0%) | 0 (0.0%) |
| Total (Overall) | 32 (36.8%) | 55 (63.2%) |
Employment Industries by Sex in Dixie Inn
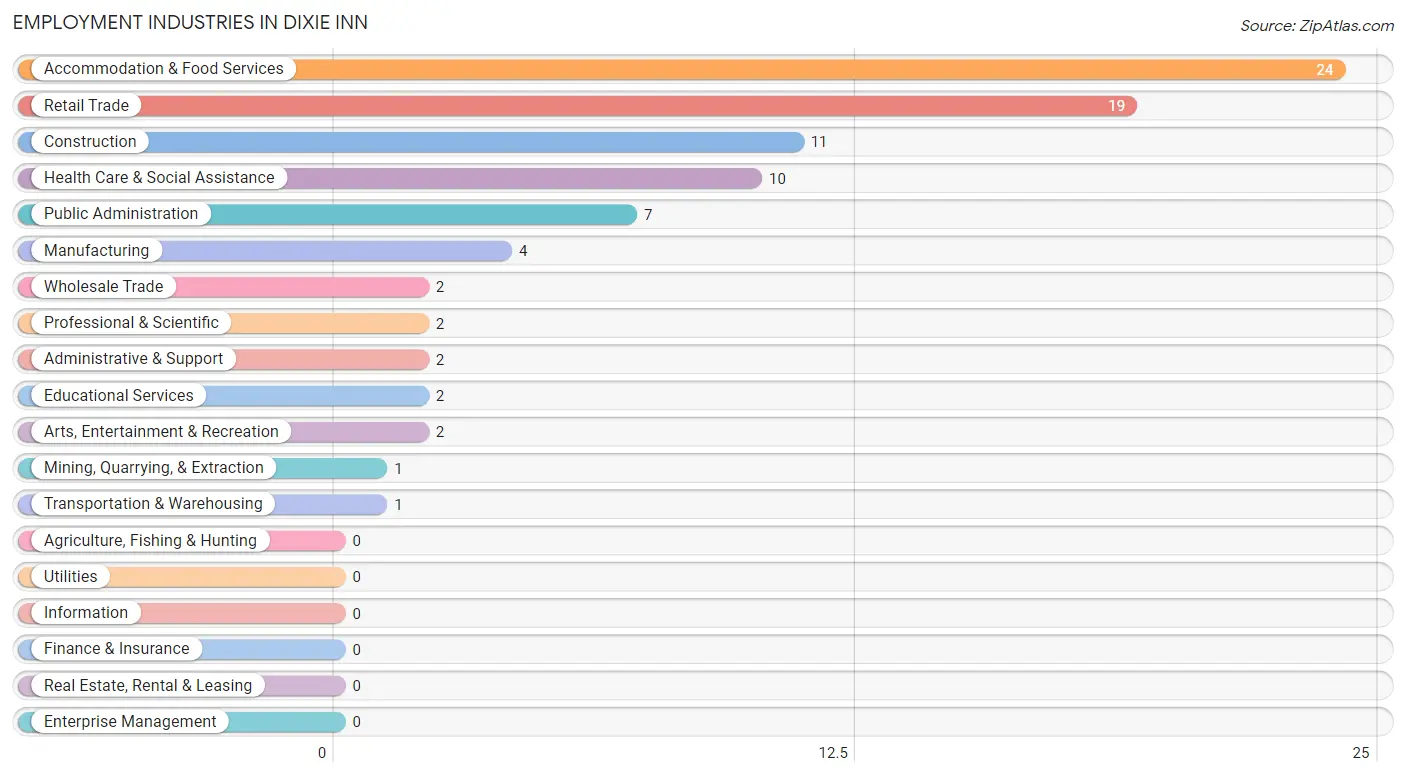
Employment Industries in Dixie Inn
The major employment industries in Dixie Inn include Accommodation & Food Services (24 | 27.6%), Retail Trade (19 | 21.8%), Construction (11 | 12.6%), Health Care & Social Assistance (10 | 11.5%), and Public Administration (7 | 8.1%).
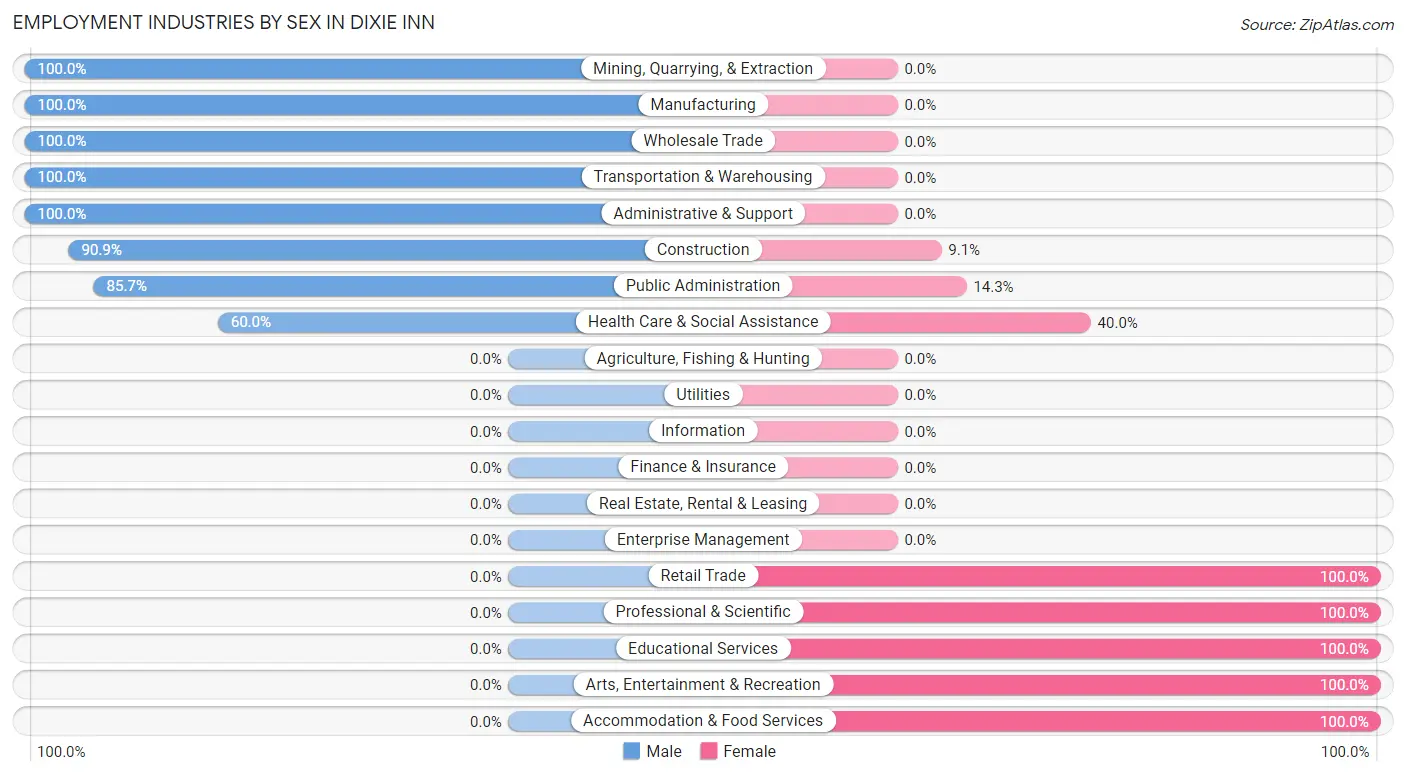
Employment Industries by Sex in Dixie Inn
The Dixie Inn industries that see more men than women are Mining, Quarrying, & Extraction (100.0%), Manufacturing (100.0%), and Wholesale Trade (100.0%), whereas the industries that tend to have a higher number of women are Retail Trade (100.0%), Professional & Scientific (100.0%), and Educational Services (100.0%).
| Industry | Male | Female |
| Agriculture, Fishing & Hunting | 0 (0.0%) | 0 (0.0%) |
| Mining, Quarrying, & Extraction | 1 (100.0%) | 0 (0.0%) |
| Construction | 10 (90.9%) | 1 (9.1%) |
| Manufacturing | 4 (100.0%) | 0 (0.0%) |
| Wholesale Trade | 2 (100.0%) | 0 (0.0%) |
| Retail Trade | 0 (0.0%) | 19 (100.0%) |
| Transportation & Warehousing | 1 (100.0%) | 0 (0.0%) |
| Utilities | 0 (0.0%) | 0 (0.0%) |
| Information | 0 (0.0%) | 0 (0.0%) |
| Finance & Insurance | 0 (0.0%) | 0 (0.0%) |
| Real Estate, Rental & Leasing | 0 (0.0%) | 0 (0.0%) |
| Professional & Scientific | 0 (0.0%) | 2 (100.0%) |
| Enterprise Management | 0 (0.0%) | 0 (0.0%) |
| Administrative & Support | 2 (100.0%) | 0 (0.0%) |
| Educational Services | 0 (0.0%) | 2 (100.0%) |
| Health Care & Social Assistance | 6 (60.0%) | 4 (40.0%) |
| Arts, Entertainment & Recreation | 0 (0.0%) | 2 (100.0%) |
| Accommodation & Food Services | 0 (0.0%) | 24 (100.0%) |
| Public Administration | 6 (85.7%) | 1 (14.3%) |
| Total | 32 (36.8%) | 55 (63.2%) |
Education in Dixie Inn
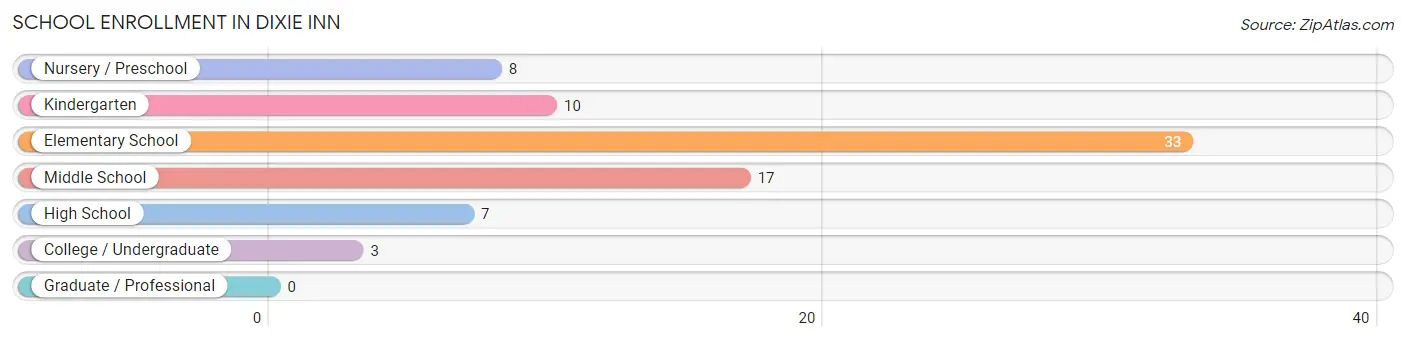
School Enrollment in Dixie Inn
The most common levels of schooling among the 78 students in Dixie Inn are elementary school (33 | 42.3%), middle school (17 | 21.8%), and kindergarten (10 | 12.8%).
| School Level | # Students | % Students |
| Nursery / Preschool | 8 | 10.3% |
| Kindergarten | 10 | 12.8% |
| Elementary School | 33 | 42.3% |
| Middle School | 17 | 21.8% |
| High School | 7 | 9.0% |
| College / Undergraduate | 3 | 3.8% |
| Graduate / Professional | 0 | 0.0% |
| Total | 78 | 100.0% |
School Enrollment by Age by Funding Source in Dixie Inn
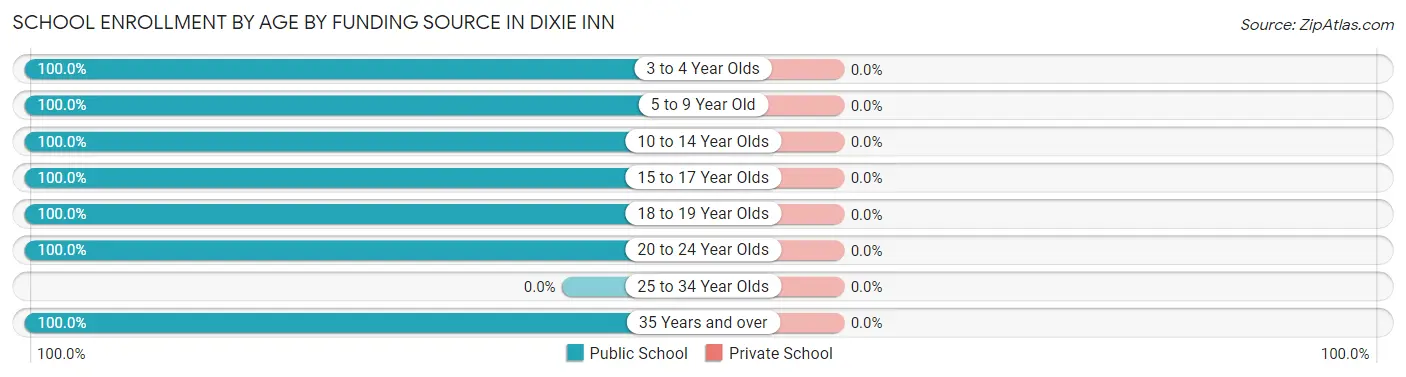
| Age Bracket | Public School | Private School |
| 3 to 4 Year Olds | 15 (100.0%) | 0 (0.0%) |
| 5 to 9 Year Old | 28 (100.0%) | 0 (0.0%) |
| 10 to 14 Year Olds | 29 (100.0%) | 0 (0.0%) |
| 15 to 17 Year Olds | 2 (100.0%) | 0 (0.0%) |
| 18 to 19 Year Olds | 1 (100.0%) | 0 (0.0%) |
| 20 to 24 Year Olds | 1 (100.0%) | 0 (0.0%) |
| 25 to 34 Year Olds | 0 (0.0%) | 0 (0.0%) |
| 35 Years and over | 2 (100.0%) | 0 (0.0%) |
| Total | 78 (100.0%) | 0 (0.0%) |
Educational Attainment by Field of Study in Dixie Inn
Science & technology (3 | 60.0%), and arts & humanities (2 | 40.0%) are the most common fields of study among 5 individuals in Dixie Inn who have obtained a bachelor's degree or higher.
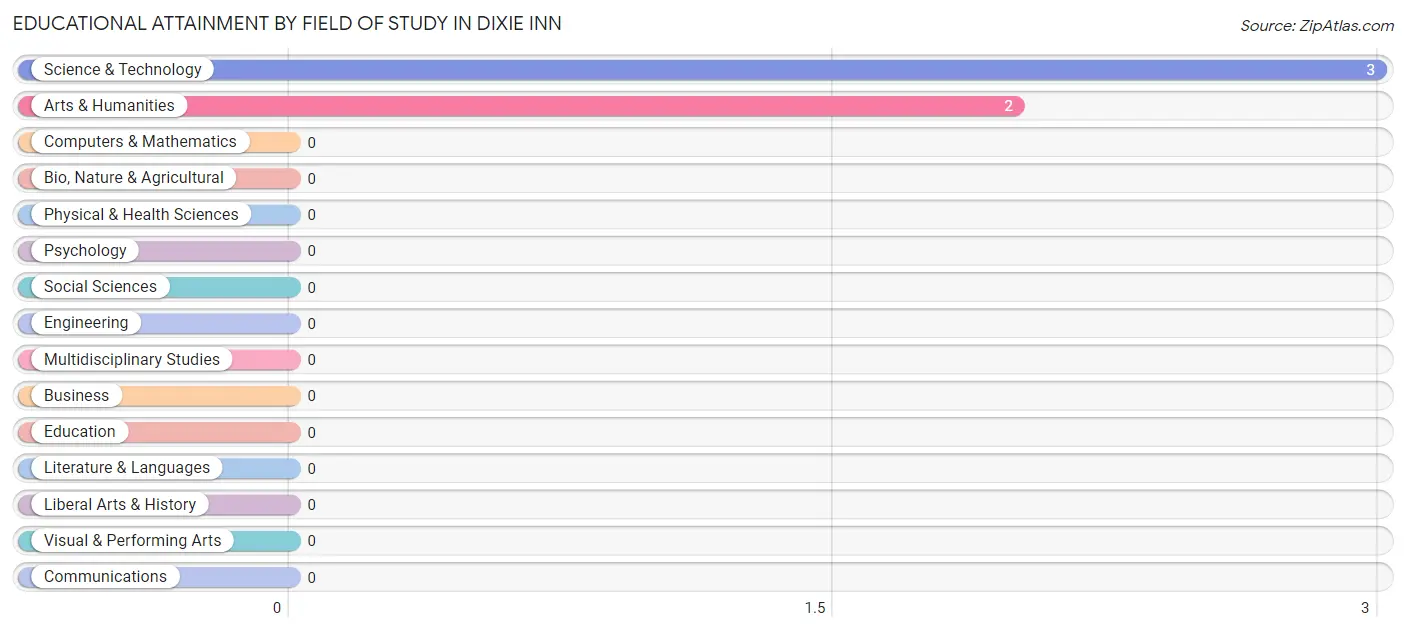
| Field of Study | # Graduates | % Graduates |
| Computers & Mathematics | 0 | 0.0% |
| Bio, Nature & Agricultural | 0 | 0.0% |
| Physical & Health Sciences | 0 | 0.0% |
| Psychology | 0 | 0.0% |
| Social Sciences | 0 | 0.0% |
| Engineering | 0 | 0.0% |
| Multidisciplinary Studies | 0 | 0.0% |
| Science & Technology | 3 | 60.0% |
| Business | 0 | 0.0% |
| Education | 0 | 0.0% |
| Literature & Languages | 0 | 0.0% |
| Liberal Arts & History | 0 | 0.0% |
| Visual & Performing Arts | 0 | 0.0% |
| Communications | 0 | 0.0% |
| Arts & Humanities | 2 | 40.0% |
| Total | 5 | 100.0% |
Transportation & Commute in Dixie Inn
Vehicle Availability by Sex in Dixie Inn
The most prevalent vehicle ownership categories in Dixie Inn are males with 2 vehicles (18, accounting for 56.2%) and females with 2 vehicles (19, making up 32.7%).
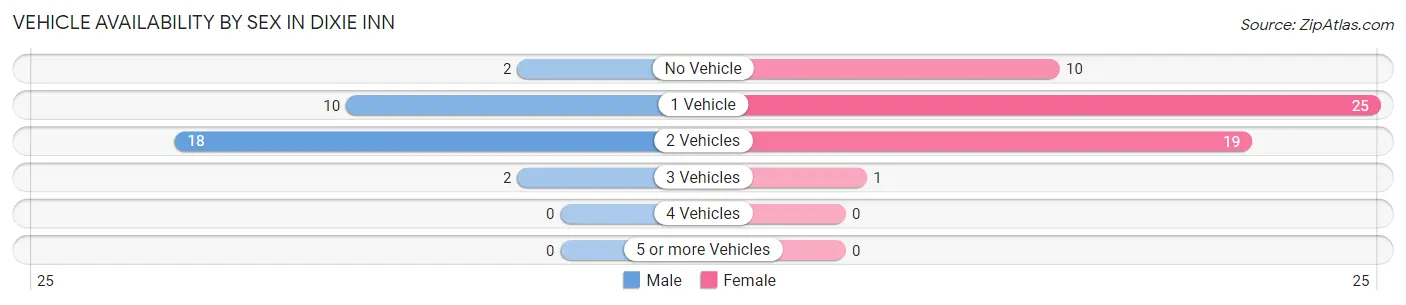
| Vehicles Available | Male | Female |
| No Vehicle | 2 (6.2%) | 10 (18.2%) |
| 1 Vehicle | 10 (31.2%) | 25 (45.5%) |
| 2 Vehicles | 18 (56.2%) | 19 (34.5%) |
| 3 Vehicles | 2 (6.2%) | 1 (1.8%) |
| 4 Vehicles | 0 (0.0%) | 0 (0.0%) |
| 5 or more Vehicles | 0 (0.0%) | 0 (0.0%) |
| Total | 32 (100.0%) | 55 (100.0%) |
Commute Time in Dixie Inn
The most frequently occuring commute durations in Dixie Inn are 10 to 14 minutes (30 commuters, 34.5%), 5 to 9 minutes (14 commuters, 16.1%), and 15 to 19 minutes (13 commuters, 14.9%).
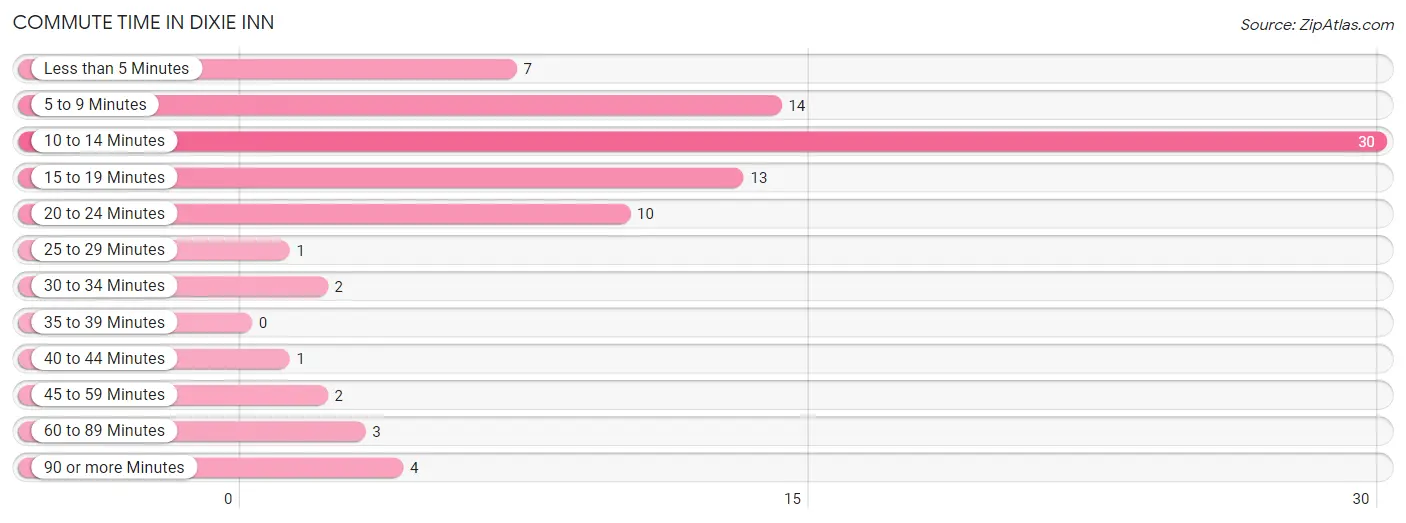
| Commute Time | # Commuters | % Commuters |
| Less than 5 Minutes | 7 | 8.1% |
| 5 to 9 Minutes | 14 | 16.1% |
| 10 to 14 Minutes | 30 | 34.5% |
| 15 to 19 Minutes | 13 | 14.9% |
| 20 to 24 Minutes | 10 | 11.5% |
| 25 to 29 Minutes | 1 | 1.1% |
| 30 to 34 Minutes | 2 | 2.3% |
| 35 to 39 Minutes | 0 | 0.0% |
| 40 to 44 Minutes | 1 | 1.1% |
| 45 to 59 Minutes | 2 | 2.3% |
| 60 to 89 Minutes | 3 | 3.5% |
| 90 or more Minutes | 4 | 4.6% |
Commute Time by Sex in Dixie Inn
The most common commute times in Dixie Inn are 5 to 9 minutes (9 commuters, 28.1%) for males and 10 to 14 minutes (25 commuters, 45.5%) for females.
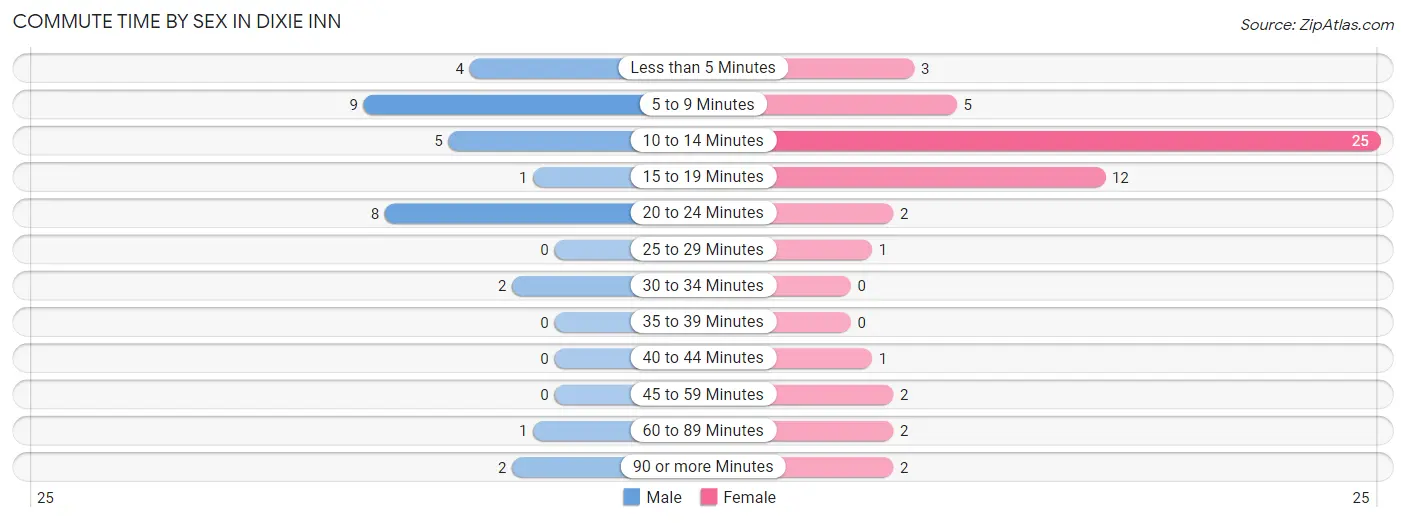
| Commute Time | Male | Female |
| Less than 5 Minutes | 4 (12.5%) | 3 (5.4%) |
| 5 to 9 Minutes | 9 (28.1%) | 5 (9.1%) |
| 10 to 14 Minutes | 5 (15.6%) | 25 (45.5%) |
| 15 to 19 Minutes | 1 (3.1%) | 12 (21.8%) |
| 20 to 24 Minutes | 8 (25.0%) | 2 (3.6%) |
| 25 to 29 Minutes | 0 (0.0%) | 1 (1.8%) |
| 30 to 34 Minutes | 2 (6.2%) | 0 (0.0%) |
| 35 to 39 Minutes | 0 (0.0%) | 0 (0.0%) |
| 40 to 44 Minutes | 0 (0.0%) | 1 (1.8%) |
| 45 to 59 Minutes | 0 (0.0%) | 2 (3.6%) |
| 60 to 89 Minutes | 1 (3.1%) | 2 (3.6%) |
| 90 or more Minutes | 2 (6.2%) | 2 (3.6%) |
Time of Departure to Work by Sex in Dixie Inn
The most frequent times of departure to work in Dixie Inn are 9:00 AM to 9:59 AM (11, 34.4%) for males and 4:00 PM to 11:59 PM (14, 25.5%) for females.
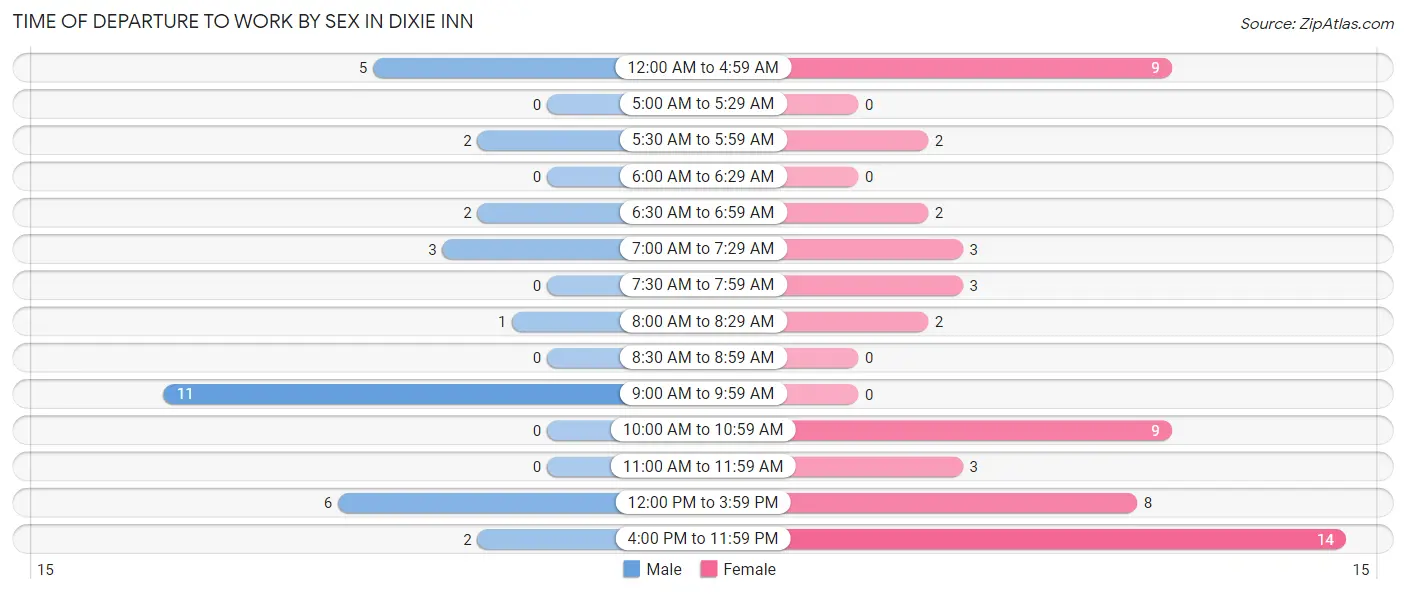
| Time of Departure | Male | Female |
| 12:00 AM to 4:59 AM | 5 (15.6%) | 9 (16.4%) |
| 5:00 AM to 5:29 AM | 0 (0.0%) | 0 (0.0%) |
| 5:30 AM to 5:59 AM | 2 (6.2%) | 2 (3.6%) |
| 6:00 AM to 6:29 AM | 0 (0.0%) | 0 (0.0%) |
| 6:30 AM to 6:59 AM | 2 (6.2%) | 2 (3.6%) |
| 7:00 AM to 7:29 AM | 3 (9.4%) | 3 (5.4%) |
| 7:30 AM to 7:59 AM | 0 (0.0%) | 3 (5.4%) |
| 8:00 AM to 8:29 AM | 1 (3.1%) | 2 (3.6%) |
| 8:30 AM to 8:59 AM | 0 (0.0%) | 0 (0.0%) |
| 9:00 AM to 9:59 AM | 11 (34.4%) | 0 (0.0%) |
| 10:00 AM to 10:59 AM | 0 (0.0%) | 9 (16.4%) |
| 11:00 AM to 11:59 AM | 0 (0.0%) | 3 (5.4%) |
| 12:00 PM to 3:59 PM | 6 (18.8%) | 8 (14.5%) |
| 4:00 PM to 11:59 PM | 2 (6.2%) | 14 (25.5%) |
| Total | 32 (100.0%) | 55 (100.0%) |
Housing Occupancy in Dixie Inn
Occupancy by Ownership in Dixie Inn
Of the total 111 dwellings in Dixie Inn, owner-occupied units account for 31 (27.9%), while renter-occupied units make up 80 (72.1%).
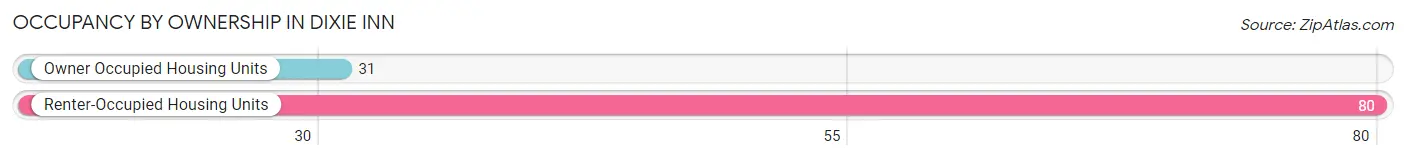
| Occupancy | # Housing Units | % Housing Units |
| Owner Occupied Housing Units | 31 | 27.9% |
| Renter-Occupied Housing Units | 80 | 72.1% |
| Total Occupied Housing Units | 111 | 100.0% |
Occupancy by Household Size in Dixie Inn
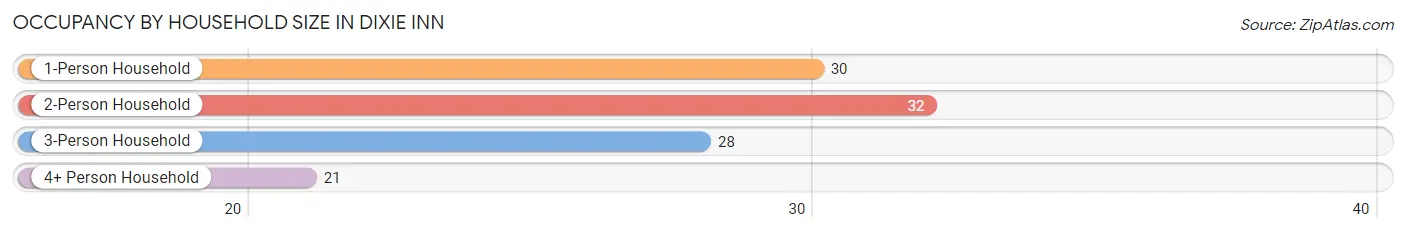
| Household Size | # Housing Units | % Housing Units |
| 1-Person Household | 30 | 27.0% |
| 2-Person Household | 32 | 28.8% |
| 3-Person Household | 28 | 25.2% |
| 4+ Person Household | 21 | 18.9% |
| Total Housing Units | 111 | 100.0% |
Occupancy by Ownership by Household Size in Dixie Inn
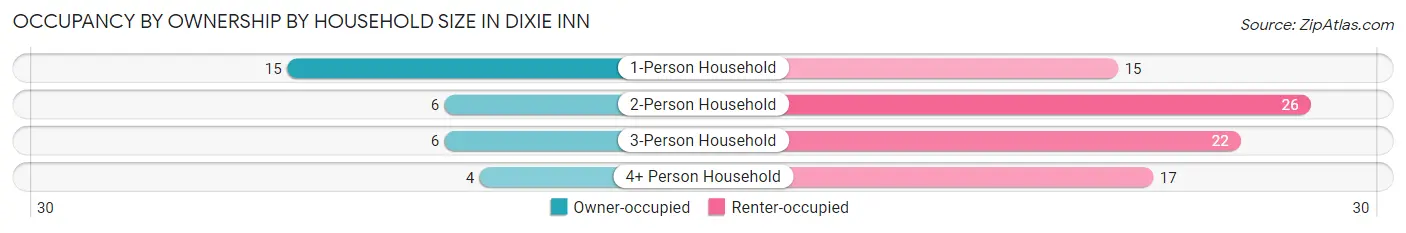
| Household Size | Owner-occupied | Renter-occupied |
| 1-Person Household | 15 (50.0%) | 15 (50.0%) |
| 2-Person Household | 6 (18.8%) | 26 (81.2%) |
| 3-Person Household | 6 (21.4%) | 22 (78.6%) |
| 4+ Person Household | 4 (19.1%) | 17 (80.9%) |
| Total Housing Units | 31 (27.9%) | 80 (72.1%) |
Occupancy by Educational Attainment in Dixie Inn
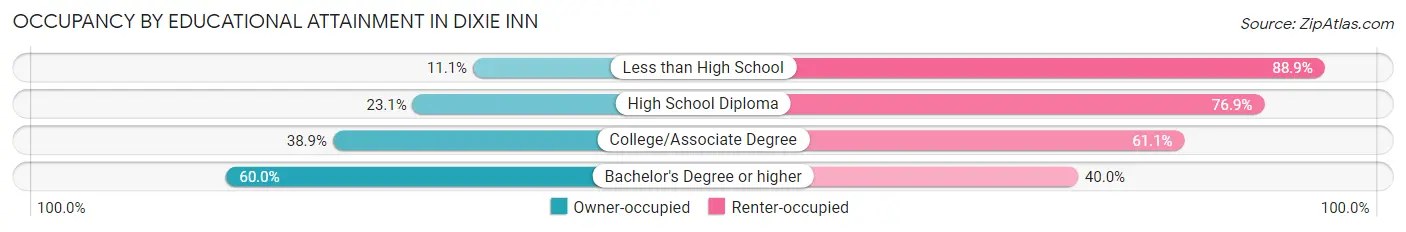
| Household Size | Owner-occupied | Renter-occupied |
| Less than High School | 2 (11.1%) | 16 (88.9%) |
| High School Diploma | 12 (23.1%) | 40 (76.9%) |
| College/Associate Degree | 14 (38.9%) | 22 (61.1%) |
| Bachelor's Degree or higher | 3 (60.0%) | 2 (40.0%) |
Occupancy by Age of Householder in Dixie Inn
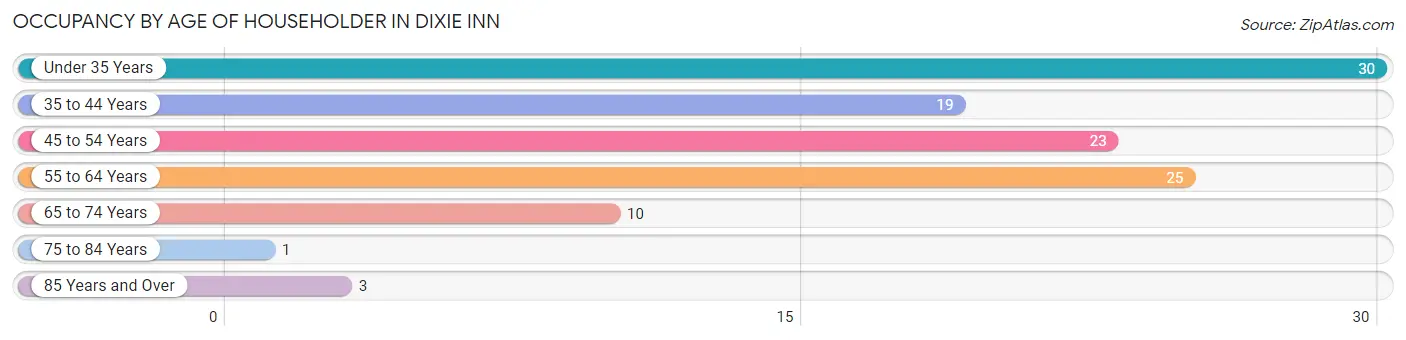
| Age Bracket | # Households | % Households |
| Under 35 Years | 30 | 27.0% |
| 35 to 44 Years | 19 | 17.1% |
| 45 to 54 Years | 23 | 20.7% |
| 55 to 64 Years | 25 | 22.5% |
| 65 to 74 Years | 10 | 9.0% |
| 75 to 84 Years | 1 | 0.9% |
| 85 Years and Over | 3 | 2.7% |
| Total | 111 | 100.0% |
Housing Finances in Dixie Inn
Median Income by Occupancy in Dixie Inn
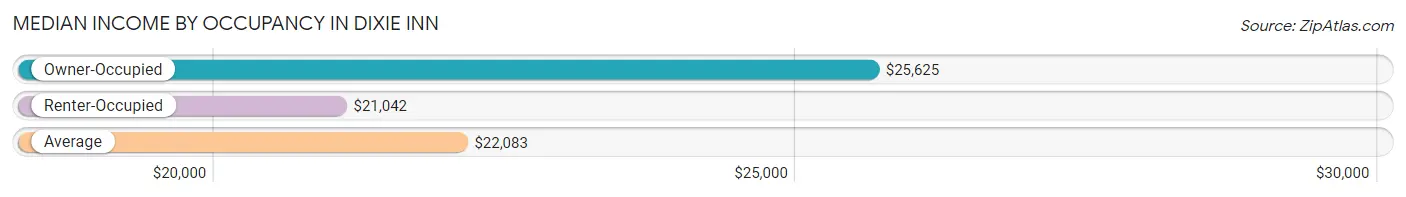
| Occupancy Type | # Households | Median Income |
| Owner-Occupied | 31 (27.9%) | $25,625 |
| Renter-Occupied | 80 (72.1%) | $21,042 |
| Average | 111 (100.0%) | $22,083 |
Occupancy by Householder Income Bracket in Dixie Inn
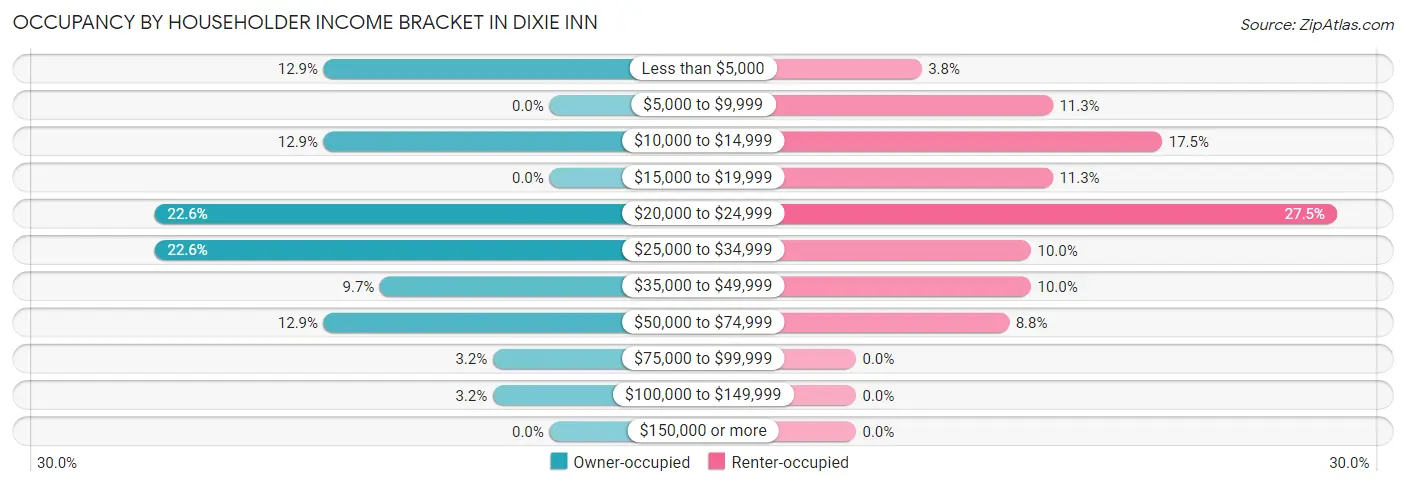
| Income Bracket | Owner-occupied | Renter-occupied |
| Less than $5,000 | 4 (12.9%) | 3 (3.7%) |
| $5,000 to $9,999 | 0 (0.0%) | 9 (11.3%) |
| $10,000 to $14,999 | 4 (12.9%) | 14 (17.5%) |
| $15,000 to $19,999 | 0 (0.0%) | 9 (11.3%) |
| $20,000 to $24,999 | 7 (22.6%) | 22 (27.5%) |
| $25,000 to $34,999 | 7 (22.6%) | 8 (10.0%) |
| $35,000 to $49,999 | 3 (9.7%) | 8 (10.0%) |
| $50,000 to $74,999 | 4 (12.9%) | 7 (8.7%) |
| $75,000 to $99,999 | 1 (3.2%) | 0 (0.0%) |
| $100,000 to $149,999 | 1 (3.2%) | 0 (0.0%) |
| $150,000 or more | 0 (0.0%) | 0 (0.0%) |
| Total | 31 (100.0%) | 80 (100.0%) |
Monthly Housing Cost Tiers in Dixie Inn
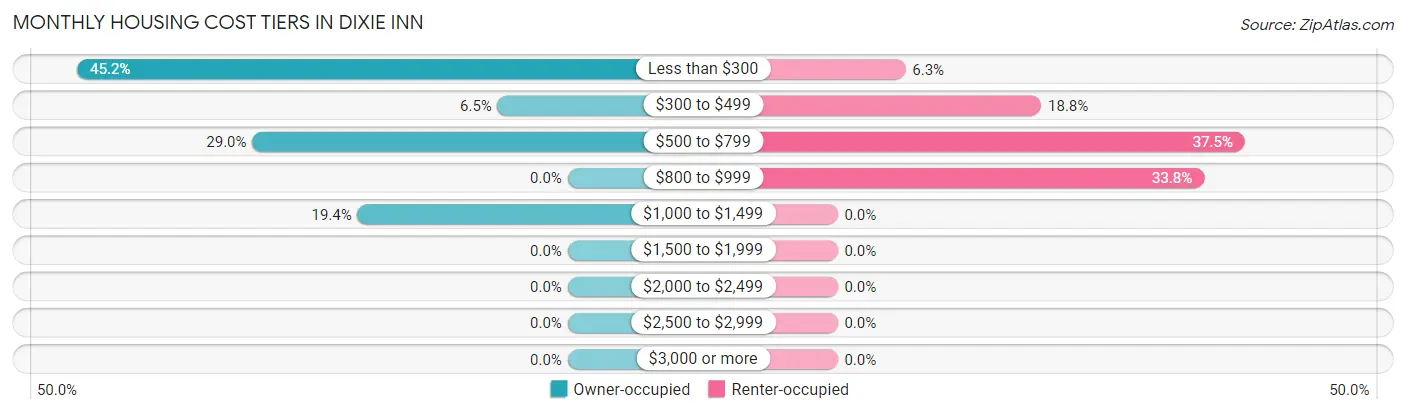
| Monthly Cost | Owner-occupied | Renter-occupied |
| Less than $300 | 14 (45.2%) | 5 (6.2%) |
| $300 to $499 | 2 (6.5%) | 15 (18.8%) |
| $500 to $799 | 9 (29.0%) | 30 (37.5%) |
| $800 to $999 | 0 (0.0%) | 27 (33.8%) |
| $1,000 to $1,499 | 6 (19.4%) | 0 (0.0%) |
| $1,500 to $1,999 | 0 (0.0%) | 0 (0.0%) |
| $2,000 to $2,499 | 0 (0.0%) | 0 (0.0%) |
| $2,500 to $2,999 | 0 (0.0%) | 0 (0.0%) |
| $3,000 or more | 0 (0.0%) | 0 (0.0%) |
| Total | 31 (100.0%) | 80 (100.0%) |
Physical Housing Characteristics in Dixie Inn
Housing Structures in Dixie Inn
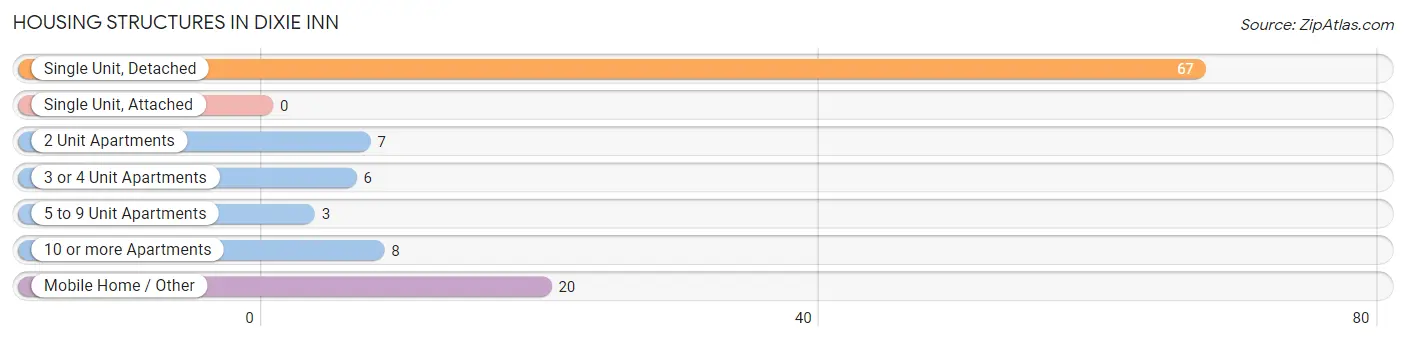
| Structure Type | # Housing Units | % Housing Units |
| Single Unit, Detached | 67 | 60.4% |
| Single Unit, Attached | 0 | 0.0% |
| 2 Unit Apartments | 7 | 6.3% |
| 3 or 4 Unit Apartments | 6 | 5.4% |
| 5 to 9 Unit Apartments | 3 | 2.7% |
| 10 or more Apartments | 8 | 7.2% |
| Mobile Home / Other | 20 | 18.0% |
| Total | 111 | 100.0% |
Housing Structures by Occupancy in Dixie Inn
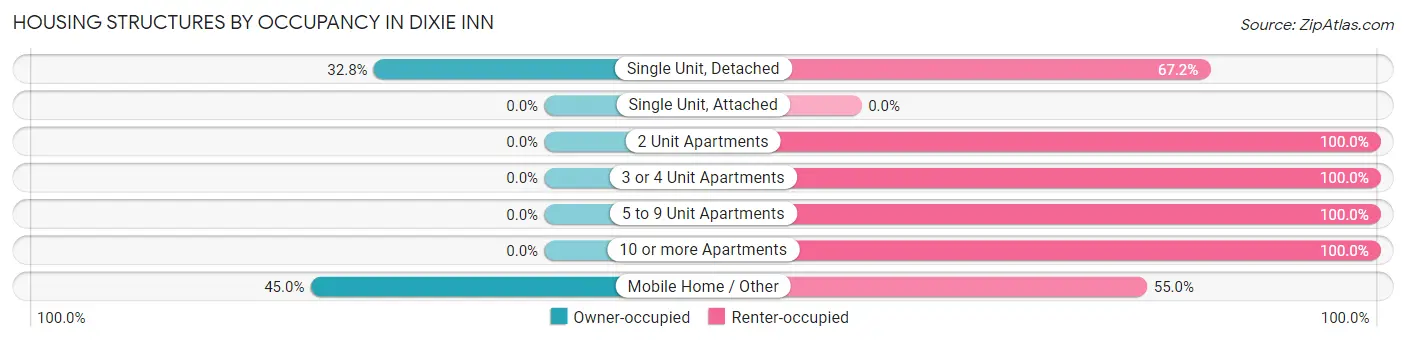
| Structure Type | Owner-occupied | Renter-occupied |
| Single Unit, Detached | 22 (32.8%) | 45 (67.2%) |
| Single Unit, Attached | 0 (0.0%) | 0 (0.0%) |
| 2 Unit Apartments | 0 (0.0%) | 7 (100.0%) |
| 3 or 4 Unit Apartments | 0 (0.0%) | 6 (100.0%) |
| 5 to 9 Unit Apartments | 0 (0.0%) | 3 (100.0%) |
| 10 or more Apartments | 0 (0.0%) | 8 (100.0%) |
| Mobile Home / Other | 9 (45.0%) | 11 (55.0%) |
| Total | 31 (27.9%) | 80 (72.1%) |
Housing Structures by Number of Rooms in Dixie Inn
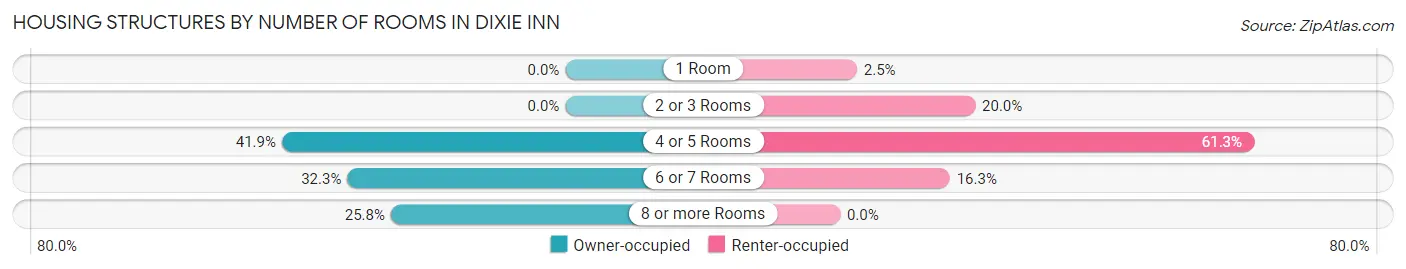
| Number of Rooms | Owner-occupied | Renter-occupied |
| 1 Room | 0 (0.0%) | 2 (2.5%) |
| 2 or 3 Rooms | 0 (0.0%) | 16 (20.0%) |
| 4 or 5 Rooms | 13 (41.9%) | 49 (61.3%) |
| 6 or 7 Rooms | 10 (32.3%) | 13 (16.3%) |
| 8 or more Rooms | 8 (25.8%) | 0 (0.0%) |
| Total | 31 (100.0%) | 80 (100.0%) |
Housing Structure by Heating Type in Dixie Inn
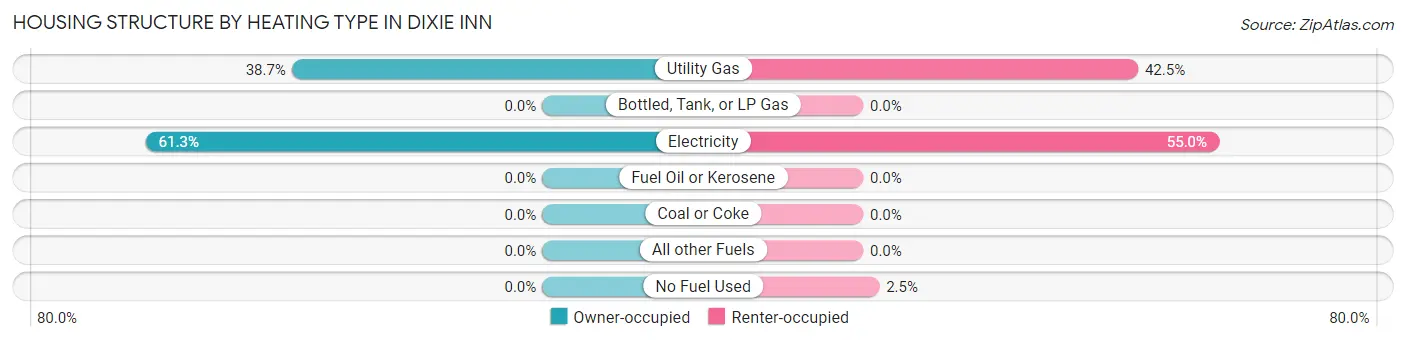
| Heating Type | Owner-occupied | Renter-occupied |
| Utility Gas | 12 (38.7%) | 34 (42.5%) |
| Bottled, Tank, or LP Gas | 0 (0.0%) | 0 (0.0%) |
| Electricity | 19 (61.3%) | 44 (55.0%) |
| Fuel Oil or Kerosene | 0 (0.0%) | 0 (0.0%) |
| Coal or Coke | 0 (0.0%) | 0 (0.0%) |
| All other Fuels | 0 (0.0%) | 0 (0.0%) |
| No Fuel Used | 0 (0.0%) | 2 (2.5%) |
| Total | 31 (100.0%) | 80 (100.0%) |
Household Vehicle Usage in Dixie Inn
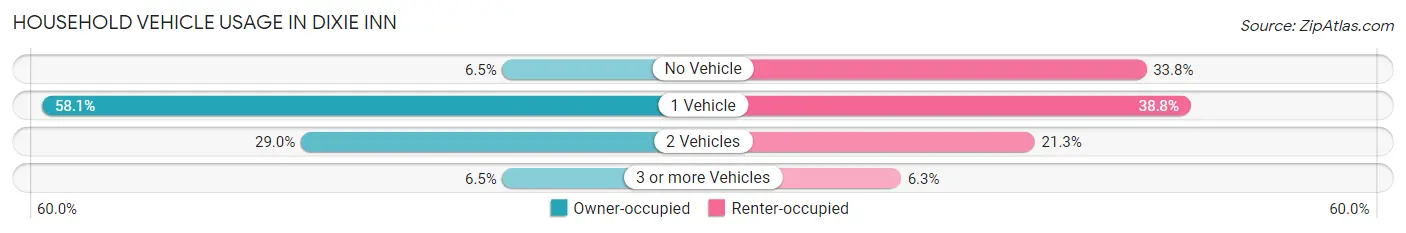
| Vehicles per Household | Owner-occupied | Renter-occupied |
| No Vehicle | 2 (6.5%) | 27 (33.8%) |
| 1 Vehicle | 18 (58.1%) | 31 (38.8%) |
| 2 Vehicles | 9 (29.0%) | 17 (21.2%) |
| 3 or more Vehicles | 2 (6.5%) | 5 (6.2%) |
| Total | 31 (100.0%) | 80 (100.0%) |
Real Estate & Mortgages in Dixie Inn
Real Estate and Mortgage Overview in Dixie Inn
| Characteristic | Without Mortgage | With Mortgage |
| Housing Units | 21 | 10 |
| Median Property Value | $39,500 | $96,000 |
| Median Household Income | $22,083 | $0 |
| Monthly Housing Costs | $265 | $0 |
| Real Estate Taxes | - | - |
Property Value by Mortgage Status in Dixie Inn
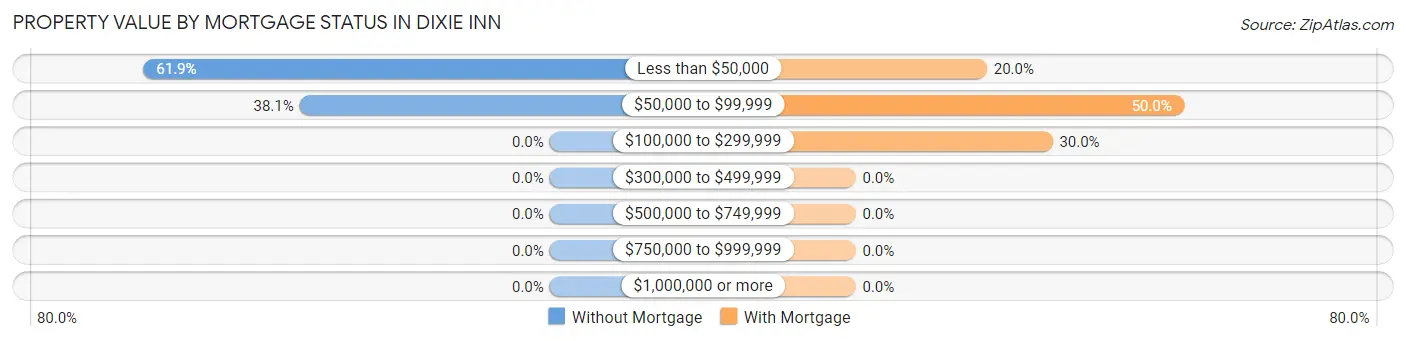
| Property Value | Without Mortgage | With Mortgage |
| Less than $50,000 | 13 (61.9%) | 2 (20.0%) |
| $50,000 to $99,999 | 8 (38.1%) | 5 (50.0%) |
| $100,000 to $299,999 | 0 (0.0%) | 3 (30.0%) |
| $300,000 to $499,999 | 0 (0.0%) | 0 (0.0%) |
| $500,000 to $749,999 | 0 (0.0%) | 0 (0.0%) |
| $750,000 to $999,999 | 0 (0.0%) | 0 (0.0%) |
| $1,000,000 or more | 0 (0.0%) | 0 (0.0%) |
| Total | 21 (100.0%) | 10 (100.0%) |
Household Income by Mortgage Status in Dixie Inn
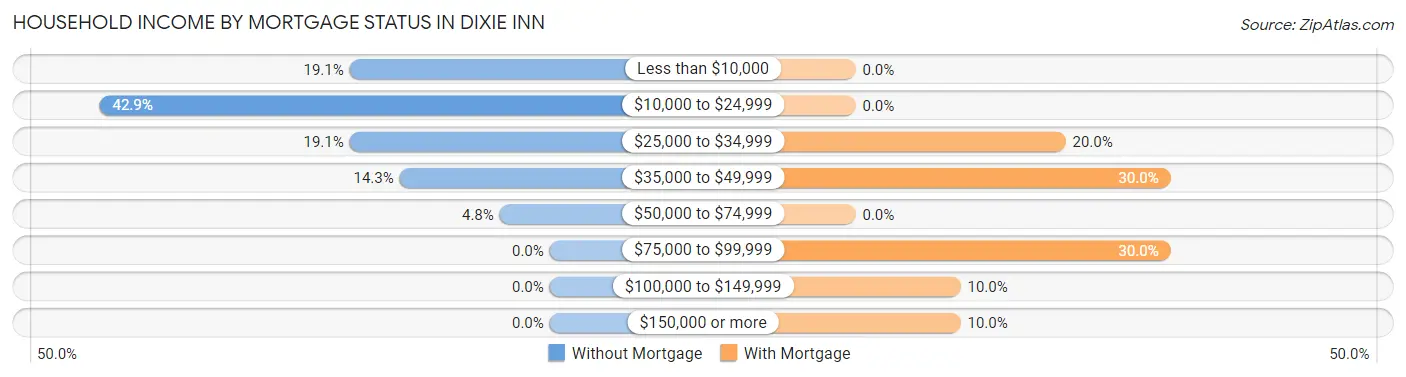
| Household Income | Without Mortgage | With Mortgage |
| Less than $10,000 | 4 (19.1%) | 0 (0.0%) |
| $10,000 to $24,999 | 9 (42.9%) | 0 (0.0%) |
| $25,000 to $34,999 | 4 (19.1%) | 2 (20.0%) |
| $35,000 to $49,999 | 3 (14.3%) | 3 (30.0%) |
| $50,000 to $74,999 | 1 (4.8%) | 0 (0.0%) |
| $75,000 to $99,999 | 0 (0.0%) | 3 (30.0%) |
| $100,000 to $149,999 | 0 (0.0%) | 1 (10.0%) |
| $150,000 or more | 0 (0.0%) | 1 (10.0%) |
| Total | 21 (100.0%) | 10 (100.0%) |
Property Value to Household Income Ratio in Dixie Inn
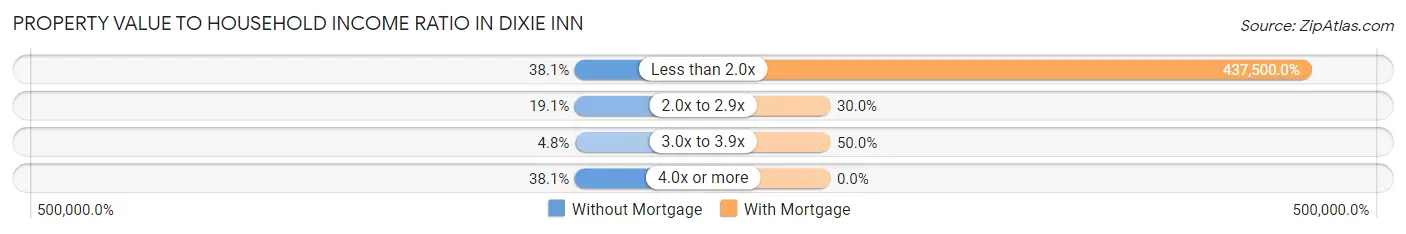
| Value-to-Income Ratio | Without Mortgage | With Mortgage |
| Less than 2.0x | 8 (38.1%) | 43,750 (437,500.0%) |
| 2.0x to 2.9x | 4 (19.1%) | 3 (30.0%) |
| 3.0x to 3.9x | 1 (4.8%) | 5 (50.0%) |
| 4.0x or more | 8 (38.1%) | 0 (0.0%) |
| Total | 21 (100.0%) | 10 (100.0%) |
Real Estate Taxes by Mortgage Status in Dixie Inn
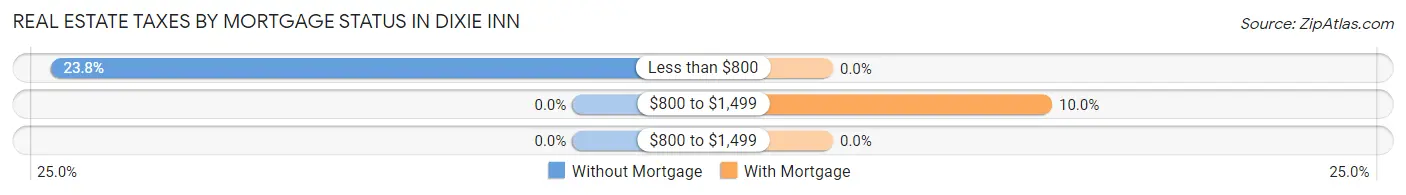
| Property Taxes | Without Mortgage | With Mortgage |
| Less than $800 | 5 (23.8%) | 0 (0.0%) |
| $800 to $1,499 | 0 (0.0%) | 1 (10.0%) |
| $800 to $1,499 | 0 (0.0%) | 0 (0.0%) |
| Total | 21 (100.0%) | 10 (100.0%) |
Health & Disability in Dixie Inn
Health Insurance Coverage by Age in Dixie Inn
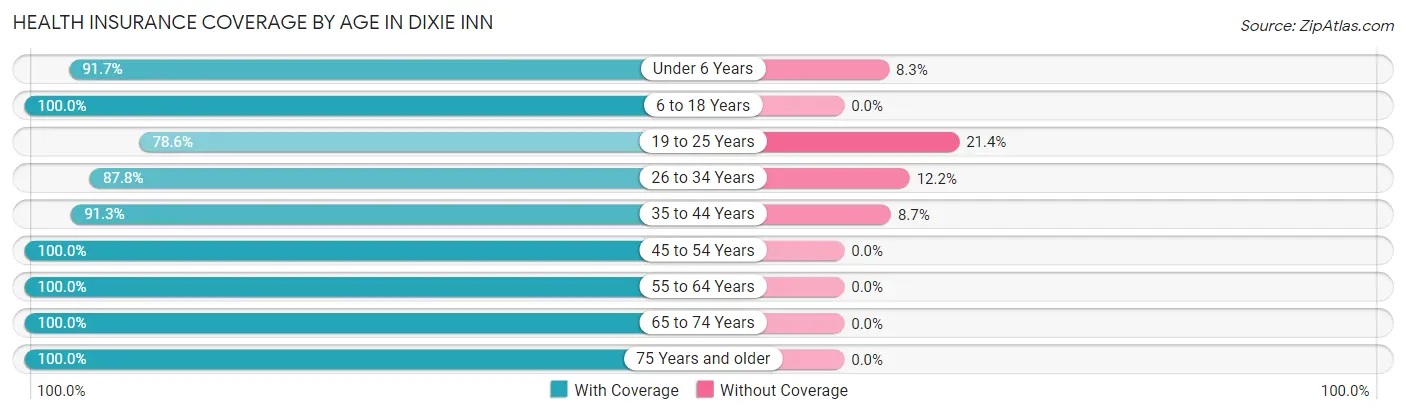
| Age Bracket | With Coverage | Without Coverage |
| Under 6 Years | 33 (91.7%) | 3 (8.3%) |
| 6 to 18 Years | 58 (100.0%) | 0 (0.0%) |
| 19 to 25 Years | 22 (78.6%) | 6 (21.4%) |
| 26 to 34 Years | 36 (87.8%) | 5 (12.2%) |
| 35 to 44 Years | 21 (91.3%) | 2 (8.7%) |
| 45 to 54 Years | 29 (100.0%) | 0 (0.0%) |
| 55 to 64 Years | 28 (100.0%) | 0 (0.0%) |
| 65 to 74 Years | 18 (100.0%) | 0 (0.0%) |
| 75 Years and older | 4 (100.0%) | 0 (0.0%) |
| Total | 249 (94.0%) | 16 (6.0%) |
Health Insurance Coverage by Citizenship Status in Dixie Inn
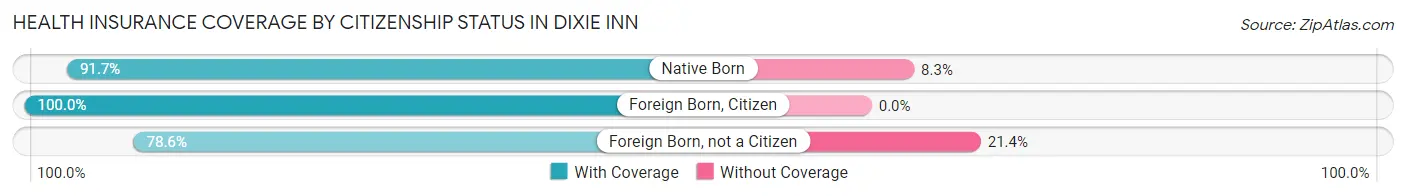
| Citizenship Status | With Coverage | Without Coverage |
| Native Born | 33 (91.7%) | 3 (8.3%) |
| Foreign Born, Citizen | 58 (100.0%) | 0 (0.0%) |
| Foreign Born, not a Citizen | 22 (78.6%) | 6 (21.4%) |
Health Insurance Coverage by Household Income in Dixie Inn
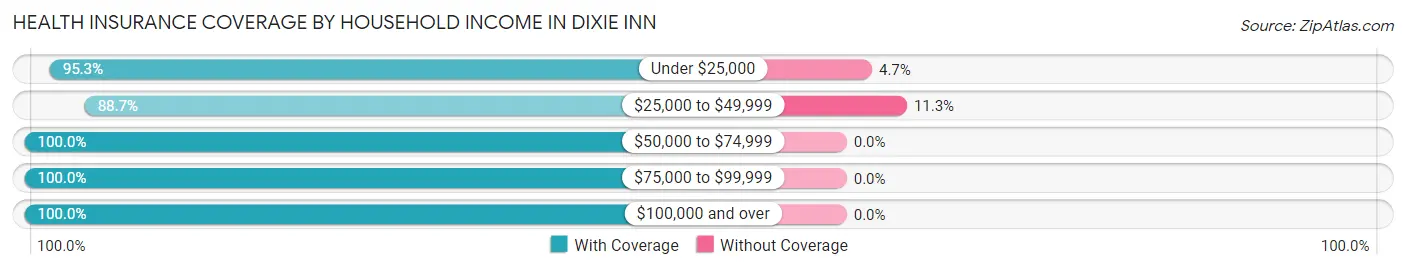
| Household Income | With Coverage | Without Coverage |
| Under $25,000 | 161 (95.3%) | 8 (4.7%) |
| $25,000 to $49,999 | 63 (88.7%) | 8 (11.3%) |
| $50,000 to $74,999 | 20 (100.0%) | 0 (0.0%) |
| $75,000 to $99,999 | 3 (100.0%) | 0 (0.0%) |
| $100,000 and over | 2 (100.0%) | 0 (0.0%) |
Public vs Private Health Insurance Coverage by Age in Dixie Inn
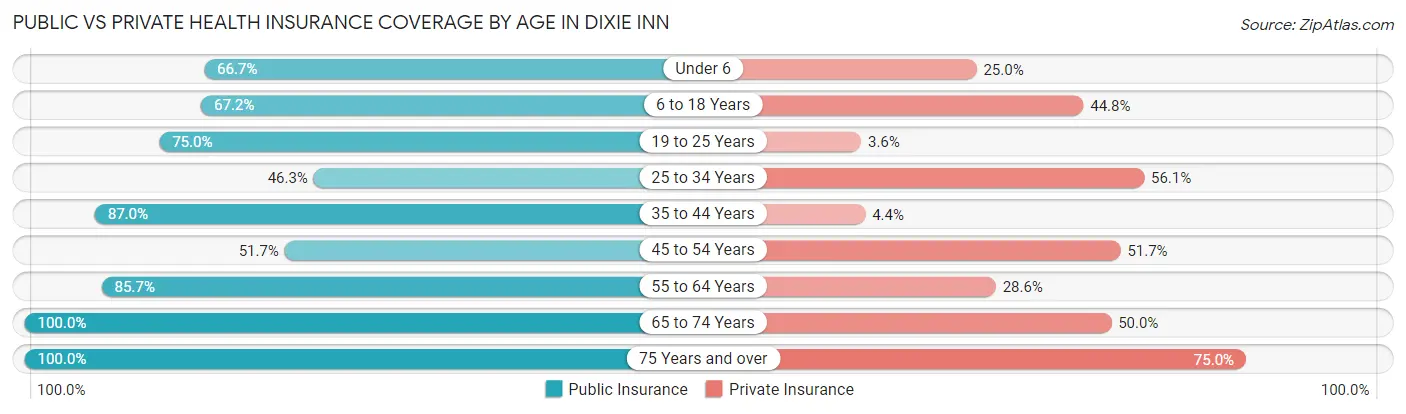
| Age Bracket | Public Insurance | Private Insurance |
| Under 6 | 24 (66.7%) | 9 (25.0%) |
| 6 to 18 Years | 39 (67.2%) | 26 (44.8%) |
| 19 to 25 Years | 21 (75.0%) | 1 (3.6%) |
| 25 to 34 Years | 19 (46.3%) | 23 (56.1%) |
| 35 to 44 Years | 20 (87.0%) | 1 (4.3%) |
| 45 to 54 Years | 15 (51.7%) | 15 (51.7%) |
| 55 to 64 Years | 24 (85.7%) | 8 (28.6%) |
| 65 to 74 Years | 18 (100.0%) | 9 (50.0%) |
| 75 Years and over | 4 (100.0%) | 3 (75.0%) |
| Total | 184 (69.4%) | 95 (35.8%) |
Disability Status by Sex by Age in Dixie Inn
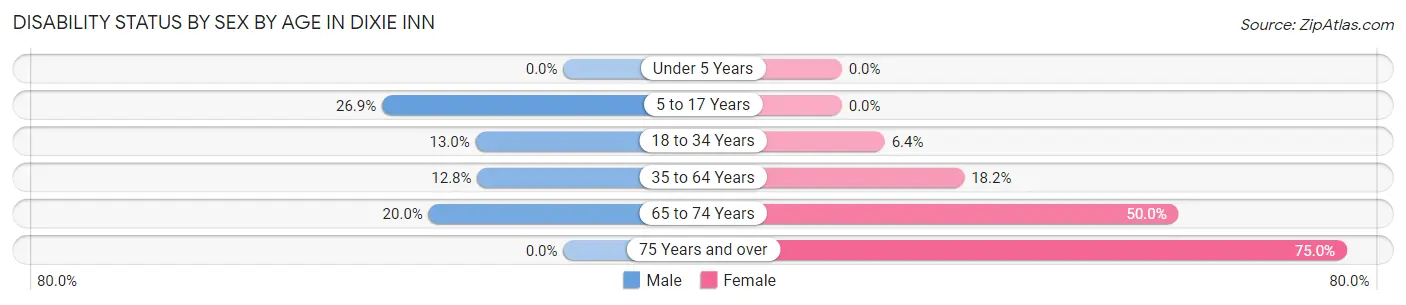
| Age Bracket | Male | Female |
| Under 5 Years | 0 (0.0%) | 0 (0.0%) |
| 5 to 17 Years | 7 (26.9%) | 0 (0.0%) |
| 18 to 34 Years | 3 (13.0%) | 3 (6.4%) |
| 35 to 64 Years | 6 (12.8%) | 6 (18.2%) |
| 65 to 74 Years | 2 (20.0%) | 4 (50.0%) |
| 75 Years and over | 0 (0.0%) | 3 (75.0%) |
Disability Class by Sex by Age in Dixie Inn
Disability Class: Hearing Difficulty
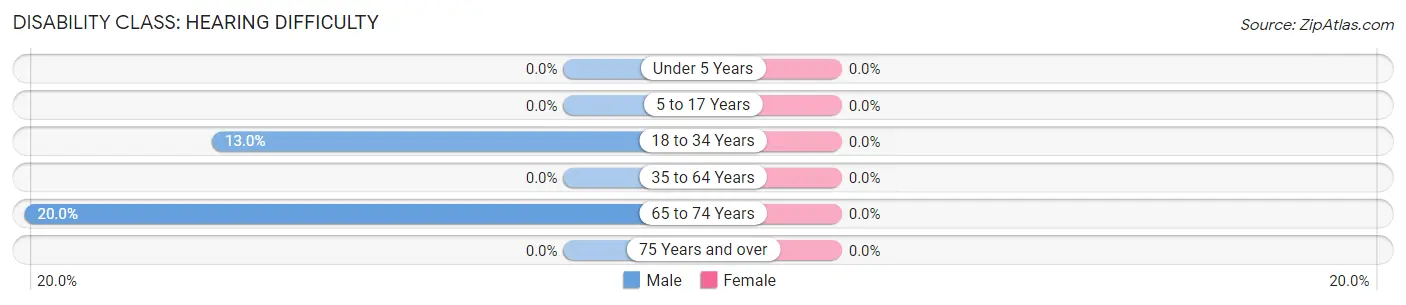
| Age Bracket | Male | Female |
| Under 5 Years | 0 (0.0%) | 0 (0.0%) |
| 5 to 17 Years | 0 (0.0%) | 0 (0.0%) |
| 18 to 34 Years | 3 (13.0%) | 0 (0.0%) |
| 35 to 64 Years | 0 (0.0%) | 0 (0.0%) |
| 65 to 74 Years | 2 (20.0%) | 0 (0.0%) |
| 75 Years and over | 0 (0.0%) | 0 (0.0%) |
Disability Class: Vision Difficulty
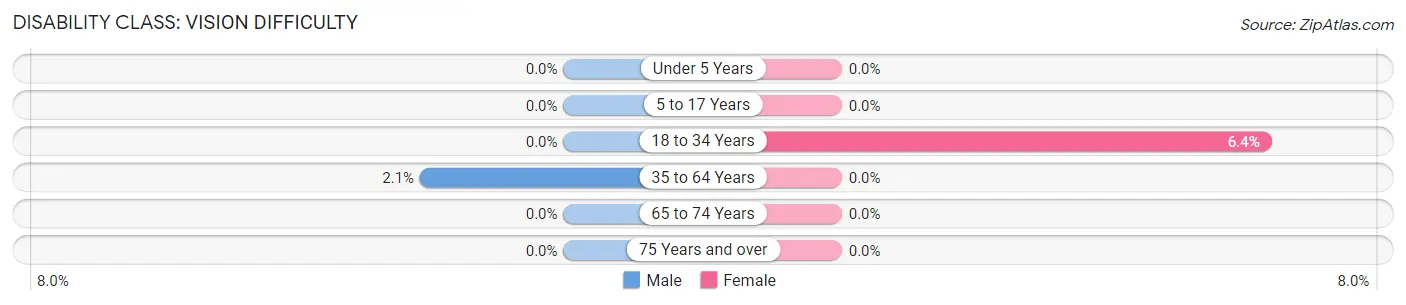
| Age Bracket | Male | Female |
| Under 5 Years | 0 (0.0%) | 0 (0.0%) |
| 5 to 17 Years | 0 (0.0%) | 0 (0.0%) |
| 18 to 34 Years | 0 (0.0%) | 3 (6.4%) |
| 35 to 64 Years | 1 (2.1%) | 0 (0.0%) |
| 65 to 74 Years | 0 (0.0%) | 0 (0.0%) |
| 75 Years and over | 0 (0.0%) | 0 (0.0%) |
Disability Class: Cognitive Difficulty
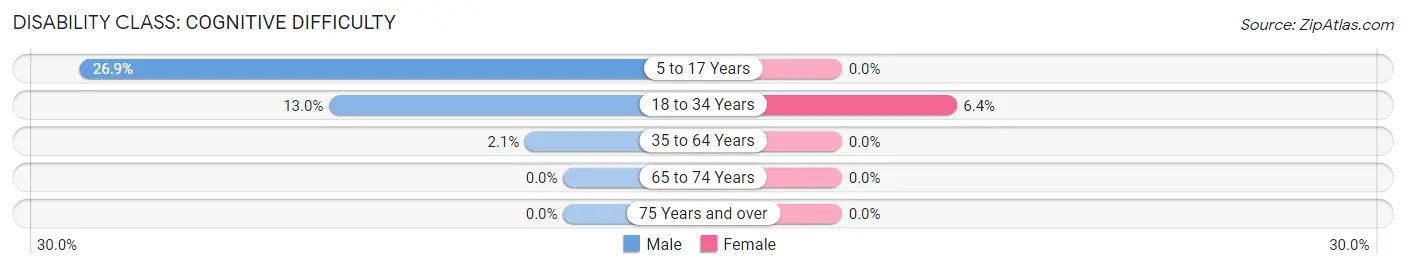
| Age Bracket | Male | Female |
| 5 to 17 Years | 7 (26.9%) | 0 (0.0%) |
| 18 to 34 Years | 3 (13.0%) | 3 (6.4%) |
| 35 to 64 Years | 1 (2.1%) | 0 (0.0%) |
| 65 to 74 Years | 0 (0.0%) | 0 (0.0%) |
| 75 Years and over | 0 (0.0%) | 0 (0.0%) |
Disability Class: Ambulatory Difficulty
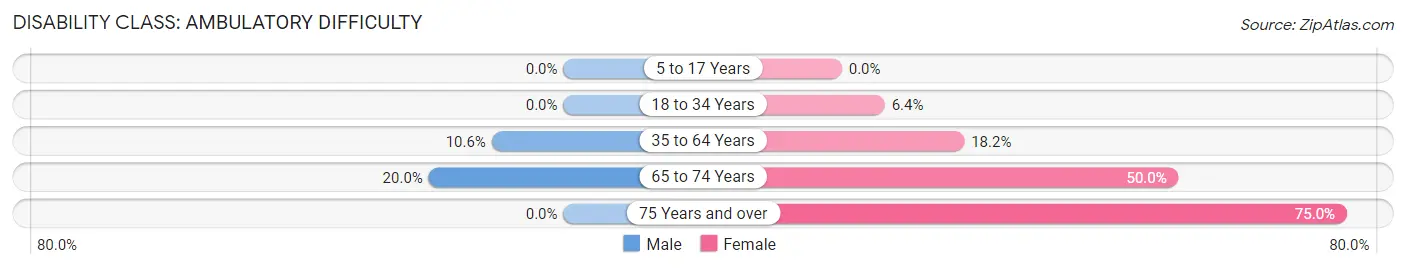
| Age Bracket | Male | Female |
| 5 to 17 Years | 0 (0.0%) | 0 (0.0%) |
| 18 to 34 Years | 0 (0.0%) | 3 (6.4%) |
| 35 to 64 Years | 5 (10.6%) | 6 (18.2%) |
| 65 to 74 Years | 2 (20.0%) | 4 (50.0%) |
| 75 Years and over | 0 (0.0%) | 3 (75.0%) |
Disability Class: Self-Care Difficulty
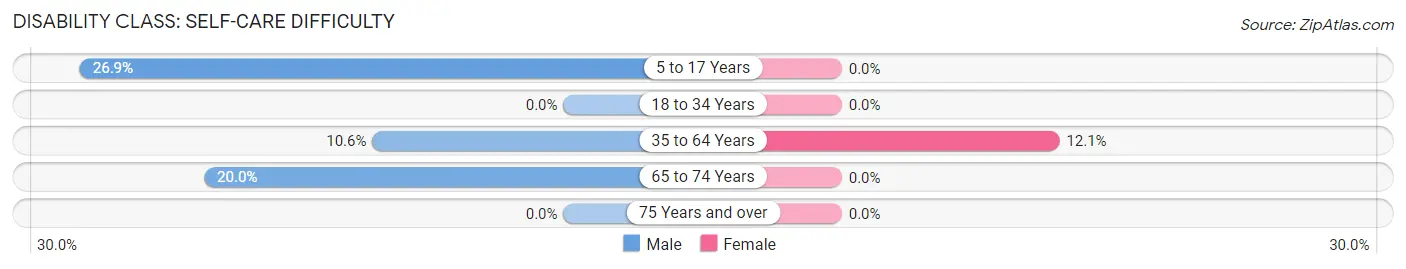
| Age Bracket | Male | Female |
| 5 to 17 Years | 7 (26.9%) | 0 (0.0%) |
| 18 to 34 Years | 0 (0.0%) | 0 (0.0%) |
| 35 to 64 Years | 5 (10.6%) | 4 (12.1%) |
| 65 to 74 Years | 2 (20.0%) | 0 (0.0%) |
| 75 Years and over | 0 (0.0%) | 0 (0.0%) |
Technology Access in Dixie Inn
Computing Device Access in Dixie Inn
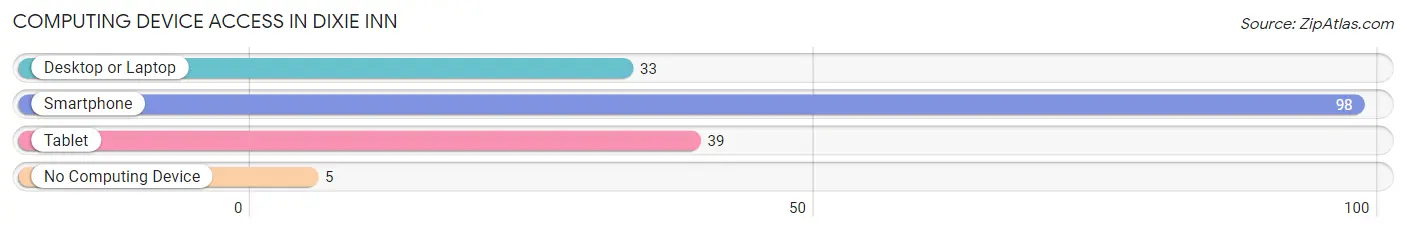
| Device Type | # Households | % Households |
| Desktop or Laptop | 33 | 29.7% |
| Smartphone | 98 | 88.3% |
| Tablet | 39 | 35.1% |
| No Computing Device | 5 | 4.5% |
| Total | 111 | 100.0% |
Internet Access in Dixie Inn
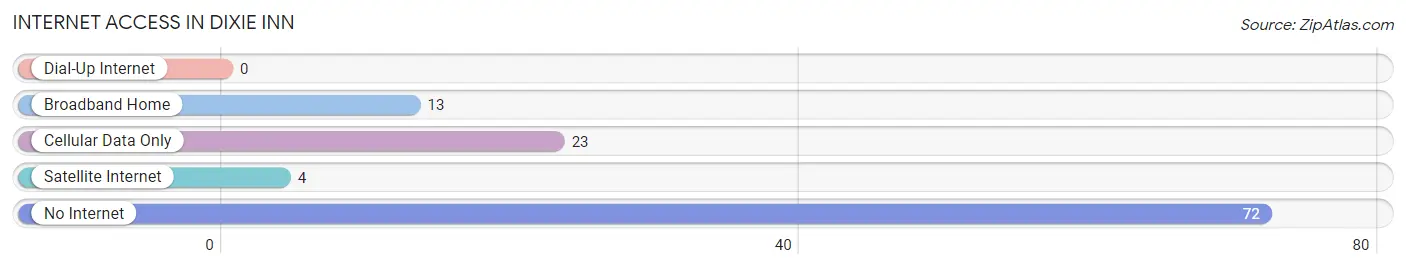
| Internet Type | # Households | % Households |
| Dial-Up Internet | 0 | 0.0% |
| Broadband Home | 13 | 11.7% |
| Cellular Data Only | 23 | 20.7% |
| Satellite Internet | 4 | 3.6% |
| No Internet | 72 | 64.9% |
| Total | 111 | 100.0% |
Dixie Inn Summary
Dixie Inn is a small unincorporated community located in Bossier Parish, Louisiana. It is situated along the Red River, approximately 10 miles south of the city of Shreveport. The population of Dixie Inn was estimated to be 1,845 in the year 2000.
History
Dixie Inn was founded in the late 1800s by a group of settlers from the nearby town of Shreveport. The town was named after the Dixie Inn Hotel, which was built in the area in 1885. The hotel was a popular destination for travelers and was known for its hospitality.
The town of Dixie Inn was officially incorporated in 1902. During the early 1900s, the town was a thriving agricultural community. Cotton, corn, and other crops were grown in the area. The town also had a sawmill and a gristmill.
In the 1920s, the town began to experience a decline in population as many of the residents moved away in search of better economic opportunities. The Great Depression of the 1930s further exacerbated the decline in population.
Geography
Dixie Inn is located in Bossier Parish, Louisiana. It is situated along the Red River, approximately 10 miles south of the city of Shreveport. The town is located in a rural area and is surrounded by farmland. The terrain is mostly flat with some rolling hills.
The climate in Dixie Inn is humid subtropical, with hot, humid summers and mild winters. The average annual temperature is around 70 degrees Fahrenheit. The average annual precipitation is around 50 inches.
Economy
The economy of Dixie Inn is largely based on agriculture. Cotton, corn, and other crops are grown in the area. The town also has a sawmill and a gristmill.
In recent years, the town has seen an increase in tourism. The town is home to several popular attractions, including the Dixie Inn Hotel, the Red River National Wildlife Refuge, and the Dixie Inn Museum.
Demographics
As of the year 2000, the population of Dixie Inn was estimated to be 1,845. The racial makeup of the town was 94.3% White, 4.2% African American, 0.3% Native American, 0.2% Asian, and 0.9% from other races.
The median household income in Dixie Inn was $30,938 in 2000. The per capita income was $15,945. The median age of the population was 37.5 years.
Conclusion
Dixie Inn is a small unincorporated community located in Bossier Parish, Louisiana. It is situated along the Red River, approximately 10 miles south of the city of Shreveport. The population of Dixie Inn was estimated to be 1,845 in the year 2000. The economy of Dixie Inn is largely based on agriculture, with cotton, corn, and other crops being grown in the area. The town also has a sawmill and a gristmill. In recent years, the town has seen an increase in tourism. The racial makeup of the town was 94.3% White, 4.2% African American, 0.3% Native American, 0.2% Asian, and 0.9% from other races. The median household income in Dixie Inn was $30,938 in 2000.
Common Questions
What is Per Capita Income in Dixie Inn?
Per Capita income in Dixie Inn is $10,668.
What is the Median Family Income in Dixie Inn?
Median Family Income in Dixie Inn is $14,519.
What is the Median Household income in Dixie Inn?
Median Household Income in Dixie Inn is $22,083.
What is Income or Wage Gap in Dixie Inn?
Income or Wage Gap in Dixie Inn is 36.4%.
Women in Dixie Inn earn 63.6 cents for every dollar earned by a man.
What is Inequality or Gini Index in Dixie Inn?
Inequality or Gini Index in Dixie Inn is 0.37.
What is the Total Population of Dixie Inn?
Total Population of Dixie Inn is 265.
What is the Total Male Population of Dixie Inn?
Total Male Population of Dixie Inn is 130.
What is the Total Female Population of Dixie Inn?
Total Female Population of Dixie Inn is 135.
What is the Ratio of Males per 100 Females in Dixie Inn?
There are 96.30 Males per 100 Females in Dixie Inn.
What is the Ratio of Females per 100 Males in Dixie Inn?
There are 103.85 Females per 100 Males in Dixie Inn.
What is the Median Population Age in Dixie Inn?
Median Population Age in Dixie Inn is 28.1 Years.
What is the Average Family Size in Dixie Inn
Average Family Size in Dixie Inn is 2.9 People.
What is the Average Household Size in Dixie Inn
Average Household Size in Dixie Inn is 2.4 People.
How Large is the Labor Force in Dixie Inn?
There are 96 People in the Labor Forcein in Dixie Inn.
What is the Percentage of People in the Labor Force in Dixie Inn?
55.8% of People are in the Labor Force in Dixie Inn.
What is the Unemployment Rate in Dixie Inn?
Unemployment Rate in Dixie Inn is 9.4%.