Bryceland, LA Map & Demographics
Bryceland Map
Bryceland Overview
$29,936
PER CAPITA INCOME
$68,086
AVG HOUSEHOLD INCOME
0.25
INEQUALITY / GINI INDEX
207
TOTAL POPULATION
114
MALE POPULATION
93
FEMALE POPULATION
122.58
MALES / 100 FEMALES
81.58
FEMALES / 100 MALES
43.7
MEDIAN AGE
2.9
AVG FAMILY SIZE
2.2
AVG HOUSEHOLD SIZE
131
LABOR FORCE [ PEOPLE ]
67.2%
PERCENT IN LABOR FORCE
5.3%
UNEMPLOYMENT RATE
Bryceland Area Codes
Income in Bryceland
Income Overview in Bryceland
| Characteristic | Number | Measure |
| Per Capita Income | 207 | $29,936 |
| Median Family Income | 36 | $0 |
| Mean Family Income | 36 | $54,856 |
| Median Household Income | 93 | $68,086 |
| Mean Household Income | 93 | $62,945 |
| Income Deficit | 36 | $0 |
| Wage / Income Gap (%) | 207 | 0.00% |
| Wage / Income Gap ($) | 207 | 100.00¢ per $1 |
| Gini / Inequality Index | 207 | 0.25 |
Earnings by Sex in Bryceland
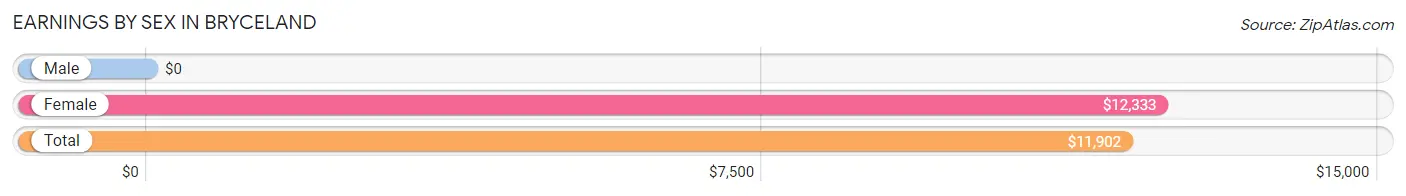
| Sex | Number | Average Earnings |
| Male | 71 (52.6%) | $0 |
| Female | 64 (47.4%) | $12,333 |
| Total | 135 (100.0%) | $11,902 |
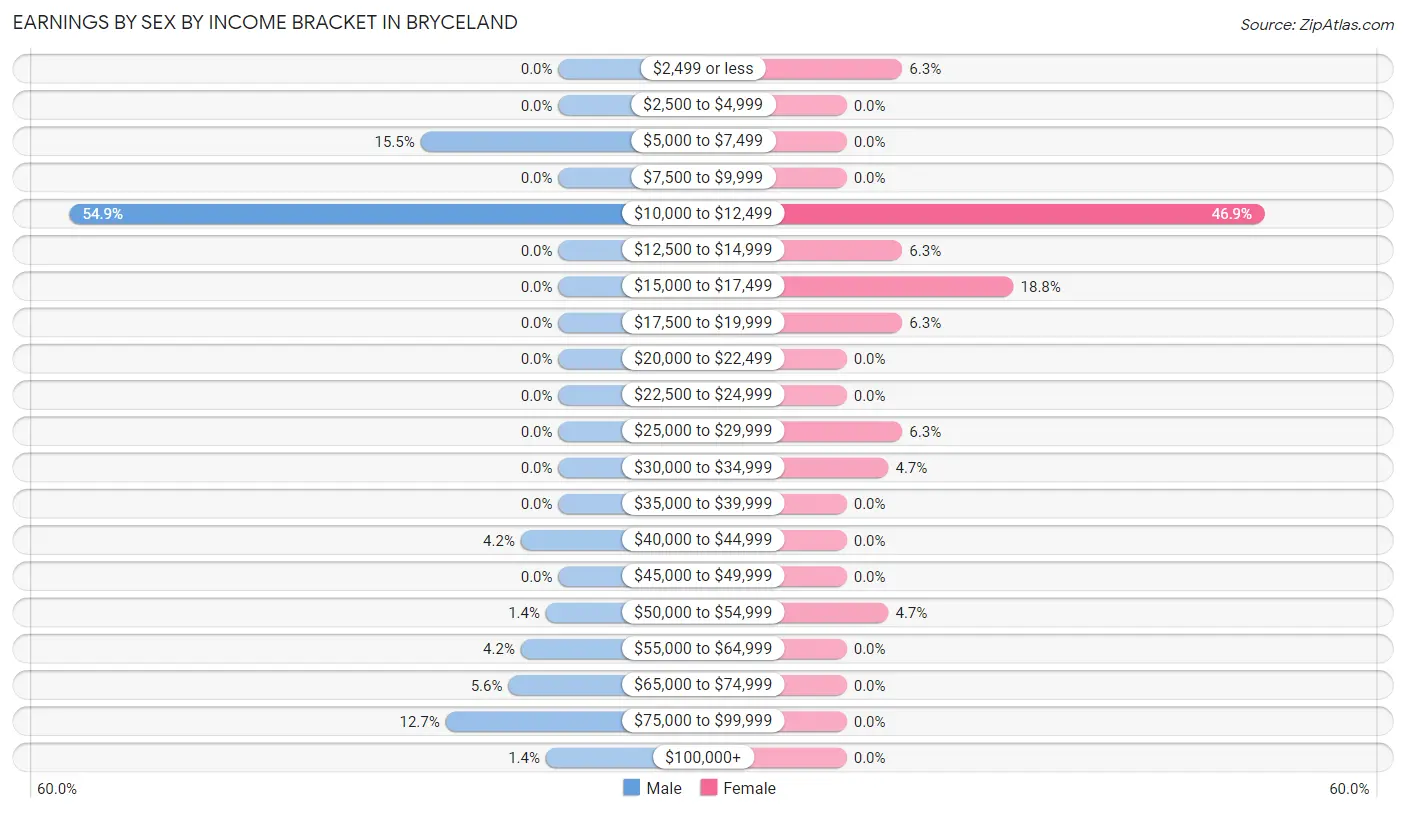
Earnings by Sex by Income Bracket in Bryceland
The most common earnings brackets in Bryceland are $10,000 to $12,499 for men (39 | 54.9%) and $10,000 to $12,499 for women (30 | 46.9%).
| Income | Male | Female |
| $2,499 or less | 0 (0.0%) | 4 (6.2%) |
| $2,500 to $4,999 | 0 (0.0%) | 0 (0.0%) |
| $5,000 to $7,499 | 11 (15.5%) | 0 (0.0%) |
| $7,500 to $9,999 | 0 (0.0%) | 0 (0.0%) |
| $10,000 to $12,499 | 39 (54.9%) | 30 (46.9%) |
| $12,500 to $14,999 | 0 (0.0%) | 4 (6.2%) |
| $15,000 to $17,499 | 0 (0.0%) | 12 (18.8%) |
| $17,500 to $19,999 | 0 (0.0%) | 4 (6.2%) |
| $20,000 to $22,499 | 0 (0.0%) | 0 (0.0%) |
| $22,500 to $24,999 | 0 (0.0%) | 0 (0.0%) |
| $25,000 to $29,999 | 0 (0.0%) | 4 (6.2%) |
| $30,000 to $34,999 | 0 (0.0%) | 3 (4.7%) |
| $35,000 to $39,999 | 0 (0.0%) | 0 (0.0%) |
| $40,000 to $44,999 | 3 (4.2%) | 0 (0.0%) |
| $45,000 to $49,999 | 0 (0.0%) | 0 (0.0%) |
| $50,000 to $54,999 | 1 (1.4%) | 3 (4.7%) |
| $55,000 to $64,999 | 3 (4.2%) | 0 (0.0%) |
| $65,000 to $74,999 | 4 (5.6%) | 0 (0.0%) |
| $75,000 to $99,999 | 9 (12.7%) | 0 (0.0%) |
| $100,000+ | 1 (1.4%) | 0 (0.0%) |
| Total | 71 (100.0%) | 64 (100.0%) |
Earnings by Sex by Educational Attainment in Bryceland
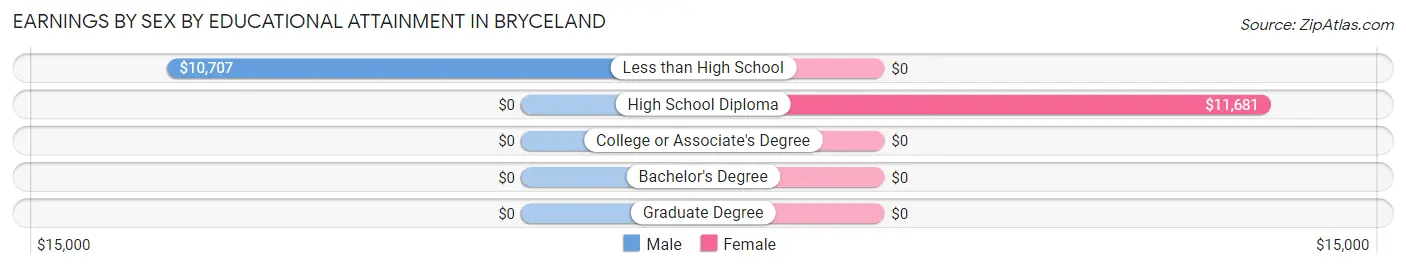
| Educational Attainment | Male Income | Female Income |
| Less than High School | $10,707 | $0 |
| High School Diploma | - | - |
| College or Associate's Degree | - | - |
| Bachelor's Degree | - | - |
| Graduate Degree | - | - |
| Total | - | - |
Family Income in Bryceland
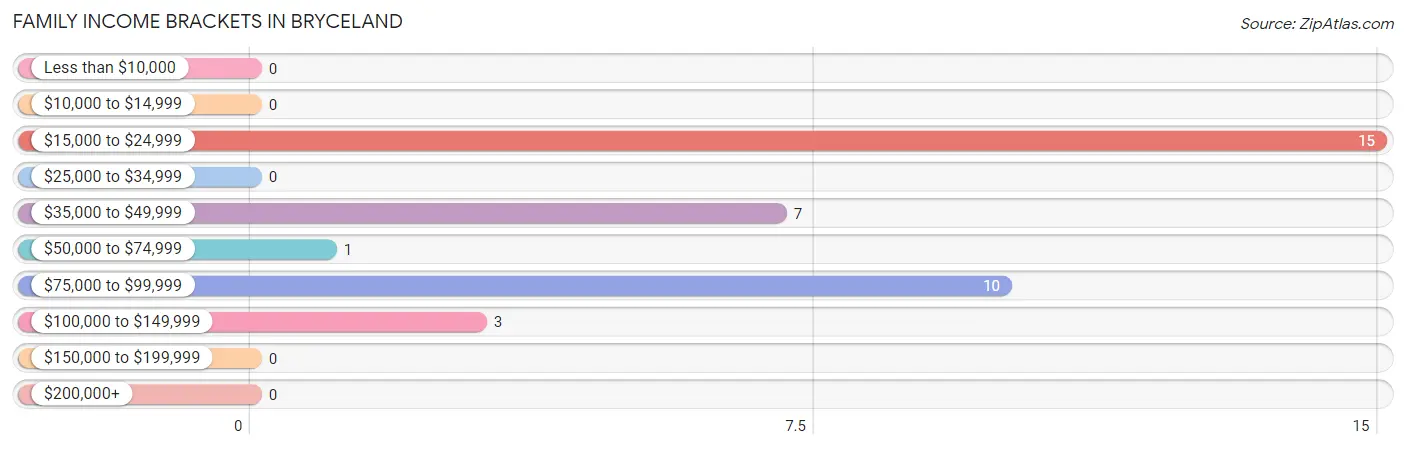
Family Income Brackets in Bryceland
According to the Bryceland family income data, there are 15 families falling into the $15,000 to $24,999 income range, which is the most common income bracket and makes up 41.7% of all families.
| Income Bracket | # Families | % Families |
| Less than $10,000 | 0 | 0.0% |
| $10,000 to $14,999 | 0 | 0.0% |
| $15,000 to $24,999 | 15 | 41.7% |
| $25,000 to $34,999 | 0 | 0.0% |
| $35,000 to $49,999 | 7 | 19.4% |
| $50,000 to $74,999 | 1 | 2.8% |
| $75,000 to $99,999 | 10 | 27.8% |
| $100,000 to $149,999 | 3 | 8.3% |
| $150,000 to $199,999 | 0 | 0.0% |
| $200,000+ | 0 | 0.0% |
Family Income by Famaliy Size in Bryceland
| Income Bracket | # Families | Median Income |
| 2-Person Families | 26 (72.2%) | $0 |
| 3-Person Families | 0 (0.0%) | $0 |
| 4-Person Families | 6 (16.7%) | $0 |
| 5-Person Families | 4 (11.1%) | $0 |
| 6-Person Families | 0 (0.0%) | $0 |
| 7+ Person Families | 0 (0.0%) | $0 |
| Total | 36 (100.0%) | $0 |
Family Income by Number of Earners in Bryceland
| Number of Earners | # Families | Median Income |
| No Earners | 6 (16.7%) | $0 |
| 1 Earner | 7 (19.4%) | $0 |
| 2 Earners | 21 (58.3%) | $0 |
| 3+ Earners | 2 (5.6%) | $0 |
| Total | 36 (100.0%) | $0 |
Household Income in Bryceland
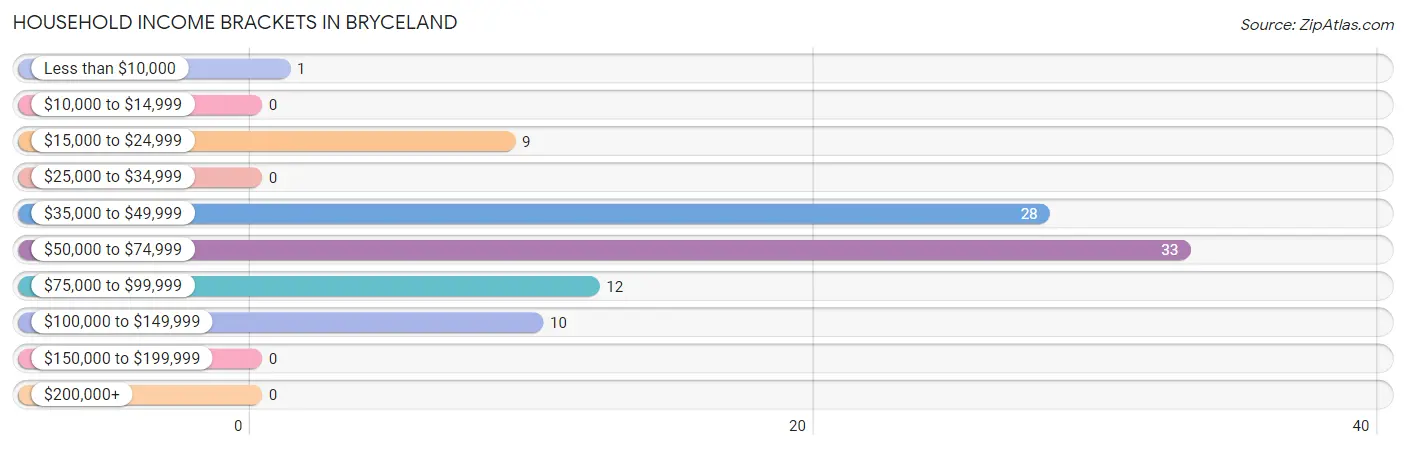
Household Income Brackets in Bryceland
With 33 households falling in the category, the $50,000 to $74,999 income range is the most frequent in Bryceland, accounting for 35.5% of all households.
| Income Bracket | # Households | % Households |
| Less than $10,000 | 1 | 1.1% |
| $10,000 to $14,999 | 0 | 0.0% |
| $15,000 to $24,999 | 9 | 9.7% |
| $25,000 to $34,999 | 0 | 0.0% |
| $35,000 to $49,999 | 28 | 30.1% |
| $50,000 to $74,999 | 33 | 35.5% |
| $75,000 to $99,999 | 12 | 12.9% |
| $100,000 to $149,999 | 10 | 10.8% |
| $150,000 to $199,999 | 0 | 0.0% |
| $200,000+ | 0 | 0.0% |
Household Income by Householder Age in Bryceland
The median household income in Bryceland is $68,086, with the highest median household income of $68,477 found in the 65+ years age bracket for the primary householder. A total of 47 households (50.5%) fall into this category.
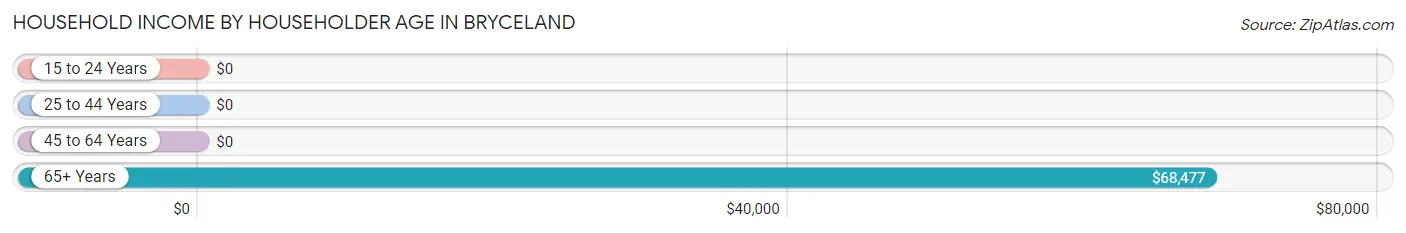
| Income Bracket | # Households | Median Income |
| 15 to 24 Years | 0 (0.0%) | $0 |
| 25 to 44 Years | 28 (30.1%) | $0 |
| 45 to 64 Years | 18 (19.4%) | $0 |
| 65+ Years | 47 (50.5%) | $68,477 |
| Total | 93 (100.0%) | $68,086 |
Poverty in Bryceland
Income Below Poverty by Sex and Age in Bryceland
With 43.9% poverty level for males and 5.4% for females among the residents of Bryceland, 45 to 54 year old males and 55 to 64 year old females are the most vulnerable to poverty, with 16 males (84.2%) and 4 females (36.4%) in their respective age groups living below the poverty level.
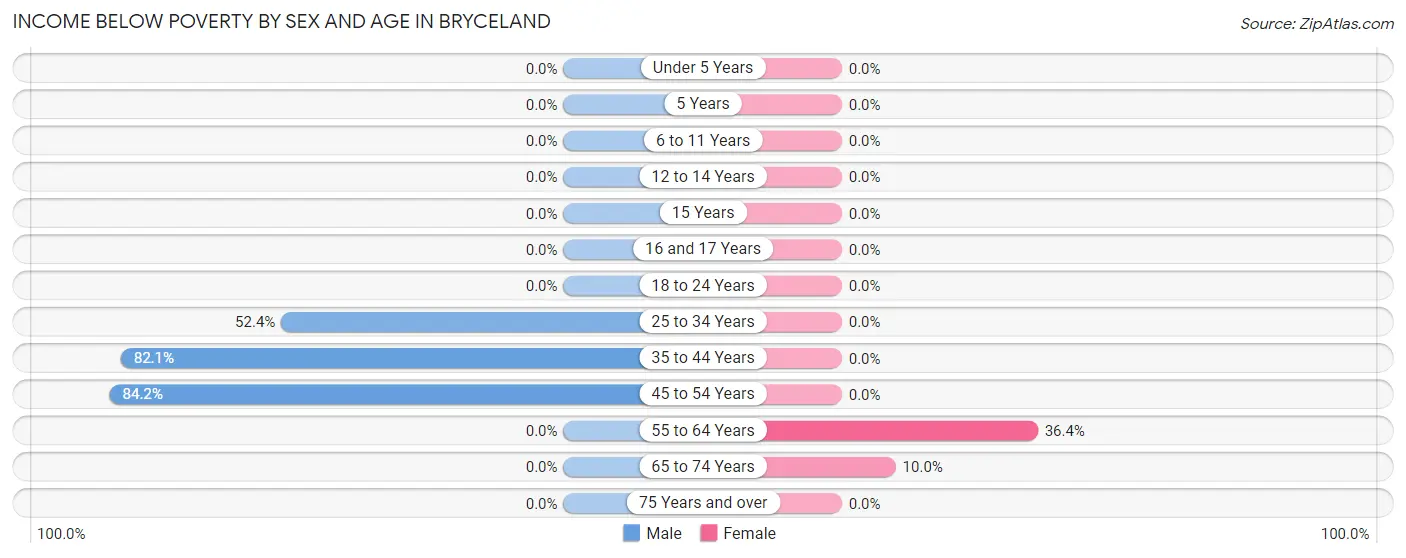
| Age Bracket | Male | Female |
| Under 5 Years | 0 (0.0%) | 0 (0.0%) |
| 5 Years | 0 (0.0%) | 0 (0.0%) |
| 6 to 11 Years | 0 (0.0%) | 0 (0.0%) |
| 12 to 14 Years | 0 (0.0%) | 0 (0.0%) |
| 15 Years | 0 (0.0%) | 0 (0.0%) |
| 16 and 17 Years | 0 (0.0%) | 0 (0.0%) |
| 18 to 24 Years | 0 (0.0%) | 0 (0.0%) |
| 25 to 34 Years | 11 (52.4%) | 0 (0.0%) |
| 35 to 44 Years | 23 (82.1%) | 0 (0.0%) |
| 45 to 54 Years | 16 (84.2%) | 0 (0.0%) |
| 55 to 64 Years | 0 (0.0%) | 4 (36.4%) |
| 65 to 74 Years | 0 (0.0%) | 1 (10.0%) |
| 75 Years and over | 0 (0.0%) | 0 (0.0%) |
| Total | 50 (43.9%) | 5 (5.4%) |
Income Above Poverty by Sex and Age in Bryceland
According to the poverty statistics in Bryceland, males aged under 5 years and females aged under 5 years are the age groups that are most secure financially, with 100.0% of males and 100.0% of females in these age groups living above the poverty line.
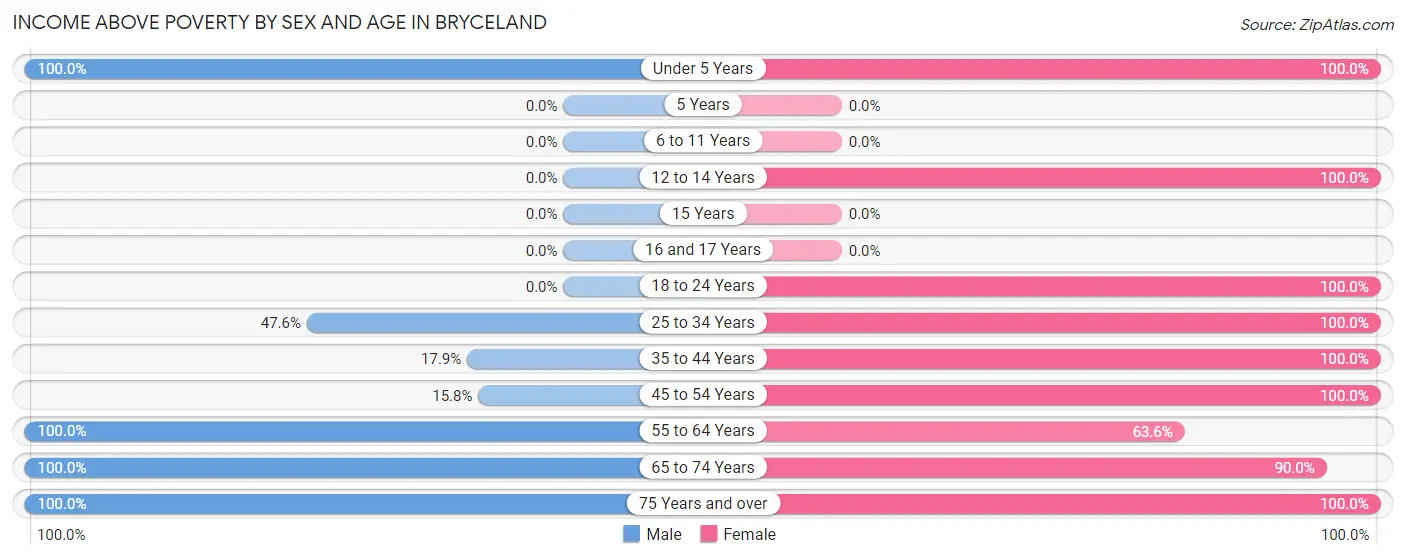
| Age Bracket | Male | Female |
| Under 5 Years | 2 (100.0%) | 5 (100.0%) |
| 5 Years | 0 (0.0%) | 0 (0.0%) |
| 6 to 11 Years | 0 (0.0%) | 0 (0.0%) |
| 12 to 14 Years | 0 (0.0%) | 5 (100.0%) |
| 15 Years | 0 (0.0%) | 0 (0.0%) |
| 16 and 17 Years | 0 (0.0%) | 0 (0.0%) |
| 18 to 24 Years | 0 (0.0%) | 4 (100.0%) |
| 25 to 34 Years | 10 (47.6%) | 8 (100.0%) |
| 35 to 44 Years | 5 (17.9%) | 39 (100.0%) |
| 45 to 54 Years | 3 (15.8%) | 1 (100.0%) |
| 55 to 64 Years | 6 (100.0%) | 7 (63.6%) |
| 65 to 74 Years | 3 (100.0%) | 9 (90.0%) |
| 75 Years and over | 35 (100.0%) | 10 (100.0%) |
| Total | 64 (56.1%) | 88 (94.6%) |
Income Below Poverty Among Married-Couple Families in Bryceland
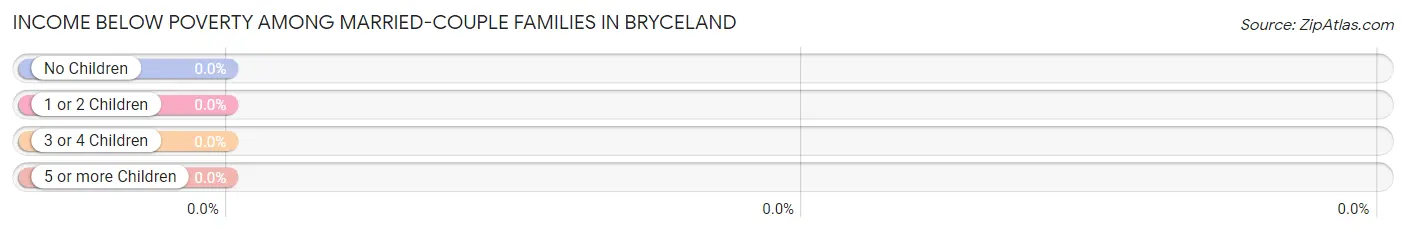
| Children | Above Poverty | Below Poverty |
| No Children | 9 (100.0%) | 0 (0.0%) |
| 1 or 2 Children | 6 (100.0%) | 0 (0.0%) |
| 3 or 4 Children | 4 (100.0%) | 0 (0.0%) |
| 5 or more Children | 0 (0.0%) | 0 (0.0%) |
| Total | 19 (100.0%) | 0 (0.0%) |
Income Below Poverty Among Single-Parent Households in Bryceland
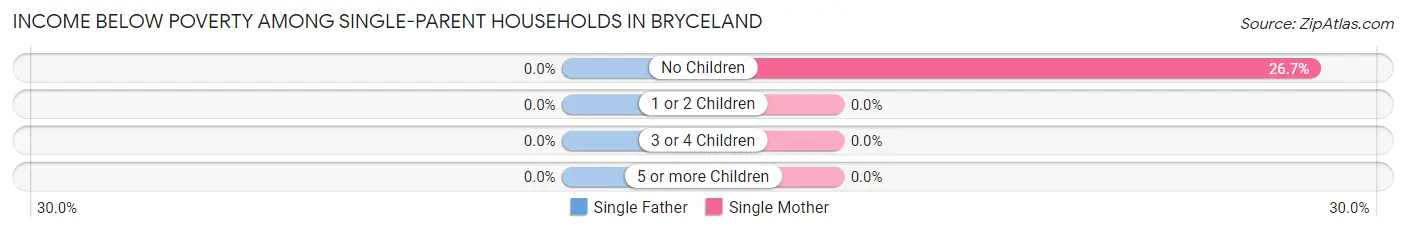
| Children | Single Father | Single Mother |
| No Children | 0 (0.0%) | 4 (26.7%) |
| 1 or 2 Children | 0 (0.0%) | 0 (0.0%) |
| 3 or 4 Children | 0 (0.0%) | 0 (0.0%) |
| 5 or more Children | 0 (0.0%) | 0 (0.0%) |
| Total | 0 (0.0%) | 4 (26.7%) |
Income Below Poverty Among Married-Couple vs Single-Parent Households in Bryceland
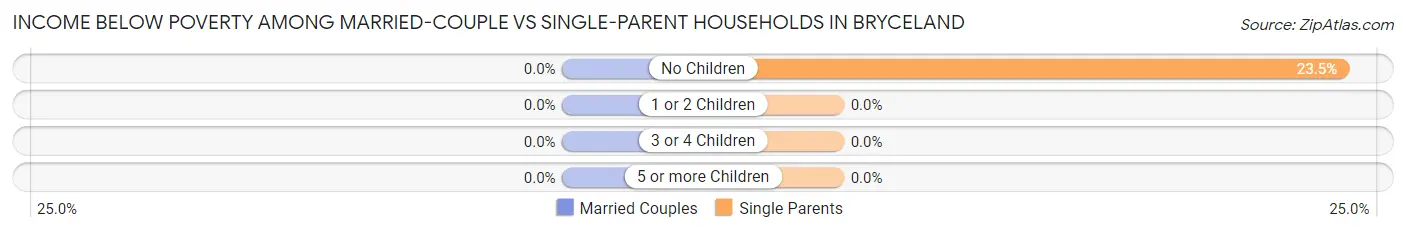
| Children | Married-Couple Families | Single-Parent Households |
| No Children | 0 (0.0%) | 4 (23.5%) |
| 1 or 2 Children | 0 (0.0%) | 0 (0.0%) |
| 3 or 4 Children | 0 (0.0%) | 0 (0.0%) |
| 5 or more Children | 0 (0.0%) | 0 (0.0%) |
| Total | 0 (0.0%) | 4 (23.5%) |
Race in Bryceland
The most populous races in Bryceland are White / Caucasian (130 | 62.8%), Two or more Races (71 | 34.3%), and Hispanic or Latino (68 | 32.9%).
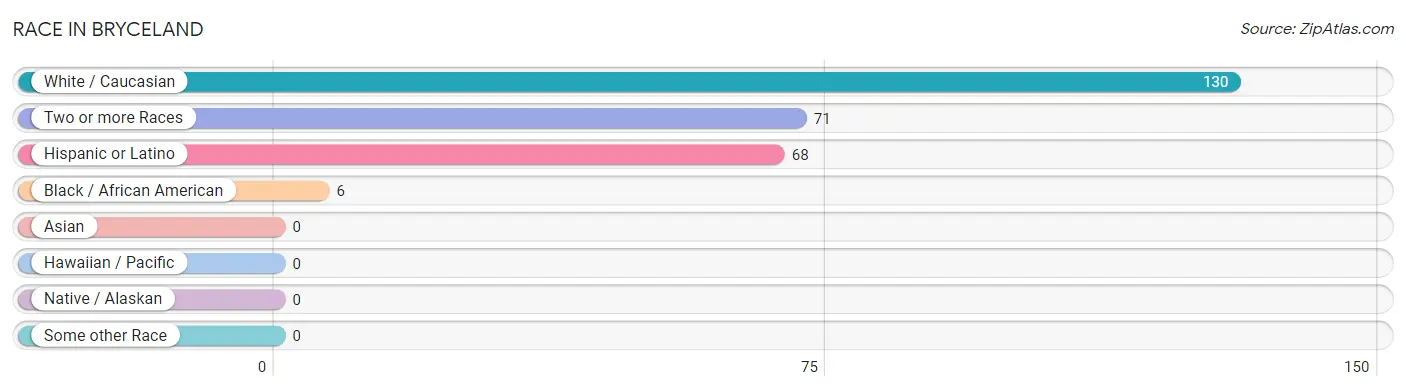
| Race | # Population | % Population |
| Asian | 0 | 0.0% |
| Black / African American | 6 | 2.9% |
| Hawaiian / Pacific | 0 | 0.0% |
| Hispanic or Latino | 68 | 32.9% |
| Native / Alaskan | 0 | 0.0% |
| White / Caucasian | 130 | 62.8% |
| Two or more Races | 71 | 34.3% |
| Some other Race | 0 | 0.0% |
| Total | 207 | 100.0% |
Ancestry in Bryceland
The most populous ancestries reported in Bryceland are Mexican (68 | 32.9%), Irish (61 | 29.5%), German (44 | 21.3%), English (12 | 5.8%), and French (5 | 2.4%), together accounting for 91.8% of all Bryceland residents.
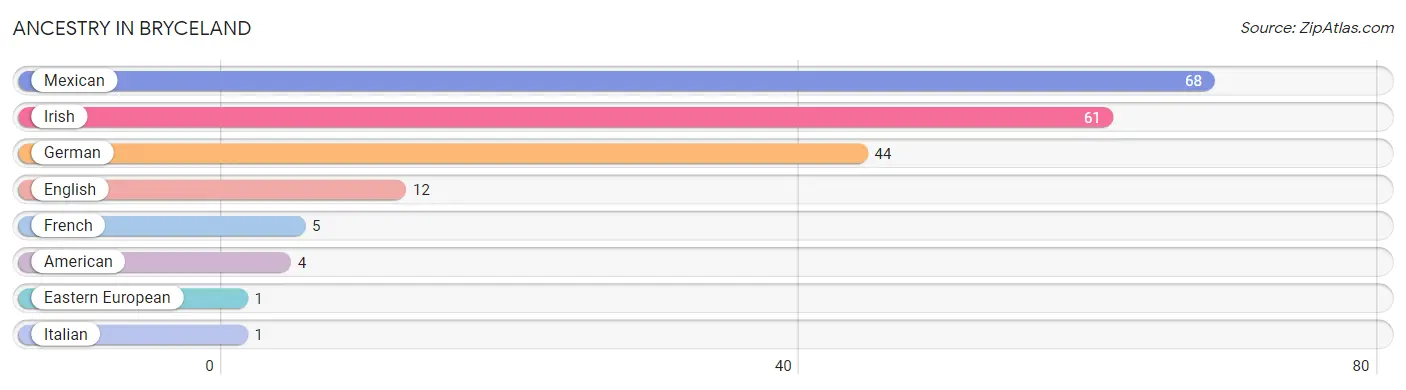
| Ancestry | # Population | % Population |
| American | 4 | 1.9% |
| Eastern European | 1 | 0.5% |
| English | 12 | 5.8% |
| French | 5 | 2.4% |
| German | 44 | 21.3% |
| Irish | 61 | 29.5% |
| Italian | 1 | 0.5% |
| Mexican | 68 | 32.9% | View All 8 Rows |
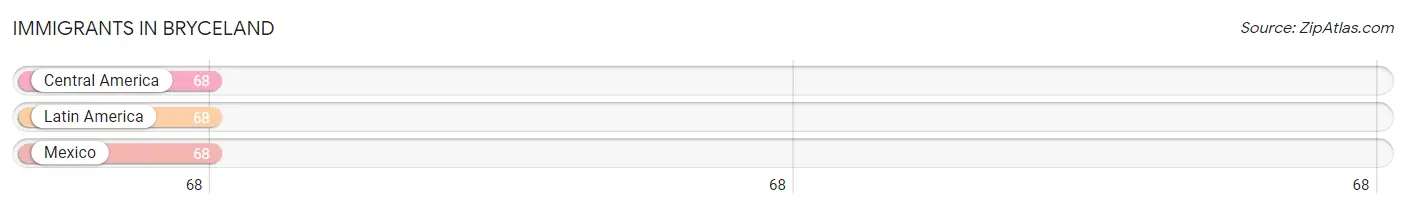
Immigrants in Bryceland
The most numerous immigrant groups reported in Bryceland came from Central America (68 | 32.9%), Latin America (68 | 32.9%), and Mexico (68 | 32.9%), together accounting for 98.6% of all Bryceland residents.
| Immigration Origin | # Population | % Population |
| Central America | 68 | 32.9% |
| Latin America | 68 | 32.9% |
| Mexico | 68 | 32.9% | View All 3 Rows |
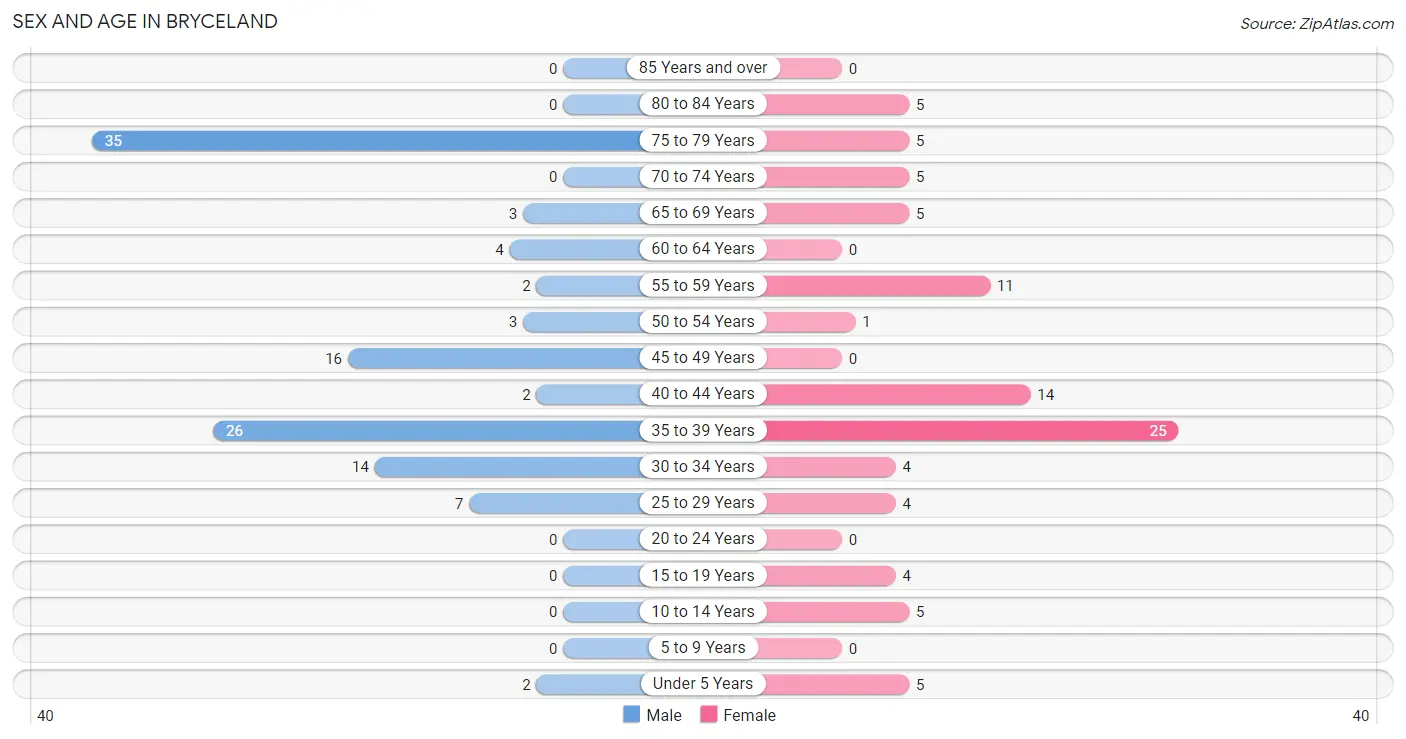
Sex and Age in Bryceland
Sex and Age in Bryceland
The most populous age groups in Bryceland are 75 to 79 Years (35 | 30.7%) for men and 35 to 39 Years (25 | 26.9%) for women.
| Age Bracket | Male | Female |
| Under 5 Years | 2 (1.8%) | 5 (5.4%) |
| 5 to 9 Years | 0 (0.0%) | 0 (0.0%) |
| 10 to 14 Years | 0 (0.0%) | 5 (5.4%) |
| 15 to 19 Years | 0 (0.0%) | 4 (4.3%) |
| 20 to 24 Years | 0 (0.0%) | 0 (0.0%) |
| 25 to 29 Years | 7 (6.1%) | 4 (4.3%) |
| 30 to 34 Years | 14 (12.3%) | 4 (4.3%) |
| 35 to 39 Years | 26 (22.8%) | 25 (26.9%) |
| 40 to 44 Years | 2 (1.8%) | 14 (15.0%) |
| 45 to 49 Years | 16 (14.0%) | 0 (0.0%) |
| 50 to 54 Years | 3 (2.6%) | 1 (1.1%) |
| 55 to 59 Years | 2 (1.8%) | 11 (11.8%) |
| 60 to 64 Years | 4 (3.5%) | 0 (0.0%) |
| 65 to 69 Years | 3 (2.6%) | 5 (5.4%) |
| 70 to 74 Years | 0 (0.0%) | 5 (5.4%) |
| 75 to 79 Years | 35 (30.7%) | 5 (5.4%) |
| 80 to 84 Years | 0 (0.0%) | 5 (5.4%) |
| 85 Years and over | 0 (0.0%) | 0 (0.0%) |
| Total | 114 (100.0%) | 93 (100.0%) |
Families and Households in Bryceland
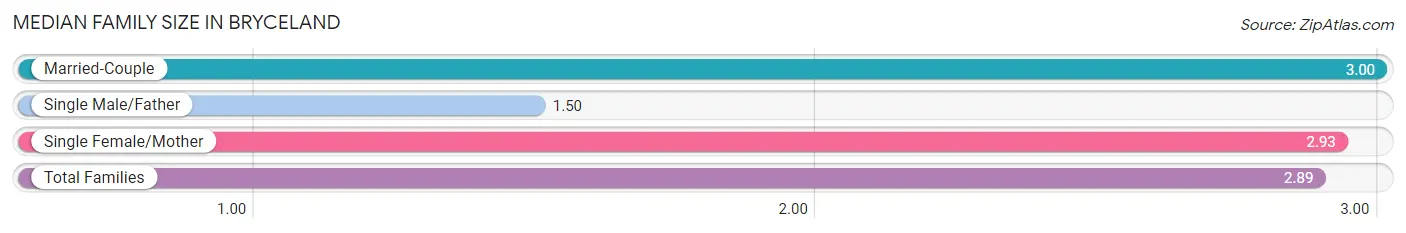
Median Family Size in Bryceland
The median family size in Bryceland is 2.89 persons per family, with married-couple families (19 | 52.8%) accounting for the largest median family size of 3 persons per family. On the other hand, single male/father families (2 | 5.6%) represent the smallest median family size with 1.50 persons per family.
| Family Type | # Families | Family Size |
| Married-Couple | 19 (52.8%) | 3.00 |
| Single Male/Father | 2 (5.6%) | 1.50 |
| Single Female/Mother | 15 (41.7%) | 2.93 |
| Total Families | 36 (100.0%) | 2.89 |
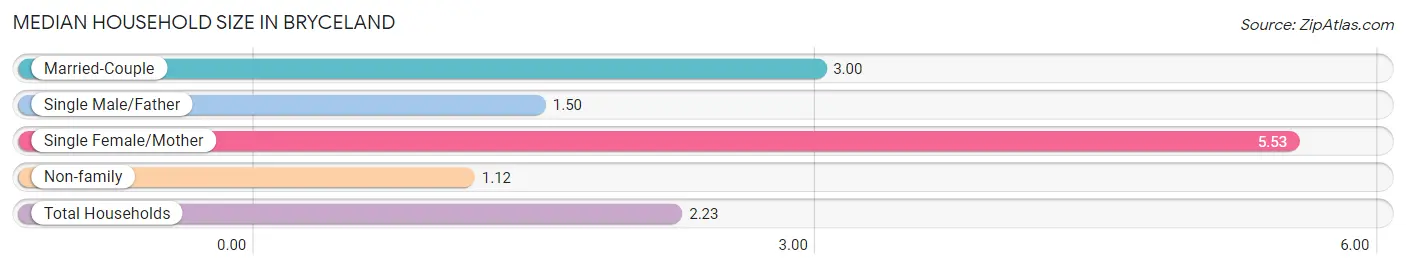
Median Household Size in Bryceland
The median household size in Bryceland is 2.23 persons per household, with single female/mother households (15 | 16.1%) accounting for the largest median household size of 5.53 persons per household. non-family households (57 | 61.3%) represent the smallest median household size with 1.12 persons per household.
| Household Type | # Households | Household Size |
| Married-Couple | 19 (20.4%) | 3.00 |
| Single Male/Father | 2 (2.1%) | 1.50 |
| Single Female/Mother | 15 (16.1%) | 5.53 |
| Non-family | 57 (61.3%) | 1.12 |
| Total Households | 93 (100.0%) | 2.23 |
Household Size by Marriage Status in Bryceland
Out of a total of 93 households in Bryceland, 36 (38.7%) are family households, while 57 (61.3%) are nonfamily households. The most numerous type of family households are 4-person households, comprising 17, and the most common type of nonfamily households are 1-person households, comprising 50.
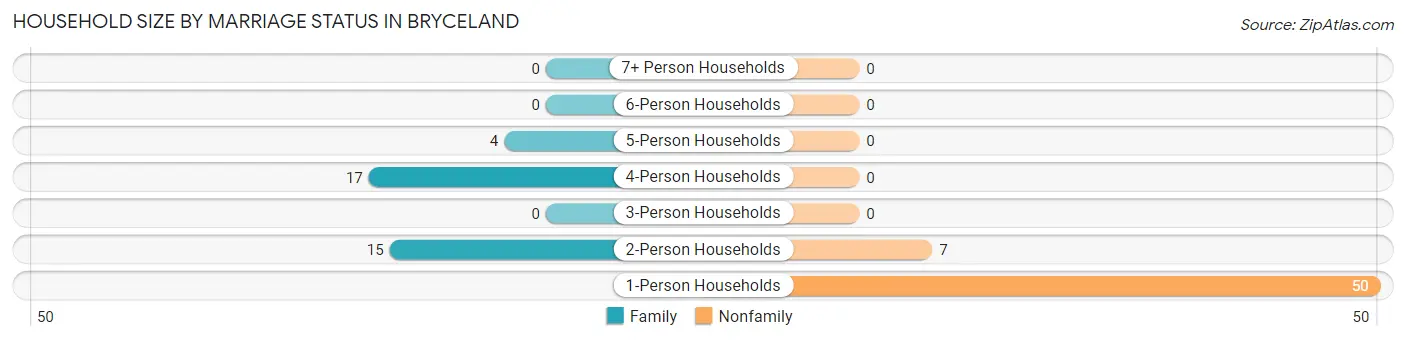
| Household Size | Family Households | Nonfamily Households |
| 1-Person Households | - | 50 (53.8%) |
| 2-Person Households | 15 (16.1%) | 7 (7.5%) |
| 3-Person Households | 0 (0.0%) | 0 (0.0%) |
| 4-Person Households | 17 (18.3%) | 0 (0.0%) |
| 5-Person Households | 4 (4.3%) | 0 (0.0%) |
| 6-Person Households | 0 (0.0%) | 0 (0.0%) |
| 7+ Person Households | 0 (0.0%) | 0 (0.0%) |
| Total | 36 (38.7%) | 57 (61.3%) |
Female Fertility in Bryceland
Fertility by Age in Bryceland
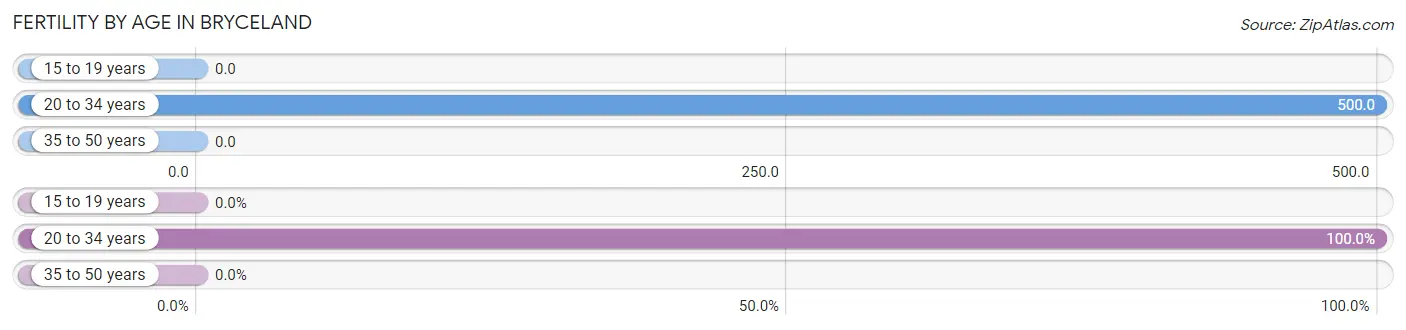
Average fertility rate in Bryceland is 78.0 births per 1,000 women. Women in the age bracket of 20 to 34 years have the highest fertility rate with 500.0 births per 1,000 women. Women in the age bracket of 20 to 34 years acount for 100.0% of all women with births.
| Age Bracket | Women with Births | Births / 1,000 Women |
| 15 to 19 years | 0 (0.0%) | 0.0 |
| 20 to 34 years | 4 (100.0%) | 500.0 |
| 35 to 50 years | 0 (0.0%) | 0.0 |
| Total | 4 (100.0%) | 78.0 |
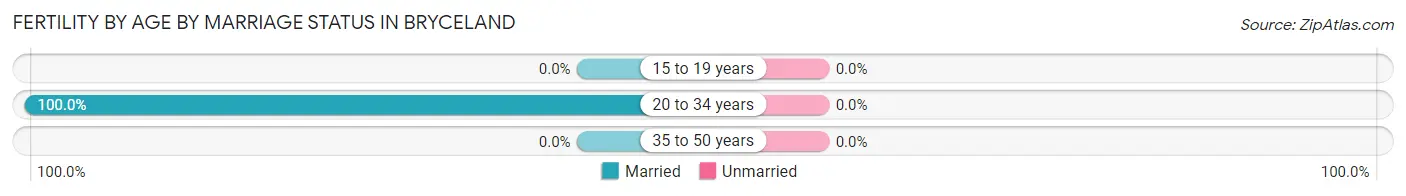
Fertility by Age by Marriage Status in Bryceland
| Age Bracket | Married | Unmarried |
| 15 to 19 years | 0 (0.0%) | 0 (0.0%) |
| 20 to 34 years | 4 (100.0%) | 0 (0.0%) |
| 35 to 50 years | 0 (0.0%) | 0 (0.0%) |
| Total | 4 (100.0%) | 0 (0.0%) |
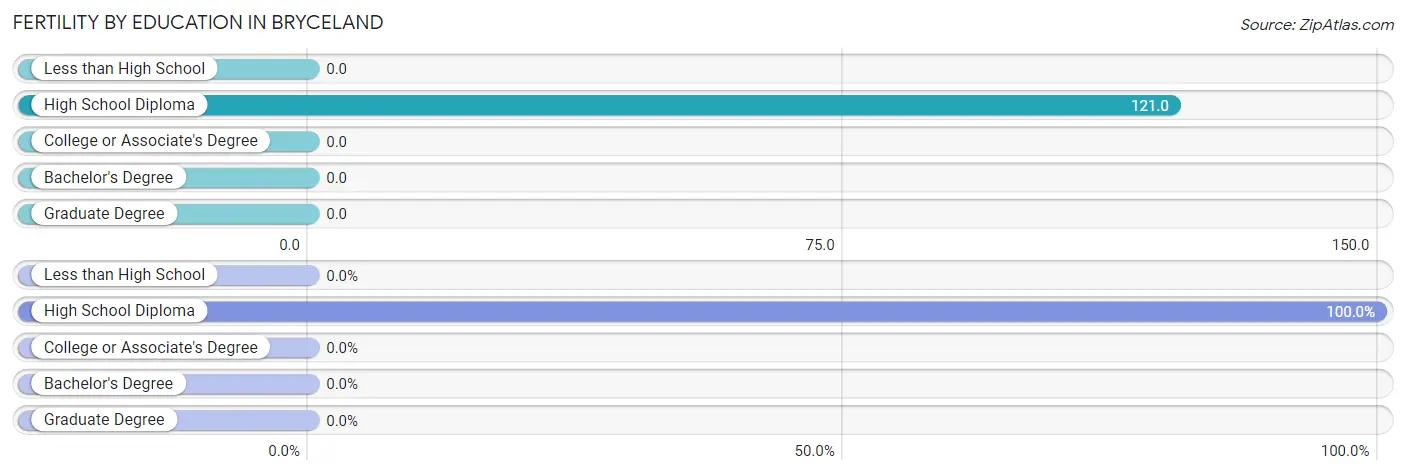
Fertility by Education in Bryceland
| Educational Attainment | Women with Births | Births / 1,000 Women |
| Less than High School | 0 (0.0%) | 0.0 |
| High School Diploma | 4 (100.0%) | 121.0 |
| College or Associate's Degree | 0 (0.0%) | 0.0 |
| Bachelor's Degree | 0 (0.0%) | 0.0 |
| Graduate Degree | 0 (0.0%) | 0.0 |
| Total | 4 (100.0%) | 78.0 |
Fertility by Education by Marriage Status in Bryceland
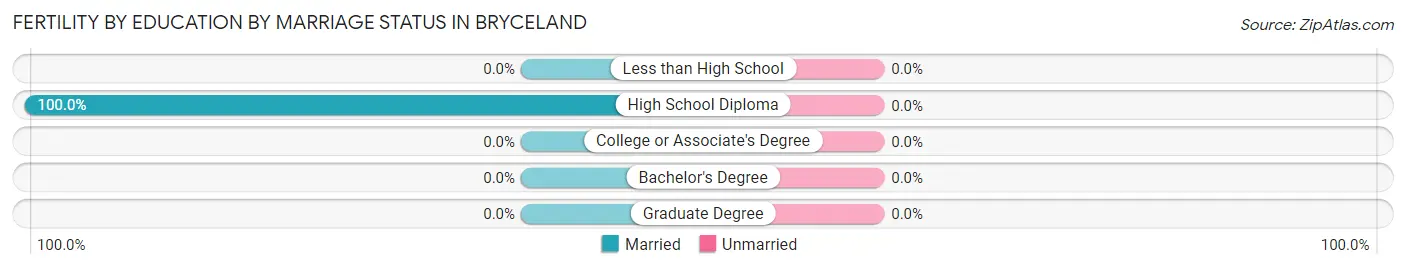
| Educational Attainment | Married | Unmarried |
| Less than High School | 0 (0.0%) | 0 (0.0%) |
| High School Diploma | 4 (100.0%) | 0 (0.0%) |
| College or Associate's Degree | 0 (0.0%) | 0 (0.0%) |
| Bachelor's Degree | 0 (0.0%) | 0 (0.0%) |
| Graduate Degree | 0 (0.0%) | 0 (0.0%) |
| Total | 4 (100.0%) | 0 (0.0%) |
Employment Characteristics in Bryceland
Employment by Class of Employer in Bryceland
Among the 124 employed individuals in Bryceland, private company employees (106 | 85.5%), self-employed (not incorporated) (7 | 5.7%), and local government employees (7 | 5.7%) make up the most common classes of employment.
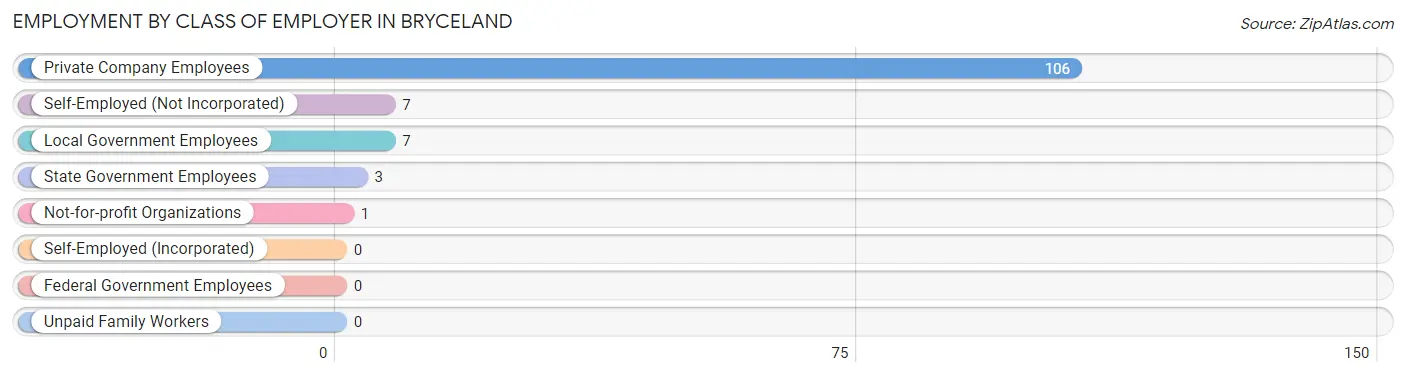
| Employer Class | # Employees | % Employees |
| Private Company Employees | 106 | 85.5% |
| Self-Employed (Incorporated) | 0 | 0.0% |
| Self-Employed (Not Incorporated) | 7 | 5.7% |
| Not-for-profit Organizations | 1 | 0.8% |
| Local Government Employees | 7 | 5.7% |
| State Government Employees | 3 | 2.4% |
| Federal Government Employees | 0 | 0.0% |
| Unpaid Family Workers | 0 | 0.0% |
| Total | 124 | 100.0% |
Employment Status by Age in Bryceland
According to the labor force statistics for Bryceland, out of the total population over 16 years of age (195), 67.2% or 131 individuals are in the labor force, with 5.3% or 7 of them unemployed. The age group with the highest labor force participation rate is 25 to 29 years, with 100.0% or 11 individuals in the labor force. Within the labor force, the 35 to 44 years age range has the highest percentage of unemployed individuals, with 10.9% or 7 of them being unemployed.
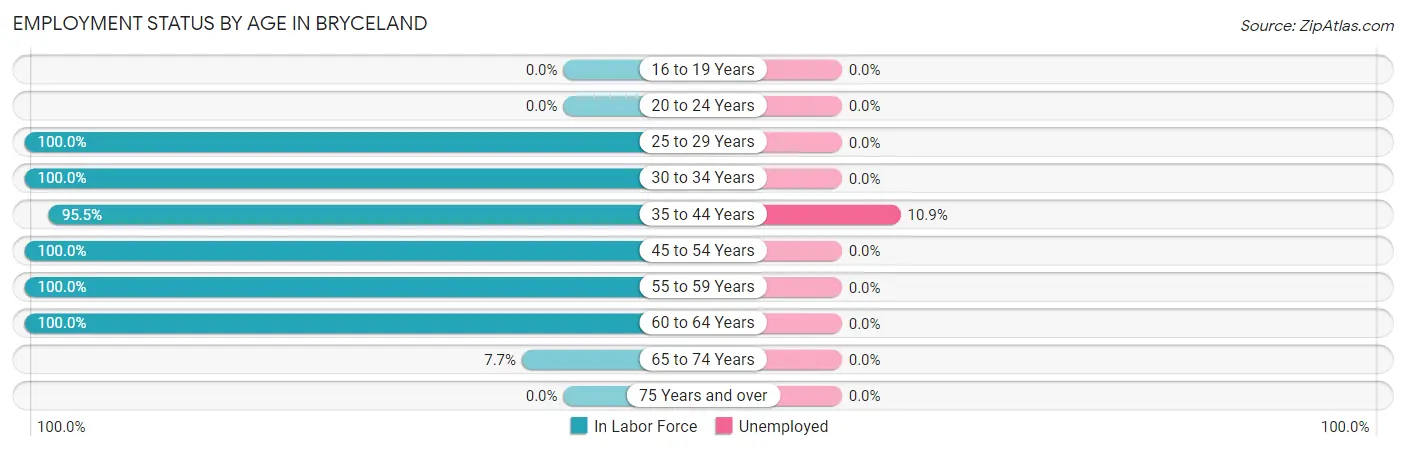
| Age Bracket | In Labor Force | Unemployed |
| 16 to 19 Years | 0 (0.0%) | 0 (0.0%) |
| 20 to 24 Years | 0 (0.0%) | 0 (0.0%) |
| 25 to 29 Years | 11 (100.0%) | 0 (0.0%) |
| 30 to 34 Years | 18 (100.0%) | 0 (0.0%) |
| 35 to 44 Years | 64 (95.5%) | 7 (10.9%) |
| 45 to 54 Years | 20 (100.0%) | 0 (0.0%) |
| 55 to 59 Years | 13 (100.0%) | 0 (0.0%) |
| 60 to 64 Years | 4 (100.0%) | 0 (0.0%) |
| 65 to 74 Years | 1 (7.7%) | 0 (0.0%) |
| 75 Years and over | 0 (0.0%) | 0 (0.0%) |
| Total | 131 (67.2%) | 7 (5.3%) |
Employment Status by Educational Attainment in Bryceland
According to labor force statistics for Bryceland, 97.7% of individuals (130) out of the total population between 25 and 64 years of age (133) are in the labor force, with 5.4% or 7 of them being unemployed. The group with the highest labor force participation rate are those with the educational attainment of high school diploma, with 100.0% or 67 individuals in the labor force. Within the labor force, individuals with college / associate degree education have the highest percentage of unemployment, with 63.6% or 7 of them being unemployed.
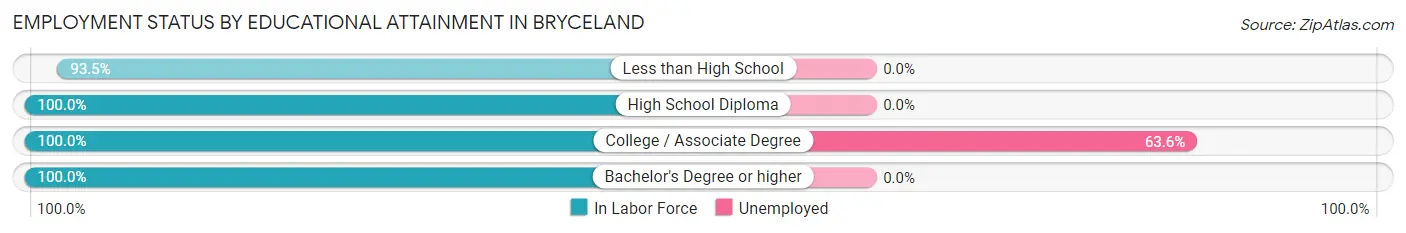
| Educational Attainment | In Labor Force | Unemployed |
| Less than High School | 43 (93.5%) | 0 (0.0%) |
| High School Diploma | 67 (100.0%) | 0 (0.0%) |
| College / Associate Degree | 11 (100.0%) | 7 (63.6%) |
| Bachelor's Degree or higher | 9 (100.0%) | 0 (0.0%) |
| Total | 130 (97.7%) | 7 (5.4%) |
Employment Occupations by Sex in Bryceland
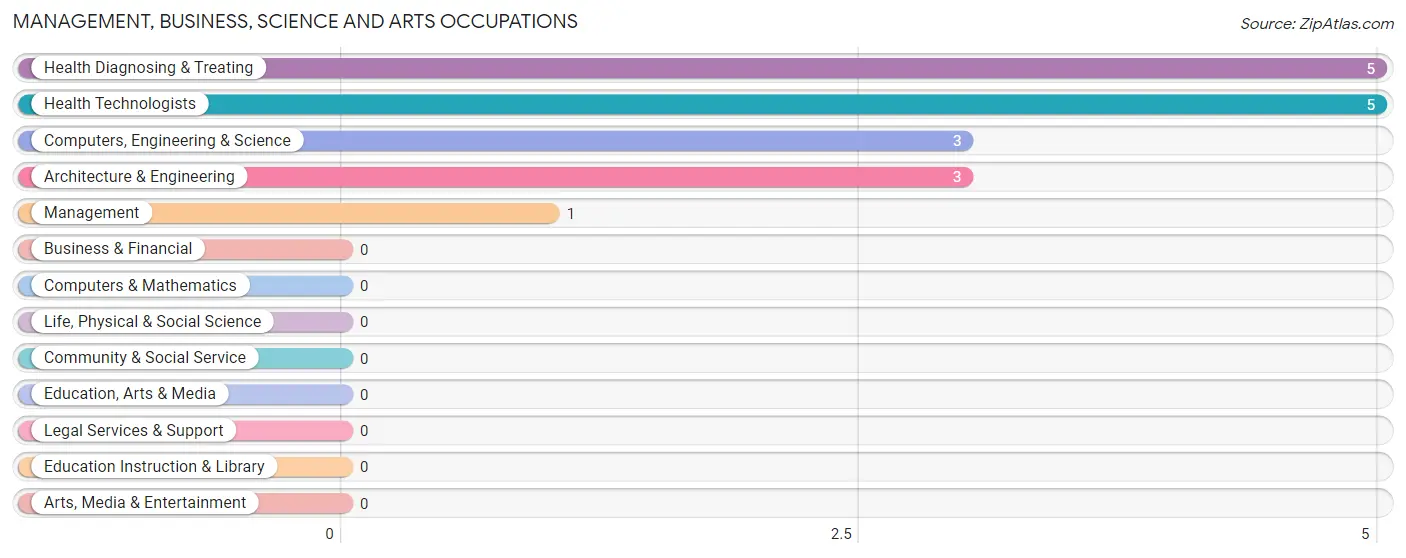
Management, Business, Science and Arts Occupations
The most common Management, Business, Science and Arts occupations in Bryceland are Health Diagnosing & Treating (5 | 4.0%), Health Technologists (5 | 4.0%), Computers, Engineering & Science (3 | 2.4%), Architecture & Engineering (3 | 2.4%), and Management (1 | 0.8%).
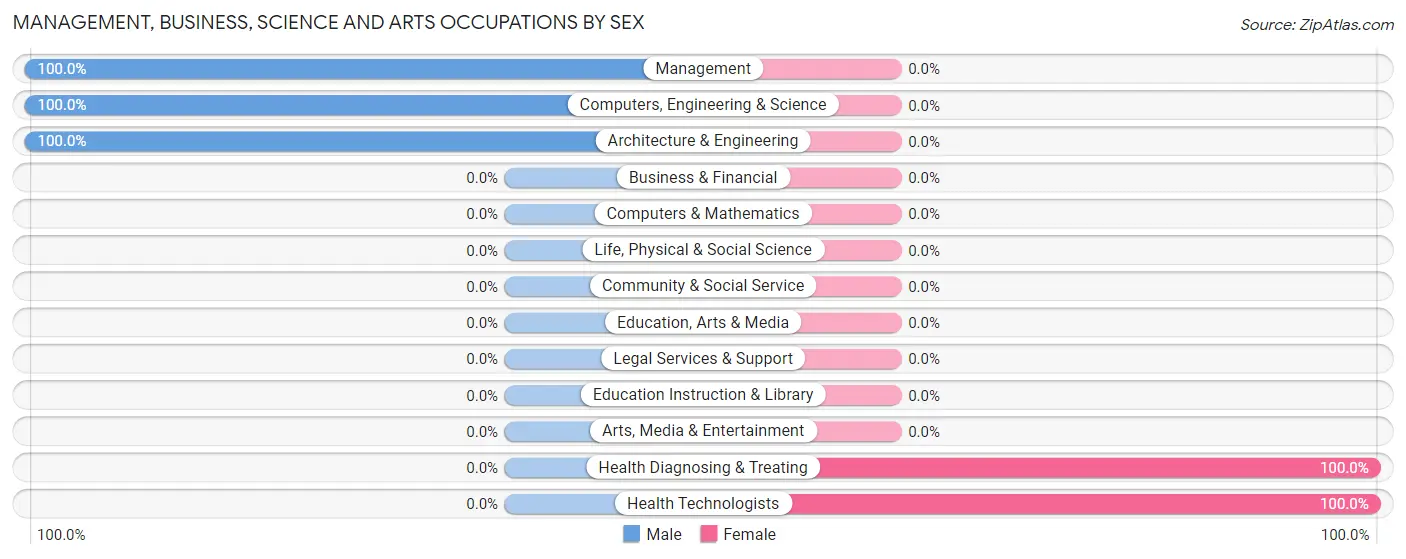
Management, Business, Science and Arts Occupations by Sex
Within the Management, Business, Science and Arts occupations in Bryceland, the most male-oriented occupations are Management (100.0%), Computers, Engineering & Science (100.0%), and Architecture & Engineering (100.0%), while the most female-oriented occupations are Health Diagnosing & Treating (100.0%), and Health Technologists (100.0%).
| Occupation | Male | Female |
| Management | 1 (100.0%) | 0 (0.0%) |
| Business & Financial | 0 (0.0%) | 0 (0.0%) |
| Computers, Engineering & Science | 3 (100.0%) | 0 (0.0%) |
| Computers & Mathematics | 0 (0.0%) | 0 (0.0%) |
| Architecture & Engineering | 3 (100.0%) | 0 (0.0%) |
| Life, Physical & Social Science | 0 (0.0%) | 0 (0.0%) |
| Community & Social Service | 0 (0.0%) | 0 (0.0%) |
| Education, Arts & Media | 0 (0.0%) | 0 (0.0%) |
| Legal Services & Support | 0 (0.0%) | 0 (0.0%) |
| Education Instruction & Library | 0 (0.0%) | 0 (0.0%) |
| Arts, Media & Entertainment | 0 (0.0%) | 0 (0.0%) |
| Health Diagnosing & Treating | 0 (0.0%) | 5 (100.0%) |
| Health Technologists | 0 (0.0%) | 5 (100.0%) |
| Total (Category) | 4 (44.4%) | 5 (55.6%) |
| Total (Overall) | 71 (57.3%) | 53 (42.7%) |
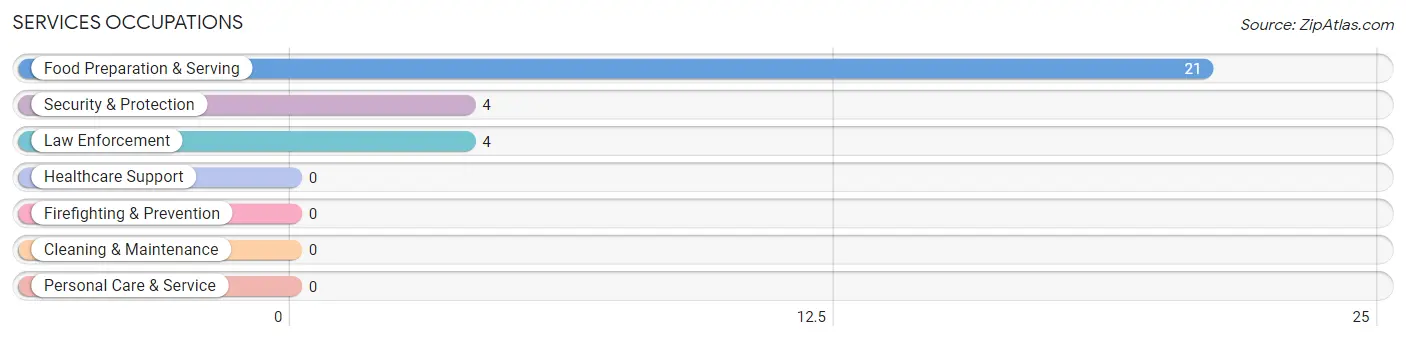
Services Occupations
The most common Services occupations in Bryceland are Food Preparation & Serving (21 | 16.9%), Security & Protection (4 | 3.2%), and Law Enforcement (4 | 3.2%).
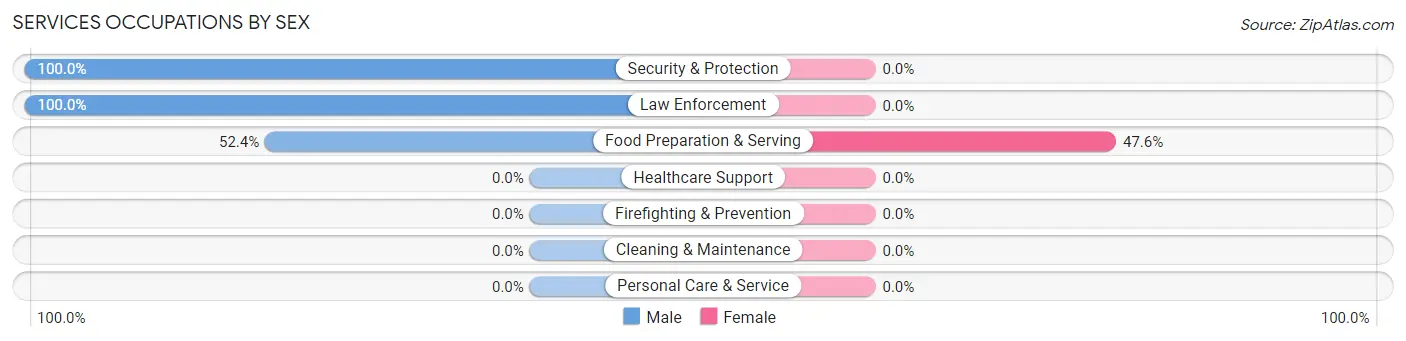
Services Occupations by Sex
| Occupation | Male | Female |
| Healthcare Support | 0 (0.0%) | 0 (0.0%) |
| Security & Protection | 4 (100.0%) | 0 (0.0%) |
| Firefighting & Prevention | 0 (0.0%) | 0 (0.0%) |
| Law Enforcement | 4 (100.0%) | 0 (0.0%) |
| Food Preparation & Serving | 11 (52.4%) | 10 (47.6%) |
| Cleaning & Maintenance | 0 (0.0%) | 0 (0.0%) |
| Personal Care & Service | 0 (0.0%) | 0 (0.0%) |
| Total (Category) | 15 (60.0%) | 10 (40.0%) |
| Total (Overall) | 71 (57.3%) | 53 (42.7%) |
Sales and Office Occupations
The most common Sales and Office occupations in Bryceland are Sales & Related (4 | 3.2%), and Office & Administration (1 | 0.8%).
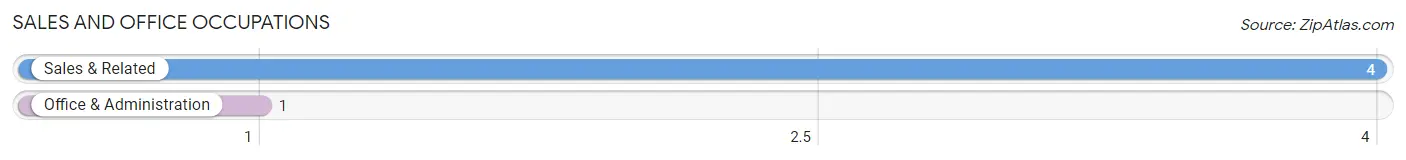
Sales and Office Occupations by Sex
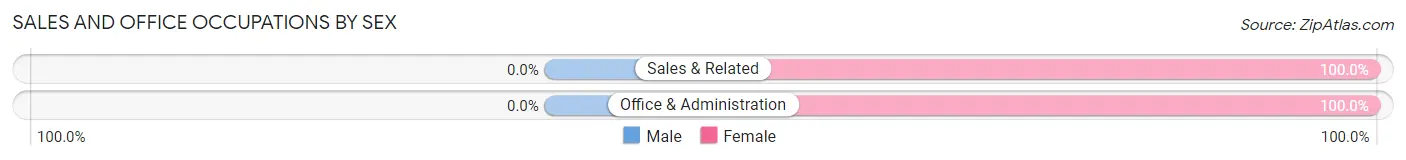
| Occupation | Male | Female |
| Sales & Related | 0 (0.0%) | 4 (100.0%) |
| Office & Administration | 0 (0.0%) | 1 (100.0%) |
| Total (Category) | 0 (0.0%) | 5 (100.0%) |
| Total (Overall) | 71 (57.3%) | 53 (42.7%) |
Natural Resources, Construction and Maintenance Occupations
The most common Natural Resources, Construction and Maintenance occupations in Bryceland are Farming, Fishing & Forestry (72 | 58.1%), and Construction & Extraction (1 | 0.8%).
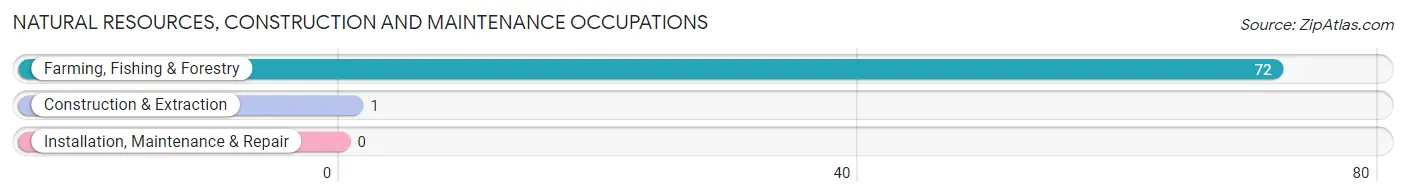
Natural Resources, Construction and Maintenance Occupations by Sex

| Occupation | Male | Female |
| Farming, Fishing & Forestry | 39 (54.2%) | 33 (45.8%) |
| Construction & Extraction | 1 (100.0%) | 0 (0.0%) |
| Installation, Maintenance & Repair | 0 (0.0%) | 0 (0.0%) |
| Total (Category) | 40 (54.8%) | 33 (45.2%) |
| Total (Overall) | 71 (57.3%) | 53 (42.7%) |
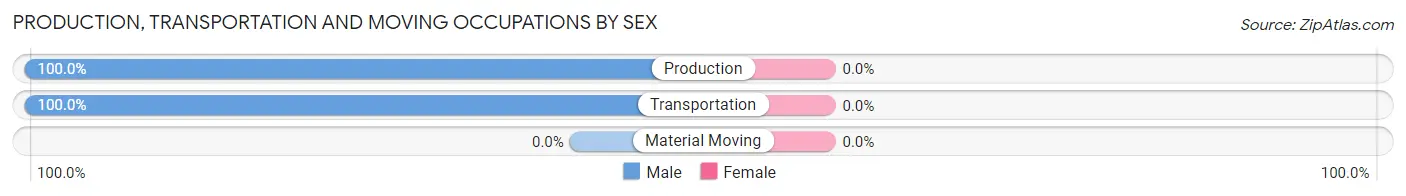
Production, Transportation and Moving Occupations
The most common Production, Transportation and Moving occupations in Bryceland are Production (10 | 8.1%), and Transportation (2 | 1.6%).
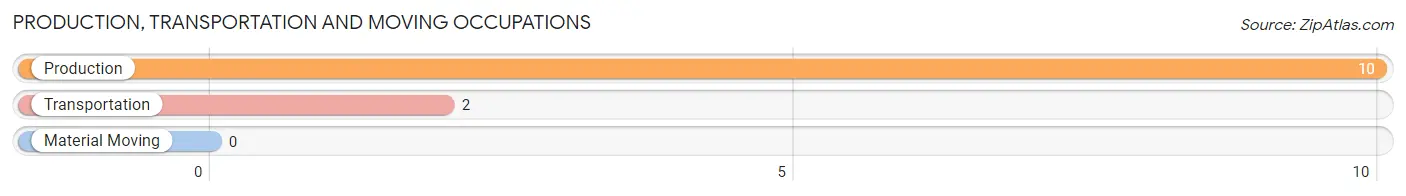
Production, Transportation and Moving Occupations by Sex
| Occupation | Male | Female |
| Production | 10 (100.0%) | 0 (0.0%) |
| Transportation | 2 (100.0%) | 0 (0.0%) |
| Material Moving | 0 (0.0%) | 0 (0.0%) |
| Total (Category) | 12 (100.0%) | 0 (0.0%) |
| Total (Overall) | 71 (57.3%) | 53 (42.7%) |
Employment Industries by Sex in Bryceland
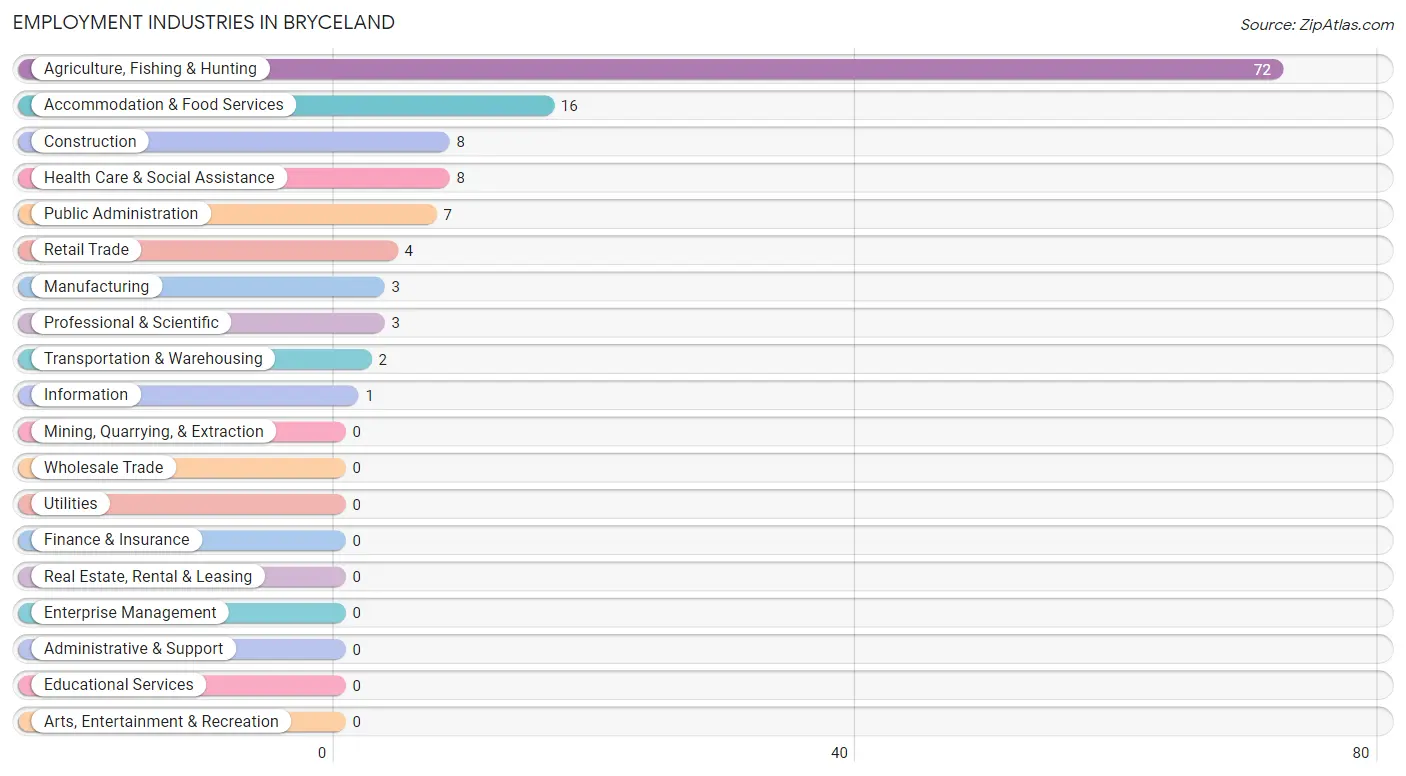
Employment Industries in Bryceland
The major employment industries in Bryceland include Agriculture, Fishing & Hunting (72 | 58.1%), Accommodation & Food Services (16 | 12.9%), Construction (8 | 6.5%), Health Care & Social Assistance (8 | 6.5%), and Public Administration (7 | 5.7%).
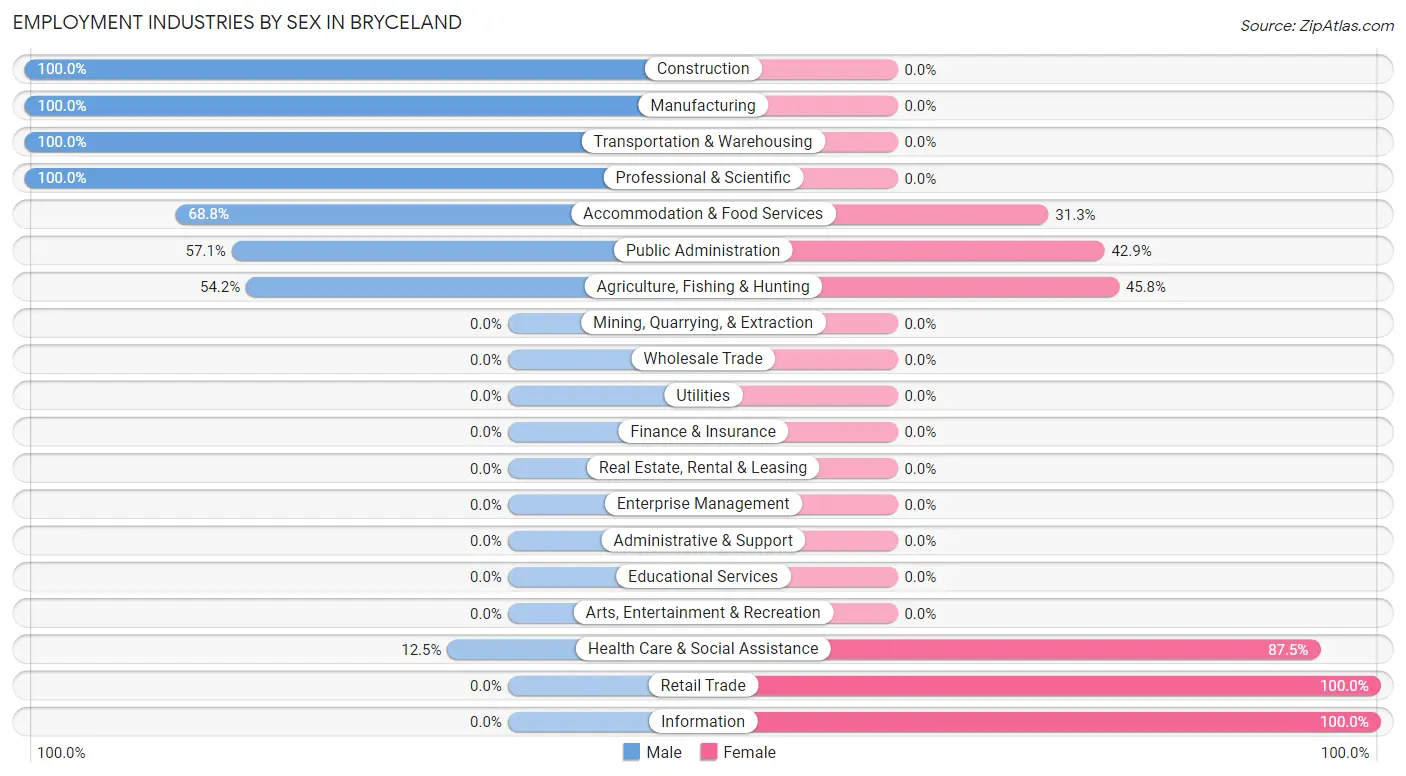
Employment Industries by Sex in Bryceland
The Bryceland industries that see more men than women are Construction (100.0%), Manufacturing (100.0%), and Transportation & Warehousing (100.0%), whereas the industries that tend to have a higher number of women are Retail Trade (100.0%), Information (100.0%), and Health Care & Social Assistance (87.5%).
| Industry | Male | Female |
| Agriculture, Fishing & Hunting | 39 (54.2%) | 33 (45.8%) |
| Mining, Quarrying, & Extraction | 0 (0.0%) | 0 (0.0%) |
| Construction | 8 (100.0%) | 0 (0.0%) |
| Manufacturing | 3 (100.0%) | 0 (0.0%) |
| Wholesale Trade | 0 (0.0%) | 0 (0.0%) |
| Retail Trade | 0 (0.0%) | 4 (100.0%) |
| Transportation & Warehousing | 2 (100.0%) | 0 (0.0%) |
| Utilities | 0 (0.0%) | 0 (0.0%) |
| Information | 0 (0.0%) | 1 (100.0%) |
| Finance & Insurance | 0 (0.0%) | 0 (0.0%) |
| Real Estate, Rental & Leasing | 0 (0.0%) | 0 (0.0%) |
| Professional & Scientific | 3 (100.0%) | 0 (0.0%) |
| Enterprise Management | 0 (0.0%) | 0 (0.0%) |
| Administrative & Support | 0 (0.0%) | 0 (0.0%) |
| Educational Services | 0 (0.0%) | 0 (0.0%) |
| Health Care & Social Assistance | 1 (12.5%) | 7 (87.5%) |
| Arts, Entertainment & Recreation | 0 (0.0%) | 0 (0.0%) |
| Accommodation & Food Services | 11 (68.8%) | 5 (31.2%) |
| Public Administration | 4 (57.1%) | 3 (42.9%) |
| Total | 71 (57.3%) | 53 (42.7%) |
Education in Bryceland
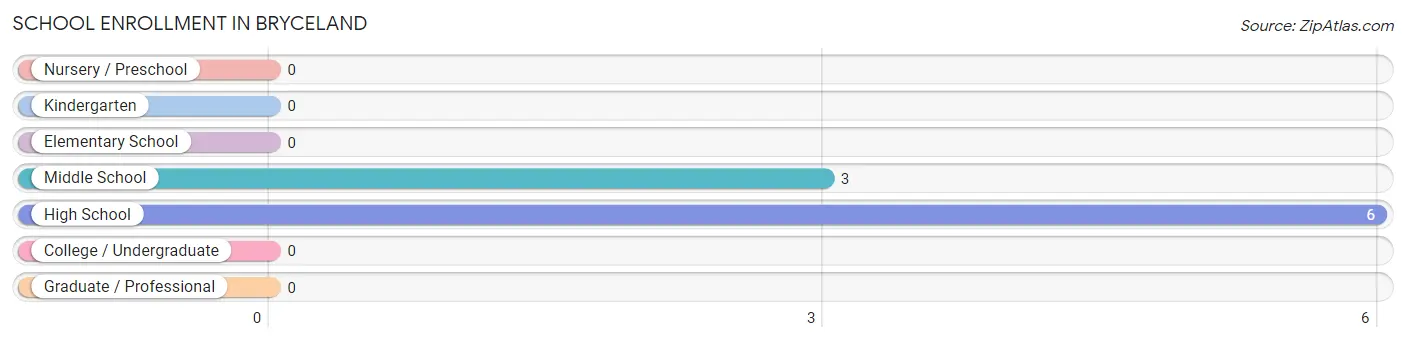
School Enrollment in Bryceland
The most common levels of schooling among the 9 students in Bryceland are high school (6 | 66.7%), and middle school (3 | 33.3%).
| School Level | # Students | % Students |
| Nursery / Preschool | 0 | 0.0% |
| Kindergarten | 0 | 0.0% |
| Elementary School | 0 | 0.0% |
| Middle School | 3 | 33.3% |
| High School | 6 | 66.7% |
| College / Undergraduate | 0 | 0.0% |
| Graduate / Professional | 0 | 0.0% |
| Total | 9 | 100.0% |
School Enrollment by Age by Funding Source in Bryceland
Out of a total of 9 students who are enrolled in schools in Bryceland, 1 (11.1%) attend a private institution, while the remaining 8 (88.9%) are enrolled in public schools. The age group of 10 to 14 year olds has the highest likelihood of being enrolled in private schools, with 1 (20.0% in the age bracket) enrolled. Conversely, the age group of 18 to 19 year olds has the lowest likelihood of being enrolled in a private school, with 4 (100.0% in the age bracket) attending a public institution.
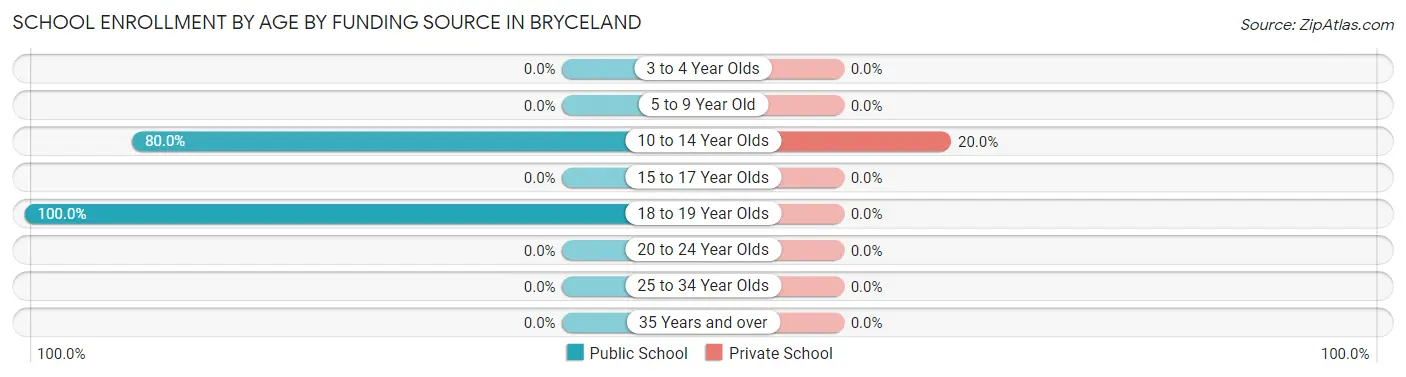
| Age Bracket | Public School | Private School |
| 3 to 4 Year Olds | 0 (0.0%) | 0 (0.0%) |
| 5 to 9 Year Old | 0 (0.0%) | 0 (0.0%) |
| 10 to 14 Year Olds | 4 (80.0%) | 1 (20.0%) |
| 15 to 17 Year Olds | 0 (0.0%) | 0 (0.0%) |
| 18 to 19 Year Olds | 4 (100.0%) | 0 (0.0%) |
| 20 to 24 Year Olds | 0 (0.0%) | 0 (0.0%) |
| 25 to 34 Year Olds | 0 (0.0%) | 0 (0.0%) |
| 35 Years and over | 0 (0.0%) | 0 (0.0%) |
| Total | 8 (88.9%) | 1 (11.1%) |
Educational Attainment by Field of Study in Bryceland
Science & technology (6 | 30.0%), bio, nature & agricultural (5 | 25.0%), education (5 | 25.0%), social sciences (3 | 15.0%), and liberal arts & history (1 | 5.0%) are the most common fields of study among 20 individuals in Bryceland who have obtained a bachelor's degree or higher.
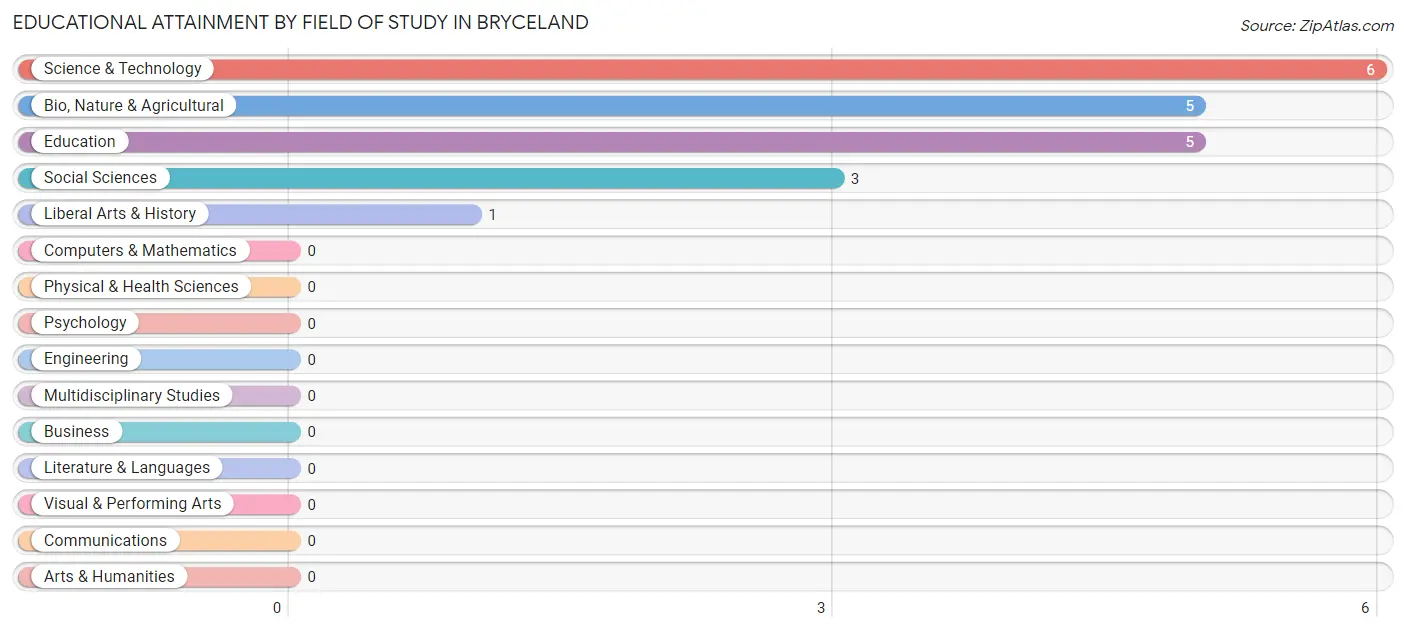
| Field of Study | # Graduates | % Graduates |
| Computers & Mathematics | 0 | 0.0% |
| Bio, Nature & Agricultural | 5 | 25.0% |
| Physical & Health Sciences | 0 | 0.0% |
| Psychology | 0 | 0.0% |
| Social Sciences | 3 | 15.0% |
| Engineering | 0 | 0.0% |
| Multidisciplinary Studies | 0 | 0.0% |
| Science & Technology | 6 | 30.0% |
| Business | 0 | 0.0% |
| Education | 5 | 25.0% |
| Literature & Languages | 0 | 0.0% |
| Liberal Arts & History | 1 | 5.0% |
| Visual & Performing Arts | 0 | 0.0% |
| Communications | 0 | 0.0% |
| Arts & Humanities | 0 | 0.0% |
| Total | 20 | 100.0% |
Transportation & Commute in Bryceland
Vehicle Availability by Sex in Bryceland
The most prevalent vehicle ownership categories in Bryceland are males with 1 vehicle (40, accounting for 56.3%) and females with 1 vehicle (40, making up 75.5%).
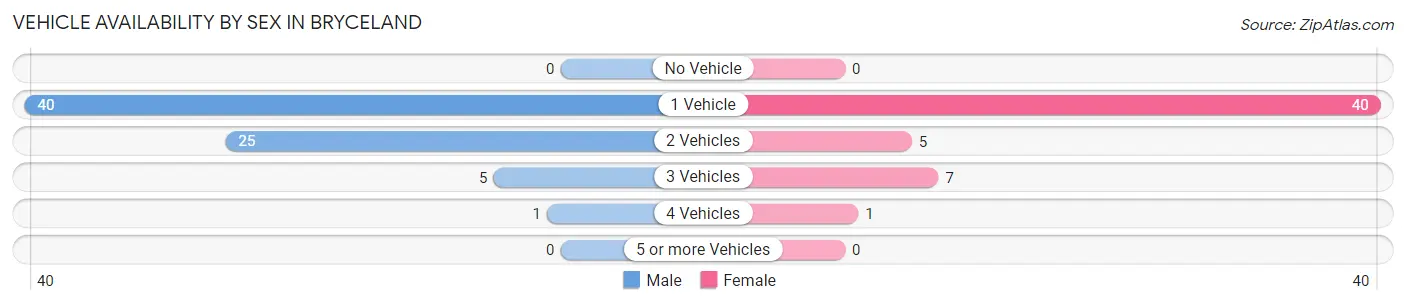
| Vehicles Available | Male | Female |
| No Vehicle | 0 (0.0%) | 0 (0.0%) |
| 1 Vehicle | 40 (56.3%) | 40 (75.5%) |
| 2 Vehicles | 25 (35.2%) | 5 (9.4%) |
| 3 Vehicles | 5 (7.0%) | 7 (13.2%) |
| 4 Vehicles | 1 (1.4%) | 1 (1.9%) |
| 5 or more Vehicles | 0 (0.0%) | 0 (0.0%) |
| Total | 71 (100.0%) | 53 (100.0%) |
Commute Time in Bryceland
The most frequently occuring commute durations in Bryceland are less than 5 minutes (73 commuters, 60.3%), 45 to 59 minutes (19 commuters, 15.7%), and 10 to 14 minutes (11 commuters, 9.1%).
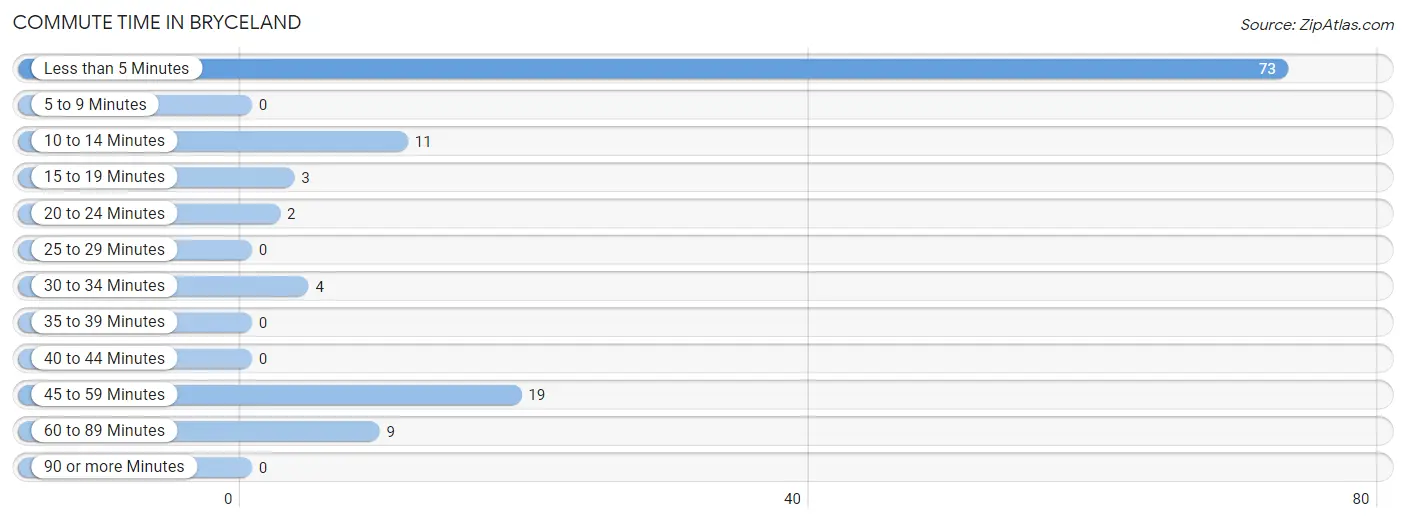
| Commute Time | # Commuters | % Commuters |
| Less than 5 Minutes | 73 | 60.3% |
| 5 to 9 Minutes | 0 | 0.0% |
| 10 to 14 Minutes | 11 | 9.1% |
| 15 to 19 Minutes | 3 | 2.5% |
| 20 to 24 Minutes | 2 | 1.7% |
| 25 to 29 Minutes | 0 | 0.0% |
| 30 to 34 Minutes | 4 | 3.3% |
| 35 to 39 Minutes | 0 | 0.0% |
| 40 to 44 Minutes | 0 | 0.0% |
| 45 to 59 Minutes | 19 | 15.7% |
| 60 to 89 Minutes | 9 | 7.4% |
| 90 or more Minutes | 0 | 0.0% |
Commute Time by Sex in Bryceland
The most common commute times in Bryceland are less than 5 minutes (39 commuters, 54.9%) for males and less than 5 minutes (34 commuters, 68.0%) for females.
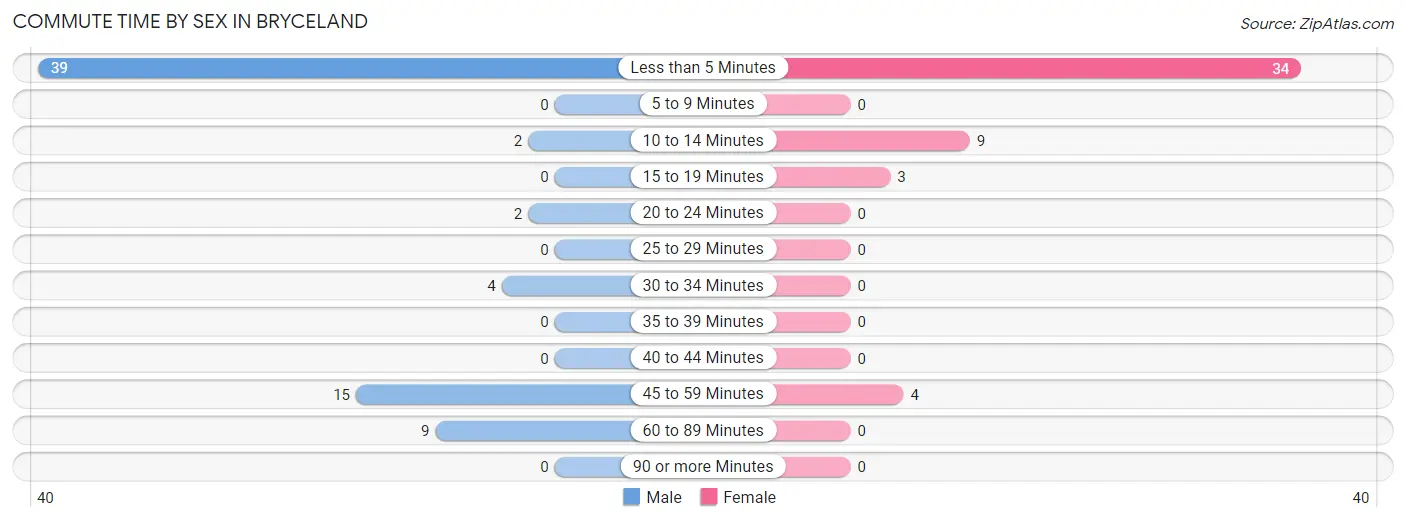
| Commute Time | Male | Female |
| Less than 5 Minutes | 39 (54.9%) | 34 (68.0%) |
| 5 to 9 Minutes | 0 (0.0%) | 0 (0.0%) |
| 10 to 14 Minutes | 2 (2.8%) | 9 (18.0%) |
| 15 to 19 Minutes | 0 (0.0%) | 3 (6.0%) |
| 20 to 24 Minutes | 2 (2.8%) | 0 (0.0%) |
| 25 to 29 Minutes | 0 (0.0%) | 0 (0.0%) |
| 30 to 34 Minutes | 4 (5.6%) | 0 (0.0%) |
| 35 to 39 Minutes | 0 (0.0%) | 0 (0.0%) |
| 40 to 44 Minutes | 0 (0.0%) | 0 (0.0%) |
| 45 to 59 Minutes | 15 (21.1%) | 4 (8.0%) |
| 60 to 89 Minutes | 9 (12.7%) | 0 (0.0%) |
| 90 or more Minutes | 0 (0.0%) | 0 (0.0%) |
Time of Departure to Work by Sex in Bryceland
The most frequent times of departure to work in Bryceland are 8:00 AM to 8:29 AM (44, 62.0%) for males and 8:00 AM to 8:29 AM (29, 58.0%) for females.
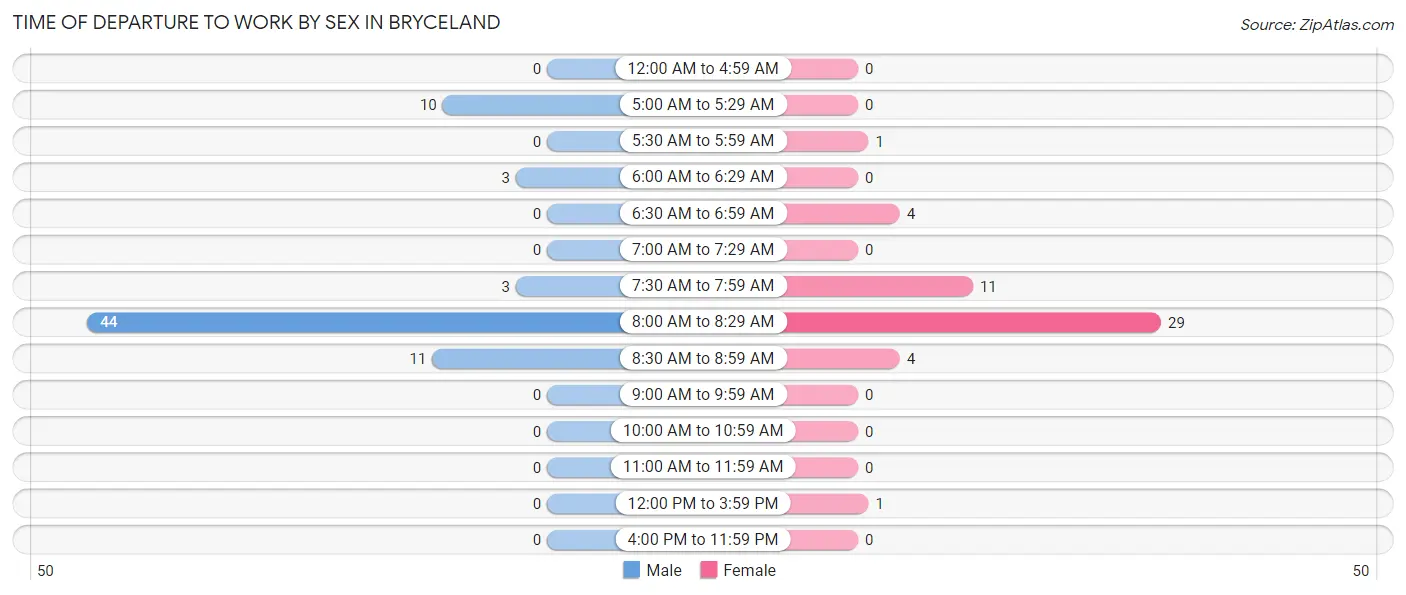
| Time of Departure | Male | Female |
| 12:00 AM to 4:59 AM | 0 (0.0%) | 0 (0.0%) |
| 5:00 AM to 5:29 AM | 10 (14.1%) | 0 (0.0%) |
| 5:30 AM to 5:59 AM | 0 (0.0%) | 1 (2.0%) |
| 6:00 AM to 6:29 AM | 3 (4.2%) | 0 (0.0%) |
| 6:30 AM to 6:59 AM | 0 (0.0%) | 4 (8.0%) |
| 7:00 AM to 7:29 AM | 0 (0.0%) | 0 (0.0%) |
| 7:30 AM to 7:59 AM | 3 (4.2%) | 11 (22.0%) |
| 8:00 AM to 8:29 AM | 44 (62.0%) | 29 (58.0%) |
| 8:30 AM to 8:59 AM | 11 (15.5%) | 4 (8.0%) |
| 9:00 AM to 9:59 AM | 0 (0.0%) | 0 (0.0%) |
| 10:00 AM to 10:59 AM | 0 (0.0%) | 0 (0.0%) |
| 11:00 AM to 11:59 AM | 0 (0.0%) | 0 (0.0%) |
| 12:00 PM to 3:59 PM | 0 (0.0%) | 1 (2.0%) |
| 4:00 PM to 11:59 PM | 0 (0.0%) | 0 (0.0%) |
| Total | 71 (100.0%) | 50 (100.0%) |
Housing Occupancy in Bryceland
Occupancy by Ownership in Bryceland
Of the total 93 dwellings in Bryceland, owner-occupied units account for 82 (88.2%), while renter-occupied units make up 11 (11.8%).
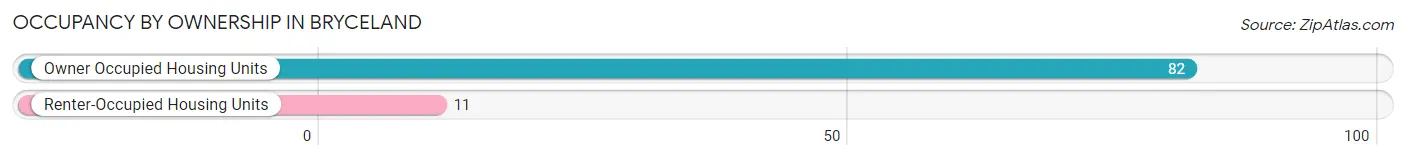
| Occupancy | # Housing Units | % Housing Units |
| Owner Occupied Housing Units | 82 | 88.2% |
| Renter-Occupied Housing Units | 11 | 11.8% |
| Total Occupied Housing Units | 93 | 100.0% |
Occupancy by Household Size in Bryceland
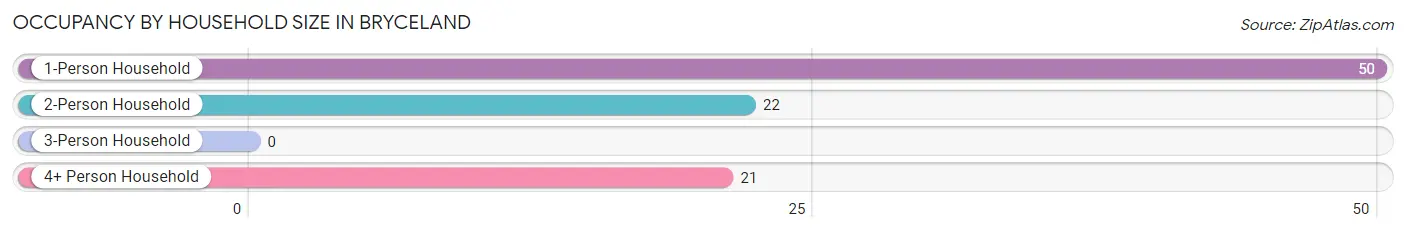
| Household Size | # Housing Units | % Housing Units |
| 1-Person Household | 50 | 53.8% |
| 2-Person Household | 22 | 23.7% |
| 3-Person Household | 0 | 0.0% |
| 4+ Person Household | 21 | 22.6% |
| Total Housing Units | 93 | 100.0% |
Occupancy by Ownership by Household Size in Bryceland
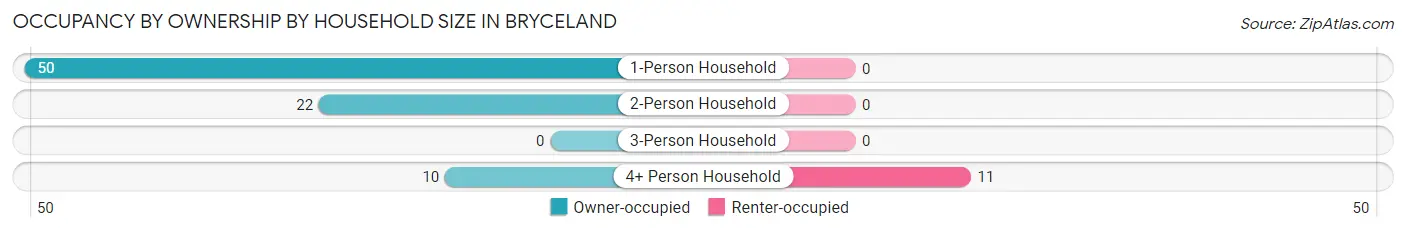
| Household Size | Owner-occupied | Renter-occupied |
| 1-Person Household | 50 (100.0%) | 0 (0.0%) |
| 2-Person Household | 22 (100.0%) | 0 (0.0%) |
| 3-Person Household | 0 (0.0%) | 0 (0.0%) |
| 4+ Person Household | 10 (47.6%) | 11 (52.4%) |
| Total Housing Units | 82 (88.2%) | 11 (11.8%) |
Occupancy by Educational Attainment in Bryceland
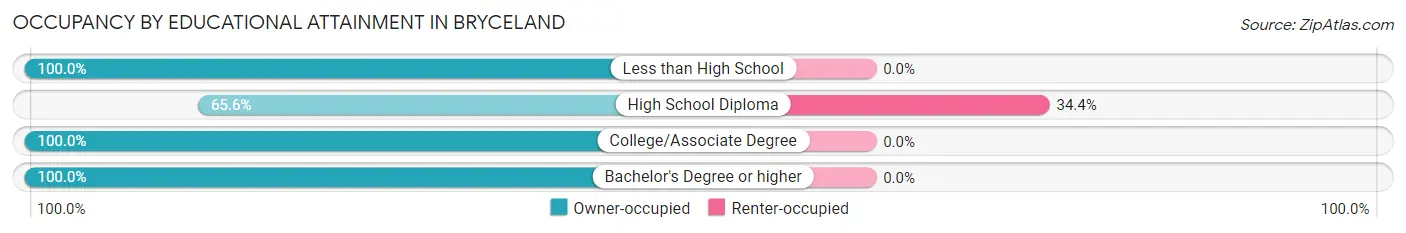
| Household Size | Owner-occupied | Renter-occupied |
| Less than High School | 9 (100.0%) | 0 (0.0%) |
| High School Diploma | 21 (65.6%) | 11 (34.4%) |
| College/Associate Degree | 42 (100.0%) | 0 (0.0%) |
| Bachelor's Degree or higher | 10 (100.0%) | 0 (0.0%) |
Occupancy by Age of Householder in Bryceland
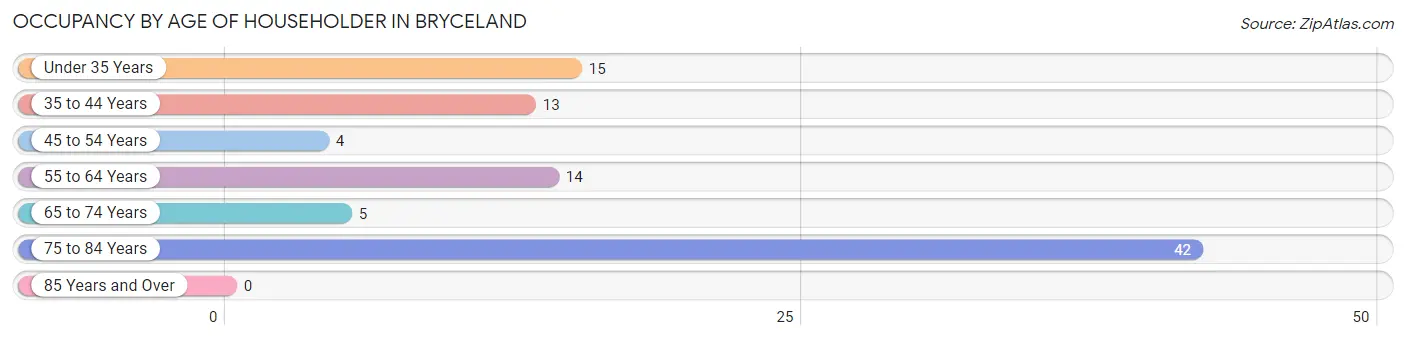
| Age Bracket | # Households | % Households |
| Under 35 Years | 15 | 16.1% |
| 35 to 44 Years | 13 | 14.0% |
| 45 to 54 Years | 4 | 4.3% |
| 55 to 64 Years | 14 | 15.0% |
| 65 to 74 Years | 5 | 5.4% |
| 75 to 84 Years | 42 | 45.2% |
| 85 Years and Over | 0 | 0.0% |
| Total | 93 | 100.0% |
Housing Finances in Bryceland
Median Income by Occupancy in Bryceland
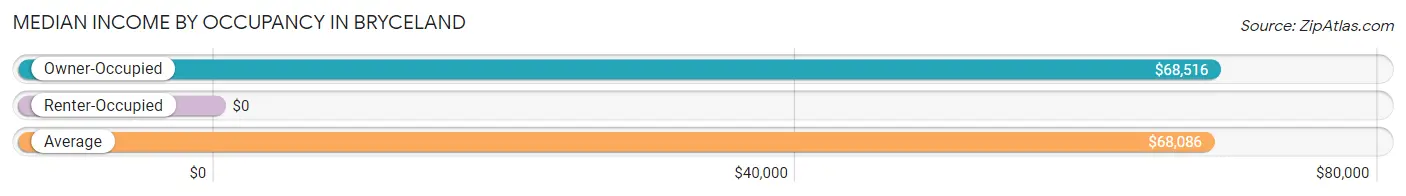
| Occupancy Type | # Households | Median Income |
| Owner-Occupied | 82 (88.2%) | $68,516 |
| Renter-Occupied | 11 (11.8%) | $0 |
| Average | 93 (100.0%) | $68,086 |
Occupancy by Householder Income Bracket in Bryceland
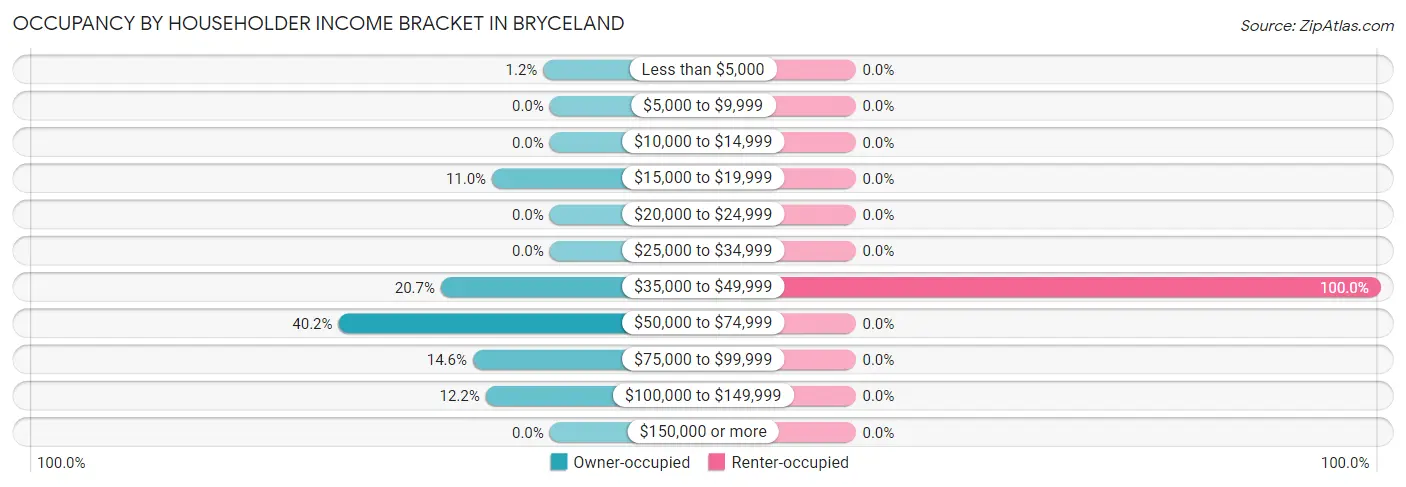
| Income Bracket | Owner-occupied | Renter-occupied |
| Less than $5,000 | 1 (1.2%) | 0 (0.0%) |
| $5,000 to $9,999 | 0 (0.0%) | 0 (0.0%) |
| $10,000 to $14,999 | 0 (0.0%) | 0 (0.0%) |
| $15,000 to $19,999 | 9 (11.0%) | 0 (0.0%) |
| $20,000 to $24,999 | 0 (0.0%) | 0 (0.0%) |
| $25,000 to $34,999 | 0 (0.0%) | 0 (0.0%) |
| $35,000 to $49,999 | 17 (20.7%) | 11 (100.0%) |
| $50,000 to $74,999 | 33 (40.2%) | 0 (0.0%) |
| $75,000 to $99,999 | 12 (14.6%) | 0 (0.0%) |
| $100,000 to $149,999 | 10 (12.2%) | 0 (0.0%) |
| $150,000 or more | 0 (0.0%) | 0 (0.0%) |
| Total | 82 (100.0%) | 11 (100.0%) |
Monthly Housing Cost Tiers in Bryceland
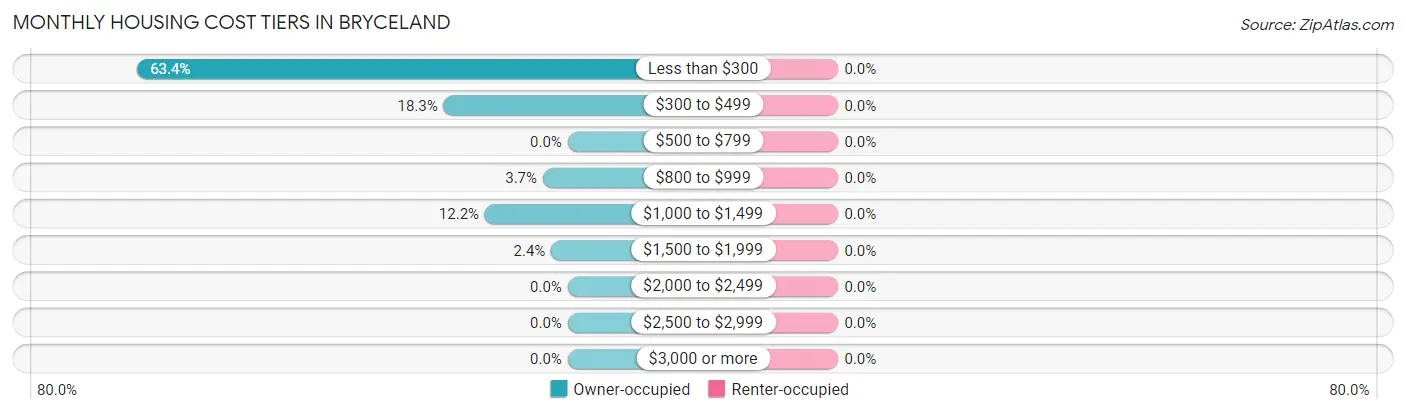
| Monthly Cost | Owner-occupied | Renter-occupied |
| Less than $300 | 52 (63.4%) | 0 (0.0%) |
| $300 to $499 | 15 (18.3%) | 0 (0.0%) |
| $500 to $799 | 0 (0.0%) | 0 (0.0%) |
| $800 to $999 | 3 (3.7%) | 0 (0.0%) |
| $1,000 to $1,499 | 10 (12.2%) | 0 (0.0%) |
| $1,500 to $1,999 | 2 (2.4%) | 0 (0.0%) |
| $2,000 to $2,499 | 0 (0.0%) | 0 (0.0%) |
| $2,500 to $2,999 | 0 (0.0%) | 0 (0.0%) |
| $3,000 or more | 0 (0.0%) | 0 (0.0%) |
| Total | 82 (100.0%) | 11 (100.0%) |
Physical Housing Characteristics in Bryceland
Housing Structures in Bryceland
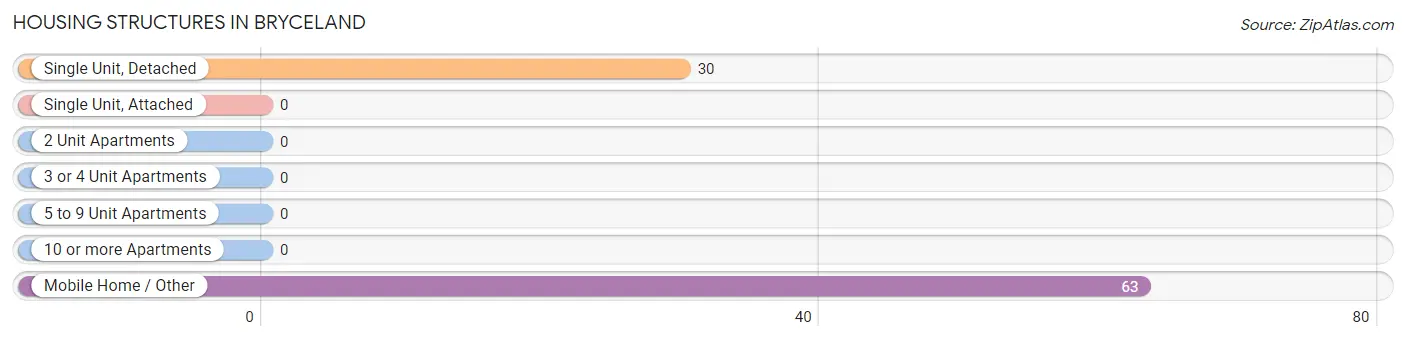
| Structure Type | # Housing Units | % Housing Units |
| Single Unit, Detached | 30 | 32.3% |
| Single Unit, Attached | 0 | 0.0% |
| 2 Unit Apartments | 0 | 0.0% |
| 3 or 4 Unit Apartments | 0 | 0.0% |
| 5 to 9 Unit Apartments | 0 | 0.0% |
| 10 or more Apartments | 0 | 0.0% |
| Mobile Home / Other | 63 | 67.7% |
| Total | 93 | 100.0% |
Housing Structures by Occupancy in Bryceland
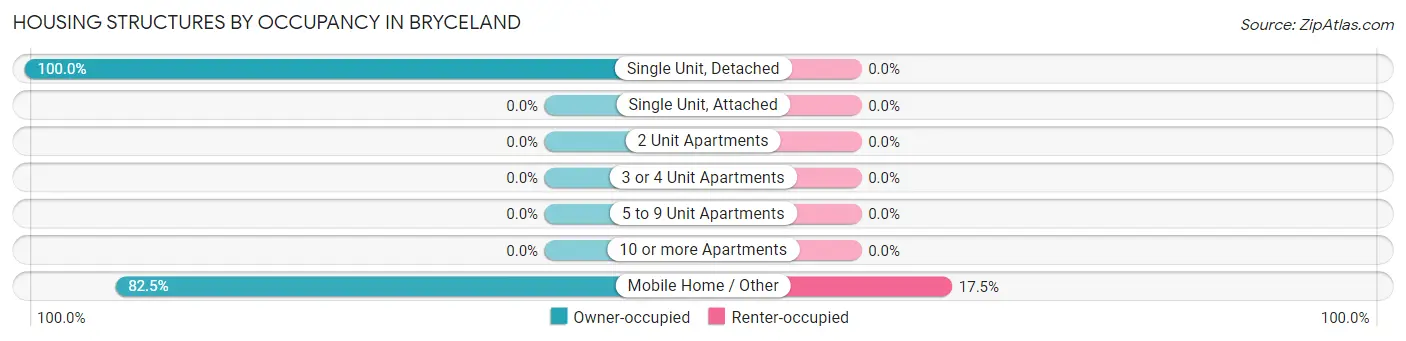
| Structure Type | Owner-occupied | Renter-occupied |
| Single Unit, Detached | 30 (100.0%) | 0 (0.0%) |
| Single Unit, Attached | 0 (0.0%) | 0 (0.0%) |
| 2 Unit Apartments | 0 (0.0%) | 0 (0.0%) |
| 3 or 4 Unit Apartments | 0 (0.0%) | 0 (0.0%) |
| 5 to 9 Unit Apartments | 0 (0.0%) | 0 (0.0%) |
| 10 or more Apartments | 0 (0.0%) | 0 (0.0%) |
| Mobile Home / Other | 52 (82.5%) | 11 (17.5%) |
| Total | 82 (88.2%) | 11 (11.8%) |
Housing Structures by Number of Rooms in Bryceland
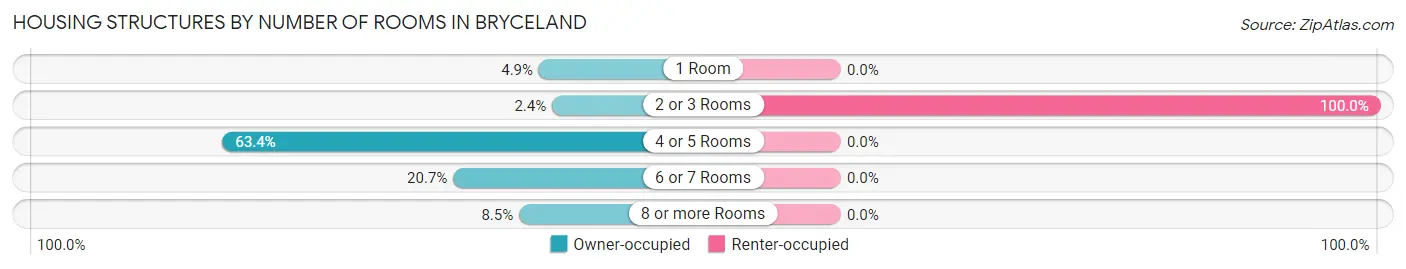
| Number of Rooms | Owner-occupied | Renter-occupied |
| 1 Room | 4 (4.9%) | 0 (0.0%) |
| 2 or 3 Rooms | 2 (2.4%) | 11 (100.0%) |
| 4 or 5 Rooms | 52 (63.4%) | 0 (0.0%) |
| 6 or 7 Rooms | 17 (20.7%) | 0 (0.0%) |
| 8 or more Rooms | 7 (8.5%) | 0 (0.0%) |
| Total | 82 (100.0%) | 11 (100.0%) |
Housing Structure by Heating Type in Bryceland
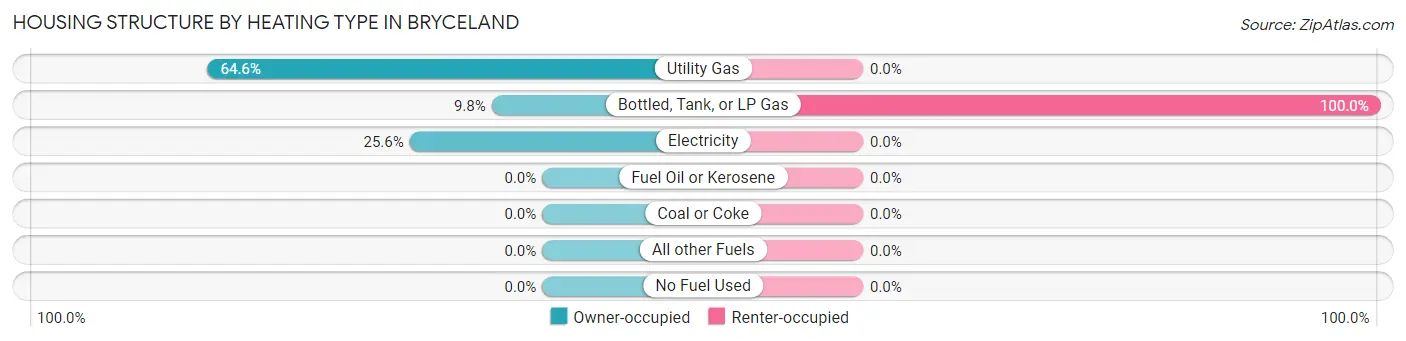
| Heating Type | Owner-occupied | Renter-occupied |
| Utility Gas | 53 (64.6%) | 0 (0.0%) |
| Bottled, Tank, or LP Gas | 8 (9.8%) | 11 (100.0%) |
| Electricity | 21 (25.6%) | 0 (0.0%) |
| Fuel Oil or Kerosene | 0 (0.0%) | 0 (0.0%) |
| Coal or Coke | 0 (0.0%) | 0 (0.0%) |
| All other Fuels | 0 (0.0%) | 0 (0.0%) |
| No Fuel Used | 0 (0.0%) | 0 (0.0%) |
| Total | 82 (100.0%) | 11 (100.0%) |
Household Vehicle Usage in Bryceland
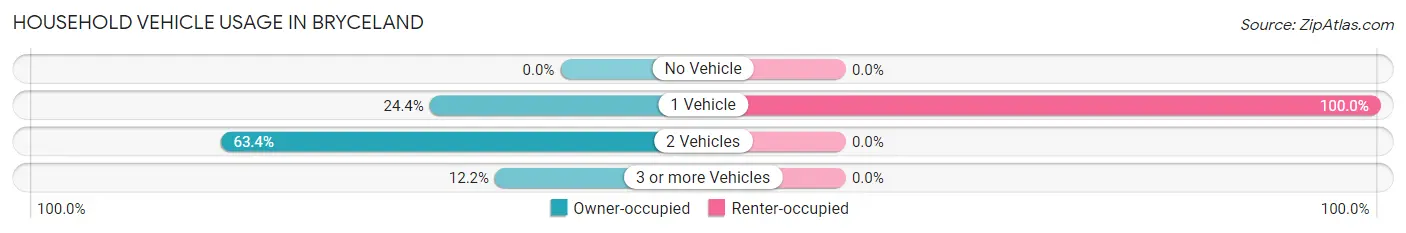
| Vehicles per Household | Owner-occupied | Renter-occupied |
| No Vehicle | 0 (0.0%) | 0 (0.0%) |
| 1 Vehicle | 20 (24.4%) | 11 (100.0%) |
| 2 Vehicles | 52 (63.4%) | 0 (0.0%) |
| 3 or more Vehicles | 10 (12.2%) | 0 (0.0%) |
| Total | 82 (100.0%) | 11 (100.0%) |
Real Estate & Mortgages in Bryceland
Real Estate and Mortgage Overview in Bryceland
| Characteristic | Without Mortgage | With Mortgage |
| Housing Units | 65 | 17 |
| Median Property Value | $52,900 | $99,300 |
| Median Household Income | $68,086 | $0 |
| Monthly Housing Costs | $140 | $0 |
| Real Estate Taxes | - | - |
Property Value by Mortgage Status in Bryceland
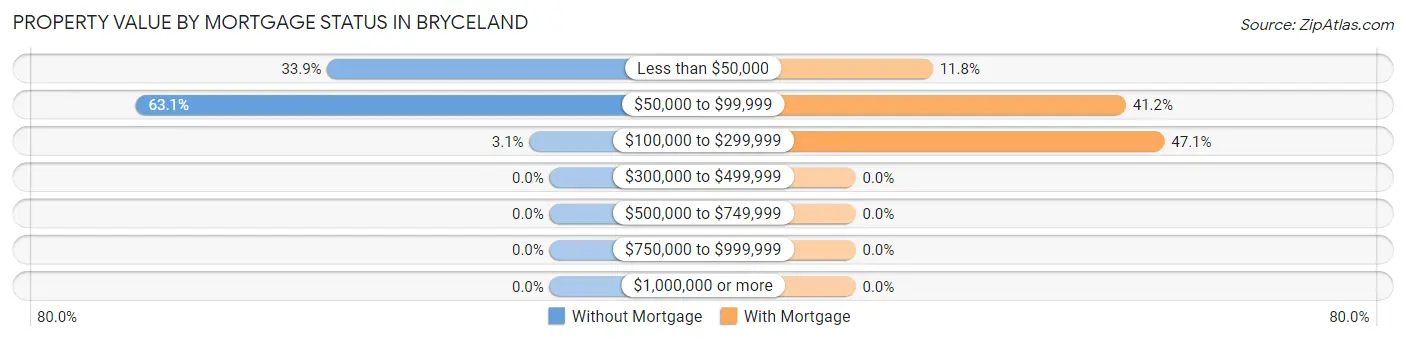
| Property Value | Without Mortgage | With Mortgage |
| Less than $50,000 | 22 (33.9%) | 2 (11.8%) |
| $50,000 to $99,999 | 41 (63.1%) | 7 (41.2%) |
| $100,000 to $299,999 | 2 (3.1%) | 8 (47.1%) |
| $300,000 to $499,999 | 0 (0.0%) | 0 (0.0%) |
| $500,000 to $749,999 | 0 (0.0%) | 0 (0.0%) |
| $750,000 to $999,999 | 0 (0.0%) | 0 (0.0%) |
| $1,000,000 or more | 0 (0.0%) | 0 (0.0%) |
| Total | 65 (100.0%) | 17 (100.0%) |
Household Income by Mortgage Status in Bryceland
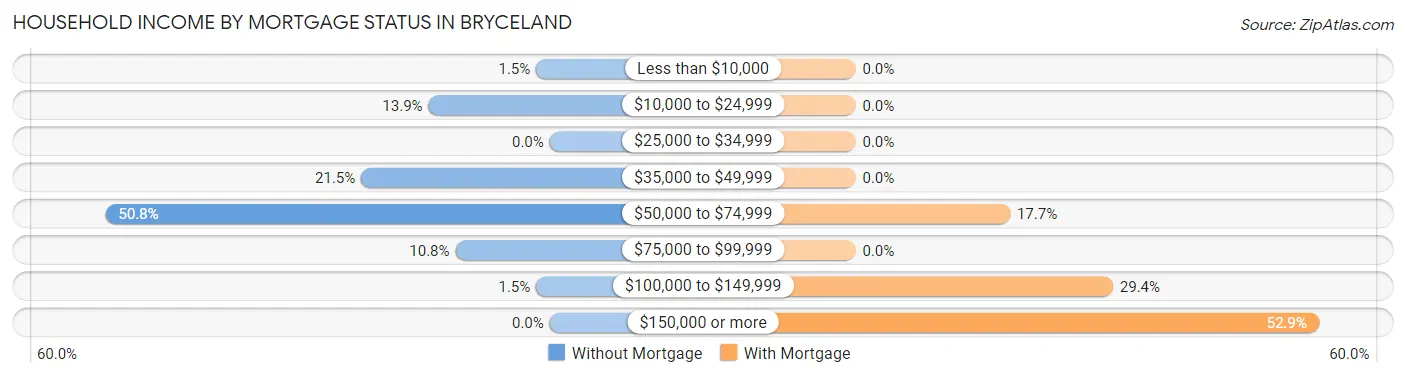
| Household Income | Without Mortgage | With Mortgage |
| Less than $10,000 | 1 (1.5%) | 0 (0.0%) |
| $10,000 to $24,999 | 9 (13.9%) | 0 (0.0%) |
| $25,000 to $34,999 | 0 (0.0%) | 0 (0.0%) |
| $35,000 to $49,999 | 14 (21.5%) | 0 (0.0%) |
| $50,000 to $74,999 | 33 (50.8%) | 3 (17.6%) |
| $75,000 to $99,999 | 7 (10.8%) | 0 (0.0%) |
| $100,000 to $149,999 | 1 (1.5%) | 5 (29.4%) |
| $150,000 or more | 0 (0.0%) | 9 (52.9%) |
| Total | 65 (100.0%) | 17 (100.0%) |
Property Value to Household Income Ratio in Bryceland
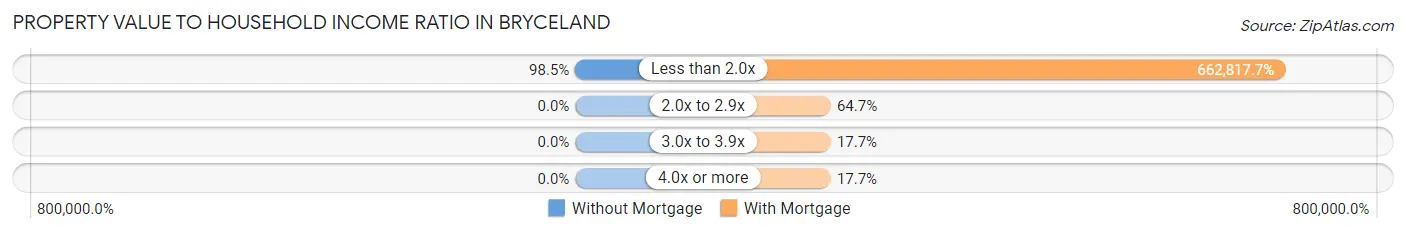
| Value-to-Income Ratio | Without Mortgage | With Mortgage |
| Less than 2.0x | 64 (98.5%) | 112,679 (662,817.6%) |
| 2.0x to 2.9x | 0 (0.0%) | 11 (64.7%) |
| 3.0x to 3.9x | 0 (0.0%) | 3 (17.6%) |
| 4.0x or more | 0 (0.0%) | 3 (17.6%) |
| Total | 65 (100.0%) | 17 (100.0%) |
Real Estate Taxes by Mortgage Status in Bryceland
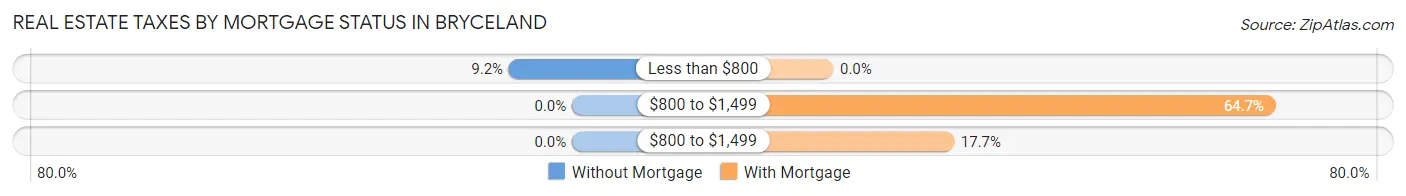
| Property Taxes | Without Mortgage | With Mortgage |
| Less than $800 | 6 (9.2%) | 0 (0.0%) |
| $800 to $1,499 | 0 (0.0%) | 11 (64.7%) |
| $800 to $1,499 | 0 (0.0%) | 3 (17.6%) |
| Total | 65 (100.0%) | 17 (100.0%) |
Health & Disability in Bryceland
Health Insurance Coverage by Age in Bryceland
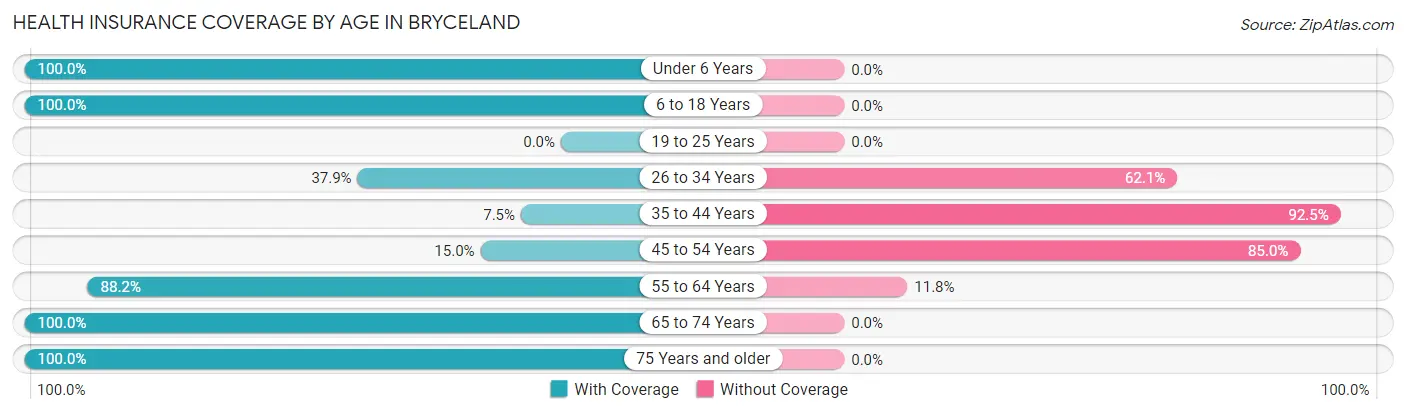
| Age Bracket | With Coverage | Without Coverage |
| Under 6 Years | 7 (100.0%) | 0 (0.0%) |
| 6 to 18 Years | 9 (100.0%) | 0 (0.0%) |
| 19 to 25 Years | 0 (0.0%) | 0 (0.0%) |
| 26 to 34 Years | 11 (37.9%) | 18 (62.1%) |
| 35 to 44 Years | 5 (7.5%) | 62 (92.5%) |
| 45 to 54 Years | 3 (15.0%) | 17 (85.0%) |
| 55 to 64 Years | 15 (88.2%) | 2 (11.8%) |
| 65 to 74 Years | 13 (100.0%) | 0 (0.0%) |
| 75 Years and older | 45 (100.0%) | 0 (0.0%) |
| Total | 108 (52.2%) | 99 (47.8%) |
Health Insurance Coverage by Citizenship Status in Bryceland
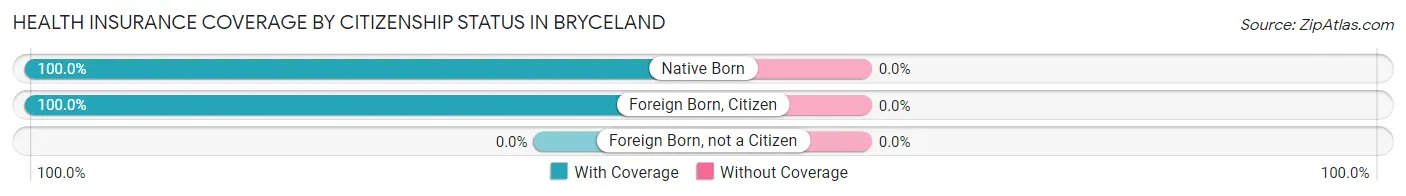
| Citizenship Status | With Coverage | Without Coverage |
| Native Born | 7 (100.0%) | 0 (0.0%) |
| Foreign Born, Citizen | 9 (100.0%) | 0 (0.0%) |
| Foreign Born, not a Citizen | 0 (0.0%) | 0 (0.0%) |
Health Insurance Coverage by Household Income in Bryceland
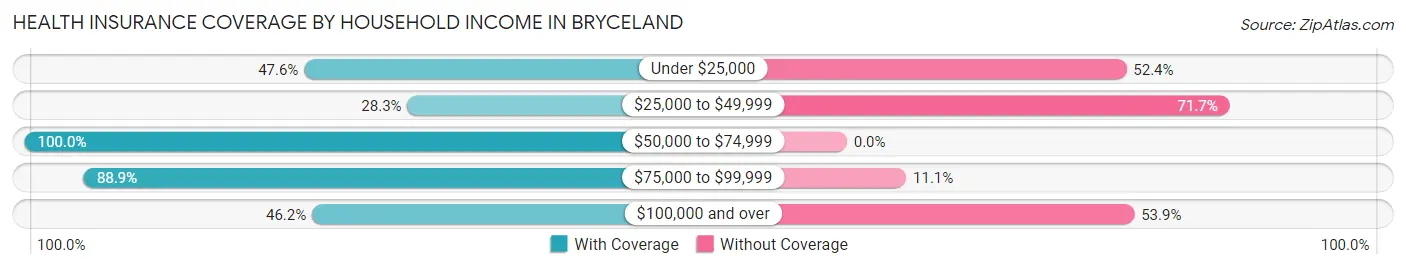
| Household Income | With Coverage | Without Coverage |
| Under $25,000 | 10 (47.6%) | 11 (52.4%) |
| $25,000 to $49,999 | 28 (28.3%) | 71 (71.7%) |
| $50,000 to $74,999 | 34 (100.0%) | 0 (0.0%) |
| $75,000 to $99,999 | 24 (88.9%) | 3 (11.1%) |
| $100,000 and over | 12 (46.2%) | 14 (53.8%) |
Public vs Private Health Insurance Coverage by Age in Bryceland
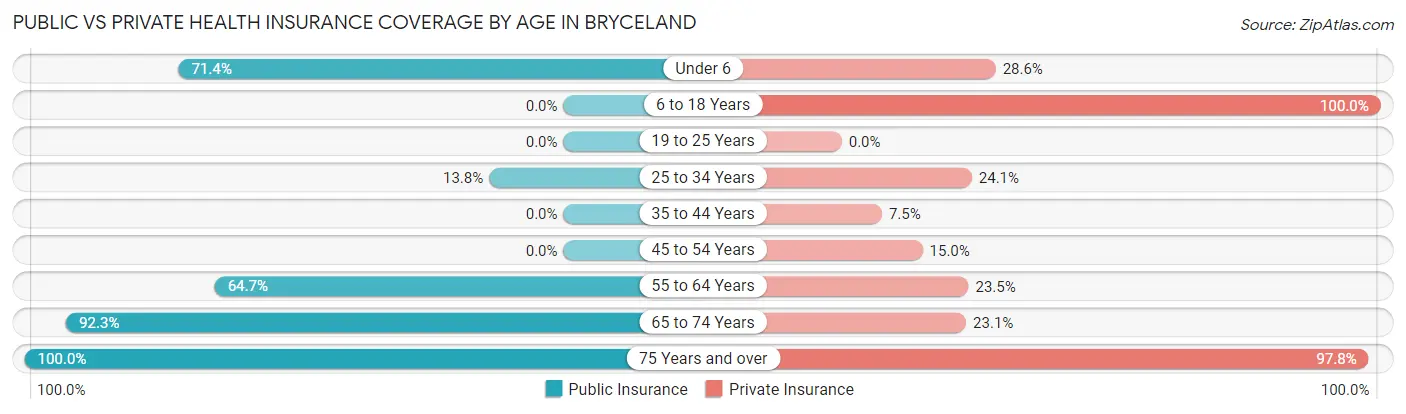
| Age Bracket | Public Insurance | Private Insurance |
| Under 6 | 5 (71.4%) | 2 (28.6%) |
| 6 to 18 Years | 0 (0.0%) | 9 (100.0%) |
| 19 to 25 Years | 0 (0.0%) | 0 (0.0%) |
| 25 to 34 Years | 4 (13.8%) | 7 (24.1%) |
| 35 to 44 Years | 0 (0.0%) | 5 (7.5%) |
| 45 to 54 Years | 0 (0.0%) | 3 (15.0%) |
| 55 to 64 Years | 11 (64.7%) | 4 (23.5%) |
| 65 to 74 Years | 12 (92.3%) | 3 (23.1%) |
| 75 Years and over | 45 (100.0%) | 44 (97.8%) |
| Total | 77 (37.2%) | 77 (37.2%) |
Disability Status by Sex by Age in Bryceland
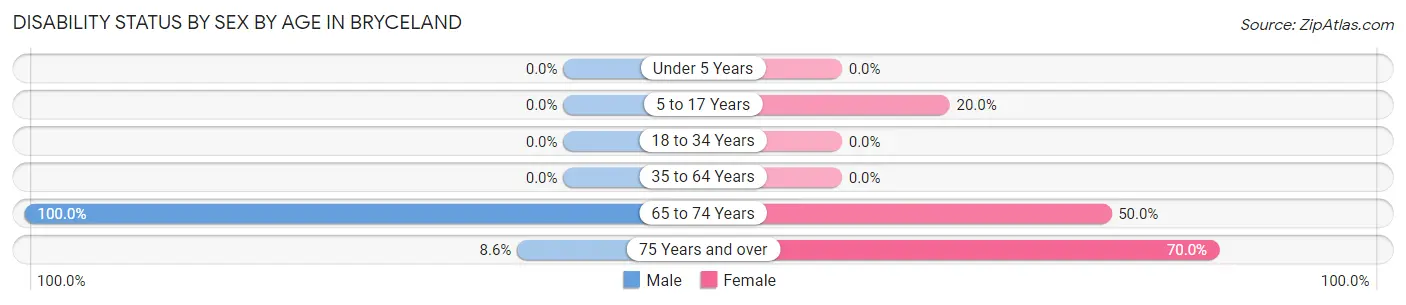
| Age Bracket | Male | Female |
| Under 5 Years | 0 (0.0%) | 0 (0.0%) |
| 5 to 17 Years | 0 (0.0%) | 1 (20.0%) |
| 18 to 34 Years | 0 (0.0%) | 0 (0.0%) |
| 35 to 64 Years | 0 (0.0%) | 0 (0.0%) |
| 65 to 74 Years | 3 (100.0%) | 5 (50.0%) |
| 75 Years and over | 3 (8.6%) | 7 (70.0%) |
Disability Class by Sex by Age in Bryceland
Disability Class: Hearing Difficulty
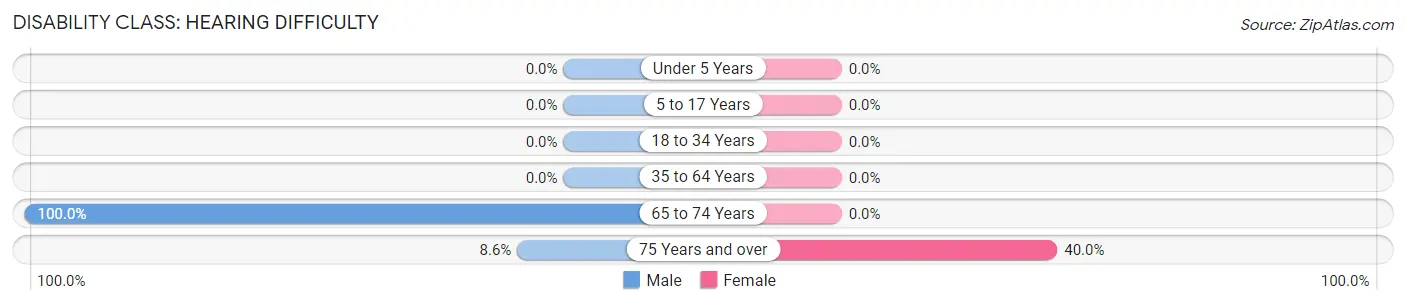
| Age Bracket | Male | Female |
| Under 5 Years | 0 (0.0%) | 0 (0.0%) |
| 5 to 17 Years | 0 (0.0%) | 0 (0.0%) |
| 18 to 34 Years | 0 (0.0%) | 0 (0.0%) |
| 35 to 64 Years | 0 (0.0%) | 0 (0.0%) |
| 65 to 74 Years | 3 (100.0%) | 0 (0.0%) |
| 75 Years and over | 3 (8.6%) | 4 (40.0%) |
Disability Class: Vision Difficulty
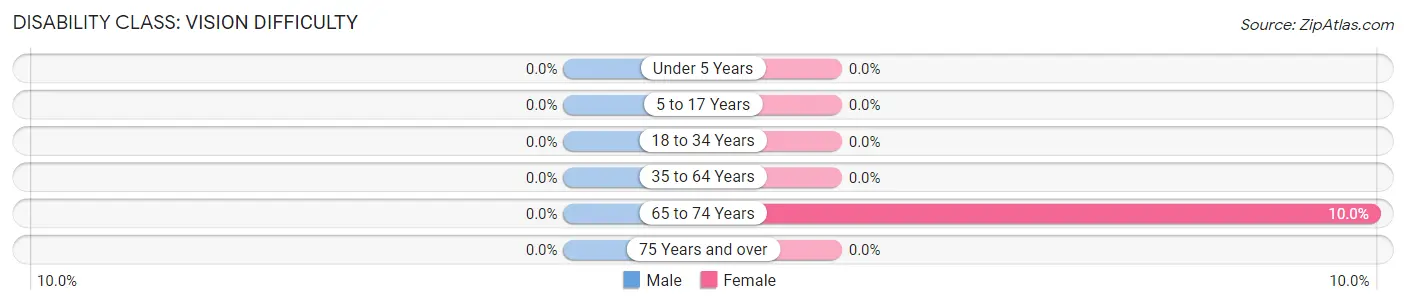
| Age Bracket | Male | Female |
| Under 5 Years | 0 (0.0%) | 0 (0.0%) |
| 5 to 17 Years | 0 (0.0%) | 0 (0.0%) |
| 18 to 34 Years | 0 (0.0%) | 0 (0.0%) |
| 35 to 64 Years | 0 (0.0%) | 0 (0.0%) |
| 65 to 74 Years | 0 (0.0%) | 1 (10.0%) |
| 75 Years and over | 0 (0.0%) | 0 (0.0%) |
Disability Class: Cognitive Difficulty
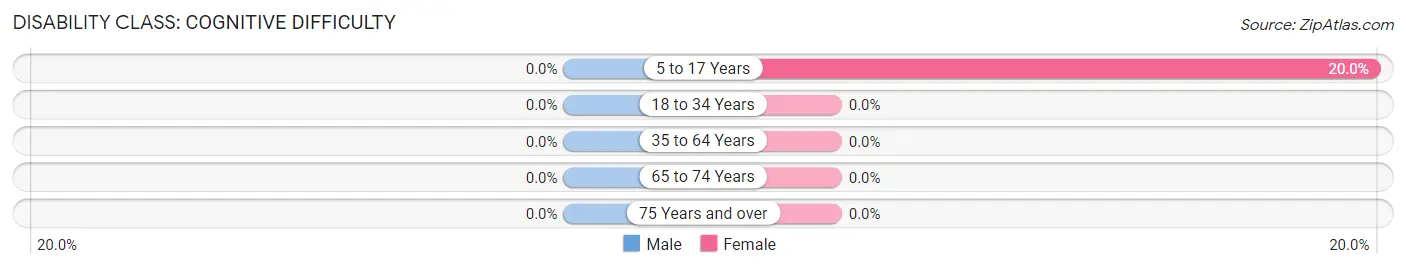
| Age Bracket | Male | Female |
| 5 to 17 Years | 0 (0.0%) | 1 (20.0%) |
| 18 to 34 Years | 0 (0.0%) | 0 (0.0%) |
| 35 to 64 Years | 0 (0.0%) | 0 (0.0%) |
| 65 to 74 Years | 0 (0.0%) | 0 (0.0%) |
| 75 Years and over | 0 (0.0%) | 0 (0.0%) |
Disability Class: Ambulatory Difficulty
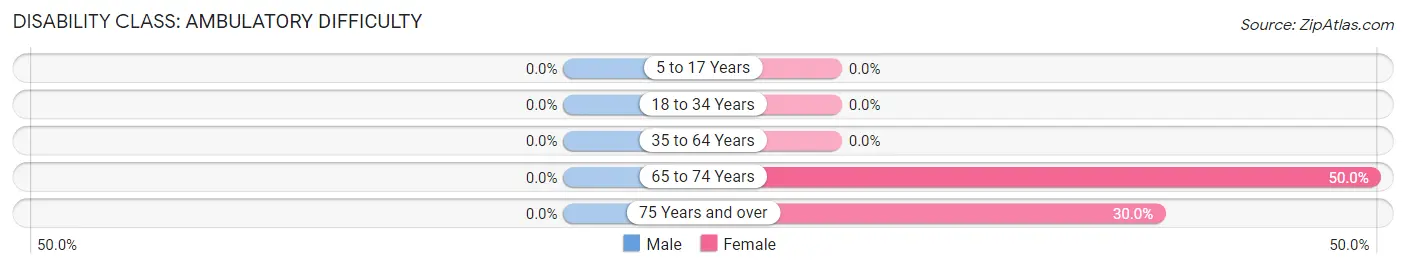
| Age Bracket | Male | Female |
| 5 to 17 Years | 0 (0.0%) | 0 (0.0%) |
| 18 to 34 Years | 0 (0.0%) | 0 (0.0%) |
| 35 to 64 Years | 0 (0.0%) | 0 (0.0%) |
| 65 to 74 Years | 0 (0.0%) | 5 (50.0%) |
| 75 Years and over | 0 (0.0%) | 3 (30.0%) |
Disability Class: Self-Care Difficulty
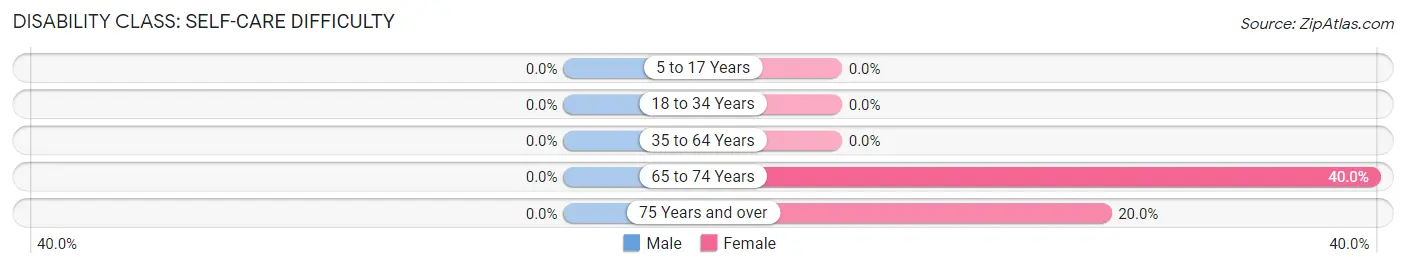
| Age Bracket | Male | Female |
| 5 to 17 Years | 0 (0.0%) | 0 (0.0%) |
| 18 to 34 Years | 0 (0.0%) | 0 (0.0%) |
| 35 to 64 Years | 0 (0.0%) | 0 (0.0%) |
| 65 to 74 Years | 0 (0.0%) | 4 (40.0%) |
| 75 Years and over | 0 (0.0%) | 2 (20.0%) |
Technology Access in Bryceland
Computing Device Access in Bryceland
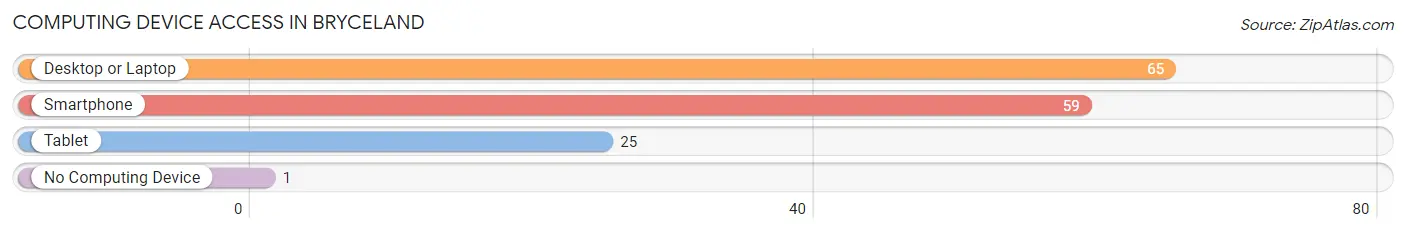
| Device Type | # Households | % Households |
| Desktop or Laptop | 65 | 69.9% |
| Smartphone | 59 | 63.4% |
| Tablet | 25 | 26.9% |
| No Computing Device | 1 | 1.1% |
| Total | 93 | 100.0% |
Internet Access in Bryceland
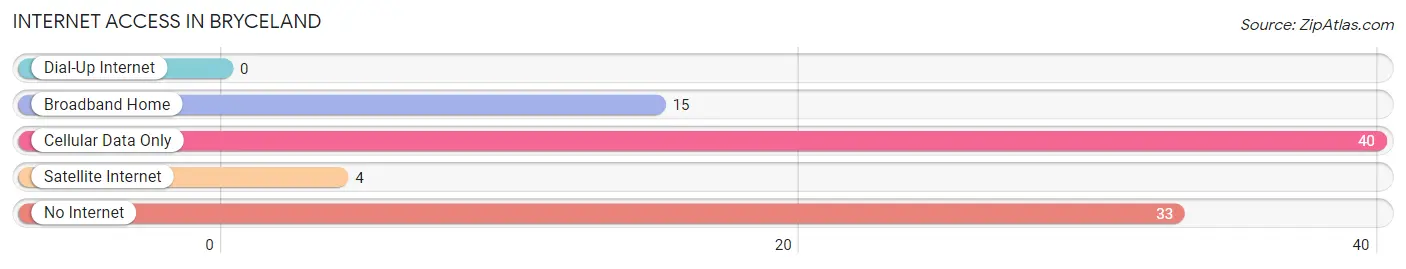
| Internet Type | # Households | % Households |
| Dial-Up Internet | 0 | 0.0% |
| Broadband Home | 15 | 16.1% |
| Cellular Data Only | 40 | 43.0% |
| Satellite Internet | 4 | 4.3% |
| No Internet | 33 | 35.5% |
| Total | 93 | 100.0% |
Bryceland Summary
Bryceland is a small town located in the northern part of Louisiana, United States. It is situated in the northern part of Lincoln Parish, and is part of the Ruston Metropolitan Statistical Area. The town has a population of approximately 1,000 people, and is known for its rural charm and friendly atmosphere.
History
Bryceland was founded in 1883 by William Bryce, a former Confederate soldier. He named the town after his father, who had served in the Civil War. The town was originally a small farming community, and the main crops grown were cotton, corn, and sweet potatoes. In the early 1900s, the town began to grow and develop, and by the 1920s, it had become a thriving community.
In the 1950s, the town began to experience a decline in population, as many of its residents moved away to larger cities. However, in the late 1970s, the town began to experience a resurgence in population, as people began to move back to the area. Today, Bryceland is a small, rural town with a population of approximately 1,000 people.
Geography
Bryceland is located in the northern part of Louisiana, in the northern part of Lincoln Parish. It is situated in the Ruston Metropolitan Statistical Area, and is approximately 30 miles from the city of Ruston. The town is located in a rural area, and is surrounded by farmland and forests. The town is situated on the banks of the Ouachita River, and is home to several small lakes and ponds.
Economy
The economy of Bryceland is largely based on agriculture. The town is home to several farms, and the main crops grown are cotton, corn, and sweet potatoes. In addition, the town is home to several small businesses, including a grocery store, a hardware store, and a few restaurants.
Demographics
As of the 2010 census, the population of Bryceland was 1,000 people. The racial makeup of the town was 95.2% White, 2.2% African American, 0.2% Native American, 0.2% Asian, 0.2% from other races, and 1.9% from two or more races. The median household income was $31,250, and the median family income was $37,500. The per capita income was $15,000.
Conclusion
Bryceland is a small, rural town located in the northern part of Louisiana. It is situated in the Ruston Metropolitan Statistical Area, and is home to approximately 1,000 people. The town is known for its rural charm and friendly atmosphere, and its economy is largely based on agriculture. The town has a diverse population, with a median household income of $31,250 and a median family income of $37,500.
Common Questions
What is Per Capita Income in Bryceland?
Per Capita income in Bryceland is $29,936.
What is the Median Household income in Bryceland?
Median Household Income in Bryceland is $68,086.
What is Inequality or Gini Index in Bryceland?
Inequality or Gini Index in Bryceland is 0.25.
What is the Total Population of Bryceland?
Total Population of Bryceland is 207.
What is the Total Male Population of Bryceland?
Total Male Population of Bryceland is 114.
What is the Total Female Population of Bryceland?
Total Female Population of Bryceland is 93.
What is the Ratio of Males per 100 Females in Bryceland?
There are 122.58 Males per 100 Females in Bryceland.
What is the Ratio of Females per 100 Males in Bryceland?
There are 81.58 Females per 100 Males in Bryceland.
What is the Median Population Age in Bryceland?
Median Population Age in Bryceland is 43.7 Years.
What is the Average Family Size in Bryceland
Average Family Size in Bryceland is 2.9 People.
What is the Average Household Size in Bryceland
Average Household Size in Bryceland is 2.2 People.
How Large is the Labor Force in Bryceland?
There are 131 People in the Labor Forcein in Bryceland.
What is the Percentage of People in the Labor Force in Bryceland?
67.2% of People are in the Labor Force in Bryceland.
What is the Unemployment Rate in Bryceland?
Unemployment Rate in Bryceland is 5.3%.