Cotton Valley, LA Map & Demographics
Cotton Valley Map
Cotton Valley Overview
$14,447
PER CAPITA INCOME
$35,417
AVG FAMILY INCOME
$21,806
AVG HOUSEHOLD INCOME
43.3%
WAGE / INCOME GAP [ % ]
56.7¢/ $1
WAGE / INCOME GAP [ $ ]
0.50
INEQUALITY / GINI INDEX
713
TOTAL POPULATION
291
MALE POPULATION
422
FEMALE POPULATION
68.96
MALES / 100 FEMALES
145.02
FEMALES / 100 MALES
31.0
MEDIAN AGE
3.6
AVG FAMILY SIZE
2.7
AVG HOUSEHOLD SIZE
211
LABOR FORCE [ PEOPLE ]
45.4%
PERCENT IN LABOR FORCE
2.8%
UNEMPLOYMENT RATE
Cotton Valley Zip Codes
Cotton Valley Area Codes
Income in Cotton Valley
Income Overview in Cotton Valley
Per Capita Income in Cotton Valley is $14,447, while median incomes of families and households are $35,417 and $21,806 respectively.
| Characteristic | Number | Measure |
| Per Capita Income | 713 | $14,447 |
| Median Family Income | 163 | $35,417 |
| Mean Family Income | 163 | $52,080 |
| Median Household Income | 265 | $21,806 |
| Mean Household Income | 265 | $39,392 |
| Income Deficit | 163 | $0 |
| Wage / Income Gap (%) | 713 | 43.31% |
| Wage / Income Gap ($) | 713 | 56.69¢ per $1 |
| Gini / Inequality Index | 713 | 0.50 |
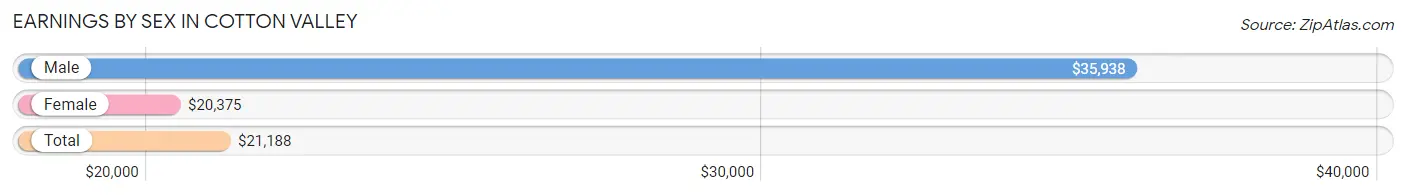
Earnings by Sex in Cotton Valley
Average Earnings in Cotton Valley are $21,188, $35,938 for men and $20,375 for women, a difference of 43.3%.
| Sex | Number | Average Earnings |
| Male | 103 (43.5%) | $35,938 |
| Female | 134 (56.5%) | $20,375 |
| Total | 237 (100.0%) | $21,188 |
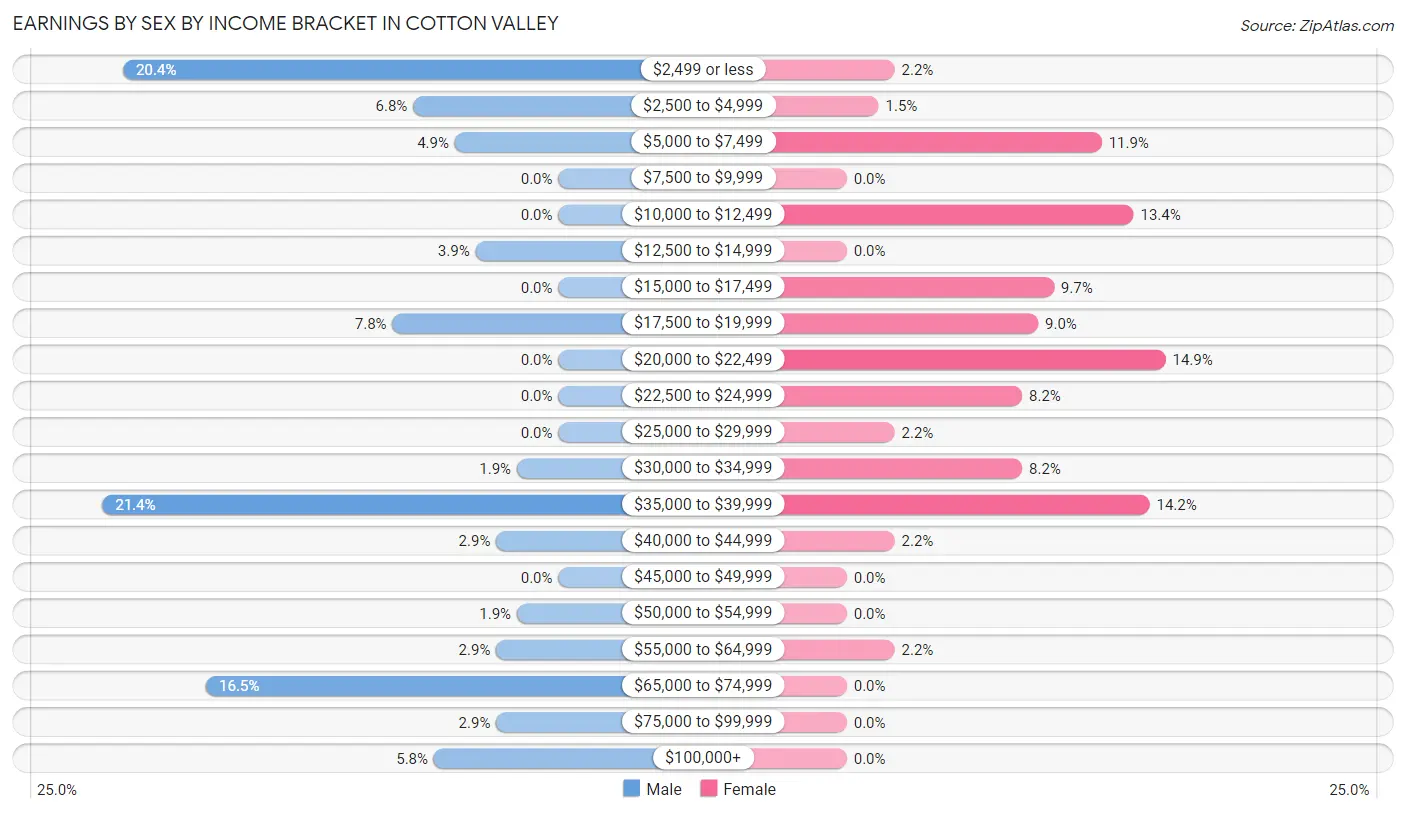
Earnings by Sex by Income Bracket in Cotton Valley
The most common earnings brackets in Cotton Valley are $35,000 to $39,999 for men (22 | 21.4%) and $20,000 to $22,499 for women (20 | 14.9%).
| Income | Male | Female |
| $2,499 or less | 21 (20.4%) | 3 (2.2%) |
| $2,500 to $4,999 | 7 (6.8%) | 2 (1.5%) |
| $5,000 to $7,499 | 5 (4.9%) | 16 (11.9%) |
| $7,500 to $9,999 | 0 (0.0%) | 0 (0.0%) |
| $10,000 to $12,499 | 0 (0.0%) | 18 (13.4%) |
| $12,500 to $14,999 | 4 (3.9%) | 0 (0.0%) |
| $15,000 to $17,499 | 0 (0.0%) | 13 (9.7%) |
| $17,500 to $19,999 | 8 (7.8%) | 12 (9.0%) |
| $20,000 to $22,499 | 0 (0.0%) | 20 (14.9%) |
| $22,500 to $24,999 | 0 (0.0%) | 11 (8.2%) |
| $25,000 to $29,999 | 0 (0.0%) | 3 (2.2%) |
| $30,000 to $34,999 | 2 (1.9%) | 11 (8.2%) |
| $35,000 to $39,999 | 22 (21.4%) | 19 (14.2%) |
| $40,000 to $44,999 | 3 (2.9%) | 3 (2.2%) |
| $45,000 to $49,999 | 0 (0.0%) | 0 (0.0%) |
| $50,000 to $54,999 | 2 (1.9%) | 0 (0.0%) |
| $55,000 to $64,999 | 3 (2.9%) | 3 (2.2%) |
| $65,000 to $74,999 | 17 (16.5%) | 0 (0.0%) |
| $75,000 to $99,999 | 3 (2.9%) | 0 (0.0%) |
| $100,000+ | 6 (5.8%) | 0 (0.0%) |
| Total | 103 (100.0%) | 134 (100.0%) |
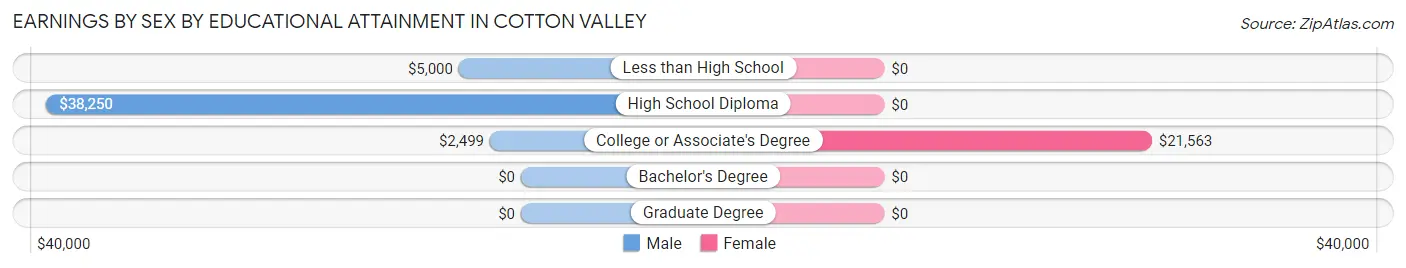
Earnings by Sex by Educational Attainment in Cotton Valley
Average earnings in Cotton Valley are $36,042 for men and $20,625 for women, a difference of 42.8%. Men with an educational attainment of high school diploma enjoy the highest average annual earnings of $38,250, while those with college or associate's degree education earn the least with $2,499. Women with an educational attainment of college or associate's degree earn the most with the average annual earnings of $21,563, while those with college or associate's degree education have the smallest earnings of $21,563.
| Educational Attainment | Male Income | Female Income |
| Less than High School | $5,000 | $0 |
| High School Diploma | $38,250 | $0 |
| College or Associate's Degree | $2,499 | $21,563 |
| Bachelor's Degree | - | - |
| Graduate Degree | - | - |
| Total | $36,042 | $20,625 |
Family Income in Cotton Valley
Family Income Brackets in Cotton Valley
According to the Cotton Valley family income data, there are 29 families falling into the $10,000 to $14,999 income range, which is the most common income bracket and makes up 17.8% of all families.
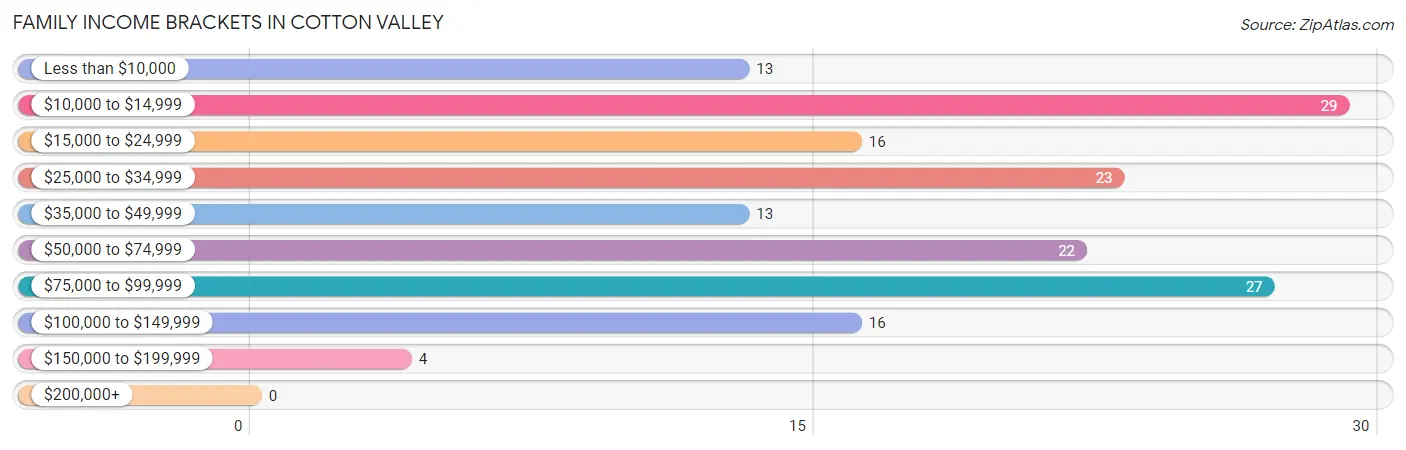
| Income Bracket | # Families | % Families |
| Less than $10,000 | 13 | 8.0% |
| $10,000 to $14,999 | 29 | 17.8% |
| $15,000 to $24,999 | 16 | 9.8% |
| $25,000 to $34,999 | 23 | 14.1% |
| $35,000 to $49,999 | 13 | 8.0% |
| $50,000 to $74,999 | 22 | 13.5% |
| $75,000 to $99,999 | 27 | 16.6% |
| $100,000 to $149,999 | 16 | 9.8% |
| $150,000 to $199,999 | 4 | 2.5% |
| $200,000+ | 0 | 0.0% |
Family Income by Famaliy Size in Cotton Valley
6-person families (15 | 9.2%) account for the highest median family income in Cotton Valley with $73,977 per family, while 5-person families (7 | 4.3%) have the highest median income of $14,417 per family member.
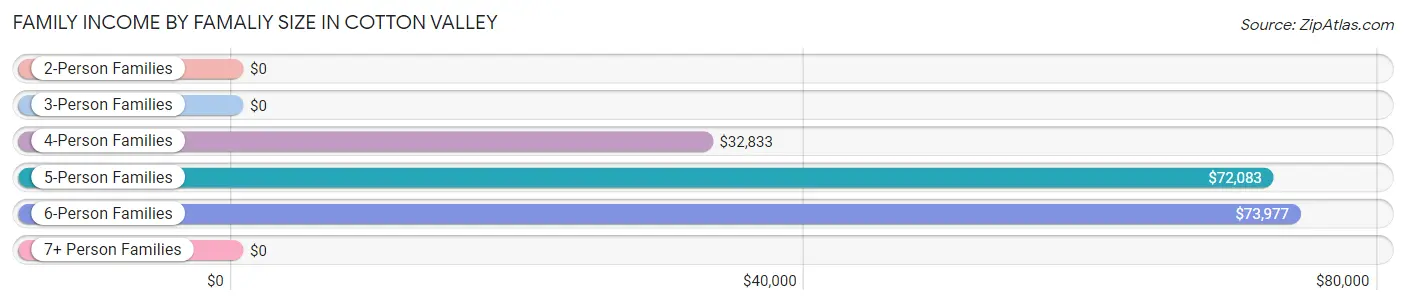
| Income Bracket | # Families | Median Income |
| 2-Person Families | 72 (44.2%) | $0 |
| 3-Person Families | 19 (11.7%) | $0 |
| 4-Person Families | 42 (25.8%) | $32,833 |
| 5-Person Families | 7 (4.3%) | $72,083 |
| 6-Person Families | 15 (9.2%) | $73,977 |
| 7+ Person Families | 8 (4.9%) | $0 |
| Total | 163 (100.0%) | $35,417 |
Family Income by Number of Earners in Cotton Valley
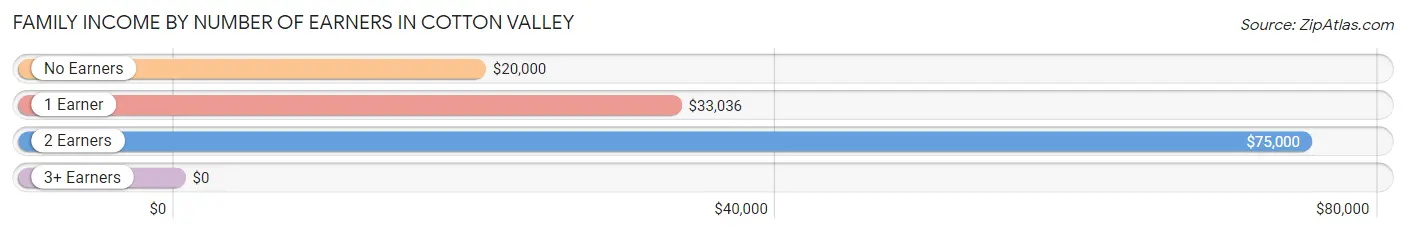
| Number of Earners | # Families | Median Income |
| No Earners | 34 (20.9%) | $20,000 |
| 1 Earner | 74 (45.4%) | $33,036 |
| 2 Earners | 54 (33.1%) | $75,000 |
| 3+ Earners | 1 (0.6%) | $0 |
| Total | 163 (100.0%) | $35,417 |
Household Income in Cotton Valley
Household Income Brackets in Cotton Valley
With 70 households falling in the category, the $10,000 to $14,999 income range is the most frequent in Cotton Valley, accounting for 26.4% of all households.
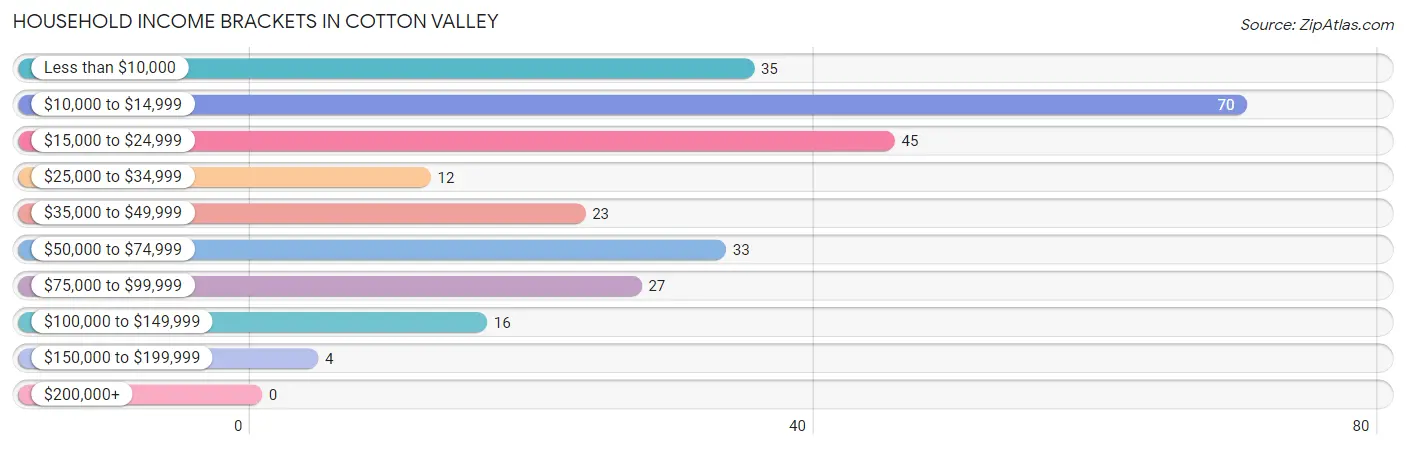
| Income Bracket | # Households | % Households |
| Less than $10,000 | 35 | 13.2% |
| $10,000 to $14,999 | 70 | 26.4% |
| $15,000 to $24,999 | 45 | 17.0% |
| $25,000 to $34,999 | 12 | 4.5% |
| $35,000 to $49,999 | 23 | 8.7% |
| $50,000 to $74,999 | 33 | 12.5% |
| $75,000 to $99,999 | 27 | 10.2% |
| $100,000 to $149,999 | 16 | 6.0% |
| $150,000 to $199,999 | 4 | 1.5% |
| $200,000+ | 0 | 0.0% |
Household Income by Householder Age in Cotton Valley
The median household income in Cotton Valley is $21,806, with the highest median household income of $31,000 found in the 45 to 64 years age bracket for the primary householder. A total of 100 households (37.7%) fall into this category. Meanwhile, the 15 to 24 years age bracket for the primary householder has the lowest median household income of $0, with 12 households (4.5%) in this group.
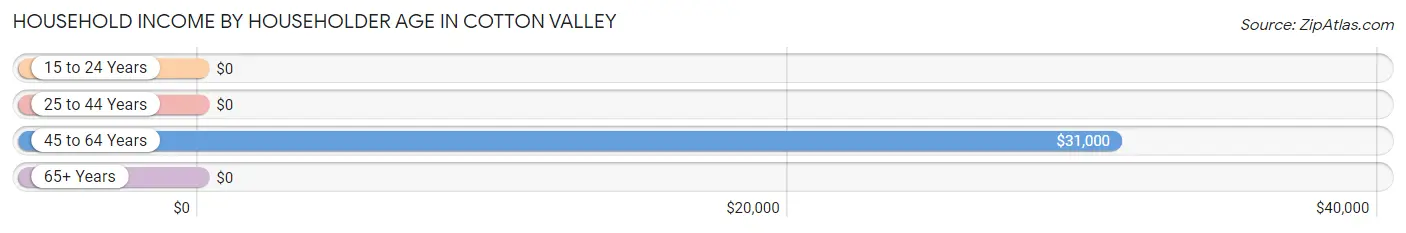
| Income Bracket | # Households | Median Income |
| 15 to 24 Years | 12 (4.5%) | $0 |
| 25 to 44 Years | 75 (28.3%) | $0 |
| 45 to 64 Years | 100 (37.7%) | $31,000 |
| 65+ Years | 78 (29.4%) | $0 |
| Total | 265 (100.0%) | $21,806 |
Poverty in Cotton Valley
Income Below Poverty by Sex and Age in Cotton Valley
With 32.0% poverty level for males and 35.3% for females among the residents of Cotton Valley, 16 and 17 year old males and 18 to 24 year old females are the most vulnerable to poverty, with 1 males (100.0%) and 20 females (52.6%) in their respective age groups living below the poverty level.
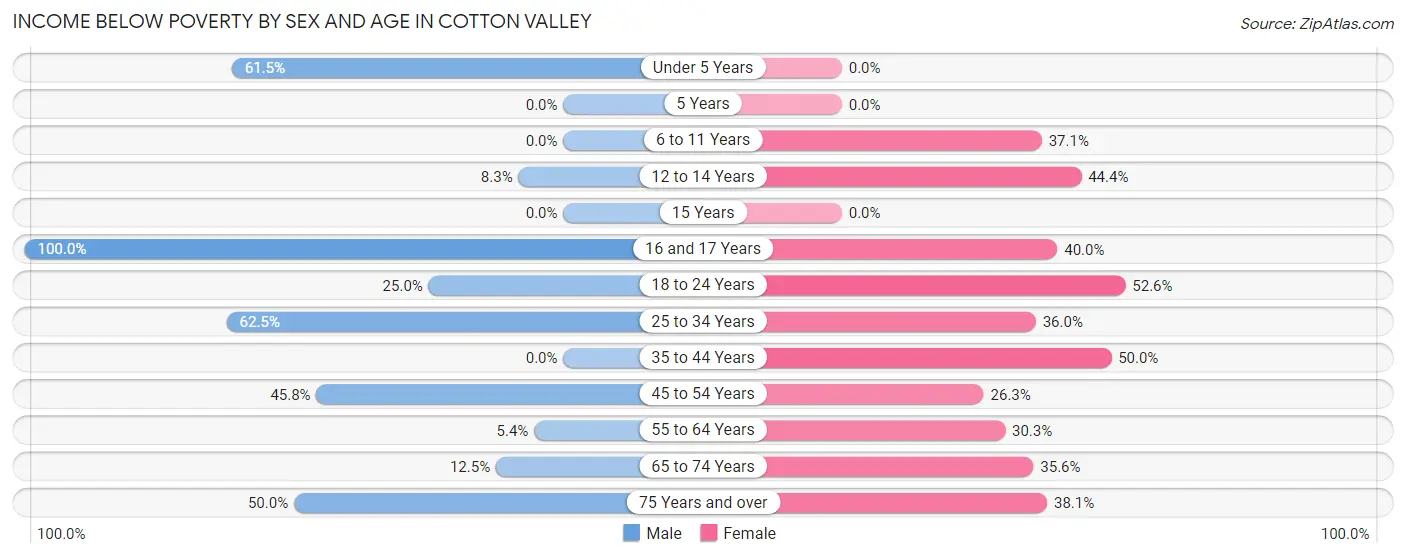
| Age Bracket | Male | Female |
| Under 5 Years | 40 (61.5%) | 0 (0.0%) |
| 5 Years | 0 (0.0%) | 0 (0.0%) |
| 6 to 11 Years | 0 (0.0%) | 36 (37.1%) |
| 12 to 14 Years | 1 (8.3%) | 8 (44.4%) |
| 15 Years | 0 (0.0%) | 0 (0.0%) |
| 16 and 17 Years | 1 (100.0%) | 2 (40.0%) |
| 18 to 24 Years | 1 (25.0%) | 20 (52.6%) |
| 25 to 34 Years | 30 (62.5%) | 18 (36.0%) |
| 35 to 44 Years | 0 (0.0%) | 11 (50.0%) |
| 45 to 54 Years | 11 (45.8%) | 10 (26.3%) |
| 55 to 64 Years | 2 (5.4%) | 20 (30.3%) |
| 65 to 74 Years | 4 (12.5%) | 16 (35.6%) |
| 75 Years and over | 3 (50.0%) | 8 (38.1%) |
| Total | 93 (32.0%) | 149 (35.3%) |
Income Above Poverty by Sex and Age in Cotton Valley
According to the poverty statistics in Cotton Valley, males aged 5 years and females aged under 5 years are the age groups that are most secure financially, with 100.0% of males and 100.0% of females in these age groups living above the poverty line.
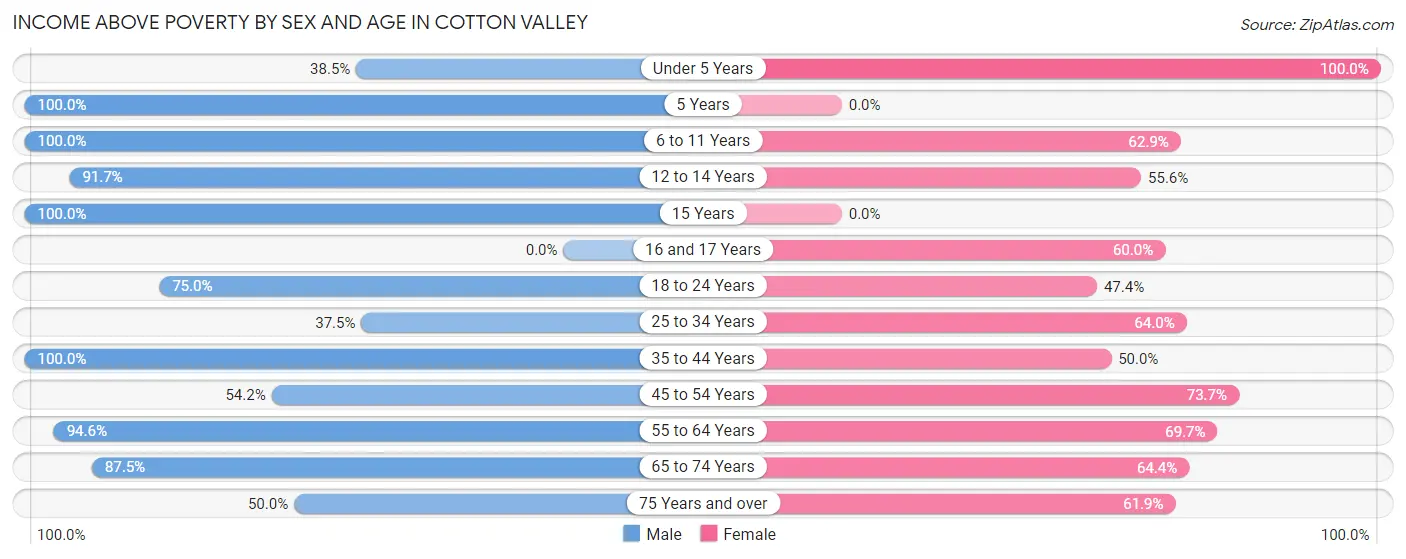
| Age Bracket | Male | Female |
| Under 5 Years | 25 (38.5%) | 22 (100.0%) |
| 5 Years | 14 (100.0%) | 0 (0.0%) |
| 6 to 11 Years | 18 (100.0%) | 61 (62.9%) |
| 12 to 14 Years | 11 (91.7%) | 10 (55.6%) |
| 15 Years | 2 (100.0%) | 0 (0.0%) |
| 16 and 17 Years | 0 (0.0%) | 3 (60.0%) |
| 18 to 24 Years | 3 (75.0%) | 18 (47.4%) |
| 25 to 34 Years | 18 (37.5%) | 32 (64.0%) |
| 35 to 44 Years | 28 (100.0%) | 11 (50.0%) |
| 45 to 54 Years | 13 (54.2%) | 28 (73.7%) |
| 55 to 64 Years | 35 (94.6%) | 46 (69.7%) |
| 65 to 74 Years | 28 (87.5%) | 29 (64.4%) |
| 75 Years and over | 3 (50.0%) | 13 (61.9%) |
| Total | 198 (68.0%) | 273 (64.7%) |
Income Below Poverty Among Married-Couple Families in Cotton Valley
The poverty statistics for married-couple families in Cotton Valley show that 16.0% or 16 of the total 100 families live below the poverty line. Families with 1 or 2 children have the highest poverty rate of 51.8%, comprising of 14 families. On the other hand, families with 3 or 4 children have the lowest poverty rate of 0.0%, which includes 0 families.
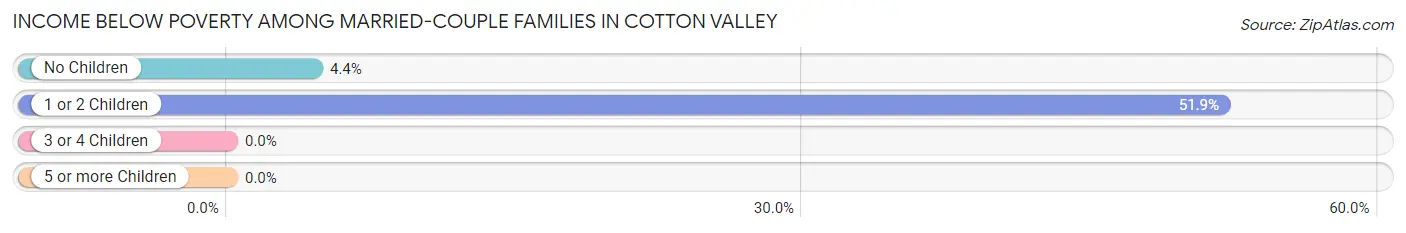
| Children | Above Poverty | Below Poverty |
| No Children | 43 (95.6%) | 2 (4.4%) |
| 1 or 2 Children | 13 (48.1%) | 14 (51.8%) |
| 3 or 4 Children | 28 (100.0%) | 0 (0.0%) |
| 5 or more Children | 0 (0.0%) | 0 (0.0%) |
| Total | 84 (84.0%) | 16 (16.0%) |
Income Below Poverty Among Single-Parent Households in Cotton Valley
According to the poverty data in Cotton Valley, 100.0% or 14 single-father households and 42.9% or 21 single-mother households are living below the poverty line. Among single-father households, those with no children have the highest poverty rate, with 3 households (100.0%) experiencing poverty. Likewise, among single-mother households, those with no children have the highest poverty rate, with 10 households (55.6%) falling below the poverty line.
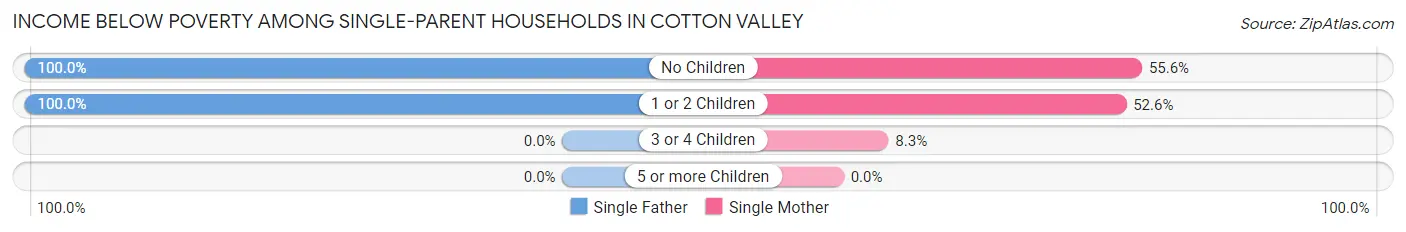
| Children | Single Father | Single Mother |
| No Children | 3 (100.0%) | 10 (55.6%) |
| 1 or 2 Children | 11 (100.0%) | 10 (52.6%) |
| 3 or 4 Children | 0 (0.0%) | 1 (8.3%) |
| 5 or more Children | 0 (0.0%) | 0 (0.0%) |
| Total | 14 (100.0%) | 21 (42.9%) |
Income Below Poverty Among Married-Couple vs Single-Parent Households in Cotton Valley
The poverty data for Cotton Valley shows that 16 of the married-couple family households (16.0%) and 35 of the single-parent households (55.6%) are living below the poverty level. Within the married-couple family households, those with 1 or 2 children have the highest poverty rate, with 14 households (51.8%) falling below the poverty line. Among the single-parent households, those with 1 or 2 children have the highest poverty rate, with 21 household (70.0%) living below poverty.
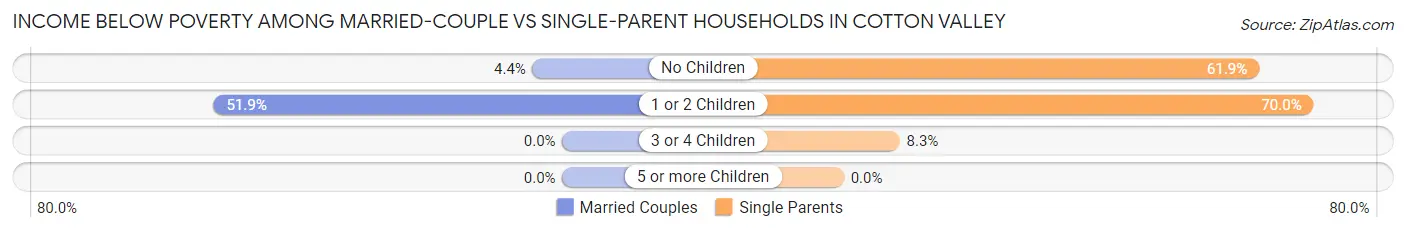
| Children | Married-Couple Families | Single-Parent Households |
| No Children | 2 (4.4%) | 13 (61.9%) |
| 1 or 2 Children | 14 (51.8%) | 21 (70.0%) |
| 3 or 4 Children | 0 (0.0%) | 1 (8.3%) |
| 5 or more Children | 0 (0.0%) | 0 (0.0%) |
| Total | 16 (16.0%) | 35 (55.6%) |
Race in Cotton Valley
The most populous races in Cotton Valley are White / Caucasian (381 | 53.4%), Black / African American (322 | 45.2%), and Two or more Races (10 | 1.4%).
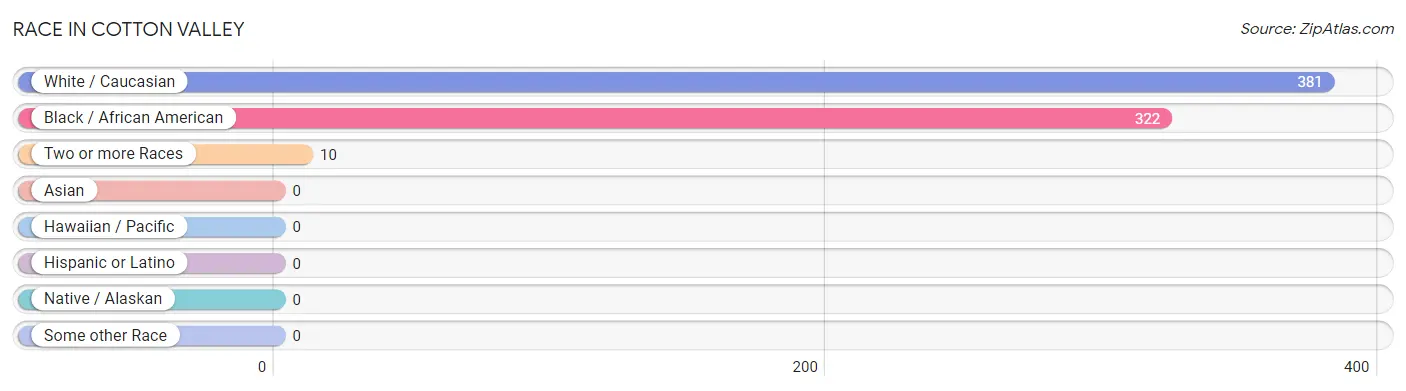
| Race | # Population | % Population |
| Asian | 0 | 0.0% |
| Black / African American | 322 | 45.2% |
| Hawaiian / Pacific | 0 | 0.0% |
| Hispanic or Latino | 0 | 0.0% |
| Native / Alaskan | 0 | 0.0% |
| White / Caucasian | 381 | 53.4% |
| Two or more Races | 10 | 1.4% |
| Some other Race | 0 | 0.0% |
| Total | 713 | 100.0% |
Ancestry in Cotton Valley
The most populous ancestries reported in Cotton Valley are American (145 | 20.3%), German (50 | 7.0%), Irish (43 | 6.0%), African (29 | 4.1%), and Subsaharan African (29 | 4.1%), together accounting for 41.5% of all Cotton Valley residents.
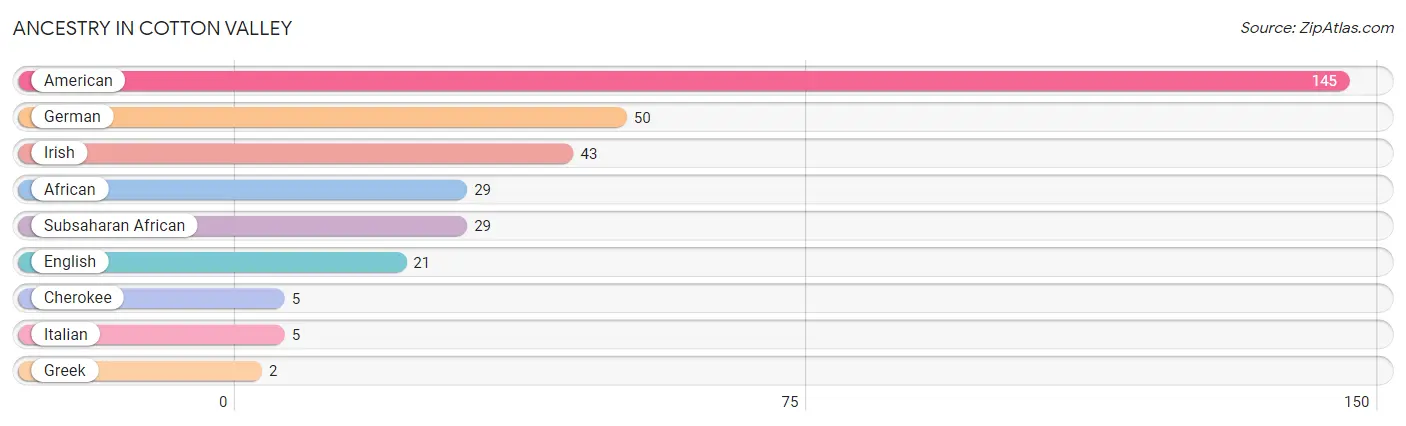
| Ancestry | # Population | % Population |
| African | 29 | 4.1% |
| American | 145 | 20.3% |
| Cherokee | 5 | 0.7% |
| English | 21 | 2.9% |
| German | 50 | 7.0% |
| Greek | 2 | 0.3% |
| Irish | 43 | 6.0% |
| Italian | 5 | 0.7% |
| Subsaharan African | 29 | 4.1% | View All 9 Rows |
Immigrants in Cotton Valley

| Immigration Origin | # Population | % Population | View All 0 Rows |
Sex and Age in Cotton Valley
Sex and Age in Cotton Valley
The most populous age groups in Cotton Valley are Under 5 Years (65 | 22.3%) for men and 10 to 14 Years (64 | 15.2%) for women.
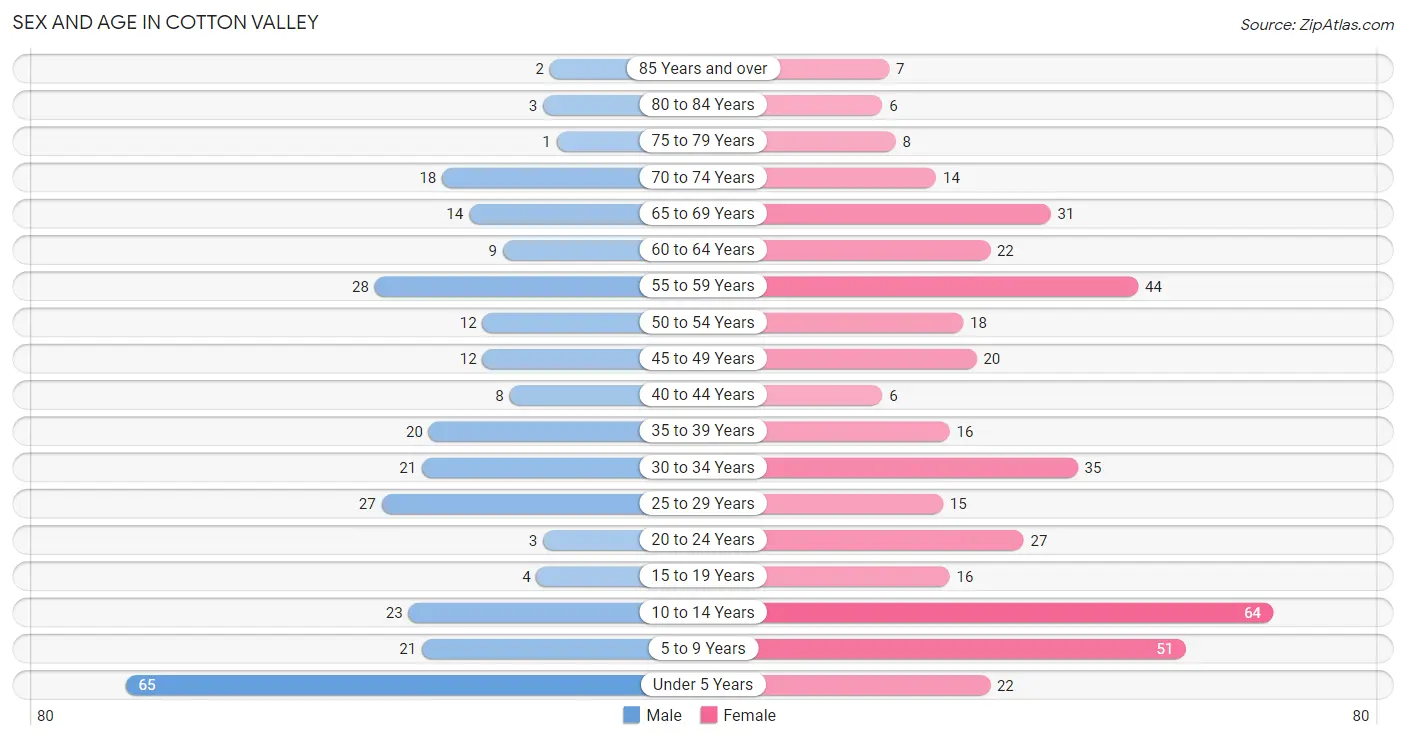
| Age Bracket | Male | Female |
| Under 5 Years | 65 (22.3%) | 22 (5.2%) |
| 5 to 9 Years | 21 (7.2%) | 51 (12.1%) |
| 10 to 14 Years | 23 (7.9%) | 64 (15.2%) |
| 15 to 19 Years | 4 (1.4%) | 16 (3.8%) |
| 20 to 24 Years | 3 (1.0%) | 27 (6.4%) |
| 25 to 29 Years | 27 (9.3%) | 15 (3.5%) |
| 30 to 34 Years | 21 (7.2%) | 35 (8.3%) |
| 35 to 39 Years | 20 (6.9%) | 16 (3.8%) |
| 40 to 44 Years | 8 (2.8%) | 6 (1.4%) |
| 45 to 49 Years | 12 (4.1%) | 20 (4.7%) |
| 50 to 54 Years | 12 (4.1%) | 18 (4.3%) |
| 55 to 59 Years | 28 (9.6%) | 44 (10.4%) |
| 60 to 64 Years | 9 (3.1%) | 22 (5.2%) |
| 65 to 69 Years | 14 (4.8%) | 31 (7.3%) |
| 70 to 74 Years | 18 (6.2%) | 14 (3.3%) |
| 75 to 79 Years | 1 (0.3%) | 8 (1.9%) |
| 80 to 84 Years | 3 (1.0%) | 6 (1.4%) |
| 85 Years and over | 2 (0.7%) | 7 (1.7%) |
| Total | 291 (100.0%) | 422 (100.0%) |
Families and Households in Cotton Valley
Median Family Size in Cotton Valley
The median family size in Cotton Valley is 3.63 persons per family, with married-couple families (100 | 61.4%) accounting for the largest median family size of 3.8 persons per family. On the other hand, single male/father families (14 | 8.6%) represent the smallest median family size with 2.00 persons per family.
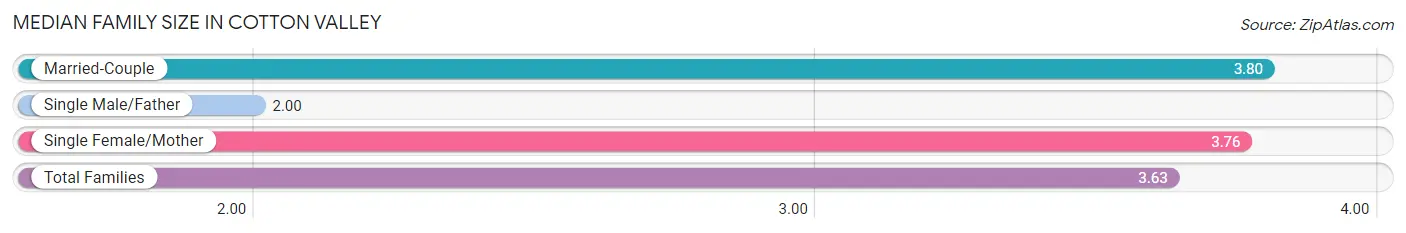
| Family Type | # Families | Family Size |
| Married-Couple | 100 (61.4%) | 3.80 |
| Single Male/Father | 14 (8.6%) | 2.00 |
| Single Female/Mother | 49 (30.1%) | 3.76 |
| Total Families | 163 (100.0%) | 3.63 |
Median Household Size in Cotton Valley
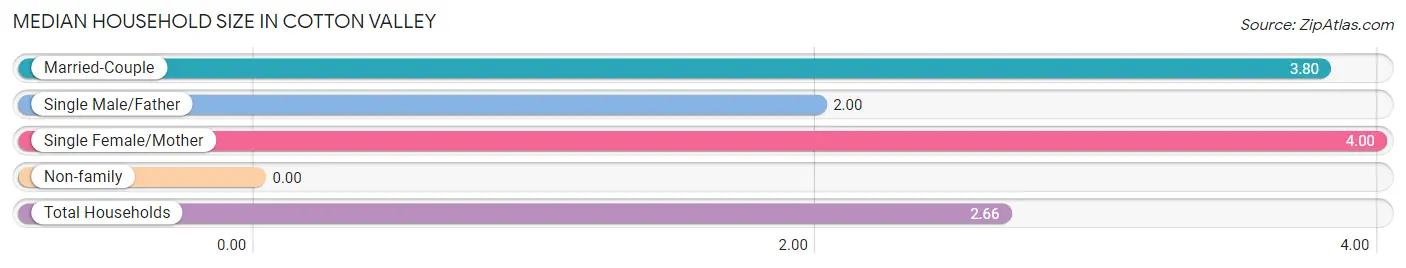
| Household Type | # Households | Household Size |
| Married-Couple | 100 (37.7%) | 3.80 |
| Single Male/Father | 14 (5.3%) | 2.00 |
| Single Female/Mother | 49 (18.5%) | 4.00 |
| Non-family | 102 (38.5%) | - |
| Total Households | 265 (100.0%) | 2.66 |
Household Size by Marriage Status in Cotton Valley
Out of a total of 265 households in Cotton Valley, 163 (61.5%) are family households, while 102 (38.5%) are nonfamily households. The most numerous type of family households are 2-person households, comprising 72, and the most common type of nonfamily households are 1-person households, comprising 102.
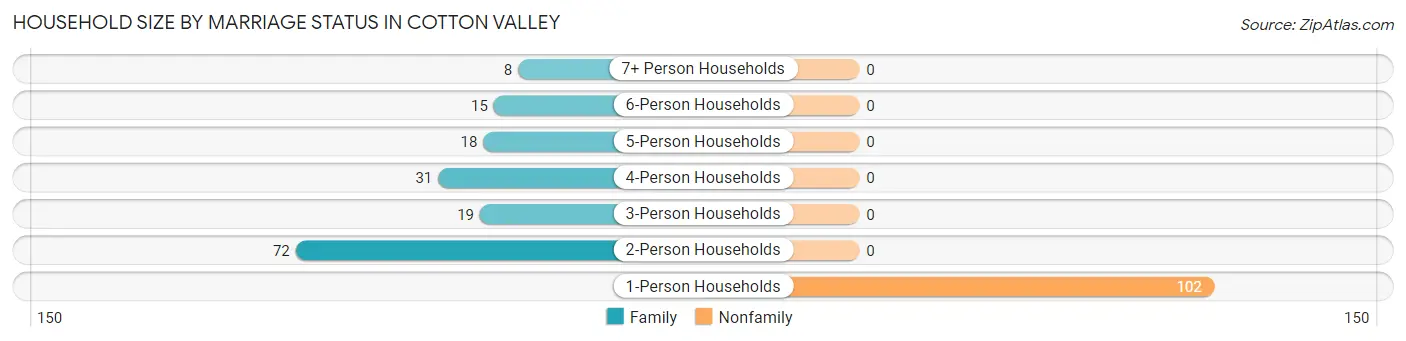
| Household Size | Family Households | Nonfamily Households |
| 1-Person Households | - | 102 (38.5%) |
| 2-Person Households | 72 (27.2%) | 0 (0.0%) |
| 3-Person Households | 19 (7.2%) | 0 (0.0%) |
| 4-Person Households | 31 (11.7%) | 0 (0.0%) |
| 5-Person Households | 18 (6.8%) | 0 (0.0%) |
| 6-Person Households | 15 (5.7%) | 0 (0.0%) |
| 7+ Person Households | 8 (3.0%) | 0 (0.0%) |
| Total | 163 (61.5%) | 102 (38.5%) |
Female Fertility in Cotton Valley
Fertility by Age in Cotton Valley
Average fertility rate in Cotton Valley is 214.0 births per 1,000 women. Women in the age bracket of 20 to 34 years have the highest fertility rate with 403.0 births per 1,000 women. Women in the age bracket of 20 to 34 years acount for 100.0% of all women with births.
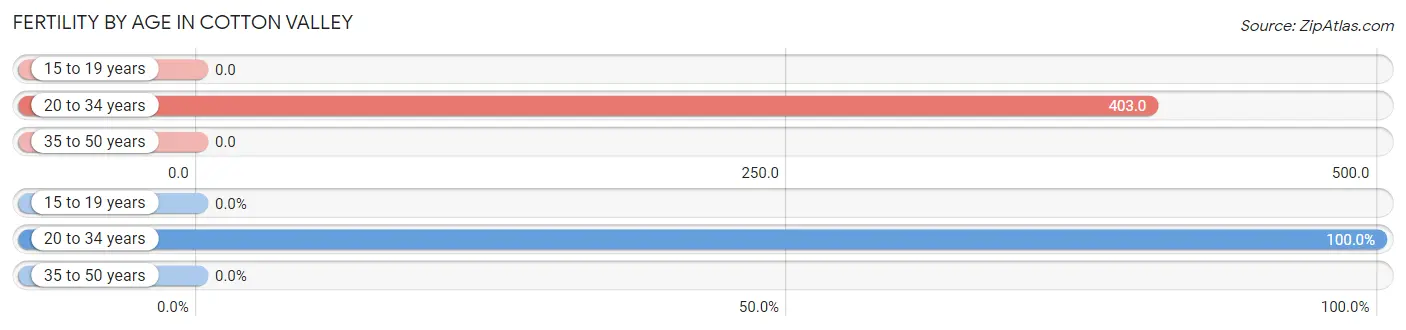
| Age Bracket | Women with Births | Births / 1,000 Women |
| 15 to 19 years | 0 (0.0%) | 0.0 |
| 20 to 34 years | 31 (100.0%) | 403.0 |
| 35 to 50 years | 0 (0.0%) | 0.0 |
| Total | 31 (100.0%) | 214.0 |
Fertility by Age by Marriage Status in Cotton Valley
35.5% of women with births (31) in Cotton Valley are married. The highest percentage of unmarried women with births falls into 20 to 34 years age bracket with 64.5% of them unmarried at the time of birth, while the lowest percentage of unmarried women with births belong to 20 to 34 years age bracket with 64.5% of them unmarried.
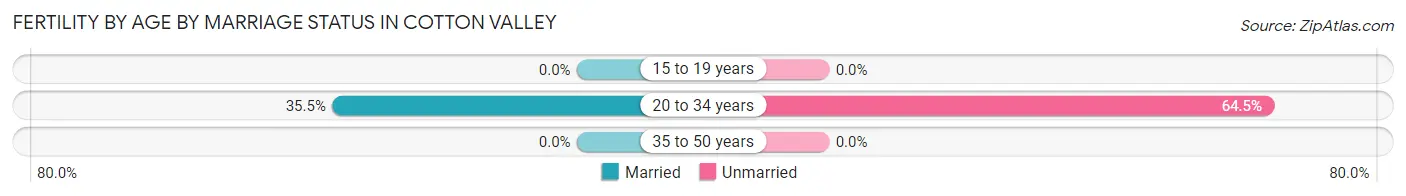
| Age Bracket | Married | Unmarried |
| 15 to 19 years | 0 (0.0%) | 0 (0.0%) |
| 20 to 34 years | 11 (35.5%) | 20 (64.5%) |
| 35 to 50 years | 0 (0.0%) | 0 (0.0%) |
| Total | 11 (35.5%) | 20 (64.5%) |
Fertility by Education in Cotton Valley
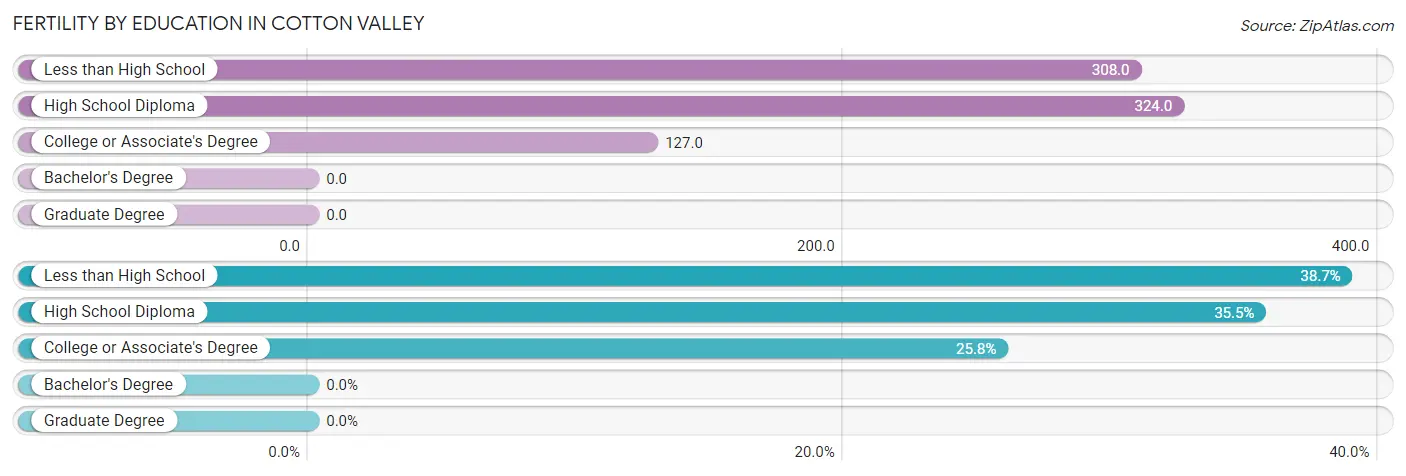
| Educational Attainment | Women with Births | Births / 1,000 Women |
| Less than High School | 12 (38.7%) | 308.0 |
| High School Diploma | 11 (35.5%) | 324.0 |
| College or Associate's Degree | 8 (25.8%) | 127.0 |
| Bachelor's Degree | 0 (0.0%) | 0.0 |
| Graduate Degree | 0 (0.0%) | 0.0 |
| Total | 31 (100.0%) | 214.0 |
Fertility by Education by Marriage Status in Cotton Valley
64.5% of women with births in Cotton Valley are unmarried. Women with the educational attainment of college or associate's degree are most likely to be married with 100.0% of them married at childbirth, while women with the educational attainment of less than high school are least likely to be married with 100.0% of them unmarried at childbirth.
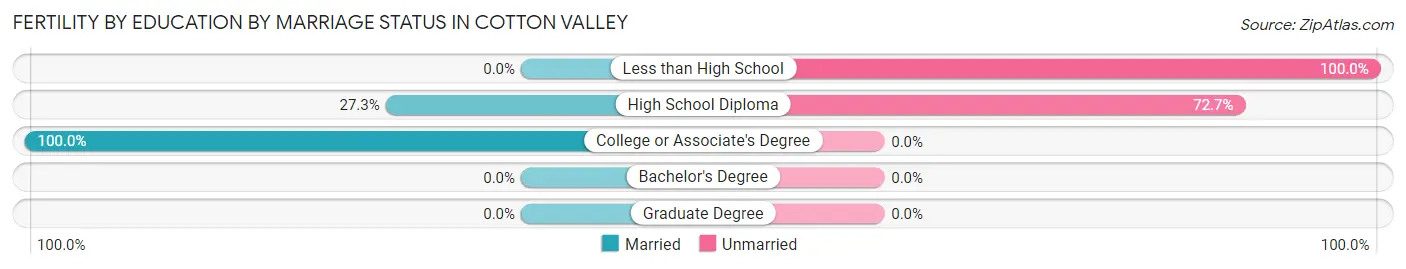
| Educational Attainment | Married | Unmarried |
| Less than High School | 0 (0.0%) | 12 (100.0%) |
| High School Diploma | 3 (27.3%) | 8 (72.7%) |
| College or Associate's Degree | 8 (100.0%) | 0 (0.0%) |
| Bachelor's Degree | 0 (0.0%) | 0 (0.0%) |
| Graduate Degree | 0 (0.0%) | 0 (0.0%) |
| Total | 11 (35.5%) | 20 (64.5%) |
Employment Characteristics in Cotton Valley
Employment by Class of Employer in Cotton Valley
Among the 197 employed individuals in Cotton Valley, private company employees (144 | 73.1%), self-employed (not incorporated) (24 | 12.2%), and not-for-profit organizations (10 | 5.1%) make up the most common classes of employment.
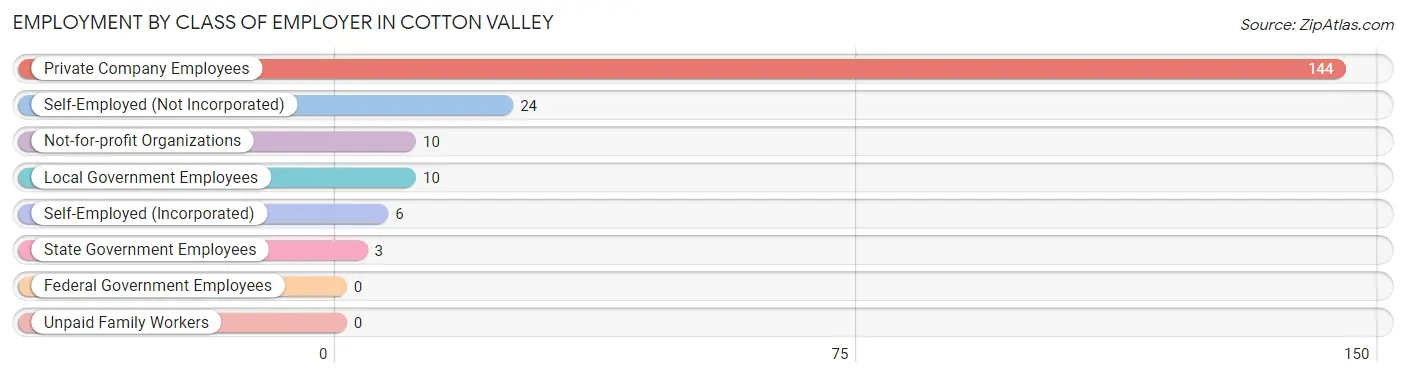
| Employer Class | # Employees | % Employees |
| Private Company Employees | 144 | 73.1% |
| Self-Employed (Incorporated) | 6 | 3.0% |
| Self-Employed (Not Incorporated) | 24 | 12.2% |
| Not-for-profit Organizations | 10 | 5.1% |
| Local Government Employees | 10 | 5.1% |
| State Government Employees | 3 | 1.5% |
| Federal Government Employees | 0 | 0.0% |
| Unpaid Family Workers | 0 | 0.0% |
| Total | 197 | 100.0% |
Employment Status by Age in Cotton Valley
According to the labor force statistics for Cotton Valley, out of the total population over 16 years of age (465), 45.4% or 211 individuals are in the labor force, with 2.8% or 6 of them unemployed. The age group with the highest labor force participation rate is 35 to 44 years, with 80.0% or 40 individuals in the labor force. Within the labor force, the 35 to 44 years age range has the highest percentage of unemployed individuals, with 12.5% or 5 of them being unemployed.
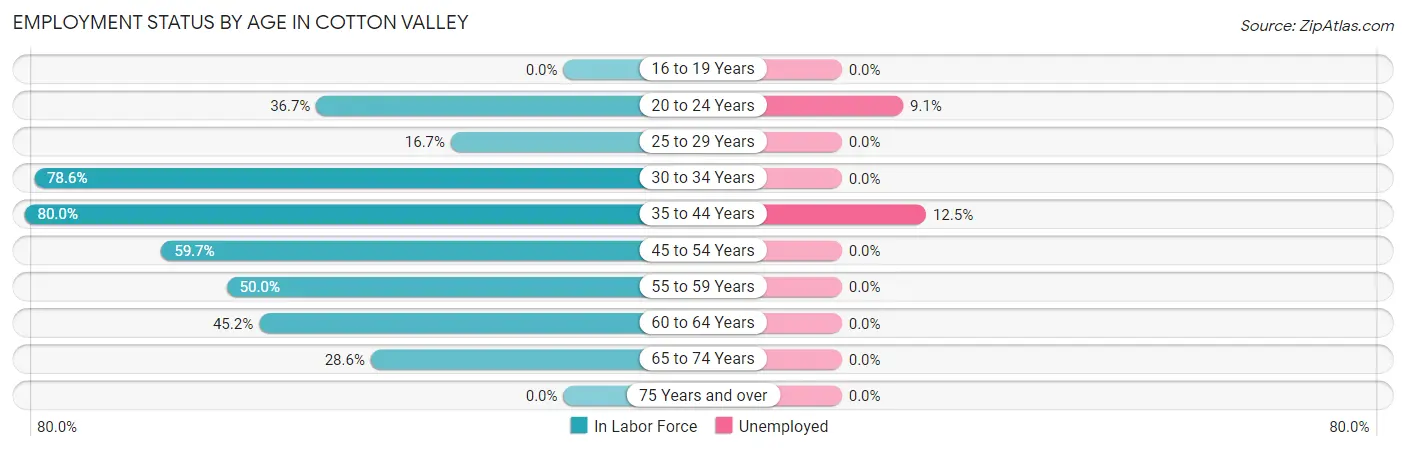
| Age Bracket | In Labor Force | Unemployed |
| 16 to 19 Years | 0 (0.0%) | 0 (0.0%) |
| 20 to 24 Years | 11 (36.7%) | 1 (9.1%) |
| 25 to 29 Years | 7 (16.7%) | 0 (0.0%) |
| 30 to 34 Years | 44 (78.6%) | 0 (0.0%) |
| 35 to 44 Years | 40 (80.0%) | 5 (12.5%) |
| 45 to 54 Years | 37 (59.7%) | 0 (0.0%) |
| 55 to 59 Years | 36 (50.0%) | 0 (0.0%) |
| 60 to 64 Years | 14 (45.2%) | 0 (0.0%) |
| 65 to 74 Years | 22 (28.6%) | 0 (0.0%) |
| 75 Years and over | 0 (0.0%) | 0 (0.0%) |
| Total | 211 (45.4%) | 6 (2.8%) |
Employment Status by Educational Attainment in Cotton Valley
According to labor force statistics for Cotton Valley, 56.9% of individuals (178) out of the total population between 25 and 64 years of age (313) are in the labor force, with 2.8% or 5 of them being unemployed. The group with the highest labor force participation rate are those with the educational attainment of bachelor's degree or higher, with 89.5% or 17 individuals in the labor force. Within the labor force, individuals with college / associate degree education have the highest percentage of unemployment, with 7.9% or 5 of them being unemployed.
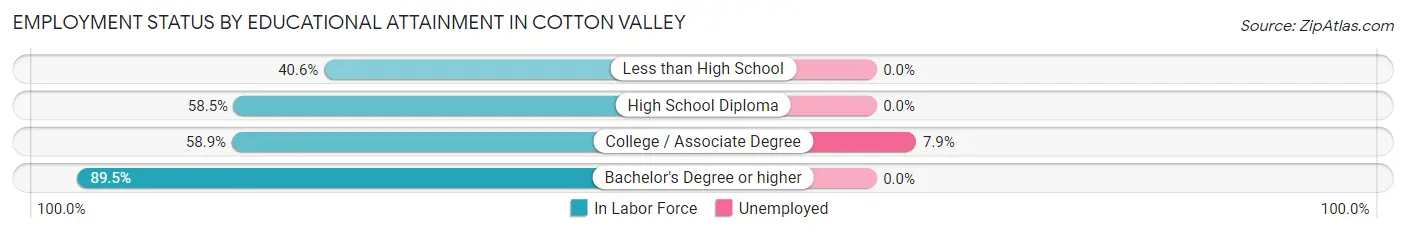
| Educational Attainment | In Labor Force | Unemployed |
| Less than High School | 26 (40.6%) | 0 (0.0%) |
| High School Diploma | 72 (58.5%) | 0 (0.0%) |
| College / Associate Degree | 63 (58.9%) | 8 (7.9%) |
| Bachelor's Degree or higher | 17 (89.5%) | 0 (0.0%) |
| Total | 178 (56.9%) | 9 (2.8%) |
Employment Occupations by Sex in Cotton Valley
Management, Business, Science and Arts Occupations
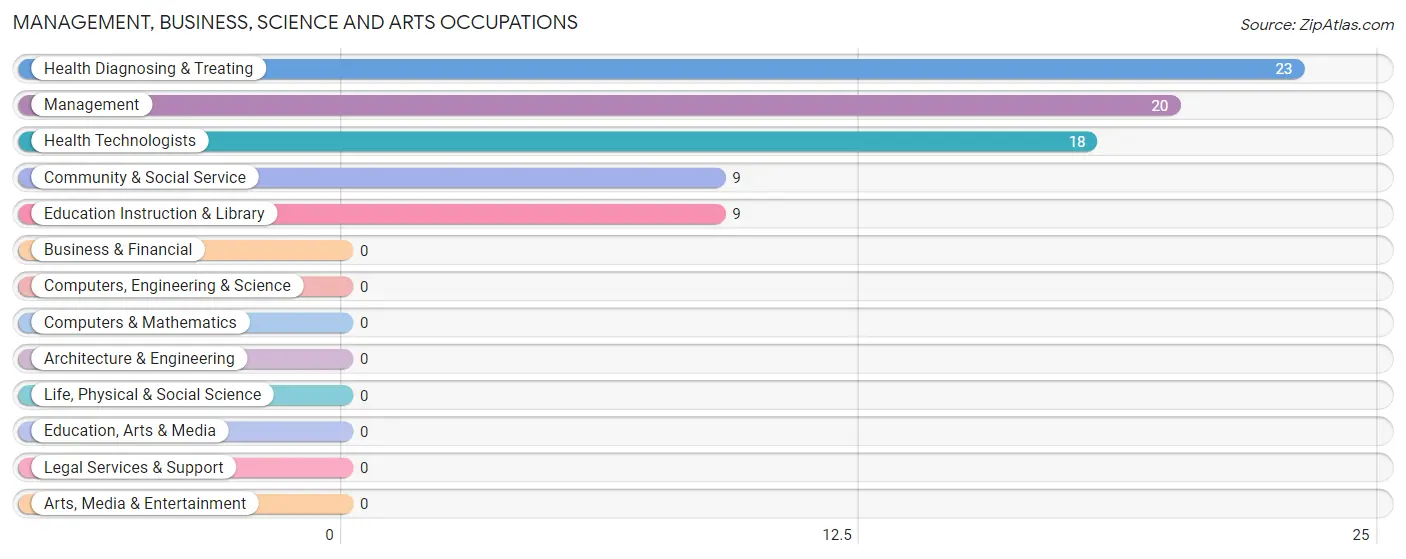
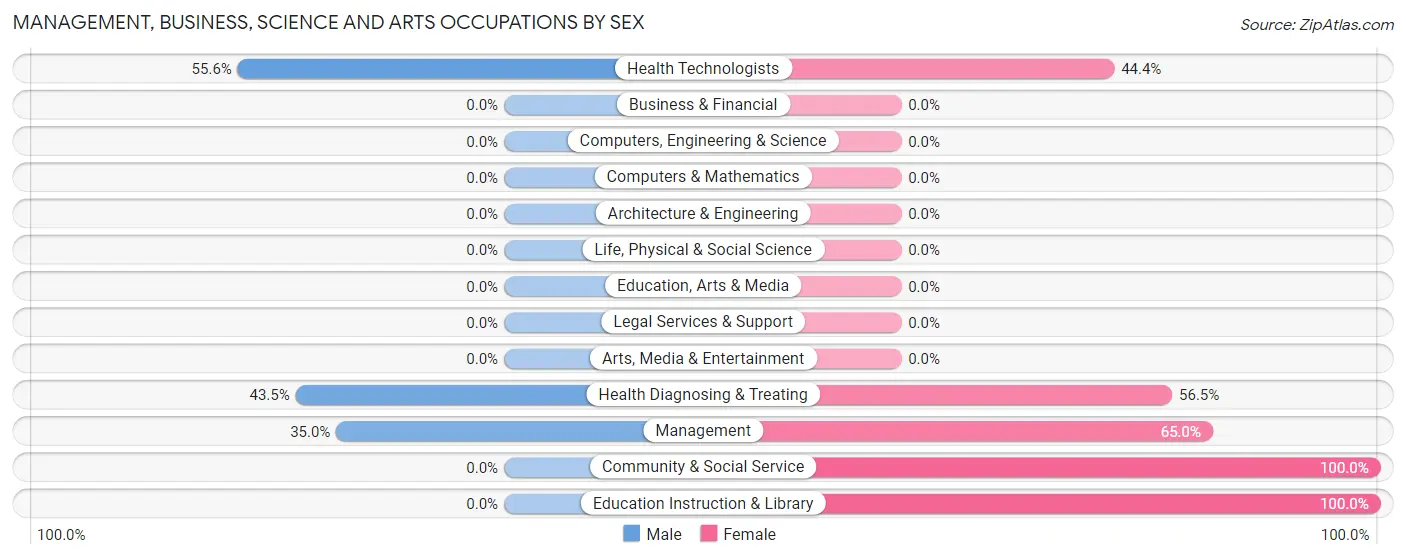
The most common Management, Business, Science and Arts occupations in Cotton Valley are Health Diagnosing & Treating (23 | 11.2%), Management (20 | 9.8%), Health Technologists (18 | 8.8%), Community & Social Service (9 | 4.4%), and Education Instruction & Library (9 | 4.4%).
Management, Business, Science and Arts Occupations by Sex
Within the Management, Business, Science and Arts occupations in Cotton Valley, the most male-oriented occupations are Health Technologists (55.6%), Health Diagnosing & Treating (43.5%), and Management (35.0%), while the most female-oriented occupations are Community & Social Service (100.0%), Education Instruction & Library (100.0%), and Management (65.0%).
| Occupation | Male | Female |
| Management | 7 (35.0%) | 13 (65.0%) |
| Business & Financial | 0 (0.0%) | 0 (0.0%) |
| Computers, Engineering & Science | 0 (0.0%) | 0 (0.0%) |
| Computers & Mathematics | 0 (0.0%) | 0 (0.0%) |
| Architecture & Engineering | 0 (0.0%) | 0 (0.0%) |
| Life, Physical & Social Science | 0 (0.0%) | 0 (0.0%) |
| Community & Social Service | 0 (0.0%) | 9 (100.0%) |
| Education, Arts & Media | 0 (0.0%) | 0 (0.0%) |
| Legal Services & Support | 0 (0.0%) | 0 (0.0%) |
| Education Instruction & Library | 0 (0.0%) | 9 (100.0%) |
| Arts, Media & Entertainment | 0 (0.0%) | 0 (0.0%) |
| Health Diagnosing & Treating | 10 (43.5%) | 13 (56.5%) |
| Health Technologists | 10 (55.6%) | 8 (44.4%) |
| Total (Category) | 17 (32.7%) | 35 (67.3%) |
| Total (Overall) | 77 (37.6%) | 128 (62.4%) |
Services Occupations
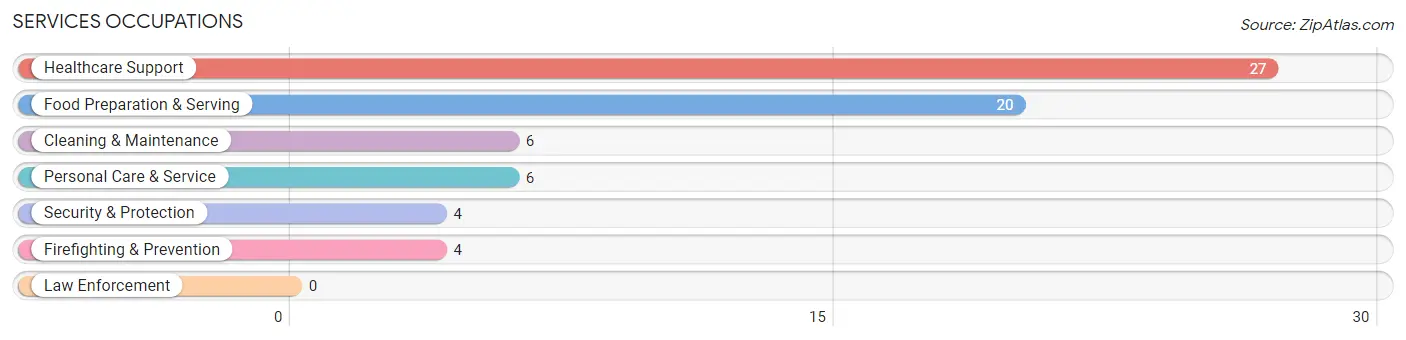
The most common Services occupations in Cotton Valley are Healthcare Support (27 | 13.2%), Food Preparation & Serving (20 | 9.8%), Cleaning & Maintenance (6 | 2.9%), Personal Care & Service (6 | 2.9%), and Security & Protection (4 | 1.9%).
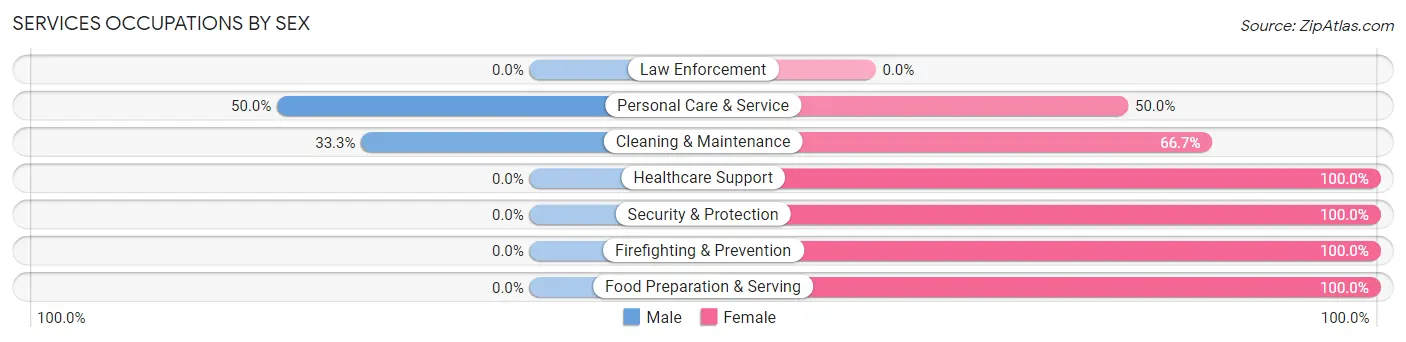
Services Occupations by Sex
Within the Services occupations in Cotton Valley, the most male-oriented occupations are Personal Care & Service (50.0%), and Cleaning & Maintenance (33.3%), while the most female-oriented occupations are Healthcare Support (100.0%), Security & Protection (100.0%), and Firefighting & Prevention (100.0%).
| Occupation | Male | Female |
| Healthcare Support | 0 (0.0%) | 27 (100.0%) |
| Security & Protection | 0 (0.0%) | 4 (100.0%) |
| Firefighting & Prevention | 0 (0.0%) | 4 (100.0%) |
| Law Enforcement | 0 (0.0%) | 0 (0.0%) |
| Food Preparation & Serving | 0 (0.0%) | 20 (100.0%) |
| Cleaning & Maintenance | 2 (33.3%) | 4 (66.7%) |
| Personal Care & Service | 3 (50.0%) | 3 (50.0%) |
| Total (Category) | 5 (7.9%) | 58 (92.1%) |
| Total (Overall) | 77 (37.6%) | 128 (62.4%) |
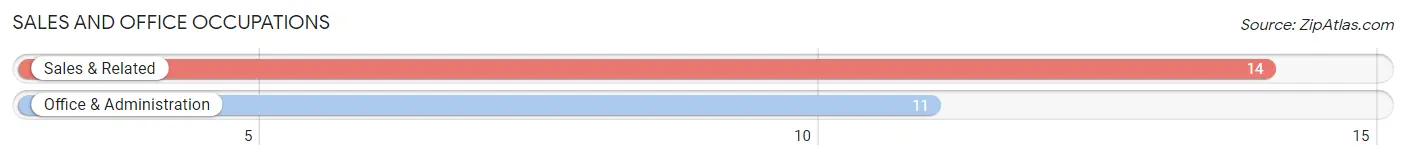
Sales and Office Occupations
The most common Sales and Office occupations in Cotton Valley are Sales & Related (14 | 6.8%), and Office & Administration (11 | 5.4%).
Sales and Office Occupations by Sex
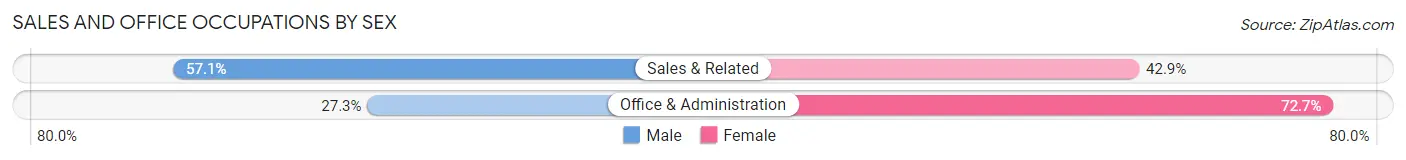
| Occupation | Male | Female |
| Sales & Related | 8 (57.1%) | 6 (42.9%) |
| Office & Administration | 3 (27.3%) | 8 (72.7%) |
| Total (Category) | 11 (44.0%) | 14 (56.0%) |
| Total (Overall) | 77 (37.6%) | 128 (62.4%) |
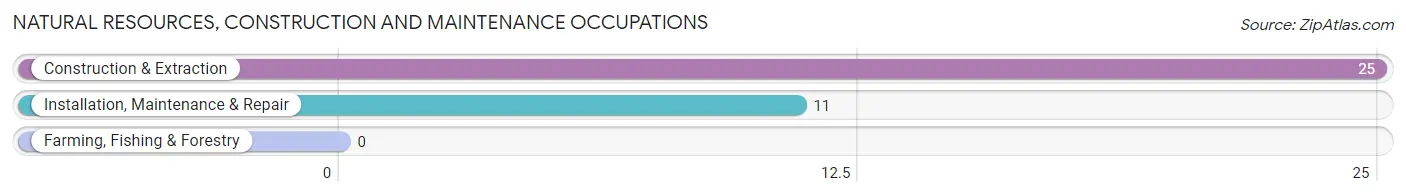
Natural Resources, Construction and Maintenance Occupations
The most common Natural Resources, Construction and Maintenance occupations in Cotton Valley are Construction & Extraction (25 | 12.2%), and Installation, Maintenance & Repair (11 | 5.4%).
Natural Resources, Construction and Maintenance Occupations by Sex
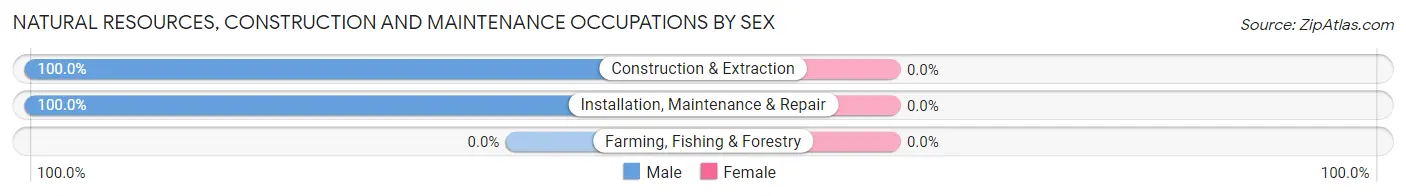
| Occupation | Male | Female |
| Farming, Fishing & Forestry | 0 (0.0%) | 0 (0.0%) |
| Construction & Extraction | 25 (100.0%) | 0 (0.0%) |
| Installation, Maintenance & Repair | 11 (100.0%) | 0 (0.0%) |
| Total (Category) | 36 (100.0%) | 0 (0.0%) |
| Total (Overall) | 77 (37.6%) | 128 (62.4%) |
Production, Transportation and Moving Occupations
The most common Production, Transportation and Moving occupations in Cotton Valley are Production (27 | 13.2%), and Material Moving (2 | 1.0%).
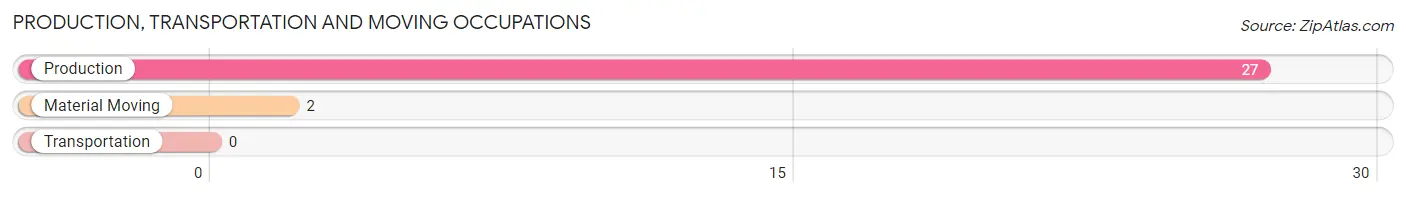
Production, Transportation and Moving Occupations by Sex
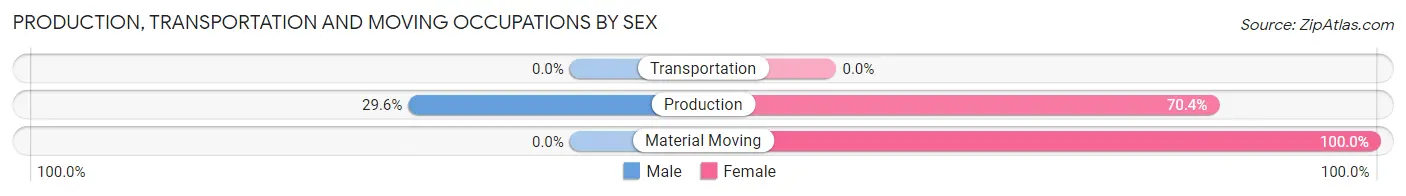
| Occupation | Male | Female |
| Production | 8 (29.6%) | 19 (70.4%) |
| Transportation | 0 (0.0%) | 0 (0.0%) |
| Material Moving | 0 (0.0%) | 2 (100.0%) |
| Total (Category) | 8 (27.6%) | 21 (72.4%) |
| Total (Overall) | 77 (37.6%) | 128 (62.4%) |
Employment Industries by Sex in Cotton Valley
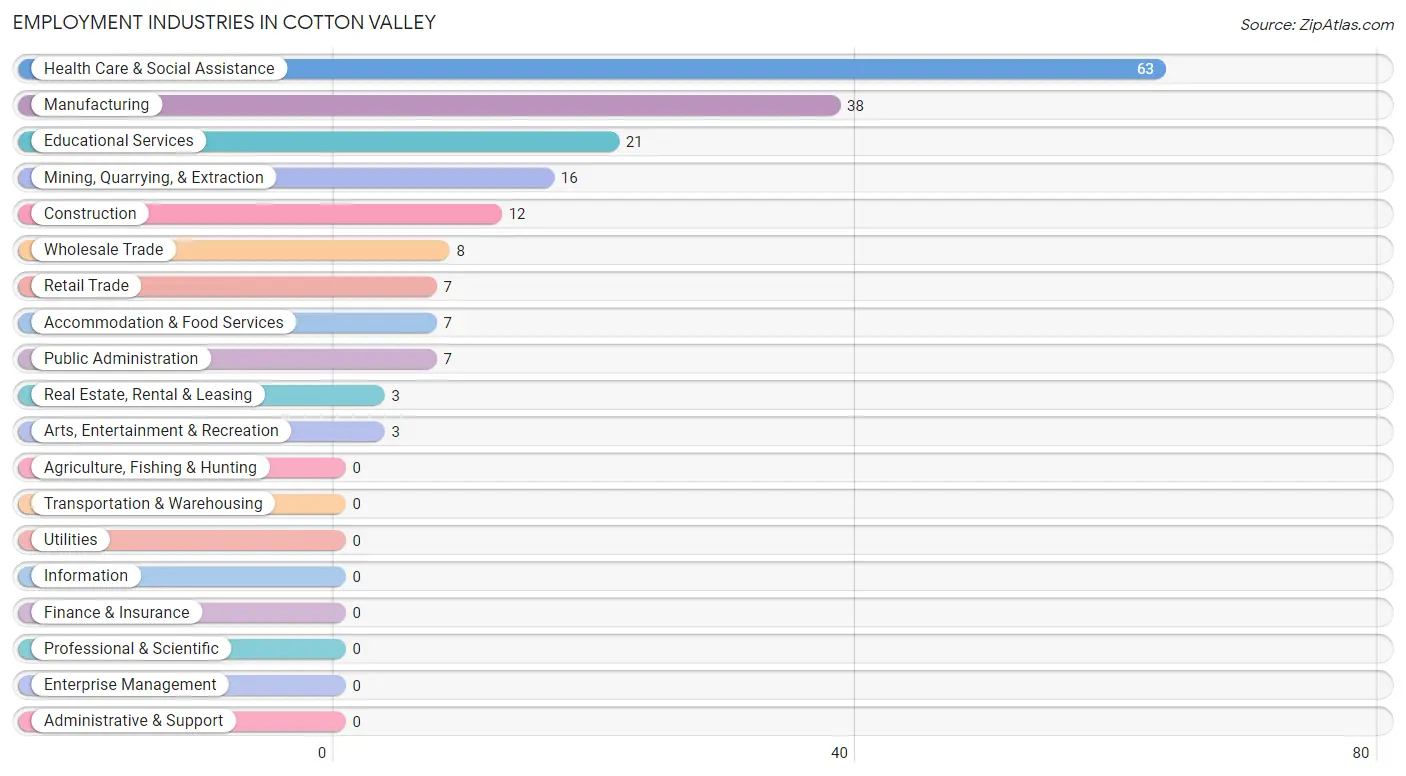
Employment Industries in Cotton Valley
The major employment industries in Cotton Valley include Health Care & Social Assistance (63 | 30.7%), Manufacturing (38 | 18.5%), Educational Services (21 | 10.2%), Mining, Quarrying, & Extraction (16 | 7.8%), and Construction (12 | 5.9%).
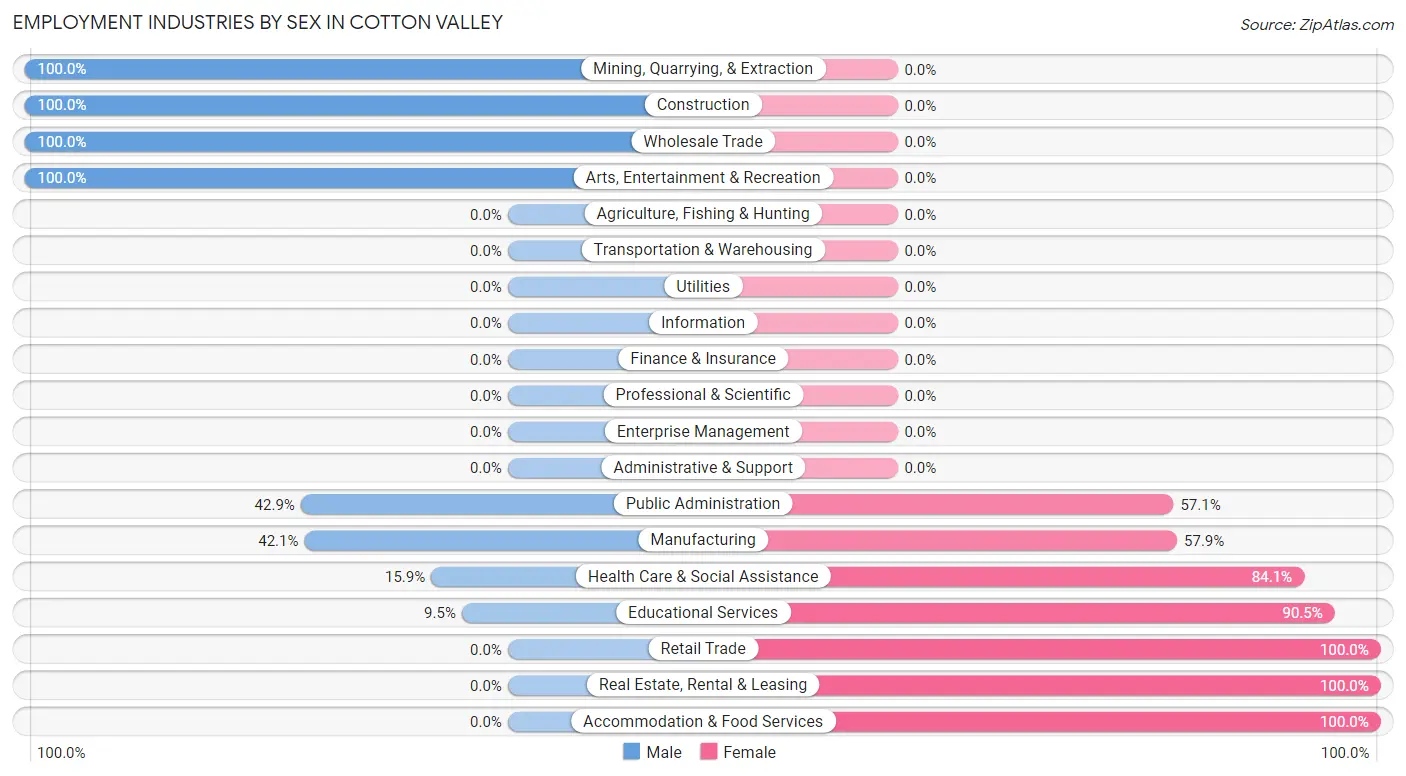
Employment Industries by Sex in Cotton Valley
The Cotton Valley industries that see more men than women are Mining, Quarrying, & Extraction (100.0%), Construction (100.0%), and Wholesale Trade (100.0%), whereas the industries that tend to have a higher number of women are Retail Trade (100.0%), Real Estate, Rental & Leasing (100.0%), and Accommodation & Food Services (100.0%).
| Industry | Male | Female |
| Agriculture, Fishing & Hunting | 0 (0.0%) | 0 (0.0%) |
| Mining, Quarrying, & Extraction | 16 (100.0%) | 0 (0.0%) |
| Construction | 12 (100.0%) | 0 (0.0%) |
| Manufacturing | 16 (42.1%) | 22 (57.9%) |
| Wholesale Trade | 8 (100.0%) | 0 (0.0%) |
| Retail Trade | 0 (0.0%) | 7 (100.0%) |
| Transportation & Warehousing | 0 (0.0%) | 0 (0.0%) |
| Utilities | 0 (0.0%) | 0 (0.0%) |
| Information | 0 (0.0%) | 0 (0.0%) |
| Finance & Insurance | 0 (0.0%) | 0 (0.0%) |
| Real Estate, Rental & Leasing | 0 (0.0%) | 3 (100.0%) |
| Professional & Scientific | 0 (0.0%) | 0 (0.0%) |
| Enterprise Management | 0 (0.0%) | 0 (0.0%) |
| Administrative & Support | 0 (0.0%) | 0 (0.0%) |
| Educational Services | 2 (9.5%) | 19 (90.5%) |
| Health Care & Social Assistance | 10 (15.9%) | 53 (84.1%) |
| Arts, Entertainment & Recreation | 3 (100.0%) | 0 (0.0%) |
| Accommodation & Food Services | 0 (0.0%) | 7 (100.0%) |
| Public Administration | 3 (42.9%) | 4 (57.1%) |
| Total | 77 (37.6%) | 128 (62.4%) |
Education in Cotton Valley
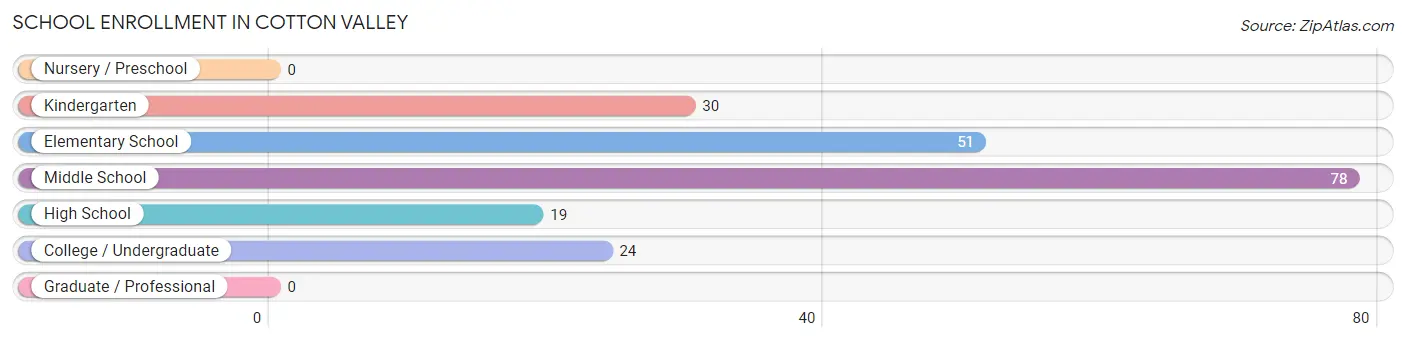
School Enrollment in Cotton Valley
The most common levels of schooling among the 202 students in Cotton Valley are middle school (78 | 38.6%), elementary school (51 | 25.3%), and kindergarten (30 | 14.8%).
| School Level | # Students | % Students |
| Nursery / Preschool | 0 | 0.0% |
| Kindergarten | 30 | 14.8% |
| Elementary School | 51 | 25.3% |
| Middle School | 78 | 38.6% |
| High School | 19 | 9.4% |
| College / Undergraduate | 24 | 11.9% |
| Graduate / Professional | 0 | 0.0% |
| Total | 202 | 100.0% |
School Enrollment by Age by Funding Source in Cotton Valley
Out of a total of 202 students who are enrolled in schools in Cotton Valley, 23 (11.4%) attend a private institution, while the remaining 179 (88.6%) are enrolled in public schools. The age group of 15 to 17 year olds has the highest likelihood of being enrolled in private schools, with 3 (37.5% in the age bracket) enrolled. Conversely, the age group of 5 to 9 year old has the lowest likelihood of being enrolled in a private school, with 72 (100.0% in the age bracket) attending a public institution.
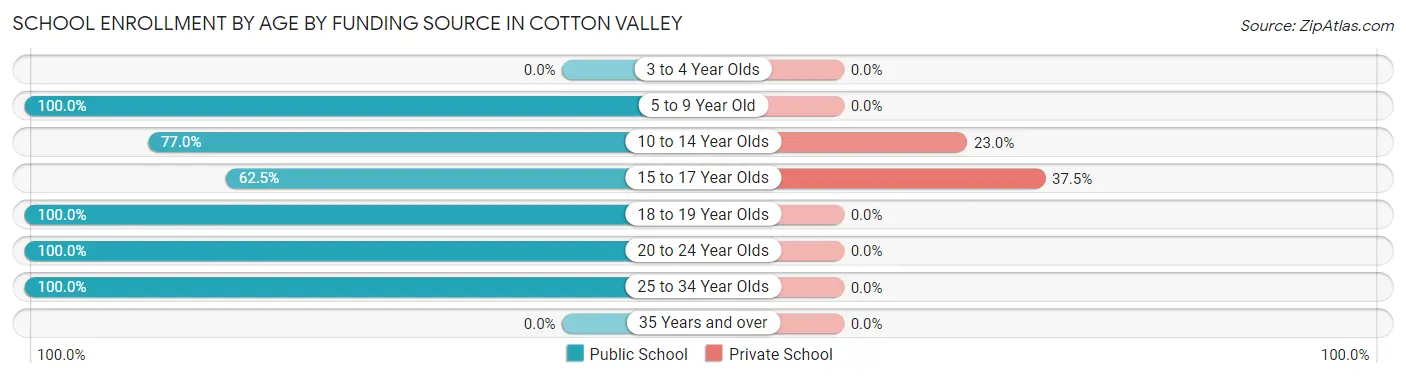
| Age Bracket | Public School | Private School |
| 3 to 4 Year Olds | 0 (0.0%) | 0 (0.0%) |
| 5 to 9 Year Old | 72 (100.0%) | 0 (0.0%) |
| 10 to 14 Year Olds | 67 (77.0%) | 20 (23.0%) |
| 15 to 17 Year Olds | 5 (62.5%) | 3 (37.5%) |
| 18 to 19 Year Olds | 12 (100.0%) | 0 (0.0%) |
| 20 to 24 Year Olds | 5 (100.0%) | 0 (0.0%) |
| 25 to 34 Year Olds | 18 (100.0%) | 0 (0.0%) |
| 35 Years and over | 0 (0.0%) | 0 (0.0%) |
| Total | 179 (88.6%) | 23 (11.4%) |
Educational Attainment by Field of Study in Cotton Valley
Education (13 | 48.1%), computers & mathematics (4 | 14.8%), social sciences (4 | 14.8%), literature & languages (4 | 14.8%), and liberal arts & history (2 | 7.4%) are the most common fields of study among 27 individuals in Cotton Valley who have obtained a bachelor's degree or higher.
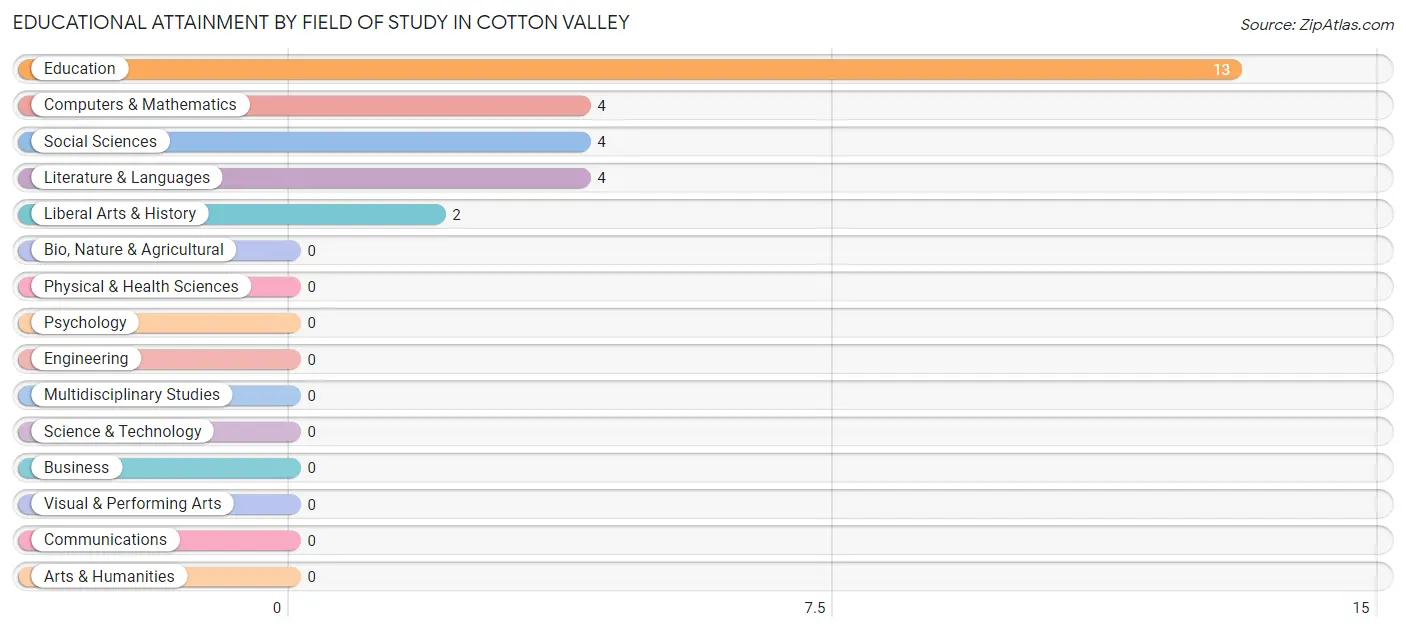
| Field of Study | # Graduates | % Graduates |
| Computers & Mathematics | 4 | 14.8% |
| Bio, Nature & Agricultural | 0 | 0.0% |
| Physical & Health Sciences | 0 | 0.0% |
| Psychology | 0 | 0.0% |
| Social Sciences | 4 | 14.8% |
| Engineering | 0 | 0.0% |
| Multidisciplinary Studies | 0 | 0.0% |
| Science & Technology | 0 | 0.0% |
| Business | 0 | 0.0% |
| Education | 13 | 48.1% |
| Literature & Languages | 4 | 14.8% |
| Liberal Arts & History | 2 | 7.4% |
| Visual & Performing Arts | 0 | 0.0% |
| Communications | 0 | 0.0% |
| Arts & Humanities | 0 | 0.0% |
| Total | 27 | 100.0% |
Transportation & Commute in Cotton Valley
Vehicle Availability by Sex in Cotton Valley
The most prevalent vehicle ownership categories in Cotton Valley are males with 2 vehicles (40, accounting for 51.9%) and females with 2 vehicles (23, making up 33.3%).
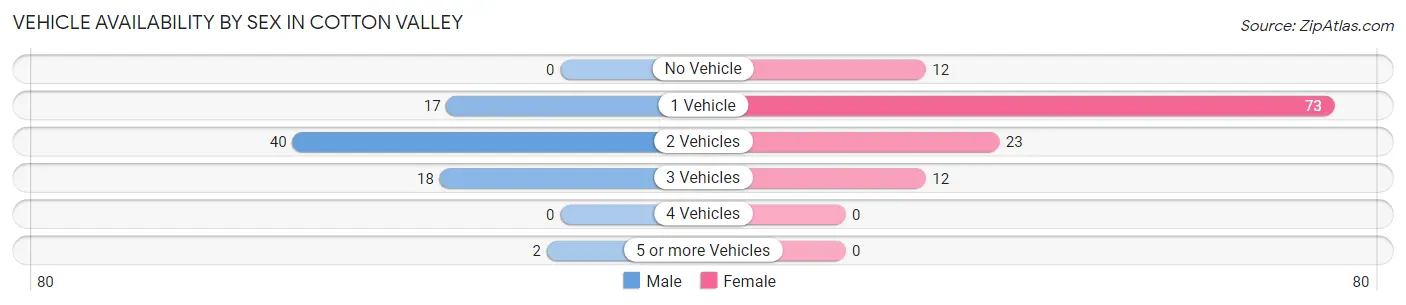
| Vehicles Available | Male | Female |
| No Vehicle | 0 (0.0%) | 12 (10.0%) |
| 1 Vehicle | 17 (22.1%) | 73 (60.8%) |
| 2 Vehicles | 40 (51.9%) | 23 (19.2%) |
| 3 Vehicles | 18 (23.4%) | 12 (10.0%) |
| 4 Vehicles | 0 (0.0%) | 0 (0.0%) |
| 5 or more Vehicles | 2 (2.6%) | 0 (0.0%) |
| Total | 77 (100.0%) | 120 (100.0%) |
Commute Time in Cotton Valley
The most frequently occuring commute durations in Cotton Valley are 45 to 59 minutes (35 commuters, 19.3%), 30 to 34 minutes (28 commuters, 15.5%), and 20 to 24 minutes (23 commuters, 12.7%).
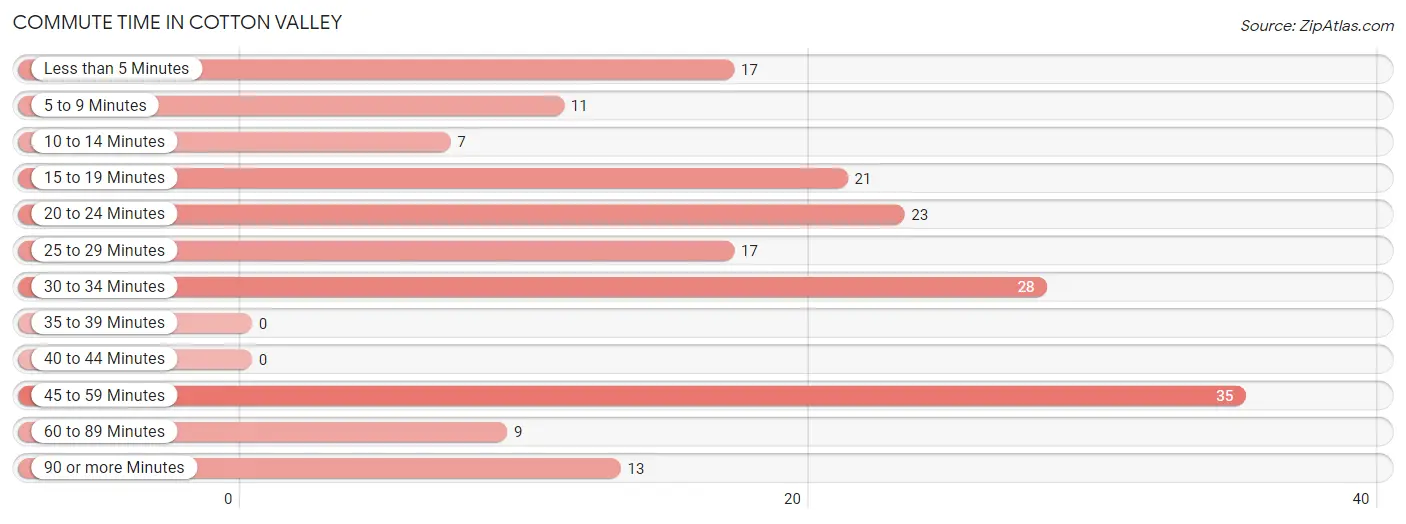
| Commute Time | # Commuters | % Commuters |
| Less than 5 Minutes | 17 | 9.4% |
| 5 to 9 Minutes | 11 | 6.1% |
| 10 to 14 Minutes | 7 | 3.9% |
| 15 to 19 Minutes | 21 | 11.6% |
| 20 to 24 Minutes | 23 | 12.7% |
| 25 to 29 Minutes | 17 | 9.4% |
| 30 to 34 Minutes | 28 | 15.5% |
| 35 to 39 Minutes | 0 | 0.0% |
| 40 to 44 Minutes | 0 | 0.0% |
| 45 to 59 Minutes | 35 | 19.3% |
| 60 to 89 Minutes | 9 | 5.0% |
| 90 or more Minutes | 13 | 7.2% |
Commute Time by Sex in Cotton Valley
The most common commute times in Cotton Valley are less than 5 minutes (14 commuters, 20.0%) for males and 30 to 34 minutes (28 commuters, 25.2%) for females.
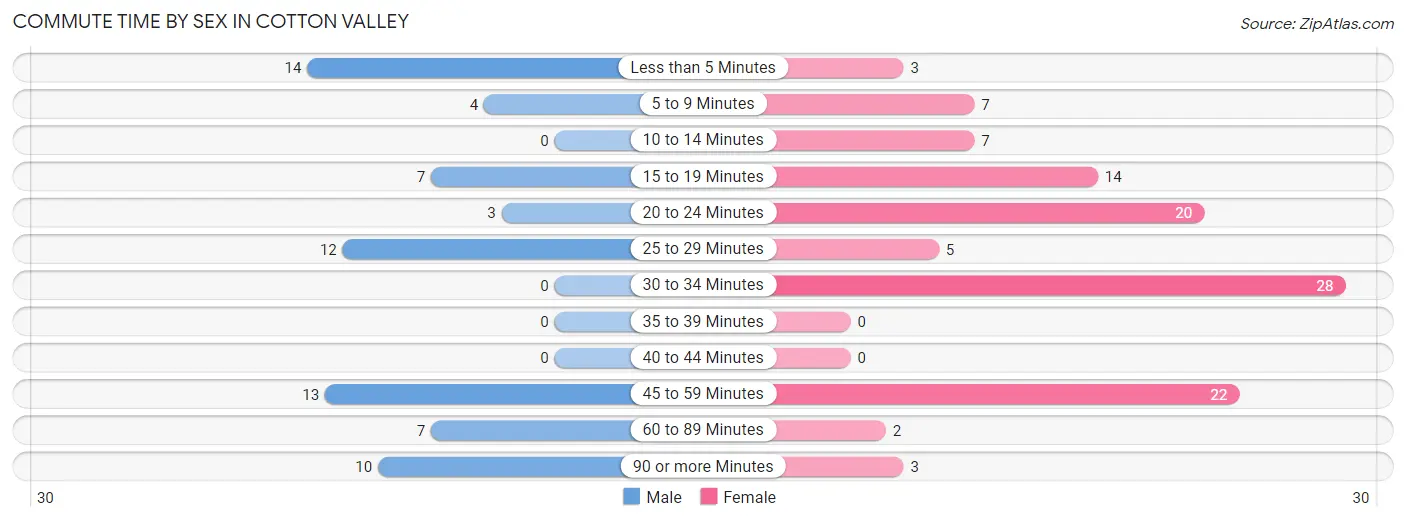
| Commute Time | Male | Female |
| Less than 5 Minutes | 14 (20.0%) | 3 (2.7%) |
| 5 to 9 Minutes | 4 (5.7%) | 7 (6.3%) |
| 10 to 14 Minutes | 0 (0.0%) | 7 (6.3%) |
| 15 to 19 Minutes | 7 (10.0%) | 14 (12.6%) |
| 20 to 24 Minutes | 3 (4.3%) | 20 (18.0%) |
| 25 to 29 Minutes | 12 (17.1%) | 5 (4.5%) |
| 30 to 34 Minutes | 0 (0.0%) | 28 (25.2%) |
| 35 to 39 Minutes | 0 (0.0%) | 0 (0.0%) |
| 40 to 44 Minutes | 0 (0.0%) | 0 (0.0%) |
| 45 to 59 Minutes | 13 (18.6%) | 22 (19.8%) |
| 60 to 89 Minutes | 7 (10.0%) | 2 (1.8%) |
| 90 or more Minutes | 10 (14.3%) | 3 (2.7%) |
Time of Departure to Work by Sex in Cotton Valley
The most frequent times of departure to work in Cotton Valley are 5:00 AM to 5:29 AM (19, 27.1%) for males and 12:00 PM to 3:59 PM (43, 38.7%) for females.
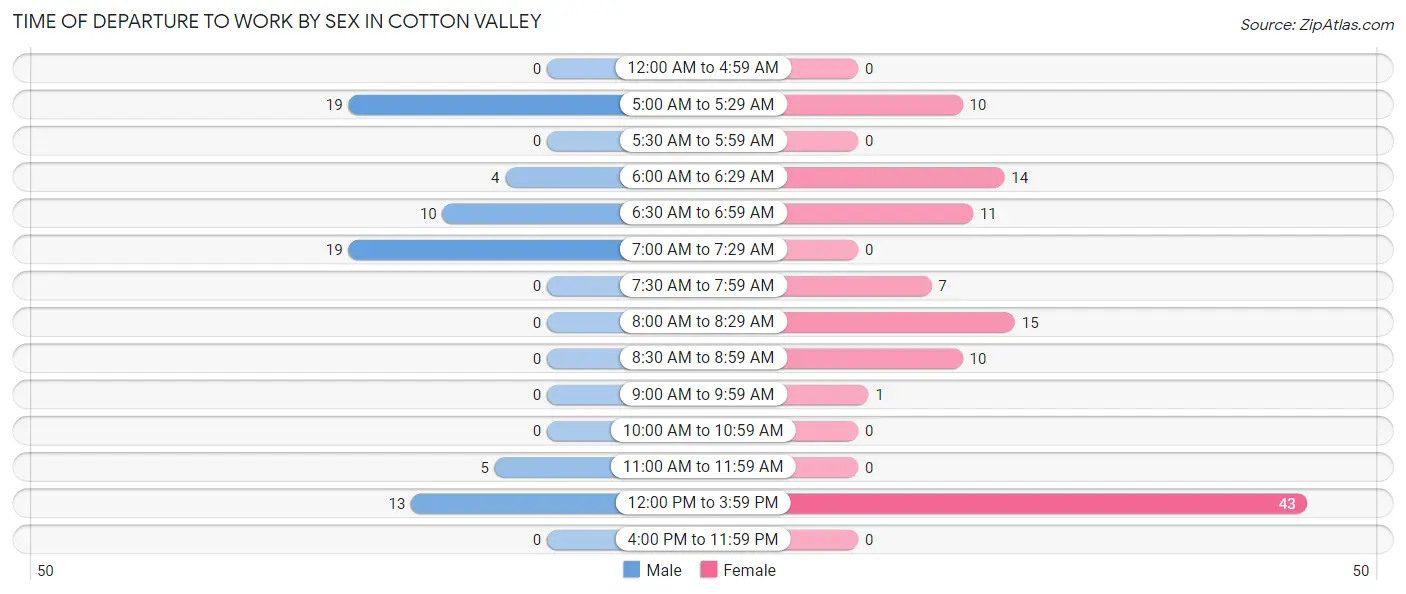
| Time of Departure | Male | Female |
| 12:00 AM to 4:59 AM | 0 (0.0%) | 0 (0.0%) |
| 5:00 AM to 5:29 AM | 19 (27.1%) | 10 (9.0%) |
| 5:30 AM to 5:59 AM | 0 (0.0%) | 0 (0.0%) |
| 6:00 AM to 6:29 AM | 4 (5.7%) | 14 (12.6%) |
| 6:30 AM to 6:59 AM | 10 (14.3%) | 11 (9.9%) |
| 7:00 AM to 7:29 AM | 19 (27.1%) | 0 (0.0%) |
| 7:30 AM to 7:59 AM | 0 (0.0%) | 7 (6.3%) |
| 8:00 AM to 8:29 AM | 0 (0.0%) | 15 (13.5%) |
| 8:30 AM to 8:59 AM | 0 (0.0%) | 10 (9.0%) |
| 9:00 AM to 9:59 AM | 0 (0.0%) | 1 (0.9%) |
| 10:00 AM to 10:59 AM | 0 (0.0%) | 0 (0.0%) |
| 11:00 AM to 11:59 AM | 5 (7.1%) | 0 (0.0%) |
| 12:00 PM to 3:59 PM | 13 (18.6%) | 43 (38.7%) |
| 4:00 PM to 11:59 PM | 0 (0.0%) | 0 (0.0%) |
| Total | 70 (100.0%) | 111 (100.0%) |
Housing Occupancy in Cotton Valley
Occupancy by Ownership in Cotton Valley
Of the total 265 dwellings in Cotton Valley, owner-occupied units account for 164 (61.9%), while renter-occupied units make up 101 (38.1%).
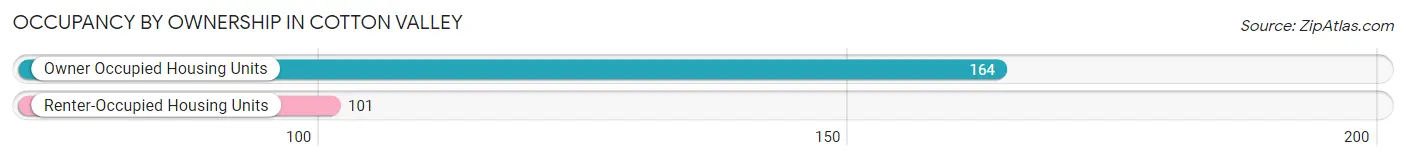
| Occupancy | # Housing Units | % Housing Units |
| Owner Occupied Housing Units | 164 | 61.9% |
| Renter-Occupied Housing Units | 101 | 38.1% |
| Total Occupied Housing Units | 265 | 100.0% |
Occupancy by Household Size in Cotton Valley
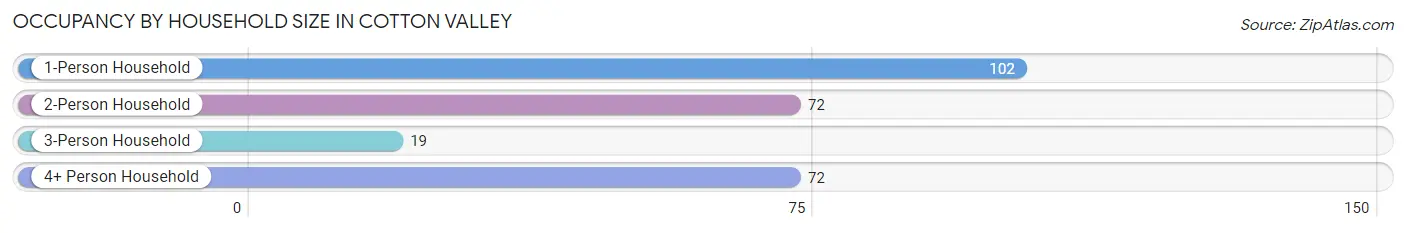
| Household Size | # Housing Units | % Housing Units |
| 1-Person Household | 102 | 38.5% |
| 2-Person Household | 72 | 27.2% |
| 3-Person Household | 19 | 7.2% |
| 4+ Person Household | 72 | 27.2% |
| Total Housing Units | 265 | 100.0% |
Occupancy by Ownership by Household Size in Cotton Valley
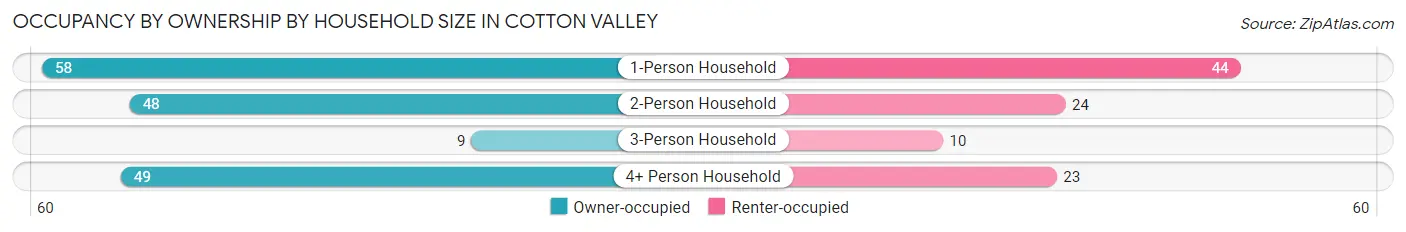
| Household Size | Owner-occupied | Renter-occupied |
| 1-Person Household | 58 (56.9%) | 44 (43.1%) |
| 2-Person Household | 48 (66.7%) | 24 (33.3%) |
| 3-Person Household | 9 (47.4%) | 10 (52.6%) |
| 4+ Person Household | 49 (68.1%) | 23 (31.9%) |
| Total Housing Units | 164 (61.9%) | 101 (38.1%) |
Occupancy by Educational Attainment in Cotton Valley
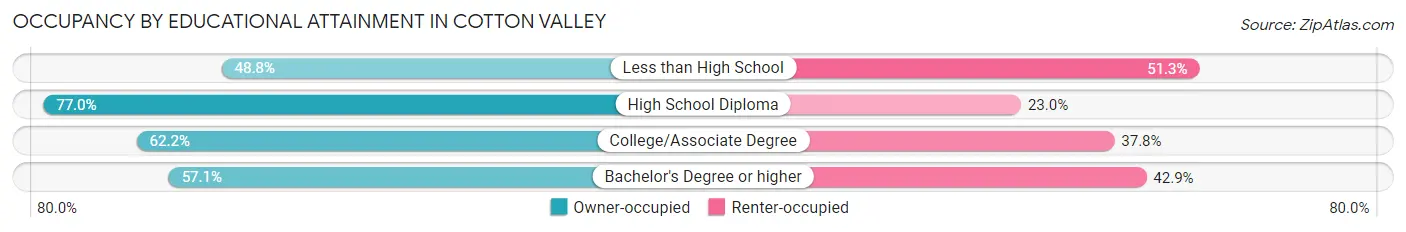
| Household Size | Owner-occupied | Renter-occupied |
| Less than High School | 39 (48.7%) | 41 (51.2%) |
| High School Diploma | 57 (77.0%) | 17 (23.0%) |
| College/Associate Degree | 56 (62.2%) | 34 (37.8%) |
| Bachelor's Degree or higher | 12 (57.1%) | 9 (42.9%) |
Occupancy by Age of Householder in Cotton Valley
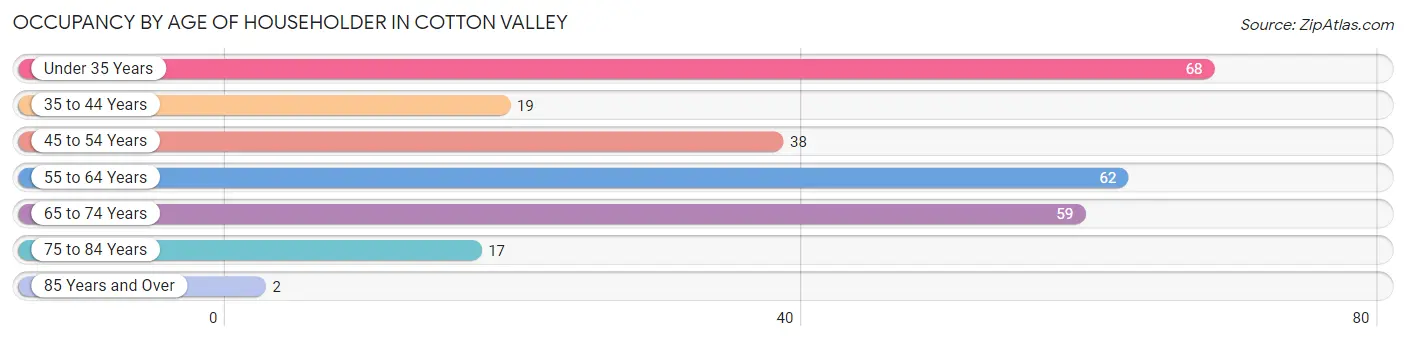
| Age Bracket | # Households | % Households |
| Under 35 Years | 68 | 25.7% |
| 35 to 44 Years | 19 | 7.2% |
| 45 to 54 Years | 38 | 14.3% |
| 55 to 64 Years | 62 | 23.4% |
| 65 to 74 Years | 59 | 22.3% |
| 75 to 84 Years | 17 | 6.4% |
| 85 Years and Over | 2 | 0.7% |
| Total | 265 | 100.0% |
Housing Finances in Cotton Valley
Median Income by Occupancy in Cotton Valley
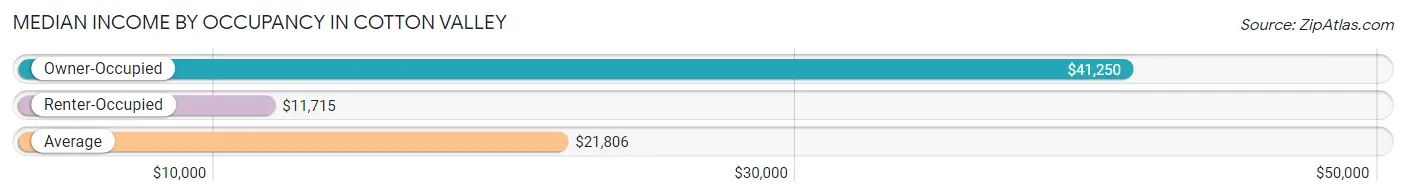
| Occupancy Type | # Households | Median Income |
| Owner-Occupied | 164 (61.9%) | $41,250 |
| Renter-Occupied | 101 (38.1%) | $11,715 |
| Average | 265 (100.0%) | $21,806 |
Occupancy by Householder Income Bracket in Cotton Valley
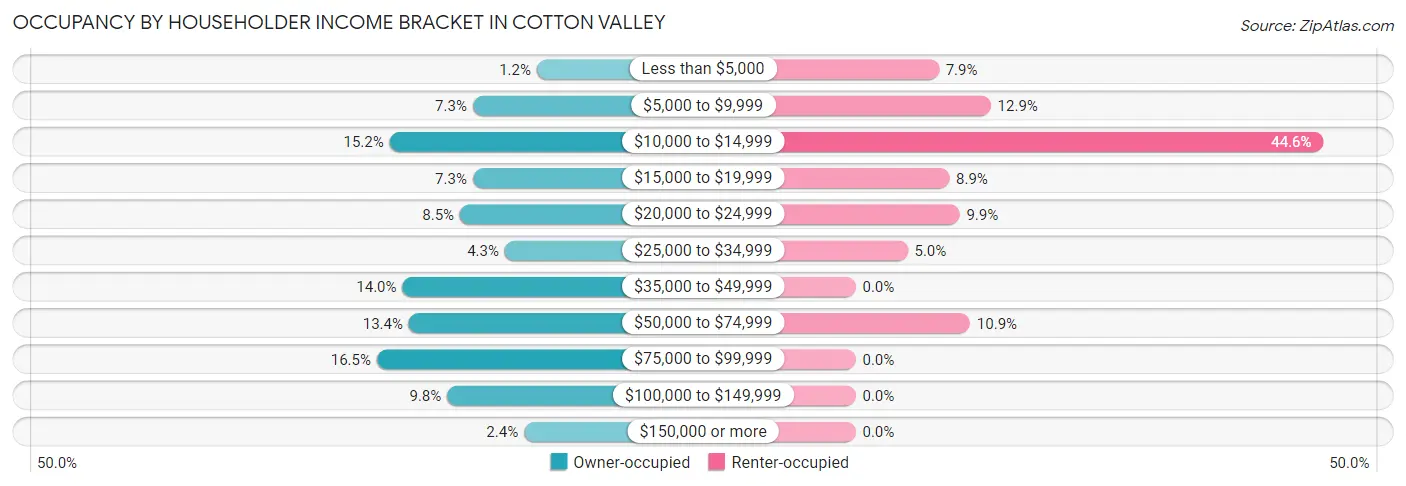
| Income Bracket | Owner-occupied | Renter-occupied |
| Less than $5,000 | 2 (1.2%) | 8 (7.9%) |
| $5,000 to $9,999 | 12 (7.3%) | 13 (12.9%) |
| $10,000 to $14,999 | 25 (15.2%) | 45 (44.6%) |
| $15,000 to $19,999 | 12 (7.3%) | 9 (8.9%) |
| $20,000 to $24,999 | 14 (8.5%) | 10 (9.9%) |
| $25,000 to $34,999 | 7 (4.3%) | 5 (5.0%) |
| $35,000 to $49,999 | 23 (14.0%) | 0 (0.0%) |
| $50,000 to $74,999 | 22 (13.4%) | 11 (10.9%) |
| $75,000 to $99,999 | 27 (16.5%) | 0 (0.0%) |
| $100,000 to $149,999 | 16 (9.8%) | 0 (0.0%) |
| $150,000 or more | 4 (2.4%) | 0 (0.0%) |
| Total | 164 (100.0%) | 101 (100.0%) |
Monthly Housing Cost Tiers in Cotton Valley
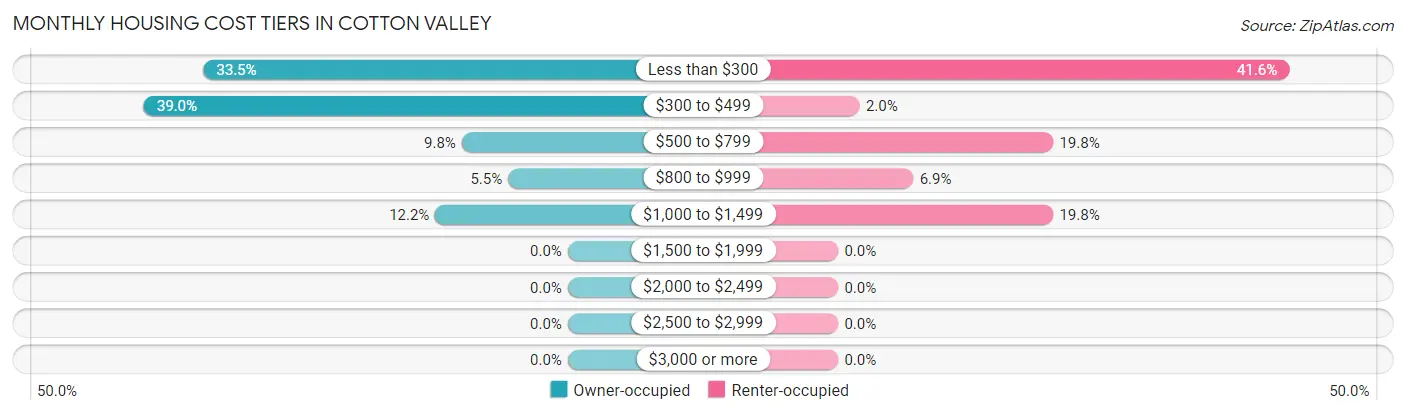
| Monthly Cost | Owner-occupied | Renter-occupied |
| Less than $300 | 55 (33.5%) | 42 (41.6%) |
| $300 to $499 | 64 (39.0%) | 2 (2.0%) |
| $500 to $799 | 16 (9.8%) | 20 (19.8%) |
| $800 to $999 | 9 (5.5%) | 7 (6.9%) |
| $1,000 to $1,499 | 20 (12.2%) | 20 (19.8%) |
| $1,500 to $1,999 | 0 (0.0%) | 0 (0.0%) |
| $2,000 to $2,499 | 0 (0.0%) | 0 (0.0%) |
| $2,500 to $2,999 | 0 (0.0%) | 0 (0.0%) |
| $3,000 or more | 0 (0.0%) | 0 (0.0%) |
| Total | 164 (100.0%) | 101 (100.0%) |
Physical Housing Characteristics in Cotton Valley
Housing Structures in Cotton Valley
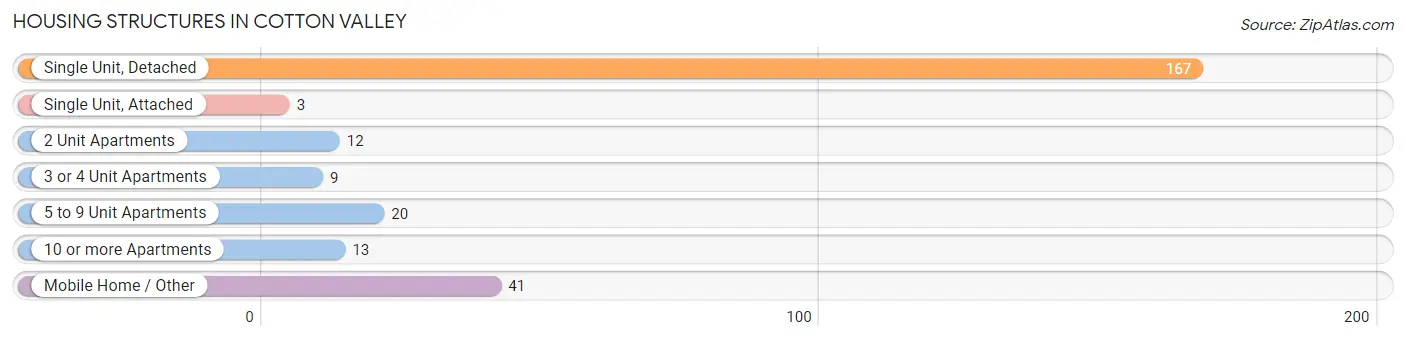
| Structure Type | # Housing Units | % Housing Units |
| Single Unit, Detached | 167 | 63.0% |
| Single Unit, Attached | 3 | 1.1% |
| 2 Unit Apartments | 12 | 4.5% |
| 3 or 4 Unit Apartments | 9 | 3.4% |
| 5 to 9 Unit Apartments | 20 | 7.5% |
| 10 or more Apartments | 13 | 4.9% |
| Mobile Home / Other | 41 | 15.5% |
| Total | 265 | 100.0% |
Housing Structures by Occupancy in Cotton Valley
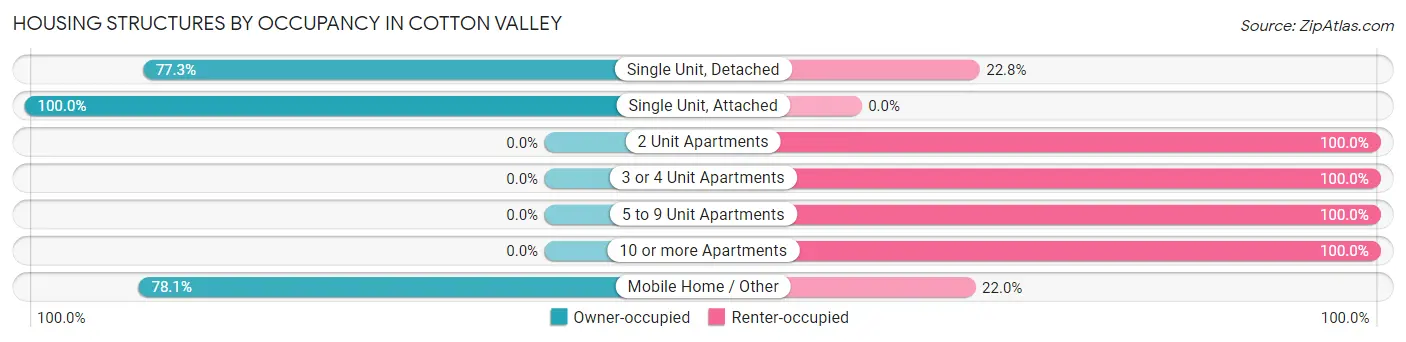
| Structure Type | Owner-occupied | Renter-occupied |
| Single Unit, Detached | 129 (77.2%) | 38 (22.8%) |
| Single Unit, Attached | 3 (100.0%) | 0 (0.0%) |
| 2 Unit Apartments | 0 (0.0%) | 12 (100.0%) |
| 3 or 4 Unit Apartments | 0 (0.0%) | 9 (100.0%) |
| 5 to 9 Unit Apartments | 0 (0.0%) | 20 (100.0%) |
| 10 or more Apartments | 0 (0.0%) | 13 (100.0%) |
| Mobile Home / Other | 32 (78.0%) | 9 (22.0%) |
| Total | 164 (61.9%) | 101 (38.1%) |
Housing Structures by Number of Rooms in Cotton Valley
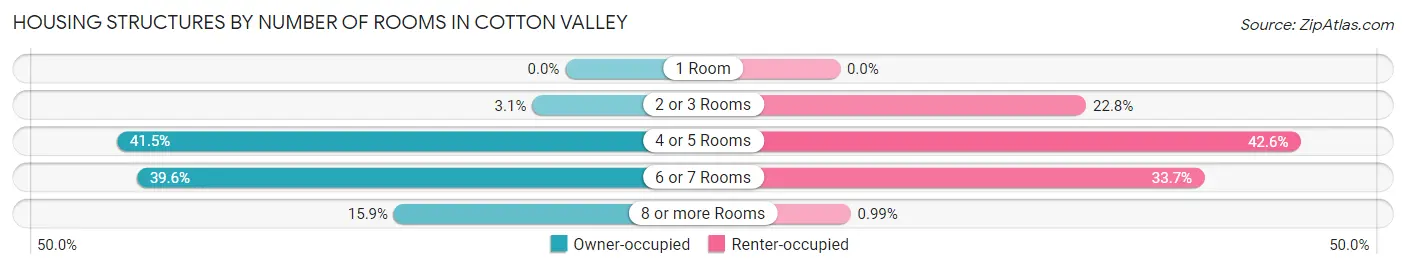
| Number of Rooms | Owner-occupied | Renter-occupied |
| 1 Room | 0 (0.0%) | 0 (0.0%) |
| 2 or 3 Rooms | 5 (3.0%) | 23 (22.8%) |
| 4 or 5 Rooms | 68 (41.5%) | 43 (42.6%) |
| 6 or 7 Rooms | 65 (39.6%) | 34 (33.7%) |
| 8 or more Rooms | 26 (15.9%) | 1 (1.0%) |
| Total | 164 (100.0%) | 101 (100.0%) |
Housing Structure by Heating Type in Cotton Valley
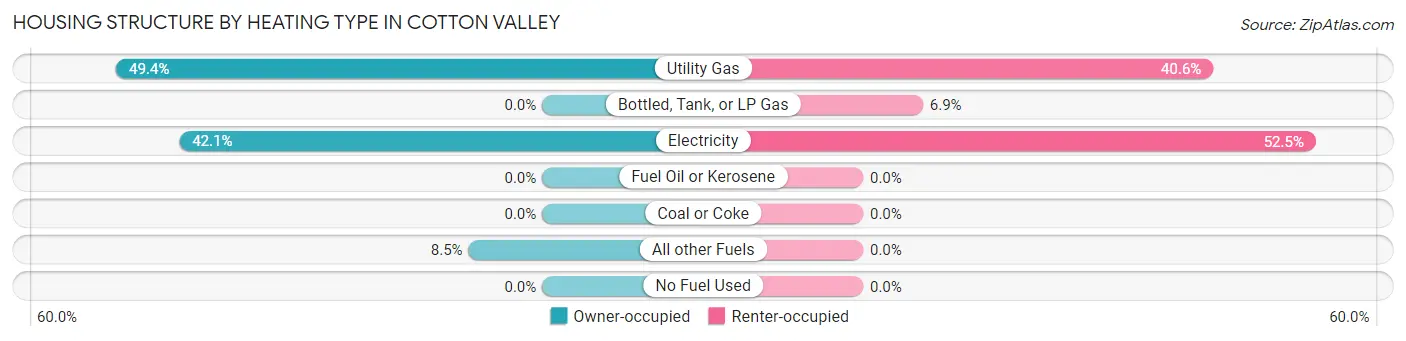
| Heating Type | Owner-occupied | Renter-occupied |
| Utility Gas | 81 (49.4%) | 41 (40.6%) |
| Bottled, Tank, or LP Gas | 0 (0.0%) | 7 (6.9%) |
| Electricity | 69 (42.1%) | 53 (52.5%) |
| Fuel Oil or Kerosene | 0 (0.0%) | 0 (0.0%) |
| Coal or Coke | 0 (0.0%) | 0 (0.0%) |
| All other Fuels | 14 (8.5%) | 0 (0.0%) |
| No Fuel Used | 0 (0.0%) | 0 (0.0%) |
| Total | 164 (100.0%) | 101 (100.0%) |
Household Vehicle Usage in Cotton Valley
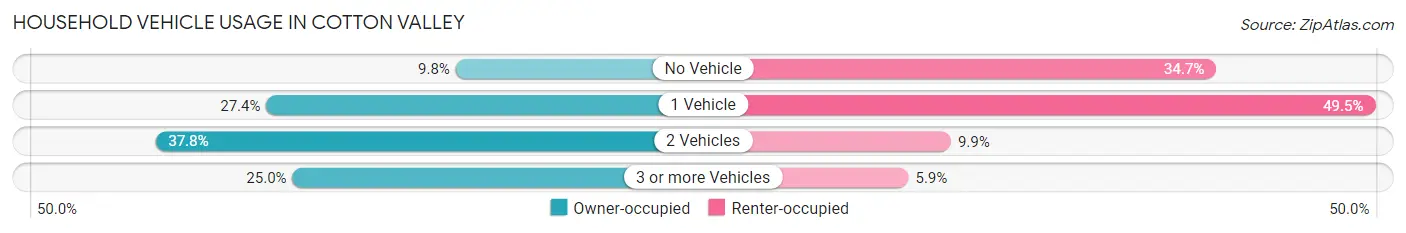
| Vehicles per Household | Owner-occupied | Renter-occupied |
| No Vehicle | 16 (9.8%) | 35 (34.6%) |
| 1 Vehicle | 45 (27.4%) | 50 (49.5%) |
| 2 Vehicles | 62 (37.8%) | 10 (9.9%) |
| 3 or more Vehicles | 41 (25.0%) | 6 (5.9%) |
| Total | 164 (100.0%) | 101 (100.0%) |
Real Estate & Mortgages in Cotton Valley
Real Estate and Mortgage Overview in Cotton Valley
| Characteristic | Without Mortgage | With Mortgage |
| Housing Units | 118 | 46 |
| Median Property Value | $46,600 | $74,500 |
| Median Household Income | $45,000 | $0 |
| Monthly Housing Costs | $339 | $0 |
| Real Estate Taxes | $199 | $30 |
Property Value by Mortgage Status in Cotton Valley
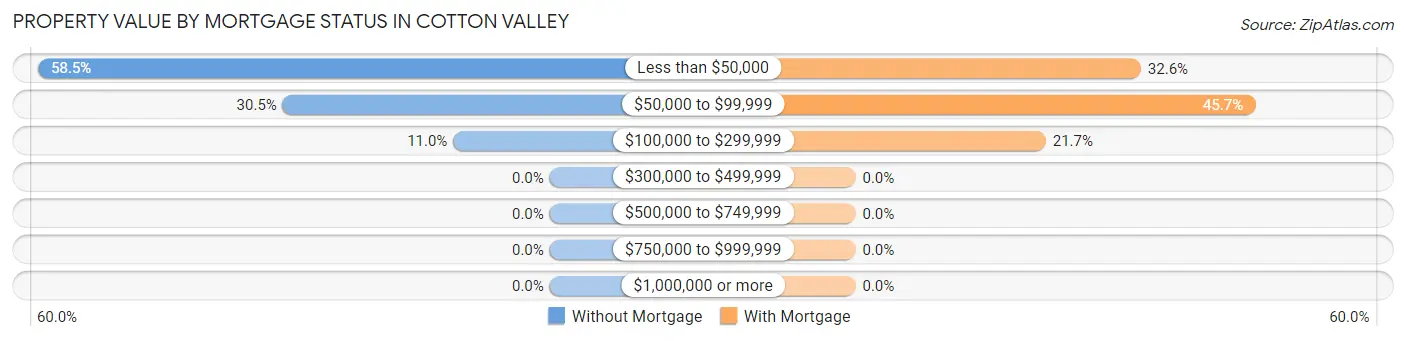
| Property Value | Without Mortgage | With Mortgage |
| Less than $50,000 | 69 (58.5%) | 15 (32.6%) |
| $50,000 to $99,999 | 36 (30.5%) | 21 (45.7%) |
| $100,000 to $299,999 | 13 (11.0%) | 10 (21.7%) |
| $300,000 to $499,999 | 0 (0.0%) | 0 (0.0%) |
| $500,000 to $749,999 | 0 (0.0%) | 0 (0.0%) |
| $750,000 to $999,999 | 0 (0.0%) | 0 (0.0%) |
| $1,000,000 or more | 0 (0.0%) | 0 (0.0%) |
| Total | 118 (100.0%) | 46 (100.0%) |
Household Income by Mortgage Status in Cotton Valley
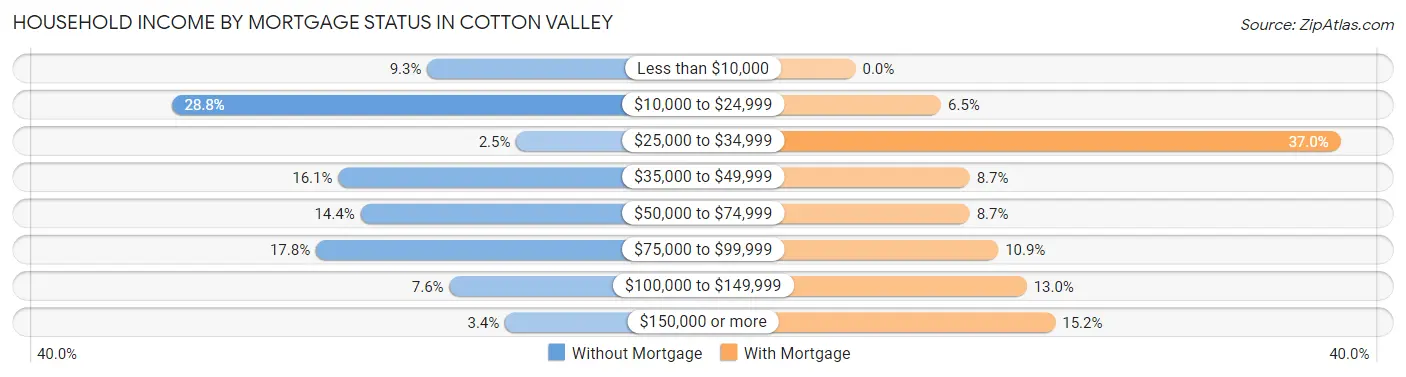
| Household Income | Without Mortgage | With Mortgage |
| Less than $10,000 | 11 (9.3%) | 0 (0.0%) |
| $10,000 to $24,999 | 34 (28.8%) | 3 (6.5%) |
| $25,000 to $34,999 | 3 (2.5%) | 17 (37.0%) |
| $35,000 to $49,999 | 19 (16.1%) | 4 (8.7%) |
| $50,000 to $74,999 | 17 (14.4%) | 4 (8.7%) |
| $75,000 to $99,999 | 21 (17.8%) | 5 (10.9%) |
| $100,000 to $149,999 | 9 (7.6%) | 6 (13.0%) |
| $150,000 or more | 4 (3.4%) | 7 (15.2%) |
| Total | 118 (100.0%) | 46 (100.0%) |
Property Value to Household Income Ratio in Cotton Valley
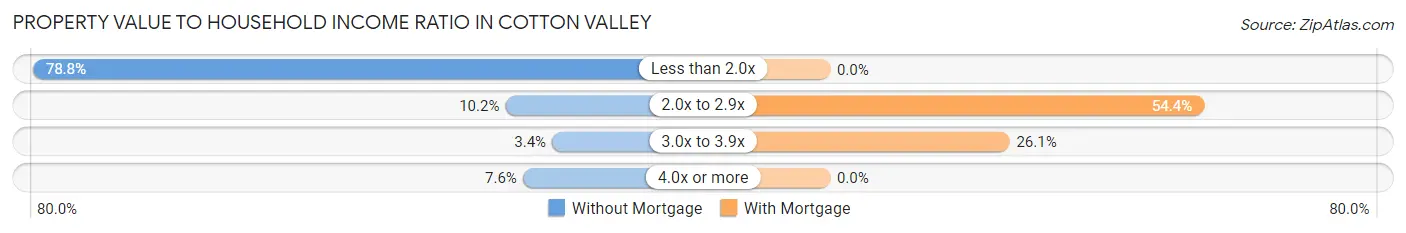
| Value-to-Income Ratio | Without Mortgage | With Mortgage |
| Less than 2.0x | 93 (78.8%) | 0 (0.0%) |
| 2.0x to 2.9x | 12 (10.2%) | 25 (54.3%) |
| 3.0x to 3.9x | 4 (3.4%) | 12 (26.1%) |
| 4.0x or more | 9 (7.6%) | 0 (0.0%) |
| Total | 118 (100.0%) | 46 (100.0%) |
Real Estate Taxes by Mortgage Status in Cotton Valley
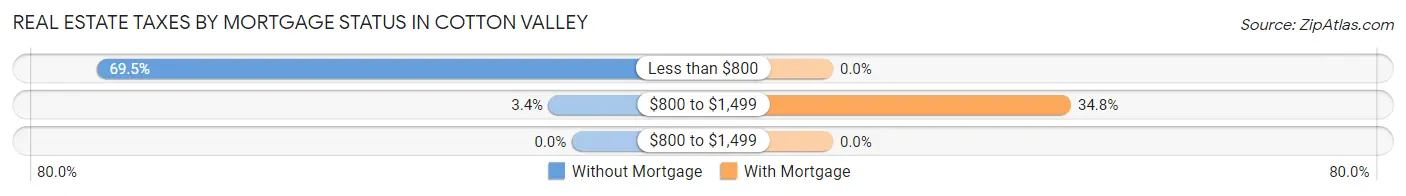
| Property Taxes | Without Mortgage | With Mortgage |
| Less than $800 | 82 (69.5%) | 0 (0.0%) |
| $800 to $1,499 | 4 (3.4%) | 16 (34.8%) |
| $800 to $1,499 | 0 (0.0%) | 0 (0.0%) |
| Total | 118 (100.0%) | 46 (100.0%) |
Health & Disability in Cotton Valley
Health Insurance Coverage by Age in Cotton Valley

| Age Bracket | With Coverage | Without Coverage |
| Under 6 Years | 101 (100.0%) | 0 (0.0%) |
| 6 to 18 Years | 164 (100.0%) | 0 (0.0%) |
| 19 to 25 Years | 52 (100.0%) | 0 (0.0%) |
| 26 to 34 Years | 60 (77.9%) | 17 (22.1%) |
| 35 to 44 Years | 38 (76.0%) | 12 (24.0%) |
| 45 to 54 Years | 62 (100.0%) | 0 (0.0%) |
| 55 to 64 Years | 103 (100.0%) | 0 (0.0%) |
| 65 to 74 Years | 77 (100.0%) | 0 (0.0%) |
| 75 Years and older | 27 (100.0%) | 0 (0.0%) |
| Total | 684 (95.9%) | 29 (4.1%) |
Health Insurance Coverage by Citizenship Status in Cotton Valley
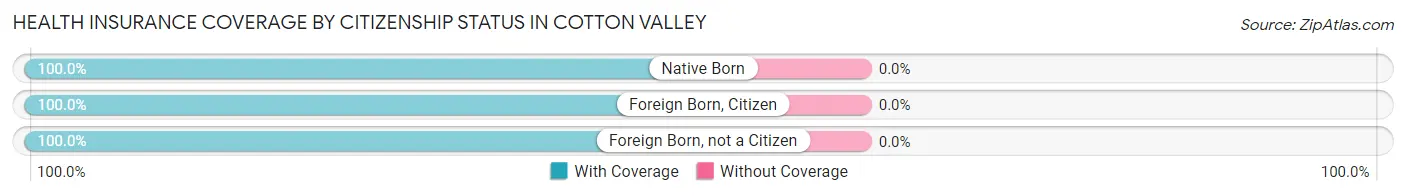
| Citizenship Status | With Coverage | Without Coverage |
| Native Born | 101 (100.0%) | 0 (0.0%) |
| Foreign Born, Citizen | 164 (100.0%) | 0 (0.0%) |
| Foreign Born, not a Citizen | 52 (100.0%) | 0 (0.0%) |
Health Insurance Coverage by Household Income in Cotton Valley
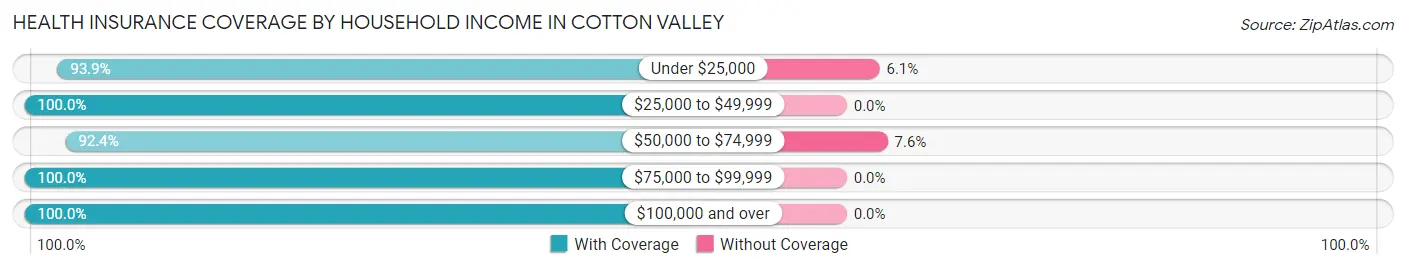
| Household Income | With Coverage | Without Coverage |
| Under $25,000 | 260 (93.9%) | 17 (6.1%) |
| $25,000 to $49,999 | 101 (100.0%) | 0 (0.0%) |
| $50,000 to $74,999 | 145 (92.4%) | 12 (7.6%) |
| $75,000 to $99,999 | 121 (100.0%) | 0 (0.0%) |
| $100,000 and over | 50 (100.0%) | 0 (0.0%) |
Public vs Private Health Insurance Coverage by Age in Cotton Valley
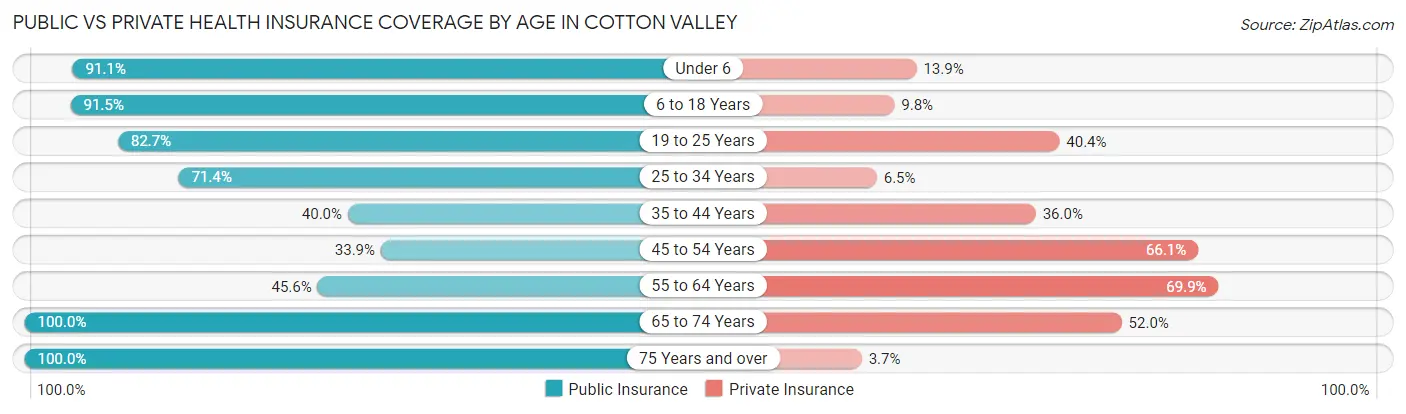
| Age Bracket | Public Insurance | Private Insurance |
| Under 6 | 92 (91.1%) | 14 (13.9%) |
| 6 to 18 Years | 150 (91.5%) | 16 (9.8%) |
| 19 to 25 Years | 43 (82.7%) | 21 (40.4%) |
| 25 to 34 Years | 55 (71.4%) | 5 (6.5%) |
| 35 to 44 Years | 20 (40.0%) | 18 (36.0%) |
| 45 to 54 Years | 21 (33.9%) | 41 (66.1%) |
| 55 to 64 Years | 47 (45.6%) | 72 (69.9%) |
| 65 to 74 Years | 77 (100.0%) | 40 (51.9%) |
| 75 Years and over | 27 (100.0%) | 1 (3.7%) |
| Total | 532 (74.6%) | 228 (32.0%) |
Disability Status by Sex by Age in Cotton Valley
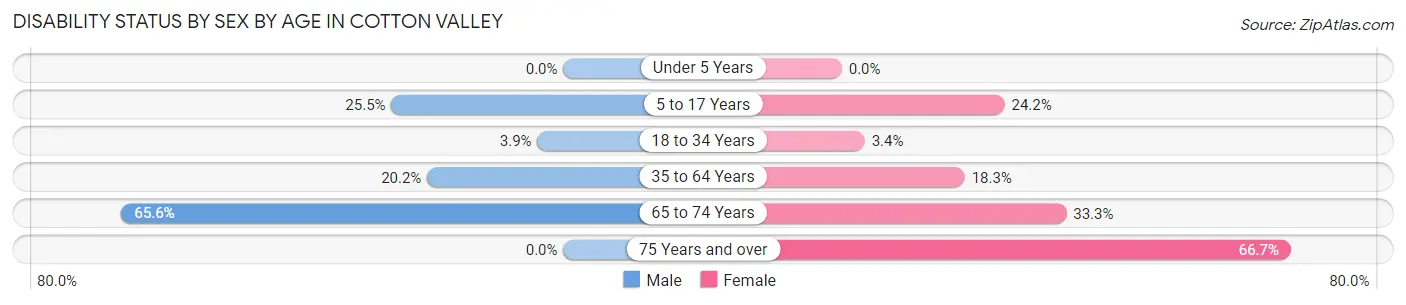
| Age Bracket | Male | Female |
| Under 5 Years | 0 (0.0%) | 0 (0.0%) |
| 5 to 17 Years | 12 (25.5%) | 29 (24.2%) |
| 18 to 34 Years | 2 (3.8%) | 3 (3.4%) |
| 35 to 64 Years | 18 (20.2%) | 23 (18.2%) |
| 65 to 74 Years | 21 (65.6%) | 15 (33.3%) |
| 75 Years and over | 0 (0.0%) | 14 (66.7%) |
Disability Class by Sex by Age in Cotton Valley
Disability Class: Hearing Difficulty
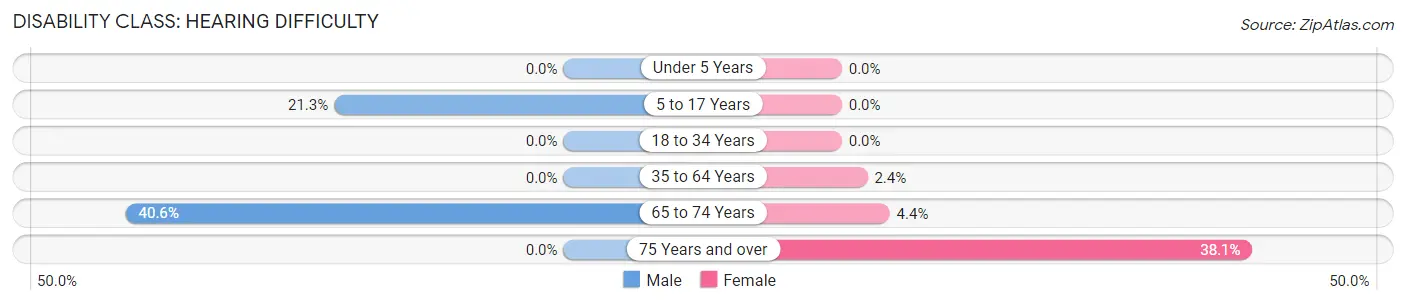
| Age Bracket | Male | Female |
| Under 5 Years | 0 (0.0%) | 0 (0.0%) |
| 5 to 17 Years | 10 (21.3%) | 0 (0.0%) |
| 18 to 34 Years | 0 (0.0%) | 0 (0.0%) |
| 35 to 64 Years | 0 (0.0%) | 3 (2.4%) |
| 65 to 74 Years | 13 (40.6%) | 2 (4.4%) |
| 75 Years and over | 0 (0.0%) | 8 (38.1%) |
Disability Class: Vision Difficulty
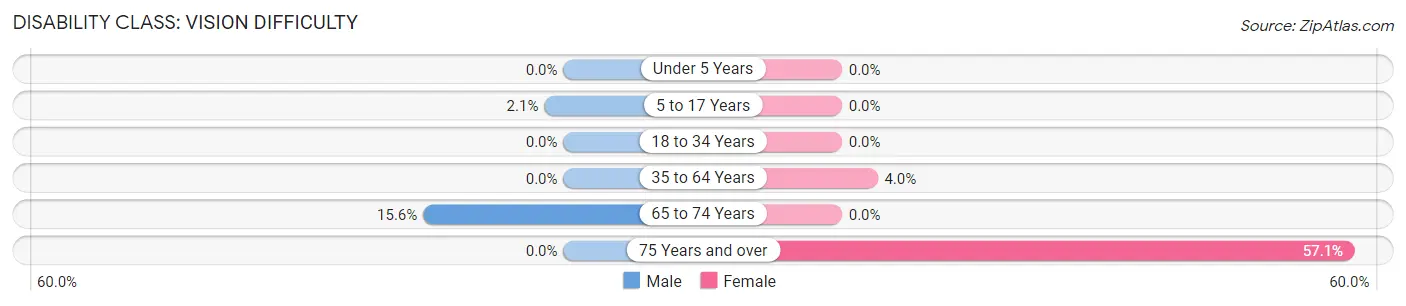
| Age Bracket | Male | Female |
| Under 5 Years | 0 (0.0%) | 0 (0.0%) |
| 5 to 17 Years | 1 (2.1%) | 0 (0.0%) |
| 18 to 34 Years | 0 (0.0%) | 0 (0.0%) |
| 35 to 64 Years | 0 (0.0%) | 5 (4.0%) |
| 65 to 74 Years | 5 (15.6%) | 0 (0.0%) |
| 75 Years and over | 0 (0.0%) | 12 (57.1%) |
Disability Class: Cognitive Difficulty
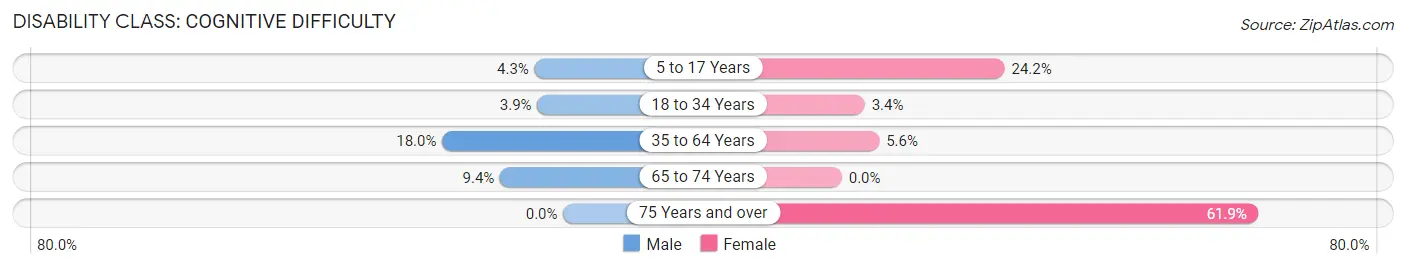
| Age Bracket | Male | Female |
| 5 to 17 Years | 2 (4.3%) | 29 (24.2%) |
| 18 to 34 Years | 2 (3.8%) | 3 (3.4%) |
| 35 to 64 Years | 16 (18.0%) | 7 (5.6%) |
| 65 to 74 Years | 3 (9.4%) | 0 (0.0%) |
| 75 Years and over | 0 (0.0%) | 13 (61.9%) |
Disability Class: Ambulatory Difficulty
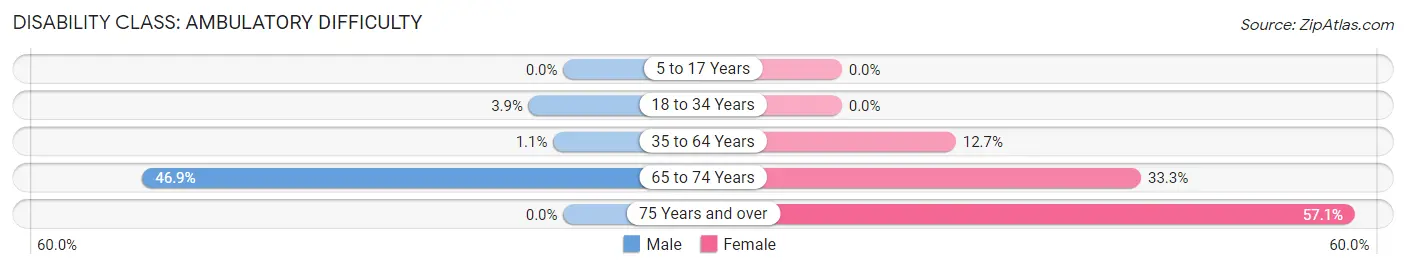
| Age Bracket | Male | Female |
| 5 to 17 Years | 0 (0.0%) | 0 (0.0%) |
| 18 to 34 Years | 2 (3.8%) | 0 (0.0%) |
| 35 to 64 Years | 1 (1.1%) | 16 (12.7%) |
| 65 to 74 Years | 15 (46.9%) | 15 (33.3%) |
| 75 Years and over | 0 (0.0%) | 12 (57.1%) |
Disability Class: Self-Care Difficulty
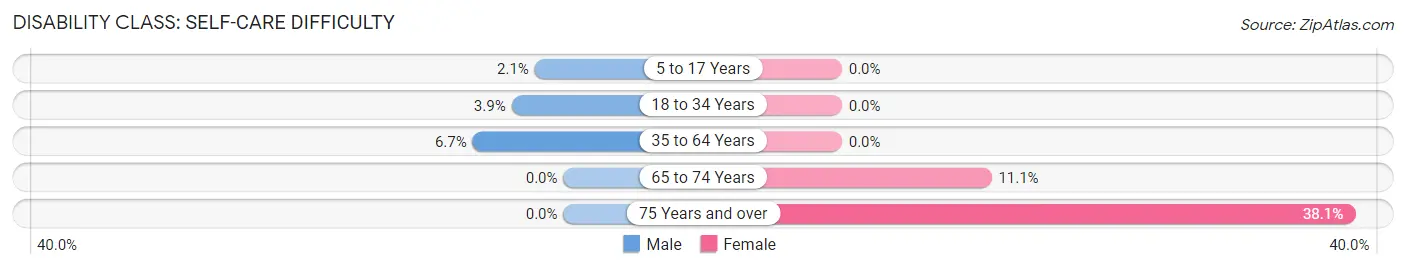
| Age Bracket | Male | Female |
| 5 to 17 Years | 1 (2.1%) | 0 (0.0%) |
| 18 to 34 Years | 2 (3.8%) | 0 (0.0%) |
| 35 to 64 Years | 6 (6.7%) | 0 (0.0%) |
| 65 to 74 Years | 0 (0.0%) | 5 (11.1%) |
| 75 Years and over | 0 (0.0%) | 8 (38.1%) |
Technology Access in Cotton Valley
Computing Device Access in Cotton Valley
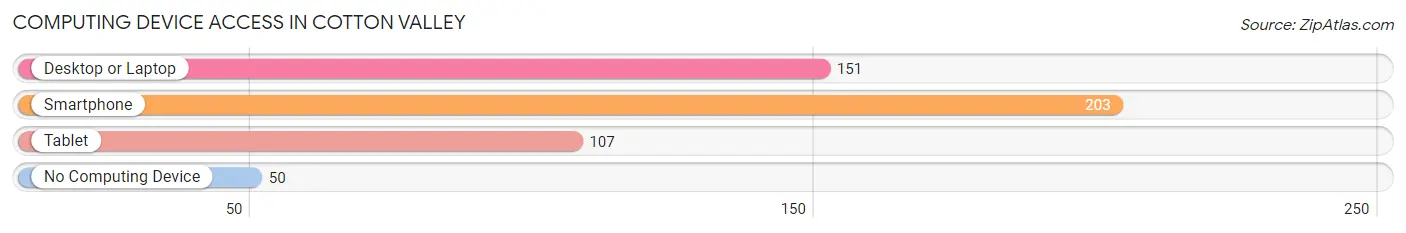
| Device Type | # Households | % Households |
| Desktop or Laptop | 151 | 57.0% |
| Smartphone | 203 | 76.6% |
| Tablet | 107 | 40.4% |
| No Computing Device | 50 | 18.9% |
| Total | 265 | 100.0% |
Internet Access in Cotton Valley
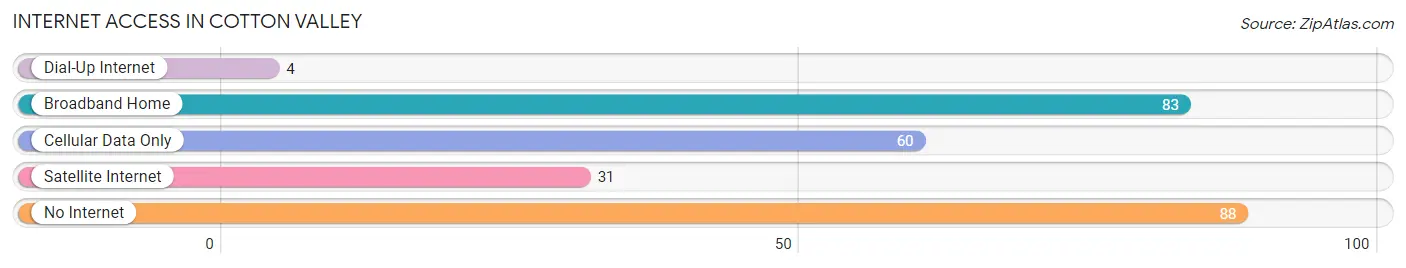
| Internet Type | # Households | % Households |
| Dial-Up Internet | 4 | 1.5% |
| Broadband Home | 83 | 31.3% |
| Cellular Data Only | 60 | 22.6% |
| Satellite Internet | 31 | 11.7% |
| No Internet | 88 | 33.2% |
| Total | 265 | 100.0% |
Cotton Valley Summary
Cotton Valley is a small town located in the northwest corner of Louisiana, in Webster Parish. It is situated on the banks of the Red River, and is surrounded by rolling hills and lush forests. The town has a population of just over 1,000 people, and is known for its small-town charm and friendly atmosphere.
History
Cotton Valley was first settled in the early 1800s by a group of settlers from the nearby town of Minden. The settlers were looking for a place to grow cotton, and the fertile soil of the Red River Valley provided the perfect opportunity. The town was officially established in 1845, and was named after the cotton that was grown in the area.
In the late 1800s, the town began to grow and prosper. The railroad came to town in 1887, and the town quickly became a hub for the cotton industry. The town also became a center for the timber industry, as the surrounding forests provided an abundance of lumber.
By the early 1900s, Cotton Valley had become a thriving community. The town had a number of businesses, including a bank, a hotel, a general store, and a cotton gin. The town also had a number of churches, and a school.
Geography
Cotton Valley is located in the northwest corner of Louisiana, in Webster Parish. It is situated on the banks of the Red River, and is surrounded by rolling hills and lush forests. The town is located about 30 miles south of Shreveport, and about 50 miles north of Monroe.
The climate in Cotton Valley is humid subtropical, with hot summers and mild winters. The average temperature in the summer is around 90 degrees Fahrenheit, and the average temperature in the winter is around 50 degrees Fahrenheit.
Economy
The economy of Cotton Valley is largely based on agriculture. The town is known for its cotton production, and the surrounding area is home to a number of farms and ranches. The town also has a number of small businesses, including restaurants, stores, and other services.
Demographics
As of the 2010 census, the population of Cotton Valley was 1,072. The racial makeup of the town was 95.3% White, 0.9% African American, 0.3% Native American, 0.2% Asian, 0.1% Pacific Islander, and 2.2% from other races. The median household income was $30,938, and the median family income was $37,500.
Conclusion
Cotton Valley is a small town located in the northwest corner of Louisiana, in Webster Parish. It is situated on the banks of the Red River, and is surrounded by rolling hills and lush forests. The town has a population of just over 1,000 people, and is known for its small-town charm and friendly atmosphere. The economy of Cotton Valley is largely based on agriculture, and the town is known for its cotton production. The racial makeup of the town is mostly White, with a small percentage of African American, Native American, Asian, and Pacific Islander residents.
Common Questions
What is Per Capita Income in Cotton Valley?
Per Capita income in Cotton Valley is $14,447.
What is the Median Family Income in Cotton Valley?
Median Family Income in Cotton Valley is $35,417.
What is the Median Household income in Cotton Valley?
Median Household Income in Cotton Valley is $21,806.
What is Income or Wage Gap in Cotton Valley?
Income or Wage Gap in Cotton Valley is 43.3%.
Women in Cotton Valley earn 56.7 cents for every dollar earned by a man.
What is Inequality or Gini Index in Cotton Valley?
Inequality or Gini Index in Cotton Valley is 0.50.
What is the Total Population of Cotton Valley?
Total Population of Cotton Valley is 713.
What is the Total Male Population of Cotton Valley?
Total Male Population of Cotton Valley is 291.
What is the Total Female Population of Cotton Valley?
Total Female Population of Cotton Valley is 422.
What is the Ratio of Males per 100 Females in Cotton Valley?
There are 68.96 Males per 100 Females in Cotton Valley.
What is the Ratio of Females per 100 Males in Cotton Valley?
There are 145.02 Females per 100 Males in Cotton Valley.
What is the Median Population Age in Cotton Valley?
Median Population Age in Cotton Valley is 31.0 Years.
What is the Average Family Size in Cotton Valley
Average Family Size in Cotton Valley is 3.6 People.
What is the Average Household Size in Cotton Valley
Average Household Size in Cotton Valley is 2.7 People.
How Large is the Labor Force in Cotton Valley?
There are 211 People in the Labor Forcein in Cotton Valley.
What is the Percentage of People in the Labor Force in Cotton Valley?
45.4% of People are in the Labor Force in Cotton Valley.
What is the Unemployment Rate in Cotton Valley?
Unemployment Rate in Cotton Valley is 2.8%.